probability - mr. lawhon's classes of 2017-2018 · probability of 1. all other events can then...
TRANSCRIPT
Probability
13Chapter
Contents: A
B
C
D
E
F
G
H
I
J
Probability by experiment
Chance investigations
Sample space
Theoretical probability
Using grids to find probabilities
Multiplying probabilities
Using tree diagrams
Sampling with and withoutreplacement
Probabilities from Venn diagrams(Extension)
Conditional probability (Extension)
IB_PDmagentacyan yellow black
0 05 5
25
25
75
75
50
50
95
95
100
100 0 05 5
25
25
75
75
50
50
95
95
100
100
Y:\HAESE\IB_PD\IBPD_13\305ibpd13.cdr Wednesday, 5 July 2006 3:36:07 PM PETERDELL
HISTORICAL NOTE
Blaise Pascal
² Jerome Cardan ( to ) admitted in his autobiography that he
gambled “not only every year, but .... every day, and with the loss at once
of thought, of substance, and of time”. He wrote a handbook on gambling
with tips on cheating and how to detect it. His book included discussion
on equally likely events, frequency tables for dice probabilities, and
expectations.
1501 1576
² Laplace ( - ) once described the theory of probabil-
ity as “nothing but common sense reduced to calculation”.
1749 1827
² Blaise Pascal
Fermat
( - ) invented the first mechanical
digital calculator. Pascal and his friend were first to
develop probability theory as we know it today. Pascal also
developed the syringe and the hydraulic press. He wrote a
large number of articles on Christian beliefs and ethics.
1623 1662
Often we are confronted by situations where we are not sure what outcome will occur.
We hear statements such as:
“The Wildcats will probably beat the Tigers on Saturday.”
“It is unlikely that it will rain today.”
“I probably will make the team.”
Each of these statements indicates a likelihood (or chance) of a particular event happening.
We can indicate the likelihood of an event happening in the future by using a percentage.
0% indicates we believe the event will not occur.
100% indicates we believe the event is certain to occur.
All events can therefore be assigned a percentage between 0% and 100% (inclusive).
A number close to 0% indicates the event is unlikely to occur, whereas a number close to
100% means that it is highly likely to occur.
In mathematics, we usually use either decimals or fractions rather than percentages for prob-
abilities. However, as 100% = 1, comparisons or conversions from percentages to fractions
or decimals are very simple.
An impossible event which has 0% chance of happening is assigned
a probability of 0.
A certain event which has 100% chance of happening is assigned a
probability of 1.
All other events can then be assigned a probability between 0 and 1.
The assigning of probabilities is usually based on either
² observing the results of an experiment (experimental probability), or
² using arguments of symmetry (theoretical probability).
306 PROBABILITY (Chapter 13)
IB_PDmagentacyan yellow black
0 05 5
25
25
75
75
50
50
95
95
100
100 0 05 5
25
25
75
75
50
50
95
95
100
100
Y:\HAESE\IB_PD\IBPD_13\306ibpd13.cdr Wednesday, 5 July 2006 3:37:01 PM PETERDELL
OPENING PROBLEM
�
PROBABILITY BY EXPERIMENTA
For you to consider:
² What would Karla’s best estimate be of the chance that the nut will finish on its end?
² What would Sam’s estimate be?
² How can a better estimate of the chance of an end occurring be made?
²
In an experiment we should use suitable language to help us describe what we are doing and
the results we expect and get.
² The number of trials is the total number of times the experiment is repeated.
² The outcomes are the different results possible for one trial of the experiment.
² The frequency of a particular outcome is the number of times this outcome is observed.
² The relative frequency of an outcome is the frequency of that outcome divided by the
total number of trials.
So, if we flip a tin can into the air 250 times and if it
lands on an end 37 times, then
² the number of trials is 250
² the outcomes are ends and sides
² the frequency of ends is 37 and sides is 213
² the relative frequency of ends is 0:148 and sides
is 0:852:
Sometimes the only way of finding the chance of occurrence of a particular event is by
experiment.
Tin can flipping is one such example. The chance of a can of this shape finishing on its end
is the relative frequency found by experimentation.
We say, the estimated experimental probability is the relative frequency of the event.
We write: Experimental P(end) = 0:148
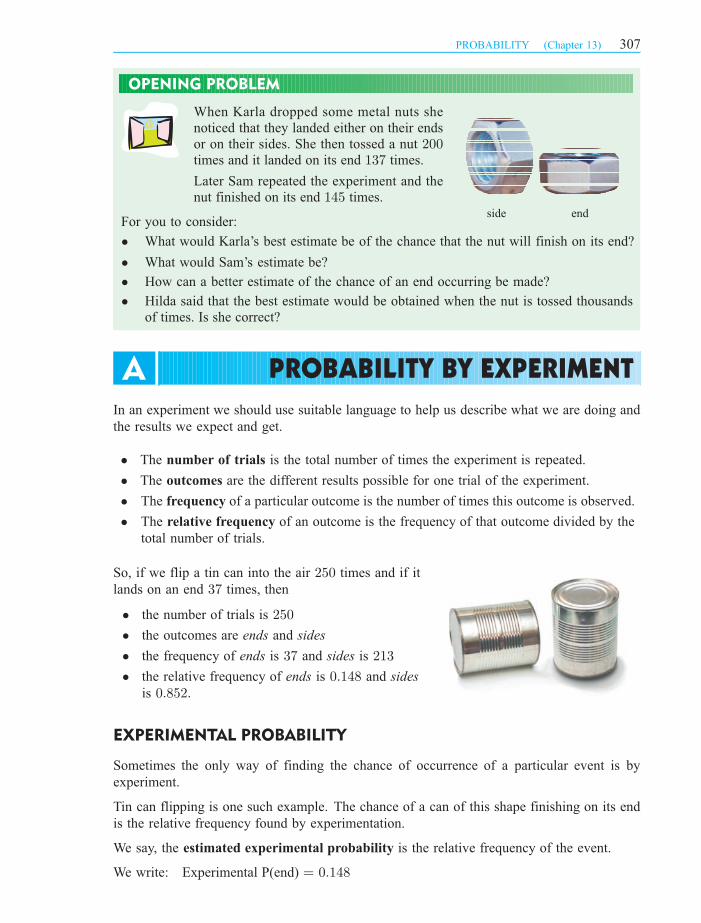
When Karla dropped some metal nuts she
noticed that they landed either on their ends
or on their sides. She then tossed a nut
times and it landed on its end times.
Later Sam repeated the experiment and the
nut finished on its end times.
200137
145
Hilda said that the best estimate would be obtained when the nut is tossed thousands
of times. Is she correct?
EXPERIMENTAL PROBABILITY
side end
PROBABILITY (Chapter 13) 307
IB_PDmagentacyan yellow black
0 05 5
25
25
75
75
50
50
95
95
100
100 0 05 5
25
25
75
75
50
50
95
95
100
100
Y:\HAESE\IB_PD\IBPD_13\307ibpd13.cdr Wednesday, 5 July 2006 3:37:11 PM PETERDELL
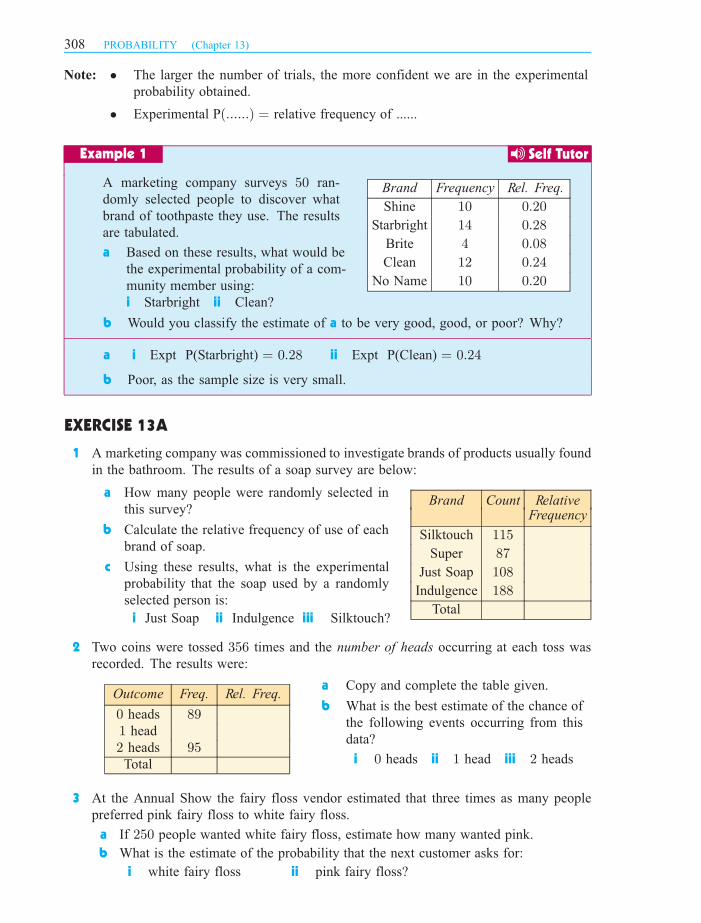
A marketing company surveys 50 ran-
domly selected people to discover what
brand of toothpaste they use. The results
are tabulated.
a Based on these results, what would be
the experimental probability of a com-
munity member using:
i Starbright ii Clean?
Brand Frequency Rel. Freq.
Shine 10 0:20
Starbright 14 0:28
Brite 4 0:08
Clean 12 0:24
No Name 10 0:20
b Would you classify the estimate of a to be very good, good, or poor? Why?
a i Expt P(Starbright) = 0:28 ii Expt P(Clean) = 0:24
b Poor, as the sample size is very small.
1 A marketing company was commissioned to investigate brands of products usually found
in the bathroom. The results of a soap survey are below:
a How many people were randomly selected in
this survey?
b Calculate the relative frequency of use of each
brand of soap.
c Using these results, what is the experimental
probability that the soap used by a randomly
selected person is:
Brand Count RelativeFrequency
Silktouch 115
Super 87
Just Soap 108
Indulgence 188
Totali Just Soap ii Indulgence iii Silktouch?
2 Two coins were tossed 356 times and the number of heads occurring at each toss was
recorded. The results were:
Outcome Freq. Rel. Freq.
0 heads 891 head
2 heads 95Total
a Copy and complete the table given.
b What is the best estimate of the chance of
the following events occurring from this
data?
i 0 heads ii 1 head iii 2 heads
3 At the Annual Show the fairy floss vendor estimated that three times as many people
preferred pink fairy floss to white fairy floss.
a If 250 people wanted white fairy floss, estimate how many wanted pink.
b What is the estimate of the probability that the next customer asks for:
i white fairy floss ii pink fairy floss?
Example 1
EXERCISE 13A
Note: ² The larger the number of trials, the more confident we are in the experimental
probability obtained.
² Experimental P(::::::) = relative frequency of ......
308 PROBABILITY (Chapter 13)
Self Tutor
IB_PDmagentacyan yellow black
0 05 5
25
25
75
75
50
50
95
95
100
100 0 05 5
25
25
75
75
50
50
95
95
100
100
Y:\HAESE\IB_PD\IBPD_13\308ibpd13.cdr Wednesday, 5 July 2006 3:37:46 PM PETERDELL
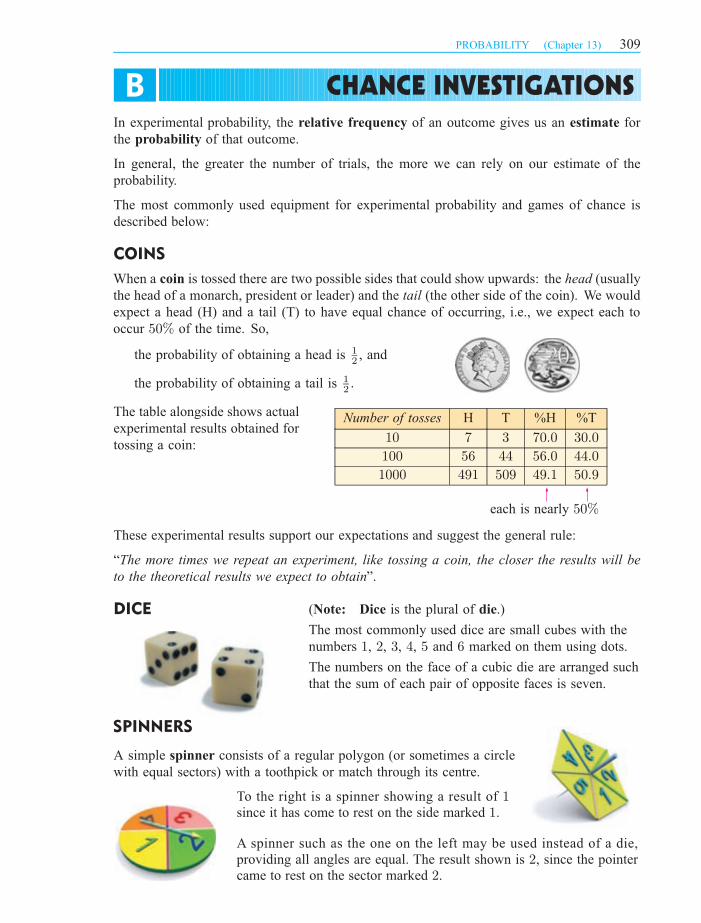
In experimental probability, the relative frequency of an outcome gives us an estimate for
the probability of that outcome.
In general, the greater the number of trials, the more we can rely on our estimate of the
probability.
The most commonly used equipment for experimental probability and games of chance is
described below:
the probability of obtaining a head is 1
2, and
the probability of obtaining a tail is 1
2:
The table alongside shows actual
experimental results obtained for
tossing a coin:
Number of tosses H T %H %T
10 7 3 70:0 30:0
100 56 44 56:0 44:0
1000 491 509 49:1 50:9
each is nearly 50%
These experimental results support our expectations and suggest the general rule:
“The more times we repeat an experiment, like tossing a coin, the closer the results will be
to the theoretical results we expect to obtain”.
A simple spinner consists of a regular polygon (or sometimes a circle
with equal sectors) with a toothpick or match through its centre.
CHANCE INVESTIGATIONSB
COINS
DICE
SPINNERS
To the right is a spinner showing a result of
since it has come to rest on the side marked .
11
A spinner such as the one on the left may be used instead of a die,
providing all angles are equal. The result shown is , since the pointer
came to rest on the sector marked .
22
When a coin is tossed there are two possible sides that could show upwards: the head (usually
the head of a monarch, president or leader) and the tail (the other side of the coin). We would
expect a head (H) and a tail (T) to have equal chance of occurring, i.e., we expect each to
occur 50% of the time. So,
(Note: Dice is the plural of die.)
The most commonly used dice are small cubes with the
numbers 1, 2, 3, 4, 5 and 6 marked on them using dots.
The numbers on the face of a cubic die are arranged such
that the sum of each pair of opposite faces is seven.
PROBABILITY (Chapter 13) 309
IB_PDmagentacyan yellow black
0 05 5
25
25
75
75
50
50
95
95
100
100 0 05 5
25
25
75
75
50
50
95
95
100
100
Y:\HAESE\IB_PD\IBPD_13\309ibpd13.cdr Wednesday, 5 July 2006 3:37:58 PM PETERDELL

INVESTIGATION 2 TOSSING THREE COINS
INVESTIGATION 1 ROLLING A DIE
At least one normal six-sided die with numbers 1 to 6 on its faces.
Several dice would be useful to speed up the experiment.
1
2
3 Roll the die 60 times and record
the result on the uppermost face in
a table like the one alongside:
Outcome Tally Frequency Rel. frequ.
1
2...
6
Total 60
4 Pool as much data as you can with
other students.
² Look at similarities and differ-
ences from one set to another.
² Look at the overall pooled data added into one table.
5 How close to your expectation were your results?
6
1 List the 8 possible outcomes for tossing 3 coins simultaneously. (Let HHT represent
“a head for the first coin, a head for the second and a tail for the third”.)
2 How many of these outcomes could be described as:
a ‘three heads’ b ‘two heads and a tail’
c ‘one head and two tails’ d ‘three tails’?
3 Consider the possible outcomes of tossing three coins 80 times. Copy and complete
a table of expected results.
Result Expected frequency
3 heads
2 heads and 1 tail
1 head and 2 tails
3 tails
What to do:
You will need:
Examine a die. List the possible outcomes for the uppermost face
when the die is rolled.
Three coins. They do not
have to be all the same type.
You will need:
What to do:
SIMULATION
Use the die rolling simulation from the computer package on the CD to
roll the die times and repeat this times. On each occasion, record your
results in a table like that in . Do your results confirm your expected results?
10 000 103
Consider the possible outcomes when the die is rolled times. Complete a table of
your which includes columns of ,
and .
60expected results Outcomes Expected relative
frequency Expected frequency
Expected relative frequency
310 PROBABILITY (Chapter 13)
IB_PDmagentacyan yellow black
0 05 5
25
25
75
75
50
50
95
95
100
100 0 05 5
25
25
75
75
50
50
95
95
100
100
Y:\HAESE\IB_PD\IBPD_13\310ibpd13.cdr Wednesday, 5 July 2006 3:38:12 PM PETERDELL
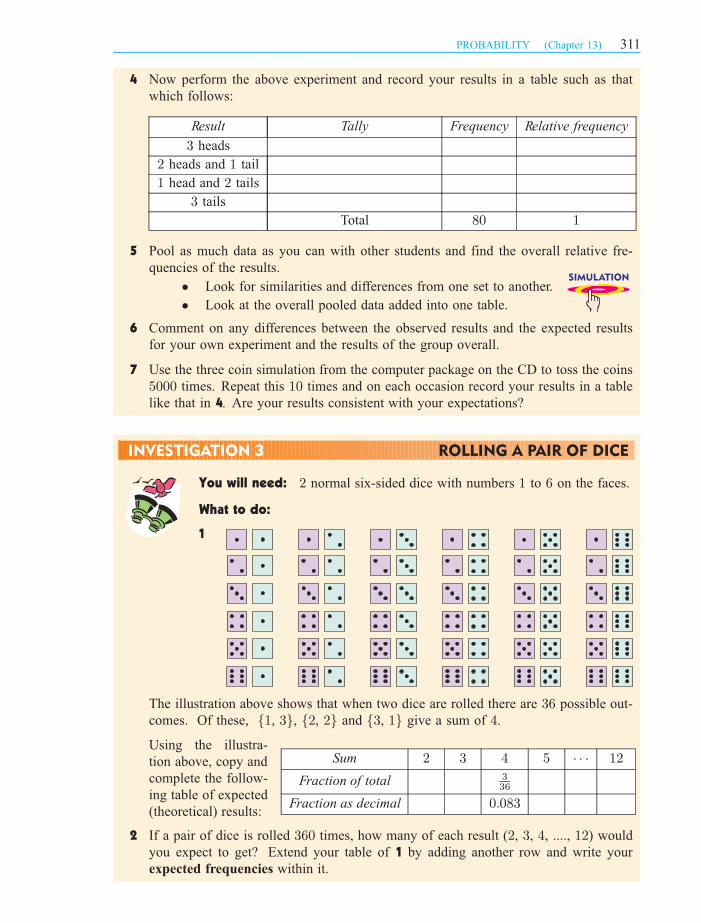
INVESTIGATION 3 ROLLING A PAIR OF DICE
4 Now perform the above experiment and record your results in a table such as that
which follows:
Result Tally Frequency Relative frequency
3 heads
2 heads and 1 tail
1 head and 2 tails
3 tails
Total 80 1
5 Pool as much data as you can with other students and find the overall relative fre-
quencies of the results.
² Look for similarities and differences from one set to another.
² Look at the overall pooled data added into one table.
6 Comment on any differences between the observed results and the expected results
for your own experiment and the results of the group overall.
7 Use the three coin simulation from the computer package on the CD to toss the coins
5000 times. Repeat this 10 times and on each occasion record your results in a table
like that in 4. Are your results consistent with your expectations?
2 normal six-sided dice with numbers 1 to 6 on the faces.
1
The illustration above shows that when two dice are rolled there are 36 possible out-
comes. Of these, f1, 3g, f2, 2g and f3, 1g give a sum of 4.
Using the illustra-
tion above, copy and
complete the follow-
ing table of expected
(theoretical) results:
Sum 2 3 4 5 ¢ ¢ ¢ 12
Fraction of total 3
36
Fraction as decimal 0:083
2 If a pair of dice is rolled 360 times, how many of each result (2, 3, 4, ...., 12) would
you expect to get? Extend your table of 1 by adding another row and write your
expected frequencies within it.
You will need:
What to do:
SIMULATION
PROBABILITY (Chapter 13) 311
IB_PDmagentacyan yellow black
0 05 5
25
25
75
75
50
50
95
95
100
100 0 05 5
25
25
75
75
50
50
95
95
100
100
Y:\HAESE\IB_PD\IBPD_13\311ibpd13.cdr Wednesday, 5 July 2006 3:39:00 PM PETERDELL
3 Toss the two dice 360 times and record in a table the sum of the two numbers for each
toss.Sum Tally Frequency Relative Frequency
2345...
12Total 360 1
4 Use the two dice simulation from the computer package on the CD to roll the pair of
dice 10 000 times. Repeat this 10 times and on each occasion record your results in
a table like that of 3. Are your results consistent with your expectations?
A sample space is the set of all possible outcomes of an experiment.
There are a variety of ways of representing or illustrating sample spaces.
List the sample space for: a tossing a coin b rolling a die.
a When a coin is tossed, there b When a die is rolled, there are 6are two possible outcomes. possible outcomes.
) sample space = fH, Tg ) sample space = f1, 2, 3, 4, 5, 6g
When an experiment involves more than one operation we can still use listing to illustrate the
sample space. However, a grid can often be a better way of achieving this.
SAMPLE SPACEC
LISTING OUTCOMES
Example 2
2-DIMENSIONAL GRIDS
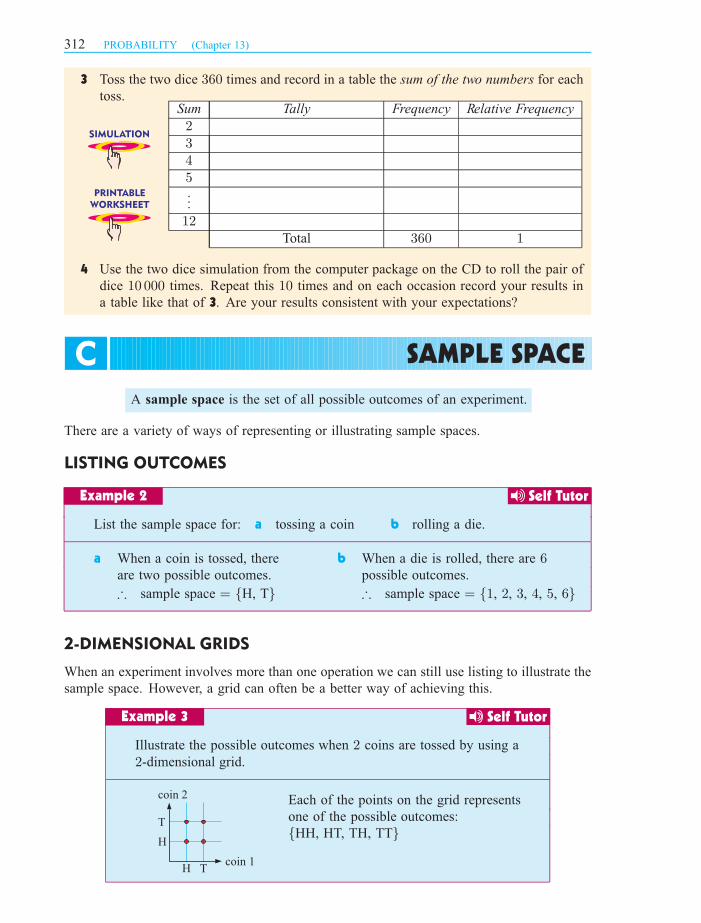
Illustrate the possible outcomes when 2 coins are tossed by using a
2-dimensional grid.
Each of the points on the grid represents
one of the possible outcomes:
fHH, HT, TH, TTg
Example 3
T
T
H
H
coin 2
coin 1
PRINTABLE
WORKSHEET
SIMULATION
312 PROBABILITY (Chapter 13)
Self Tutor
Self Tutor
IB_PDmagentacyan yellow black
0 05 5
25
25
75
75
50
50
95
95
100
100 0 05 5
25
25
75
75
50
50
95
95
100
100
Y:\HAESE\IB_PD\IBPD_13\312ibpd13.cdr Wednesday, 5 July 2006 3:39:23 PM PETERDELL
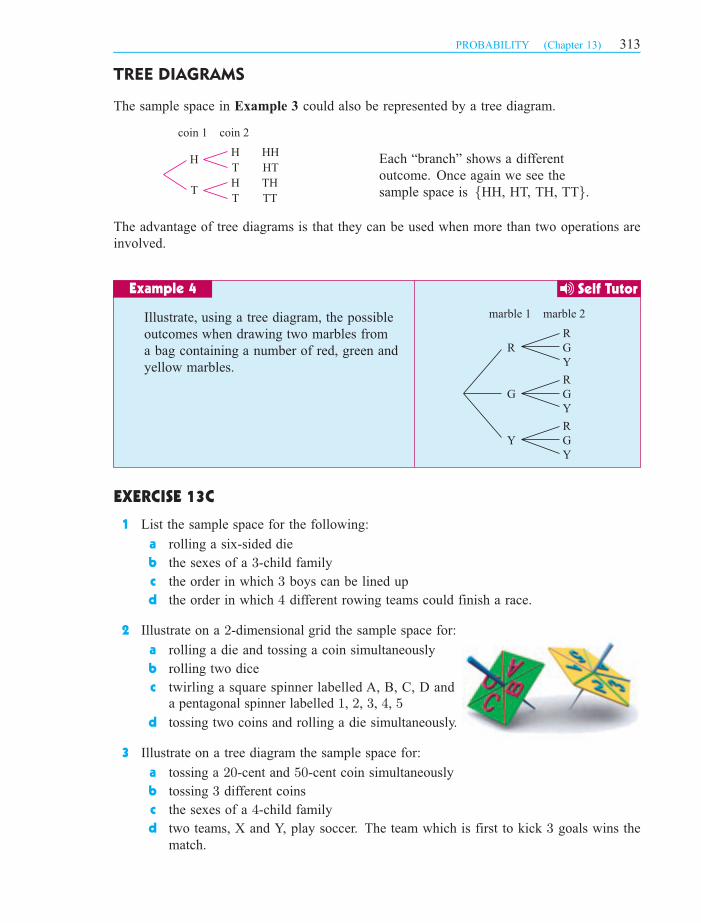
The sample space in Example 3 could also be represented by a tree diagram.
The advantage of tree diagrams is that they can be used when more than two operations are
involved.
Illustrate, using a tree diagram, the possible
outcomes when drawing two marbles from
a bag containing a number of red, green and
yellow marbles.
1 List the sample space for the following:
a rolling a six-sided die
b the sexes of a 3-child family
c the order in which 3 boys can be lined up
d the order in which 4 different rowing teams could finish a race.
2 Illustrate on a 2-dimensional grid the sample space for:
a rolling a die and tossing a coin simultaneously
b rolling two dice
c
d tossing two coins and rolling a die simultaneously.
3 Illustrate on a tree diagram the sample space for:
a tossing a 20-cent and 50-cent coin simultaneously
b tossing 3 different coins
c the sexes of a 4-child family
d two teams, X and Y, play soccer. The team which is first to kick 3 goals wins the
match.
TREE DIAGRAMS
H
TH
H
TT
coin 1 coin 2
HH
HT
TH
TT
Example 4
R
GR
Y
R
GG
Y
R
GY
Y
marble 1 marble 2
EXERCISE 13C
twirling a square spinner labelled A, B, C, D and
a pentagonal spinner labelled , , , ,1 2 3 4 5
Each “branch” shows a different
outcome. Once again we see the
sample space is fHH, HT, TH, TTg.
PROBABILITY (Chapter 13) 313
Self Tutor
IB_PDmagentacyan yellow black
0 05 5
25
25
75
75
50
50
95
95
100
100 0 05 5
25
25
75
75
50
50
95
95
100
100
Y:\HAESE\IB_PD\IBPD_13\313ibpd13.cdr Wednesday, 5 July 2006 3:39:58 PM PETERDELL
A marble is randomly selected from a bag containing 1 green, 4 yellow and
4 red marbles. Determine the probability of getting:
a a red marble b a green or yellow marble
c a blue marble d a green, yellow or red marble
The sample space is fG, Y, Y, Y, Y, R, R, R, Rg
which has 1 + 4 + 4 = 9 outcomes.
a P(red)
= 4
9
b P(a green or a yellow) =1 + 4
9
= 5
9
c P(blue)
= 0
9
= 0
d P(green, yellow or red) =1 + 4 + 4
9
= 9
9
= 1
THEORETICAL PROBABILITYD
We read as
‘3 chances in 5’.
Et_
Example 5
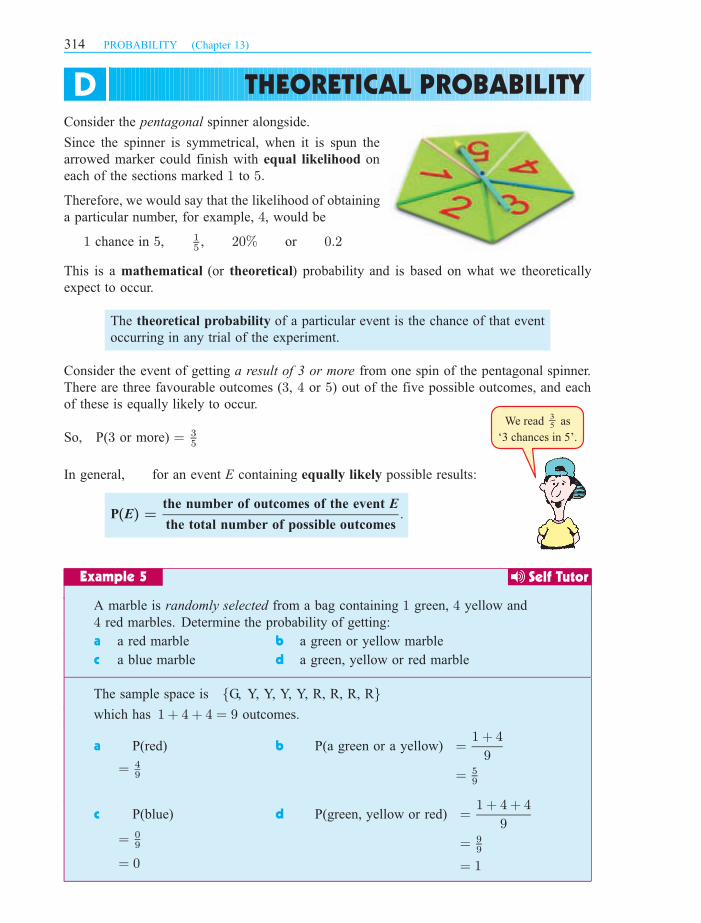
Consider the pentagonal spinner alongside.
Since the spinner is symmetrical, when it is spun the
arrowed marker could finish with equal likelihood on
each of the sections marked 1 to 5:
Therefore, we would say that the likelihood of obtaining
a particular number, for example, 4, would be
1 chance in 5, 1
5, 20% or 0:2
This is a mathematical (or theoretical) probability and is based on what we theoretically
expect to occur.
The theoretical probability of a particular event is the chance of that event
occurring in any trial of the experiment.
Consider the event of getting a result of 3 or more from one spin of the pentagonal spinner.
There are three favourable outcomes (3, 4 or 5) out of the five possible outcomes, and each
of these is equally likely to occur.
So, P(3 or more) = 3
5
In general, for an event E containing equally likely possible results:
P(E) =the number of outcomes of the event E
the total number of possible outcomes.
314 PROBABILITY (Chapter 13)
Self Tutor
IB_PDmagentacyan yellow black
0 05 5
25
25
75
75
50
50
95
95
100
100 0 05 5
25
25
75
75
50
50
95
95
100
100
Y:\HAESE\IB_PD\IBPD_13\314ibpd13.cdr Wednesday, 5 July 2006 3:40:21 PM PETERDELL
In Example 5 notice that in c a blue result cannot occur and the calculated probability is 0,
which fits the fact that it has no chance of occurring.
Also notice in d, a green, yellow or red result is certain to occur. It is 100% likely which is
perfectly described using a 1.
The two events of no chance of occurring with probability 0 and
certain to occur with probability 1 are two extremes.
Consequently, for any event E, 0 6 P(E) 6 1:
In Example 6, did you notice that
P(5) + P(not getting a 5) = 1 and that P(an even number) + P(an odd number) = 1?
This is no surprise as getting a 5 and not getting a 5 are complementary events where one
of them must occur.
Likewise getting an even number and getting an odd number are complementary events.
A useful rearrangement is:
1 A fair die is rolled. Determine the probability of getting:
a a 2 or a 3 c a 7
d a result greater than 4
b a positive integer
e a non-six
COMPLEMENTARY EVENTS
An ordinary 6-sided die is rolled once. Determine the chance of:
a getting a 5 b not getting a 5
c getting an even number d getting an odd number
The sample space of possible outcomes is f1, 2, 3, 4, 5, 6g
a P(5)
= 1
6
b P(not getting a 5)
= P(1, 2, 3, 4 or 6)
= 5
6
c P(an even number)
= P(2, 4 or 6)
= 3
6
= 1
2
d P(an odd number)
= P(1, 3 or 5)
= 3
6
= 1
2
Example 6
NOTATION
EXERCISE 13D
If E is an event, then E0 is the complementary event of E:
So, P(E) + P(E0) = 1.
P(E not occurring) = 1 ¡ P(E occurring)
PROBABILITY (Chapter 13) 315
Self Tutor
IB_PDmagentacyan yellow black
0 05 5
25
25
75
75
50
50
95
95
100
100 0 05 5
25
25
75
75
50
50
95
95
100
100
Y:\HAESE\IB_PD\IBPD_13\315ibpd13.cdr Wednesday, 5 July 2006 3:40:38 PM PETERDELL
2 A symmetrical octahedral die has numbers 1 to 8 marked on its faces, and it is rolled
once. Determine the probability of throwing:
a a 2 b a number less than 4
c a number less than 1 d a number between 1 and 8
3
4 A bag contains 3 red and 7 blue buttons, and a button is randomly selected from the bag.
Determine the probability of getting:
a a red b a blue c a red or a blue d a red and a blue.
5 One ticket is chosen in a lottery consisting of 100tickets numbered 1 to 100 and the choice is made
randomly. Determine the probability that the ticket
is:
a a two digit number b a multiple of 12c a multiple of 7 or 11
6 Determine the probability that a person randomly
selected in the street has his (or her) birthday in
September.
7 List the six different orders in which buses A, B and C can arrive at a bus stop. If the
three buses arrive at random at a bus stop, determine the probability that:
a bus A arrives first b they arrive in alphabetical order
c bus B is the second bus to arrive d after bus B, bus C will be next to arrive
8 a List the 8 possible 3-child families, according to the gender of the children. For
example, GGB means “the first is a girl, the second is a girl, and the third is a
boy”.
b Assuming that each of these is equally likely to occur, determine the probability
that a randomly selected 3-child family consists of:
i all boys ii all girls
iii boy, then boy, then girl iv two girls and a boy
v a boy for the eldest vi at least one girl
9 a List, in systematic order, the 24 different orders in which four blocks W, X, Y and
Z can be placed one on top of the other.
b Hence, determine the probability that when 4 blocks are placed at random on top
of one another:
i W is at the bottom ii X is in one of the two middle positions
iii X and Y are placed together
iv X, Y and Z are together, not necessarily in that order.
A regular pentagonal spinner has the numbers
to marked on its partitions. Determine the
probability that after a spin the result will be:
1 5
a
b
c
even
prime
a factor of .6
316 PROBABILITY (Chapter 13)
IB_PDmagentacyan yellow black
0 05 5
25
25
75
75
50
50
95
95
100
100 0 05 5
25
25
75
75
50
50
95
95
100
100
Y:\HAESE\IB_PD\IBPD_13\316ibpd13.cdr Wednesday, 5 July 2006 3:40:48 PM PETERDELL
Two-dimensional grids give us excellent visual displays of sample spaces. From these we
can count favourable outcomes and so calculate probabilities.
This point represents ‘a tail from coin A’ and ‘a tail from coin B’.
This point represents ‘a tail from coin A’ and ‘a head from coin B’.
There are four members of the sample space.
Use a two-dimensional grid to illustrate the sample space for tossing a coin and
rolling a die simultaneously. From this grid determine the probability of:
a tossing a tail b rolling a 3
c getting a head and a 6 d getting a head or a 6
There are 12 members in the sample space.
a P(tail) = 6
12= 1
2
b P(3) = 2
12= 1
6
c P(head and a ‘6’) = 1
12
d P(head or a ‘6’) = 7
12fthe enclosed pointsg
USING GRIDS TO FIND PROBABILITIESE
T
T
H
H
coin B
coin A
Example 7
T
2 3 4 5 6
H
1
coin
die
a a 2 with each spinner b a 2 and a 4
c an even result for each spinner
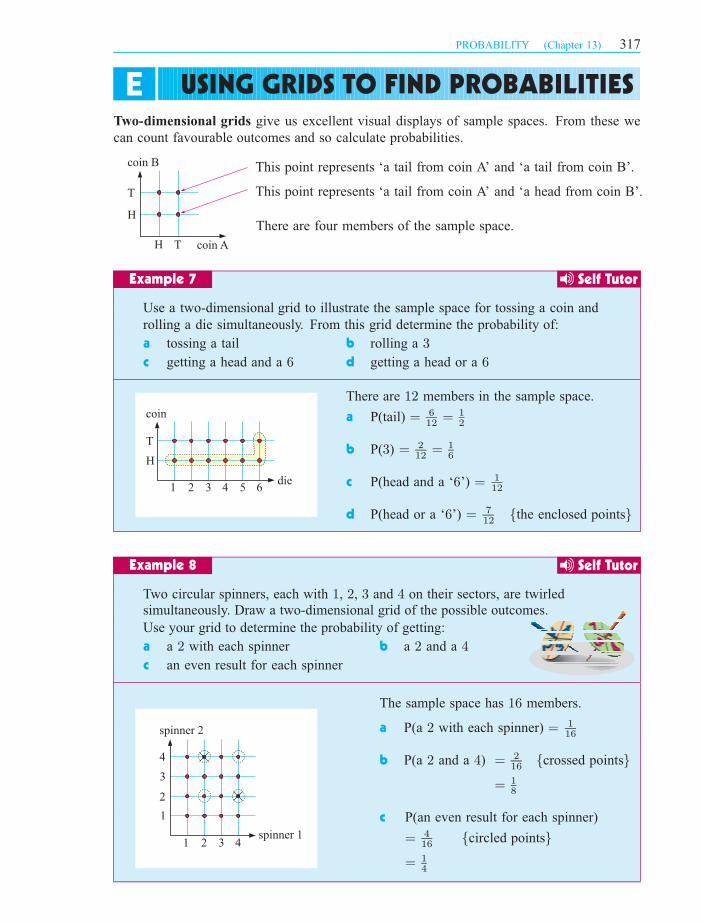
The sample space has 16 members.
a P(a 2 with each spinner) = 1
16
b P(a 2 and a 4) = 2
16fcrossed pointsg
= 1
8
c P(an even result for each spinner)
= 4
16fcircled pointsg
= 1
4
Two circular spinners, each with , , and on their sectors, are twirled
simultaneously. Draw a two-dimensional grid of the possible outcomes.
Use your grid to determine the probability of getting:
1 2 3 4
2 3 41
spinner 2
spinner 1
1
2
3
4
Example 8
PROBABILITY (Chapter 13) 317
Self Tutor
Self Tutor
IB_PDmagentacyan yellow black
0 05 5
25
25
75
75
50
50
95
95
100
100 0 05 5
25
25
75
75
50
50
95
95
100
100
Y:\HAESE\IB_PD\IBPD_13\317ibpd13.cdr Wednesday, 5 July 2006 3:41:06 PM PETERDELL
1 Two coins are tossed simultaneously. Use a 2-dimensional grid to illustrate the sample
space and hence determine the probability of getting:
a two heads b a head and a tail c at least one tail.
2 Draw a 2-dimensional grid to illustrate the sample space when an ordinary die (numbered
1 to 6) is tossed and a square spinner labelled A, B, C and D is spun. Hence, determine
the probability of getting:
a A and 4 b B and a prime number c a consonant and a multiple of 3.
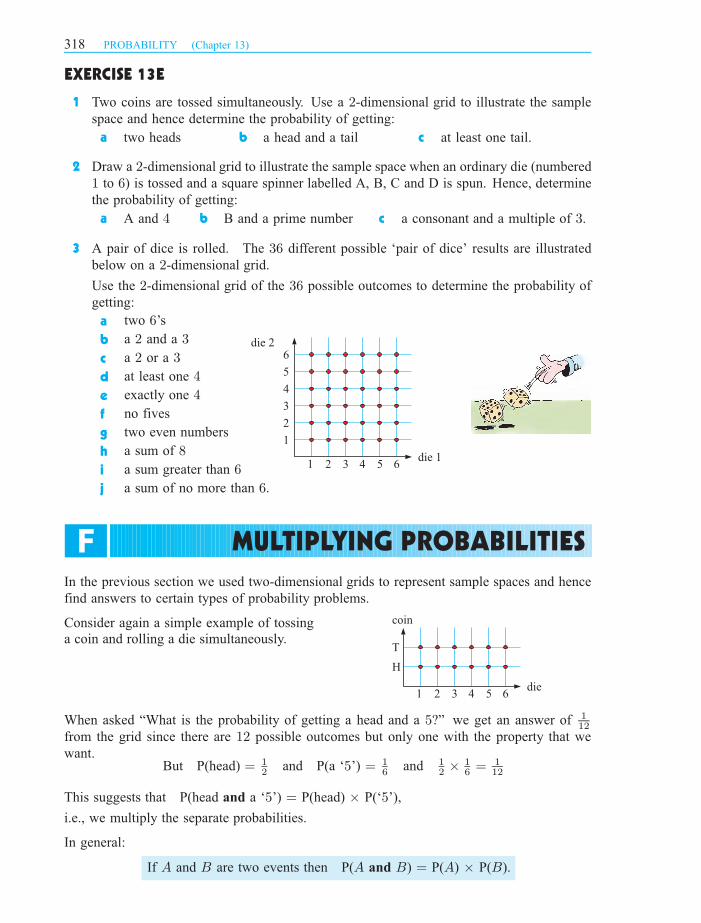
3 A pair of dice is rolled. The 36 different possible ‘pair of dice’ results are illustrated
below on a 2-dimensional grid.
Use the 2-dimensional grid of the 36 possible outcomes to determine the probability of
getting:
a
b
c
d
e
f
g
h
i
j
In the previous section we used two-dimensional grids to represent sample spaces and hence
find answers to certain types of probability problems.
When asked “What is the probability of getting a head and a 5?” we get an answer of 1
12
from the grid since there are 12 possible outcomes but only one with the property that we
want.But P(head) = 1
2and P(a ‘5’) = 1
6and 1
2£ 1
6= 1
12
This suggests that P(head and a ‘5’) = P(head) £ P(‘5’),
i.e., we multiply the separate probabilities.
In general:
EXERCISE 13E
MULTIPLYING PROBABILITIESF
Consider again a simple example of tossing
a coin and rolling a die simultaneously.T
2 3 4 5 6
H
1
coin
die
2
2 3 4 5 6
1
1
die 2
die 1
3
4
5
6
If A and B are two events then P(A and B) = P(A) £ P(B).
two 6’s
a 2 and a 3
a 2 or a 3
at least one 4
exactly one 4
no fives
two even numbers
a sum of 8
a sum greater than 6
a sum of no more than 6.
318 PROBABILITY (Chapter 13)
IB_PDmagentacyan yellow black
0 05 5
25
25
75
75
50
50
95
95
100
100 0 05 5
25
25
75
75
50
50
95
95
100
100
Y:\HAESE\IB_PD\IBPD_13\318ibpd13.cdr Wednesday, 5 July 2006 3:41:26 PM PETERDELL
Joe has probability 3
4of hitting a target and Anne has probability 4
5.
If they both fire simultaneously at the target, determine the probability that:
a they both hit it b they both miss it.
a P(both hit) b P(both miss)
= P(Joe and Anne hit) = P(Joe misses and Anne misses)
= P(Joe hits) £ P(Anne hits) = P(Joe misses) £ P(Anne misses)
= 3
4£ 4
5= 1
4£ 1
5
= 3
5= 1
20
1
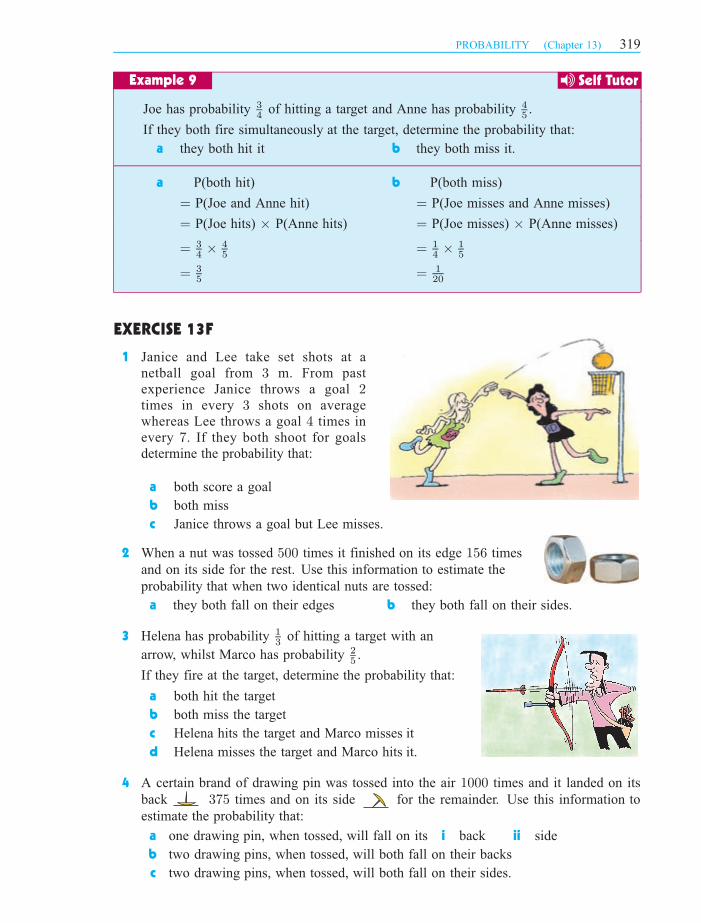
a both score a goal
b both miss
c
2 When a nut was tossed 500 times it finished on its edge 156 times
and on its side for the rest. Use this information to estimate the
probability that when two identical nuts are tossed:
a they both fall on their edges b they both fall on their sides.
3 Helena has probability 1
3of hitting a target with an
arrow, whilst Marco has probability 2
5.
If they fire at the target, determine the probability that:
a both hit the target
b both miss the target
c Helena hits the target and Marco misses it
d Helena misses the target and Marco hits it.
4 A certain brand of drawing pin was tossed into the air 1000 times and it landed on its
back 375 times and on its side for the remainder. Use this information to
estimate the probability that:
a one drawing pin, when tossed, will fall on its i back ii side
b two drawing pins, when tossed, will both fall on their backs
c two drawing pins, when tossed, will both fall on their sides.
Example 9
EXERCISE 13F
Janice and Lee take set shots at a
netball goal from m. From past
experience Janice throws a goal
times in every shots on average
whereas Lee throws a goal times in
every . If they both shoot for goals
determine the probability that:
32
34
7
Janice throws a goal but Lee misses.
PROBABILITY (Chapter 13) 319
Self Tutor
IB_PDmagentacyan yellow black
0 05 5
25
25
75
75
50
50
95
95
100
100 0 05 5
25
25
75
75
50
50
95
95
100
100
Y:\HAESE\IB_PD\IBPD_13\319ibpd13.cdr Wednesday, 5 July 2006 3:41:42 PM PETERDELL
Tree diagrams can be used to illustrate sample spaces provided that the alternatives are not
too numerous.
Once the sample space is illustrated, the tree diagram can be used for determining probabilities.
Consider Example 9 again. The tree diagram for this information is:
Notice that:
² The probabilities for hitting and missing are marked on the branches.
² There are four alternative paths and each branch shows a particular outcome.
² All outcomes are represented and the probabilities are obtained by multiplying.
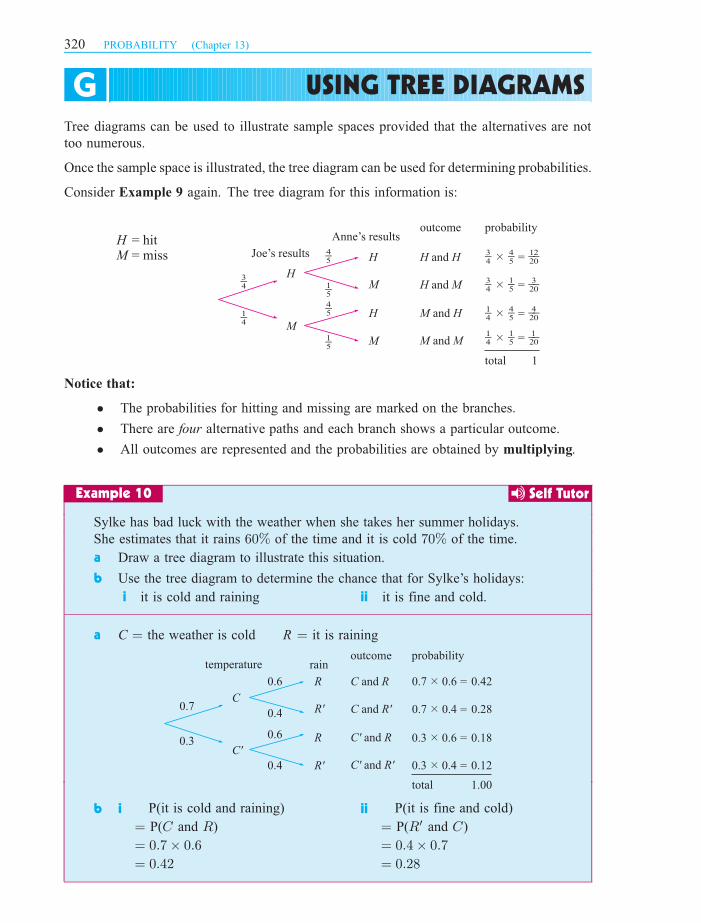
Sylke has bad luck with the weather when she takes her summer holidays.
She estimates that it rains 60% of the time and it is cold 70% of the time.
a Draw a tree diagram to illustrate this situation.
b Use the tree diagram to determine the chance that for Sylke’s holidays:
i it is cold and raining ii it is fine and cold.
a C = the weather is cold R = it is raining
b i ii
USING TREE DIAGRAMSG
Joe’s results
Anne’s results
H
H H Hand
H Mand
M Hand
M Mand
M
H
M
M
outcome probability
total 1
Er_
Er_
Er_
rQ_
tR_ tR_
tR_tR_
tQ_
tQ_
£
£
£
£
=
=
=
=
Dw_p_tQ_
tQ_rQ_
rQ_
Aw_p_
Fw_p_
Qw_Wp_H
M
= hit= miss
Example 10
temperature rain
C
R C Rand
C R'and
C' Rand
C' R'and
R'
R
C'
outcome probability
total 1.00
£
£
£
£
=
=
=
=
0.7
0.7 0.6 0.42
0.7 0.4 0.28
0.3 0.6 0.18
0.3 0.4 0.12
0.6
0.6
0.4
0.4
0.3
R'
P(it is cold and raining)
= P(C and R)
= 0:7£ 0:6
= 0:42
P(it is fine and cold)
= P(R0 and C)
= 0:4£ 0:7
= 0:28
320 PROBABILITY (Chapter 13)
Self Tutor
IB_PDmagentacyan yellow black
0 05 5
25
25
75
75
50
50
95
95
100
100 0 05 5
25
25
75
75
50
50
95
95
100
100
Y:\HAESE\IB_PD\IBPD_13\320ibpd13.cdr Wednesday, 5 July 2006 3:42:09 PM PETERDELL
1
a Copy and complete the branches on the tree diagram shown.
b Determine the probability that the marble is red.
2
3
4 A factory produces bottles of fruit juice. Machine A fills 60% of the bottles produced
and machine B fills the rest. Machine A underfills 1% of the bottles, while Machine B
underfills 0:5%. Determine the probability that the next bottle inspected at this factory
is underfilled.
EXERCISE 13G
R
WA
jar marbleJar A contains white and red marbles, whereas Jar B
contains red and white marble. A jar is randomly selected
and one marble is taken from it.
2 34 1
dart 1 dart 2
The probability of rain tomorrow is estimated to be 1
5. If it does rain, the Mudlarks
football team will have an 80% probability of winning. If it is fine they have a 50%chance of winning. Display the sample space of possible results of the football match
on a tree diagram.
Determine the probability that the Mudlarks will win tomorrow.
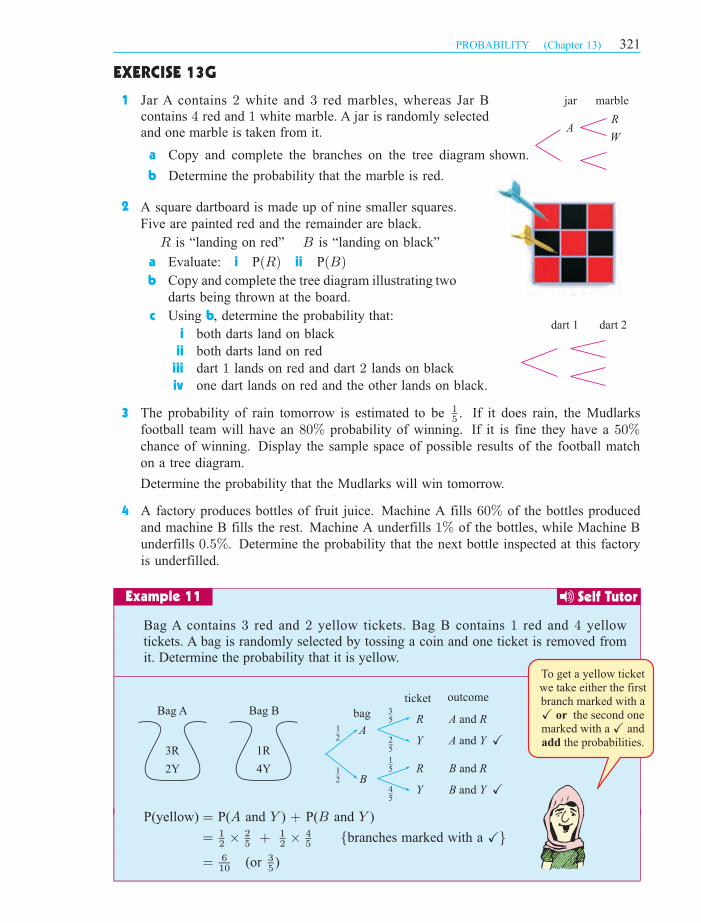
To get a yellow ticket
we take either the first
branch marked with a
the second one
marked with a and
the probabilities.
or
add
XX
Bag A contains red and yellow tickets. Bag B contains red and yellow
tickets. A bag is randomly selected by tossing a coin and one ticket is removed from
it. Determine the probability that it is yellow.
3 2 1 4
Example 11
3R 1R
2Y 4Y
Bag A Bag BR A Rand
R B Rand
AY A Yand X
Y B Yand XB
3–5
1–5
1–2
1–2
2–5
4–5
outcometicket
bag
A square dartboard is made up of nine smaller squares.
Five are painted red and the remainder are black.
R is “landing on red” B is “landing on black”
a Evaluate: i P(R) ii P(B)
b Copy and complete the tree diagram illustrating two
darts being thrown at the board.
c Using b, determine the probability that:
i both darts land on black
ii both darts land on red
iii dart 1 lands on red and dart 2 lands on black
iv one dart lands on red and the other lands on black.
P(yellow) = P(A and Y ) + P(B and Y )
= 1
2£ 2
5+ 1
2£ 4
5fbranches marked with a Xg
= 6
10(or 3
5)
PROBABILITY (Chapter 13) 321
Self Tutor
IB_PDmagentacyan yellow black
0 05 5
25
25
75
75
50
50
95
95
100
100 0 05 5
25
25
75
75
50
50
95
95
100
100
Y:\HAESE\IB_PD\IBPD_13\321ibpd13.cdr Wednesday, 5 July 2006 3:42:29 PM PETERDELL
5
2B
2R
A
1B
3R
B
2B
2R
C
SAMPLING WITH AND
WITHOUT REPLACEMENTH
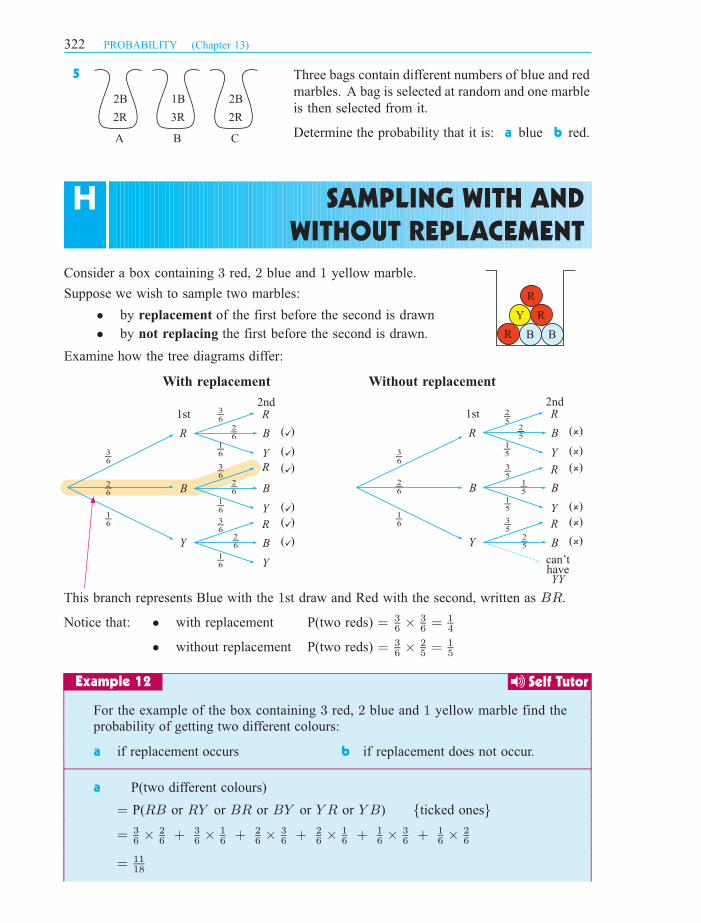
Consider a box containing 3 red, 2 blue and 1 yellow marble.
Suppose we wish to sample two marbles:
² by replacement of the first before the second is drawn
² by not replacing the first before the second is drawn.
Examine how the tree diagrams differ:
With replacement Without replacement
Notice that: ² with replacement P(two reds) = 3
6£ 3
6= 1
4
² without replacement P(two reds) = 3
6£ 2
5= 1
5
1st2nd
R
R
R
R
B
B
B
BY
Y
Y
Y
( )
( )
( )
( )
( )
( )
Ey_
Ey_
Ey_
Ey_
Wy_
Wy_
Wy_
Wy_
Qy_
Qy_
Qy_
Qy_
Et_
1st2nd
R
R
R
R
B
B
B
BY
Y
Y
( )
( )
( )
( )
( )
( )
Ey_
Wy_
Qy_
Wt_Wt_
Wt_Et_
Qt_
Qt_Qt_
can’thaveYY
a if replacement occurs b if replacement does not occur.
a P(two different colours)
For the example of the box containing red, blue and yellow marble find the
probability of getting two different colours:
3 2 1
Example 12
Y
R
R
BR B
This branch represents Blue with the 1st draw and Red with the second, written as BR.
= P(RB or RY or BR or BY or Y R or Y B) fticked onesg
= 3
6£ 2
6+ 3
6£ 1
6+ 2
6£ 3
6+ 2
6£ 1
6+ 1
6£ 3
6+ 1
6£ 2
6
= 11
18
Three bags contain different numbers of blue and red
marbles. A bag is selected at random and one marble
is then selected from it.
Determine the probability that it is: a blue b red.
322 PROBABILITY (Chapter 13)
Self Tutor
IB_PDmagentacyan yellow black
0 05 5
25
25
75
75
50
50
95
95
100
100 0 05 5
25
25
75
75
50
50
95
95
100
100
Y:\HAESE\IB_PD\IBPD_13\322ibpd13.cdr Wednesday, 5 July 2006 3:42:45 PM PETERDELL
b P(two different colours)
Note:
When using tree diagrams to assist in solving probability questions, the following rules should
be used:
² The probability for each branch is calculated by multiplying the probabilities along
that path.
² If two or more branch paths meet the description of the compound event, the
probability of each path is found and then they are added.
1 A box contains 5 red and 2 white tickets. Two tickets are drawn at random (the first
being replaced before the second is drawn). Draw a tree diagram to represent the sample
space and use it to determine the probability that:
a both are red b both are white
c the first is red and the second is white d one is red and the other is white
2 7 tickets numbered 1, 2, 3, 4, 5, 6 and 7 are placed in a hat. Two of the tickets are taken
from the hat at random without replacement. Determine the probability that:
a both are even b both are odd
c the first is odd and the second is even d one is odd and the other is even
3 Amelie has a bag containing two different varieties of apples. They are approximately
the same size and shape, but one variety is red and the other is green. There are 4 red
apples and 6 green ones. She selects one apple at random, eats it and then takes another,
also at random. Determine the probability that:
a both apples were red
b both apples were green
c the first was red and the second was green
d the first was green and the second was red
Add your answers to a, b, c and d. Explain why the answer must be 1.
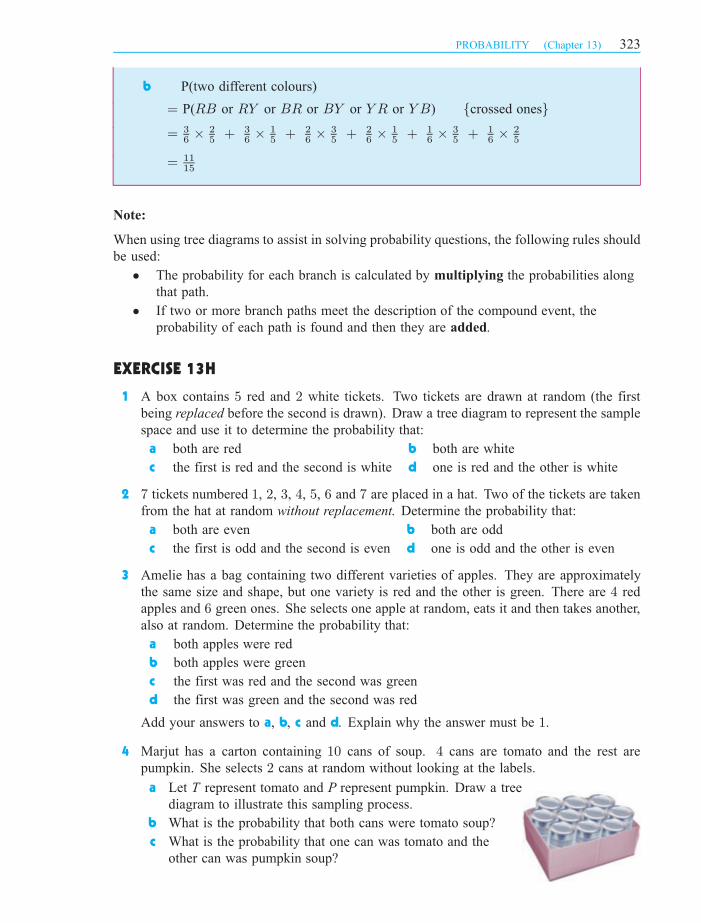
4 Marjut has a carton containing 10 cans of soup. 4 cans are tomato and the rest are
pumpkin. She selects 2 cans at random without looking at the labels.
a Let T represent tomato and P represent pumpkin. Draw a tree
diagram to illustrate this sampling process.
b What is the probability that both cans were tomato soup?
c What is the probability that one can was tomato and the
other can was pumpkin soup?
EXERCISE 13H
= P(RB or RY or BR or BY or Y R or Y B) fcrossed onesg
= 3
6£ 2
5+ 3
6£ 1
5+ 2
6£ 3
5+ 2
6£ 1
5+ 1
6£ 3
5+ 1
6£ 2
5
= 11
15
PROBABILITY (Chapter 13) 323
IB_PDmagentacyan yellow black
0 05 5
25
25
75
75
50
50
95
95
100
100 0 05 5
25
25
75
75
50
50
95
95
100
100
Y:\HAESE\IB_PD\IBPD_13\323ibpd13.cdr Tuesday, 11 July 2006 12:38:35 PM PETERDELL
A
R R R
WW
B
R
R R
R
WWW
PROBABILITIES FROM VENN DIAGRAMS(EXTENSION)
I
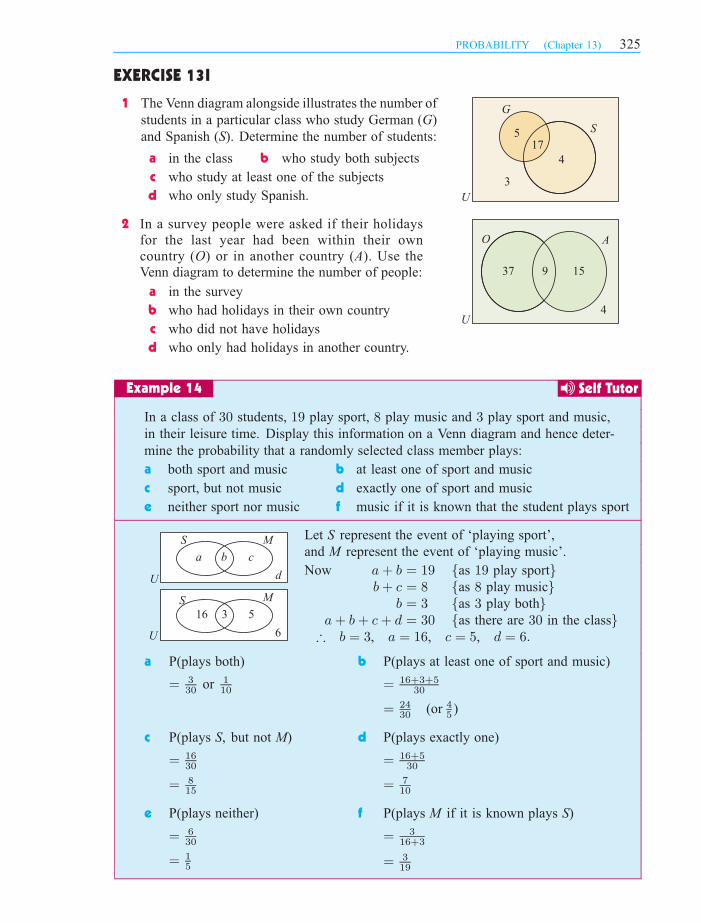
a on the flight b who watched television
c who slept or watched television d
e who did not sleep
a Number on the flight
= 46 + 4 + 8 + 12 = 70b Number who watched television
= 46 + 4 = 50
c Number who slept or watched television
= 46 + 4 + 8 = 58
d Number who neither watched television nor slept = 12
e Number who did not sleep = 46 + 12 = 58
Example 13
If the Venn diagram alongside illustrates the
number of passengers on an aeroplane flight
who watched television ( ) and slept ( ),
determine the number of passengers:
T S
T S
46 4 8
12U
who neither watched television
nor slept
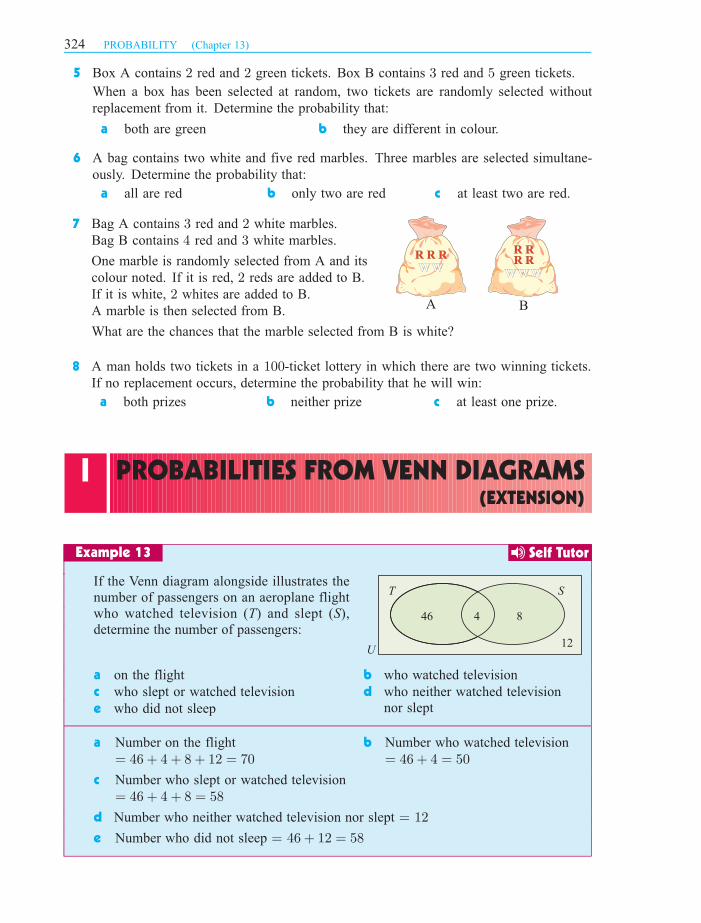
7 Bag A contains 3 red and 2 white marbles.
Bag B contains 4 red and 3 white marbles.
One marble is randomly selected from A and its
colour noted. If it is red, 2 reds are added to B.
If it is white, 2 whites are added to B.
A marble is then selected from B.
What are the chances that the marble selected from B is white?
8 A man holds two tickets in a 100-ticket lottery in which there are two winning tickets.
If no replacement occurs, determine the probability that he will win:
a both prizes b neither prize c at least one prize.
5 Box A contains 2 red and 2 green tickets. Box B contains 3 red and 5 green tickets.
When a box has been selected at random, two tickets are randomly selected without
replacement from it. Determine the probability that:
a both are green b they are different in colour.
6 A bag contains two white and five red marbles. Three marbles are selected simultane-
ously. Determine the probability that:
a all are red b only two are red c at least two are red.
324 PROBABILITY (Chapter 13)
Self Tutor
IB_PDmagentacyan yellow black
0 05 5
25
25
75
75
50
50
95
95
100
100 0 05 5
25
25
75
75
50
50
95
95
100
100
Y:\HAESE\IB_PD\IBPD_13\324ibpd13.cdr Wednesday, 5 July 2006 3:44:00 PM PETERDELL
In a survey people were asked if their holidays
for the last year had been within their own
country ( ) or in another country ( ). Use the
Venn diagram to determine the number of people:
O A
G
S517
4
3
U
1 The Venn diagram alongside illustrates the number of
students in a particular class who study German ( )G
and Spanish ( ).S Determine the number of students:
a in the class b who study both subjects
c who study at least one of the subjects
d who only study Spanish.
2
a in the survey
b who had holidays in their own country
c who did not have holidays
d who only had holidays in another country.
S
a b c
d
M
U
S
16 3 5
6
M
U
In a class of 30 students, 19 play sport, 8 play music and 3 play sport and music,
in their leisure time. Display this information on a Venn diagram and hence deter-
mine the probability that a randomly selected class member plays:
a both sport and music b at least one of sport and music
c sport, but not music d exactly one of sport and music
e neither sport nor music f music if it is known that the student plays sport
Let S represent the event of ‘playing sport’,
and M represent the event of ‘playing music’.
Now a+ b = 19 fas 19 play sportgb+ c = 8 fas 8 play musicg
b = 3 fas 3 play bothga+ b+ c+ d = 30 fas there are 30 in the classg) b = 3, a = 16, c = 5, d = 6:
a P(plays both)
= 3
30or 1
10
b P(plays at least one of sport and music)
= 16+3+5
30
= 24
30(or 4
5)
c P(plays S, but not M)
= 16
30
= 8
15
d P(plays exactly one)
= 16+5
30
= 7
10
e P(plays neither)
= 6
30
= 1
5
f P(plays M if it is known plays S)
= 3
16+3
= 3
19
EXERCISE 13I
Example 14
O A
37 9 15
4U
PROBABILITY (Chapter 13) 325
Self Tutor
IB_PDmagentacyan yellow black
0 05 5
25
25
75
75
50
50
95
95
100
100 0 05 5
25
25
75
75
50
50
95
95
100
100
Y:\HAESE\IB_PD\IBPD_13\325ibpd13.cdr Wednesday, 5 July 2006 3:44:20 PM PETERDELL
This is known as the addition law of probability, and can be written as
CONDITIONAL PROBABILITY (EXTENSION)J
THE ADDITION LAW
Example 15
A BU
A B
a b0.3
U
3 In summer, in a class of 35 students, 18 swim, 14 play tennis and 8 do neither of these
sports. A student is randomly chosen from the class. Determine the probability that the
student:
a plays tennis b does not swim
c does at least one of the sports d does exactly one of the sports
e swims, but does not play tennis
4 On a hot day a group of 50 people at the beach were asked why they had come to the
beach. 27 had come to swim, 19 had come to surf, and 3 had come to do both. If one
person was chosen at random, determine the probability that he/she had come to:
a surf but not swim b neither surf nor swim
c swim, but not surf.
In question of the previous exercise we showed that5
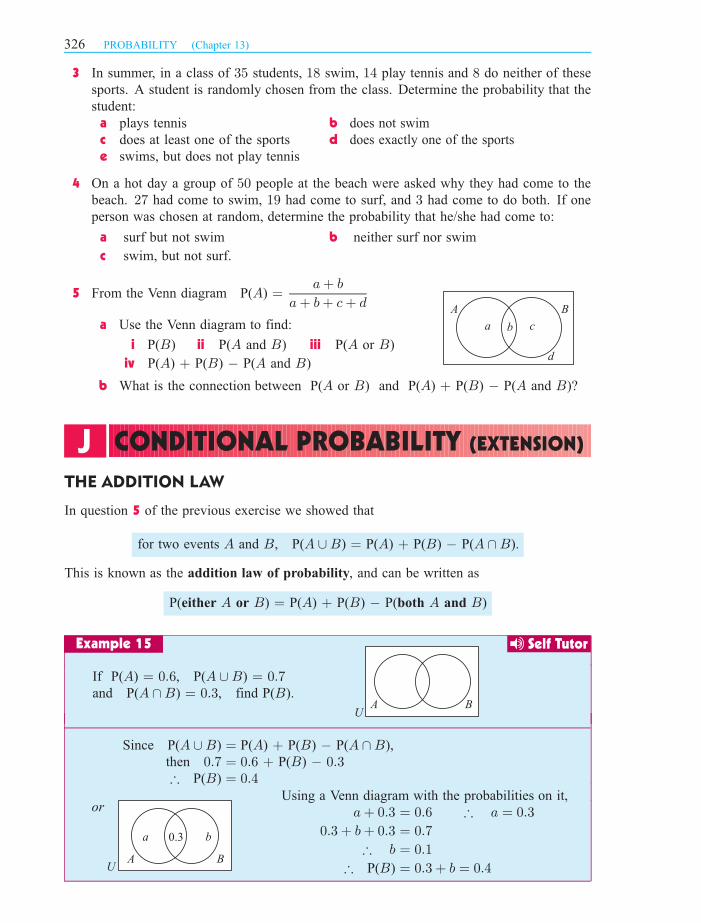
5 From the Venn diagram P(A) =a+ b
a+ b+ c+ d
a Use the Venn diagram to find:
i P(B) ii P(A and B) iii P(A or B)
iv P(A) + P(B) ¡ P(A and B)
b What is the connection between P(A or B) and P(A) + P(B) ¡ P(A and B)?
for two events A and B, P(A [B) = P(A) + P(B) ¡ P(A \B).
P(either A or B) = P(A) + P(B) ¡ P(both A and B)
If P(A) = 0:6, P(A [B) = 0:7and P(A \B) = 0:3, find P(B).
Since P(A [B) = P(A) + P(B) ¡ P(A \B),
then 0:7 = 0:6 + P(B) ¡ 0:3) P(B) = 0:4
orUsing a Venn diagram with the probabilities on it,
a+ 0:3 = 0:6 ) a = 0:3
0:3 + b+ 0:3 = 0:7
) b = 0:1
) P(B) = 0:3 + b = 0:4
A B
a b c
d
326 PROBABILITY (Chapter 13)
Self Tutor
IB_PDmagentacyan yellow black
0 05 5
25
25
75
75
50
50
95
95
100
100 0 05 5
25
25
75
75
50
50
95
95
100
100
Y:\HAESE\IB_PD\IBPD_13\326ibpd13.cdr Wednesday, 5 July 2006 3:44:58 PM PETERDELL
MUTUALLY EXCLUSIVE EVENTS
Example 16
CONDITIONAL PROBABILITY
a likes chocolate milk
b likes chocolate milk given that he/she likes iced coffee?
M C
6 9
2
8
U
Example 17
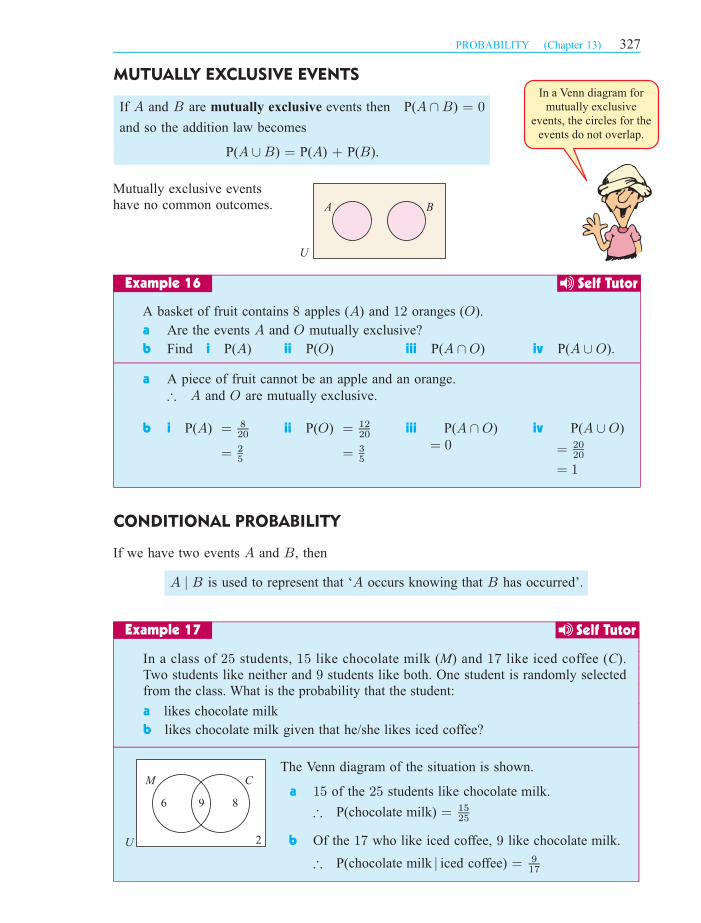
In a class of students, like chocolate milk ( ) and like iced coffee ( ).
Two students like neither and students like both. One student is randomly selected
from the class. What is the probability that the student:
25 15 179
M C
A B
U
In a Venn diagram for
mutually exclusive
events, the circles for the
events do not overlap.
The Venn diagram of the situation is shown.
a 15 of the 25 students like chocolate milk.
) P(chocolate milk) = 15
25
b Of the 17 who like iced coffee, 9 like chocolate milk.
) P(chocolate milk j iced coffee) = 9
17
Mutually exclusive events
have no common outcomes.
If A and B are mutually exclusive events then P(A \B) = 0
and so the addition law becomes
P(A [B) = P(A) + P(B).
A basket of fruit contains 8 apples (A) and 12 oranges (O).
a Are the events A and O mutually exclusive?
b Find i P(A) ii P(O) iii P(A \O) iv P(A [O).
a A piece of fruit cannot be an apple and an orange.
) A and O are mutually exclusive.
b i P(A) = 8
20
= 2
5
ii P(O) = 12
20
= 3
5
iii P(A \O)
= 0iv P(A [O)
= 20
20
= 1
If we have two events A and B, then
A j B is used to represent that ‘A occurs knowing that B has occurred’.
PROBABILITY (Chapter 13) 327
Self Tutor
Self Tutor
IB_PDmagentacyan yellow black
0 05 5
25
25
75
75
50
50
95
95
100
100 0 05 5
25
25
75
75
50
50
95
95
100
100
Y:\HAESE\IB_PD\IBPD_13\327ibpd13.cdr Wednesday, 5 July 2006 3:45:23 PM PETERDELL
1 50 students went on a ‘thrill seekers’ holiday. 40 went white-water rafting, 21 went
paragliding and each student did at least one of these activities.
a From a Venn diagram find how many students did both activities.
b If a student from this group is randomly selected, find the probability that he/she:
i went white-water rafting but not paragliding
ii went paragliding given that he/she went white-water rafting.
2
U
A
B
a
b
c
d
In a library group of 50 readers, 34 like science fiction, 22 like detective stories
and 12 dislike both.
If a reader is randomly selected, find the probability that the reader:
a likes science fiction and detective stories
b likes at least one of science fiction and detective stories
c likes science fiction given that he/she likes detective stories
d dislikes detective stories given that he/she likes science fiction.
S represents readers who like science fiction
D represents readers who like detective stories
We are given that a+ b = 34b+ c = 22
a+ b+ c = 38
) c = 38¡ 34= 4
and so b = 18and a = 16
a P(likes both)
= 18
50
= 9
25
b P(likes at least one)
= 38
50
= 19
25
c d
a
16
b
18 4
c
S
S
D
D
12
12
U
U
Example 18
EXERCISE 13J
Proof:
It follows that
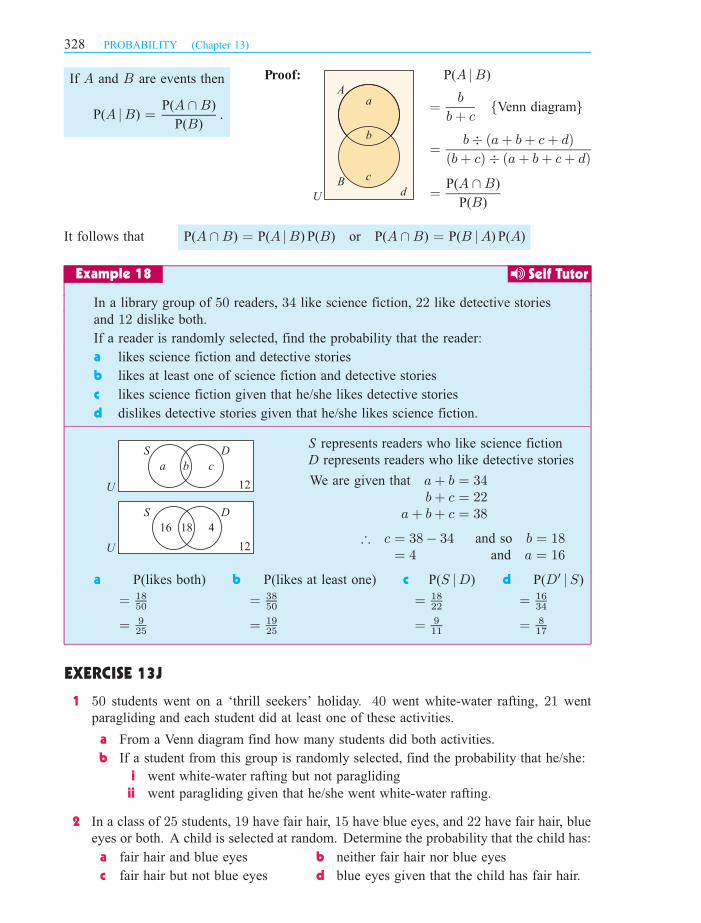
If A and B are events then
P(A jB) =P(A \B)
P(B).
P(A jB)
=b
b+ cfVenn diagramg
=P(A \B)
P(B)
P(A \B) = P(A jB) P(B) or P(A \B) = P(B jA) P(A)
P(S jD)
= 18
22
= 9
11
P(D0 jS)
= 16
34
= 8
17
=b¥ (a+ b+ c+ d)
(b+ c)¥ (a+ b+ c+ d)
In a class of 25 students, 19 have fair hair, 15 have blue eyes, and 22 have fair hair, blue
eyes or both. A child is selected at random. Determine the probability that the child has:
a fair hair and blue eyes b neither fair hair nor blue eyes
c fair hair but not blue eyes d blue eyes given that the child has fair hair.
328 PROBABILITY (Chapter 13)
Self Tutor
IB_PDmagentacyan yellow black
0 05 5
25
25
75
75
50
50
95
95
100
100 0 05 5
25
25
75
75
50
50
95
95
100
100
Y:\HAESE\IB_PD\IBPD_13\328ibpd13.cdr Wednesday, 5 July 2006 3:45:42 PM PETERDELL
3 28 students go tramping. 23 get sunburnt, 8 get blis-
ters and 5 get both sunburnt and blisters. Determine
the probability that a randomly selected student:
a did not get blisters
b either got blisters or sunburnt
c neither got blisters nor sunburnt
d got blisters, given that the student was sunburnt
e was sunburnt, given that the student did not get
blisters.
4 An examination in French has two parts; aural and written. When 30 students sit for
the examination, 25 pass aural, 26 pass written and 3 fail both parts. Determine the
probability that a student who:
a passed aural also passed written b passed aural, failed written.
5 In a certain town there are 3 supermarkets, P, Q and R. 60% of the population shop at P,
36% shop at Q, 34% shop at R, 18% shop at P and Q, 15% shop at P and R, 4% shop
at Q and R and 2% shop at all 3 supermarkets. A person is selected at random.
Determine the probability that the person shops at:
a none of the supermarkets b at least one of the supermarkets
c exactly one of the supermarkets d either P or Q
e P, given that the person shops at at least one supermarket
f R, given that the person shops at either P or Q or both.
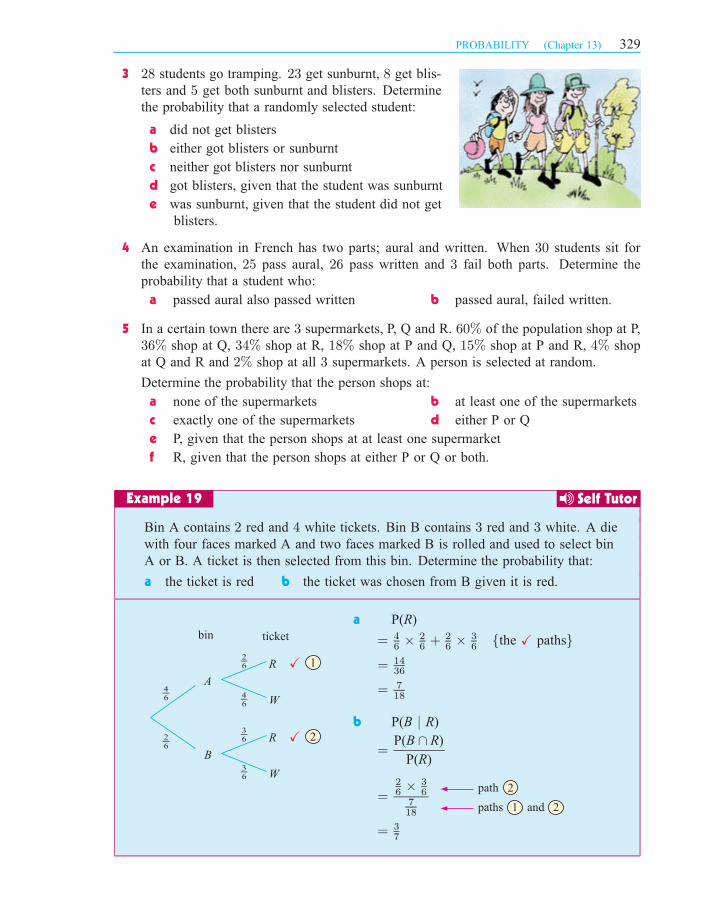
Bin A contains 2 red and 4 white tickets. Bin B contains 3 red and 3 white. A die
with four faces marked A and two faces marked B is rolled and used to select bin
A or B. A ticket is then selected from this bin. Determine the probability that:
a the ticket is red b the ticket was chosen from B given it is red.
a P( )R
= 4
6£ 2
6+ 2
6£ 3
6fthe X pathsg
= 14
36
= 7
18
b P(B j R)
=P(B \ R)
P( )R
=2
6£ 3
6
7
18
= 3
7
X
X
R
R
W
W
A
B
bin ticket
Ry_
Wy_
Ry_
Wy_
Ey_
Ey_
2
2
1
path
Example 19
paths 1 and 2
PROBABILITY (Chapter 13) 329
Self Tutor
IB_PDmagentacyan yellow black
0 05 5
25
25
75
75
50
50
95
95
100
100 0 05 5
25
25
75
75
50
50
95
95
100
100
Y:\HAESE\IB_PD\IBPD_13\329ibpd13.cdr Wednesday, 5 July 2006 3:45:58 PM PETERDELL
REVIEW SET 13A
6 Marius has 2 bags of peaches. Bag A has 4 ripe and 2 unripe peaches, and bag B has
5 ripe and 1 unripe peaches. Ingrid selects a bag by tossing a coin, and takes a peach
from that bag.
a Determine the probability that the peach is ripe.
b Given that the peach is ripe, what is the probability it came from B?
7 When Sophia goes to the local shopping centre on Monday to Thursday the probability
that she finds a carpark is 95%. When she goes on Friday or Saturday the probability of
finding a carpark is 70%. Assuming that she is equally likely to shop on any day from
Monday to Saturday, determine the probability that on any trip:
a she finds a carpark b it is Saturday, given that she finds a carpark.
8
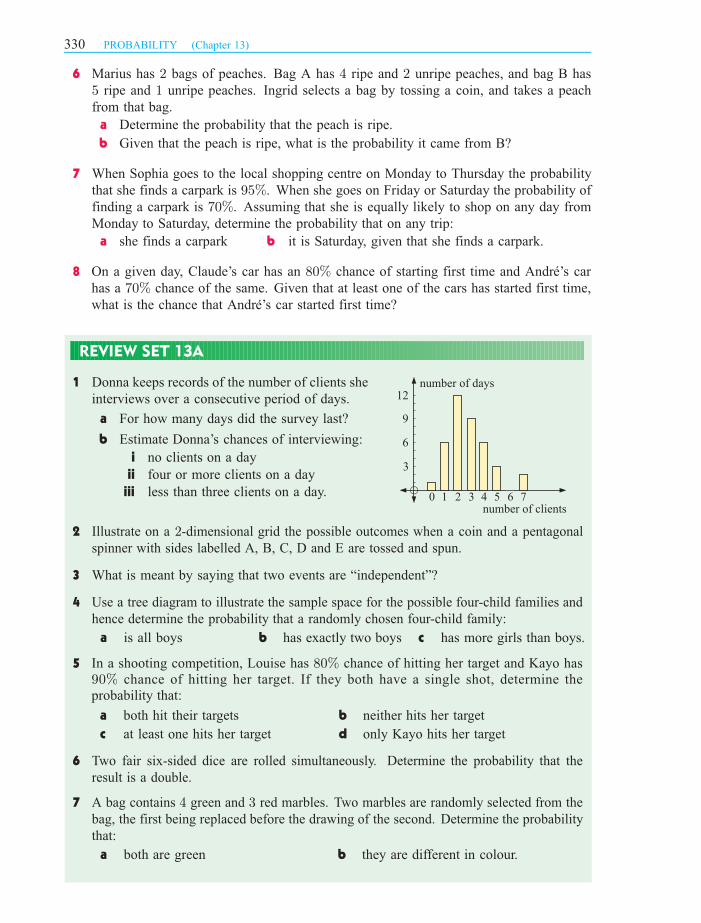
1 Donna keeps records of the number of clients she
interviews over a consecutive period of days.
a For how many days did the survey last?
b Estimate Donna’s chances of interviewing:
i no clients on a day
ii four or more clients on a day
iii less than three clients on a day.
2 Illustrate on a 2-dimensional grid the possible outcomes when a coin and a pentagonal
spinner with sides labelled A, B, C, D and E are tossed and spun.
3 What is meant by saying that two events are “independent”?
4 Use a tree diagram to illustrate the sample space for the possible four-child families and
hence determine the probability that a randomly chosen four-child family:
a is all boys b has exactly two boys c has more girls than boys.
5
6 Two fair six-sided dice are rolled simultaneously. Determine the probability that the
result is a double.
7 A bag contains 4 green and 3 red marbles. Two marbles are randomly selected from the
bag, the first being replaced before the drawing of the second. Determine the probability
that:
a both are green b they are different in colour.
1
3
0 2 3
6
4 6 75
9
12number of days
number of clients
On a given day, Claude’s car has an 80% chance of starting first time and Andre’s car
has a 70% chance of the same. Given that at least one of the cars has started first time,
what is the chance that Andre’s car started first time?
a both hit their targets b neither hits her target
c at least one hits her target d only Kayo hits her target
In a shooting competition, Louise has chance of hitting her target and Kayo has
chance of hitting her target. If they both have a single shot, determine the
probability that:
80%90%
330 PROBABILITY (Chapter 13)
IB_PDmagentacyan yellow black
0 05 5
25
25
75
75
50
50
95
95
100
100 0 05 5
25
25
75
75
50
50
95
95
100
100
Y:\HAESE\IB_PD\IBPD_13\330ibpd13.cdr Wednesday, 5 July 2006 3:46:13 PM PETERDELL
REVIEW SET 13B
8 A circle is divided into 5 sectors with congruent angles at the centre and a spinner is
constructed. The sectors are numbered 1, 2, 3, 4, and 5. A coin is tossed and the spinner
is spun.
a Use a 2-dimensional grid to show the sample space.
b What is the chance of getting: i a head and a 5 ii a head or a 5?
9 Bag X contains three white and two red marbles. Bag Y contains one white and three
red marbles. A bag is randomly chosen and two marbles are drawn from it. Illustrate
the given information on a tree diagram and hence determine the probability of drawing
two marbles of the same colour.
10 At a local girls’ school, 65% of the students play netball, 60% play tennis and 20%play neither sport. Display this information on a Venn diagram and hence determine the
likelihood that a randomly chosen student plays:
a netball b netball but not tennis
c at least one of these two sports d exactly one of these two sports
e tennis, given that she plays netball
1 Pierre conducted a survey to determine the ages of peo-
ple walking through a shopping mall. The results are
shown in the table alongside. Find, correct to 3 deci-
mal places, the estimated probability that the next person
Pierre meets in the shopping mall is:
a between 20 and 39 years of age
b less than 40 years of age c at least 20 years of age.
Age Frequency
0 - 19 2220 - 39 4340 - 59 3960+ 14
2 a List, in set notation, the sample space of possible results when a tetrahedral die
with four faces labelled A, B, C and D is rolled and a 20-cent coin are tossed
simultaneously.
b Use a tree diagram to illustrate the sample space for the following:
Bags A, B and C contain green or yellow tickets. A bag is selected and then a
ticket taken from it.
3 Use a tree diagram to illustrate the following sample space: Martina and Justine play
tennis. The first to win three sets wins the match.
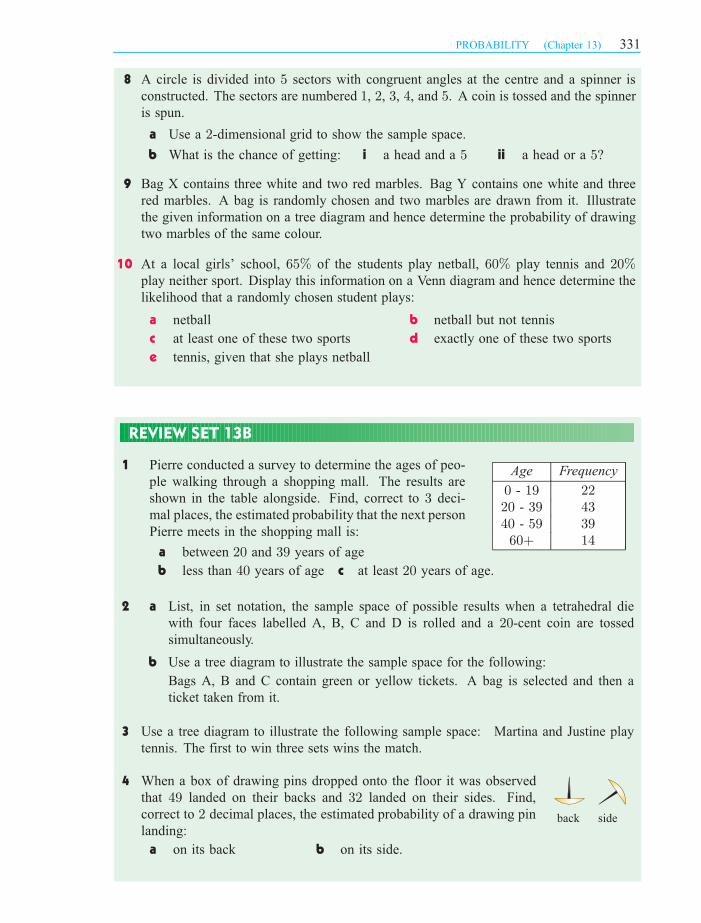
4 When a box of drawing pins dropped onto the floor it was observed
that 49 landed on their backs and 32 landed on their sides. Find,
correct to 2 decimal places, the estimated probability of a drawing pin
landing:
a on its back b on its side.
back side
PROBABILITY (Chapter 13) 331
IB_PDmagentacyan yellow black
0 05 5
25
25
75
75
50
50
95
95
100
100 0 05 5
25
25
75
75
50
50
95
95
100
100
Y:\HAESE\IB_PD\IBPD_13\331ibpd13.cdr Wednesday, 5 July 2006 3:46:26 PM PETERDELL
vowelvowel
vowelnon-vowel
non-vowel
non-vowel
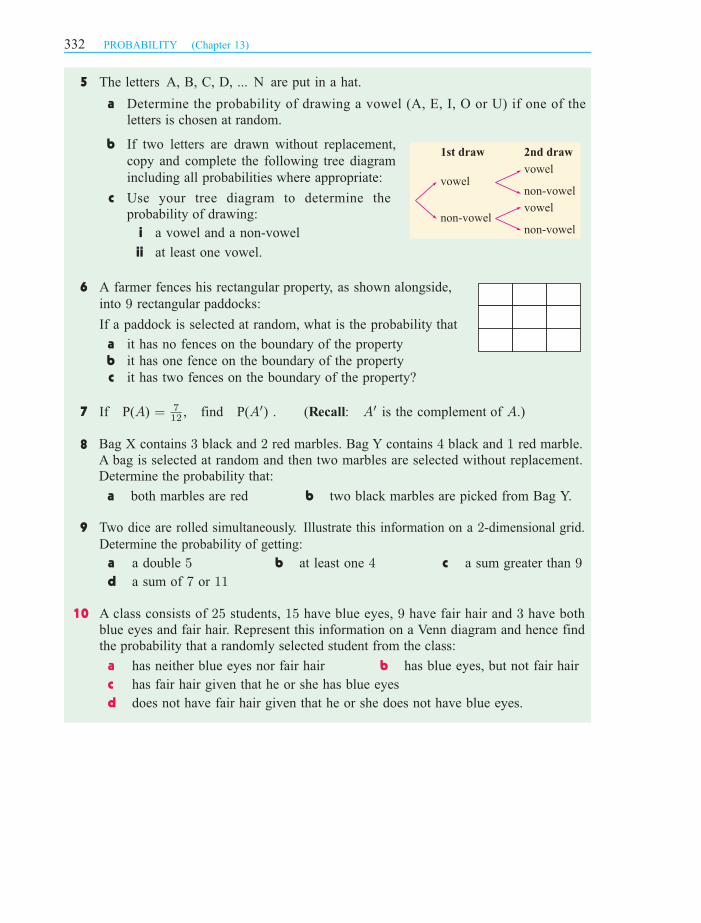
1st draw 2nd drawb If two letters are drawn without replacement,
copy and complete the following tree diagram
including all probabilities where appropriate:
c
i a vowel and a non-vowel
ii at least one vowel.
6 A farmer fences his rectangular property, as shown alongside,
into 9 rectangular paddocks:
If a paddock is selected at random, what is the probability that
a it has no fences on the boundary of the property
b it has one fence on the boundary of the property
c it has two fences on the boundary of the property?
7
8
9 Two dice are rolled simultaneously. Illustrate this information on a 2-dimensional grid.
Determine the probability of getting:
a a double 5 b at least one 4 c a sum greater than 9
d a sum of 7 or 11
10
a b has blue eyes, but not fair hair
c
d
A class consists of students, have blue eyes, have fair hair and have both
blue eyes and fair hair. Represent this information on a Venn diagram and hence find
the probability that a randomly selected student from the class:
25 15 9 3
Use your tree diagram to determine the
probability of drawing:
5 The letters A, B, C, D, ... N are put in a hat.
a Determine the probability of drawing a vowel (A, E, I, O or U) if one of the
letters is chosen at random.
has neither blue eyes nor fair hair
has fair hair given that he or she has blue eyes
does not have fair hair given that he or she does not have blue eyes.
If P(A) = 7
12, find P(A0) . (Recall: A0 is the complement of A.)
a both marbles are red b two black marbles are picked from Bag Y.
Bag X contains black and red marbles. Bag Y contains black and red marble.
A bag is selected at random and then two marbles are selected without replacement.
Determine the probability that:
3 2 4 1
332 PROBABILITY (Chapter 13)
IB_PDmagentacyan yellow black
0 05 5
25
25
75
75
50
50
95
95
100
100 0 05 5
25
25
75
75
50
50
95
95
100
100
Y:\HAESE\IB_PD\IBPD_13\332ibpd13.cdr Wednesday, 5 July 2006 3:46:35 PM PETERDELL