probability - chapter 4 - tim buskentimbusken.com/assets/statistics/chapter-4/probability.pdf ·...
TRANSCRIPT
Probability - Chapter 4In this chapter, you will learn about probability—its meaning, how it is computed,
and how to evaluate it in terms of the likelihood of an event actually happening.
A cynical person once said, “The only two sure things are death and taxes.” This philosophy no doubt arose because so much in people’s lives is affected by chance. From the time you awake until you go to bed, you make decisions regarding the possible events that are governed at least in part by chance. For example, should you carry an umbrella to work today? Will your car battery last until spring? Should you accept that new job?
Probability as a general concept can be defined as the chance of an event occurring. Many people are familiar with probability from observing or playing games of chance, such as card games, slot machines, or lotteries. In addition to being used in games of chance, probability theory is used in the fields of insurance, investments, and weather fore-casting and in various other areas. Finally, as stated in Chapter 1, probability is the basis of inferential statistics. For example, predictions are based on probability, and hypotheses are tested by using probability.
The basic concepts of probability are explained in this chapter. These concepts include probability experiments, sample spaces, the addition and multiplication rules, and the probabilities of complementary events. Also in this chapter, you will learn the rule for counting, the differences between permutations and combinations, and how to figure out how many different combinations for specific situations exist.
Sample Spaces and ProbabilityThe theory of probability grew out of the study of various games of chance using coins, dice, and cards. Since these devices lend themselves well to the application of concepts of probability, they will be used in this chapter as examples.
Basic ConceptsProcesses such as flipping a coin, rolling a die, or drawing a card from a deck are called probability experiments.
A probability experiment is a chance process that leads to well-defined results called outcomes.
An outcome is the result of a single trial of a probability experiment.
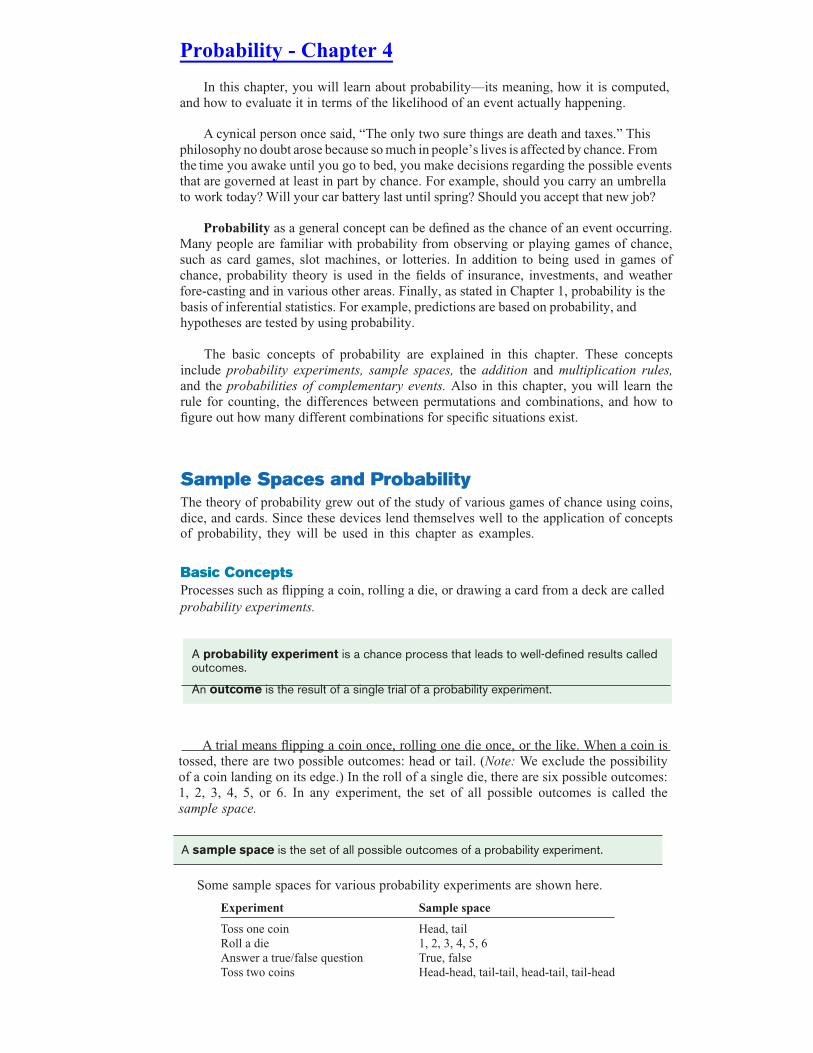
A trial means flipping a coin once, rolling one die once, or the like. When a coin istossed, there are two possible outcomes: head or tail. (Note: We exclude the possibilityof a coin landing on its edge.) In the roll of a single die, there are six possible outcomes:1, 2, 3, 4, 5, or 6. In any experiment, the set of all possible outcomes is called thesample space.
A sample space is the set of all possible outcomes of a probability experiment.
Some sample spaces for various probability experiments are shown here.
Experiment Sample space
Toss one coinRoll a dieAnswer a true/false questionToss two coins
Head, tail1, 2, 3, 4, 5, 6True, falseHead-head, tail-tail, head-tail, tail-head

It is important to realize that when two coins are tossed, there are four possible out-comes, as shown in the fourth experiment above. Both coins could fall heads up. Bothcoins could fall tails up. Coin 1 could fall heads up and coin 2 tails up. Or coin 1 couldfall tails up and coin 2 heads up. Heads and tails will be abbreviated as H and T through-out this chapter.
Example 4–1 Rolling DiceFind the sample space for rolling two dice.
Roll Probability2 1
36
3 236
4 336
5 436
6 536
7 636
8 536
9 436
10 336
11 236
12 136
Determine the following probabilities:
• P(the sum is 8)• P(rolling a double 1)
A 98765432 10 J Q K
A 2 3 94 5 6 7 8 10 J Q K
A 9876532 4 10 J Q K
A 52 3 4 6 7 8 9 10 J Q K
Example 4–2 Drawing CardsFind the sample space for drawing one card from an ordinary deck of cards.
Solution
Since there are 4 suits (hearts, clubs, diamonds, and spades) and 13 cards for each suit (ace through king), there are 52 outcomes in the sample space.

Example 4–3 Gender of ChildrenFind the sample space for the gender of the children if a family has three children. UseB for boy and G for girl.
Solution
There are two genders, male and female, and each child could be either gender. Hence,there are eight possibilities, as shown here.
BBB BBG BGB GBB GGG GGB GBG BGG
A tree diagram is a device consisting of line segments emanating from a starting pointand also from the outcome point. It is used to determine all possible outcomes of aprobability experiment.
Example 4–4 Gender of ChildrenUse a tree diagram to find the sample space for the gender of three children in a family
Firstchild
Secondchild
Thirdchild Outcomes
B
B
B
G
G
B
G
G
B
B
G
G
B
G
BBB
BBG
BGB
BGG
GBB
GBG
GGB
GGG
HH
HT
H
TTH
TT
H
T
First toss Secondtoss
Finaloutcomes
H
T
Example 4–4 Coin TossUse a tree diagram to find the sample space for the experiment tossing a coin twice.

An outcome was defined previously as the result of a single trial of a probability experiment. In many problems, one must find the probability of two or more outcomes. For this reason, it is necessary to distinguish between an outcome and an event.
An event consists of a set of outcomes of a probability experiment.
An event can be one outcome or more than one outcome. For example, if a die is rolled and a 6 shows, this result is called an outcome, since it is a result of a single trial. An event with one outcome is called a simple event. The event of getting an odd number when a die is rolled is called a compound event, since it consists of three outcomes or three simple events. In general, a compound event consists of two or more outcomes or simple events.
There are three basic interpretations of probability:
1. Classical probability
2. Empirical probability (or relative frequency probability)3. Subjective probability
Classical ProbabilityClassical probability uses sample spaces to determine the numerical probability that an event will happen. You do not actually have to perform the experiment to determine that probability. Classical probability is so named because it was the first type of probability studied formally by mathematicians in the 17th and 18th centuries.
Classical probability assumes that all outcomes in the sample space are equally likely to occur. For example, when a single die is rolled, each outcome has the same prob-
ability of occurring. Since there are six outcomes, each outcome has a probability of .When a card is selected from an ordinary deck of 52 cards, you assume that the deck has been shuffled, and each card has the same probability of being selected. In this case,
it is .
Equally likely events are events that have the same probability of occurring.
152
16
Formula for Classical Probability
Definition (The Classical Approach)Assume that a given procedure has n different simple events and that each of those simple events has an equal chance of occurring. If event A
Probabilities can be expressed as fractions or decimals, or—where appropriate—percentages. If you ask, “What is the probability of getting a head when a coin is tossed?” typical responses can be any of the following three.
“One-half.”
“Point five.”
“Fifty percent.”These answers are all equivalent. In most cases, the answers to examples and exercises given in this chapter are expressed as fractions or decimals, but percentages are used where appropriate.
Rounding Rule for Probabilities Probabilities should be expressed as reduced fractions or rounded to two or three decimal places. When the probability of an event is an extremely small decimal, it is permissible to round the decimal to the first nonzero digit after the point. For example, 0.0000587 would be 0.00006. If decimals are converted to percentages to express probabilities, move the decimal point two places to the right and add a percent sign.
P(A) =#of ways A can occur
#of different simple events=
sn

a. An aceb. A diamondc. An ace of diamondsd. A 4 or a 6e. A 4 or a clubf. A 6 or a spadeg. A heart or a clubh. A red queeni. A red card or a 7j. A black card and a 10
16. Human Blood Types Human blood is grouped intofour types. The percentages of Americans with each typeare listed below.O 43% A 40% B 12% AB 5%
Choose one American at random. Find the probabilitythat this person
a. Has type O bloodb. Has type A or B
c. Does not have type O or ASource: www.infoplease.com
12. (ans) Rolling a Die If a die is rolled one time, findthese probabilities.
a. Of getting a 4b. Of getting an even numberc. Of getting a number greater than 4d. Of getting a number less than 7e. Of getting a number greater than 0f. Of getting a number greater than 3 or an odd numberg. Of getting a number greater than 3 and an odd
number
13. Rolling Two Dice If two dice are rolled one time, findthe probability of getting these results.
a. A sum of 6b. Doublesc. A sum of 7 or 11d. A sum greater than 9e. A sum less than or equal to 4
14. (ans) Drawing a Card If one card is drawn from adeck, find the probability of getting these results.

Empirical ProbabilityThe difference between classical and empirical probability is that classical probability assumes that certain outcomes are equally likely (such as the outcomes when a die is rolled), while empirical probability relies on actual experience to determine the likelihood of outcomes. In empirical probability, one might actually roll a given die 6000 times, observe the various frequencies, and use these frequencies to determine the probability of an outcome.
Finding Empirical or Relative Frequency ProbabilityConduct (or observe) a procedure, and count the number of times event A actually occurs. Based on these actual results, P(A) is approximated as
P(A) =#of times A occurred
#of times procedure was repeated
Example: When trying to determine the probability that an individual car crashes in a year, wemust examine past results to determine the number of cars in use in a year and the number ofthem that crashed, then find the ratio of the two.[1]
P(crash) =#of times cars that crashed
total #of cars=
6, 511, 100135, 670, 000
= 0.0480
This probability is called empirical probability and is based on observation.
21. Computers in Elementary Schools Elementary andsecondary schools were classified by the number ofcomputers they had. Choose one of these schools atrandom.
Computers 1–10 11–20 21–50 51–100 100�
Schools 3170 4590 16,741 23,753 34,803
Choose one school at random. Find the probability thatit has
a. 50 or fewer computersb. More than 100 computersc. No more than 20 computers
Source: World Almanac.
25. Sources of Energy Uses in the United States Abreakdown of the sources of energy used in the UnitedStates is shown below. Choose one energy source atrandom. Find the probability that it is
a. Not oilb. Natural gas or oilc. Nuclear
Oil 39% Coal 23%Nuclear 8%
Natural gas 24%Hydropower 3% Other 3%
Source: www.infoplease.com
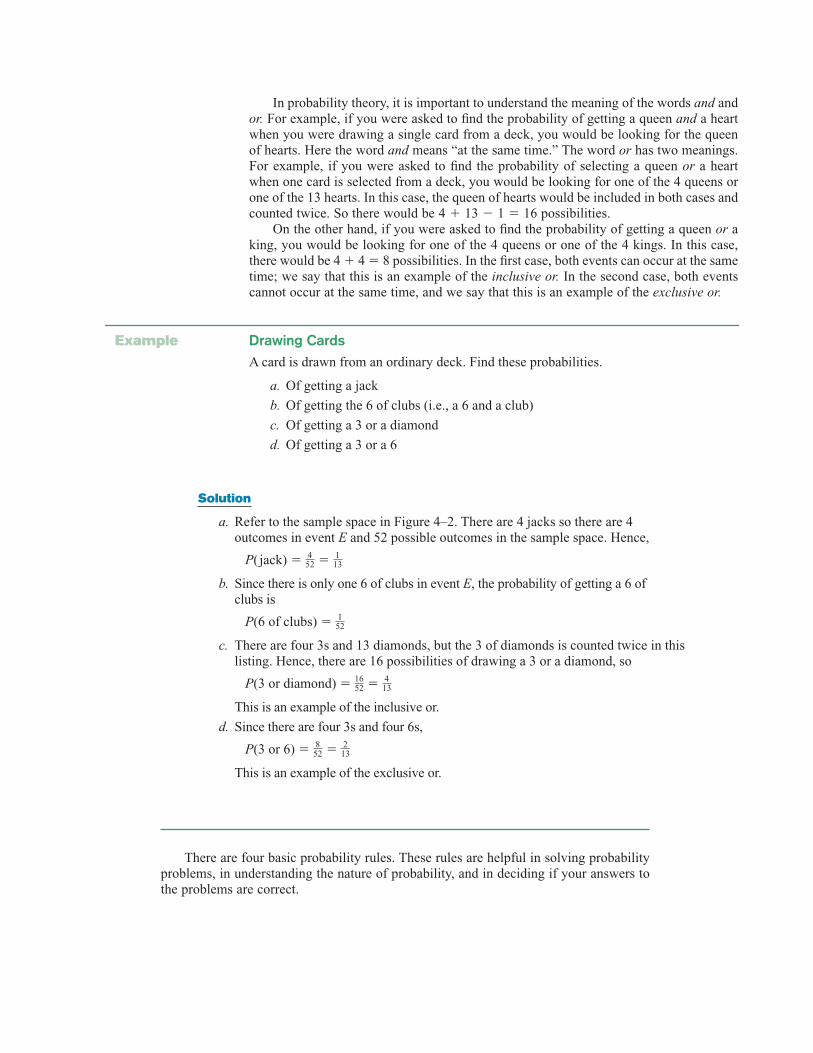
In probability theory, it is important to understand the meaning of the words and andor. For example, if you were asked to find the probability of getting a queen and a heartwhen you were drawing a single card from a deck, you would be looking for the queenof hearts. Here the word and means “at the same time.” The word or has two meanings.For example, if you were asked to find the probability of selecting a queen or a heartwhen one card is selected from a deck, you would be looking for one of the 4 queens orone of the 13 hearts. In this case, the queen of hearts would be included in both cases andcounted twice. So there would be 4 � 13 � 1 � 16 possibilities.
On the other hand, if you were asked to find the probability of getting a queen or aking, you would be looking for one of the 4 queens or one of the 4 kings. In this case,there would be 4 � 4 � 8 possibilities. In the first case, both events can occur at the sametime; we say that this is an example of the inclusive or. In the second case, both eventscannot occur at the same time, and we say that this is an example of the exclusive or.
Example 4–7 Drawing CardsA card is drawn from an ordinary deck. Find these probabilities.
a. Of getting a jack
b. Of getting the 6 of clubs (i.e., a 6 and a club)
c. Of getting a 3 or a diamond
d. Of getting a 3 or a 6
Solution
a. Refer to the sample space in Figure 4–2. There are 4 jacks so there are 4outcomes in event E and 52 possible outcomes in the sample space. Hence,
P( jack) �
b. Since there is only one 6 of clubs in event E, the probability of getting a 6 ofclubs is
P(6 of clubs) �
c. There are four 3s and 13 diamonds, but the 3 of diamonds is counted twice in thislisting. Hence, there are 16 possibilities of drawing a 3 or a diamond, so
P(3 or diamond) �
This is an example of the inclusive or.
d. Since there are four 3s and four 6s,
P(3 or 6) �
This is an example of the exclusive or.
2� 138
52
4� 131652
152
1� 134
52
There are four basic probability rules. These rules are helpful in solving probabilityproblems, in understanding the nature of probability, and in deciding if your answers tothe problems are correct.

Probability Rule 1
The probability of any event E is a number (either a fraction or decimal) between and including 0 and 1. This is denoted by 0 � P(E ) � 1.
If an event E cannot occur (i.e., the event contains no members in the sample space), its probability is 0.
Probability Rule 3
If an event E is certain, then the probability of E is 1.
Rule 1 states that probabilities cannot be negative or greater than 1.
Probability Rule 2
Example 4–8 Rolling a DieWhen a single die is rolled, find the probability of getting a 9.
Solution
Since the sample space is 1, 2, 3, 4, 5, and 6, it is impossible to get a 9. Hence, the probability is P(9) � � 0.0
6
For example, in the roll of a fair die, each outcome in the sample space has a probability of 1/6. Hence, the sum of the probabilities of the outcomes is as shown.
Outcome 1 2 3 4 5 6
Probability
Sum �� � � � � 1�66
16
16
16
16
16
16
16
16
16
16
16
16
Probability Rule 4
The sum of the probabilities of all the outcomes in the sample space is 1.
In other words, if P(E ) � 1, then the event E is certain to occur.
Example 4–9 Rolling a DieWhen a single die is rolled, what is the probability of getting a number less than 7?
Solution
Since all outcomes—1, 2, 3, 4, 5, and 6—are less than 7, the probability is
P(number less than 7) � � 1
The event of getting a number less than 7 is certain.
In other words, probability values range from 0 to 1. When the probability of an event is close to 0, its occurrence is highly unlikely. When the probability of an event is near 0.5, there is about a 50-50 chance that the event will occur; and when the probabil-ity of an event is close to 1, the event is highly likely to occur.
66
Complementary EventsAnother important concept in probability theory is that of complementary events. Whena die is rolled, for instance, the sample space consists of the outcomes 1, 2, 3, 4, 5, and6. The event E of getting odd numbers consists of the outcomes 1, 3, and 5. The event ofnot getting an odd number is called the complement of event E, and it consists of the out-comes 2, 4, and 6.
The complement of an event E is the set of outcomes in the sample space that arenot included in the outcomes of event E. The complement of E is denoted by (read“E bar”).
Example 4–10 further illustrates the concept of complementary events.
E
Example 4–10 Finding ComplementsFind the complement of each event.
a. Rolling a die and getting a 4
b. Selecting a letter of the alphabet and getting a vowel
c. Selecting a month and getting a month that begins with a J
d. Selecting a day of the week and getting a weekday
The outcomes of an event and the outcomes of the complement make up the entire sample space. For example, if two coins are tossed, the sample space is HH, HT, TH, and TT. The complement of “getting all heads” is not “getting all tails,” since the event “all heads” is HH, and the complement of HH is HT, TH, and TT. Hence, the complement of the event “all heads” is the event “getting at least one tail.”
Since the event and its complement make up the entire sample space, it follows that the sum of the probability of the event and the probability of its complement will equal 1.
Rule for Complementary Events
P E( ) � 1 � P(E ) or P(E) � 1 � P E( ) or P(E ) � P E( ) � 1
Stated in words, the rule is: If the probability of an event or the probability of its com-plement is known, then the other can be found by subtracting the probability from 1. Thisrule is important in probability theory because at times the best solution to a problem isto find the probability of the complement of an event and then subtract from 1 to get theprobability of the event itself.

Example 4–11 Residence of PeopleIf the probability that a person lives in an industrialized country of the world is , findthe probability that a person does not live in an industrialized country.Source: Harper’s Index.
Solution
P(not living in an industrialized country) � 1 � P(living in an industrialized country)� 1 � �
Probabilities can be represented pictorially by Venn diagrams. The figure below shows the probability of a simple event E. The area inside the circle represents the probability of event E, that is, P(E ). The area inside the rectangle represents the probability of all the events in the sample space P(S).
45
15
15
The Venn diagram that represents the probability of the complement of an event P(E) is shown in figure(b). In this case, P E( ) � 1 � P(E), which is the area inside the rectangle but outside the circle representing P(E). Recall that P(S) � 1 and P(E) � 1 � P(E). The reasoning is that P(E) is represented by the area of the circle and P E( ) is the probability of the events that are outside the circle.
Figure 4–4
Venn Diagram for theProbability andComplement P(E )
P(S) = 1
(a) Simple probability
P(E )
P(E )
(b) P(E ) = 1 – P(E )
Example 4–13 Distribution of Blood TypesIn a sample of 50 people, 21 had type O blood, 22 had type A blood, 5 had type Bblood, and 2 had type AB blood. Set up a frequency distribution and find the followingprobabilities.
a. A person has type O blood.
b. A person has type A or type B blood.
c. A person has neither type A nor type O blood.
d. A person does not have type AB blood.Source: The American Red Cross.
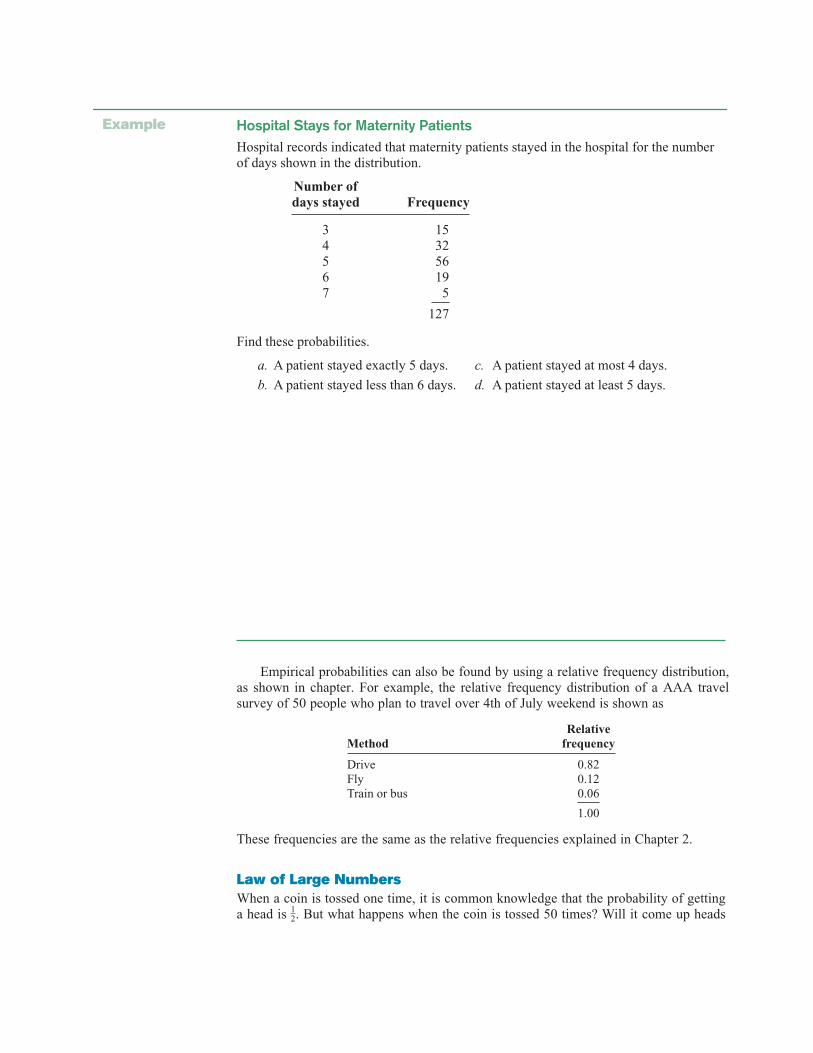
Example 4–14 Hospital Stays for Maternity PatientsHospital records indicated that maternity patients stayed in the hospital for the numberof days shown in the distribution.
Number ofdays stayed Frequency
3 154 325 566 197 5
127
Find these probabilities.
a. A patient stayed exactly 5 days. c. A patient stayed at most 4 days.
b. A patient stayed less than 6 days. d. A patient stayed at least 5 days.
Empirical probabilities can also be found by using a relative frequency distribution, as shown in chapter. For example, the relative frequency distribution of a AAA travel survey of 50 people who plan to travel over 4th of July weekend is shown as
RelativeMethod frequency
Drive 0.82Fly 0.12Train or bus 0.06
1.00
These frequencies are the same as the relative frequencies explained in Chapter 2.
Law of Large NumbersWhen a coin is tossed one time, it is common knowledge that the probability of gettinga head is . But what happens when the coin is tossed 50 times? Will it come up heads1
2
25 times? Not all the time. You should expect about 25 heads if the coin is fair. But dueto chance variation, 25 heads will not occur most of the time.
If the empirical probability of getting a head is computed by using a small number oftrials, it is usually not exactly . However, as the number of trials increases, the empiricalprobability of getting a head will approach the theoretical probability of , if in fact thecoin is fair (i.e., balanced). This phenomenon is an example of the law of large numbers.
Subjective ProbabilityThe third type of probability is called subjective probability. Subjective probability uses a probability value based on an educated guess or estimate, employing opinions and inex-act information.
In subjective probability, a person or group makes an educated guess at the chance that an event will occur. This guess is based on the person’s experience and evaluation of a solution.
For example, a sportswriter may say that there is a 70% probability that the Pirates will win the pennant next year.
A physician might say that, on the basis of her diagnosis, there is a 30% chance the patient will need an operation.
A seismologist might say there is an 80% probability that an earthquake will occur in a certain area.
All three types of probability (classical, empirical, and subjective) are used to solve a variety of problems in business, engineering, and other fields.
12
12
12
11. Classify each statement as an example of classical prob-ability, empirical probability, or subjectiveprobability.
a. The probability that a person will watch the 6 o’clock evening news is 0.15.b. The probability of winning the final round of wheel of fortune
c. The probability that a city bus will be in an accident on a specific run is about 6%.d. The probability of getting a royal flush when five cards are selected at random is 1/649,740e. The probability that a student will get a C or better in a statistics course is about 70%.

4–2 The Addition Rules for ProbabilityMany problems involve finding the probability of two or more events. For example, at alarge political gathering, you might wish to know, for a person selected at random, theprobability that the person is a female or is a Republican. In this case, there are three pos-sibilities to consider:
1. The person is a female.
2. The person is a Republican.
3. The person is both a female and a Republican.
Consider another example. At the same gathering there are Republicans, Democrats,and Independents. If a person is selected at random, what is the probability that the per-son is a Democrat or an Independent? In this case, there are only two possibilities:
1. The person is a Democrat.
2. The person is an Independent.
The difference between the two examples is that in the first case, the person selectedcan be a female and a Republican at the same time. In the second case, the personselected cannot be both a Democrat and an Independent at the same time. In the secondcase, the two events are said to be mutually exclusive; in the first case, they are not mutu-ally exclusive.
Two events are mutually exclusive events if they cannot occur at the same time(i.e., they have no outcomes in common).
In another situation, the events of getting a 4 and getting a 6 when a single card isdrawn from a deck are mutually exclusive events, since a single card cannot be both a 4and a 6. On the other hand, the events of getting a 4 and getting a heart on a single draware not mutually exclusive, since you can select the 4 of hearts when drawing a singlecard from an ordinary deck.
Objective
Find the probabilityof compound events,using the additionrules.
Example 4–161. Determine whether these events are mutually exclusive.
a. Roll a die: Get an even number, and get a number less than 3.b. Roll a die: Get a prime number (2, 3, 5), and get an odd number.c. Roll a die: Get a number greater than 3, and get a number less than 3.d. Select a student in your class: The student has blond hair, and the student has blue eyes.e. Select a student in your college: The student is a sophomore, and the student is a business major.f. Select any course: It is a calculus course, and it is an English course.g. Select a registered voter: The voter is a Republican, and the voter is a Democrat.
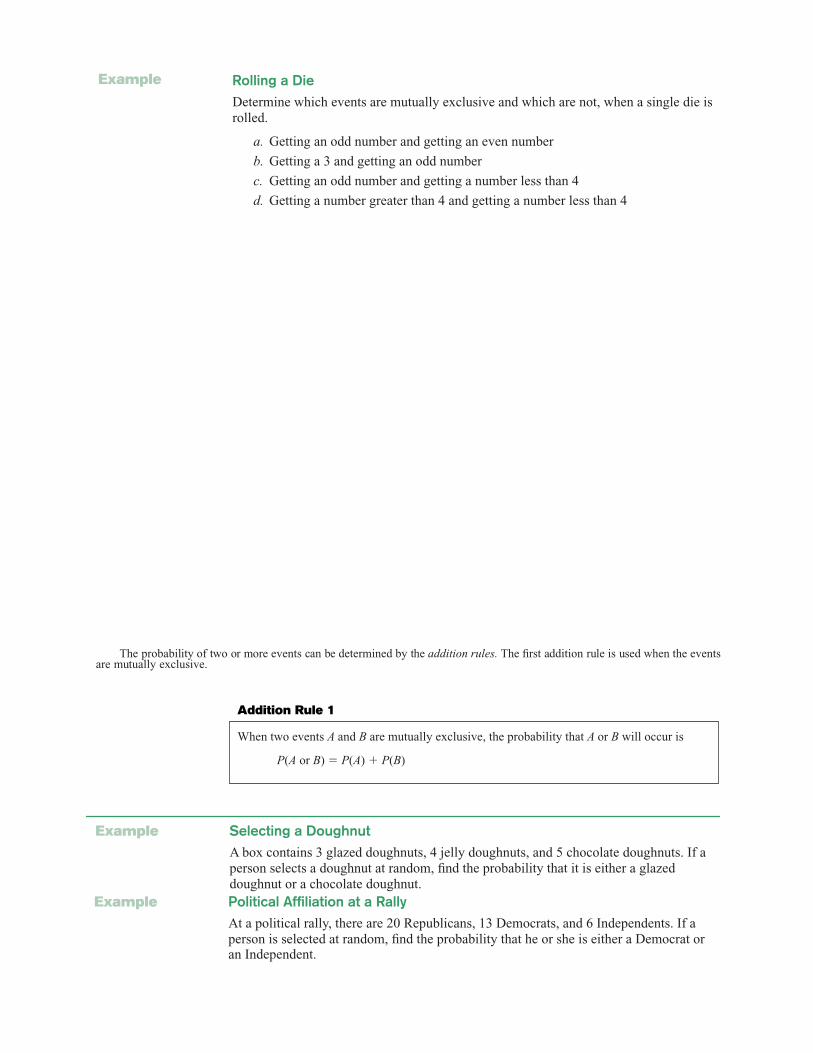
The probability of two or more events can be determined by the addition rules. The first addition rule is used when the events are mutually exclusive.
Addition Rule 1
When two events A and B are mutually exclusive, the probability that A or B will occur is
P(A or B) � P(A) � P(B)
Example 4–17 Selecting a DoughnutA box contains 3 glazed doughnuts, 4 jelly doughnuts, and 5 chocolate doughnuts. If aperson selects a doughnut at random, find the probability that it is either a glazeddoughnut or a chocolate doughnut.
Example 4–15 Rolling a DieDetermine which events are mutually exclusive and which are not, when a single die isrolled.
a. Getting an odd number and getting an even number
b. Getting a 3 and getting an odd number
c. Getting an odd number and getting a number less than 4
d. Getting a number greater than 4 and getting a number less than 4
Example 4–18 Political Affiliation at a RallyAt a political rally, there are 20 Republicans, 13 Democrats, and 6 Independents. If a person is selected at random, find the probability that he or she is either a Democrat or an Independent.

Example 4–19 Selecting a Day of the WeekA day of the week is selected at random. Find the probability that it is a weekend day.
When two events are not mutually exclusive, we must subtract one of the two prob-abilities of the outcomes that are common to both events, since they have been counted twice. This technique is illustrated in the next example.
Example 4–20 Drawing a CardA single card is drawn at random from an ordinary deck of cards. Find the probabilitythat it is either an ace or a black card.
Solution
Since there are 4 aces and 26 black cards (13 spades and 13 clubs), 2 of the aces areblack cards, namely, the ace of spades and the ace of clubs. Hence the probabilities ofthe two outcomes must be subtracted since they have been counted twice.
P(ace or black card) � P(ace) � P(black card) � P(black aces)
When events are not mutually exclusive, addition rule 2 can be used to find the probability of the events.
� 452 � 26
52 � 252 � 28
52 � 713
Addition Rule 2
If A and B are not mutually exclusive, then
P(A or B) � P(A) � P(B) � P(A and B)
Example 4–21 Selecting a Medical Staff PersonIn a hospital unit there are 8 nurses and 5 physicians; 7 nurses and 3 physicians are females. If a staff person is selected, find the probability that the subject is a nurse or a male.
Note: This rule can also be used when the events are mutually exclusive, since P(A and B) will always equal 0. However, it is important to make a distinction betweenthe two situations.

Example 4–22 Driving While IntoxicatedOn New Year’s Eve, the probability of a person driving while intoxicated is 0.32, the probability of a person having a driving accident is 0.09, and the probability of a person having a driving accident while intoxicated is 0.06. What is the probability of a person driving while intoxicated or having a driving accident?
In summary, then, when the two events are mutually exclusive, use addition rule 1.When the events are not mutually exclusive, use addition rule 2.
The probability rules can be extended to three or more events. For three mutuallyexclusive events A, B, and C,
P(A or B or C ) � P(A) � P(B) � P(C )
For three events that are not mutually exclusive,
P(A or B or C ) � P(A) � P(B) � P(C ) � P(A and B) � P(A and C )
� P(B and C ) � P(A and B and C )
The figure below shows a Venn diagram that represents two mutually exclusive events A and B. In this case, P(A or B) � P(A) � P(B), since these events are mutually exclusive
P(S ) = 1
(a) Mutually exclusive events P(A or B ) = P(A ) + P(B )
(b) Nonmutually exclusive eventsP(A or B ) = P(A ) + P(B ) – P(A and B )
P(A ) P(B )
P (A and B )
P(S ) = 1
P(A ) P(B )
Figure 4–5
Venn Diagrams for theAddition Rules
and do not overlap. In other words, the probability of occurrence of event A or event B is the sum of the areas of the two circles.
The figure above represents the probability of two events that are not mutually exclu-sive. In this case, P(A or B) � P(A) � P(B) � P(A and B). The area in the intersection or overlapping part of both circles corresponds to P(A and B); and when the area of cir-cle A is added to the area of circle B, the overlapping part is counted twice. It must there-fore be subtracted once to get the correct area or probability.
Note: Venn diagrams were developed by mathematician John Venn (1834–1923) and are used in set theory and symbolic logic. They have been adapted to probability theory also. In set theory, the symbol � represents the union of two sets, and A � B corresponds to A or B. The symbol � represents the intersection of two sets, and A � B corresponds to A and B. Venn diagrams show only a general picture of the probability rules and do not por-tray all situations, such as P(A) � 0, accurately.