probabilistic graphical modelsepxing/class/10708-15/slides/lecture1-introduction.pdf · logistics...
TRANSCRIPT

School of Computer Science
Probabilistic Graphical Models
Introduction to GM
Eric XingLecture 1, January 12, 2015
© Eric Xing @ CMU, 2005-2015
Receptor A
Kinase C
TF F
Gene G Gene H
Kinase EKinase D
Receptor BX1 X2
X3 X4 X5
X6
X7 X8
Receptor A
Kinase C
TF F
Gene G Gene H
Kinase EKinase D
Receptor BX1 X2
X3 X4 X5
X6
X7 X8
X1 X2
X3 X4 X5
X6
X7 X8
Reading: see class homepage1

Class webpage: http://www.cs.cmu.edu/~epxing/Class/10708/
Logistics
© Eric Xing @ CMU, 2005-2015 2

Logistics Text books:
Daphne Koller and Nir Friedman, Probabilistic Graphical Models M. I. Jordan, An Introduction to Probabilistic Graphical Models
Mailing Lists: To contact the instructors: [email protected] Class announcements list: [email protected].
TA: Mrinmaya Sachan, GHC 8013, Office hours: TBA Pengtao Xie, GHC 8228, Office hours: TBA Xun Zheng, GHC 8228, Office hours: TBA
Guest Lecturers: Many
Class Assistant: Mallory Deptola, GHC 8001, x8-5527
Instruction aids: TBA (Canvas or blackboard) © Eric Xing @ CMU, 2005-2015 3

Logistics 5 homework assignments: 40% of grade
Theory exercises, Implementation exercises
Scribe duties: 10% (~once to twice for the whole semester) Short reading summary: 10% (due at the beginning of every lecture) Final project: 40% of grade
Applying PGM to the development of a real, substantial ML system Design and Implement a (record-breaking) distributed Deep Network or topic model on Petuum and
apply to ImageNet, Wikipedia, and/or other data Build a web-scale topic or story line tracking system for news media, or a paper recommendation
system for conference review matching An online car or people or event detector for web-images and webcam An automatic “what’s up here?” or “photo album” service on iPhone
Theoretical and/or algorithmic work a more efficient approximate inference or optimization algorithm, e.g., based on stochastic
approximation a distributed sampling scheme with convergence guarantee
3-member team to be formed in the first three weeks, proposal, mid-way report, oral presetation & demo, final report, peer review possibly conference submission !
© Eric Xing @ CMU, 2005-2015 4

Past projects:
We will have a prize for the best project(s) …
Winner of the 2005 project:J. Yang, Y. Liu, E. P. Xing and A. Hauptmann,Harmonium-Based Models for Semantic Video Representation and Classification ,Proceedings of The Seventh SIAM International Conference on Data Mining (SDM 2007). (Recipient of the BEST PAPER Award)
Other projects:Andreas Krause, Jure Leskovec and Carlos Guestrin, Data Association for Topic Intensity Tracking, 23rd International Conference on Machine Learning (ICML 2006).
M. Sachan, A. Dubey, S. Srivastava, E. P. Xing and Eduard Hovy, Spatial Compactness meets Topical Consistency: Jointly modeling Links and Content for Community Detection ,Proceedings of The 7th ACM International Conference on Web Search and Data Mining (WSDM 2014).
© Eric Xing @ CMU, 2005-2015 5

What Are Graphical Models?
© Eric Xing @ CMU, 2005-2015
Graph Model
MG
Data
D ´ fX(i)1 ;X
(i)2 ; :::;X
(i)m gN
i=1
6
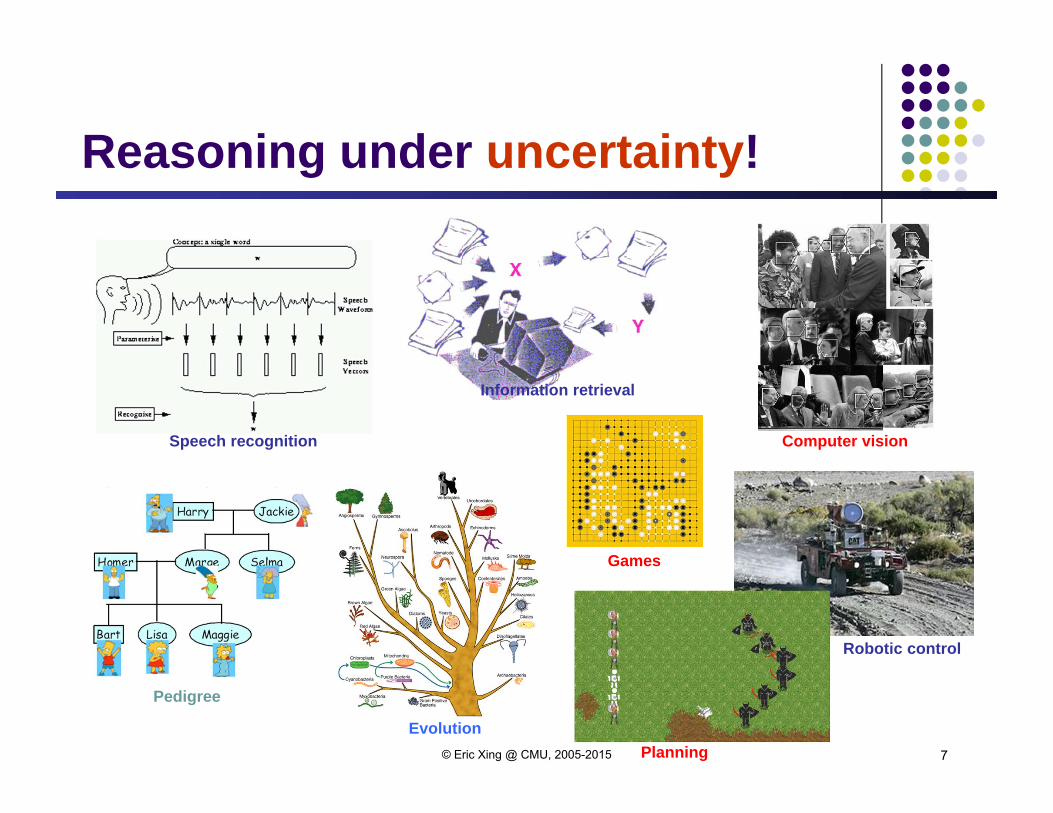
Reasoning under uncertainty!
© Eric Xing @ CMU, 2005-2015
Speech recognition
Information retrieval
Computer vision
Robotic control
Planning
Games
Evolution
Pedigree
7

The Fundamental Questions Representation
How to capture/model uncertainties in possible worlds? How to encode our domain knowledge/assumptions/constraints?
Inference How do I answers questions/queries
according to my model and/or based given data?
Learning What model is "right"
for my data?
© Eric Xing @ CMU, 2005-2015
??
?
?
X1 X2 X3 X4 X5
X6 X7
X8
X9
)|( :e.g. DiXP
);( maxarg :e.g. MMM
DFM
8
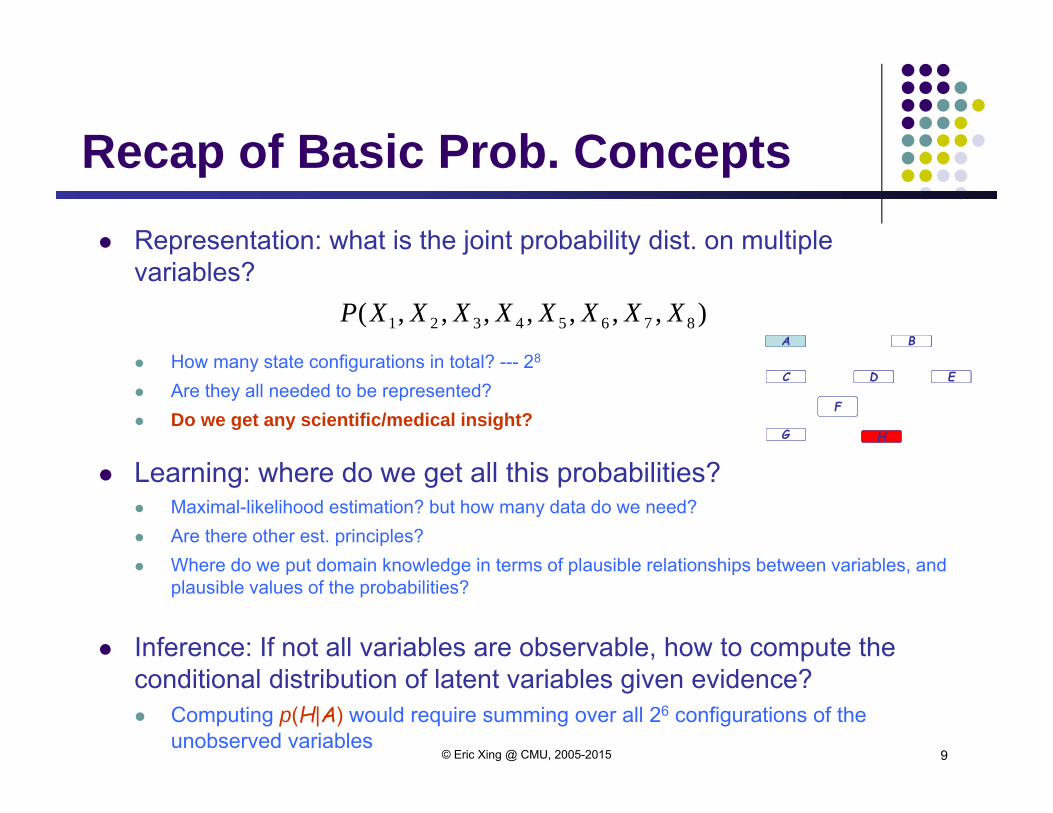
Representation: what is the joint probability dist. on multiple variables?
How many state configurations in total? --- 28
Are they all needed to be represented? Do we get any scientific/medical insight?
Learning: where do we get all this probabilities? Maximal-likelihood estimation? but how many data do we need? Are there other est. principles? Where do we put domain knowledge in terms of plausible relationships between variables, and
plausible values of the probabilities?
Inference: If not all variables are observable, how to compute the conditional distribution of latent variables given evidence? Computing p(H|A) would require summing over all 26 configurations of the
unobserved variables
),,,,,,,( 87654321 XXXXXXXXP
Recap of Basic Prob. Concepts
© Eric Xing @ CMU, 2005-2015
A
C
F
G H
ED
BA
C
F
G H
ED
BA
C
F
G H
ED
BA
C
F
G H
ED
B
9

Receptor A
Kinase C
TF F
Gene G Gene H
Kinase EKinase D
Receptor BX1 X2
X3 X4 X5
X6
X7 X8
What is a Graphical Model?--- Multivariate Distribution in High-D Space
A possible world for cellular signal transduction:
© Eric Xing @ CMU, 2005-2015 10

Receptor A
Kinase C
TF F
Gene G Gene H
Kinase EKinase D
Receptor B
Membrane
Cytosol
X1 X2
X3 X4 X5
X6
X7 X8
GM: Structure Simplifies Representation
Dependencies among variables
© Eric Xing @ CMU, 2005-2015 11

If Xi's are conditionally independent (as described by a PGM), the joint can be factored to a product of simpler terms, e.g.,
Why we may favor a PGM? Incorporation of domain knowledge and causal (logical) structures
P(X1, X2, X3, X4, X5, X6, X7, X8)
= P(X1) P(X2) P(X3| X1) P(X4| X2) P(X5| X2)P(X6| X3, X4) P(X7| X6) P(X8| X5, X6)
Probabilistic Graphical Models
© Eric Xing @ CMU, 2005-2015
Receptor A
Kinase C
TF F
Gene G Gene H
Kinase EKinase D
Receptor BX1 X2
X3 X4 X5
X6
X7 X8
Receptor A
Kinase C
TF F
Gene G Gene H
Kinase EKinase D
Receptor BX1 X2
X3 X4 X5
X6
X7 X8
X1 X2
X3 X4 X5
X6
X7 X8
1+1+2+2+2+4+2+4=18, a 16-fold reduction from 28 in representation cost !
Stay tune for what are these independencies!
12

Receptor A
Kinase C
TF F
Gene G Gene H
Kinase EKinase D
Receptor BX1 X2
X3 X4 X5
X6
X7 X8
Receptor A
Kinase C
TF F
Gene G Gene H
Kinase EKinase D
Receptor BX1 X2
X3 X4 X5
X6
X7 X8
GM: Data Integration
© Eric Xing @ CMU, 2005-2015 13

More Data Integration Text + Image + Network Holistic Social Media
Genome + Proteome + Transcritome + Phenome + … PanOmic Biology
© Eric Xing @ CMU, 2005-2015 14

If Xi's are conditionally independent (as described by a PGM), the joint can be factored to a product of simpler terms, e.g.,
Why we may favor a PGM? Incorporation of domain knowledge and causal (logical) structures
Modular combination of heterogeneous parts – data fusion
Probabilistic Graphical Models
© Eric Xing @ CMU, 2005-2015
2+2+4+4+4+8+4+8=36, an 8-fold reduction from 28 in representation cost !
Receptor A
Kinase C
TF F
Gene G Gene H
Kinase EKinase D
Receptor BXX11 XX22
XX33 XX44 XX55
XX66
XX77 XX88
Receptor A
Kinase C
TF F
Gene G Gene H
Kinase EKinase D
Receptor BXX11 XX22
XX33 XX44 XX55
XX66
XX77 XX88
XX11 XX22
XX33 XX44 XX55
XX66
XX77 XX88
P(X1, X2, X3, X4, X5, X6, X7, X8)
= P(X2) P(X4| X2) P(X5| X2) P(X1) P(X3| X1) P(X6| X3, X4) P(X7| X6) P(X8| X5, X6)
15
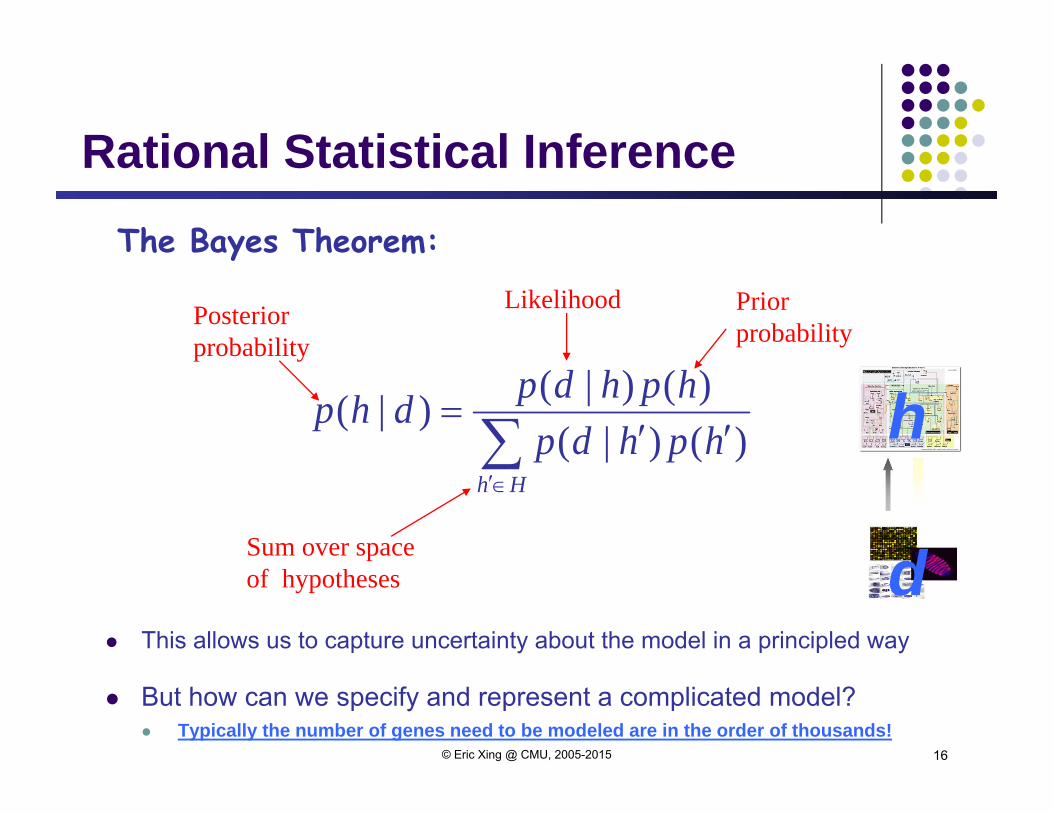
Hhhphdp
hphdpdhp)()|(
)()|()|(
Posteriorprobability
Likelihood Priorprobability
Sum over space of hypotheses
Rational Statistical Inference
This allows us to capture uncertainty about the model in a principled way
But how can we specify and represent a complicated model? Typically the number of genes need to be modeled are in the order of thousands!
© Eric Xing @ CMU, 2005-2015
h
d
The Bayes Theorem:
16

GM: MLE and Bayesian Learning Probabilistic statements of is conditioned on the values of the
observed variables Aobs and prior p( |)
© Eric Xing @ CMU, 2005-2015
(A,B,C,D,E,…)=(T,F,F,T,F,…)A= (A,B,C,D,E,…)=(T,F,T,T,F,…)
……..(A,B,C,D,E,…)=(F,T,T,T,F,…)
A
C
F
G H
ED
BA
C
F
G H
ED
B A
C
F
G H
ED
BA
C
F
G H
ED
BA
C
F
G H
ED
B
0.9 0.1
c
dc
0.2 0.8
0.01 0.99
0.9 0.1
dcdd
c
DC P(F | C,D)0.9 0.1
c
dc
0.2 0.8
0.01 0.99
0.9 0.1
dcdd
c
DC P(F | C,D)
p()
);()|();|( ΘΘΘ ppp AA
posterior likelihood prior
ΘΘΘΘ dpBayes ),|( A
17

If Xi's are conditionally independent (as described by a PGM), the joint can be factored to a product of simpler terms, e.g.,
Why we may favor a PGM? Incorporation of domain knowledge and causal (logical) structures
Modular combination of heterogeneous parts – data fusion
Bayesian Philosophy Knowledge meets data
Probabilistic Graphical Models
© Eric Xing @ CMU, 2005-2015
2+2+4+4+4+8+4+8=36, an 8-fold reduction from 28 in representation cost !
P(X1, X2, X3, X4, X5, X6, X7, X8)
= P(X1) P(X2) P(X3| X1) P(X4| X2) P(X5| X2)P(X6| X3, X4) P(X7| X6) P(X8| X5, X6)
Receptor A
Kinase C
TF F
Gene G Gene H
Kinase EKinase D
Receptor BX1 X2
X3 X4 X5
X6
X7 X8
Receptor A
Kinase C
TF F
Gene G Gene H
Kinase EKinase D
Receptor BX1 X2
X3 X4 X5
X6
X7 X8
X1 X2
X3 X4 X5
X6
X7 X8
18
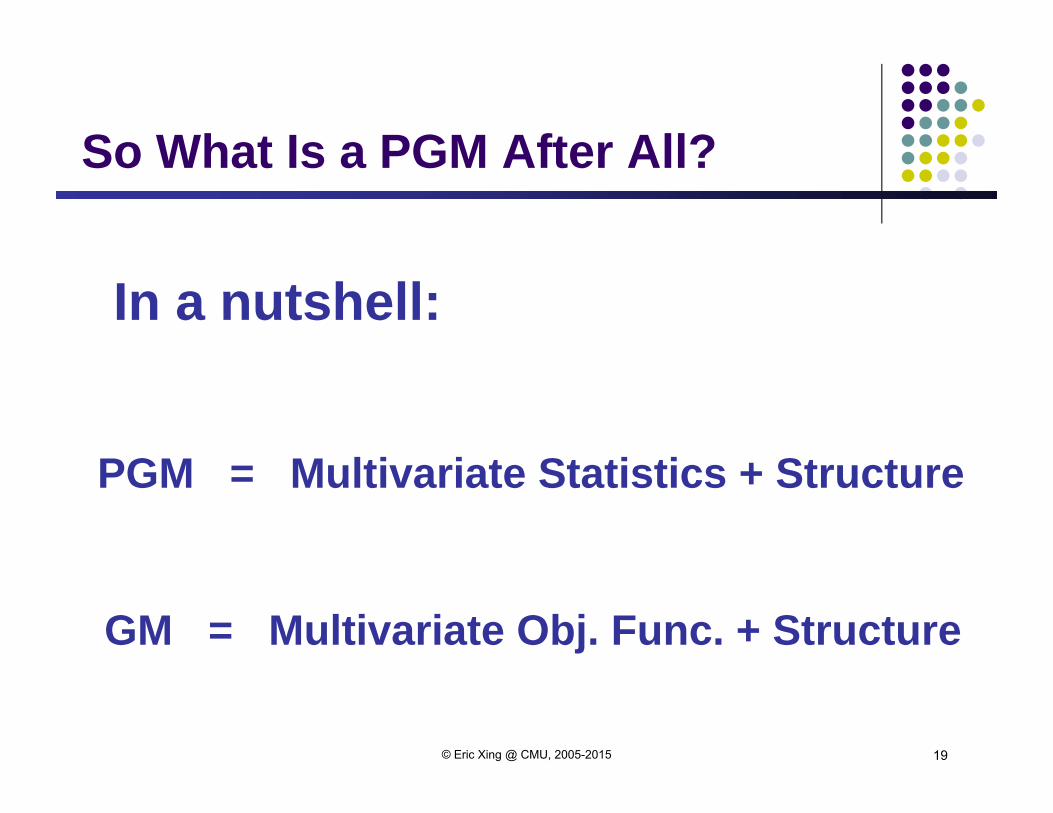
So What Is a PGM After All?
© Eric Xing @ CMU, 2005-2015
In a nutshell:
PGM = Multivariate Statistics + Structure
19
GM = Multivariate Obj. Func. + Structure
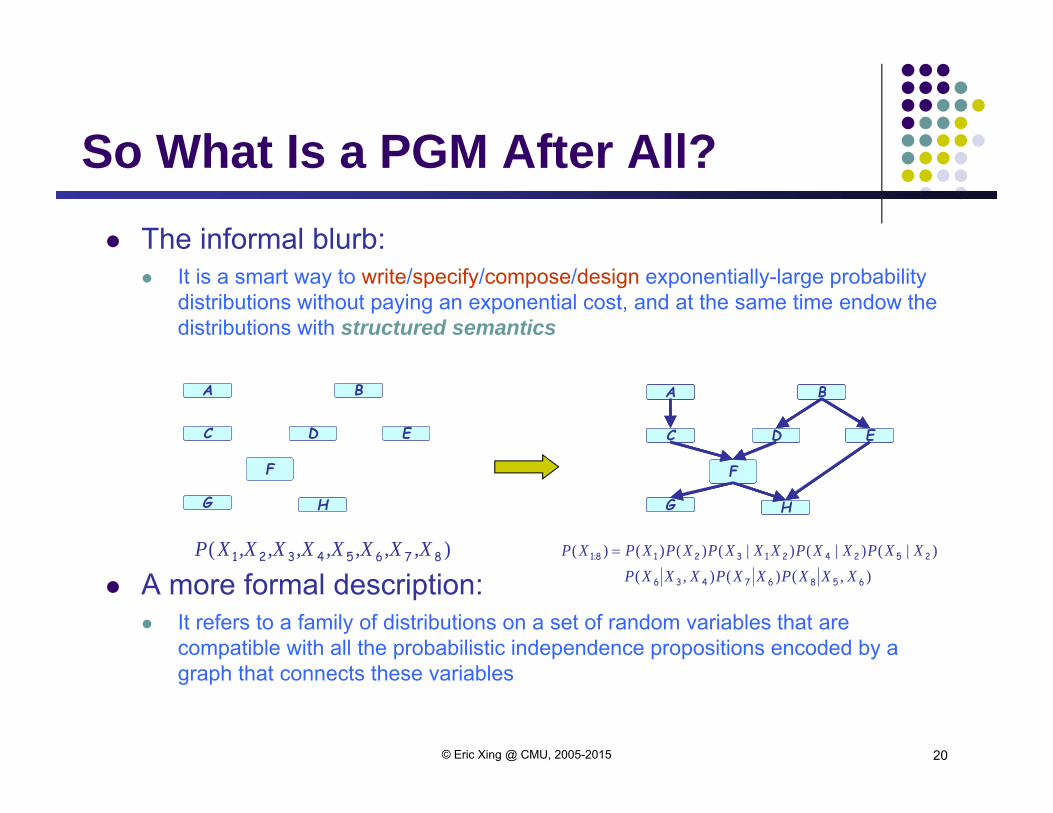
So What Is a PGM After All? The informal blurb:
It is a smart way to write/specify/compose/design exponentially-large probability distributions without paying an exponential cost, and at the same time endow the distributions with structured semantics
A more formal description: It refers to a family of distributions on a set of random variables that are
compatible with all the probabilistic independence propositions encoded by a graph that connects these variables
© Eric Xing @ CMU, 2005-2015
A
C
F
G H
ED
BA
C
F
G H
ED
B A
C
F
G H
ED
BA
C
F
G H
ED
BA
C
F
G H
ED
B
)( 87654321 ,X,X,X,X,X,X,XX P),()(),(
)|()|()|()()()( :
65867436
25242132181
XXXPXXPXXXPXXPXXPXXXPXPXPXP
20
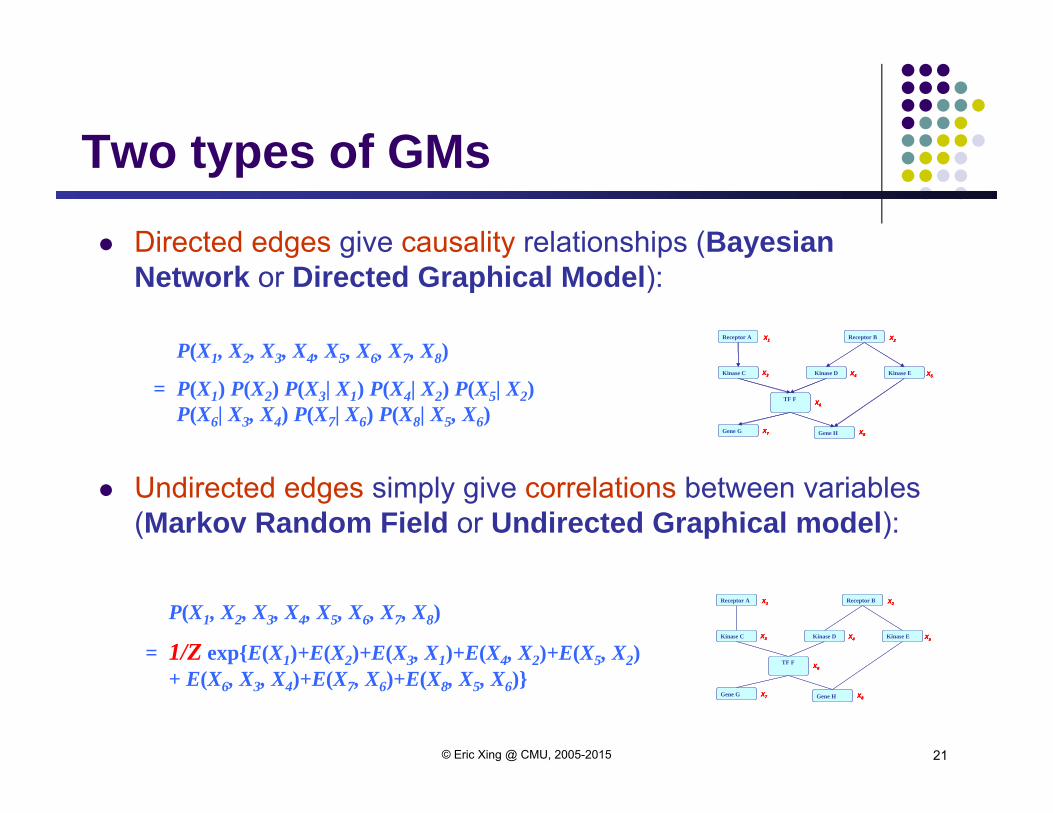
Directed edges give causality relationships (Bayesian Network or Directed Graphical Model):
Undirected edges simply give correlations between variables (Markov Random Field or Undirected Graphical model):
Two types of GMs
© Eric Xing @ CMU, 2005-2015
Receptor A
Kinase C
TF F
Gene G Gene H
Kinase EKinase D
Receptor BX1 X2
X3 X4 X5
X6
X7 X8
Receptor A
Kinase C
TF F
Gene G Gene H
Kinase EKinase D
Receptor BX1 X2
X3 X4 X5
X6
X7 X8
X1 X2
X3 X4 X5
X6
X7 X8
Receptor A
Kinase C
TF F
Gene G Gene H
Kinase EKinase D
Receptor BX1 X2
X3 X4 X5
X6
X7 X8
Receptor A
Kinase C
TF F
Gene G Gene H
Kinase EKinase D
Receptor BX1 X2
X3 X4 X5
X6
X7 X8
X1 X2
X3 X4 X5
X6
X7 X8
P(X1, X2, X3, X4, X5, X6, X7, X8)
= P(X1) P(X2) P(X3| X1) P(X4| X2) P(X5| X2)P(X6| X3, X4) P(X7| X6) P(X8| X5, X6)
P(X1, X2, X3, X4, X5, X6, X7, X8)
= 1/Z exp{E(X1)+E(X2)+E(X3, X1)+E(X4, X2)+E(X5, X2)+ E(X6, X3, X4)+E(X7, X6)+E(X8, X5, X6)}
21

Structure: DAG
• Meaning: a node is conditionally independentof every other node in the network outside its Markov blanket
• Local conditional distributions (CPD) and the DAGcompletely determine the joint dist.
• Give causality relationships, and facilitate a generativeprocess
X
Y1 Y2
Descendent
Ancestor
Parent
Children's co-parentChildren's co-parent
Child
Bayesian Networks
© Eric Xing @ CMU, 2005-2015 22
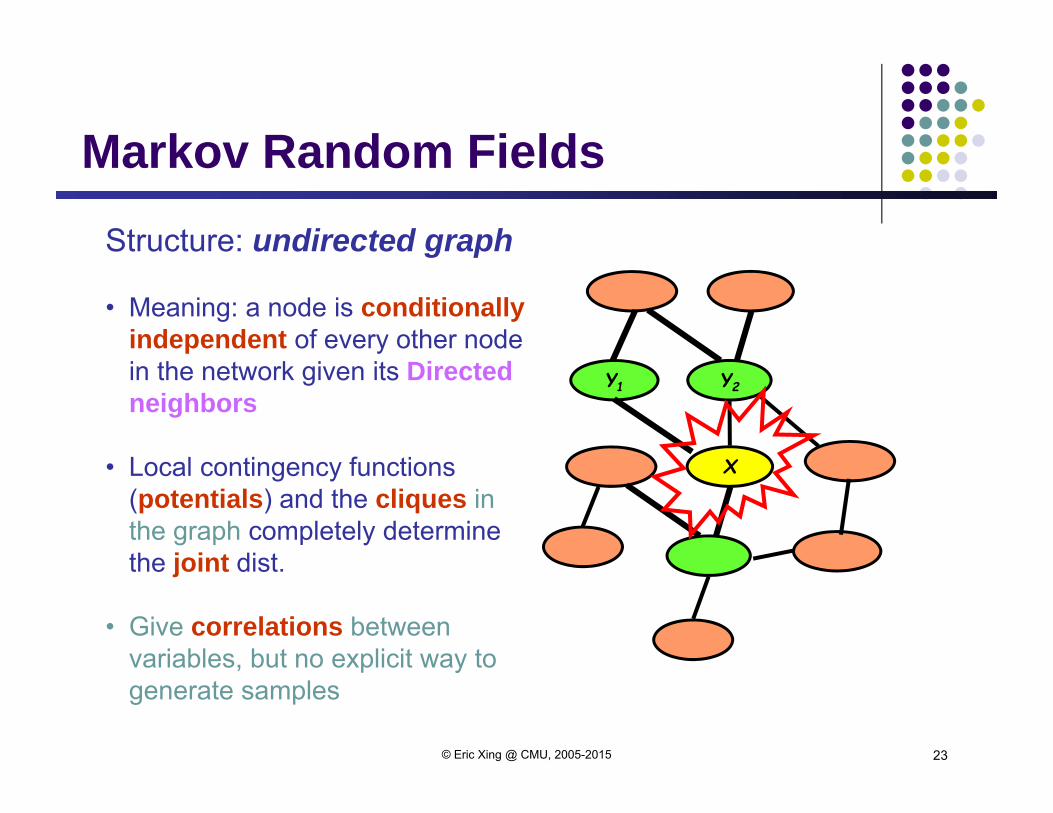
Structure: undirected graph
• Meaning: a node is conditionally independent of every other node in the network given its Directed neighbors
• Local contingency functions (potentials) and the cliques in the graph completely determine the joint dist.
• Give correlations between variables, but no explicit way to generate samples
X
Y1 Y2
Markov Random Fields
© Eric Xing @ CMU, 2005-2015 23

Towards structural specification of probability distribution
Separation properties in the graph imply independence properties about the associated variables
For the graph to be useful, any conditional independence properties we can derive from the graph should hold for the probability distribution that the graph represents
The Equivalence TheoremFor a graph G,Let D1 denote the family of all distributions that satisfy I(G),Let D2 denote the family of all distributions that factor according to G,Then D1≡D2.
© Eric Xing @ CMU, 2005-2015 24
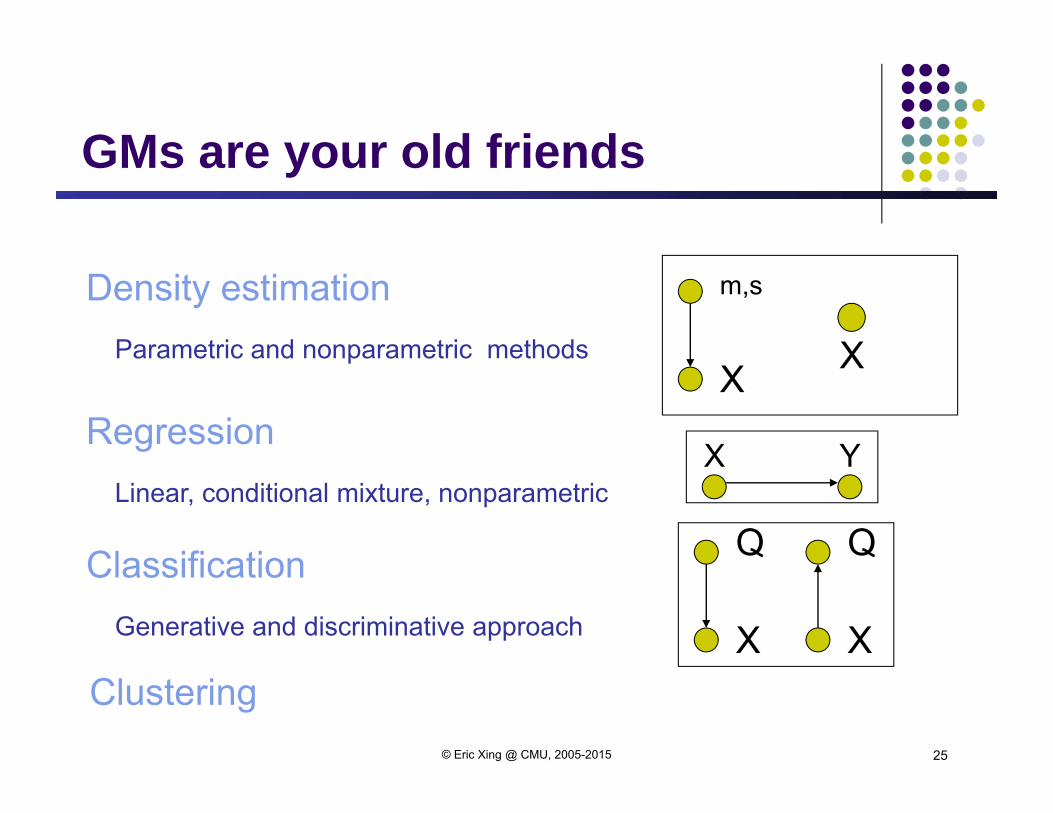
Density estimation
Regression
Classification
Parametric and nonparametric methods
Linear, conditional mixture, nonparametric
Generative and discriminative approach
Q
X
Q
X
X Y
m,s
X X
GMs are your old friends
© Eric Xing @ CMU, 2005-2015
Clustering 25

(Picture by Zoubin Ghahramani and Sam Roweis)
© Eric Xing @ CMU, 2005-2015
An (incomplete)
genealogy of graphical
models
26

Fancier GMs: reinforcement learning Partially observed Markov decision processes (POMDP)
© Eric Xing @ CMU, 2005-2015 27

Fancier GMs: machine translation
© Eric Xing @ CMU, 2005-2015
SMT
The HM-BiTAM model (B. Zhao and E.P Xing, ACL 2006)
28
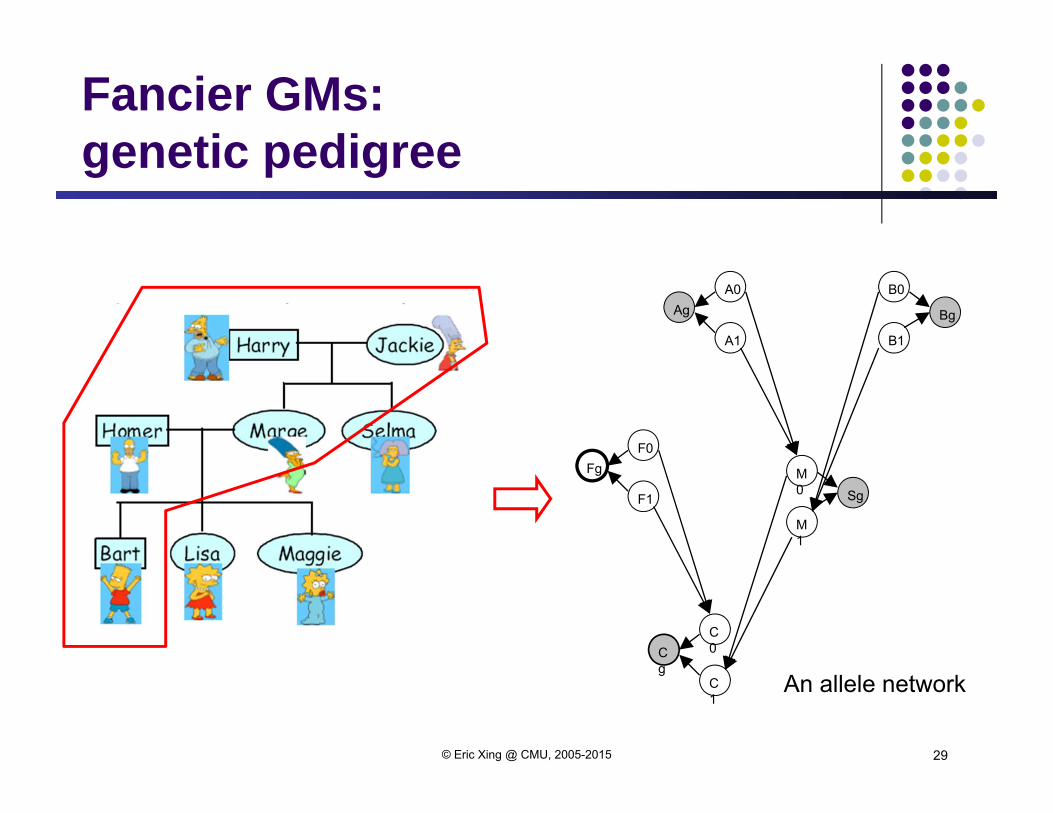
Fancier GMs: genetic pedigree
© Eric Xing @ CMU, 2005-2015
A0
A1
AgB0
B1
Bg
M0
M1
F0
F1
Fg
C0
C1
Cg
Sg
An allele network
29
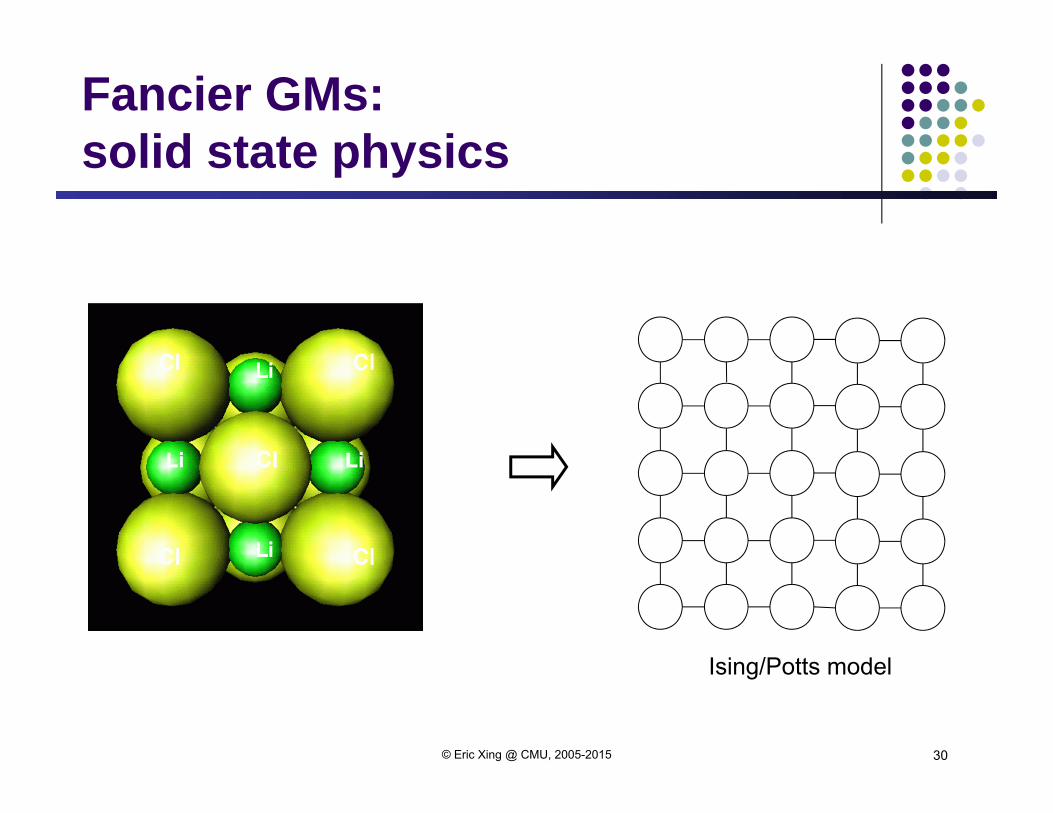
Fancier GMs: solid state physics
© Eric Xing @ CMU, 2005-2015
Ising/Potts model
30

Application of GMs Machine Learning Computational statistics
Computer vision and graphics Natural language processing Informational retrieval Robotic control Decision making under uncertainty Error-control codes Computational biology Genetics and medical diagnosis/prognosis Finance and economics Etc.
© Eric Xing @ CMU, 2005-2015 31

Why graphical models
A language for communication A language for computation A language for development
Origins: Wright 1920’s Independently developed by Spiegelhalter and Lauritzen in statistics and Pearl in
computer science in the late 1980’s
© Eric Xing @ CMU, 2005-2015 32
Probability theory provides the glue whereby the parts are combined, ensuring that the system as a whole is consistent, and providing ways to interface models to data.
The graph theoretic side of graphical models provides both an intuitively appealing interface by which humans can model highly-interacting sets of variables as well as a data structure that lends itself naturally to the design of efficient general-purpose algorithms.
Many of the classical multivariate probabilistic systems studied in fields such as statistics, systems engineering, information theory, pattern recognition and statistical mechanics are special cases of the general graphical model formalism
The graphical model framework provides a way to view all of these systems as instances of a common underlying formalism.
--- M. Jordan
Why graphical models
© Eric Xing @ CMU, 2005-2015 33
Plan for the Class Fundamentals of Graphical Models:
Bayesian Network and Markov Random Fields Discrete, Continuous and Hybrid models, exponential family, GLIM Basic representation, inference, and learning
…
Advanced topics and latest developments Approximate inference
Monte Carlo algorithms Vatiational methods and theories
“Infinite” GMs: nonparametric Bayesian models Optimization-theoretic formulations for GMs, e.g., Structured sparsity Nonparametric and spectral graphical models, where GM meets kernels and matrix algebra Alternative GM learning paradigms,
e.g., Margin-based learning of GMs (where GM meets SVM) e.g. Regularized Bayes: where GM meets SVM, and meets Bayesian, and meets NB …
Case studies: popular GMs and applications Multivariate Gaussian Models Conditional random fields Mixed-membership, aka, Topic models
© Eric Xing @ CMU, 2005-2015 34

Questions ?
© Eric Xing @ CMU, 2005-2015 35