prithivya - img1.wsimg.com
TRANSCRIPT

prithivya
copy K
eyur
Nar
ia
Editorial Board
Editor in Chief Dr Sagarika Damle Head Department of Life Sciences KC college HNSC University Mumbai
Associate Editor Dr Nishith Dharaiya Associate Professor Department of Life Sciences HNG University Patan
Dr Jagruti Rathod Director Center for Nature amp Ecosystem Wellbeing (CNEW) Vadodara
Editors Prof V C Soni Retd Professor Department of Biosciences Saurashtra University Rajkot
Dr BK Jain Rtd Principal MG Science Institute Ahmedabad
Prof Hitesh Solanki Professor Department of Botany Gujarat University Ahmedabad
Dr Nuria Selva Associate Professor Institute of Nature and Science Polish Academy of Science Krakow Poland
Mr Thomas Sharp Director of Conservation and Research Wildlife SOS USA
Dr Krzysztof Klimaszewski Assistant Professor Department of Zoology Warsaw University of Life Sciences Warsaw Poland
Dr Zornitza Aguilar Scientist SNAP Ecuador
Dr Darshan Marjadi Assistant Professor Department of Biotechnology Sarvajanik University Surat
Dr Rajesh Senma Assistant Professor Government Science College Vankal
Dr Archana Gajjar Assistant Professor Bahauddin Science College Junagadh
Dr Nisha Singh Scientist Bombay Natural History Society Mumbai
Dr Sumesh Dudhani Project Consultant Natural heritage INTACH Delhi
Editorial Assistant Ms Jahnvi Patel |Mr Pratik Desai | Ms Rinku Bhati WCB Research Foundation Patan
Language Editor Dr Ramaa Gaury Mandava WCB Research Foundation Patan
Contact details +918320519905 | Email prithivyawcbgmailcom
Prithivya A Quarterly Newsleer of WCB Research Foundaon and
Volume 1 | Issue 2 (August 2021)
Chief Editor Dr Sagarika Damle
Associate Editors Dr Nishith Dharaiya Dr Jagruti Rathod
Editorial Assistant MsRinku Bhati Jahnvi Patel Pratik Desai
Design amp Creation Mr Sachin and Dr Nishith Dharaiya
Cover page Indian Flying Fox (Pteropus giganteus) By Hiren Patel
copy Printed amp Published by WCB Research Foundation India wwwwcbresearchin
1-3 Range extinction of Asian pied starling (Gracupica contra)in Gujarat state Western India
Chaudhary and Desai
4-11 Observation on nesting pattern of different bird species around university road Rajkot
Dave D
12-17 Record of leucism in Indian flying fox (Pteropus giganteus) from South Gujarat India
Amin et al
18-21 Notes on behavioural observation of some water birds during the annual solar eclipse
Thakkar and Gohil
Field observations
22-23 Restoration of Earth with bio based polymer Marjadi D
24-27 Single-used surgical mask human life saver or biodiversity destroyer
Patel and Patel
28-36 Does the contemplation of forest field staff about wildlife differ than a common man
Pithva and Dharaiya
Short Articles
37-43 Qualitative phytochemical analysis of some medicinal plants (leaves) from the surrounding areas of Talod taluka North Gujarat India
Panchal and Jha
Research Papers
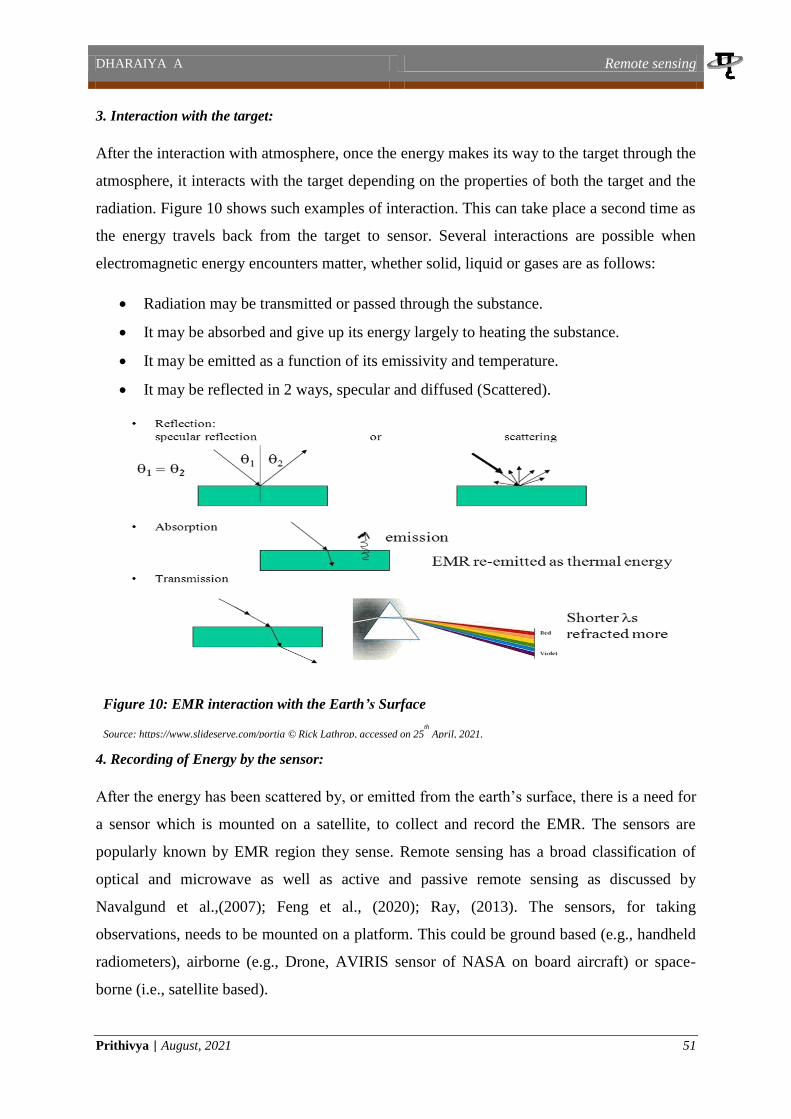
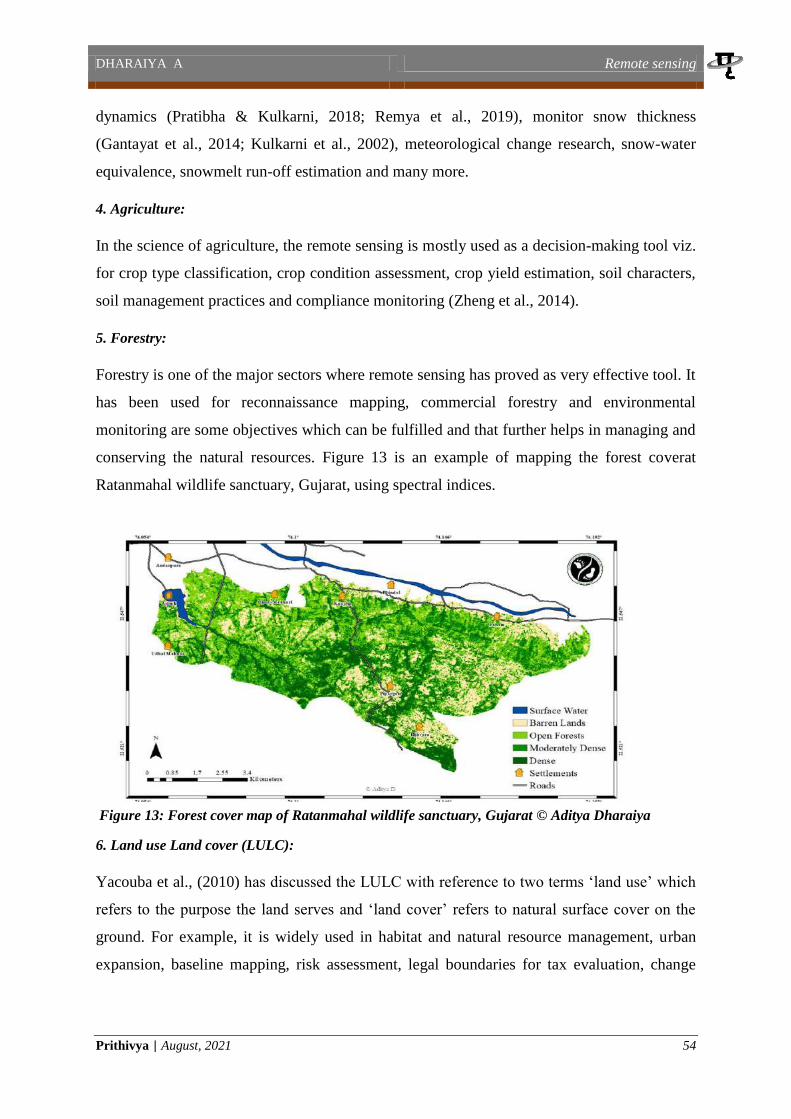
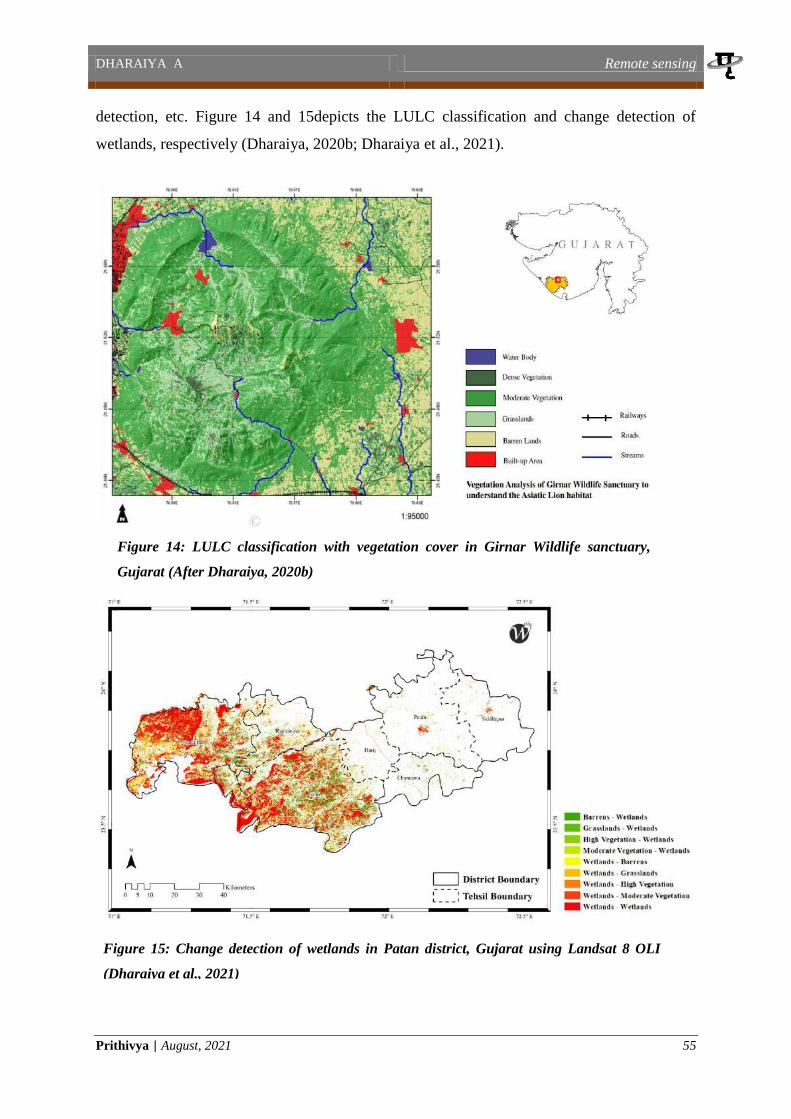
44-59 Remote sensing An overview with fundamentals and applications
Dharaiya A
Review Article
60-61 Final nominees of M I Patel Award 2021
62-63 Announcements
64-65 Winners of Mangrove day poster competition
Assorted news
The word Sustainable livelihood explains the essence of maintaining the values of theassets and enhancing the capabilities of the system for the current as well as futurescenario while conserving and respecting the natural resources The second issue of thenewsletter lsquoPrithivyarsquo attempts to draw the attention of the readers to various aspects ofsustainability through traditional conservation to high-tech environmental monitoringpractices It offers a wide range of articles ranging from Tribal artifacts and life style toEarth restoration contributed by young researchers From endemic species to sacredsites all natural habitats inherit conservation values Those biological ecological socialor cultural values of outstanding significance are known as lsquoHigh Conservation Valuesor HCVs and an observerrsquos role is pivotal in keeping the meticulous records that help inassigning these HVCrsquos The Stewardship of Biodiversity Conservation has been ablycarried forward by the young brigade of learners who belong to diverse disciplines butconverge towards their common goal of protecting the Mother earth The recentdisasters of untimely uncontrollable rains and floods landslides and raging forest firesat glocal levels point towards an undesirable climatic shift in earthrsquos environment andthe human species is racing against time to be disaster ready The lsquoCode Red forHumanityrsquo flashed in the latest USClimate Change report demands for doubling ourefforts in ecological restoration regimes It would happen only and only when the oldconservation practices and new technological insights work in tandem to bring aboutthe synergistic effect lsquoPrithivyarsquo is the right platform for the caregivers of environmentto showcase their ideas and outcomes We thank all the contributing authors of this 2ndissue and appeal to each reader of this newsletter to participate in some activity that willmake a positive difference in sustainable livelihood of the species around us Letrsquoscome together to build a greener tomorrowhellip
Editorial Noteपया983521वरणनाशन 984015वरमत 984015वरतो भवत मानवो मानवो भ983750ा कया983521त 983544क984017त र983477णम I
Dr Sagarika DamleChief EditorPrithivya sagarikadamlekccollegeeduin
Wildlife conservation has captivated great attention from all the sectors of the community Stakeholdersincluding scientists policymakers local and global organizations and citizens have been puttingrelentless efforts in conserving the wildlife and the wilderness on the earth This emphasizes on need foradopting foresighted approach and using scientific measures for producing desired results However allwe need is to adopt a scientific approach in such conservation activities so that it retains for longerperiod of time and give the desired results The key to wildlife conservation is target oriented awarenessand appreciation of the relationship between wildlife conservation policies and practices In order tobuild such relationship it is crucial that the correct scientific information about the wildlife reachesground level Wildlife researchers should be recognised as an important disseminator of science-basedinformation with education in schools and universities Along with that the media should bolster thesocial responsibility for communicating accurate and reliable conservation information At WCB Research Foundation we strive to bring different stakeholders and media on a single platformto spread the science-based information about wildlife and encourage the community to appreciatewildlife Our community based conservation approach has now become our mission of ldquoAdding scienceto the ConservationrdquoThe foundation will now complete one year And during this first year of establishment we initiatedseveral activities through which the scientific information can reach to every single or all sectors of thesociety We have started the sloth bear conservation education program in the central Gujarat wherepeople and sloth bear co-exists and the territorial forest patches connects two important protected areasWe have transformed the scientific information into the fun learning materials such as animation filmdocumentary videos stories comics and activity book We distribute these products among the schoolchildren and the local community and we expect that this will enhance the tolerance and appreciation oflocals towards the sloth bears In this difficult time of the pandemic we have organized severalwebinars online workshops and spread the message on wildlife conservation through social media Inorder to provide the platform to wildlife researchers and students we initiated WCBinars allowingstudents to present their research and the same we broadcast on our YouTube channel WCB is now connected with several national and international organizations through signing MoU andI am sure this will enhance our capacity and network to reach out more people and help wildlifeconservation We are always open to collaborate with organizations and institutions working in the areaof mutual interest and I welcome you all to join us work with us and collaborate with us to serve forMother Nature and conserving her wilderness
Directorrsquos Column
Nishith Dharaiya PhDDirector of ResearchWCB Research Foundaationnadharaiyagmailcom
CHAUDHARY amp DESAI Range Extension of Asian Pied Starling
Prithivya | August 2021 1
Range Extension of Asian Pied Starling (Gracupica contra) in Gujarat state Western
India
Chaudhary Sarthak Vsup1 and Desai Pratik Gsup2 1M N College Visnagar (Gujarat) India 2WCB Research Lab HNG University Patan (Gujarat) India
E-mail pratikdesai825gmailcom
India has more than 1300 bird species which is about 125 of worldrsquos total avifauna
(Grimmett et al 2011) Among them a total of 576 bird species have been reported from
Gujarat state (Ganpule 2016) Asian pied starling (Gracupica contra) commonly found in
foothills of south Asiauntil elevation of 700m It is also commonly found near water bodies
of human dominated areas grasslands and farmland (Ali amp Ripley 1983) Ali amp Ripley
(1983) recorded three subspecies of Pied starling in India whereas Grimmet et al (2005)
mentioned only two subspecies of Asian pied staling in India viz G superciliaris observed
around Manipur only while G contra is widely observed in North central and Eastern parts
of India (Grimmet et al 2005) Monga amp Naoroji (1983) mentioned sighting of pied starling
in Jamnagar and south Gujarat as rarevagrant Presence and breeding of G Contra was also
reported from Rajkot and Dahod districts of Gujarat consequently (Rasmussen amp Anderton
2005 Ganpule 2016) this species was introduced in Mumbai of Maharashtra state India
(Rasmussen amp Anderton 2005)
During field visit of Vadanagar
Mehsana district in northern part of
Gujarat (February 28 2021) we
have observed bird with white on the
black wings with white ventral mark
and orange bill at 0730 hrs After
validation through reference book
(Grewal 2016) we have identified it
as Asian pied starling (Gracupica
contra) We have found this
individual near the water body of
human habitation (N 237896 E
726291) The individual was
Asian pied starling (G contra) in Vadnagar town of
northern part of Gujarat (N 237896 E 726291)
CHAUDHARY amp DESAI Range Extension of Asian Pied Starling
Prithivya | August 2021 2
observed for 10 minutes and its behaviour was recorded Bird was feeding on some unknown
excreta material while foraging with other bird species viz Glossy ibis (Plegadis
falcinellus) Streak-throated swallow (Petrochelidon luvicola) Another individual of the
same species pair was observed on April 5 2021 1613 hrs at Kheralu town approximately
11 km far from previous observation (N 238831 E 726109) where the bird was sitting on
electric wire above the agriculture farm
Asian pied startling was recorded for the first time the semi-arid region of Gujarat as we did
not found any record of this species in this area This observation reflects the possible range
expansion of species Both of our sightings were around agriculture and human dominated
areas indicating the generalist niche and adaptability of this species in human dominated
landscape
Asian pied starling (G contra) perching on
electric wire above the agriculture farm (N
238831 E 726109)
Asian pied starling (G contra) feeding
on some unidentified excreta
CHAUDHARY amp DESAI Range Extension of Asian Pied Starling
Prithivya | August 2021 3
References
Ali S amp Ripley SD 1986 Handbook of the bird of India and Pakistan (Vol 5- Lark to
Grey Hypocolius) Oxford University Press
Grimmett R Inskipp C amp Inskipp T (2005) Birds of Indian Subcontinent Oxford
university press Pp 402-403
Grewal B 2016 A Pictorial Field Guide to Birds of India Pakistan Nepal Bhutan Sri
Lanka and Bangladesh India Om Books International
Monga S G amp Naoroji R K 1983 Birds of the Rajpipla forests ndash SouthGujarat With
notes on nests found and breeding recorded andsome new observations JBNHS 80
(3) 575-612
Rasmussen P C amp Anderton J C 2005 Birds of South Asia The Ripley guide
Washington DC amp Barcelona Smithsonian Institute amp Lynx Edition
Ganpule P 2016 The birds of Gujarat Status and distribution Flamingo 8(3) 2_40
Suggested citation
Chaudhary SV and Desai PG (2021) Range Extension of Asian Pied Starling (Gracupica contra)
in Gujarat state Western India Prithivya An Official Newsletter of WCB Research Foundation
and WCB Research Lab Vol 1(2) 1-3
DAVE D Nesting pattern of different bird species
Prithivya | August 2021 4
Observationson nesting pattern of different bird species around University road
Rajkot
Dave Deepali ldquoAnjaneyrdquo Sanjay vatika 8 Neel city club campus NearSaurashtra University Rajkot-
3640005(Gujarat) India
E-mail deepalidave955gmailcom
The dense vegetation near Saurashtra university circle provided a preferable avifaunal habitat
(Trivedi amp Vaghela 2020) This helped in the study of Avifaunal nesting sites in the urban
area of Rajkot (22deg17737N 70deg445388E 22deg171026N 70deg444403E 22deg17238N
70deg444514E 22deg165827N 70deg445231E) Gujarat A 2hours study was conducted while
exploring the area 2km away from my residence in the morning for a week in May 2021 Up
to 33 Avifaunal species and seven nesting sites were reported The nesting sites reported
during the survey were of Black Drongo (Dicrurusmacrocercus) Eurasian collared Dove
(Streptopeliadecaocto) Indian Thick knee (Burhinus indicus) Shikra (Accipiter badius)
Rufous Treepie (Dendrocittavagabunda) Red wattled Lapwing (Vanellus indicus) and Cattle
egret (Bubulcus ibis)
Figure 1 Detailed Map of Study area
DAVE D Nesting pattern of different bird species
Prithivya | August 2021 5
Point1 from the above figure indicates my residence where fieldwork was started Based on
vegetation and human disturbance the study area was divided into two parts Sub-urban Area
and Rural Area Point 7 and 8 indicates plantations done by the Saurashtra University The
line transect method was used for the field survey Images were captured with the help of
Canon 1200D 55-250 mm lens
Figure 2(a) Figure 2(b)
Figure 2(c) Figure 2(d)
Figure 2 Different photographs of saurashtra university plantation area (Study Area)
Black Drongo (Dicrurusmacrocercus)
The nesting season for Black Drongo is April to August with 3-4eggs as clutch size and 14-
15days incubation period The nest of Black drongo was observed at Point 8 (22deg17737N
70deg445388E) in the plantation site of Saurashtra University It is about 9 to 10 feet high
from ground level and built with twigs rootlets and threads Drongo is known to be a
protective parent and its mobbing behaviour towards Greater Coucal (Centropus sinensis)
Rose-ringed Parakeet (Alexandrinuskrameri) and Asian Koel (Eudynamysscolopaceus) were
DAVE D Nesting pattern of different bird species
Prithivya | August 2021 6
observed during the survey (Nijman 2004) Interspecies interaction between Eurasian
Collared-Dove and Black Drongo was observed during the survey and in previous studies
(Jahan et al 2018) as well where two Eurasian collared Dove made nest near the nest of
Black Drongo Usually birds like Dove do not cause any harm to Drongo Feeding gills for
both species is different as well (Ali 2017 Grimmettet al 2011) Therefore to protect their
eggs from other predators Dove makes their nest in the vicinity of Drongorsquos nest
Figure 3 (a) Figure 3 (b)
Eurasian collared Dove (Streptopeliadecaocto)
The nesting season for Eurasian collared Dove is throughout the year The nest was
observed at Point 8 in the plantation site
of Saurashtra University (22deg17737N
70deg445388E) It was made with twigs
and rootlets at 8-9feet height The clutch
size is 1-2 (Robertson 1990) and
incubation period of eggs is 15-19 days
Within a distance of 3 meters two nests
of Eurasian collared Dove were found
Both nests were in the vicinity of Black
Drongorsquos nest Itrsquos a great example of
species-species interaction By making
nests nearby aggressive Drongorsquos nests
Figure 4 A photograph presenting the nest
of Eurasian collared Dove
(Streptopeliadecaocto) Detailed Map of
Study area
Figure 3 Photographs presenting nest of Black Drongo (Dicrurusmacrocercus)
DAVE D Nesting pattern of different bird species
Prithivya | August 2021 7
Dove could gain protection from other predator species (Jahan et al 2018)
Indian Thick-knee (Burhinus indicus)
Indian Thick-knee is also known as Indian Stone curlew Its nest was found at Point 8 in the
plantation site of Saurashtra University (22deg17737N 70deg445388E) The breeding season
is from March to April The nest was made on the ground surrounded by dead leaves and few
twigs The clutch size for stone curlew is two (Sharma amp Sharma 2015) with incubation
period around 24 days While exploring the study area one egg and one hatchling were
observed which were wonderfully camouflaged with the colour of the ground The egg was
off-white coloured with random brown spots on it At the end of May 2021 another egg was
found broken Both male and female are involved in caring and protecting the hatchlings
against predators (Sharma amp Sharma 2015)
Figure 5 (a) Nest with hatchling and egg Figure 5 (b) Egg
Figure 5 (c) Hatchling Figure 5 (d) Adult Indian Thick-knee
Figure 5 Different photographs of Indian Thick-knee (Burhinus indicus) presenting
developmental stages
DAVE D Nesting pattern of different bird species
Prithivya | August 2021 8
Shikra (Accipiter badius)
The nesting season for Shikra is March to June Shikrarsquos nest was found at Point 8
(22deg171026N 70deg444403E) in the
plantation site of the Saurashtra
University The nest built with twigs
and rootlets at 20feet height from
ground level was observed on the
tallest tree The clutch size for the
Shikra is 3 to 4 eggs with 18-21days
incubation period Usually females
hatch the eggs but in rare cases males
hatch eggs as observed by
Suryawanshi (2021) During the
survey female Shikra was observed
chasing Large-grey Babbler (Argyamalcolmi)
Rufous Treepie (Dendrocittavagabunda)
The breeding season for Rufous Treepie is April to June and with clutch size 3-6eggs
At Point 8 of Saurashtra University plantation site (22deg17737N 70deg445388E) two to three
individuals of Rufous Treepie were seen
Figure 6 A photograph of Adult female Shikra
(Accipiter badius) and her nest
Figure 7 Adult Rufous treepie (Dendrocitta vagabunda) and her nest
DAVE D Nesting pattern of different bird species
Prithivya | August 2021 9
One of them was seen carrying food material while the other was collecting the nesting
materials A single nest of Rufous Treepie was observed and was built with twigs dead
leaves threads old clothing material rootlets and cotton The nest was found at a height of
approximately 20 feet On May 16th 2021 Rufous Treepie was seen feeding juvenile Koel
After a few days another Rufous Treepie was found hatching the eggs
Red-wattled Lapwing (Vanellus indicus)
Breeding season for Red-wattled Lapwing is April to June The egg or nest was not part of the
observation however a juvenile was observed at Point 3 of the Sub-urban area (22deg17238N
70deg444514E) A survey was conducted in May and the eggs might be laid during April The
clutch size is 3 to 4 with an incubation period of 28-30 days The nesting of this bird has no
protection strategies other than camouflaging the eggs with the surroundings to protect those
(Balkhande et al 2017)
Figure 8 (a) Juvenile Red-wattled Lapwing Figure 8 (b) Adult Red-wattled Lapwing
Figure 8 Photographic presentation of juvenile and adult Red-wattled Lapwing (Vanellus
indicus)
Cattle Egret (Bubulcus ibis)
The breeding season for Cattle Egret is June to August Between Point 5 and 6
(22deg165827N 70deg445231E) ten to twelve Cattle Egret nests were found and Egrets
were observed in their breeding plumage During their breeding season adults develop
orange buff plumage on the back breast and crown area Cattle Egrets from their nest in
DAVE D Nesting pattern of different bird species
Prithivya | August 2021 10
colonies Rootlets and twigs are used to build nests Clutch size for Cattle Egret is 2-4 and
the incubation period is between 22-28 days (Patankar et al 2007)
Fig 9 (a) Fig 9 (b)
Figure 9 Cattle egrets (Bubulcus ibis) and their colony
Acknowledgements
I would like to express my gratitude to DrJagruti Rathod for guiding and inspiring me
throughout my study I would also like to thank all the members of WCB Research
Foundation for organizing this internship program and giving me a chance to expand my
knowledge
References
Ali (2017) The Bookof Indian Birds Bombay Natural History Society ISBN 8173714851
Ali Hadjela amp Hassan Syed amp Rana Shahnaz amp Beg Mirza amp Mahmood-ul-Hassan
Muhammad (2007) Brood parasitism of Asian koel (Eudynamys scolopacea) on the
house crow (Corvus splendens) in Pothwar region of Pakistan Pakistan Journal of
Agricultural Sciences 44 627
Balkhande Dr Jayvardhan (2017) Study of Nesting pattern and breeding Biology of Red-
Wattled Lapwing Vanellus Indicus in agricultural field near to Asna River bridge
Nanded (Maharashtra) Research maGma An International Multidisciplinary Journal
ISSN NO- 2456-7078 VOL-1 ISSUE-6 AUG-2017
Grimmett et al (2011) Birds of Indian Subcontinent Helm field guides
ISBN 9781408127636
DAVE D Nesting pattern of different bird species
Prithivya | August 2021 11
Jahan I Begum S Feeroz M M Das D K amp Datta A K (2018) Nesting pattern of
birds in Jahangirnagar University Campus Bangladesh Journal of Threatened Taxa
10(5) 11618ndash11635 httpsdoiorg1011609jot279910511618-11635
Nijman V (2004) Seasonal variation in naturally occurring mobbing behaviour of drongos
(Dicruridae) towards two avian predators Ethology Ecology and Evolution 16(1)
25ndash32 httpsdoiorg1010800892701420049522651
Patankar Pratyush amp Desai Isha amp Shinde Kavita amp Balakrishnan Suresh (2007) Ecology
and breeding biology of the Cattle Egret Bubulcus ibis in an industrial area at
Vadodara Gujarat Zoos Print Journal 22 1011609JoTTZPJ15662885-8
Robertson H A (1990) Breeding of collared doves streptopelia decaocto in rural
oxfordshire england Bird Study 37(2) 73ndash83
httpsdoiorg10108000063659009477043
Sharma M amp Sharma R K (2015) Ecology and breeding biology of Indian stone curlew
(Burhinus indicus) Nature Environment and Pollution Technology 14(2) 423ndash426
Suryawanshi K 2021 Nesting behaviour and diet of Shikra Accipiter badius in Ajanta
Maharashtra Indian BIRDS 17 (2) XXndashXX
Trivedi V amp Vaghela S (2020) Avifauna of saurashtra university campus Rajkot Gujarat
India Journal of Threatened Taxa 12(13) 16764ndash16774
httpsdoiorg1011609jott5113121316764-16774
Suggested citation
Dave D (2021) Observations on nesting pattern of different bird species around university road
Rajkot Prithivya An Official Newsletter of WCB Research Foundation and WCB Research Lab
Vol 1(2) 4-11
AMIN ET AL Record of Leucism in Indian Flying Fox
Prithivya | August 2021 12
Record of Leucism in Indian Flying Fox Pteropus giganteus (Mammalia
Chiroptera Pteropodidae) from South Gujarat India
Amin Siddharth M1 Patel Hiren J2 and Vaghela Prashant P3
1 C129 Bhagyoday Society Opposite Sahyog Police chowki Gorwa Refinery Road
Vadodara - 390024(Gujarat) India 2Sardar Patel Zoological Park Kevadiya ndash 393151(Gujarat) India 3C-27 New Narmada Colony Chhani Jakatnaka Vadodara - 390024(Gujarat) India
E-mail hirenp9408gmailcom
Abstract
Leucism in fruit bat species Pteropus giganteus (Brunnich 1782) is recorded for the first
time from India based on photographic evidence collected from the Anaval Village located in
Surat District of South Gujarat India A total lack of pigmentation in the whole body due to
the failure of melanocytes to migrate to the skin and hair follicles resulting in white or
whitish hairs pale skin but normal coloured eyes are the sign of leucism The present record
can serve as baseline data and will also help understand colour aberration in bats
Key Words Colour aberration Chiropteran Pigmentation Mutation
Introduction
The Indian Flying Fox is one of the most common and widely distributed chiropterans found
in India Pakistan Sri Lanka Bhutan Nepal Bangladesh Maldives Myanmar and China
(Tsang 2020 Johnsingh amp Manjrekar 2013 Srinivasulu amp Srinivasulu 2012) Flying Fox is
the largest fruit bat known to occur on mainland India (Bates et al 1994) out of 13 Indian
fruit bat species (Bates amp Harrison 1997 Srinivasulu et al 2010) It has a reddish-brown
head with a darker sometimes
blackish snout pale brownish-
yellow shoulders and hindneck
yellowish-brown ventrally and
black wings (Prater 1971) It is
a colonial species and roosts
during the day often in the
midst of busy towns villages
on large trees along the
roadside near cropland and
water bodies (Bates et al 1994
Johnsingh amp Manjrekar 2013
Menon 2014) Their roosting
Figure 1 Leucistic individual roosting along with the
normal individuals
AMIN ET AL Record of Leucism in Indian Flying Fox
Prithivya | August 2021 13
colonies are generally found on large trees such as Ficus benghalensis F religiosa
Tamarindus indica Mangifera indica Dalbergia sissoo and Eucalyptus sp (Vendan 2003)
and the colony size can vary from hundreds to several thousands of individuals (Bastawade
amp Mahabal 1976) Although fruit bats are responsible for many ecological services (Saikia
2018) yet Indian Flying Fox is one of the most persecuted fruit bats in South Asia and is
listed as vermin under Schedule V of the Indian Wildlife (Protection) Act and IUCN Red List
Data included it as a Least Concern species (Tsang 2020)
In mammals a wide variety of colours and forms are found as a result of the presence of
certain pigments mostly melanin which provides colour to the skin hairs and eyes
(Nordlund et al 1998 Uieda 2000 Lucati amp Loacutepez Baucells 2016) Often this pigment is
affected as a result of mutations giving rise to diverse colour aberrations The effect of such
abnormal colouration is generally the pigmentation anomalies of chromatic disorders (Rook
et al 1998) Similar to other mammals bats are also vulnerable to genetic disorders that
affect pigmentation Globally such chromatic disorders are being reported at an increasing
rate in bats (Lucati amp Loacutepez Baucells 2016) and are caused by either an increase or a
decrease in the production of melanin in some regions or over the entire body (Hofreiter amp
Schoneberg 2010 Abreu et al 2013) These include albinism leucism piebaldism
hypomelanism and melanism (Lucati amp Loacutepez Baucells 2016) Among these conditions
leucism stands out as a rare phenomenon in nature
Leucism is a total lack of pigmentation in the whole body due to the failure of melanocytes to
migrate to the skin and hair follicles resulting in white or whitish hairs pale skin but
normal coloured eyes It occurs regardless of the normal production of the enzyme tyrosinase
and melanin Moreover it can be caused by one of the several mutations that will give rise to
apparently similar phenotypes (van Grouw 2006 2013 Abreu et al 2013 Lucati amp
Loacutepez‐ Baucells 2016) The occurrence of colour aberration in 55 Indian mammalian species
has been compiled by Mahabal et al (2019) Although cases of albinism and piebaldism have
been reported in the family Pteropodidae (Neal 1971 Karim 1983 Anonymous 2012
Anonymous 2013) however there is no report on colour aberration in Indian Flying Fox
(Pteropus giganteus) Here we report the first case of leucism in Indian Flying Fox from
Surat district of South Gujarat India
AMIN ET AL Record of Leucism in Indian Flying Fox
Prithivya | August 2021 14
Observations
On 18 June 2017 we were on the way to Vansda National Park and at 1230 h we stopped as
we saw a group of Indian Flying Fox roosting on Ficus religiosa near Anaval Village
(20838degN 73263degE) in Surat District Gujarat Suddenly all the fruit bats flew in the sky as
a local was hunting them with the help of a catapult maybe for eating purposes In the
middle of all these at 1249 h a white bat flying in the sky grabbed our attention as it flew
further to roost on one of the branches with other Indian Flying Fox We took some
photographs (Figure 1) and observed with the help of binoculars to note down its
characteristics Its whole body ie both fur and skin were white or whitish including
patagium and ears but it had normal black coloured eyes With the help of the classification
proposed by Lucati amp Loacutepez Baucells (2016) we identified it as a case of leucism and not
albinism
The roosting colony had around 250 individuals and was situated near a village pond among
human habitation on the roadside We observed the leucistic individual at least for an hour
and also alerted the locals to cease hunting of bats The leucistic individual was probably a
female and showed similar activity as that of normal individuals such as opening and closing
of wings folding the wings around belly and grooming
Discussion
Although physiological causes of colouration including melanism are evident (Caro 2005)
the genetic processes responsible for these colour variations remain unknown in most
mammals (Lucati amp Loacutepez Baucells 2016) Moreover chromatic disorders in bats can affect
both fur and skin including patagium ears and muzzle and their impact on the survival rate
is vague (Lucati amp Loacutepez Baucells 2016) However bats are most likely less vulnerable to
predation than the majority of diurnal animals as they are active at night and prefer dark
roosting sites (Buys et al 2002 Rocha et al 2013) Lucati amp Loacutepez Baucells (2016) states
that aberrant individuals roosting in sheltered places such as caves mines and buildings
may have greater survival rates than the one roosting in the open leaves Here we found the
leucistic Indian Flying Fox roosting in the open leaves and is likely to be vulnerable to
predation
Albinism is one of the most commonly occurring colour aberrations in bats (Lucati amp Loacutepez
Baucells 2016) In the family Pteropodidae albinism has been reported in Cynopterus sphinx
AMIN ET AL Record of Leucism in Indian Flying Fox
Prithivya | August 2021 15
from Nepal (Anonymous 2013) Lissonycteris angolensis from Uganda (Neal 1971) and
Rousettus leschenaultia from India (Karim 1983) while piebaldism is reported in Rousettus
amplexicaudatus from Philippines (Anonymous 2012) However another such colour
aberration leucism is not yet reported from the family Pteropodidae In this regard our report
of leucism in Pteropus giganteus can be the first of its kind in the entire range of its
distribution
Today bats in India face the harsh reality of declining habitats and resources ultimately
making them disappear altogether (Graham 2001 Tsang 2020) and the peoplersquos perception
regarding the presence of bats in their surroundings for different myths These facts raise an
urgent need to protect bats throughout the world by studying more about their behaviour and
ecology Further studies on Pteropus giganteus from Gujarat are mainly sighting reports
(Mahato et al 2012) and on roosting sites (Vyas amp Upadhyay 2014) Due to the lack of
information on colour aberration in the family Pteropodidae this report can add importance
to bat biologists
Acknowledgement
We are thankful to Dhaivat Patel and Vivek Patel for assisting us in fieldwork
References
Abreu M S L Machado R Barbieri F Freitas N S amp Oliveira L R 2013 Anomalous
colour in Neotropical mammals a review with new records for Didelphis sp
(Didelphidae Didelphimorphia) and Arctocephalus australis (Otariidae Carnivora)
Brazilian Journal of Biology 73 185ndash194
Anonymous 2012 Monfort Bat Sanctuary Blanca Bella Website
httpwwwmonfortbatsanctuaryorgblanca-bellac12m [Accessed 20 October
2019] Anonymous 2013 SMCRF (Small Mammals Conservation amp Research
Foundation) Website httpwwwsmcrforgindexphp [Accessed 20 October
2019]
Bastawade D B amp Mahabal A 1976 Some behavioural aspects of the Indian flying fox
Pteropus giganteus giganteus Bio-Vigyanam 2 209ndash212
Bates P J J amp Harrison D L 1997 Bats of the Indian Subcontinent Harrison Zoological
Museum Publication UK 258pp
Bates P J J Harrison D L amp Muni M 1994 The bats of western India Part 1 JBNHS
AMIN ET AL Record of Leucism in Indian Flying Fox
Prithivya | August 2021 16
91 (2) 1ndash15
Buys J Heijligers H amp Dorenbosch M 2002 First record of an albino long-eared bat
Plecotus auritus in The Netherlands Lutra 45 49ndash52
Caro T 2005 The adaptive significance of coloration in mammals BioScience55 125ndash136
Graham G L 2001 Bats of the World St Martinrsquos Press New York New York
160pp Hofreiter M amp Schoneberg T 2010
The genetic and evolutionary basis of colour variation in vertebrates Cellular and Molecular
Life Science 67 2591ndash2603
Johnsingh A J T amp Manjrekar N (eds) 2013 Mammals of South Asia Volume 2
Universities Press (India) Private Limited Telangana India pp 545ndash547
Karim K B 1983 A note on an albino Rousettus leschenaulti Bat Research News 24 39ndash
40
Lucati F amp Loacutepez Baucells A 2016 Chromatic disorders in bats a review of pigmentation
anomalies and the misuse of terms to describe them Mammal review 47(2) 112ndash123
Mahabal A Sharma R M Patil R N amp Jadhav S 2019 Colour aberration in Indian
mammals a review from 1886 to 2017 Journal of Threatened Taxa 11(6) 13690ndash
13719 Mahato A K R Kumar V V amp Patel N 2012 Indian flying fox in
Hamirsir Lake Bhuj city needs conservation attention Current Science 103(4)
354ndash355
Menon V 2014 Indian mammals a field guide Hachette India pp 386 Tsang SM
2020 Pteropus giganteus (errata version published in 2021) The IUCN Red List of
Threatened Species 2020 eT18725A194134899
httpsdxdoiorg102305IUCNUK2020-3RLTST18725A194134899en
Downloaded on 10 April 2021
Neal E 1971 Uganda Quest Collins London UK
Nordlund J J Boissy R E Hearing V J King R A Oetting W S amp Ortonne J P
(Eds) 1998 The pigmentary system physiology and pathophysiology Oxford
University Press New York
Prater S H 1971 The Book of Indian Animals (Revised) Bombay Natural History Society
Bombay pp 200ndash201
Rocha P A Feijo J A Donato C R amp Ferrari S F 2013 Leucism in Sebarsquos short-
tailed bat Carolliaperspicillata (Linnaeus 1758) from a rock shelter in northeastern
AMIN ET AL Record of Leucism in Indian Flying Fox
Prithivya | August 2021 17
Brazil Chiroptera Neotropical 19 1151ndash1153
Rook A Wilkinson D S Ebling F J B Champion R H amp Burton J L 1998
Textbook of Dermatology 6th edn Blackwell Science Boston Massachusetts USA
Saikia U 2018 A review of chiropterological studies and a distributional list of the
bat fauna of India Records of the Zoological Survey of India 118(3) 242ndash280
Srinivasulu C amp Srinivasulu B 2012 South Asian mammals their diversity distribution
and status Springer Science amp Business Media
Srinivasulu C Racey P A amp Mistry S 2010 A key to the bats (Mammalia Chiroptera)
of South Asia Journal of Threatened Taxa 2(7) 1001ndash1076
Uieda W 2000 A review of complete albinism in bats with five new cases from Brazil Acta
Chiropterologica 2 97ndash105
Van Grouw H 2006 Not every white bird is an albino sense and nonsense about colour
aberrations in birds Dutch Birding 28(2) 79ndash89
Van Grouw H 2013 What colour is that bird British birds 106 17ndash29
Vendan S E 2003 Roost and diet selection in the Indian Flying Fox Pteropus giganteus
(Mega chiroptera) MSc Thesis Madurai Kamaraj University India 85pp
Vyas R amp Upadhyay K 2014 Study of the Indian Flying Fox (Pteropus giganteus)
Colonies of Jambughoda Wildlife Sanctuary Gujarat India Record of the largest
roosting congregation at Targol Small Mammal Mail 6(1) 2ndash8
Suggested citation
Amin S Patel H and Vaghela P (2021) Record of Leucism in Indian Flying Fox Pteropus
giganteus (Mammalia Chiroptera Pteropodidae) from South Gujarat India Prithivya An
Official Newsletter of WCB Research Foundation and WCB Research Lab Vol 1(2) 12-17
THAKKAR amp GOHIL Birds behaviour during the Annular solar eclipse
Prithivya | August 2021 18
Notes on behavioural observation of some water birds during the Annular Solar
Eclipse
Thakkar Karan and Gohil Bharatsinh
Department of Life Sciences Maharaja Krishnakumarsinhji Bhavnagar University
Bhavnagar-364001 Gujarat India E-mail ksonpal07gmailcom
Abstract
In this communication we report the behaviour of various water birds observed during the annular
solar eclipse which happened on 26th November 2019 We observed the behaviour of eight species of
birdsrsquo viz Greater Flamingoes Phoenicopterus roseus the Indian Cormorant Phalacrocorax
fuscicollis Pied Avocet Recurvirostra avosetta Black-winged stilt Himantopus himantopus Eurasian
spoonbill Platalea leucorodia Northern shoveler Spatula clypeata Little grebe Tachybaptus
ruficollis and Dalmatian pelican Pelecanus crispus throughout the eclipse period ie from 805 AM
to 1051 AM Various behavioural chan`ges were observed in all the targeted species except the
Indian cormorant It rested on a pole for the whole eclipse period Detailed observations are given in
the note Reduction in light levels due to solar eclipse does affect the activity of birds
Key Words Solar Eclipse Behaviour Birds Bhavnagar
An annular solar eclipse was visible from 805 to 1051 AM on 26 December 2019 in India
Solar eclipse a rare and uncommon environmental event can influence and modulate the
behaviour of animals (Murdin 2001 Gil-burmann amp Beltrami 2003) Following observations
were made during the eclipse at airport Road Lake (21762837deg N 72183624deg E) in
Bhavnagar city using Nikon binoculars (1050)
Greater flamingos (n=24) on the day of the eclipse were seen foraging constantly from 805-
920 AM All of them started calling together from 921 to 935 AM After the peak of the
eclipse (ie after 921 AM) many flamingo individuals started preening Activities of Indian
cormorants varied throughout the eclipse period Pied avocets (n=13) were observed feeding
through the initial phase of the eclipse ie from 805 to 850 AM But pied avocets went onto
the resting phase from 851 to 935 AM Eight of them continued resting even after 935 AM
while the other five started feeding again Black-winged stilts (n=50) were seen resting in a
flock throughout the study period But as the eclipse increased flocks of black-winged stilts
from outside the lake started arriving and joined the original flock of 50 A group of five
black-winged stilts arrived at 852 followed by a flock of 20 at 906 AM Three other groups
of 30 50 and 10 black-winged stilts arrived from 921 to 935 AM Eurasian spoonbills
(n=30) were seen resting in water during the initial stage of eclipse ie from 808 to 920
AM From 921 to 935 AM five spoonbills started feeding 21 continued resting while 12
THAKKAR amp GOHIL Birds behaviour during the Annular solar eclipse
Prithivya | August 2021 19
started vocalizing and four flew away from the lake After 935 AM 12 individuals
continued calling 29 rested in water whereas eight individuals arrived from outside the lake
Activities of northern shoveler (n=80) varied throughout the eclipse Little cormorant (n=1)
rested on a pole for most of the observation It started feeding at 921 to 935 AM along with
one little cormorant which arrived from somewhere outside the lake After 935 both
perched at the wood in the lake Little grebe (n=1) spent most of the time feeding Between
935 and 950 AM it was joined by a flock of eight grebes that arrived from outside the lake
Pelicans (n=2) rested on a small patch of land in the lake throughout the study period
Table 1 Ethogram
Bird
Time intervals
0805-
0820
0821-
0835
0836-
0850
0851-
0905
0906-
0920
0921-
0935
0936-
0950
Greater
flamingo FD(n=24) FD(n=24) FD(n=24) FD(n=24) FD(n=24) C(n=24)
PR(n=4)
FD(n=17)C
(n=3)
Indian
Cormorant Rp(n=2) Rp(n=2)
Fi(n=2)
FD(n=4)
Rp(n=2)Fb
(n=2) Rp(n=1) Rp(n=1)Fb(n=1) _
Pied
Avocet FD(n=13) FD(n=13) FD(n=13) Rw(n=13) Rw(n=13) Rw(n=13)
FD(n=5)R
w(n=8)
Black
winged stilt Rw(n=50) Rw(n=50) Rw(n=50)
Rw(n=50)F
i(n=5)
Rw(n=55)
Fi(n=20)
Rw(n=75)
Fi(n=30)
Fi(n=50) Fi(n=10) Rw(n=165)
Eurasian
Spoonbill Rw(n=30) Rw(n=30)
Rw(n=30)
FD(n=4) Rw(n=34) Rw(n=34)
FD(n=5)C(n=12)
Fo(n=4)
Rw(n=21)
Fi(n=8)
C(n=13)
Rw(n=29)
Northern
Shoveler
PR(n=10)
Rl(n= 50)
Rw(n=20)
Rl(n= 50)
Rw(n=20)
PR(n=4)
Rw(n=50)
Rl(n=10)
Rw(n=54)
Rl(n=10)
FD(n=5)
Rw(n=54)
Rl(n=5)
Rw(n=54)
Rl(n=10)
Rw(n=54)
Rl(n=10)
Little
Cormorant Rp(n=1) Rp(n=1) Rp(n=1) Rp(n=1) Rp(n=1) FD(n=1) Fi(n=1) Rp(n=2)
Little grebe Rw(n=1) FD(n=1) FD(n=1) FD(n=1) FD(n=2) Fi(n=8)FD(n=10) FD(n=18)
Dalmatian
pelican Rl(n=2) Rl(n=2) Rl(n=2) Rl(n=2) Rl(n=2) Rl(n=2) Rl(n=2)
THAKKAR amp GOHIL Birds behaviour during the Annular solar eclipse
Prithivya | August 2021 20
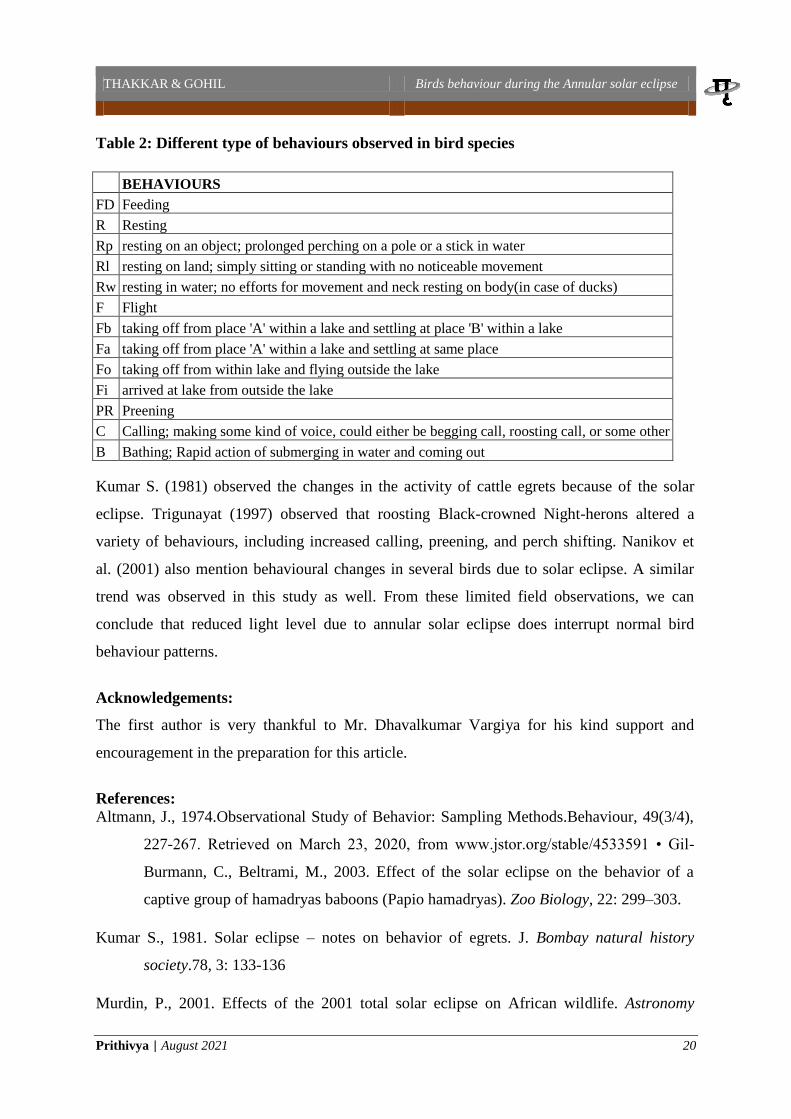
Table 2 Different type of behaviours observed in bird species
BEHAVIOURS
FD Feeding
R Resting
Rp resting on an object prolonged perching on a pole or a stick in water
Rl resting on land simply sitting or standing with no noticeable movement
Rw resting in water no efforts for movement and neck resting on body(in case of ducks)
F Flight
Fb taking off from place A within a lake and settling at place B within a lake
Fa taking off from place A within a lake and settling at same place
Fo taking off from within lake and flying outside the lake
Fi arrived at lake from outside the lake
PR Preening
C Calling making some kind of voice could either be begging call roosting call or some other
B Bathing Rapid action of submerging in water and coming out
Kumar S (1981) observed the changes in the activity of cattle egrets because of the solar
eclipse Trigunayat (1997) observed that roosting Black-crowned Night-herons altered a
variety of behaviours including increased calling preening and perch shifting Nanikov et
al (2001) also mention behavioural changes in several birds due to solar eclipse A similar
trend was observed in this study as well From these limited field observations we can
conclude that reduced light level due to annular solar eclipse does interrupt normal bird
behaviour patterns
Acknowledgements
The first author is very thankful to Mr Dhavalkumar Vargiya for his kind support and
encouragement in the preparation for this article
References
Altmann J 1974Observational Study of Behavior Sampling MethodsBehaviour 49(34)
227-267 Retrieved on March 23 2020 from wwwjstororgstable4533591 bull Gil-
Burmann C Beltrami M 2003 Effect of the solar eclipse on the behavior of a
captive group of hamadryas baboons (Papio hamadryas) Zoo Biology 22 299ndash303
Kumar S 1981 Solar eclipse ndash notes on behavior of egrets J Bombay natural history
society78 3 133-136
Murdin P 2001 Effects of the 2001 total solar eclipse on African wildlife Astronomy
THAKKAR amp GOHIL Birds behaviour during the Annular solar eclipse
Prithivya | August 2021 21
Geophysics 42 40ndash42
Nankinov D Dalakthieva S Nikolov B Shurulinkov P Popov K Kirilov S Zareva
K Borisov B Stojanov G Nankinov N Minchev N Kjichukov D Nikolov I
Stanchev R Ganchev E 2001Studying the behaviour of birds during the solar
eclipse on August 11 1999 mdash Russian Ornithological Journal 142 355-369
Trigunayat M M 1997 Some behavioral observations on Night Heron Nycticorax
nycticorax (Linnaeus) during the total solar eclipse in Keoladeo National Park
Bharatpur IndiaPavo 3561ndash65
Tramer E J 2000 Bird Behavior During a Total Solar Eclipse The Wilson Bulletin 112(3)
431ndash432
Suggested citation
Thakkar K and Gohil B (2021) Notes on behavioural observation of some water birds during the
Annular Solar Eclipse Prithivya An Official Newsletter of WCB Research Foundation and WCB
Research Lab Vol 1(2) 18-21
MARJADI D Restoration of Earth with Biobased Polymer
Prithivya | August 2021 22
Restoration of Earth with Biobased Polymer
Marjadi Darshan
Shree Ramkrishna Institute of Computer Education amp Applied Sciences MTB Campus
Athwalines Surat-395001
E-mail darshanmarjadisrkiacin
Humanity is facing increasingly numerous challenges in life despite the great advancements
in science and technology over the last century All the needs of modern society eg food
fuel energy and materials are highly dependent on diminishing fossil resources The
demand for creating and using plastic throughout the world driven by the increasing usage of
plastic-based materials has been increasing and adding stress to the current waste
management infrastructures There is significant interest to decrease the reliance on
petroleum-based plastic products which causes global environmental pollution The
advancement in science and technology has enabled mankind to live longer and consume
more of the worlds resources More than eight million tons of plastic waste leak into oceans
every year which can be eased through innovative redesigns of packaging materials
Issues such as global climate change and depletion of fossil fuels both resulting from the
increased usage of energy have triggered alarms among scientists and politicians worldwide
Therefore governments industries and academia are inputting much effort towards finding a
sustainable solution for the increasing energy crisis However a similar concerted effort is
still lacking to bring about the creation and usage of sustainable materials in the modern
lifestyle In addition to the increasing demand for energy the usage of materials in the
modern lifestyle has also been increasing rapidly Considering the widespread usage of
plastics in food packaging clothes shelter communication transportation construction
health care and leisure industries plastics are the most dependable material among the other
materials that mankind is currently dependent upon Currently most of the plastics that are
widely used in various sectors are produced from petrochemical products The plastic
industry has been among the most profitable businesses and is expected to grow further
especially because of their increased demands from rapidly developing countries like India
and other parts of South-East Asia While plastics are superior materials in terms of their
production costs and diverse properties the sustainability of this synthetic material is
undoubtedly an issue that needs to be addressed Biobased and biodegradable polymeric
materials are considered amongst the most suitable alternatives for some applications The
MARJADI D Restoration of Earth with Biobased Polymer
Prithivya | August 2021 23
excessive usage of petroleum also contributes to the increased emission of CO2into the
atmosphere which is thought to be among the principal reasons for global warming and
climate change These are some of the strong and valid reasons leading towards the
development of technologies to produce biobased and biodegradable plastics
Science and technology have created the modern lifestyle that mankind is living in which
efficiency is the keyword Drawing an analogy from a bacterial culture in a shaken flask the
depletion of nutrients and the simultaneous accumulation of toxic wastes are the main
reasons for the onset of the stationary growth phase and the subsequent death phase
However unlike bacteria mankind is aware of the consequences of such activities As a
result the world population is now concerned about sustainable development
Biobased and biodegradable plastics most likely to remain less superior in terms of
production cost and material properties compared to petrochemical plastics Petroleum-based
plastics have serious environmental and social impacts due to their non-degradable nature
and the leaching of carcinogenic substances like dioxin when exposed to scratch or heat
Compared to the ease at which fossil resources are utilized renewable biobased materials
will need more effort and efficiency to be used in daily life However biobased materials are
considered superior in terms of sustainability and environmental friendly provided that they
are used judiciously and in a contented manner Hence it is in our hands to utilize our
knowledge of the environment to work towards the restoration of the earth and make it free
from single-use plastics
Suggested citation
Marjadi D (2021) Restoration of Earth with Biobased Polymer Prithivya An Official
Newsletter of WCB Research Foundation and WCB Research Lab Vol 1(2) 22-23
PATEL amp PATEL Single-use surgical mask
Prithivya | August 2021 24
Single-use surgical mask Human lifesaver or Biodiversity destroyer
Patel Jeel1 and Patel Rushika2 3
1GMERS Sola Civil Medical College Ahmedabad-380008 (Gujarat) India 2Assistant Professor Rai University Dholaka Ahmedabad-380008 (Gujarat) India 3Fellow Wildlife and Conservation Biology Research Foundation Pata-384265 (Gujarat)
India
E-mail rush2907gmailcom
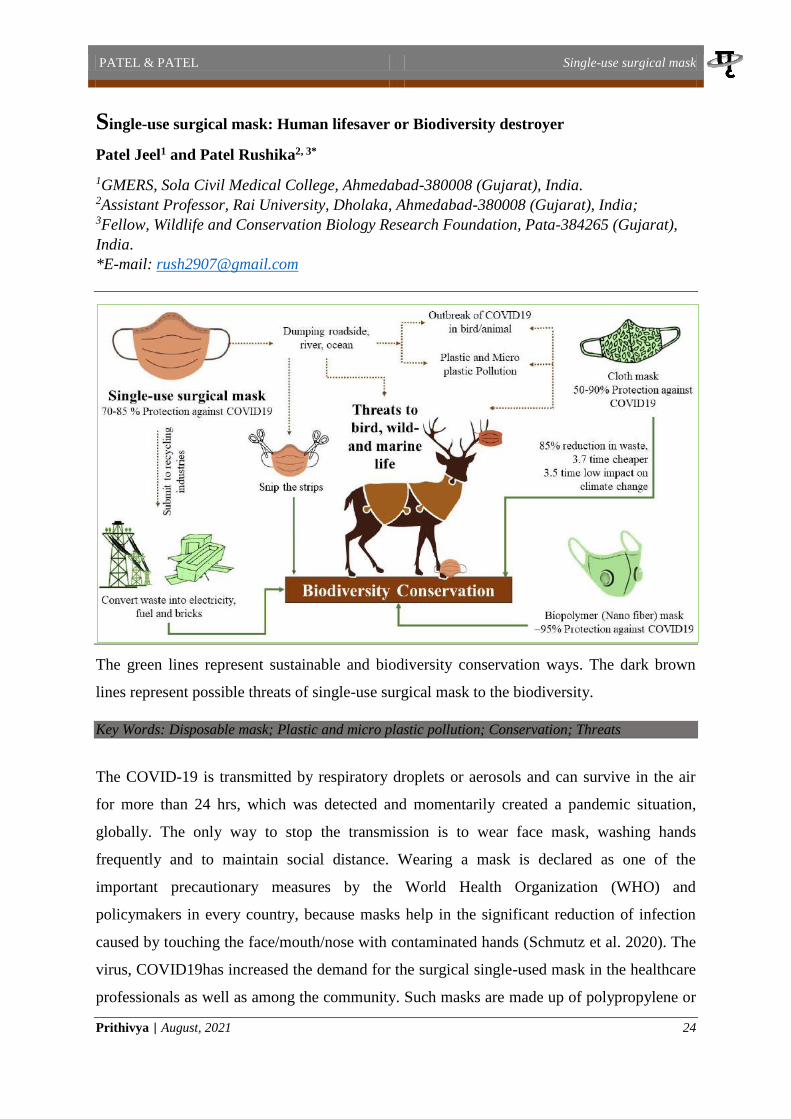
The green lines represent sustainable and biodiversity conservation ways The dark brown
lines represent possible threats of single-use surgical mask to the biodiversity
Key Words Disposable mask Plastic and micro plastic pollution Conservation Threats
The COVID-19 is transmitted by respiratory droplets or aerosols and can survive in the air
for more than 24 hrs which was detected and momentarily created a pandemic situation
globally The only way to stop the transmission is to wear face mask washing hands
frequently and to maintain social distance Wearing a mask is declared as one of the
important precautionary measures by the World Health Organization (WHO) and
policymakers in every country because masks help in the significant reduction of infection
caused by touching the facemouthnose with contaminated hands (Schmutz et al 2020) The
virus COVID19has increased the demand for the surgical single-used mask in the healthcare
professionals as well as among the community Such masks are made up of polypropylene or
PATEL amp PATEL Single-use surgical mask
Prithivya | August 2021 25
high-density polyethylene (HDPE) a fossil-derived plastic which has a very high half-life
(Dharmaraj et al 2021)The mask production to the disposal statistics is presented in Table 1
Based on the reusability the mask is divided into two major groupsrsquo disposable (made up of
polymers) and reusable mask (made up of cloth material) in terms of production In present
study the details of only disposable mask is presented
Calculated based on the global entries of masks and gloves mentioned (200 millionmonth)
The average of one mask and single glove weight is 225plusmn001
Mask a threat to the ecosystem
In current situation recycling of any household medical waste is not a feasible and advisable
solution as there is a chance that it may be exposed to infectious particles There are no
particular laws or guidelines for separation and segregation which might involve several
issues Globally the dumping of masks was observed in areas such as roadside river oceans
and several open areas Usually such masks sustain in the environment for a longer period of
time (more than 400 years)(Hasan et al 2021) The misconception of masks to various birds
animals and marine creatures considering as a food and leads to trapping and entangling in
the strips of masks The single-use surgical mask not only adds litter to the environment but
No Statistics Reference
1 Estimated worldwide usage of disposable mask 129
billionmonth
Prata et al 2020
2 Production in China as on Feb 2020 116 millionday Adyel 2020
3 Order of mask in Japan as of April 2020 over 600
millionmonth
Fadare and Okoffo
2020
4 Mask disposal in the UK 53 millionday Website URL 1
5 Gloves and mask entered into the environment 200
millionmonth
Website URL 2
6 Mask reached to oceans 15 billion
Marine plastic pollution increased in last year 6200 tonnes
Website URL 3
7 Mask waste generation in India Minimum 928week
Maximum 4640week
Selvaranjan et al 2021
8 Plastic footprint in the environment due to mask and gloves
45times105 KgMonth
Present Study
Table 1 Global mask production usage and disposable statistics
PATEL amp PATEL Single-use surgical mask
Prithivya | August 2021 26
also hurting and killing a wide range of terrestrial and marine living organisms Moreover
the production process of such masks also releases greenhouse gases (Prata et al 2021) The
disposal of mask also reported as a novel source of micro plastic pollution in the environment
and entry point of the food chain (Hasan et al 2021) The single-use surgical masks are also
noted as a major causative agent of secondary disease outbreaks in all life forms including
humans (Fadare and Okoffo 2020) India does not have any sufficient resources for the
household medical waste management (Prata et al 2021) Every minute 10 kg of disposed
masks and gloves entered into the environment (Table 1)Hence it is very important to deal
with the mentioned issues and look into more sustainable sources at individual level
Herewith we suggest some measures by which we can protect the environment without
compromising human health in current pandemic situation
Snip the strips of the masks before the disposal to avoid the entangling and entrapping
issues
Dispose masks as a separate medical waste and submit it to plastic recycling
companies
Moving towards the development of biopolymer mask (Torres and Torre 2021)
Biopolymer mask were made up of gluten and nanofibers having 95 efficiency
A reusable mask could be applied in routine life for the general community Regular
cloth masks having multi-layer of high thread-count and textiles are moderately
effective and reported to block 50-70 fine droplets and particles Reusable masks
help in the reduction of waste production (85 ) Moreover economically viable
option in a country like India as it is 37 times cheaper than other masks (Prata et al
2021)
References
Adyel T M 2020 Accumulation of plastic waste during COVID-19 Science 396(6509)
1314ndash1315 httpsdoiorg101056nejmms2004740
Dharmaraj S Ashokkumar V Hariharan S Manibharathi A Show P L Chong C T
ampNgamcharussrivichai C 2021 The COVID-19 pandemic face mask waste A
blooming threat to the marine environment Chemosphere Elsevier Ltd
httpsdoiorg101016jchemosphere2021129601
Fadare O O ampOkoffo E D 2020 Covid-19 face masks A potential source of
microplastic fibers in the environment Science of The Total Environment 737
140279 httpsdoiorg101016jscitotenv2020140279
PATEL amp PATEL Single-use surgical mask
Prithivya | August 2021 27
Hasan N A Heal R D Bashar A amp Haque M M 2021 Face masks protecting the
wearer but neglecting the aquatic environment - A perspective from Bangladesh
Environmental Challenges 4 100126 httpsdoiorg101016jenvc2021100126
Prata J C Silva A L P Duarte A C amp Rocha-Santos T 2021 Disposable over
Reusable Face Masks Public Safety or Environmental Disaster Environments 8(4)
31 httpsdoiorg103390environments8040031
Schmutz M Hischier R Batt T Wick P Nowack B Waumlger P ampSom C 2020
Cotton and surgical masksmdashwhat ecological factors are relevant for their
sustainability Sustainability (Switzerland) 12(24) 1ndash13
httpsdoiorg103390su122410245
Selvaranjan K Navaratnam S Rajeev P ampRavintherakumaran N 2021 Environmental
challenges induced by extensive use of face masks during COVID-19 A review and
potential solutions Environmental Challenges 3 100039
httpsdoiorg101016jenvc2021100039
Torres F G amp De-la-Torre G E 2021 Face mask waste generation and management
during the COVID-19 pandemic An overview and the Peruvian case Science of the
Total Environment 786 147628 httpsdoiorg101016jscitotenv2021147628
Website URL 1 httpswwwgreenpeaceorguknewssingle-use-face-masks-hurting-
wildlife-what-you-can-do [Accessed on 23rd June 2021]
Website URL 2 httpswwwgreenmatterscompface-masks-wildlife [Accessed on 23rd June
2021]
Website URL 3 httpseconomictimesindiatimescomnewsenvironmentecosystem-under-
threat-as-birds-and-marine-life-ensnared-in-discarded-face-maskswidespread-
contaminationslideshow80230026cms [Accessed on 23rd June 2021]
Suggested citation
Patel J and Patel R (2021) Single-use surgical mask Human lifesaver or Biodiversity destroyer
Prithivya An Official Newsletter of WCB Research Foundation and WCB Research Lab Vol 1 (2)
24-27
PITHVA amp DHARAIYA Perception of forest staff about wildlife
Prithivya | August 2021 28
Does the contemplation of forest field staff about wildlife differ than a common man
Pithva Krishna1 2 and Dharaiya Nishith1
1 Wildlife and Conservation Biology Research Lab Hemchandracharya North Gujarat
University Patan (Gujarat) India 2Institute of Environment Education and Research Bharati Vidyapeeth Deemed University
Pune India
E-mail krishnapithva17gmailcom
Introduction
A field-based training was organized by Vadodara wildlife division Gujarat forest
department and WCB Research Lab of Hemchandracharya North Gujarat University from
September 17th to 19th 2020 with the aim to enhance the capacity of forest field staff for
monitoring and rescue of sloth bear and associated fauna The training was organized at
Jambughoda wildlife sanctuary Central Gujarat Along with the awareness about sloth bear
a small survey was carried out to understand how the field staff envisages the wildlife that is
found in their work place Total 18 frontline forest staff of different cadre such as beat guards
and round foresters from different forest ranges of central Gujarat has participated in this
survey
This study provides an insight on how
forest staffrsquos perception differs in different
animals As Q method provides qualitative
and quantitative data which helps
identifying peoplersquos perception in detail As
participants have to provide justification of
their answers it reveals some underlying
conflicts or reasons These justifications of
participants can help identify the gaps and
can be better used for conservation planning
as well as capacity building of forest field
staff
Figure 1 Forest frontline staff organizing
photos on Q Board copy Nishith Dharaiya
PITHVA amp DHARAIYA Perception of forest staff about wildlife
Prithivya | August 2021 29
Methodology
We used Q methodology for this study this method is designed and developed by William
Stephenson in 1930s (McKeown amp Thomas 1988)and allows to disclose underlying reasons
This method is widely used in social sciences studies In this method photos were used
instead of statements to know respondentrsquos perception allowing them to justify their answer
in detail without any restriction This method allows both qualitative and quantitative data on
perception of the person being interviewed
We categorised the Q Method into two parts first organising 16 photos of locally found
animals on a Q-board (figure 1(b)) followed by explanation for each photo which are placed
on Q-board by the respondent As shown in the figure 1(a) the participants were asked to
organise photos in Q- board as per their liking and disliking towards the animals and to
provide reasons which were recorded in mobile phone devise A list of all the wildlife photos
used for this survey is provided in table 1
-3 -2 -1 0 +1 +2 +3
Negative Positive Neutral
Figure 1(a) Representative sort of organized Q-
board by a participant
Figure 1(b) A Q-board on which the
respondents organize the photos
PITHVA amp DHARAIYA Perception of forest staff about wildlife
Prithivya | August 2021 30
Photo
ID
Common name Scientific name
1 Wild boar Sus scrofa
2 Hanuman langur Semnopithecus entellus
3 Indian cobra Najanaja
4 Indian giant flying squirrel Petauristaphilippensis
5 Small Indian civet Viverricula indica
6 Sloth bear Melursus ursinus
7 Indian hare Lepus nigricollis
8 Indian python Python molursus
9 Barn owl Tyto alba
10 Grey francolin Francolinuspondicerianus
11 Red-wattled lapwing Vanellus indicus
12 Rhesus macaque Macaca mulatta
13 Black kite Milvus migrans
14 Common krait Bungarus caeruleus
15 Indian crested porcupine Hystrix indica
16 Blue bull Boselaphustragocamelus
Q sort analysis
In this study three factors were derived based on participantrsquosjustification which is explained
in detail in the result section A factor in this study is a category representingthe group of
people who have similar perspective(Brown 1980) The higher the factor loading the more
highly that sorts are correlated with that factor (Ramlo 2008 Ramlo amp Newman 2011)The
sorts refer to the photos assembled by participants on Q-board (figure 1(b))In order to
analyse the data a software PQMethod(httpschmolckorgqmethod)was used which is
specially designed for Q-analysis Q sorts are the number of participants that took part in the
survey All the data were entered manually in this software and correlation was calculated
among each sort The correlation matrix for the extracted factor was analysed through a
principal component factor analysis with varimax rotationfor which options are provided in
the software (figure 2)
Table 1 Photos of wildlife used for this study
PITHVA amp DHARAIYA Perception of forest staff about wildlife
Prithivya | August 2021 31
Results and Discussion
The three factors that emerged
are shown in Table 2 with
automatic pre-flagging
Participants having similar
perceptions are put together in
their respective factors and
marked in bold and have ldquoXrdquo
next to their score Out of 18
sorts 17 sorts were found
complete by the software and
were further analysed Each of
three factors represents a different perspective towards the photos provided to them
Participants were named as PART001 PART002 and so on to keep their identity unrevealed
In table 2 there are 8 participants belonging to factor 1 with 29 of the variance explained
followed by 7 participants in factor 2 having 26 explained variance and 2 participants
belonging to factor 3 with 14 explained varianceOnce factor score calculated by the
software distinguishing tables were developed in this analysis for each factor which differ
from each other that is explained further in this section The distinguishing tables for each
factor explains differences between factors(Brown 1971 Ramlo amp Newman 2011 Brown
1993)In order to determine distinguishing statements average Z-score of respondentrsquos factor
score was calculated by the software
Figure 2 Screenshot of analytical option available in PQM
method Software
PITHVA amp DHARAIYA Perception of forest staff about wildlife
Prithivya | August 2021 32
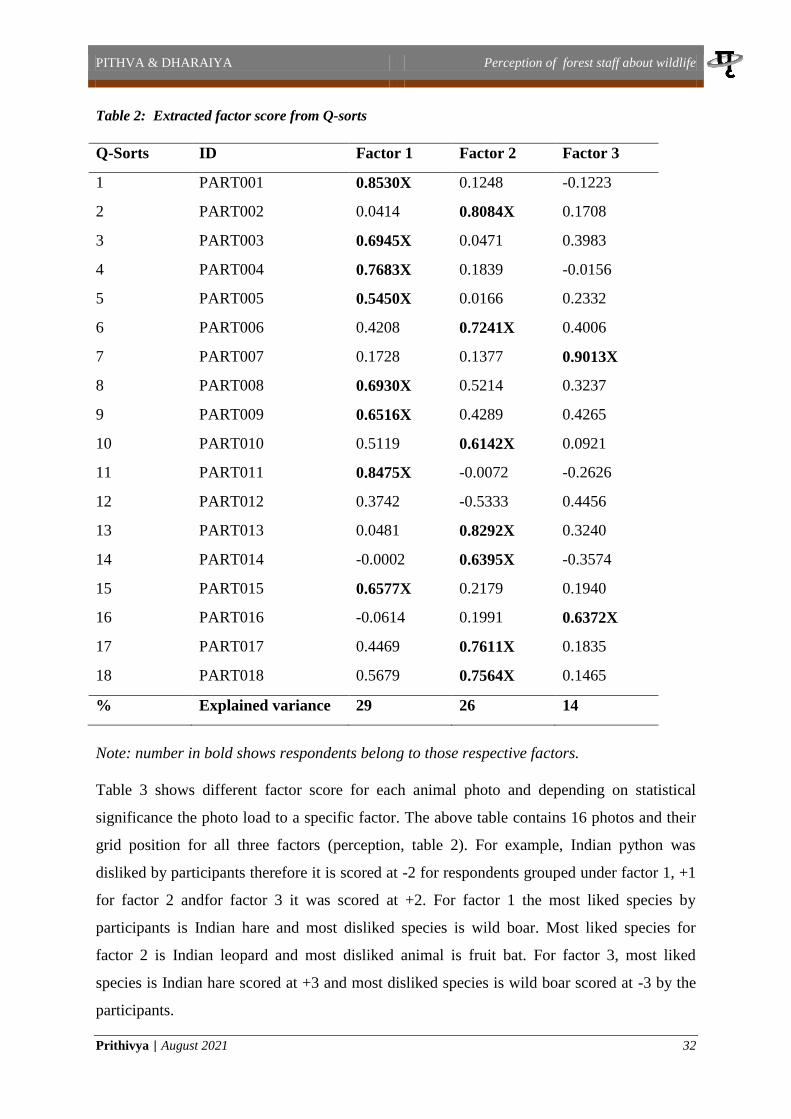
Table 2 Extracted factor score from Q-sorts
Q-Sorts ID Factor 1 Factor 2 Factor 3
1 PART001 08530X 01248 -01223
2 PART002 00414 08084X 01708
3 PART003 06945X 00471 03983
4 PART004 07683X 01839 -00156
5 PART005 05450X 00166 02332
6 PART006 04208 07241X 04006
7 PART007 01728 01377 09013X
8 PART008 06930X 05214 03237
9 PART009 06516X 04289 04265
10 PART010 05119 06142X 00921
11 PART011 08475X -00072 -02626
12 PART012 03742 -05333 04456
13 PART013 00481 08292X 03240
14 PART014 -00002 06395X -03574
15 PART015 06577X 02179 01940
16 PART016 -00614 01991 06372X
17 PART017 04469 07611X 01835
18 PART018 05679 07564X 01465
Explained variance 29 26 14
Note number in bold shows respondents belong to those respective factors
Table 3 shows different factor score for each animal photo and depending on statistical
significance the photo load to a specific factor The above table contains 16 photos and their
grid position for all three factors (perception table 2) For example Indian python was
disliked by participants therefore it is scored at -2 for respondents grouped under factor 1 +1
for factor 2 andfor factor 3 it was scored at +2 For factor 1 the most liked species by
participants is Indian hare and most disliked species is wild boar Most liked species for
factor 2 is Indian leopard and most disliked animal is fruit bat For factor 3 most liked
species is Indian hare scored at +3 and most disliked species is wild boar scored at -3 by the
participants
PITHVA amp DHARAIYA Perception of forest staff about wildlife
Prithivya | August 2021 33
Table 3 Aggregate factor values of each 16 photos
Aggregate values
No Photos Factor 1 Factor 2 Factor 3
1 Indian python -2 1 2
2 Hanuman langur 0 0 2
3 Monitor lizard -1 -2 -1
4 Red-wattled lapwing 1 -1 1
5 Sloth bear 2 2 0
6 Indian hare 3 1 3
7 Leopard 2 3 0
8 Grey francolin 1 -1 -1
9 Indian giant flying squirrel 1 1 -2
10 Blue bull 0 0 0
11 Small Indian civet 0 0 -1
12 Fruit bat (Flying fox) -1 -3 -2
13 Indian cobra -2 2 1
14 Barn owl 0 0 0
15 Indian chameleon -1 -1 0
16 Wild boar -3 -2 -3
Factor 1 Economic impact
This factor was described by 8 participants mainly concerning economic impact Animals
that cause harm economically by destroying crops and threat to human life and livestock
Participants of factor 1 thinks fruit bat Indian python and Indian cobra causes high level of
economic harm Grey francolin is scored +1 due to its contribution to reduce impact by eating
pest insects from agricultural field Though the most disliked animal is wild boar for factor 1
as shown in table 3
PITHVA amp DHARAIYA Perception of forest staff about wildlife
Prithivya | August 2021 34
Table 4 Distinguishing photos for factor 1
Factor 2 Aesthetic spiritual values and conservation aspects
This factor explains aesthetic spiritual values and conservation aspects which includes
appearance tourist attraction rehabilitation and religious belief There are 7 responses in this
factor (table 2) Respondents are observed to have negative opinions towards animals which
play major role in economic loss but positive towards animalrsquos beauty and its natural
charisma Table 5 shows how score of animals for factor 2 is different from the score of
factor 1 and factor 3 For example Indian cobra is scored at +2 in factor 2 as it is attractive to
participants but it is scored -2 for factor 1 as it threatens human life
Table5 Distinguishing photos for factor 2
Photo
ID Photos
Grid
position
for
Factor 1
Z-score
of
Factor 1
Grid
position
for
Factor 2
Z-score
of
Factor 2
Grid
position
for
Factor 3
Z-score
of
Factor 3
13 Indian cobra -2 -119 2 127 1 037
6 Indian hare 3 148 1 067 3 189
1 Indian python -2 -103 1 034 2 122
4 Red-wattled
lapwing 1 014 -1 -065 1 079
16 Wild boar -3 -189 -2 -125 -3 -201
Photo
ID Photos
Grid
position
for
Factor
1
Z-score
of
Factor
1
Grid
position
for
Factor
2
Z-score
of
Factor
2
Grid
position
for
Factor
3
Z-score
of
Factor 3
8 Grey francolin 1 095 -1 -046 -1 -067
12 Fruit bat (Flying -1 -02 -3 -182 -2 -11
1 Indian python -2 -103 1 034 2 122
13 Indian cobra -2 -119 2 127 1 037
PITHVA amp DHARAIYA Perception of forest staff about wildlife
Prithivya | August 2021 35
Factor 3 Lack of awareness
This factor describes lack of awareness which includes lack of interest compared to other
animals and species This factor mainly concerns individuals who lacks knowledge proper
information and are not aware about the species For example in table 6 the score of Indian
giant flying squirrel differs from factor 3 to factor 1 and 2 as it is scored at -2 +1 and +1
respectively The justification for negative score given by the participants is that they are not
aware about the presence of the species therefore they do not have any information on the
species
Table 6 Distinguishing photos for factor 3
Photo
ID Photos
Grid
position
for
Factor 1
Z-score
of
Factor
1
Grid
position
for
Factor 2
Z-score
of
Factor
2
Grid
position
for
Factor 3
Z-score
of
Factor 3
1 Indian python -2 -103 1 034 2 122
2 Hanuman langur 0 -02 0 -045 2 110
13 Indian cobra -2 -119 2 127 1 037
5 Sloth bear 2 138 2 135 0 -000
7 Leopard 2 133 3 181 0 -000
9 Indian giant flying
squirrel 1 096 1 062 -2 -122
Conclusion
The perception of forest field staff was better understood using Q method analysis
considering various aspects It is seen that participants tend to like animals such as Indian
leopard sloth bear Hanuman langur and Indian hare as they are scored positive or neutral
The animals that are not given negative score in any factor due to their appearance are seen
frequently and does not lack awareness It is observed from the data that frontline forest staff
lacks knowledge about animals that are not seen or present in their forest rangebeat As
frontline forest staff they should be aware about existence of animal species that are found in
Gujarat state along with their ecological importance threats and conservation values Some
participants were not even aware about the existence of the species in the wild such as Indian
giant flying squirrel Although being frontline forest staff their perception is biased towards
animals such as wild boar monitor lizard and flying fox bat due to the economic loss they
PITHVA amp DHARAIYA Perception of forest staff about wildlife
Prithivya | August 2021 36
may cause and weird appearance Their perception becomes the same as a common man
when every animal should be equal to frontline forest staff as it is their job to protect forest
and its animals Some participants believe in superstitions of bad luck of barn owl and
monitor lizard which shows their common man perception and lack of right information
Recommendations
A separate training or workshops should be organised by forest department focused on
animal species found in Gujarat This will help them enhancing their existing knowledge and
it will provide them with some scientific insights Having basic scientific knowledge will
help remove some barriers like superstitions and other beliefs Field trips should be organised
in different part of state to gain practical experience Team building activities should be
conducted between staff of different forest divisions
Acknowledgements
We are thankful to all the forest field staff who participated in this survey We also thank to
the Deputy Conservator of Forests Vadodara Wildlife Division of Gujarat Forest Department
and sincerely acknowledge the help from our research team members
References
Brown S R (1980) Political subjectivity applications of Q methodology inpolitical science
E Ramlo S and Newman I (2011) Q Methodology and Its Position in the Mixed-Methods
Continuum Operant Subjectivity 34(3) 172ndash191
McKeown B and Thomas D B (1988) Q Methodology SAGE Publications
R Brown S (1993) A Primer on Q Methodology Operant Subjectivity 16(34) 91ndash138
Ramlo S E (2008) Determining the various perspectives and consensus within a classroom
using Q methodology AIP Conference Proceedings 1064 179ndash182
httpsdoiorg10106313021248
Suggested citation
Pithva K and Dharaiya N (2021) Does the contemplation of forest field staff about wildlife differ
than a common man Prithivya An Official Newsletter of WCB Research Foundation and WCB
Research Lab Vol 1(2) 28-36
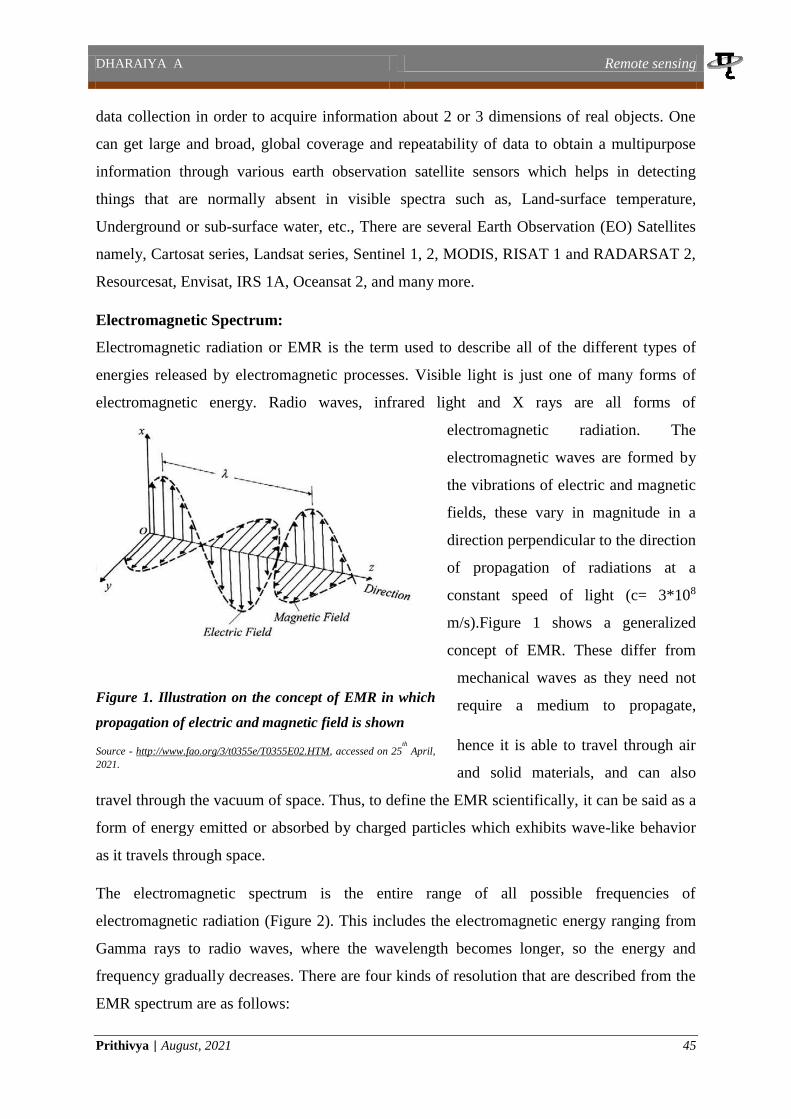
PANCHAL amp JHA Qualitative phytochemical analysis
Prithivya | August 2021 37
Qualitative phytochemical analysis of some medicinal plants (leaves) from the
surrounding area of Talod Taluka North Gujarat India
Panchal Mital and Jha Charumati
Department of Botany Smt Panchal Science college Talod ndash383215 North Gujarat India
E-mail mitalpanchal0gmailcom
Abstract
The tremendous biological variety of North-Eastern India has long been recognised Five medicinal
plants were chosen for this study Manilkara zapota (L) van Royen Manilkara hexandra (Roxb)
Dub Mangifera indica L Madhuca indica JF Gmel and Annona squamosa L The purpose of this
study was to look into the existence of Phytochemicals such as Alkaloid Amino acid Carbohydrate
Protein Glycoside Tannin Terpenoid Saponin Flavonoid and Steroids in the medicinal plants that
were chosen For the organic solvent extraction the Soxhlet apparatus was utilized Water acetone
and chloroform were utilised as solvents Our findings show that the examined plants crude aqueous
and organic solvent extracts contain medicinally relevant bioactive components justifying their usage
in traditional medicines for the treatment of various ailments
Key Words Qualitative phytochemical analysis Manikara zapota M hexandra Madhuka
indica Mangifera indica Annona squamosa
Introduction
Phytochemicals are non-nutritive substances Chemical compounds are produced naturally on
plants during metabolic processes and contain a wide range of proactive and disease-
preventive qualities These compounds are known to be produced by plants in order to defend
themselves Recent study has shown that they can also play a vital role in illness prevention
in humans Even some of these herbs have been used for millennia as traditional medicine
Most phytochemicals such as flavonoids carotenoids and polyphenols have antibacterial
action and can be used to treat infections The following plant species were studied
Manilkara zapota (L) van Royen M hexandra (Roxb) Dub Mangifera indica L Madhuca
indica JF Gmel and Annona squamosa L
Plants play a universal function in the treatment of sickness as seen by their use in every
major system of medicine regardless of philosophical foundation Plants are vital to the
pharmaceutical industry because they are a rich supply of pharmaceuticals and a vast
reservoir of chemical variety for drug development screening procedures The majority of the
medications mentioned in the Indian medicinal system are derived from plants
PANCHAL amp JHA Qualitative phytochemical analysis
Prithivya | August 2021 38
Medicinal plants have been used to treat disease all across the world for thousands of years It
is generally understood that some plants with active chemicals can limit microbial
development Plants ability to generate chemicals via secondary metabolism determines their
antimicrobial potency Secondary metabolites emerged as the most important class of
chemicals with a wide spectrum of antibacterial and antifungal properties When compared
to conventional fungicides used to inhibit microbial growth and survival these plant
chemicals have different structures and activities
Plants are a major source of Traditional medicine and can be used to cure a variety of
conditions with little adverse effects Traditional medical practises are not only beneficial in
the treatment of diseases but they also aid in the discovery of pharmaceutically active
compounds in plants which can aid in the commercial manufacture of pharmaceuticals From
ancient times the importance of plant diversification in health care has been extensively
recognised According to a literature review more than 50000 plant species have been
successfully employed for medical purposes globally with flowering plants accounting for
over 13 of these
Material and methods Plant collection and Identification
M zapota (L) van Royen M hexandra (Roxb) Dub M indica L M indica JF Gmel
and A squamosa L were among the plant species studied The plants were harvested from
the land in the Talod taluka in North Gujarat India The washed plant leaves were kept in for
drying after being cleaned with tap water around 2-3 times to evaporate the water content
With the use of a mechanical blender the sample was ground into a fine powder after drying
The powder is then kept in an airtight plastic container for future usage with adequate
labelling
Extraction technique
Extraction is the separation of inert plant tissue constituents from medicinally active plant
tissue constituents using a conventional extraction process Menstrum is a selective solvent
that is used to eliminate inert material and to obtain the curative part of the procedure through
therapy
PANCHAL amp JHA Qualitative phytochemical analysis
Prithivya | August 2021 39
Method and Plant extraction
Solvent extraction
The crude plant extract was made using the Soxhlet extraction method 10 gm of powdered
plant material was placed into a thimble and 300 ml of solvents were extracted separately
Acetone and chloroform were utilized as solvents In a syphon tube of an extractor the
extraction process continued for 24 hours until the solvent became colourless The extract
was then placed in a beaker The extract was then retained and cooked on a hot plate at 30- 40
degC until all of the solvent had evaporated The dried extract was stored at 4degC in a refrigerator
for future phytochemical investigation
Methods of phytochemical analysis
Alkaloid
Wagnerrsquos test A few drops of Wagners reagent were applied to 2mg of extract that had
been acidified with 15 percent vv hydrochloric acid The presence of alkaloids is indicated
by a yellow or brown ppt
Carbohydrates
Molischrsquos test 2mg of ethanolic extract was mixed with 10ml water filtered and
concentrated 2ml of conc sulphuric acid was added to these 2 drops of freshly prepared 20
alcoholic alpha-naphthol solution forming a layer below the mixture red-violet ring showing
the existence of carbohydrates that disappears when sufficient alkali is added
Amino acid
Ninhydrin test Boil for a few minutes 2ml Ninhydrin reagent + 2ml extract The production
of blue colour indicates the presence of amino acids
Steroids
Salkowski reaction 2mg of dry extract was combined with chloroform to the chloroform
layer sulphuric acid was gently introduced by the sides of the test tube The emergence of a
red colour indicated the presence of steroids
Tannin A few drops of a 5 percent wv Fecl3 solution were added to 1-2 ml of the ethanolic
extract Gallo tannins are shown by a green colour whereas pseudo tannins are indicated by a
brown colour
Flavonoids After mixing 2ml of each extract with a few drops of 20 sodium hydroxide a
bright yellow colour was seen A few drops of 70 dilute hydrochloric acid were added to
PANCHAL amp JHA Qualitative phytochemical analysis
Prithivya | August 2021 40
this and the yellow coloration disappeared The presence of flavonoids in the sample extract
is shown by the formation and disappearance of yellow colour
Saponins 6ml distilled water was added to 2 ml of each extract and rapidly shaken the
presence of saponin is indicated by the production of bubbles or persistent foam
Proteins adding 1 ml of 40 percent sodium hydroxide and a few drops of 1 percent copper
sulphate to 2ml of each extract The production of violet colour shows the presence of peptide
linkage molecules in the sample extract
Glycosides 05ml of glacial acetic acid and 3 drops of 1 aqueous ferric chloride solution
added in to 1ml of each extract The creation of a brown ring at the interface shows the
presence of glycosides in the sample extract
Terpenoids 1ml of each solvent is mixed with 05ml chloroform and a few drops of strong
sulphuric acid to produce a reddish-brown precipitate that confirms the presence of Terpenoid
in the extract
Table 1 Preliminary Phytochemical analysis
Class of
compounds
Manilkara
zapota
Manilkara
hexandra
Mangifera
indica
Madhuka
indica
Annona
squamosa AE CE WE AE CE WE AE CE WE AE CE WE AE CE WE
Alkaloid + + - + - - + + - + - - + - -
Amino acid - - - - - - - - - - - - - - -
Carbohydr
ate
+ + - + - + + - - - - - - - -
Protein - - + + - + + - + - - - - - +
Glycoside + - - + - + - - - - - + - - -
Tannin - - + - - - + + + + - + + + +
Terpenoid - + - - - - - - - - - + - - -
Saponin - + + + - + + - + + - + + - -
Flavonoid - + + - - + - - + - - + + - -
Steroid + - + - - + - - + - - - - - -
Where lsquo+rsquo = positive and lsquo-rsquo = negative
AE= Acetone extract CE= Chloroform extract WE= Water extract
Alkaloid carbohydrate glycoside and steroid are all found in Acetone extract of M zapota
leaves Chloroform extract of M zapota leaves contains alkaloid carbohydrate terpenoid
PANCHAL amp JHA Qualitative phytochemical analysis
Prithivya | August 2021 41
saponin and flavonoid Protein Tannin Saponin Flavonoid and Steroid can be found in the
aqueous extract of M zapota leaves alkaloid carbohydrate protein glycoside and saponin
are all found in Acetone extract of M hexandra leaves All phytochemicals are missing in the
chloroform extract of M hexandra leaves Aqueous extract of M hexandra leaves contains
carbohydrate protein glycoside saponin flavonoid and steroid Alkaloid Carbohydrate
Protein Tannin and Saponin are all found in Acetone extract of M indica leaves Alkaloid
and Tannin are found in Chloroform extract of M indica leaves Protein Tannin Saponin
Flavonoid and Steroid are found in aqueous extract of M indica leaves Alkaloid and
Tannin are found in Acetone extract of M indica leaves Chloroform extract of M indica
leaves is devoid of all phytochemicals Aqueous extract of M indica leaves contains
Glycoside Tannin Terpenoid Saponin and Flavonoid Alkaloid Tannin Saponin and
Flavonoid are all found in Acetone extract of A squamosa leaves Aqueous extract of A
squamosa leaves contains protein and tannin
Discussion
Plant samples were subjected to phytochemical analysis which confirmed the existence of
elements with medicinal and physiological properties Phytochemicals such as carbohydrate
amino acid protein tannin flavonoid saponin glycoside steroid terpenoid and alkaloids
were found in the plant extracts
Tannins attach to proline-rich proteins preventing them from being synthesized Flavonoids
are hydroxylated phenolic compounds that plants produce in response to microbial infection
and have been discovered to have antibacterial properties in vitro against a wide range of
pathogens Their capacity to combine with extracellular and soluble proteins as well as the
bacterial cell wall is most likely the reason for their activity They are also powerful
antioxidants with anticancer properties
Saponins which are known to have an anti-inflammatory impact were also discovered in the
plant extracts Saponins have the ability to coagulate and precipitate red blood cells Saponins
are known for their ability to produce foams in aqueous solutions as well as their hemolytic
activity cholesterol binding capabilities and bitterness Steroids have been shown to have
antimicrobial characteristics and they are extremely essential molecules particularly in
regard to sex hormones For millennia alkaloids have been associated with medical purposes
and cytotoxicity is one of their most prevalent biological features Alkaloids have been shown
PANCHAL amp JHA Qualitative phytochemical analysis
Prithivya | August 2021 42
to have analgesic antispasmodic and antibacterial effects by several researchers Glycosides
have been shown to reduce blood pressure in numerous studies The findings of this study
indicate that the detected phytochemical substances may be bioactive constituents and that
these plants are proving to be a valuable reservoir of bioactive compounds with significant
medical value
Conclusion
The findings demonstrated that the plants investigated contained medicinally essential
components Many previous investigations had accumulated evidence that the discovered
phytochemical was bioactive Several studies have demonstrated that these phytochemicals
contribute pharmacological and physiological qualities to the plants researched in the
treatment of various illnesses As a result extracts from these plants could be considered a
valuable source of drugs Further research should be carried out to separate purify and
characterize the active ingredients responsible for the activity of these plants as well as
further work to isolate purify and characterize the active constituents responsible for the
action of these Plants In addition more research into the putative mechanisms of action of
these extracts is urged
Acknowledgement
Authors are thankful to Disha life sciences Pvt Ltd for practical work during this study
References
Ashwin Godghate Rajaram Sawant Ashok Sutar (2012) Phytochemical Analysis of
Ethanolic extract of Roots of Carrisa carandus Linn RasayanJChem 5(4)456-
459
K Girija P Udaya Chandrika K Lakshman N Pruthvi (2010) Evaluation of Antimicrobial
activity of various Bark extracts of Bombax malabaricum IntJResPharmSci
1(2)199-204
Khalid S Shahzad A Bashrat N Abubakar M Anwar P (2018) Phytochemical screening and
Analysis of selected Medicinal Plants in Gujarat J Phytochemistry Biochem 2108
Kodangala C Saha S Kodangala P (2010) Phytochemical studies of Aerial parts of the Plant
Leucas lavandulaefolia Der Pharma Chemica 2(5)434-437
PANCHAL amp JHA Qualitative phytochemical analysis
Prithivya | August 2021 43
Manash PS et al (2016) Phytochemical Analysis of Traditional Medicinal Plants and their
Antimicrobial activity An Experience from North East India J Pharm Res
1(1)000104
Prabhavathi R M Prasad M P and Jayaramu M (2016) Studies on Qualitative and
Quantitative Phytochemical Analysis of Cissus quadrangularis Advances in Applied
Science Research 7(4)11-17
Pushpendra K Patel Narendra K Prajapati and BK Dubey (2012) Madhuka indica A
Review of its Medicinal property IJPSR 3(5) 942-950
RNS Yadav and Munia Agrawala (2011) Phytochemical analysis of some medicinal plants
Journal of Phytology 3(1)10-14
S Hemadri Reddy Aisha Khalid AL-Hinai Hajer Hafed AL-Yaqoobi and Fatima Jafar AL-
Ajmi (2016) Phytochemical analysis antimicrobial screening and Hypoglycemic
effect of some selected Medicinal plant extract from Oman Journal of Experimental
Biology and Agricultural Sciences 4(2)218-224
Suggested citation
Panchal M and Jha C (2021) Qualitative phytochemical analysis of some medicinal plants (leaves)
from the surrounding area of Talod Taluka North Gujarat India Prithivya An Official Newsletter
of WCB Research Foundation and WCB Research Lab Vol 1(2) 37-43
DHARAIYA A Remote sensing
Prithivya | August 2021 44
Remote sensing An overview with fundamentals and applications
Dharaiya Aditya
Geology Department MG Science Institute Ahmadabad ndash 380009 (Gujarat) India
E-mail adiradhugmailcom
Introduction
The general concept of remote sensing can be inferred by a simple statement ie the
acquisition of information from a specific distance Scientifically it is the science of
acquiring information about an object or phenomenon by measuring emitted and reflected
radiation (Ray 2013) According to Lillesand et al (2015) remote sensing is defined as the
science and techniques of obtaining information about an object land area phenomenon or
ecosystem process acquired by a device that is not in direct contact with the object area or
phenomenon under investigation The data collection is done remotely using various sensors
which may be further analyzed to obtain information about the objects areas or phenomenon
These acquired data can be of many forms such as variations in force distributions acoustic
wave and electromagnetic energy distributions Joseph (2005) has discussed modern remote
sensing as an extension of the natural phenomenon of visual perception of objects Apart
from visible spectrum the electromagnetic radiation from the ultraviolet to far infrared and
the microwave regions is used for remote sensing The observations which are directly
inferred through electromagnetic radiation (EMR) from the sun or self-emitted radiance is
called passive remote sensing Whereas in active remote sensing the electromagnetic
radiations of a specific wavelength or band of wavelengths are generated to illuminate the
targets and reflected or back-scattered EMR are recorded to gain information for example
LiDAR RADAR SAR etc Based on its applicability remote sensing is defined as sensing
of the earthrsquos surface from the space by making use of the properties of electromagnetic wave
emitted reflected or diffracted by the sensed objects for the purpose of improving natural
resource management land use and environmental protection The classification of remote
sensing is further based on the selection of EMR (eg optical and microwave Navalgund et
al (2007)) When the sensors detect the solar radiation in the visible and infrared wavelength
regions reflectedscattered or emitted from the earth is said as optical remote sensing and in
microwave remote sensing uses interference and polarization concepts with electromagnetic
energy that detects the scattered energy returning from the terrain and records it as an image
The main purpose of remote sensing is to have an organized systematic and large amount of
DHARAIYA A Remote sensing
Prithivya | August 2021 45
data collection in order to acquire information about 2 or 3 dimensions of real objects One
can get large and broad global coverage and repeatability of data to obtain a multipurpose
information through various earth observation satellite sensors which helps in detecting
things that are normally absent in visible spectra such as Land-surface temperature
Underground or sub-surface water etc There are several Earth Observation (EO) Satellites
namely Cartosat series Landsat series Sentinel 1 2 MODIS RISAT 1 and RADARSAT 2
Resourcesat Envisat IRS 1A Oceansat 2 and many more
Electromagnetic Spectrum
Electromagnetic radiation or EMR is the term used to describe all of the different types of
energies released by electromagnetic processes Visible light is just one of many forms of
electromagnetic energy Radio waves infrared light and X rays are all forms of
electromagnetic radiation The
electromagnetic waves are formed by
the vibrations of electric and magnetic
fields these vary in magnitude in a
direction perpendicular to the direction
of propagation of radiations at a
constant speed of light (c= 3108
ms)Figure 1 shows a generalized
concept of EMR These differ from
mechanical waves as they need not
require a medium to propagate
hence it is able to travel through air
and solid materials and can also
travel through the vacuum of space Thus to define the EMR scientifically it can be said as a
form of energy emitted or absorbed by charged particles which exhibits wave-like behavior
as it travels through space
The electromagnetic spectrum is the entire range of all possible frequencies of
electromagnetic radiation (Figure 2) This includes the electromagnetic energy ranging from
Gamma rays to radio waves where the wavelength becomes longer so the energy and
frequency gradually decreases There are four kinds of resolution that are described from the
EMR spectrum are as follows
Figure 1 Illustration on the concept of EMR in which
propagation of electric and magnetic field is shown
Source - httpwwwfaoorg3t0355eT0355E02HTM accessed on 25
th
April
2021
DHARAIYA A Remote sensing
Prithivya | August 2021 46
1 Spectral resolution ndash it is the variation in the reflectanceemittance as a function of
wavelength Spectral responses are recorded by separate spectral bands such as Red Blue
Green Thermal NIR etc Figure 3 depicts the spectral resolution through a reflectance
curve It is further divided into 4 class sub classes
a Panchromatic ndash It consists
of only 1 band (BW)
b Colour ndash It consists the
combinations of 3 colors of
visible spectrum (RGB)
c Multispectral ndash consists of
3 to 10 bands and offers
Medium level spectral
resolution(Feng et al 2020)
d Hyper spectral ndash consists
of 100s of band and offers
higher spectral resolution (Feng et al 2020)
The combinations of spectral reflectance from two or more wavelength that indicate the
relative abundance of feature of interest are known as spectral indices Vegetation indices are
the most popular type but other indices are available for burned area built-up features
Figure 2 Electromagnetic spectrum showing waves and the radiations with respect to
wavelength and frequency
Figure 3 Spectral reflectance curve to determine spectral
resolution
Source -httpgsphumboldtedu accessed on 8th
April 2021
Source ndashLillesand et al (2015) Remote sensing and Image interpretation 7e
DHARAIYA A Remote sensing
Prithivya | August 2021 47
hydrologic and geologic features The band combinations for formulating spectral indices
vary from satellite to satellite Some of the most common spectral indices are listed in
Table1
No Spectral indices Formulation
(Band combinations)
1 NDVI (Normalised Difference Vegetation
Index)
NIR ndash Red NIR + Red (Where NIR is
Near-infrared band)
2 NDWI (Normalised Difference Water Index)
NDMI (Normalised Difference Moisture Index)
NIR - SWIR NIR + SWIR
3 AVI (Advanced Vegetation Index) [NIR (1-Red) (NIR-Red)] 13
4 NDSI (Normalised Difference Snow Index) Green ndash SWIR Green + SWIR
5 SAVI (Soil Adjusted Vegetation Index) ((NIR ndash R) (NIR + R + L)) (1 + L)
Where L is soil brightness correction
factor
6 MSI (Moisture Stress Index) MIR NIR Where MIR is Middle-wave
Infrared
7 NDGI (Normalised Difference Glacier Index) NIR ndash Green NIR + Green
8 NDBI (Normalised Difference Built-up Index) SWIR ndash NIR SWIR + NIR
9 BSI (Bare Soil Index) ((Red + SWIR) ndash (NIR + Blue)) ((Red
+ SWIR) + (NIR + Blue))
2 Spatial resolutionndashIt is described as the measure of the smallest object that can be resolved
by the sensor or the ground area imaged for the instantaneous field of view (IFOV) of the
ground sensor or the linear dimension on the ground represented by each pixel in the
reflectanceemittance determined by the shape size and texture of the target as discussed in
the book entitled Advance Remote Sensing 2012 It is expressed in meters like (250 m 80
m 10 m 1 m resolutions etc) Figure 4 is an example of spatial resolution
10 m resolution 30 m resolution
(a) (b)
Table 1 Different kinds of Spectral indices with respect to their formulations of band
Source -httpsgiscrackcomlist-of-spectral-indices
Source -httpsgiscrackcomlist-of-spectral-indices
Source -httpsgiscrackcomlist-of-spectral-indices
combinations
Figure 4 Example of Spatial Resolution by imagery acquired from Sentinel (a) and Landsat (b)
satellite sensors
Source -httpsgiscrackcomlist-of-spectral-indices
DHARAIYA A Remote sensing
Prithivya | August 2021 48
3Temporal resolution ndash the amount of time needed to revisit and acquire data for the exact
same location is called temporal resolution for example the revisit time period of Landsat is
16 days and that of Sentinel is 10 days Figure 5 shows the processed temporal resolution
4 Radiometric resolution ndash When an image is acquired by a sensor its sensitivity to the
magnitude of the electromagnetic energy determines the radiometric resolution The finer the
radiometric resolution of a sensor the more sensitive it is to detecting small differences in
reflected or emitted energy
Components and process of remote sensing
Figure 6 briefly describes the
process of remote sensing
Though the methods for
collection processing and
interpretation of remotely sensed
data are diverse imaging systems
have the following essential
components
Figure 5 Example of Temporal resolution of Las Vegas over time in 1973 2000 and 2006
Figure 6 A generalized process components of remote
sensing technology
Source- httpsseos-projecteuremotesensing
Source - httpswwwgisoutlookcom2019 accessed on 8th
April 2021
DHARAIYA A Remote sensing
Prithivya | August 2021 49
1 Energy source or illumination
This is the basic requirement for process of remote sensing to have a source of energy that
illuminates electromagnetic energy to the target of interest for example Active and passive
ensors Mostly the sensors are passive which tends to measure the solar radiation reflected
from the target
2 Interaction with the atmosphere
Before the electromagnetic radiation reaches the Earths surface it has to travel through some
distance of the Earths atmosphere Particles and gases in the atmosphere can affect the
incoming light and radiation and such type of effects are caused by the mechanisms
of scattering and absorption (Figure 7)Scattering occurs when particles or large gas
molecules present in the atmosphere interacts and cause the electromagnetic radiation to be
redirected from its
original path It depends
on several factors
including the
wavelength of the
radiation the abundance
of particles or gases and
the distance the radiation
travels through the
atmosphere There are three 3 types of scattering which take place are described in Table 2
All the different types of scattering with examples are briefly shown in figure 8
No Types of Scattering Particle size
(Micro meters
μm)
Examples
1 Rayleigh lt 01 μm Small specks of Dust N2 O2
molecules
2 Mie ~ 1 to 10 μm Pollen Smoke Water vapour
3 Non ndash Selective gt 10 μm Water droplets and large dust
particles
Figure 7 Interaction of EMR with atmosphere (a) Scattering and (b)
Absorption
Table 2 Different types of scattering occur when EMR interacts with the atmosphere
Reference httpswwwnrcangccamaps-tools-publications
DHARAIYA A Remote sensing
Prithivya | August 2021 50
Absorption is the other main mechanism when EMR interacts with the atmosphere In
Contrast to scattering it causes molecules in the atmosphere to absorb specific amount of
energy at various wavelengths O3 CO2 and water vapour are 3 main atmospheric
constituents which absorbs radiation Those areas of the EMR spectrum which are not
severely influenced by atmospheric absorption and thus are useful for remote sensors are
called Atmospheric windows (Figure 9) The visible portion of the spectrum to which our
eyes are most sensitive corresponds to both the atmospheric window and the peak energy
level of the sun
Figure 8 Different types of scattering when EMR interacts in the atmosphere or with the
Earthrsquos surface
Figure 9 Atmospheric window showing the transmission of molecules at different wavelength
with respect to different radiations
Source - httpwwwgeooregonstateedu accessed on 8th
April 2021
Source - httpwwwsarraceniacomastronomy accessed on 8th
April 2021
DHARAIYA A Remote sensing
Prithivya | August 2021 51
3 Interaction with the target
After the interaction with atmosphere once the energy makes its way to the target through the
atmosphere it interacts with the target depending on the properties of both the target and the
radiation Figure 10 shows such examples of interaction This can take place a second time as
the energy travels back from the target to sensor Several interactions are possible when
electromagnetic energy encounters matter whether solid liquid or gases are as follows
Radiation may be transmitted or passed through the substance
It may be absorbed and give up its energy largely to heating the substance
It may be emitted as a function of its emissivity and temperature
It may be reflected in 2 ways specular and diffused (Scattered)
4 Recording of Energy by the sensor
After the energy has been scattered by or emitted from the earthrsquos surface there is a need for
a sensor which is mounted on a satellite to collect and record the EMR The sensors are
popularly known by EMR region they sense Remote sensing has a broad classification of
optical and microwave as well as active and passive remote sensing as discussed by
Navalgund et al(2007) Feng et al (2020) Ray (2013) The sensors for taking
observations needs to be mounted on a platform This could be ground based (eg handheld
radiometers) airborne (eg Drone AVIRIS sensor of NASA on board aircraft) or space-
borne (ie satellite based)
Figure 10 EMR interaction with the Earthrsquos Surface
Source httpswwwslideservecomportia copy Rick Lathrop accessed on 25th
April 2021
DHARAIYA A Remote sensing
Prithivya | August 2021 52
5 Transmission Reception and Processing
The energy recorded by the sensor has to be transmitted often in electronic form to a
receiving and processing station at the earth where the data are processed and stored in digital
form
6 Interpretation and analysis
Furthermore this processed data is interpreted visually and digitally to extract information
about the target which was illuminated There are numerous specialised instruments or
hardware and software used that are commonly known as image processing tools which
involves four basic steps viz image correctionrestoration image enhancement image
transformation and image classification
7 Application
The final element or component of remote sensing process is achieved when we apply the
extracted and processed information in solving a particular issue or problem Specialists who
work in each application theme are able to perform and carry out this task
Applications of remote sensing
Every application itself has some specific demands for spectral spatial radiometric and
temporal resolution of the satellite sensor (Shandilya et al 2013) In modern era the remote
sensing proved very effective to understand and resolve the challenges in almost all the
fields few of its major applications are illustrated in this article
1 Geology
In the field of geosciences the remote sensing techniques are applied to interpret and analyse
the bedrock lithological structural formations sedimentation(Merritt et al 2014 Stead et
al 2019) planetary surface monitoring (Clark et al 2003 Des Marais et al 2002 Shepard
et al 2001)geo-hazards and mineral exploration through observation and modelling
techniques
DHARAIYA A Remote sensing
Prithivya | August 2021 53
2 Hydrology
Some examples of applications of remote
sensing in hydrological science include
soil moisture estimation flood and
wetland monitoring watershed and
drainage modelling river delta change
detection and many more Figure 11 and
12are an example of one of the studies
undertaken for hydrological modelling
and mapping of wetlands respectively
(Dharaiya 2020a Dharaiya et al 2021)
3 Glaciology
By means of remote sensing one can acquire information and map the ice concentration ice
type or motion(Frey et al 2014 Jiyang Chen amp Ohmura 1990) iceberg detection glacier
copy
Adi
tya
D
Figure 11 Drainage modelling in Jambughoda
Wildlife sanctuary Gujarat (after Dharaiya
2020a)
copy
Aditya
D Figure 12 Mapping of wetlands in Patan district Gujarat (Dharaiya et al 2021)
DHARAIYA A Remote sensing
Prithivya | August 2021 54
dynamics (Pratibha amp Kulkarni 2018 Remya et al 2019) monitor snow thickness
(Gantayat et al 2014 Kulkarni et al 2002) meteorological change research snow-water
equivalence snowmelt run-off estimation and many more
4 Agriculture
In the science of agriculture the remote sensing is mostly used as a decision-making tool viz
for crop type classification crop condition assessment crop yield estimation soil characters
soil management practices and compliance monitoring (Zheng et al 2014)
5 Forestry
Forestry is one of the major sectors where remote sensing has proved as very effective tool It
has been used for reconnaissance mapping commercial forestry and environmental
monitoring are some objectives which can be fulfilled and that further helps in managing and
conserving the natural resources Figure 13 is an example of mapping the forest coverat
Ratanmahal wildlife sanctuary Gujarat using spectral indices
6 Land use Land cover (LULC)
Yacouba et al (2010) has discussed the LULC with reference to two terms lsquoland usersquo which
refers to the purpose the land serves and lsquoland coverrsquo refers to natural surface cover on the
ground For example it is widely used in habitat and natural resource management urban
expansion baseline mapping risk assessment legal boundaries for tax evaluation change
Figure 13 Forest cover map of Ratanmahal wildlife sanctuary Gujarat copy Aditya Dharaiya
DHARAIYA A Remote sensing
Prithivya | August 2021 55
detection etc Figure 14 and 15depicts the LULC classification and change detection of
wetlands respectively (Dharaiya 2020b Dharaiya et al 2021)
copy
Adity
a D
Figure 14 LULC classification with vegetation cover in Girnar Wildlife sanctuary
Gujarat (After Dharaiya 2020b)
Figure 15 Change detection of wetlands in Patan district Gujarat using Landsat 8 OLI
(Dharaiya et al 2021)
DHARAIYA A Remote sensing
Prithivya | August 2021 56
7 Coastal monitoring
Remote sensing can be used to gather information about oceanic processes(physical and
biological) oil spill (Alesheikh et al 1997 Fingas amp Brown 1997) and shipping by means
of remote sensing
Several other applications according to Shandilya et al (2013) include planimetry or land
surveying using very high spatial resolution satellites (30 cm) Generating Digital Elevation
Models (DEMs) from remote sensing products are used to generate elevation profiles by
means of radar interferometry radargrammetry and photogrammetry To extract the
planimetric details about mineral exploration activities topographic mapping and surface
monitoring base map imagery provides a priori information about the areas
Conclusion
This emerging technique of remote sensing is a significant tool to monitor the Earthrsquos
surface It has progressively expanded applications which allow users to collect interpret
and manipulate data over vast areas Multi-temporal satellite data help to delineate changes of
the earthrsquos surface thus it can be also said to be a useful and handy tool for all the users as it
increases the accuracy efficiency and quality of the analysis in such a way that it can be
helpful in decision-making process Furthermore the products can be conveniently used by
other scientists too who are even not much familiar with this technology and for the greatest
level of detail to be extracted
References
Alesheikh A A Ghorbanali A amp Nouri N (1997) Coastline change detection using
remote sensing International Journal of Environmental Science and Technology 4(1)
1ndash11
Clark R N Swayze G A Livo K E Kokaly R F Sutley S J Dalton J B
McDougal R R amp Gent C A (2003) Imaging spectroscopy Earth and planetary
remote sensing with the USGS Tetra order and expert systems Journal of
Geophysical Research E Planets 108(12) httpsdoiorg1010292002je001847
Des Marais D J Harwit M O Jucks K W Kasting J F Lin D N C Lunine J I
Schneider J Seager S Traub W A amp Woolf N J (2002) Remote sensing of
DHARAIYA A Remote sensing
Prithivya | August 2021 57
planetary properties and biosignatures on extrasolar terrestrial planets Astrobiology
2(2) 153ndash181 httpsdoiorg10108915311070260192246
Dharaiya A (2020a)Monitoring and assessment of forest ecosystem using geospatial
technology A case study of Jambughoda wildlife sanctuary Gujarat India Poster
presented at ISRS National Symposium-2020
Dharaiya A (2020b) Habitat Analysis of Girnar Wildlife Sanctuary using Geospatial
Techniques Paper presented at National Map Competition GIS Day-2020
Dharaiya N Bhati R and Patel J (2021) Ecological studies on selected wetlands of Patan
district to prepare management plan for long-term conservation Technical Report
WCB Research Foundation Patan 91Pp
Feng X He L Cheng Q Long X amp Yuan Y (2020) Hyperspectral and multispectral
remote sensing image fusion based on endmember spatial information Remote
Sensing 12(6) 1ndash17 httpsdoiorg103390rs12061009
Fingas M F amp Brown C E (1997) Review of oil spill remote sensing Spill Science and
Technology Bulletin 4(4) 199ndash208 httpsdoiorg101016S1353-2561(98)00023-1
Frey H Machguth H Huss M Huggel C Bajracharya S Bolch T Kulkarni A
Linsbauer A Salzmann N amp Stoffel M (2014) Estimating the volume of glaciers
in the Himalayan-Karakoram region using different methods Cryosphere 8(6) 2313ndash
2333 httpsdoiorg105194tc-8-2313-2014
Gantayat P Kulkarni A V amp Srinivasan J (2014) Estimation of ice thickness using
surface velocities and slope Case study at Gangotri Glacier India Journal of
Glaciology 60(220) 277ndash282 httpsdoiorg1031892014JoG13J078
Jiyang Chen amp Ohmura A (1990) Estimation of Alpine glacier water resources and their
change since the 1870s Hydrology in Mountainous Regions I 5(193) 127ndash135
Joseph G (2005) Fundamentals of Remote sensing 2e Orient Blackswan 2Rev ed Pp i-
xi 1-486
DHARAIYA A Remote sensing
Prithivya | August 2021 58
Kulkarni A V Srinivasulu J Manjul S S amp Mathur P (2002) Field based spectral
reflectance studies to develop NDSI method for snow cover monitoring Journal of
the Indian Society of Remote Sensing 30(1ndash2) 73ndash80
httpsdoiorg101007BF02989978
Lillesand T Kiefer R Chipman J (2015) Remote sensing and Image interpretation 7e
John Wiley amp sons Inc Pp 1-736
Merritt A J Chambers J E Murphy W Wilkinson P B West L J Gunn D A
Meldrum P I Kirkham M amp Dixon N (2014) 3D ground model development for
an active landslide in Liasmudrocks using geophysical remote sensing and
geotechnical methods Landslides 11(4) 537ndash550 httpsdoiorg101007s10346-
013-0409-1
Navalgund R Jayaraman V Roy P (2007) Remote sensing applications An overview
Current Science 93(12) 1747-1766
Pratibha S amp Kulkarni A V (2018) Decadal change in supraglacial debris cover in Baspa
basin Western Himalaya Current Science 114(4) 792ndash799
httpsdoiorg1018520csv114i04792-799
Ray S (2013) Basics of Remote Sensing Remote Sensing Image Analysis Including the
Spatial Domain 1ndash15 httpsdoiorg1010071-4020-2560-2_1
Remya S N Kulkarni A V Pradeep S amp Shrestha D G (2019) Volume estimation of
existing and potential glacier lakes Sikkim Himalaya India Current Science 116(4)
620ndash627 httpsdoiorg1018520csv116i4620-627
Shandilya K K Shukla S P amp Pathak V (2013) Applications of Remote sensing
Horizons of Earth sciences Vol 10 1ndash12
Shepard M K Campbell B A Bulmer M H Farr T G Gaddis L R amp Plaut J J
(2001) The roughness of natural terrain A planetary and remote sensing perspective
Journal of Geophysical Research E Planets 106(E12) 32777ndash32795
httpsdoiorg1010292000JE001429
DHARAIYA A Remote sensing
Prithivya | August 2021 59
Stead D Donati D Wolter A amp Sturzenegger M (2019) Application of remote sensing
to the investigation of rock slopes Experience gained and lessons learned ISPRS
International Journal of Geo-Information 8(7) httpsdoiorg103390ijgi8070296
Yacouba D Guangdao H amp Xingping W (2010) Applications of Remote Sensing in
Land UseLand Cover Change Detection in Puer and Simao Counties Yunnan
Province Report and Opinion 2(9) 7ndash16
Zheng B Campbell J B Serbin G amp Galbraith J M (2014) Remote sensing of crop
residue and tillage practices Present capabilities and future prospects Soil and
Tillage Research 138 26ndash34 httpsdoiorg101016jstill201312009
Types of resolution used in remote sensing
httpwwwedcuriedunrsclassesnrs409rslectureshowremotesensonworkpdfacce
ssed on 24th April 2021
Components of remote sensing ndash Scattering and absorption httpswwwnrcangccamaps-
tools-publicationssatellite-imagery-air-photosremote-sensing-
tutorialsintroductioninteractions-atmosphere14635accessed on 24th April 2021
Basic concepts of Electromagnetic radiation and
spectrumhttpgsphumboldteduOLMCoursesGSP_216_Onlinelesson1-
2spectrumhtmlaccessed on 24th April 2021
Concept of spectral indices httpswwwl3harrisgeospatialcomdocsspectralindiceshtml
accessed on 25th April 2021
Suggested citation
Dharaiya A (2021) Remote sensing and An overview with fundamentals and applications
Prithivya An Official Newsletter of WCB Research Foundation and WCB Research Lab Vol 1(2)
44-59
M I PATEL AWARD 2021
Prithivya | August 2021 60
M I Patel Award for Young Wildlife amp Conservation Biologist
Nominations for 2021 Award
Ms Shivangi Mishra
Shivangi is a Senior Research Fellow (Basic Scientific
Research Fellow UGC) at University of Lucknow and is
currently working on Egyptian Vultures She has also
worked on Butterflies of Uttar Pradesh from 2014- 2016
She has presented her research on Egyptian Vultures in
Conference of Raptor Research Foundation in 2018
(South Africa) 2019 (USA) and awarded with William C
Andersen Award and James Koplin Award respectively In
future also she wants to contribute her research for the
conservation of Egyptian Vultures in India
Dr Tarang Kumar Shah
Tarang is an Assistant Professor in Fisheries polytechnic at
Dau Shri VasudevChandrakarKamdhenuVishwaVidyalaya
Durg He studied the Effect of Thymus linearis plant
Extract on Growth Performance and Non-Specific Immune
Responses of endangered Golden Mahseer (Tor
putitora)against the disease caused
byOomycetesSaprolegniaparastica He found that the leaf
extract of Thymus plant has the antifungal properties and a
small quantity of which can control the population against
saprolegniosis
Dr Sujit Kolangath
Sujit is a subject specialist in animal biotechnology at
Wildlife Research amp Training Center Gorewada Nagpur
He studied the qualitative and quantitative aspect of
hepatoozoonfelis epidemiology in a tiger cub He reported
that the infection is transmitted by ingestion of infected
ticks infected prey and carrion and concurrent infection
with bacterial or viral infections may be fatal to the
infected animal
M I PATEL AWARD 2021
Prithivya | August 2021 61
Ms Jis Sebastian
Jis recently completed her doctoral research in Botany
from Madurai Kamraj University Madurai- Tamil Nadu
She is studying the pattern of diversity spatial distribution
and community structure of epiphytic orchids of southern
Western Ghatsresponds to availibility of
microenviornments (Microhabitat supported by
Microclimates) in the structurally diverse trees There for
Conservation of epiphytic orchids would ensure
conservation of old aged natural structurally complex
trees in the forest ecosystem
Dr Harshil Patel
Harshil is a naturalist working mainly on systematics and
taxonomy of reptiles and amphibians He studied the
amphibians amp reptiles of northern Western Ghats of
Gujarat He found a new Miocene divergent endemic
lineage of a racer snake evolutionary history of an
endemic snake resulted in the resurrection of a genus
reinvestigation of a gecko species complex that resulted
into the discovery of two new species
The final round including the presentation by the nominees followed by the award
ceremony will be conducted on September 27 2021 at M N College Visnagar (Gujarat)
WCB and the M I Patel Award committee congratulate all the nominees and wishing all
the best for their presentation
Applications and nomination for the 2022 awards are now open through our website
(wwwwcbresearchin) till June 30 2022
ANNOUNCEMENT
Prithivya | August 2021 62
ANNOUNCEMENT
Prithivya | August 2021 63
WINNERS OF MANGROVE DAY POSTER
COMPETITION
Prithivya | August 2021 64
WCB Research Foundation with K J Somaiya College Mubai have organized Digital and
Handmade Posters Competition on the occasion of World Mangrove Day July 26 2021 Out
of entries of thirty participants three best posters were selected by the committee and
awarded
Posters of Winners
1st Prize Digital Poster Ms Yukta Sawant
WINNERS OF MANGROVE DAY POSTER
COMPETITION
Prithivya | August 2021 65
1st Prize Digital Poster Ms Yukta Sawant
1st Prize Handmade Poster Ms Tanya Sawardekar
WCB RESEARCH FOUNDATION GOVERNING COUNCIL
Prithivya | August 2021 66
Governing Council of WCB Research Foundation
Executive
Director
Dr Hardik Patel Assistant Professor
Parul University Vadodara
phardik80gmailcom
Director of
Research
Dr Nishith Dharaiya Associate Professor
HNG University Patan
nadharaiyanguacin
Member Dr Sagarika Damle Associate Professor amp Head
Department of Life Sciences KC College Mumbai
sagarikadamlekccollegeeduin
Member Dr Nuria Selva Associate Professor
Institute of Nature Conservation
Polish Academy of Science Krakow Poland
nuriaselvagmailcom
Member Mr Pratik Desai Jr Research Fellow
WCB Research Lab Patan
pratikdesai825gmailcom
Member Mr M S Patel Associate Professor
M N College Visnagar martinleemsgmailcom
Member Dr Haresh Gondaliya Assistant Professor
Shri G D Modi Science College Palanpur hareshgondliya55gmailcom
Member Mr Prasad Patil Range Forest Officer
Gujarat Forest Department jalu1890gmailcom
Member Ms Madhuri Padaya Assistant Professor
K J Somaiya College of Science Mumbai padayamadhuriyahoocom
Member Dr Jagruti Rathod Director
Center for Nature amp Ecosystem Wellbeing Vadodara
rathod21gmailcom
Member
Secretary
Ms Jahnvi Patel Admin Officer
WCB Research Foundation Patan
adminwcbresearchin
Page 1 of 7 Pruthivya An official newsletter of WCB Research Foundation
Guidelines to authors and contributors 1 | P a g e
Instructions for authors
Scope Prithivya is a tri-annual newsletter of WCB Research Foundation and will
publish manuscripts on wildlife conservation biology and its allied areas
Guidelines to contributors of Prithiviya
Manuscript Types Prithiviya publishes original research articles short notes
field notes reviews and comments Submissions should be in English (UK) only
All manuscripts should be easy to read and comprehend Manuscripts may be
edited for length content and style and be sent to referees when found to be
appropriate The editor will discuss contributions with authors and advise to
modified whenever required
Submission is considered on the condition that papers are previously
unpublished have not been offered simultaneously elsewhere and that all
contributors have read and approved the contents
The editor will acknowledge manuscript contributions and assign them a unique
registration number which latter must be quoted in correspondence Papers are
peer-reviewed although the editor reserves the right to reject one without a
review
Preparation and submission of manuscripts
1 Title page Add full title Authors name and affiliation with email of all the Authors Abstract (250 Words) and Key words (4-5)
2 Submitted manuscripts should generally follow the normal convention of
scientific manuscripts keywords generally not appearing in the title
Introduction Materials and Methods Results and Discussion
Acknowledgments Authors contribution (optional) Appendices (optional) and
References) with the replacement or addition of sections allowed in between
the Introduction and the Acknowledgments
3 The manuscript should be typed in MS Word with left-aligned typesetting and
only true type fonts (Times new roman preferable) should be used The line
spacing must be 15 and the font size of 12 Headings should be bold and sub-
headings should be made italicized
Page 2 of 7 Pruthivya An official newsletter of WCB Research Foundation
Guidelines to authors and contributors 2 | P a g e
4 Title A concise informative and attractive and short title with 5-20 words will
be encouraged
5 Abstract Word limit for the abstract is 250 words and should contain a
summary of all major findings or conclusions of the study however abstract
is not required in case of short notes field notes and other short
communication
6 Introduction should be clearly written and must covering the objectives and
significance of the study
7 Methodology A detailed methodology is always encouraged The methodology
should contain the study area (if applicable) data collection analysis and
interpretation Authors should also mention the instruments software used
for the experiments and analysis
8 Result and discussions which contain main result with proper references
and authentic justifications include graph table photographs (No checklist
it directly goes into appendix or supplementary data)
9 Conclusions A short and comprehensive conclusion with significant novel
findings and depicting your research in a nut-shell
10 Acknowledgments which contain all funds support persons who help
during project or research or findings name of university other than they work
etc
11 Checklist-based papers like trip reports should contain dates of the trip total
number of birders or participants Mammals reptiles amphibians
invertebrates etc
12 Manuscripts should be sent electronically as an email attachment to the
Editorial Assistant with a cover letter to helliphellip
13 The text tables figurephotograph captions (which must be self-explanatory)
and appendices should be combined in one Microsoft Wordreg (ldquodocrdquo OR
ldquodocxrdquo) file format The preferred font is lsquoTimes New Romanrsquo in 12 point
14 Photographs artwork maps (the outlines of the Republic of India should
conform to Government of India regulations) diagrams etc should be
digitized and sent separately along with the manuscript or if they are large
Page 3 of 7 Pruthivya An official newsletter of WCB Research Foundation
Guidelines to authors and contributors 3 | P a g e
files in separate trailing e-mails These should be in TIFF and at least 8times11
inches in 300 dpi resolutions JPEG files must be lsquomaximumrsquo quality ie at
their minimum compression Maps should be marked with a scale and North
arrow and should carry a clear caption
15 Authors whose work involves the handling of any necessary permissions from
the requisite government agencies to do so The editor reserves the right to
view such permissions at herhis discretion
16 While photographing nestingcourtship display or any behavioural activity
including those of nests eggs courtship etc authorsphotographers must
ensure the safety of the animals involved and also ensure that they do not
disturb in any way whatsoever in the course of their photography The editor
reserves the right to view permissions for such activities within protected
areas The editorreferee reserves the right to query an author regarding the
ethics of photography and the methodology followed while photographing
including that of rejecting a manuscript if unsatisfied on these counts
Types of Manuscript
1 Short Research articles 2000 to 2500 words
2 Short notes Up to 1500 words
3 Important sightings 250-350 words with proper GPS location and
photographic evidence
4 Important findings 250-500 words with proper GPS location with image
5 Full-length Research paper Up to 10000 words with appendix excluding
photographs only
Other important Guidelines
Scientific binomials should comprise the generic and specific names but should
not include the name of the author and year of citation Scientific trinomials
should be mentioned only if the nature of the manuscript requires them
For example both the English and scientific name must be given thus ldquoHouse
Crow Corvus splendensrdquo thereafter only the English name ldquoHouse Crowrdquo will
suffice English and scientific names should follow the proper book that should
be mention in reference and title of the table
Page 4 of 7 Pruthivya An official newsletter of WCB Research Foundation
Guidelines to authors and contributors 4 | P a g e
Metric units and their international symbols must be used eg ldquosq kmrdquo and
ldquo1000 m aslrdquo dates and times should be of the form of MMDDYYYY (January
01 2021rdquo and ldquo1345 hrdquo respectively
Tables should be within gridlines (which may or may not be printed) Tables
should never be formatted with wrap-around text
Latitude and longitude coordinates should follow the format ldquo27807ordmN
74094ordmErdquo
Enzyme Nomenclature The trivial names recommended by the IUPAC-IUB
Commission should be used When the enzyme is the main subject of a paper
its code number and systematic name should be stated in its first citation in the
paper
Symbols and Abbreviations Use only standard abbreviations The use of non-
standard abbreviations can be extremely confusing to readers Avoid
abbreviations in the title The full term for which an abbreviation stands should
precede its first use in the text unless it is a standard unit of measurement
Page number (page 1 0f 10 formats) must be on top right corner of the word
documents font size 10 and times new roman word type
Citation and References Prithivya encourages the authors to use Mendely EndNote or other reference management tools for proper citations We follow APA referencing style
Do not abbreviate references pagination should be given in the expanded form
eg ldquoindashvi 1ndash250rdquo not ldquovi 250rdquo the page numbers should be separated by an
lsquoEnrsquo dash
Italics should be used for book titles but not volume numbers when citing
periodicals use italics for the journal name not the article title
References should be arranged alphabetically by the first author (and in the case
of more than one author by second and subsequent authors)
Citations to references in the text should follow the style ldquo(Santharam 1978)rdquo
ldquo(Barua amp Sharma 1999)rdquo ldquo(Pande et al 2002)rdquo ldquo(Lainer 1999 2004)rdquo ldquo(Lainer
1999abcd Lainer 1999a 2000a)rdquo [for several papers by an authors from
Page 5 of 7 Pruthivya An official newsletter of WCB Research Foundation
Guidelines to authors and contributors 5 | P a g e
amultiple calendar years] and ldquo(Neelakantan et al 1993 Sashikumar et
al 2011)rdquo
A string of citations in the text should follow a chronological not an alphabetical
order thus ldquo(Ali amp Ripley 1981 Kazmierczak 2000 Grimmett et al 2011)rdquo
When citing unpublished sources please use the following formats if the source
is written material ldquo(Harkirat Sangha in litt e-mailletter dated 02 January
2013)rdquo if oral ldquo(Rajah Jayapal verbally dated 15 December 2013)rdquo
When citing from e-Bird or any other magazine checklist please enter the author
of the e-Bird checklistrsquos name or others name and the year the checklist was
uploaded in the text ldquo(Raman 1994)rdquo If a checklist thatrsquos shared amongst
multiple observers is being referred to only the relevant checklist(s) should be
used for citation
See examples below for detailed formatting
Journal articles
Pittie A 2011 The dates of seven new taxa described by W E Brooks (Certhia
Hodgsoni Sitta Cashmirensis Dumeticola
major Horites [sic] Pallidus Phylloscopus Tytleri Motacilla Cashmirensis
and Alauda Guttata) Prithiviya7 (2) 54ndash55
Naoroji R amp Sangha H S 2011 Threats to habitat and wildlife in Changthang
and Rupshu areas of Ladakh a case study at Hanle Prithiviya7 (1) 2ndash6
Choudhary D N Mandal J N Mishra A amp Ghosh T K 2010 First ever
breeding record of Black-necked Stork Ephippiorhynchus asiaticus from
Bihar Prithiviya6 (3) 80ndash82
Books
Futehally Z (ed) 2006 India through its birds 1st ed Bangalore India
Dronequill Publishers Pvt Ltd Pp indashii 1ndash214
Pittie A 2010 Birds in books three hundred years of South Asian ornithologymdash
a bibliography 1st ed Ranikhet Permanent Black Pp indashxxi 1ndash845
Sashikumar C Praveen J Palot M J amp Nameer P O 2011 Birds of Kerala
status and distribution 1st ed Kottayam Kerala DC Books Pp 1ndash835 Book chapter
Pittie A 2011 Stray Feathers (1872ndash1899) (p 247) In Priority The dating of
scientific names in ornithology a directory to the literature and its
Page 6 of 7 Pruthivya An official newsletter of WCB Research Foundation
Guidelines to authors and contributors 6 | P a g e
reviewers Dickinson E C Overstreet L K Dowsett R J amp Bruce M D
(eds) Northampton UK Aves Press Limited Website
2013 Kadalundi makes history with new gull species The
Hindu (Thiruvananthapuram ed) dated February 7 2013
Website httpwwwthehinducomtodays-papertp-nationaltp-
keralakadalundi-makes-history-with-new-gull-speciesarticle4388171ece
[Accessed on 21 July 2014] Any magazine checklist
Raman T R S 1994 Website
URL httpebirdorgebirdviewchecklistsubID=S21694571 [Accessed on
15
December 2015]
ETHICAL MATTERS Authors involving in the usage of experimental animals and human subjects in their
research work should seek approval from the appropriate Institutional Animal Ethics
Committee in accordance with Principles of Laboratory Animal Care The material
and methods section of the manuscript should include a statement to prove that the
investigation was approved and that informed consent was obtained
Disclaimer
While every care is taken of manuscripts and their accompanying
material Prithiviya cannot be held responsible for accidental loss or damage of
any material sent for publication or for their return whether they are accepted
for publication or not
Material published in Prithiviya reflects the views of the authors and not
necessarily those of the publishers editors referees etc
The editor reserves the rights to make necessary changes in manuscripts in
consultation with the author
All submissions are evaluated under the assumption that the conditions listed here have been understood and accepted by the author(s)
Submission fees There will be no submission fees for e-publication however we
may produce the reprints on request and on payment basis
Page 7 of 7 Pruthivya An official newsletter of WCB Research Foundation
Guidelines to authors and contributors 7 | P a g e
Special announcements
We also accept announcement of workshop webinar conference symposium job
opportunities academic courses etc with nominal charges and guarantee for its
wider circulation
Contacts Editor in Chief Dr Sagarika Damle Emailvisaanikagmailcom Associate Editors Dr Nishith Dharaiya
Email nadharaiyagmailcom Dr Jagruti Rathod Email rathod21gmailcom Editorial Assistant Ms Rinku Bhati
Email bhatirinku178gmailcom
WCB Research FoundationAdding Science to Conservation
wwwwcbresearchin
- 001_Cover Page
- 002_Editorial Board_2
- 003_Table of Contents_Issue 2
- 004_Editorial and Directors Column
- 005_Chaudhary and Desai 1-3
- 006_Dave 4-11
- 007_Amin et al 12-17
- 008_Thakkar and Gohil 18-21
- 009_Marjadi 22-23
- 010_Patel and Patel 24-27
- 011_Pithva and Dharaiya 28-36
- 012_Panchal and Jha 37-43
- 013_Dhaaraiya 44-59
- 014_MI Patel Award Nominee 60-61
- 015_Announcements 62-63
- 016_Posters Competition Winners 64-65
- 017_ WCB Council and Board 66
- 018_Prithiviya_Guidelines Final
- 019_Last page
-

Editorial Board
Editor in Chief Dr Sagarika Damle Head Department of Life Sciences KC college HNSC University Mumbai
Associate Editor Dr Nishith Dharaiya Associate Professor Department of Life Sciences HNG University Patan
Dr Jagruti Rathod Director Center for Nature amp Ecosystem Wellbeing (CNEW) Vadodara
Editors Prof V C Soni Retd Professor Department of Biosciences Saurashtra University Rajkot
Dr BK Jain Rtd Principal MG Science Institute Ahmedabad
Prof Hitesh Solanki Professor Department of Botany Gujarat University Ahmedabad
Dr Nuria Selva Associate Professor Institute of Nature and Science Polish Academy of Science Krakow Poland
Mr Thomas Sharp Director of Conservation and Research Wildlife SOS USA
Dr Krzysztof Klimaszewski Assistant Professor Department of Zoology Warsaw University of Life Sciences Warsaw Poland
Dr Zornitza Aguilar Scientist SNAP Ecuador
Dr Darshan Marjadi Assistant Professor Department of Biotechnology Sarvajanik University Surat
Dr Rajesh Senma Assistant Professor Government Science College Vankal
Dr Archana Gajjar Assistant Professor Bahauddin Science College Junagadh
Dr Nisha Singh Scientist Bombay Natural History Society Mumbai
Dr Sumesh Dudhani Project Consultant Natural heritage INTACH Delhi
Editorial Assistant Ms Jahnvi Patel |Mr Pratik Desai | Ms Rinku Bhati WCB Research Foundation Patan
Language Editor Dr Ramaa Gaury Mandava WCB Research Foundation Patan
Contact details +918320519905 | Email prithivyawcbgmailcom
Prithivya A Quarterly Newsleer of WCB Research Foundaon and
Volume 1 | Issue 2 (August 2021)
Chief Editor Dr Sagarika Damle
Associate Editors Dr Nishith Dharaiya Dr Jagruti Rathod
Editorial Assistant MsRinku Bhati Jahnvi Patel Pratik Desai
Design amp Creation Mr Sachin and Dr Nishith Dharaiya
Cover page Indian Flying Fox (Pteropus giganteus) By Hiren Patel
copy Printed amp Published by WCB Research Foundation India wwwwcbresearchin
1-3 Range extinction of Asian pied starling (Gracupica contra)in Gujarat state Western India
Chaudhary and Desai
4-11 Observation on nesting pattern of different bird species around university road Rajkot
Dave D
12-17 Record of leucism in Indian flying fox (Pteropus giganteus) from South Gujarat India
Amin et al
18-21 Notes on behavioural observation of some water birds during the annual solar eclipse
Thakkar and Gohil
Field observations
22-23 Restoration of Earth with bio based polymer Marjadi D
24-27 Single-used surgical mask human life saver or biodiversity destroyer
Patel and Patel
28-36 Does the contemplation of forest field staff about wildlife differ than a common man
Pithva and Dharaiya
Short Articles
37-43 Qualitative phytochemical analysis of some medicinal plants (leaves) from the surrounding areas of Talod taluka North Gujarat India
Panchal and Jha
Research Papers
44-59 Remote sensing An overview with fundamentals and applications
Dharaiya A
Review Article
60-61 Final nominees of M I Patel Award 2021
62-63 Announcements
64-65 Winners of Mangrove day poster competition
Assorted news
The word Sustainable livelihood explains the essence of maintaining the values of theassets and enhancing the capabilities of the system for the current as well as futurescenario while conserving and respecting the natural resources The second issue of thenewsletter lsquoPrithivyarsquo attempts to draw the attention of the readers to various aspects ofsustainability through traditional conservation to high-tech environmental monitoringpractices It offers a wide range of articles ranging from Tribal artifacts and life style toEarth restoration contributed by young researchers From endemic species to sacredsites all natural habitats inherit conservation values Those biological ecological socialor cultural values of outstanding significance are known as lsquoHigh Conservation Valuesor HCVs and an observerrsquos role is pivotal in keeping the meticulous records that help inassigning these HVCrsquos The Stewardship of Biodiversity Conservation has been ablycarried forward by the young brigade of learners who belong to diverse disciplines butconverge towards their common goal of protecting the Mother earth The recentdisasters of untimely uncontrollable rains and floods landslides and raging forest firesat glocal levels point towards an undesirable climatic shift in earthrsquos environment andthe human species is racing against time to be disaster ready The lsquoCode Red forHumanityrsquo flashed in the latest USClimate Change report demands for doubling ourefforts in ecological restoration regimes It would happen only and only when the oldconservation practices and new technological insights work in tandem to bring aboutthe synergistic effect lsquoPrithivyarsquo is the right platform for the caregivers of environmentto showcase their ideas and outcomes We thank all the contributing authors of this 2ndissue and appeal to each reader of this newsletter to participate in some activity that willmake a positive difference in sustainable livelihood of the species around us Letrsquoscome together to build a greener tomorrowhellip
Editorial Noteपया983521वरणनाशन 984015वरमत 984015वरतो भवत मानवो मानवो भ983750ा कया983521त 983544क984017त र983477णम I
Dr Sagarika DamleChief EditorPrithivya sagarikadamlekccollegeeduin
Wildlife conservation has captivated great attention from all the sectors of the community Stakeholdersincluding scientists policymakers local and global organizations and citizens have been puttingrelentless efforts in conserving the wildlife and the wilderness on the earth This emphasizes on need foradopting foresighted approach and using scientific measures for producing desired results However allwe need is to adopt a scientific approach in such conservation activities so that it retains for longerperiod of time and give the desired results The key to wildlife conservation is target oriented awarenessand appreciation of the relationship between wildlife conservation policies and practices In order tobuild such relationship it is crucial that the correct scientific information about the wildlife reachesground level Wildlife researchers should be recognised as an important disseminator of science-basedinformation with education in schools and universities Along with that the media should bolster thesocial responsibility for communicating accurate and reliable conservation information At WCB Research Foundation we strive to bring different stakeholders and media on a single platformto spread the science-based information about wildlife and encourage the community to appreciatewildlife Our community based conservation approach has now become our mission of ldquoAdding scienceto the ConservationrdquoThe foundation will now complete one year And during this first year of establishment we initiatedseveral activities through which the scientific information can reach to every single or all sectors of thesociety We have started the sloth bear conservation education program in the central Gujarat wherepeople and sloth bear co-exists and the territorial forest patches connects two important protected areasWe have transformed the scientific information into the fun learning materials such as animation filmdocumentary videos stories comics and activity book We distribute these products among the schoolchildren and the local community and we expect that this will enhance the tolerance and appreciation oflocals towards the sloth bears In this difficult time of the pandemic we have organized severalwebinars online workshops and spread the message on wildlife conservation through social media Inorder to provide the platform to wildlife researchers and students we initiated WCBinars allowingstudents to present their research and the same we broadcast on our YouTube channel WCB is now connected with several national and international organizations through signing MoU andI am sure this will enhance our capacity and network to reach out more people and help wildlifeconservation We are always open to collaborate with organizations and institutions working in the areaof mutual interest and I welcome you all to join us work with us and collaborate with us to serve forMother Nature and conserving her wilderness
Directorrsquos Column
Nishith Dharaiya PhDDirector of ResearchWCB Research Foundaationnadharaiyagmailcom
CHAUDHARY amp DESAI Range Extension of Asian Pied Starling
Prithivya | August 2021 1
Range Extension of Asian Pied Starling (Gracupica contra) in Gujarat state Western
India
Chaudhary Sarthak Vsup1 and Desai Pratik Gsup2 1M N College Visnagar (Gujarat) India 2WCB Research Lab HNG University Patan (Gujarat) India
E-mail pratikdesai825gmailcom
India has more than 1300 bird species which is about 125 of worldrsquos total avifauna
(Grimmett et al 2011) Among them a total of 576 bird species have been reported from
Gujarat state (Ganpule 2016) Asian pied starling (Gracupica contra) commonly found in
foothills of south Asiauntil elevation of 700m It is also commonly found near water bodies
of human dominated areas grasslands and farmland (Ali amp Ripley 1983) Ali amp Ripley
(1983) recorded three subspecies of Pied starling in India whereas Grimmet et al (2005)
mentioned only two subspecies of Asian pied staling in India viz G superciliaris observed
around Manipur only while G contra is widely observed in North central and Eastern parts
of India (Grimmet et al 2005) Monga amp Naoroji (1983) mentioned sighting of pied starling
in Jamnagar and south Gujarat as rarevagrant Presence and breeding of G Contra was also
reported from Rajkot and Dahod districts of Gujarat consequently (Rasmussen amp Anderton
2005 Ganpule 2016) this species was introduced in Mumbai of Maharashtra state India
(Rasmussen amp Anderton 2005)
During field visit of Vadanagar
Mehsana district in northern part of
Gujarat (February 28 2021) we
have observed bird with white on the
black wings with white ventral mark
and orange bill at 0730 hrs After
validation through reference book
(Grewal 2016) we have identified it
as Asian pied starling (Gracupica
contra) We have found this
individual near the water body of
human habitation (N 237896 E
726291) The individual was
Asian pied starling (G contra) in Vadnagar town of
northern part of Gujarat (N 237896 E 726291)
CHAUDHARY amp DESAI Range Extension of Asian Pied Starling
Prithivya | August 2021 2
observed for 10 minutes and its behaviour was recorded Bird was feeding on some unknown
excreta material while foraging with other bird species viz Glossy ibis (Plegadis
falcinellus) Streak-throated swallow (Petrochelidon luvicola) Another individual of the
same species pair was observed on April 5 2021 1613 hrs at Kheralu town approximately
11 km far from previous observation (N 238831 E 726109) where the bird was sitting on
electric wire above the agriculture farm
Asian pied startling was recorded for the first time the semi-arid region of Gujarat as we did
not found any record of this species in this area This observation reflects the possible range
expansion of species Both of our sightings were around agriculture and human dominated
areas indicating the generalist niche and adaptability of this species in human dominated
landscape
Asian pied starling (G contra) perching on
electric wire above the agriculture farm (N
238831 E 726109)
Asian pied starling (G contra) feeding
on some unidentified excreta
CHAUDHARY amp DESAI Range Extension of Asian Pied Starling
Prithivya | August 2021 3
References
Ali S amp Ripley SD 1986 Handbook of the bird of India and Pakistan (Vol 5- Lark to
Grey Hypocolius) Oxford University Press
Grimmett R Inskipp C amp Inskipp T (2005) Birds of Indian Subcontinent Oxford
university press Pp 402-403
Grewal B 2016 A Pictorial Field Guide to Birds of India Pakistan Nepal Bhutan Sri
Lanka and Bangladesh India Om Books International
Monga S G amp Naoroji R K 1983 Birds of the Rajpipla forests ndash SouthGujarat With
notes on nests found and breeding recorded andsome new observations JBNHS 80
(3) 575-612
Rasmussen P C amp Anderton J C 2005 Birds of South Asia The Ripley guide
Washington DC amp Barcelona Smithsonian Institute amp Lynx Edition
Ganpule P 2016 The birds of Gujarat Status and distribution Flamingo 8(3) 2_40
Suggested citation
Chaudhary SV and Desai PG (2021) Range Extension of Asian Pied Starling (Gracupica contra)
in Gujarat state Western India Prithivya An Official Newsletter of WCB Research Foundation
and WCB Research Lab Vol 1(2) 1-3
DAVE D Nesting pattern of different bird species
Prithivya | August 2021 4
Observationson nesting pattern of different bird species around University road
Rajkot
Dave Deepali ldquoAnjaneyrdquo Sanjay vatika 8 Neel city club campus NearSaurashtra University Rajkot-
3640005(Gujarat) India
E-mail deepalidave955gmailcom
The dense vegetation near Saurashtra university circle provided a preferable avifaunal habitat
(Trivedi amp Vaghela 2020) This helped in the study of Avifaunal nesting sites in the urban
area of Rajkot (22deg17737N 70deg445388E 22deg171026N 70deg444403E 22deg17238N
70deg444514E 22deg165827N 70deg445231E) Gujarat A 2hours study was conducted while
exploring the area 2km away from my residence in the morning for a week in May 2021 Up
to 33 Avifaunal species and seven nesting sites were reported The nesting sites reported
during the survey were of Black Drongo (Dicrurusmacrocercus) Eurasian collared Dove
(Streptopeliadecaocto) Indian Thick knee (Burhinus indicus) Shikra (Accipiter badius)
Rufous Treepie (Dendrocittavagabunda) Red wattled Lapwing (Vanellus indicus) and Cattle
egret (Bubulcus ibis)
Figure 1 Detailed Map of Study area
DAVE D Nesting pattern of different bird species
Prithivya | August 2021 5
Point1 from the above figure indicates my residence where fieldwork was started Based on
vegetation and human disturbance the study area was divided into two parts Sub-urban Area
and Rural Area Point 7 and 8 indicates plantations done by the Saurashtra University The
line transect method was used for the field survey Images were captured with the help of
Canon 1200D 55-250 mm lens
Figure 2(a) Figure 2(b)
Figure 2(c) Figure 2(d)
Figure 2 Different photographs of saurashtra university plantation area (Study Area)
Black Drongo (Dicrurusmacrocercus)
The nesting season for Black Drongo is April to August with 3-4eggs as clutch size and 14-
15days incubation period The nest of Black drongo was observed at Point 8 (22deg17737N
70deg445388E) in the plantation site of Saurashtra University It is about 9 to 10 feet high
from ground level and built with twigs rootlets and threads Drongo is known to be a
protective parent and its mobbing behaviour towards Greater Coucal (Centropus sinensis)
Rose-ringed Parakeet (Alexandrinuskrameri) and Asian Koel (Eudynamysscolopaceus) were
DAVE D Nesting pattern of different bird species
Prithivya | August 2021 6
observed during the survey (Nijman 2004) Interspecies interaction between Eurasian
Collared-Dove and Black Drongo was observed during the survey and in previous studies
(Jahan et al 2018) as well where two Eurasian collared Dove made nest near the nest of
Black Drongo Usually birds like Dove do not cause any harm to Drongo Feeding gills for
both species is different as well (Ali 2017 Grimmettet al 2011) Therefore to protect their
eggs from other predators Dove makes their nest in the vicinity of Drongorsquos nest
Figure 3 (a) Figure 3 (b)
Eurasian collared Dove (Streptopeliadecaocto)
The nesting season for Eurasian collared Dove is throughout the year The nest was
observed at Point 8 in the plantation site
of Saurashtra University (22deg17737N
70deg445388E) It was made with twigs
and rootlets at 8-9feet height The clutch
size is 1-2 (Robertson 1990) and
incubation period of eggs is 15-19 days
Within a distance of 3 meters two nests
of Eurasian collared Dove were found
Both nests were in the vicinity of Black
Drongorsquos nest Itrsquos a great example of
species-species interaction By making
nests nearby aggressive Drongorsquos nests
Figure 4 A photograph presenting the nest
of Eurasian collared Dove
(Streptopeliadecaocto) Detailed Map of
Study area
Figure 3 Photographs presenting nest of Black Drongo (Dicrurusmacrocercus)
DAVE D Nesting pattern of different bird species
Prithivya | August 2021 7
Dove could gain protection from other predator species (Jahan et al 2018)
Indian Thick-knee (Burhinus indicus)
Indian Thick-knee is also known as Indian Stone curlew Its nest was found at Point 8 in the
plantation site of Saurashtra University (22deg17737N 70deg445388E) The breeding season
is from March to April The nest was made on the ground surrounded by dead leaves and few
twigs The clutch size for stone curlew is two (Sharma amp Sharma 2015) with incubation
period around 24 days While exploring the study area one egg and one hatchling were
observed which were wonderfully camouflaged with the colour of the ground The egg was
off-white coloured with random brown spots on it At the end of May 2021 another egg was
found broken Both male and female are involved in caring and protecting the hatchlings
against predators (Sharma amp Sharma 2015)
Figure 5 (a) Nest with hatchling and egg Figure 5 (b) Egg
Figure 5 (c) Hatchling Figure 5 (d) Adult Indian Thick-knee
Figure 5 Different photographs of Indian Thick-knee (Burhinus indicus) presenting
developmental stages
DAVE D Nesting pattern of different bird species
Prithivya | August 2021 8
Shikra (Accipiter badius)
The nesting season for Shikra is March to June Shikrarsquos nest was found at Point 8
(22deg171026N 70deg444403E) in the
plantation site of the Saurashtra
University The nest built with twigs
and rootlets at 20feet height from
ground level was observed on the
tallest tree The clutch size for the
Shikra is 3 to 4 eggs with 18-21days
incubation period Usually females
hatch the eggs but in rare cases males
hatch eggs as observed by
Suryawanshi (2021) During the
survey female Shikra was observed
chasing Large-grey Babbler (Argyamalcolmi)
Rufous Treepie (Dendrocittavagabunda)
The breeding season for Rufous Treepie is April to June and with clutch size 3-6eggs
At Point 8 of Saurashtra University plantation site (22deg17737N 70deg445388E) two to three
individuals of Rufous Treepie were seen
Figure 6 A photograph of Adult female Shikra
(Accipiter badius) and her nest
Figure 7 Adult Rufous treepie (Dendrocitta vagabunda) and her nest
DAVE D Nesting pattern of different bird species
Prithivya | August 2021 9
One of them was seen carrying food material while the other was collecting the nesting
materials A single nest of Rufous Treepie was observed and was built with twigs dead
leaves threads old clothing material rootlets and cotton The nest was found at a height of
approximately 20 feet On May 16th 2021 Rufous Treepie was seen feeding juvenile Koel
After a few days another Rufous Treepie was found hatching the eggs
Red-wattled Lapwing (Vanellus indicus)
Breeding season for Red-wattled Lapwing is April to June The egg or nest was not part of the
observation however a juvenile was observed at Point 3 of the Sub-urban area (22deg17238N
70deg444514E) A survey was conducted in May and the eggs might be laid during April The
clutch size is 3 to 4 with an incubation period of 28-30 days The nesting of this bird has no
protection strategies other than camouflaging the eggs with the surroundings to protect those
(Balkhande et al 2017)
Figure 8 (a) Juvenile Red-wattled Lapwing Figure 8 (b) Adult Red-wattled Lapwing
Figure 8 Photographic presentation of juvenile and adult Red-wattled Lapwing (Vanellus
indicus)
Cattle Egret (Bubulcus ibis)
The breeding season for Cattle Egret is June to August Between Point 5 and 6
(22deg165827N 70deg445231E) ten to twelve Cattle Egret nests were found and Egrets
were observed in their breeding plumage During their breeding season adults develop
orange buff plumage on the back breast and crown area Cattle Egrets from their nest in
DAVE D Nesting pattern of different bird species
Prithivya | August 2021 10
colonies Rootlets and twigs are used to build nests Clutch size for Cattle Egret is 2-4 and
the incubation period is between 22-28 days (Patankar et al 2007)
Fig 9 (a) Fig 9 (b)
Figure 9 Cattle egrets (Bubulcus ibis) and their colony
Acknowledgements
I would like to express my gratitude to DrJagruti Rathod for guiding and inspiring me
throughout my study I would also like to thank all the members of WCB Research
Foundation for organizing this internship program and giving me a chance to expand my
knowledge
References
Ali (2017) The Bookof Indian Birds Bombay Natural History Society ISBN 8173714851
Ali Hadjela amp Hassan Syed amp Rana Shahnaz amp Beg Mirza amp Mahmood-ul-Hassan
Muhammad (2007) Brood parasitism of Asian koel (Eudynamys scolopacea) on the
house crow (Corvus splendens) in Pothwar region of Pakistan Pakistan Journal of
Agricultural Sciences 44 627
Balkhande Dr Jayvardhan (2017) Study of Nesting pattern and breeding Biology of Red-
Wattled Lapwing Vanellus Indicus in agricultural field near to Asna River bridge
Nanded (Maharashtra) Research maGma An International Multidisciplinary Journal
ISSN NO- 2456-7078 VOL-1 ISSUE-6 AUG-2017
Grimmett et al (2011) Birds of Indian Subcontinent Helm field guides
ISBN 9781408127636
DAVE D Nesting pattern of different bird species
Prithivya | August 2021 11
Jahan I Begum S Feeroz M M Das D K amp Datta A K (2018) Nesting pattern of
birds in Jahangirnagar University Campus Bangladesh Journal of Threatened Taxa
10(5) 11618ndash11635 httpsdoiorg1011609jot279910511618-11635
Nijman V (2004) Seasonal variation in naturally occurring mobbing behaviour of drongos
(Dicruridae) towards two avian predators Ethology Ecology and Evolution 16(1)
25ndash32 httpsdoiorg1010800892701420049522651
Patankar Pratyush amp Desai Isha amp Shinde Kavita amp Balakrishnan Suresh (2007) Ecology
and breeding biology of the Cattle Egret Bubulcus ibis in an industrial area at
Vadodara Gujarat Zoos Print Journal 22 1011609JoTTZPJ15662885-8
Robertson H A (1990) Breeding of collared doves streptopelia decaocto in rural
oxfordshire england Bird Study 37(2) 73ndash83
httpsdoiorg10108000063659009477043
Sharma M amp Sharma R K (2015) Ecology and breeding biology of Indian stone curlew
(Burhinus indicus) Nature Environment and Pollution Technology 14(2) 423ndash426
Suryawanshi K 2021 Nesting behaviour and diet of Shikra Accipiter badius in Ajanta
Maharashtra Indian BIRDS 17 (2) XXndashXX
Trivedi V amp Vaghela S (2020) Avifauna of saurashtra university campus Rajkot Gujarat
India Journal of Threatened Taxa 12(13) 16764ndash16774
httpsdoiorg1011609jott5113121316764-16774
Suggested citation
Dave D (2021) Observations on nesting pattern of different bird species around university road
Rajkot Prithivya An Official Newsletter of WCB Research Foundation and WCB Research Lab
Vol 1(2) 4-11
AMIN ET AL Record of Leucism in Indian Flying Fox
Prithivya | August 2021 12
Record of Leucism in Indian Flying Fox Pteropus giganteus (Mammalia
Chiroptera Pteropodidae) from South Gujarat India
Amin Siddharth M1 Patel Hiren J2 and Vaghela Prashant P3
1 C129 Bhagyoday Society Opposite Sahyog Police chowki Gorwa Refinery Road
Vadodara - 390024(Gujarat) India 2Sardar Patel Zoological Park Kevadiya ndash 393151(Gujarat) India 3C-27 New Narmada Colony Chhani Jakatnaka Vadodara - 390024(Gujarat) India
E-mail hirenp9408gmailcom
Abstract
Leucism in fruit bat species Pteropus giganteus (Brunnich 1782) is recorded for the first
time from India based on photographic evidence collected from the Anaval Village located in
Surat District of South Gujarat India A total lack of pigmentation in the whole body due to
the failure of melanocytes to migrate to the skin and hair follicles resulting in white or
whitish hairs pale skin but normal coloured eyes are the sign of leucism The present record
can serve as baseline data and will also help understand colour aberration in bats
Key Words Colour aberration Chiropteran Pigmentation Mutation
Introduction
The Indian Flying Fox is one of the most common and widely distributed chiropterans found
in India Pakistan Sri Lanka Bhutan Nepal Bangladesh Maldives Myanmar and China
(Tsang 2020 Johnsingh amp Manjrekar 2013 Srinivasulu amp Srinivasulu 2012) Flying Fox is
the largest fruit bat known to occur on mainland India (Bates et al 1994) out of 13 Indian
fruit bat species (Bates amp Harrison 1997 Srinivasulu et al 2010) It has a reddish-brown
head with a darker sometimes
blackish snout pale brownish-
yellow shoulders and hindneck
yellowish-brown ventrally and
black wings (Prater 1971) It is
a colonial species and roosts
during the day often in the
midst of busy towns villages
on large trees along the
roadside near cropland and
water bodies (Bates et al 1994
Johnsingh amp Manjrekar 2013
Menon 2014) Their roosting
Figure 1 Leucistic individual roosting along with the
normal individuals
AMIN ET AL Record of Leucism in Indian Flying Fox
Prithivya | August 2021 13
colonies are generally found on large trees such as Ficus benghalensis F religiosa
Tamarindus indica Mangifera indica Dalbergia sissoo and Eucalyptus sp (Vendan 2003)
and the colony size can vary from hundreds to several thousands of individuals (Bastawade
amp Mahabal 1976) Although fruit bats are responsible for many ecological services (Saikia
2018) yet Indian Flying Fox is one of the most persecuted fruit bats in South Asia and is
listed as vermin under Schedule V of the Indian Wildlife (Protection) Act and IUCN Red List
Data included it as a Least Concern species (Tsang 2020)
In mammals a wide variety of colours and forms are found as a result of the presence of
certain pigments mostly melanin which provides colour to the skin hairs and eyes
(Nordlund et al 1998 Uieda 2000 Lucati amp Loacutepez Baucells 2016) Often this pigment is
affected as a result of mutations giving rise to diverse colour aberrations The effect of such
abnormal colouration is generally the pigmentation anomalies of chromatic disorders (Rook
et al 1998) Similar to other mammals bats are also vulnerable to genetic disorders that
affect pigmentation Globally such chromatic disorders are being reported at an increasing
rate in bats (Lucati amp Loacutepez Baucells 2016) and are caused by either an increase or a
decrease in the production of melanin in some regions or over the entire body (Hofreiter amp
Schoneberg 2010 Abreu et al 2013) These include albinism leucism piebaldism
hypomelanism and melanism (Lucati amp Loacutepez Baucells 2016) Among these conditions
leucism stands out as a rare phenomenon in nature
Leucism is a total lack of pigmentation in the whole body due to the failure of melanocytes to
migrate to the skin and hair follicles resulting in white or whitish hairs pale skin but
normal coloured eyes It occurs regardless of the normal production of the enzyme tyrosinase
and melanin Moreover it can be caused by one of the several mutations that will give rise to
apparently similar phenotypes (van Grouw 2006 2013 Abreu et al 2013 Lucati amp
Loacutepez‐ Baucells 2016) The occurrence of colour aberration in 55 Indian mammalian species
has been compiled by Mahabal et al (2019) Although cases of albinism and piebaldism have
been reported in the family Pteropodidae (Neal 1971 Karim 1983 Anonymous 2012
Anonymous 2013) however there is no report on colour aberration in Indian Flying Fox
(Pteropus giganteus) Here we report the first case of leucism in Indian Flying Fox from
Surat district of South Gujarat India
AMIN ET AL Record of Leucism in Indian Flying Fox
Prithivya | August 2021 14
Observations
On 18 June 2017 we were on the way to Vansda National Park and at 1230 h we stopped as
we saw a group of Indian Flying Fox roosting on Ficus religiosa near Anaval Village
(20838degN 73263degE) in Surat District Gujarat Suddenly all the fruit bats flew in the sky as
a local was hunting them with the help of a catapult maybe for eating purposes In the
middle of all these at 1249 h a white bat flying in the sky grabbed our attention as it flew
further to roost on one of the branches with other Indian Flying Fox We took some
photographs (Figure 1) and observed with the help of binoculars to note down its
characteristics Its whole body ie both fur and skin were white or whitish including
patagium and ears but it had normal black coloured eyes With the help of the classification
proposed by Lucati amp Loacutepez Baucells (2016) we identified it as a case of leucism and not
albinism
The roosting colony had around 250 individuals and was situated near a village pond among
human habitation on the roadside We observed the leucistic individual at least for an hour
and also alerted the locals to cease hunting of bats The leucistic individual was probably a
female and showed similar activity as that of normal individuals such as opening and closing
of wings folding the wings around belly and grooming
Discussion
Although physiological causes of colouration including melanism are evident (Caro 2005)
the genetic processes responsible for these colour variations remain unknown in most
mammals (Lucati amp Loacutepez Baucells 2016) Moreover chromatic disorders in bats can affect
both fur and skin including patagium ears and muzzle and their impact on the survival rate
is vague (Lucati amp Loacutepez Baucells 2016) However bats are most likely less vulnerable to
predation than the majority of diurnal animals as they are active at night and prefer dark
roosting sites (Buys et al 2002 Rocha et al 2013) Lucati amp Loacutepez Baucells (2016) states
that aberrant individuals roosting in sheltered places such as caves mines and buildings
may have greater survival rates than the one roosting in the open leaves Here we found the
leucistic Indian Flying Fox roosting in the open leaves and is likely to be vulnerable to
predation
Albinism is one of the most commonly occurring colour aberrations in bats (Lucati amp Loacutepez
Baucells 2016) In the family Pteropodidae albinism has been reported in Cynopterus sphinx
AMIN ET AL Record of Leucism in Indian Flying Fox
Prithivya | August 2021 15
from Nepal (Anonymous 2013) Lissonycteris angolensis from Uganda (Neal 1971) and
Rousettus leschenaultia from India (Karim 1983) while piebaldism is reported in Rousettus
amplexicaudatus from Philippines (Anonymous 2012) However another such colour
aberration leucism is not yet reported from the family Pteropodidae In this regard our report
of leucism in Pteropus giganteus can be the first of its kind in the entire range of its
distribution
Today bats in India face the harsh reality of declining habitats and resources ultimately
making them disappear altogether (Graham 2001 Tsang 2020) and the peoplersquos perception
regarding the presence of bats in their surroundings for different myths These facts raise an
urgent need to protect bats throughout the world by studying more about their behaviour and
ecology Further studies on Pteropus giganteus from Gujarat are mainly sighting reports
(Mahato et al 2012) and on roosting sites (Vyas amp Upadhyay 2014) Due to the lack of
information on colour aberration in the family Pteropodidae this report can add importance
to bat biologists
Acknowledgement
We are thankful to Dhaivat Patel and Vivek Patel for assisting us in fieldwork
References
Abreu M S L Machado R Barbieri F Freitas N S amp Oliveira L R 2013 Anomalous
colour in Neotropical mammals a review with new records for Didelphis sp
(Didelphidae Didelphimorphia) and Arctocephalus australis (Otariidae Carnivora)
Brazilian Journal of Biology 73 185ndash194
Anonymous 2012 Monfort Bat Sanctuary Blanca Bella Website
httpwwwmonfortbatsanctuaryorgblanca-bellac12m [Accessed 20 October
2019] Anonymous 2013 SMCRF (Small Mammals Conservation amp Research
Foundation) Website httpwwwsmcrforgindexphp [Accessed 20 October
2019]
Bastawade D B amp Mahabal A 1976 Some behavioural aspects of the Indian flying fox
Pteropus giganteus giganteus Bio-Vigyanam 2 209ndash212
Bates P J J amp Harrison D L 1997 Bats of the Indian Subcontinent Harrison Zoological
Museum Publication UK 258pp
Bates P J J Harrison D L amp Muni M 1994 The bats of western India Part 1 JBNHS
AMIN ET AL Record of Leucism in Indian Flying Fox
Prithivya | August 2021 16
91 (2) 1ndash15
Buys J Heijligers H amp Dorenbosch M 2002 First record of an albino long-eared bat
Plecotus auritus in The Netherlands Lutra 45 49ndash52
Caro T 2005 The adaptive significance of coloration in mammals BioScience55 125ndash136
Graham G L 2001 Bats of the World St Martinrsquos Press New York New York
160pp Hofreiter M amp Schoneberg T 2010
The genetic and evolutionary basis of colour variation in vertebrates Cellular and Molecular
Life Science 67 2591ndash2603
Johnsingh A J T amp Manjrekar N (eds) 2013 Mammals of South Asia Volume 2
Universities Press (India) Private Limited Telangana India pp 545ndash547
Karim K B 1983 A note on an albino Rousettus leschenaulti Bat Research News 24 39ndash
40
Lucati F amp Loacutepez Baucells A 2016 Chromatic disorders in bats a review of pigmentation
anomalies and the misuse of terms to describe them Mammal review 47(2) 112ndash123
Mahabal A Sharma R M Patil R N amp Jadhav S 2019 Colour aberration in Indian
mammals a review from 1886 to 2017 Journal of Threatened Taxa 11(6) 13690ndash
13719 Mahato A K R Kumar V V amp Patel N 2012 Indian flying fox in
Hamirsir Lake Bhuj city needs conservation attention Current Science 103(4)
354ndash355
Menon V 2014 Indian mammals a field guide Hachette India pp 386 Tsang SM
2020 Pteropus giganteus (errata version published in 2021) The IUCN Red List of
Threatened Species 2020 eT18725A194134899
httpsdxdoiorg102305IUCNUK2020-3RLTST18725A194134899en
Downloaded on 10 April 2021
Neal E 1971 Uganda Quest Collins London UK
Nordlund J J Boissy R E Hearing V J King R A Oetting W S amp Ortonne J P
(Eds) 1998 The pigmentary system physiology and pathophysiology Oxford
University Press New York
Prater S H 1971 The Book of Indian Animals (Revised) Bombay Natural History Society
Bombay pp 200ndash201
Rocha P A Feijo J A Donato C R amp Ferrari S F 2013 Leucism in Sebarsquos short-
tailed bat Carolliaperspicillata (Linnaeus 1758) from a rock shelter in northeastern
AMIN ET AL Record of Leucism in Indian Flying Fox
Prithivya | August 2021 17
Brazil Chiroptera Neotropical 19 1151ndash1153
Rook A Wilkinson D S Ebling F J B Champion R H amp Burton J L 1998
Textbook of Dermatology 6th edn Blackwell Science Boston Massachusetts USA
Saikia U 2018 A review of chiropterological studies and a distributional list of the
bat fauna of India Records of the Zoological Survey of India 118(3) 242ndash280
Srinivasulu C amp Srinivasulu B 2012 South Asian mammals their diversity distribution
and status Springer Science amp Business Media
Srinivasulu C Racey P A amp Mistry S 2010 A key to the bats (Mammalia Chiroptera)
of South Asia Journal of Threatened Taxa 2(7) 1001ndash1076
Uieda W 2000 A review of complete albinism in bats with five new cases from Brazil Acta
Chiropterologica 2 97ndash105
Van Grouw H 2006 Not every white bird is an albino sense and nonsense about colour
aberrations in birds Dutch Birding 28(2) 79ndash89
Van Grouw H 2013 What colour is that bird British birds 106 17ndash29
Vendan S E 2003 Roost and diet selection in the Indian Flying Fox Pteropus giganteus
(Mega chiroptera) MSc Thesis Madurai Kamaraj University India 85pp
Vyas R amp Upadhyay K 2014 Study of the Indian Flying Fox (Pteropus giganteus)
Colonies of Jambughoda Wildlife Sanctuary Gujarat India Record of the largest
roosting congregation at Targol Small Mammal Mail 6(1) 2ndash8
Suggested citation
Amin S Patel H and Vaghela P (2021) Record of Leucism in Indian Flying Fox Pteropus
giganteus (Mammalia Chiroptera Pteropodidae) from South Gujarat India Prithivya An
Official Newsletter of WCB Research Foundation and WCB Research Lab Vol 1(2) 12-17
THAKKAR amp GOHIL Birds behaviour during the Annular solar eclipse
Prithivya | August 2021 18
Notes on behavioural observation of some water birds during the Annular Solar
Eclipse
Thakkar Karan and Gohil Bharatsinh
Department of Life Sciences Maharaja Krishnakumarsinhji Bhavnagar University
Bhavnagar-364001 Gujarat India E-mail ksonpal07gmailcom
Abstract
In this communication we report the behaviour of various water birds observed during the annular
solar eclipse which happened on 26th November 2019 We observed the behaviour of eight species of
birdsrsquo viz Greater Flamingoes Phoenicopterus roseus the Indian Cormorant Phalacrocorax
fuscicollis Pied Avocet Recurvirostra avosetta Black-winged stilt Himantopus himantopus Eurasian
spoonbill Platalea leucorodia Northern shoveler Spatula clypeata Little grebe Tachybaptus
ruficollis and Dalmatian pelican Pelecanus crispus throughout the eclipse period ie from 805 AM
to 1051 AM Various behavioural chan`ges were observed in all the targeted species except the
Indian cormorant It rested on a pole for the whole eclipse period Detailed observations are given in
the note Reduction in light levels due to solar eclipse does affect the activity of birds
Key Words Solar Eclipse Behaviour Birds Bhavnagar
An annular solar eclipse was visible from 805 to 1051 AM on 26 December 2019 in India
Solar eclipse a rare and uncommon environmental event can influence and modulate the
behaviour of animals (Murdin 2001 Gil-burmann amp Beltrami 2003) Following observations
were made during the eclipse at airport Road Lake (21762837deg N 72183624deg E) in
Bhavnagar city using Nikon binoculars (1050)
Greater flamingos (n=24) on the day of the eclipse were seen foraging constantly from 805-
920 AM All of them started calling together from 921 to 935 AM After the peak of the
eclipse (ie after 921 AM) many flamingo individuals started preening Activities of Indian
cormorants varied throughout the eclipse period Pied avocets (n=13) were observed feeding
through the initial phase of the eclipse ie from 805 to 850 AM But pied avocets went onto
the resting phase from 851 to 935 AM Eight of them continued resting even after 935 AM
while the other five started feeding again Black-winged stilts (n=50) were seen resting in a
flock throughout the study period But as the eclipse increased flocks of black-winged stilts
from outside the lake started arriving and joined the original flock of 50 A group of five
black-winged stilts arrived at 852 followed by a flock of 20 at 906 AM Three other groups
of 30 50 and 10 black-winged stilts arrived from 921 to 935 AM Eurasian spoonbills
(n=30) were seen resting in water during the initial stage of eclipse ie from 808 to 920
AM From 921 to 935 AM five spoonbills started feeding 21 continued resting while 12
THAKKAR amp GOHIL Birds behaviour during the Annular solar eclipse
Prithivya | August 2021 19
started vocalizing and four flew away from the lake After 935 AM 12 individuals
continued calling 29 rested in water whereas eight individuals arrived from outside the lake
Activities of northern shoveler (n=80) varied throughout the eclipse Little cormorant (n=1)
rested on a pole for most of the observation It started feeding at 921 to 935 AM along with
one little cormorant which arrived from somewhere outside the lake After 935 both
perched at the wood in the lake Little grebe (n=1) spent most of the time feeding Between
935 and 950 AM it was joined by a flock of eight grebes that arrived from outside the lake
Pelicans (n=2) rested on a small patch of land in the lake throughout the study period
Table 1 Ethogram
Bird
Time intervals
0805-
0820
0821-
0835
0836-
0850
0851-
0905
0906-
0920
0921-
0935
0936-
0950
Greater
flamingo FD(n=24) FD(n=24) FD(n=24) FD(n=24) FD(n=24) C(n=24)
PR(n=4)
FD(n=17)C
(n=3)
Indian
Cormorant Rp(n=2) Rp(n=2)
Fi(n=2)
FD(n=4)
Rp(n=2)Fb
(n=2) Rp(n=1) Rp(n=1)Fb(n=1) _
Pied
Avocet FD(n=13) FD(n=13) FD(n=13) Rw(n=13) Rw(n=13) Rw(n=13)
FD(n=5)R
w(n=8)
Black
winged stilt Rw(n=50) Rw(n=50) Rw(n=50)
Rw(n=50)F
i(n=5)
Rw(n=55)
Fi(n=20)
Rw(n=75)
Fi(n=30)
Fi(n=50) Fi(n=10) Rw(n=165)
Eurasian
Spoonbill Rw(n=30) Rw(n=30)
Rw(n=30)
FD(n=4) Rw(n=34) Rw(n=34)
FD(n=5)C(n=12)
Fo(n=4)
Rw(n=21)
Fi(n=8)
C(n=13)
Rw(n=29)
Northern
Shoveler
PR(n=10)
Rl(n= 50)
Rw(n=20)
Rl(n= 50)
Rw(n=20)
PR(n=4)
Rw(n=50)
Rl(n=10)
Rw(n=54)
Rl(n=10)
FD(n=5)
Rw(n=54)
Rl(n=5)
Rw(n=54)
Rl(n=10)
Rw(n=54)
Rl(n=10)
Little
Cormorant Rp(n=1) Rp(n=1) Rp(n=1) Rp(n=1) Rp(n=1) FD(n=1) Fi(n=1) Rp(n=2)
Little grebe Rw(n=1) FD(n=1) FD(n=1) FD(n=1) FD(n=2) Fi(n=8)FD(n=10) FD(n=18)
Dalmatian
pelican Rl(n=2) Rl(n=2) Rl(n=2) Rl(n=2) Rl(n=2) Rl(n=2) Rl(n=2)
THAKKAR amp GOHIL Birds behaviour during the Annular solar eclipse
Prithivya | August 2021 20
Table 2 Different type of behaviours observed in bird species
BEHAVIOURS
FD Feeding
R Resting
Rp resting on an object prolonged perching on a pole or a stick in water
Rl resting on land simply sitting or standing with no noticeable movement
Rw resting in water no efforts for movement and neck resting on body(in case of ducks)
F Flight
Fb taking off from place A within a lake and settling at place B within a lake
Fa taking off from place A within a lake and settling at same place
Fo taking off from within lake and flying outside the lake
Fi arrived at lake from outside the lake
PR Preening
C Calling making some kind of voice could either be begging call roosting call or some other
B Bathing Rapid action of submerging in water and coming out
Kumar S (1981) observed the changes in the activity of cattle egrets because of the solar
eclipse Trigunayat (1997) observed that roosting Black-crowned Night-herons altered a
variety of behaviours including increased calling preening and perch shifting Nanikov et
al (2001) also mention behavioural changes in several birds due to solar eclipse A similar
trend was observed in this study as well From these limited field observations we can
conclude that reduced light level due to annular solar eclipse does interrupt normal bird
behaviour patterns
Acknowledgements
The first author is very thankful to Mr Dhavalkumar Vargiya for his kind support and
encouragement in the preparation for this article
References
Altmann J 1974Observational Study of Behavior Sampling MethodsBehaviour 49(34)
227-267 Retrieved on March 23 2020 from wwwjstororgstable4533591 bull Gil-
Burmann C Beltrami M 2003 Effect of the solar eclipse on the behavior of a
captive group of hamadryas baboons (Papio hamadryas) Zoo Biology 22 299ndash303
Kumar S 1981 Solar eclipse ndash notes on behavior of egrets J Bombay natural history
society78 3 133-136
Murdin P 2001 Effects of the 2001 total solar eclipse on African wildlife Astronomy
THAKKAR amp GOHIL Birds behaviour during the Annular solar eclipse
Prithivya | August 2021 21
Geophysics 42 40ndash42
Nankinov D Dalakthieva S Nikolov B Shurulinkov P Popov K Kirilov S Zareva
K Borisov B Stojanov G Nankinov N Minchev N Kjichukov D Nikolov I
Stanchev R Ganchev E 2001Studying the behaviour of birds during the solar
eclipse on August 11 1999 mdash Russian Ornithological Journal 142 355-369
Trigunayat M M 1997 Some behavioral observations on Night Heron Nycticorax
nycticorax (Linnaeus) during the total solar eclipse in Keoladeo National Park
Bharatpur IndiaPavo 3561ndash65
Tramer E J 2000 Bird Behavior During a Total Solar Eclipse The Wilson Bulletin 112(3)
431ndash432
Suggested citation
Thakkar K and Gohil B (2021) Notes on behavioural observation of some water birds during the
Annular Solar Eclipse Prithivya An Official Newsletter of WCB Research Foundation and WCB
Research Lab Vol 1(2) 18-21
MARJADI D Restoration of Earth with Biobased Polymer
Prithivya | August 2021 22
Restoration of Earth with Biobased Polymer
Marjadi Darshan
Shree Ramkrishna Institute of Computer Education amp Applied Sciences MTB Campus
Athwalines Surat-395001
E-mail darshanmarjadisrkiacin
Humanity is facing increasingly numerous challenges in life despite the great advancements
in science and technology over the last century All the needs of modern society eg food
fuel energy and materials are highly dependent on diminishing fossil resources The
demand for creating and using plastic throughout the world driven by the increasing usage of
plastic-based materials has been increasing and adding stress to the current waste
management infrastructures There is significant interest to decrease the reliance on
petroleum-based plastic products which causes global environmental pollution The
advancement in science and technology has enabled mankind to live longer and consume
more of the worlds resources More than eight million tons of plastic waste leak into oceans
every year which can be eased through innovative redesigns of packaging materials
Issues such as global climate change and depletion of fossil fuels both resulting from the
increased usage of energy have triggered alarms among scientists and politicians worldwide
Therefore governments industries and academia are inputting much effort towards finding a
sustainable solution for the increasing energy crisis However a similar concerted effort is
still lacking to bring about the creation and usage of sustainable materials in the modern
lifestyle In addition to the increasing demand for energy the usage of materials in the
modern lifestyle has also been increasing rapidly Considering the widespread usage of
plastics in food packaging clothes shelter communication transportation construction
health care and leisure industries plastics are the most dependable material among the other
materials that mankind is currently dependent upon Currently most of the plastics that are
widely used in various sectors are produced from petrochemical products The plastic
industry has been among the most profitable businesses and is expected to grow further
especially because of their increased demands from rapidly developing countries like India
and other parts of South-East Asia While plastics are superior materials in terms of their
production costs and diverse properties the sustainability of this synthetic material is
undoubtedly an issue that needs to be addressed Biobased and biodegradable polymeric
materials are considered amongst the most suitable alternatives for some applications The
MARJADI D Restoration of Earth with Biobased Polymer
Prithivya | August 2021 23
excessive usage of petroleum also contributes to the increased emission of CO2into the
atmosphere which is thought to be among the principal reasons for global warming and
climate change These are some of the strong and valid reasons leading towards the
development of technologies to produce biobased and biodegradable plastics
Science and technology have created the modern lifestyle that mankind is living in which
efficiency is the keyword Drawing an analogy from a bacterial culture in a shaken flask the
depletion of nutrients and the simultaneous accumulation of toxic wastes are the main
reasons for the onset of the stationary growth phase and the subsequent death phase
However unlike bacteria mankind is aware of the consequences of such activities As a
result the world population is now concerned about sustainable development
Biobased and biodegradable plastics most likely to remain less superior in terms of
production cost and material properties compared to petrochemical plastics Petroleum-based
plastics have serious environmental and social impacts due to their non-degradable nature
and the leaching of carcinogenic substances like dioxin when exposed to scratch or heat
Compared to the ease at which fossil resources are utilized renewable biobased materials
will need more effort and efficiency to be used in daily life However biobased materials are
considered superior in terms of sustainability and environmental friendly provided that they
are used judiciously and in a contented manner Hence it is in our hands to utilize our
knowledge of the environment to work towards the restoration of the earth and make it free
from single-use plastics
Suggested citation
Marjadi D (2021) Restoration of Earth with Biobased Polymer Prithivya An Official
Newsletter of WCB Research Foundation and WCB Research Lab Vol 1(2) 22-23
PATEL amp PATEL Single-use surgical mask
Prithivya | August 2021 24
Single-use surgical mask Human lifesaver or Biodiversity destroyer
Patel Jeel1 and Patel Rushika2 3
1GMERS Sola Civil Medical College Ahmedabad-380008 (Gujarat) India 2Assistant Professor Rai University Dholaka Ahmedabad-380008 (Gujarat) India 3Fellow Wildlife and Conservation Biology Research Foundation Pata-384265 (Gujarat)
India
E-mail rush2907gmailcom
The green lines represent sustainable and biodiversity conservation ways The dark brown
lines represent possible threats of single-use surgical mask to the biodiversity
Key Words Disposable mask Plastic and micro plastic pollution Conservation Threats
The COVID-19 is transmitted by respiratory droplets or aerosols and can survive in the air
for more than 24 hrs which was detected and momentarily created a pandemic situation
globally The only way to stop the transmission is to wear face mask washing hands
frequently and to maintain social distance Wearing a mask is declared as one of the
important precautionary measures by the World Health Organization (WHO) and
policymakers in every country because masks help in the significant reduction of infection
caused by touching the facemouthnose with contaminated hands (Schmutz et al 2020) The
virus COVID19has increased the demand for the surgical single-used mask in the healthcare
professionals as well as among the community Such masks are made up of polypropylene or
PATEL amp PATEL Single-use surgical mask
Prithivya | August 2021 25
high-density polyethylene (HDPE) a fossil-derived plastic which has a very high half-life
(Dharmaraj et al 2021)The mask production to the disposal statistics is presented in Table 1
Based on the reusability the mask is divided into two major groupsrsquo disposable (made up of
polymers) and reusable mask (made up of cloth material) in terms of production In present
study the details of only disposable mask is presented
Calculated based on the global entries of masks and gloves mentioned (200 millionmonth)
The average of one mask and single glove weight is 225plusmn001
Mask a threat to the ecosystem
In current situation recycling of any household medical waste is not a feasible and advisable
solution as there is a chance that it may be exposed to infectious particles There are no
particular laws or guidelines for separation and segregation which might involve several
issues Globally the dumping of masks was observed in areas such as roadside river oceans
and several open areas Usually such masks sustain in the environment for a longer period of
time (more than 400 years)(Hasan et al 2021) The misconception of masks to various birds
animals and marine creatures considering as a food and leads to trapping and entangling in
the strips of masks The single-use surgical mask not only adds litter to the environment but
No Statistics Reference
1 Estimated worldwide usage of disposable mask 129
billionmonth
Prata et al 2020
2 Production in China as on Feb 2020 116 millionday Adyel 2020
3 Order of mask in Japan as of April 2020 over 600
millionmonth
Fadare and Okoffo
2020
4 Mask disposal in the UK 53 millionday Website URL 1
5 Gloves and mask entered into the environment 200
millionmonth
Website URL 2
6 Mask reached to oceans 15 billion
Marine plastic pollution increased in last year 6200 tonnes
Website URL 3
7 Mask waste generation in India Minimum 928week
Maximum 4640week
Selvaranjan et al 2021
8 Plastic footprint in the environment due to mask and gloves
45times105 KgMonth
Present Study
Table 1 Global mask production usage and disposable statistics
PATEL amp PATEL Single-use surgical mask
Prithivya | August 2021 26
also hurting and killing a wide range of terrestrial and marine living organisms Moreover
the production process of such masks also releases greenhouse gases (Prata et al 2021) The
disposal of mask also reported as a novel source of micro plastic pollution in the environment
and entry point of the food chain (Hasan et al 2021) The single-use surgical masks are also
noted as a major causative agent of secondary disease outbreaks in all life forms including
humans (Fadare and Okoffo 2020) India does not have any sufficient resources for the
household medical waste management (Prata et al 2021) Every minute 10 kg of disposed
masks and gloves entered into the environment (Table 1)Hence it is very important to deal
with the mentioned issues and look into more sustainable sources at individual level
Herewith we suggest some measures by which we can protect the environment without
compromising human health in current pandemic situation
Snip the strips of the masks before the disposal to avoid the entangling and entrapping
issues
Dispose masks as a separate medical waste and submit it to plastic recycling
companies
Moving towards the development of biopolymer mask (Torres and Torre 2021)
Biopolymer mask were made up of gluten and nanofibers having 95 efficiency
A reusable mask could be applied in routine life for the general community Regular
cloth masks having multi-layer of high thread-count and textiles are moderately
effective and reported to block 50-70 fine droplets and particles Reusable masks
help in the reduction of waste production (85 ) Moreover economically viable
option in a country like India as it is 37 times cheaper than other masks (Prata et al
2021)
References
Adyel T M 2020 Accumulation of plastic waste during COVID-19 Science 396(6509)
1314ndash1315 httpsdoiorg101056nejmms2004740
Dharmaraj S Ashokkumar V Hariharan S Manibharathi A Show P L Chong C T
ampNgamcharussrivichai C 2021 The COVID-19 pandemic face mask waste A
blooming threat to the marine environment Chemosphere Elsevier Ltd
httpsdoiorg101016jchemosphere2021129601
Fadare O O ampOkoffo E D 2020 Covid-19 face masks A potential source of
microplastic fibers in the environment Science of The Total Environment 737
140279 httpsdoiorg101016jscitotenv2020140279
PATEL amp PATEL Single-use surgical mask
Prithivya | August 2021 27
Hasan N A Heal R D Bashar A amp Haque M M 2021 Face masks protecting the
wearer but neglecting the aquatic environment - A perspective from Bangladesh
Environmental Challenges 4 100126 httpsdoiorg101016jenvc2021100126
Prata J C Silva A L P Duarte A C amp Rocha-Santos T 2021 Disposable over
Reusable Face Masks Public Safety or Environmental Disaster Environments 8(4)
31 httpsdoiorg103390environments8040031
Schmutz M Hischier R Batt T Wick P Nowack B Waumlger P ampSom C 2020
Cotton and surgical masksmdashwhat ecological factors are relevant for their
sustainability Sustainability (Switzerland) 12(24) 1ndash13
httpsdoiorg103390su122410245
Selvaranjan K Navaratnam S Rajeev P ampRavintherakumaran N 2021 Environmental
challenges induced by extensive use of face masks during COVID-19 A review and
potential solutions Environmental Challenges 3 100039
httpsdoiorg101016jenvc2021100039
Torres F G amp De-la-Torre G E 2021 Face mask waste generation and management
during the COVID-19 pandemic An overview and the Peruvian case Science of the
Total Environment 786 147628 httpsdoiorg101016jscitotenv2021147628
Website URL 1 httpswwwgreenpeaceorguknewssingle-use-face-masks-hurting-
wildlife-what-you-can-do [Accessed on 23rd June 2021]
Website URL 2 httpswwwgreenmatterscompface-masks-wildlife [Accessed on 23rd June
2021]
Website URL 3 httpseconomictimesindiatimescomnewsenvironmentecosystem-under-
threat-as-birds-and-marine-life-ensnared-in-discarded-face-maskswidespread-
contaminationslideshow80230026cms [Accessed on 23rd June 2021]
Suggested citation
Patel J and Patel R (2021) Single-use surgical mask Human lifesaver or Biodiversity destroyer
Prithivya An Official Newsletter of WCB Research Foundation and WCB Research Lab Vol 1 (2)
24-27
PITHVA amp DHARAIYA Perception of forest staff about wildlife
Prithivya | August 2021 28
Does the contemplation of forest field staff about wildlife differ than a common man
Pithva Krishna1 2 and Dharaiya Nishith1
1 Wildlife and Conservation Biology Research Lab Hemchandracharya North Gujarat
University Patan (Gujarat) India 2Institute of Environment Education and Research Bharati Vidyapeeth Deemed University
Pune India
E-mail krishnapithva17gmailcom
Introduction
A field-based training was organized by Vadodara wildlife division Gujarat forest
department and WCB Research Lab of Hemchandracharya North Gujarat University from
September 17th to 19th 2020 with the aim to enhance the capacity of forest field staff for
monitoring and rescue of sloth bear and associated fauna The training was organized at
Jambughoda wildlife sanctuary Central Gujarat Along with the awareness about sloth bear
a small survey was carried out to understand how the field staff envisages the wildlife that is
found in their work place Total 18 frontline forest staff of different cadre such as beat guards
and round foresters from different forest ranges of central Gujarat has participated in this
survey
This study provides an insight on how
forest staffrsquos perception differs in different
animals As Q method provides qualitative
and quantitative data which helps
identifying peoplersquos perception in detail As
participants have to provide justification of
their answers it reveals some underlying
conflicts or reasons These justifications of
participants can help identify the gaps and
can be better used for conservation planning
as well as capacity building of forest field
staff
Figure 1 Forest frontline staff organizing
photos on Q Board copy Nishith Dharaiya
PITHVA amp DHARAIYA Perception of forest staff about wildlife
Prithivya | August 2021 29
Methodology
We used Q methodology for this study this method is designed and developed by William
Stephenson in 1930s (McKeown amp Thomas 1988)and allows to disclose underlying reasons
This method is widely used in social sciences studies In this method photos were used
instead of statements to know respondentrsquos perception allowing them to justify their answer
in detail without any restriction This method allows both qualitative and quantitative data on
perception of the person being interviewed
We categorised the Q Method into two parts first organising 16 photos of locally found
animals on a Q-board (figure 1(b)) followed by explanation for each photo which are placed
on Q-board by the respondent As shown in the figure 1(a) the participants were asked to
organise photos in Q- board as per their liking and disliking towards the animals and to
provide reasons which were recorded in mobile phone devise A list of all the wildlife photos
used for this survey is provided in table 1
-3 -2 -1 0 +1 +2 +3
Negative Positive Neutral
Figure 1(a) Representative sort of organized Q-
board by a participant
Figure 1(b) A Q-board on which the
respondents organize the photos
PITHVA amp DHARAIYA Perception of forest staff about wildlife
Prithivya | August 2021 30
Photo
ID
Common name Scientific name
1 Wild boar Sus scrofa
2 Hanuman langur Semnopithecus entellus
3 Indian cobra Najanaja
4 Indian giant flying squirrel Petauristaphilippensis
5 Small Indian civet Viverricula indica
6 Sloth bear Melursus ursinus
7 Indian hare Lepus nigricollis
8 Indian python Python molursus
9 Barn owl Tyto alba
10 Grey francolin Francolinuspondicerianus
11 Red-wattled lapwing Vanellus indicus
12 Rhesus macaque Macaca mulatta
13 Black kite Milvus migrans
14 Common krait Bungarus caeruleus
15 Indian crested porcupine Hystrix indica
16 Blue bull Boselaphustragocamelus
Q sort analysis
In this study three factors were derived based on participantrsquosjustification which is explained
in detail in the result section A factor in this study is a category representingthe group of
people who have similar perspective(Brown 1980) The higher the factor loading the more
highly that sorts are correlated with that factor (Ramlo 2008 Ramlo amp Newman 2011)The
sorts refer to the photos assembled by participants on Q-board (figure 1(b))In order to
analyse the data a software PQMethod(httpschmolckorgqmethod)was used which is
specially designed for Q-analysis Q sorts are the number of participants that took part in the
survey All the data were entered manually in this software and correlation was calculated
among each sort The correlation matrix for the extracted factor was analysed through a
principal component factor analysis with varimax rotationfor which options are provided in
the software (figure 2)
Table 1 Photos of wildlife used for this study
PITHVA amp DHARAIYA Perception of forest staff about wildlife
Prithivya | August 2021 31
Results and Discussion
The three factors that emerged
are shown in Table 2 with
automatic pre-flagging
Participants having similar
perceptions are put together in
their respective factors and
marked in bold and have ldquoXrdquo
next to their score Out of 18
sorts 17 sorts were found
complete by the software and
were further analysed Each of
three factors represents a different perspective towards the photos provided to them
Participants were named as PART001 PART002 and so on to keep their identity unrevealed
In table 2 there are 8 participants belonging to factor 1 with 29 of the variance explained
followed by 7 participants in factor 2 having 26 explained variance and 2 participants
belonging to factor 3 with 14 explained varianceOnce factor score calculated by the
software distinguishing tables were developed in this analysis for each factor which differ
from each other that is explained further in this section The distinguishing tables for each
factor explains differences between factors(Brown 1971 Ramlo amp Newman 2011 Brown
1993)In order to determine distinguishing statements average Z-score of respondentrsquos factor
score was calculated by the software
Figure 2 Screenshot of analytical option available in PQM
method Software
PITHVA amp DHARAIYA Perception of forest staff about wildlife
Prithivya | August 2021 32
Table 2 Extracted factor score from Q-sorts
Q-Sorts ID Factor 1 Factor 2 Factor 3
1 PART001 08530X 01248 -01223
2 PART002 00414 08084X 01708
3 PART003 06945X 00471 03983
4 PART004 07683X 01839 -00156
5 PART005 05450X 00166 02332
6 PART006 04208 07241X 04006
7 PART007 01728 01377 09013X
8 PART008 06930X 05214 03237
9 PART009 06516X 04289 04265
10 PART010 05119 06142X 00921
11 PART011 08475X -00072 -02626
12 PART012 03742 -05333 04456
13 PART013 00481 08292X 03240
14 PART014 -00002 06395X -03574
15 PART015 06577X 02179 01940
16 PART016 -00614 01991 06372X
17 PART017 04469 07611X 01835
18 PART018 05679 07564X 01465
Explained variance 29 26 14
Note number in bold shows respondents belong to those respective factors
Table 3 shows different factor score for each animal photo and depending on statistical
significance the photo load to a specific factor The above table contains 16 photos and their
grid position for all three factors (perception table 2) For example Indian python was
disliked by participants therefore it is scored at -2 for respondents grouped under factor 1 +1
for factor 2 andfor factor 3 it was scored at +2 For factor 1 the most liked species by
participants is Indian hare and most disliked species is wild boar Most liked species for
factor 2 is Indian leopard and most disliked animal is fruit bat For factor 3 most liked
species is Indian hare scored at +3 and most disliked species is wild boar scored at -3 by the
participants
PITHVA amp DHARAIYA Perception of forest staff about wildlife
Prithivya | August 2021 33
Table 3 Aggregate factor values of each 16 photos
Aggregate values
No Photos Factor 1 Factor 2 Factor 3
1 Indian python -2 1 2
2 Hanuman langur 0 0 2
3 Monitor lizard -1 -2 -1
4 Red-wattled lapwing 1 -1 1
5 Sloth bear 2 2 0
6 Indian hare 3 1 3
7 Leopard 2 3 0
8 Grey francolin 1 -1 -1
9 Indian giant flying squirrel 1 1 -2
10 Blue bull 0 0 0
11 Small Indian civet 0 0 -1
12 Fruit bat (Flying fox) -1 -3 -2
13 Indian cobra -2 2 1
14 Barn owl 0 0 0
15 Indian chameleon -1 -1 0
16 Wild boar -3 -2 -3
Factor 1 Economic impact
This factor was described by 8 participants mainly concerning economic impact Animals
that cause harm economically by destroying crops and threat to human life and livestock
Participants of factor 1 thinks fruit bat Indian python and Indian cobra causes high level of
economic harm Grey francolin is scored +1 due to its contribution to reduce impact by eating
pest insects from agricultural field Though the most disliked animal is wild boar for factor 1
as shown in table 3
PITHVA amp DHARAIYA Perception of forest staff about wildlife
Prithivya | August 2021 34
Table 4 Distinguishing photos for factor 1
Factor 2 Aesthetic spiritual values and conservation aspects
This factor explains aesthetic spiritual values and conservation aspects which includes
appearance tourist attraction rehabilitation and religious belief There are 7 responses in this
factor (table 2) Respondents are observed to have negative opinions towards animals which
play major role in economic loss but positive towards animalrsquos beauty and its natural
charisma Table 5 shows how score of animals for factor 2 is different from the score of
factor 1 and factor 3 For example Indian cobra is scored at +2 in factor 2 as it is attractive to
participants but it is scored -2 for factor 1 as it threatens human life
Table5 Distinguishing photos for factor 2
Photo
ID Photos
Grid
position
for
Factor 1
Z-score
of
Factor 1
Grid
position
for
Factor 2
Z-score
of
Factor 2
Grid
position
for
Factor 3
Z-score
of
Factor 3
13 Indian cobra -2 -119 2 127 1 037
6 Indian hare 3 148 1 067 3 189
1 Indian python -2 -103 1 034 2 122
4 Red-wattled
lapwing 1 014 -1 -065 1 079
16 Wild boar -3 -189 -2 -125 -3 -201
Photo
ID Photos
Grid
position
for
Factor
1
Z-score
of
Factor
1
Grid
position
for
Factor
2
Z-score
of
Factor
2
Grid
position
for
Factor
3
Z-score
of
Factor 3
8 Grey francolin 1 095 -1 -046 -1 -067
12 Fruit bat (Flying -1 -02 -3 -182 -2 -11
1 Indian python -2 -103 1 034 2 122
13 Indian cobra -2 -119 2 127 1 037
PITHVA amp DHARAIYA Perception of forest staff about wildlife
Prithivya | August 2021 35
Factor 3 Lack of awareness
This factor describes lack of awareness which includes lack of interest compared to other
animals and species This factor mainly concerns individuals who lacks knowledge proper
information and are not aware about the species For example in table 6 the score of Indian
giant flying squirrel differs from factor 3 to factor 1 and 2 as it is scored at -2 +1 and +1
respectively The justification for negative score given by the participants is that they are not
aware about the presence of the species therefore they do not have any information on the
species
Table 6 Distinguishing photos for factor 3
Photo
ID Photos
Grid
position
for
Factor 1
Z-score
of
Factor
1
Grid
position
for
Factor 2
Z-score
of
Factor
2
Grid
position
for
Factor 3
Z-score
of
Factor 3
1 Indian python -2 -103 1 034 2 122
2 Hanuman langur 0 -02 0 -045 2 110
13 Indian cobra -2 -119 2 127 1 037
5 Sloth bear 2 138 2 135 0 -000
7 Leopard 2 133 3 181 0 -000
9 Indian giant flying
squirrel 1 096 1 062 -2 -122
Conclusion
The perception of forest field staff was better understood using Q method analysis
considering various aspects It is seen that participants tend to like animals such as Indian
leopard sloth bear Hanuman langur and Indian hare as they are scored positive or neutral
The animals that are not given negative score in any factor due to their appearance are seen
frequently and does not lack awareness It is observed from the data that frontline forest staff
lacks knowledge about animals that are not seen or present in their forest rangebeat As
frontline forest staff they should be aware about existence of animal species that are found in
Gujarat state along with their ecological importance threats and conservation values Some
participants were not even aware about the existence of the species in the wild such as Indian
giant flying squirrel Although being frontline forest staff their perception is biased towards
animals such as wild boar monitor lizard and flying fox bat due to the economic loss they
PITHVA amp DHARAIYA Perception of forest staff about wildlife
Prithivya | August 2021 36
may cause and weird appearance Their perception becomes the same as a common man
when every animal should be equal to frontline forest staff as it is their job to protect forest
and its animals Some participants believe in superstitions of bad luck of barn owl and
monitor lizard which shows their common man perception and lack of right information
Recommendations
A separate training or workshops should be organised by forest department focused on
animal species found in Gujarat This will help them enhancing their existing knowledge and
it will provide them with some scientific insights Having basic scientific knowledge will
help remove some barriers like superstitions and other beliefs Field trips should be organised
in different part of state to gain practical experience Team building activities should be
conducted between staff of different forest divisions
Acknowledgements
We are thankful to all the forest field staff who participated in this survey We also thank to
the Deputy Conservator of Forests Vadodara Wildlife Division of Gujarat Forest Department
and sincerely acknowledge the help from our research team members
References
Brown S R (1980) Political subjectivity applications of Q methodology inpolitical science
E Ramlo S and Newman I (2011) Q Methodology and Its Position in the Mixed-Methods
Continuum Operant Subjectivity 34(3) 172ndash191
McKeown B and Thomas D B (1988) Q Methodology SAGE Publications
R Brown S (1993) A Primer on Q Methodology Operant Subjectivity 16(34) 91ndash138
Ramlo S E (2008) Determining the various perspectives and consensus within a classroom
using Q methodology AIP Conference Proceedings 1064 179ndash182
httpsdoiorg10106313021248
Suggested citation
Pithva K and Dharaiya N (2021) Does the contemplation of forest field staff about wildlife differ
than a common man Prithivya An Official Newsletter of WCB Research Foundation and WCB
Research Lab Vol 1(2) 28-36
PANCHAL amp JHA Qualitative phytochemical analysis
Prithivya | August 2021 37
Qualitative phytochemical analysis of some medicinal plants (leaves) from the
surrounding area of Talod Taluka North Gujarat India
Panchal Mital and Jha Charumati
Department of Botany Smt Panchal Science college Talod ndash383215 North Gujarat India
E-mail mitalpanchal0gmailcom
Abstract
The tremendous biological variety of North-Eastern India has long been recognised Five medicinal
plants were chosen for this study Manilkara zapota (L) van Royen Manilkara hexandra (Roxb)
Dub Mangifera indica L Madhuca indica JF Gmel and Annona squamosa L The purpose of this
study was to look into the existence of Phytochemicals such as Alkaloid Amino acid Carbohydrate
Protein Glycoside Tannin Terpenoid Saponin Flavonoid and Steroids in the medicinal plants that
were chosen For the organic solvent extraction the Soxhlet apparatus was utilized Water acetone
and chloroform were utilised as solvents Our findings show that the examined plants crude aqueous
and organic solvent extracts contain medicinally relevant bioactive components justifying their usage
in traditional medicines for the treatment of various ailments
Key Words Qualitative phytochemical analysis Manikara zapota M hexandra Madhuka
indica Mangifera indica Annona squamosa
Introduction
Phytochemicals are non-nutritive substances Chemical compounds are produced naturally on
plants during metabolic processes and contain a wide range of proactive and disease-
preventive qualities These compounds are known to be produced by plants in order to defend
themselves Recent study has shown that they can also play a vital role in illness prevention
in humans Even some of these herbs have been used for millennia as traditional medicine
Most phytochemicals such as flavonoids carotenoids and polyphenols have antibacterial
action and can be used to treat infections The following plant species were studied
Manilkara zapota (L) van Royen M hexandra (Roxb) Dub Mangifera indica L Madhuca
indica JF Gmel and Annona squamosa L
Plants play a universal function in the treatment of sickness as seen by their use in every
major system of medicine regardless of philosophical foundation Plants are vital to the
pharmaceutical industry because they are a rich supply of pharmaceuticals and a vast
reservoir of chemical variety for drug development screening procedures The majority of the
medications mentioned in the Indian medicinal system are derived from plants
PANCHAL amp JHA Qualitative phytochemical analysis
Prithivya | August 2021 38
Medicinal plants have been used to treat disease all across the world for thousands of years It
is generally understood that some plants with active chemicals can limit microbial
development Plants ability to generate chemicals via secondary metabolism determines their
antimicrobial potency Secondary metabolites emerged as the most important class of
chemicals with a wide spectrum of antibacterial and antifungal properties When compared
to conventional fungicides used to inhibit microbial growth and survival these plant
chemicals have different structures and activities
Plants are a major source of Traditional medicine and can be used to cure a variety of
conditions with little adverse effects Traditional medical practises are not only beneficial in
the treatment of diseases but they also aid in the discovery of pharmaceutically active
compounds in plants which can aid in the commercial manufacture of pharmaceuticals From
ancient times the importance of plant diversification in health care has been extensively
recognised According to a literature review more than 50000 plant species have been
successfully employed for medical purposes globally with flowering plants accounting for
over 13 of these
Material and methods Plant collection and Identification
M zapota (L) van Royen M hexandra (Roxb) Dub M indica L M indica JF Gmel
and A squamosa L were among the plant species studied The plants were harvested from
the land in the Talod taluka in North Gujarat India The washed plant leaves were kept in for
drying after being cleaned with tap water around 2-3 times to evaporate the water content
With the use of a mechanical blender the sample was ground into a fine powder after drying
The powder is then kept in an airtight plastic container for future usage with adequate
labelling
Extraction technique
Extraction is the separation of inert plant tissue constituents from medicinally active plant
tissue constituents using a conventional extraction process Menstrum is a selective solvent
that is used to eliminate inert material and to obtain the curative part of the procedure through
therapy
PANCHAL amp JHA Qualitative phytochemical analysis
Prithivya | August 2021 39
Method and Plant extraction
Solvent extraction
The crude plant extract was made using the Soxhlet extraction method 10 gm of powdered
plant material was placed into a thimble and 300 ml of solvents were extracted separately
Acetone and chloroform were utilized as solvents In a syphon tube of an extractor the
extraction process continued for 24 hours until the solvent became colourless The extract
was then placed in a beaker The extract was then retained and cooked on a hot plate at 30- 40
degC until all of the solvent had evaporated The dried extract was stored at 4degC in a refrigerator
for future phytochemical investigation
Methods of phytochemical analysis
Alkaloid
Wagnerrsquos test A few drops of Wagners reagent were applied to 2mg of extract that had
been acidified with 15 percent vv hydrochloric acid The presence of alkaloids is indicated
by a yellow or brown ppt
Carbohydrates
Molischrsquos test 2mg of ethanolic extract was mixed with 10ml water filtered and
concentrated 2ml of conc sulphuric acid was added to these 2 drops of freshly prepared 20
alcoholic alpha-naphthol solution forming a layer below the mixture red-violet ring showing
the existence of carbohydrates that disappears when sufficient alkali is added
Amino acid
Ninhydrin test Boil for a few minutes 2ml Ninhydrin reagent + 2ml extract The production
of blue colour indicates the presence of amino acids
Steroids
Salkowski reaction 2mg of dry extract was combined with chloroform to the chloroform
layer sulphuric acid was gently introduced by the sides of the test tube The emergence of a
red colour indicated the presence of steroids
Tannin A few drops of a 5 percent wv Fecl3 solution were added to 1-2 ml of the ethanolic
extract Gallo tannins are shown by a green colour whereas pseudo tannins are indicated by a
brown colour
Flavonoids After mixing 2ml of each extract with a few drops of 20 sodium hydroxide a
bright yellow colour was seen A few drops of 70 dilute hydrochloric acid were added to
PANCHAL amp JHA Qualitative phytochemical analysis
Prithivya | August 2021 40
this and the yellow coloration disappeared The presence of flavonoids in the sample extract
is shown by the formation and disappearance of yellow colour
Saponins 6ml distilled water was added to 2 ml of each extract and rapidly shaken the
presence of saponin is indicated by the production of bubbles or persistent foam
Proteins adding 1 ml of 40 percent sodium hydroxide and a few drops of 1 percent copper
sulphate to 2ml of each extract The production of violet colour shows the presence of peptide
linkage molecules in the sample extract
Glycosides 05ml of glacial acetic acid and 3 drops of 1 aqueous ferric chloride solution
added in to 1ml of each extract The creation of a brown ring at the interface shows the
presence of glycosides in the sample extract
Terpenoids 1ml of each solvent is mixed with 05ml chloroform and a few drops of strong
sulphuric acid to produce a reddish-brown precipitate that confirms the presence of Terpenoid
in the extract
Table 1 Preliminary Phytochemical analysis
Class of
compounds
Manilkara
zapota
Manilkara
hexandra
Mangifera
indica
Madhuka
indica
Annona
squamosa AE CE WE AE CE WE AE CE WE AE CE WE AE CE WE
Alkaloid + + - + - - + + - + - - + - -
Amino acid - - - - - - - - - - - - - - -
Carbohydr
ate
+ + - + - + + - - - - - - - -
Protein - - + + - + + - + - - - - - +
Glycoside + - - + - + - - - - - + - - -
Tannin - - + - - - + + + + - + + + +
Terpenoid - + - - - - - - - - - + - - -
Saponin - + + + - + + - + + - + + - -
Flavonoid - + + - - + - - + - - + + - -
Steroid + - + - - + - - + - - - - - -
Where lsquo+rsquo = positive and lsquo-rsquo = negative
AE= Acetone extract CE= Chloroform extract WE= Water extract
Alkaloid carbohydrate glycoside and steroid are all found in Acetone extract of M zapota
leaves Chloroform extract of M zapota leaves contains alkaloid carbohydrate terpenoid
PANCHAL amp JHA Qualitative phytochemical analysis
Prithivya | August 2021 41
saponin and flavonoid Protein Tannin Saponin Flavonoid and Steroid can be found in the
aqueous extract of M zapota leaves alkaloid carbohydrate protein glycoside and saponin
are all found in Acetone extract of M hexandra leaves All phytochemicals are missing in the
chloroform extract of M hexandra leaves Aqueous extract of M hexandra leaves contains
carbohydrate protein glycoside saponin flavonoid and steroid Alkaloid Carbohydrate
Protein Tannin and Saponin are all found in Acetone extract of M indica leaves Alkaloid
and Tannin are found in Chloroform extract of M indica leaves Protein Tannin Saponin
Flavonoid and Steroid are found in aqueous extract of M indica leaves Alkaloid and
Tannin are found in Acetone extract of M indica leaves Chloroform extract of M indica
leaves is devoid of all phytochemicals Aqueous extract of M indica leaves contains
Glycoside Tannin Terpenoid Saponin and Flavonoid Alkaloid Tannin Saponin and
Flavonoid are all found in Acetone extract of A squamosa leaves Aqueous extract of A
squamosa leaves contains protein and tannin
Discussion
Plant samples were subjected to phytochemical analysis which confirmed the existence of
elements with medicinal and physiological properties Phytochemicals such as carbohydrate
amino acid protein tannin flavonoid saponin glycoside steroid terpenoid and alkaloids
were found in the plant extracts
Tannins attach to proline-rich proteins preventing them from being synthesized Flavonoids
are hydroxylated phenolic compounds that plants produce in response to microbial infection
and have been discovered to have antibacterial properties in vitro against a wide range of
pathogens Their capacity to combine with extracellular and soluble proteins as well as the
bacterial cell wall is most likely the reason for their activity They are also powerful
antioxidants with anticancer properties
Saponins which are known to have an anti-inflammatory impact were also discovered in the
plant extracts Saponins have the ability to coagulate and precipitate red blood cells Saponins
are known for their ability to produce foams in aqueous solutions as well as their hemolytic
activity cholesterol binding capabilities and bitterness Steroids have been shown to have
antimicrobial characteristics and they are extremely essential molecules particularly in
regard to sex hormones For millennia alkaloids have been associated with medical purposes
and cytotoxicity is one of their most prevalent biological features Alkaloids have been shown
PANCHAL amp JHA Qualitative phytochemical analysis
Prithivya | August 2021 42
to have analgesic antispasmodic and antibacterial effects by several researchers Glycosides
have been shown to reduce blood pressure in numerous studies The findings of this study
indicate that the detected phytochemical substances may be bioactive constituents and that
these plants are proving to be a valuable reservoir of bioactive compounds with significant
medical value
Conclusion
The findings demonstrated that the plants investigated contained medicinally essential
components Many previous investigations had accumulated evidence that the discovered
phytochemical was bioactive Several studies have demonstrated that these phytochemicals
contribute pharmacological and physiological qualities to the plants researched in the
treatment of various illnesses As a result extracts from these plants could be considered a
valuable source of drugs Further research should be carried out to separate purify and
characterize the active ingredients responsible for the activity of these plants as well as
further work to isolate purify and characterize the active constituents responsible for the
action of these Plants In addition more research into the putative mechanisms of action of
these extracts is urged
Acknowledgement
Authors are thankful to Disha life sciences Pvt Ltd for practical work during this study
References
Ashwin Godghate Rajaram Sawant Ashok Sutar (2012) Phytochemical Analysis of
Ethanolic extract of Roots of Carrisa carandus Linn RasayanJChem 5(4)456-
459
K Girija P Udaya Chandrika K Lakshman N Pruthvi (2010) Evaluation of Antimicrobial
activity of various Bark extracts of Bombax malabaricum IntJResPharmSci
1(2)199-204
Khalid S Shahzad A Bashrat N Abubakar M Anwar P (2018) Phytochemical screening and
Analysis of selected Medicinal Plants in Gujarat J Phytochemistry Biochem 2108
Kodangala C Saha S Kodangala P (2010) Phytochemical studies of Aerial parts of the Plant
Leucas lavandulaefolia Der Pharma Chemica 2(5)434-437
PANCHAL amp JHA Qualitative phytochemical analysis
Prithivya | August 2021 43
Manash PS et al (2016) Phytochemical Analysis of Traditional Medicinal Plants and their
Antimicrobial activity An Experience from North East India J Pharm Res
1(1)000104
Prabhavathi R M Prasad M P and Jayaramu M (2016) Studies on Qualitative and
Quantitative Phytochemical Analysis of Cissus quadrangularis Advances in Applied
Science Research 7(4)11-17
Pushpendra K Patel Narendra K Prajapati and BK Dubey (2012) Madhuka indica A
Review of its Medicinal property IJPSR 3(5) 942-950
RNS Yadav and Munia Agrawala (2011) Phytochemical analysis of some medicinal plants
Journal of Phytology 3(1)10-14
S Hemadri Reddy Aisha Khalid AL-Hinai Hajer Hafed AL-Yaqoobi and Fatima Jafar AL-
Ajmi (2016) Phytochemical analysis antimicrobial screening and Hypoglycemic
effect of some selected Medicinal plant extract from Oman Journal of Experimental
Biology and Agricultural Sciences 4(2)218-224
Suggested citation
Panchal M and Jha C (2021) Qualitative phytochemical analysis of some medicinal plants (leaves)
from the surrounding area of Talod Taluka North Gujarat India Prithivya An Official Newsletter
of WCB Research Foundation and WCB Research Lab Vol 1(2) 37-43
DHARAIYA A Remote sensing
Prithivya | August 2021 44
Remote sensing An overview with fundamentals and applications
Dharaiya Aditya
Geology Department MG Science Institute Ahmadabad ndash 380009 (Gujarat) India
E-mail adiradhugmailcom
Introduction
The general concept of remote sensing can be inferred by a simple statement ie the
acquisition of information from a specific distance Scientifically it is the science of
acquiring information about an object or phenomenon by measuring emitted and reflected
radiation (Ray 2013) According to Lillesand et al (2015) remote sensing is defined as the
science and techniques of obtaining information about an object land area phenomenon or
ecosystem process acquired by a device that is not in direct contact with the object area or
phenomenon under investigation The data collection is done remotely using various sensors
which may be further analyzed to obtain information about the objects areas or phenomenon
These acquired data can be of many forms such as variations in force distributions acoustic
wave and electromagnetic energy distributions Joseph (2005) has discussed modern remote
sensing as an extension of the natural phenomenon of visual perception of objects Apart
from visible spectrum the electromagnetic radiation from the ultraviolet to far infrared and
the microwave regions is used for remote sensing The observations which are directly
inferred through electromagnetic radiation (EMR) from the sun or self-emitted radiance is
called passive remote sensing Whereas in active remote sensing the electromagnetic
radiations of a specific wavelength or band of wavelengths are generated to illuminate the
targets and reflected or back-scattered EMR are recorded to gain information for example
LiDAR RADAR SAR etc Based on its applicability remote sensing is defined as sensing
of the earthrsquos surface from the space by making use of the properties of electromagnetic wave
emitted reflected or diffracted by the sensed objects for the purpose of improving natural
resource management land use and environmental protection The classification of remote
sensing is further based on the selection of EMR (eg optical and microwave Navalgund et
al (2007)) When the sensors detect the solar radiation in the visible and infrared wavelength
regions reflectedscattered or emitted from the earth is said as optical remote sensing and in
microwave remote sensing uses interference and polarization concepts with electromagnetic
energy that detects the scattered energy returning from the terrain and records it as an image
The main purpose of remote sensing is to have an organized systematic and large amount of
DHARAIYA A Remote sensing
Prithivya | August 2021 45
data collection in order to acquire information about 2 or 3 dimensions of real objects One
can get large and broad global coverage and repeatability of data to obtain a multipurpose
information through various earth observation satellite sensors which helps in detecting
things that are normally absent in visible spectra such as Land-surface temperature
Underground or sub-surface water etc There are several Earth Observation (EO) Satellites
namely Cartosat series Landsat series Sentinel 1 2 MODIS RISAT 1 and RADARSAT 2
Resourcesat Envisat IRS 1A Oceansat 2 and many more
Electromagnetic Spectrum
Electromagnetic radiation or EMR is the term used to describe all of the different types of
energies released by electromagnetic processes Visible light is just one of many forms of
electromagnetic energy Radio waves infrared light and X rays are all forms of
electromagnetic radiation The
electromagnetic waves are formed by
the vibrations of electric and magnetic
fields these vary in magnitude in a
direction perpendicular to the direction
of propagation of radiations at a
constant speed of light (c= 3108
ms)Figure 1 shows a generalized
concept of EMR These differ from
mechanical waves as they need not
require a medium to propagate
hence it is able to travel through air
and solid materials and can also
travel through the vacuum of space Thus to define the EMR scientifically it can be said as a
form of energy emitted or absorbed by charged particles which exhibits wave-like behavior
as it travels through space
The electromagnetic spectrum is the entire range of all possible frequencies of
electromagnetic radiation (Figure 2) This includes the electromagnetic energy ranging from
Gamma rays to radio waves where the wavelength becomes longer so the energy and
frequency gradually decreases There are four kinds of resolution that are described from the
EMR spectrum are as follows
Figure 1 Illustration on the concept of EMR in which
propagation of electric and magnetic field is shown
Source - httpwwwfaoorg3t0355eT0355E02HTM accessed on 25
th
April
2021
DHARAIYA A Remote sensing
Prithivya | August 2021 46
1 Spectral resolution ndash it is the variation in the reflectanceemittance as a function of
wavelength Spectral responses are recorded by separate spectral bands such as Red Blue
Green Thermal NIR etc Figure 3 depicts the spectral resolution through a reflectance
curve It is further divided into 4 class sub classes
a Panchromatic ndash It consists
of only 1 band (BW)
b Colour ndash It consists the
combinations of 3 colors of
visible spectrum (RGB)
c Multispectral ndash consists of
3 to 10 bands and offers
Medium level spectral
resolution(Feng et al 2020)
d Hyper spectral ndash consists
of 100s of band and offers
higher spectral resolution (Feng et al 2020)
The combinations of spectral reflectance from two or more wavelength that indicate the
relative abundance of feature of interest are known as spectral indices Vegetation indices are
the most popular type but other indices are available for burned area built-up features
Figure 2 Electromagnetic spectrum showing waves and the radiations with respect to
wavelength and frequency
Figure 3 Spectral reflectance curve to determine spectral
resolution
Source -httpgsphumboldtedu accessed on 8th
April 2021
Source ndashLillesand et al (2015) Remote sensing and Image interpretation 7e
DHARAIYA A Remote sensing
Prithivya | August 2021 47
hydrologic and geologic features The band combinations for formulating spectral indices
vary from satellite to satellite Some of the most common spectral indices are listed in
Table1
No Spectral indices Formulation
(Band combinations)
1 NDVI (Normalised Difference Vegetation
Index)
NIR ndash Red NIR + Red (Where NIR is
Near-infrared band)
2 NDWI (Normalised Difference Water Index)
NDMI (Normalised Difference Moisture Index)
NIR - SWIR NIR + SWIR
3 AVI (Advanced Vegetation Index) [NIR (1-Red) (NIR-Red)] 13
4 NDSI (Normalised Difference Snow Index) Green ndash SWIR Green + SWIR
5 SAVI (Soil Adjusted Vegetation Index) ((NIR ndash R) (NIR + R + L)) (1 + L)
Where L is soil brightness correction
factor
6 MSI (Moisture Stress Index) MIR NIR Where MIR is Middle-wave
Infrared
7 NDGI (Normalised Difference Glacier Index) NIR ndash Green NIR + Green
8 NDBI (Normalised Difference Built-up Index) SWIR ndash NIR SWIR + NIR
9 BSI (Bare Soil Index) ((Red + SWIR) ndash (NIR + Blue)) ((Red
+ SWIR) + (NIR + Blue))
2 Spatial resolutionndashIt is described as the measure of the smallest object that can be resolved
by the sensor or the ground area imaged for the instantaneous field of view (IFOV) of the
ground sensor or the linear dimension on the ground represented by each pixel in the
reflectanceemittance determined by the shape size and texture of the target as discussed in
the book entitled Advance Remote Sensing 2012 It is expressed in meters like (250 m 80
m 10 m 1 m resolutions etc) Figure 4 is an example of spatial resolution
10 m resolution 30 m resolution
(a) (b)
Table 1 Different kinds of Spectral indices with respect to their formulations of band
Source -httpsgiscrackcomlist-of-spectral-indices
Source -httpsgiscrackcomlist-of-spectral-indices
Source -httpsgiscrackcomlist-of-spectral-indices
combinations
Figure 4 Example of Spatial Resolution by imagery acquired from Sentinel (a) and Landsat (b)
satellite sensors
Source -httpsgiscrackcomlist-of-spectral-indices
DHARAIYA A Remote sensing
Prithivya | August 2021 48
3Temporal resolution ndash the amount of time needed to revisit and acquire data for the exact
same location is called temporal resolution for example the revisit time period of Landsat is
16 days and that of Sentinel is 10 days Figure 5 shows the processed temporal resolution
4 Radiometric resolution ndash When an image is acquired by a sensor its sensitivity to the
magnitude of the electromagnetic energy determines the radiometric resolution The finer the
radiometric resolution of a sensor the more sensitive it is to detecting small differences in
reflected or emitted energy
Components and process of remote sensing
Figure 6 briefly describes the
process of remote sensing
Though the methods for
collection processing and
interpretation of remotely sensed
data are diverse imaging systems
have the following essential
components
Figure 5 Example of Temporal resolution of Las Vegas over time in 1973 2000 and 2006
Figure 6 A generalized process components of remote
sensing technology
Source- httpsseos-projecteuremotesensing
Source - httpswwwgisoutlookcom2019 accessed on 8th
April 2021
DHARAIYA A Remote sensing
Prithivya | August 2021 49
1 Energy source or illumination
This is the basic requirement for process of remote sensing to have a source of energy that
illuminates electromagnetic energy to the target of interest for example Active and passive
ensors Mostly the sensors are passive which tends to measure the solar radiation reflected
from the target
2 Interaction with the atmosphere
Before the electromagnetic radiation reaches the Earths surface it has to travel through some
distance of the Earths atmosphere Particles and gases in the atmosphere can affect the
incoming light and radiation and such type of effects are caused by the mechanisms
of scattering and absorption (Figure 7)Scattering occurs when particles or large gas
molecules present in the atmosphere interacts and cause the electromagnetic radiation to be
redirected from its
original path It depends
on several factors
including the
wavelength of the
radiation the abundance
of particles or gases and
the distance the radiation
travels through the
atmosphere There are three 3 types of scattering which take place are described in Table 2
All the different types of scattering with examples are briefly shown in figure 8
No Types of Scattering Particle size
(Micro meters
μm)
Examples
1 Rayleigh lt 01 μm Small specks of Dust N2 O2
molecules
2 Mie ~ 1 to 10 μm Pollen Smoke Water vapour
3 Non ndash Selective gt 10 μm Water droplets and large dust
particles
Figure 7 Interaction of EMR with atmosphere (a) Scattering and (b)
Absorption
Table 2 Different types of scattering occur when EMR interacts with the atmosphere
Reference httpswwwnrcangccamaps-tools-publications
DHARAIYA A Remote sensing
Prithivya | August 2021 50
Absorption is the other main mechanism when EMR interacts with the atmosphere In
Contrast to scattering it causes molecules in the atmosphere to absorb specific amount of
energy at various wavelengths O3 CO2 and water vapour are 3 main atmospheric
constituents which absorbs radiation Those areas of the EMR spectrum which are not
severely influenced by atmospheric absorption and thus are useful for remote sensors are
called Atmospheric windows (Figure 9) The visible portion of the spectrum to which our
eyes are most sensitive corresponds to both the atmospheric window and the peak energy
level of the sun
Figure 8 Different types of scattering when EMR interacts in the atmosphere or with the
Earthrsquos surface
Figure 9 Atmospheric window showing the transmission of molecules at different wavelength
with respect to different radiations
Source - httpwwwgeooregonstateedu accessed on 8th
April 2021
Source - httpwwwsarraceniacomastronomy accessed on 8th
April 2021
DHARAIYA A Remote sensing
Prithivya | August 2021 51
3 Interaction with the target
After the interaction with atmosphere once the energy makes its way to the target through the
atmosphere it interacts with the target depending on the properties of both the target and the
radiation Figure 10 shows such examples of interaction This can take place a second time as
the energy travels back from the target to sensor Several interactions are possible when
electromagnetic energy encounters matter whether solid liquid or gases are as follows
Radiation may be transmitted or passed through the substance
It may be absorbed and give up its energy largely to heating the substance
It may be emitted as a function of its emissivity and temperature
It may be reflected in 2 ways specular and diffused (Scattered)
4 Recording of Energy by the sensor
After the energy has been scattered by or emitted from the earthrsquos surface there is a need for
a sensor which is mounted on a satellite to collect and record the EMR The sensors are
popularly known by EMR region they sense Remote sensing has a broad classification of
optical and microwave as well as active and passive remote sensing as discussed by
Navalgund et al(2007) Feng et al (2020) Ray (2013) The sensors for taking
observations needs to be mounted on a platform This could be ground based (eg handheld
radiometers) airborne (eg Drone AVIRIS sensor of NASA on board aircraft) or space-
borne (ie satellite based)
Figure 10 EMR interaction with the Earthrsquos Surface
Source httpswwwslideservecomportia copy Rick Lathrop accessed on 25th
April 2021
DHARAIYA A Remote sensing
Prithivya | August 2021 52
5 Transmission Reception and Processing
The energy recorded by the sensor has to be transmitted often in electronic form to a
receiving and processing station at the earth where the data are processed and stored in digital
form
6 Interpretation and analysis
Furthermore this processed data is interpreted visually and digitally to extract information
about the target which was illuminated There are numerous specialised instruments or
hardware and software used that are commonly known as image processing tools which
involves four basic steps viz image correctionrestoration image enhancement image
transformation and image classification
7 Application
The final element or component of remote sensing process is achieved when we apply the
extracted and processed information in solving a particular issue or problem Specialists who
work in each application theme are able to perform and carry out this task
Applications of remote sensing
Every application itself has some specific demands for spectral spatial radiometric and
temporal resolution of the satellite sensor (Shandilya et al 2013) In modern era the remote
sensing proved very effective to understand and resolve the challenges in almost all the
fields few of its major applications are illustrated in this article
1 Geology
In the field of geosciences the remote sensing techniques are applied to interpret and analyse
the bedrock lithological structural formations sedimentation(Merritt et al 2014 Stead et
al 2019) planetary surface monitoring (Clark et al 2003 Des Marais et al 2002 Shepard
et al 2001)geo-hazards and mineral exploration through observation and modelling
techniques
DHARAIYA A Remote sensing
Prithivya | August 2021 53
2 Hydrology
Some examples of applications of remote
sensing in hydrological science include
soil moisture estimation flood and
wetland monitoring watershed and
drainage modelling river delta change
detection and many more Figure 11 and
12are an example of one of the studies
undertaken for hydrological modelling
and mapping of wetlands respectively
(Dharaiya 2020a Dharaiya et al 2021)
3 Glaciology
By means of remote sensing one can acquire information and map the ice concentration ice
type or motion(Frey et al 2014 Jiyang Chen amp Ohmura 1990) iceberg detection glacier
copy
Adi
tya
D
Figure 11 Drainage modelling in Jambughoda
Wildlife sanctuary Gujarat (after Dharaiya
2020a)
copy
Aditya
D Figure 12 Mapping of wetlands in Patan district Gujarat (Dharaiya et al 2021)
DHARAIYA A Remote sensing
Prithivya | August 2021 54
dynamics (Pratibha amp Kulkarni 2018 Remya et al 2019) monitor snow thickness
(Gantayat et al 2014 Kulkarni et al 2002) meteorological change research snow-water
equivalence snowmelt run-off estimation and many more
4 Agriculture
In the science of agriculture the remote sensing is mostly used as a decision-making tool viz
for crop type classification crop condition assessment crop yield estimation soil characters
soil management practices and compliance monitoring (Zheng et al 2014)
5 Forestry
Forestry is one of the major sectors where remote sensing has proved as very effective tool It
has been used for reconnaissance mapping commercial forestry and environmental
monitoring are some objectives which can be fulfilled and that further helps in managing and
conserving the natural resources Figure 13 is an example of mapping the forest coverat
Ratanmahal wildlife sanctuary Gujarat using spectral indices
6 Land use Land cover (LULC)
Yacouba et al (2010) has discussed the LULC with reference to two terms lsquoland usersquo which
refers to the purpose the land serves and lsquoland coverrsquo refers to natural surface cover on the
ground For example it is widely used in habitat and natural resource management urban
expansion baseline mapping risk assessment legal boundaries for tax evaluation change
Figure 13 Forest cover map of Ratanmahal wildlife sanctuary Gujarat copy Aditya Dharaiya
DHARAIYA A Remote sensing
Prithivya | August 2021 55
detection etc Figure 14 and 15depicts the LULC classification and change detection of
wetlands respectively (Dharaiya 2020b Dharaiya et al 2021)
copy
Adity
a D
Figure 14 LULC classification with vegetation cover in Girnar Wildlife sanctuary
Gujarat (After Dharaiya 2020b)
Figure 15 Change detection of wetlands in Patan district Gujarat using Landsat 8 OLI
(Dharaiya et al 2021)
DHARAIYA A Remote sensing
Prithivya | August 2021 56
7 Coastal monitoring
Remote sensing can be used to gather information about oceanic processes(physical and
biological) oil spill (Alesheikh et al 1997 Fingas amp Brown 1997) and shipping by means
of remote sensing
Several other applications according to Shandilya et al (2013) include planimetry or land
surveying using very high spatial resolution satellites (30 cm) Generating Digital Elevation
Models (DEMs) from remote sensing products are used to generate elevation profiles by
means of radar interferometry radargrammetry and photogrammetry To extract the
planimetric details about mineral exploration activities topographic mapping and surface
monitoring base map imagery provides a priori information about the areas
Conclusion
This emerging technique of remote sensing is a significant tool to monitor the Earthrsquos
surface It has progressively expanded applications which allow users to collect interpret
and manipulate data over vast areas Multi-temporal satellite data help to delineate changes of
the earthrsquos surface thus it can be also said to be a useful and handy tool for all the users as it
increases the accuracy efficiency and quality of the analysis in such a way that it can be
helpful in decision-making process Furthermore the products can be conveniently used by
other scientists too who are even not much familiar with this technology and for the greatest
level of detail to be extracted
References
Alesheikh A A Ghorbanali A amp Nouri N (1997) Coastline change detection using
remote sensing International Journal of Environmental Science and Technology 4(1)
1ndash11
Clark R N Swayze G A Livo K E Kokaly R F Sutley S J Dalton J B
McDougal R R amp Gent C A (2003) Imaging spectroscopy Earth and planetary
remote sensing with the USGS Tetra order and expert systems Journal of
Geophysical Research E Planets 108(12) httpsdoiorg1010292002je001847
Des Marais D J Harwit M O Jucks K W Kasting J F Lin D N C Lunine J I
Schneider J Seager S Traub W A amp Woolf N J (2002) Remote sensing of
DHARAIYA A Remote sensing
Prithivya | August 2021 57
planetary properties and biosignatures on extrasolar terrestrial planets Astrobiology
2(2) 153ndash181 httpsdoiorg10108915311070260192246
Dharaiya A (2020a)Monitoring and assessment of forest ecosystem using geospatial
technology A case study of Jambughoda wildlife sanctuary Gujarat India Poster
presented at ISRS National Symposium-2020
Dharaiya A (2020b) Habitat Analysis of Girnar Wildlife Sanctuary using Geospatial
Techniques Paper presented at National Map Competition GIS Day-2020
Dharaiya N Bhati R and Patel J (2021) Ecological studies on selected wetlands of Patan
district to prepare management plan for long-term conservation Technical Report
WCB Research Foundation Patan 91Pp
Feng X He L Cheng Q Long X amp Yuan Y (2020) Hyperspectral and multispectral
remote sensing image fusion based on endmember spatial information Remote
Sensing 12(6) 1ndash17 httpsdoiorg103390rs12061009
Fingas M F amp Brown C E (1997) Review of oil spill remote sensing Spill Science and
Technology Bulletin 4(4) 199ndash208 httpsdoiorg101016S1353-2561(98)00023-1
Frey H Machguth H Huss M Huggel C Bajracharya S Bolch T Kulkarni A
Linsbauer A Salzmann N amp Stoffel M (2014) Estimating the volume of glaciers
in the Himalayan-Karakoram region using different methods Cryosphere 8(6) 2313ndash
2333 httpsdoiorg105194tc-8-2313-2014
Gantayat P Kulkarni A V amp Srinivasan J (2014) Estimation of ice thickness using
surface velocities and slope Case study at Gangotri Glacier India Journal of
Glaciology 60(220) 277ndash282 httpsdoiorg1031892014JoG13J078
Jiyang Chen amp Ohmura A (1990) Estimation of Alpine glacier water resources and their
change since the 1870s Hydrology in Mountainous Regions I 5(193) 127ndash135
Joseph G (2005) Fundamentals of Remote sensing 2e Orient Blackswan 2Rev ed Pp i-
xi 1-486
DHARAIYA A Remote sensing
Prithivya | August 2021 58
Kulkarni A V Srinivasulu J Manjul S S amp Mathur P (2002) Field based spectral
reflectance studies to develop NDSI method for snow cover monitoring Journal of
the Indian Society of Remote Sensing 30(1ndash2) 73ndash80
httpsdoiorg101007BF02989978
Lillesand T Kiefer R Chipman J (2015) Remote sensing and Image interpretation 7e
John Wiley amp sons Inc Pp 1-736
Merritt A J Chambers J E Murphy W Wilkinson P B West L J Gunn D A
Meldrum P I Kirkham M amp Dixon N (2014) 3D ground model development for
an active landslide in Liasmudrocks using geophysical remote sensing and
geotechnical methods Landslides 11(4) 537ndash550 httpsdoiorg101007s10346-
013-0409-1
Navalgund R Jayaraman V Roy P (2007) Remote sensing applications An overview
Current Science 93(12) 1747-1766
Pratibha S amp Kulkarni A V (2018) Decadal change in supraglacial debris cover in Baspa
basin Western Himalaya Current Science 114(4) 792ndash799
httpsdoiorg1018520csv114i04792-799
Ray S (2013) Basics of Remote Sensing Remote Sensing Image Analysis Including the
Spatial Domain 1ndash15 httpsdoiorg1010071-4020-2560-2_1
Remya S N Kulkarni A V Pradeep S amp Shrestha D G (2019) Volume estimation of
existing and potential glacier lakes Sikkim Himalaya India Current Science 116(4)
620ndash627 httpsdoiorg1018520csv116i4620-627
Shandilya K K Shukla S P amp Pathak V (2013) Applications of Remote sensing
Horizons of Earth sciences Vol 10 1ndash12
Shepard M K Campbell B A Bulmer M H Farr T G Gaddis L R amp Plaut J J
(2001) The roughness of natural terrain A planetary and remote sensing perspective
Journal of Geophysical Research E Planets 106(E12) 32777ndash32795
httpsdoiorg1010292000JE001429
DHARAIYA A Remote sensing
Prithivya | August 2021 59
Stead D Donati D Wolter A amp Sturzenegger M (2019) Application of remote sensing
to the investigation of rock slopes Experience gained and lessons learned ISPRS
International Journal of Geo-Information 8(7) httpsdoiorg103390ijgi8070296
Yacouba D Guangdao H amp Xingping W (2010) Applications of Remote Sensing in
Land UseLand Cover Change Detection in Puer and Simao Counties Yunnan
Province Report and Opinion 2(9) 7ndash16
Zheng B Campbell J B Serbin G amp Galbraith J M (2014) Remote sensing of crop
residue and tillage practices Present capabilities and future prospects Soil and
Tillage Research 138 26ndash34 httpsdoiorg101016jstill201312009
Types of resolution used in remote sensing
httpwwwedcuriedunrsclassesnrs409rslectureshowremotesensonworkpdfacce
ssed on 24th April 2021
Components of remote sensing ndash Scattering and absorption httpswwwnrcangccamaps-
tools-publicationssatellite-imagery-air-photosremote-sensing-
tutorialsintroductioninteractions-atmosphere14635accessed on 24th April 2021
Basic concepts of Electromagnetic radiation and
spectrumhttpgsphumboldteduOLMCoursesGSP_216_Onlinelesson1-
2spectrumhtmlaccessed on 24th April 2021
Concept of spectral indices httpswwwl3harrisgeospatialcomdocsspectralindiceshtml
accessed on 25th April 2021
Suggested citation
Dharaiya A (2021) Remote sensing and An overview with fundamentals and applications
Prithivya An Official Newsletter of WCB Research Foundation and WCB Research Lab Vol 1(2)
44-59
M I PATEL AWARD 2021
Prithivya | August 2021 60
M I Patel Award for Young Wildlife amp Conservation Biologist
Nominations for 2021 Award
Ms Shivangi Mishra
Shivangi is a Senior Research Fellow (Basic Scientific
Research Fellow UGC) at University of Lucknow and is
currently working on Egyptian Vultures She has also
worked on Butterflies of Uttar Pradesh from 2014- 2016
She has presented her research on Egyptian Vultures in
Conference of Raptor Research Foundation in 2018
(South Africa) 2019 (USA) and awarded with William C
Andersen Award and James Koplin Award respectively In
future also she wants to contribute her research for the
conservation of Egyptian Vultures in India
Dr Tarang Kumar Shah
Tarang is an Assistant Professor in Fisheries polytechnic at
Dau Shri VasudevChandrakarKamdhenuVishwaVidyalaya
Durg He studied the Effect of Thymus linearis plant
Extract on Growth Performance and Non-Specific Immune
Responses of endangered Golden Mahseer (Tor
putitora)against the disease caused
byOomycetesSaprolegniaparastica He found that the leaf
extract of Thymus plant has the antifungal properties and a
small quantity of which can control the population against
saprolegniosis
Dr Sujit Kolangath
Sujit is a subject specialist in animal biotechnology at
Wildlife Research amp Training Center Gorewada Nagpur
He studied the qualitative and quantitative aspect of
hepatoozoonfelis epidemiology in a tiger cub He reported
that the infection is transmitted by ingestion of infected
ticks infected prey and carrion and concurrent infection
with bacterial or viral infections may be fatal to the
infected animal
M I PATEL AWARD 2021
Prithivya | August 2021 61
Ms Jis Sebastian
Jis recently completed her doctoral research in Botany
from Madurai Kamraj University Madurai- Tamil Nadu
She is studying the pattern of diversity spatial distribution
and community structure of epiphytic orchids of southern
Western Ghatsresponds to availibility of
microenviornments (Microhabitat supported by
Microclimates) in the structurally diverse trees There for
Conservation of epiphytic orchids would ensure
conservation of old aged natural structurally complex
trees in the forest ecosystem
Dr Harshil Patel
Harshil is a naturalist working mainly on systematics and
taxonomy of reptiles and amphibians He studied the
amphibians amp reptiles of northern Western Ghats of
Gujarat He found a new Miocene divergent endemic
lineage of a racer snake evolutionary history of an
endemic snake resulted in the resurrection of a genus
reinvestigation of a gecko species complex that resulted
into the discovery of two new species
The final round including the presentation by the nominees followed by the award
ceremony will be conducted on September 27 2021 at M N College Visnagar (Gujarat)
WCB and the M I Patel Award committee congratulate all the nominees and wishing all
the best for their presentation
Applications and nomination for the 2022 awards are now open through our website
(wwwwcbresearchin) till June 30 2022
ANNOUNCEMENT
Prithivya | August 2021 62
ANNOUNCEMENT
Prithivya | August 2021 63
WINNERS OF MANGROVE DAY POSTER
COMPETITION
Prithivya | August 2021 64
WCB Research Foundation with K J Somaiya College Mubai have organized Digital and
Handmade Posters Competition on the occasion of World Mangrove Day July 26 2021 Out
of entries of thirty participants three best posters were selected by the committee and
awarded
Posters of Winners
1st Prize Digital Poster Ms Yukta Sawant
WINNERS OF MANGROVE DAY POSTER
COMPETITION
Prithivya | August 2021 65
1st Prize Digital Poster Ms Yukta Sawant
1st Prize Handmade Poster Ms Tanya Sawardekar
WCB RESEARCH FOUNDATION GOVERNING COUNCIL
Prithivya | August 2021 66
Governing Council of WCB Research Foundation
Executive
Director
Dr Hardik Patel Assistant Professor
Parul University Vadodara
phardik80gmailcom
Director of
Research
Dr Nishith Dharaiya Associate Professor
HNG University Patan
nadharaiyanguacin
Member Dr Sagarika Damle Associate Professor amp Head
Department of Life Sciences KC College Mumbai
sagarikadamlekccollegeeduin
Member Dr Nuria Selva Associate Professor
Institute of Nature Conservation
Polish Academy of Science Krakow Poland
nuriaselvagmailcom
Member Mr Pratik Desai Jr Research Fellow
WCB Research Lab Patan
pratikdesai825gmailcom
Member Mr M S Patel Associate Professor
M N College Visnagar martinleemsgmailcom
Member Dr Haresh Gondaliya Assistant Professor
Shri G D Modi Science College Palanpur hareshgondliya55gmailcom
Member Mr Prasad Patil Range Forest Officer
Gujarat Forest Department jalu1890gmailcom
Member Ms Madhuri Padaya Assistant Professor
K J Somaiya College of Science Mumbai padayamadhuriyahoocom
Member Dr Jagruti Rathod Director
Center for Nature amp Ecosystem Wellbeing Vadodara
rathod21gmailcom
Member
Secretary
Ms Jahnvi Patel Admin Officer
WCB Research Foundation Patan
adminwcbresearchin
Page 1 of 7 Pruthivya An official newsletter of WCB Research Foundation
Guidelines to authors and contributors 1 | P a g e
Instructions for authors
Scope Prithivya is a tri-annual newsletter of WCB Research Foundation and will
publish manuscripts on wildlife conservation biology and its allied areas
Guidelines to contributors of Prithiviya
Manuscript Types Prithiviya publishes original research articles short notes
field notes reviews and comments Submissions should be in English (UK) only
All manuscripts should be easy to read and comprehend Manuscripts may be
edited for length content and style and be sent to referees when found to be
appropriate The editor will discuss contributions with authors and advise to
modified whenever required
Submission is considered on the condition that papers are previously
unpublished have not been offered simultaneously elsewhere and that all
contributors have read and approved the contents
The editor will acknowledge manuscript contributions and assign them a unique
registration number which latter must be quoted in correspondence Papers are
peer-reviewed although the editor reserves the right to reject one without a
review
Preparation and submission of manuscripts
1 Title page Add full title Authors name and affiliation with email of all the Authors Abstract (250 Words) and Key words (4-5)
2 Submitted manuscripts should generally follow the normal convention of
scientific manuscripts keywords generally not appearing in the title
Introduction Materials and Methods Results and Discussion
Acknowledgments Authors contribution (optional) Appendices (optional) and
References) with the replacement or addition of sections allowed in between
the Introduction and the Acknowledgments
3 The manuscript should be typed in MS Word with left-aligned typesetting and
only true type fonts (Times new roman preferable) should be used The line
spacing must be 15 and the font size of 12 Headings should be bold and sub-
headings should be made italicized
Page 2 of 7 Pruthivya An official newsletter of WCB Research Foundation
Guidelines to authors and contributors 2 | P a g e
4 Title A concise informative and attractive and short title with 5-20 words will
be encouraged
5 Abstract Word limit for the abstract is 250 words and should contain a
summary of all major findings or conclusions of the study however abstract
is not required in case of short notes field notes and other short
communication
6 Introduction should be clearly written and must covering the objectives and
significance of the study
7 Methodology A detailed methodology is always encouraged The methodology
should contain the study area (if applicable) data collection analysis and
interpretation Authors should also mention the instruments software used
for the experiments and analysis
8 Result and discussions which contain main result with proper references
and authentic justifications include graph table photographs (No checklist
it directly goes into appendix or supplementary data)
9 Conclusions A short and comprehensive conclusion with significant novel
findings and depicting your research in a nut-shell
10 Acknowledgments which contain all funds support persons who help
during project or research or findings name of university other than they work
etc
11 Checklist-based papers like trip reports should contain dates of the trip total
number of birders or participants Mammals reptiles amphibians
invertebrates etc
12 Manuscripts should be sent electronically as an email attachment to the
Editorial Assistant with a cover letter to helliphellip
13 The text tables figurephotograph captions (which must be self-explanatory)
and appendices should be combined in one Microsoft Wordreg (ldquodocrdquo OR
ldquodocxrdquo) file format The preferred font is lsquoTimes New Romanrsquo in 12 point
14 Photographs artwork maps (the outlines of the Republic of India should
conform to Government of India regulations) diagrams etc should be
digitized and sent separately along with the manuscript or if they are large
Page 3 of 7 Pruthivya An official newsletter of WCB Research Foundation
Guidelines to authors and contributors 3 | P a g e
files in separate trailing e-mails These should be in TIFF and at least 8times11
inches in 300 dpi resolutions JPEG files must be lsquomaximumrsquo quality ie at
their minimum compression Maps should be marked with a scale and North
arrow and should carry a clear caption
15 Authors whose work involves the handling of any necessary permissions from
the requisite government agencies to do so The editor reserves the right to
view such permissions at herhis discretion
16 While photographing nestingcourtship display or any behavioural activity
including those of nests eggs courtship etc authorsphotographers must
ensure the safety of the animals involved and also ensure that they do not
disturb in any way whatsoever in the course of their photography The editor
reserves the right to view permissions for such activities within protected
areas The editorreferee reserves the right to query an author regarding the
ethics of photography and the methodology followed while photographing
including that of rejecting a manuscript if unsatisfied on these counts
Types of Manuscript
1 Short Research articles 2000 to 2500 words
2 Short notes Up to 1500 words
3 Important sightings 250-350 words with proper GPS location and
photographic evidence
4 Important findings 250-500 words with proper GPS location with image
5 Full-length Research paper Up to 10000 words with appendix excluding
photographs only
Other important Guidelines
Scientific binomials should comprise the generic and specific names but should
not include the name of the author and year of citation Scientific trinomials
should be mentioned only if the nature of the manuscript requires them
For example both the English and scientific name must be given thus ldquoHouse
Crow Corvus splendensrdquo thereafter only the English name ldquoHouse Crowrdquo will
suffice English and scientific names should follow the proper book that should
be mention in reference and title of the table
Page 4 of 7 Pruthivya An official newsletter of WCB Research Foundation
Guidelines to authors and contributors 4 | P a g e
Metric units and their international symbols must be used eg ldquosq kmrdquo and
ldquo1000 m aslrdquo dates and times should be of the form of MMDDYYYY (January
01 2021rdquo and ldquo1345 hrdquo respectively
Tables should be within gridlines (which may or may not be printed) Tables
should never be formatted with wrap-around text
Latitude and longitude coordinates should follow the format ldquo27807ordmN
74094ordmErdquo
Enzyme Nomenclature The trivial names recommended by the IUPAC-IUB
Commission should be used When the enzyme is the main subject of a paper
its code number and systematic name should be stated in its first citation in the
paper
Symbols and Abbreviations Use only standard abbreviations The use of non-
standard abbreviations can be extremely confusing to readers Avoid
abbreviations in the title The full term for which an abbreviation stands should
precede its first use in the text unless it is a standard unit of measurement
Page number (page 1 0f 10 formats) must be on top right corner of the word
documents font size 10 and times new roman word type
Citation and References Prithivya encourages the authors to use Mendely EndNote or other reference management tools for proper citations We follow APA referencing style
Do not abbreviate references pagination should be given in the expanded form
eg ldquoindashvi 1ndash250rdquo not ldquovi 250rdquo the page numbers should be separated by an
lsquoEnrsquo dash
Italics should be used for book titles but not volume numbers when citing
periodicals use italics for the journal name not the article title
References should be arranged alphabetically by the first author (and in the case
of more than one author by second and subsequent authors)
Citations to references in the text should follow the style ldquo(Santharam 1978)rdquo
ldquo(Barua amp Sharma 1999)rdquo ldquo(Pande et al 2002)rdquo ldquo(Lainer 1999 2004)rdquo ldquo(Lainer
1999abcd Lainer 1999a 2000a)rdquo [for several papers by an authors from
Page 5 of 7 Pruthivya An official newsletter of WCB Research Foundation
Guidelines to authors and contributors 5 | P a g e
amultiple calendar years] and ldquo(Neelakantan et al 1993 Sashikumar et
al 2011)rdquo
A string of citations in the text should follow a chronological not an alphabetical
order thus ldquo(Ali amp Ripley 1981 Kazmierczak 2000 Grimmett et al 2011)rdquo
When citing unpublished sources please use the following formats if the source
is written material ldquo(Harkirat Sangha in litt e-mailletter dated 02 January
2013)rdquo if oral ldquo(Rajah Jayapal verbally dated 15 December 2013)rdquo
When citing from e-Bird or any other magazine checklist please enter the author
of the e-Bird checklistrsquos name or others name and the year the checklist was
uploaded in the text ldquo(Raman 1994)rdquo If a checklist thatrsquos shared amongst
multiple observers is being referred to only the relevant checklist(s) should be
used for citation
See examples below for detailed formatting
Journal articles
Pittie A 2011 The dates of seven new taxa described by W E Brooks (Certhia
Hodgsoni Sitta Cashmirensis Dumeticola
major Horites [sic] Pallidus Phylloscopus Tytleri Motacilla Cashmirensis
and Alauda Guttata) Prithiviya7 (2) 54ndash55
Naoroji R amp Sangha H S 2011 Threats to habitat and wildlife in Changthang
and Rupshu areas of Ladakh a case study at Hanle Prithiviya7 (1) 2ndash6
Choudhary D N Mandal J N Mishra A amp Ghosh T K 2010 First ever
breeding record of Black-necked Stork Ephippiorhynchus asiaticus from
Bihar Prithiviya6 (3) 80ndash82
Books
Futehally Z (ed) 2006 India through its birds 1st ed Bangalore India
Dronequill Publishers Pvt Ltd Pp indashii 1ndash214
Pittie A 2010 Birds in books three hundred years of South Asian ornithologymdash
a bibliography 1st ed Ranikhet Permanent Black Pp indashxxi 1ndash845
Sashikumar C Praveen J Palot M J amp Nameer P O 2011 Birds of Kerala
status and distribution 1st ed Kottayam Kerala DC Books Pp 1ndash835 Book chapter
Pittie A 2011 Stray Feathers (1872ndash1899) (p 247) In Priority The dating of
scientific names in ornithology a directory to the literature and its
Page 6 of 7 Pruthivya An official newsletter of WCB Research Foundation
Guidelines to authors and contributors 6 | P a g e
reviewers Dickinson E C Overstreet L K Dowsett R J amp Bruce M D
(eds) Northampton UK Aves Press Limited Website
2013 Kadalundi makes history with new gull species The
Hindu (Thiruvananthapuram ed) dated February 7 2013
Website httpwwwthehinducomtodays-papertp-nationaltp-
keralakadalundi-makes-history-with-new-gull-speciesarticle4388171ece
[Accessed on 21 July 2014] Any magazine checklist
Raman T R S 1994 Website
URL httpebirdorgebirdviewchecklistsubID=S21694571 [Accessed on
15
December 2015]
ETHICAL MATTERS Authors involving in the usage of experimental animals and human subjects in their
research work should seek approval from the appropriate Institutional Animal Ethics
Committee in accordance with Principles of Laboratory Animal Care The material
and methods section of the manuscript should include a statement to prove that the
investigation was approved and that informed consent was obtained
Disclaimer
While every care is taken of manuscripts and their accompanying
material Prithiviya cannot be held responsible for accidental loss or damage of
any material sent for publication or for their return whether they are accepted
for publication or not
Material published in Prithiviya reflects the views of the authors and not
necessarily those of the publishers editors referees etc
The editor reserves the rights to make necessary changes in manuscripts in
consultation with the author
All submissions are evaluated under the assumption that the conditions listed here have been understood and accepted by the author(s)
Submission fees There will be no submission fees for e-publication however we
may produce the reprints on request and on payment basis
Page 7 of 7 Pruthivya An official newsletter of WCB Research Foundation
Guidelines to authors and contributors 7 | P a g e
Special announcements
We also accept announcement of workshop webinar conference symposium job
opportunities academic courses etc with nominal charges and guarantee for its
wider circulation
Contacts Editor in Chief Dr Sagarika Damle Emailvisaanikagmailcom Associate Editors Dr Nishith Dharaiya
Email nadharaiyagmailcom Dr Jagruti Rathod Email rathod21gmailcom Editorial Assistant Ms Rinku Bhati
Email bhatirinku178gmailcom
WCB Research FoundationAdding Science to Conservation
wwwwcbresearchin
- 001_Cover Page
- 002_Editorial Board_2
- 003_Table of Contents_Issue 2
- 004_Editorial and Directors Column
- 005_Chaudhary and Desai 1-3
- 006_Dave 4-11
- 007_Amin et al 12-17
- 008_Thakkar and Gohil 18-21
- 009_Marjadi 22-23
- 010_Patel and Patel 24-27
- 011_Pithva and Dharaiya 28-36
- 012_Panchal and Jha 37-43
- 013_Dhaaraiya 44-59
- 014_MI Patel Award Nominee 60-61
- 015_Announcements 62-63
- 016_Posters Competition Winners 64-65
- 017_ WCB Council and Board 66
- 018_Prithiviya_Guidelines Final
- 019_Last page
-
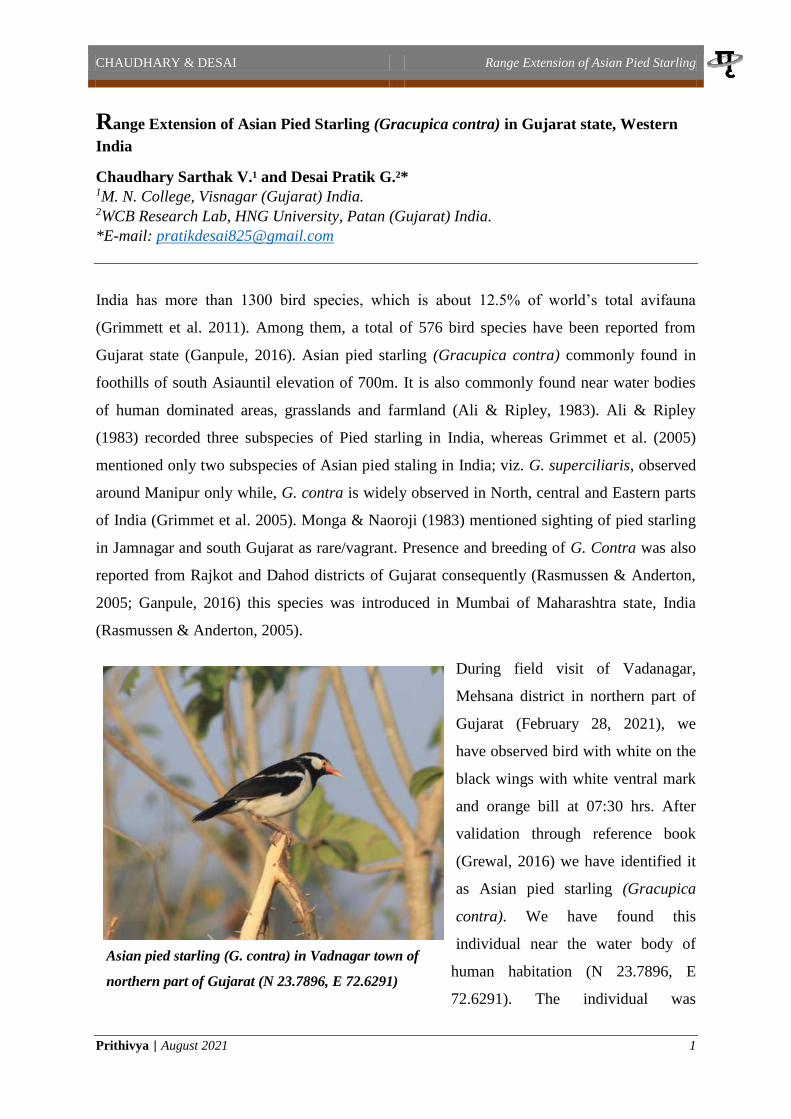
CHAUDHARY amp DESAI Range Extension of Asian Pied Starling
Prithivya | August 2021 3
References
Ali S amp Ripley SD 1986 Handbook of the bird of India and Pakistan (Vol 5- Lark to
Grey Hypocolius) Oxford University Press
Grimmett R Inskipp C amp Inskipp T (2005) Birds of Indian Subcontinent Oxford
university press Pp 402-403
Grewal B 2016 A Pictorial Field Guide to Birds of India Pakistan Nepal Bhutan Sri
Lanka and Bangladesh India Om Books International
Monga S G amp Naoroji R K 1983 Birds of the Rajpipla forests ndash SouthGujarat With
notes on nests found and breeding recorded andsome new observations JBNHS 80
(3) 575-612
Rasmussen P C amp Anderton J C 2005 Birds of South Asia The Ripley guide
Washington DC amp Barcelona Smithsonian Institute amp Lynx Edition
Ganpule P 2016 The birds of Gujarat Status and distribution Flamingo 8(3) 2_40
Suggested citation
Chaudhary SV and Desai PG (2021) Range Extension of Asian Pied Starling (Gracupica contra)
in Gujarat state Western India Prithivya An Official Newsletter of WCB Research Foundation
and WCB Research Lab Vol 1(2) 1-3
DAVE D Nesting pattern of different bird species
Prithivya | August 2021 4
Observationson nesting pattern of different bird species around University road
Rajkot
Dave Deepali ldquoAnjaneyrdquo Sanjay vatika 8 Neel city club campus NearSaurashtra University Rajkot-
3640005(Gujarat) India
E-mail deepalidave955gmailcom
The dense vegetation near Saurashtra university circle provided a preferable avifaunal habitat
(Trivedi amp Vaghela 2020) This helped in the study of Avifaunal nesting sites in the urban
area of Rajkot (22deg17737N 70deg445388E 22deg171026N 70deg444403E 22deg17238N
70deg444514E 22deg165827N 70deg445231E) Gujarat A 2hours study was conducted while
exploring the area 2km away from my residence in the morning for a week in May 2021 Up
to 33 Avifaunal species and seven nesting sites were reported The nesting sites reported
during the survey were of Black Drongo (Dicrurusmacrocercus) Eurasian collared Dove
(Streptopeliadecaocto) Indian Thick knee (Burhinus indicus) Shikra (Accipiter badius)
Rufous Treepie (Dendrocittavagabunda) Red wattled Lapwing (Vanellus indicus) and Cattle
egret (Bubulcus ibis)
Figure 1 Detailed Map of Study area
DAVE D Nesting pattern of different bird species
Prithivya | August 2021 5
Point1 from the above figure indicates my residence where fieldwork was started Based on
vegetation and human disturbance the study area was divided into two parts Sub-urban Area
and Rural Area Point 7 and 8 indicates plantations done by the Saurashtra University The
line transect method was used for the field survey Images were captured with the help of
Canon 1200D 55-250 mm lens
Figure 2(a) Figure 2(b)
Figure 2(c) Figure 2(d)
Figure 2 Different photographs of saurashtra university plantation area (Study Area)
Black Drongo (Dicrurusmacrocercus)
The nesting season for Black Drongo is April to August with 3-4eggs as clutch size and 14-
15days incubation period The nest of Black drongo was observed at Point 8 (22deg17737N
70deg445388E) in the plantation site of Saurashtra University It is about 9 to 10 feet high
from ground level and built with twigs rootlets and threads Drongo is known to be a
protective parent and its mobbing behaviour towards Greater Coucal (Centropus sinensis)
Rose-ringed Parakeet (Alexandrinuskrameri) and Asian Koel (Eudynamysscolopaceus) were
DAVE D Nesting pattern of different bird species
Prithivya | August 2021 6
observed during the survey (Nijman 2004) Interspecies interaction between Eurasian
Collared-Dove and Black Drongo was observed during the survey and in previous studies
(Jahan et al 2018) as well where two Eurasian collared Dove made nest near the nest of
Black Drongo Usually birds like Dove do not cause any harm to Drongo Feeding gills for
both species is different as well (Ali 2017 Grimmettet al 2011) Therefore to protect their
eggs from other predators Dove makes their nest in the vicinity of Drongorsquos nest
Figure 3 (a) Figure 3 (b)
Eurasian collared Dove (Streptopeliadecaocto)
The nesting season for Eurasian collared Dove is throughout the year The nest was
observed at Point 8 in the plantation site
of Saurashtra University (22deg17737N
70deg445388E) It was made with twigs
and rootlets at 8-9feet height The clutch
size is 1-2 (Robertson 1990) and
incubation period of eggs is 15-19 days
Within a distance of 3 meters two nests
of Eurasian collared Dove were found
Both nests were in the vicinity of Black
Drongorsquos nest Itrsquos a great example of
species-species interaction By making
nests nearby aggressive Drongorsquos nests
Figure 4 A photograph presenting the nest
of Eurasian collared Dove
(Streptopeliadecaocto) Detailed Map of
Study area
Figure 3 Photographs presenting nest of Black Drongo (Dicrurusmacrocercus)
DAVE D Nesting pattern of different bird species
Prithivya | August 2021 7
Dove could gain protection from other predator species (Jahan et al 2018)
Indian Thick-knee (Burhinus indicus)
Indian Thick-knee is also known as Indian Stone curlew Its nest was found at Point 8 in the
plantation site of Saurashtra University (22deg17737N 70deg445388E) The breeding season
is from March to April The nest was made on the ground surrounded by dead leaves and few
twigs The clutch size for stone curlew is two (Sharma amp Sharma 2015) with incubation
period around 24 days While exploring the study area one egg and one hatchling were
observed which were wonderfully camouflaged with the colour of the ground The egg was
off-white coloured with random brown spots on it At the end of May 2021 another egg was
found broken Both male and female are involved in caring and protecting the hatchlings
against predators (Sharma amp Sharma 2015)
Figure 5 (a) Nest with hatchling and egg Figure 5 (b) Egg
Figure 5 (c) Hatchling Figure 5 (d) Adult Indian Thick-knee
Figure 5 Different photographs of Indian Thick-knee (Burhinus indicus) presenting
developmental stages
DAVE D Nesting pattern of different bird species
Prithivya | August 2021 8
Shikra (Accipiter badius)
The nesting season for Shikra is March to June Shikrarsquos nest was found at Point 8
(22deg171026N 70deg444403E) in the
plantation site of the Saurashtra
University The nest built with twigs
and rootlets at 20feet height from
ground level was observed on the
tallest tree The clutch size for the
Shikra is 3 to 4 eggs with 18-21days
incubation period Usually females
hatch the eggs but in rare cases males
hatch eggs as observed by
Suryawanshi (2021) During the
survey female Shikra was observed
chasing Large-grey Babbler (Argyamalcolmi)
Rufous Treepie (Dendrocittavagabunda)
The breeding season for Rufous Treepie is April to June and with clutch size 3-6eggs
At Point 8 of Saurashtra University plantation site (22deg17737N 70deg445388E) two to three
individuals of Rufous Treepie were seen
Figure 6 A photograph of Adult female Shikra
(Accipiter badius) and her nest
Figure 7 Adult Rufous treepie (Dendrocitta vagabunda) and her nest
DAVE D Nesting pattern of different bird species
Prithivya | August 2021 9
One of them was seen carrying food material while the other was collecting the nesting
materials A single nest of Rufous Treepie was observed and was built with twigs dead
leaves threads old clothing material rootlets and cotton The nest was found at a height of
approximately 20 feet On May 16th 2021 Rufous Treepie was seen feeding juvenile Koel
After a few days another Rufous Treepie was found hatching the eggs
Red-wattled Lapwing (Vanellus indicus)
Breeding season for Red-wattled Lapwing is April to June The egg or nest was not part of the
observation however a juvenile was observed at Point 3 of the Sub-urban area (22deg17238N
70deg444514E) A survey was conducted in May and the eggs might be laid during April The
clutch size is 3 to 4 with an incubation period of 28-30 days The nesting of this bird has no
protection strategies other than camouflaging the eggs with the surroundings to protect those
(Balkhande et al 2017)
Figure 8 (a) Juvenile Red-wattled Lapwing Figure 8 (b) Adult Red-wattled Lapwing
Figure 8 Photographic presentation of juvenile and adult Red-wattled Lapwing (Vanellus
indicus)
Cattle Egret (Bubulcus ibis)
The breeding season for Cattle Egret is June to August Between Point 5 and 6
(22deg165827N 70deg445231E) ten to twelve Cattle Egret nests were found and Egrets
were observed in their breeding plumage During their breeding season adults develop
orange buff plumage on the back breast and crown area Cattle Egrets from their nest in
DAVE D Nesting pattern of different bird species
Prithivya | August 2021 10
colonies Rootlets and twigs are used to build nests Clutch size for Cattle Egret is 2-4 and
the incubation period is between 22-28 days (Patankar et al 2007)
Fig 9 (a) Fig 9 (b)
Figure 9 Cattle egrets (Bubulcus ibis) and their colony
Acknowledgements
I would like to express my gratitude to DrJagruti Rathod for guiding and inspiring me
throughout my study I would also like to thank all the members of WCB Research
Foundation for organizing this internship program and giving me a chance to expand my
knowledge
References
Ali (2017) The Bookof Indian Birds Bombay Natural History Society ISBN 8173714851
Ali Hadjela amp Hassan Syed amp Rana Shahnaz amp Beg Mirza amp Mahmood-ul-Hassan
Muhammad (2007) Brood parasitism of Asian koel (Eudynamys scolopacea) on the
house crow (Corvus splendens) in Pothwar region of Pakistan Pakistan Journal of
Agricultural Sciences 44 627
Balkhande Dr Jayvardhan (2017) Study of Nesting pattern and breeding Biology of Red-
Wattled Lapwing Vanellus Indicus in agricultural field near to Asna River bridge
Nanded (Maharashtra) Research maGma An International Multidisciplinary Journal
ISSN NO- 2456-7078 VOL-1 ISSUE-6 AUG-2017
Grimmett et al (2011) Birds of Indian Subcontinent Helm field guides
ISBN 9781408127636
DAVE D Nesting pattern of different bird species
Prithivya | August 2021 11
Jahan I Begum S Feeroz M M Das D K amp Datta A K (2018) Nesting pattern of
birds in Jahangirnagar University Campus Bangladesh Journal of Threatened Taxa
10(5) 11618ndash11635 httpsdoiorg1011609jot279910511618-11635
Nijman V (2004) Seasonal variation in naturally occurring mobbing behaviour of drongos
(Dicruridae) towards two avian predators Ethology Ecology and Evolution 16(1)
25ndash32 httpsdoiorg1010800892701420049522651
Patankar Pratyush amp Desai Isha amp Shinde Kavita amp Balakrishnan Suresh (2007) Ecology
and breeding biology of the Cattle Egret Bubulcus ibis in an industrial area at
Vadodara Gujarat Zoos Print Journal 22 1011609JoTTZPJ15662885-8
Robertson H A (1990) Breeding of collared doves streptopelia decaocto in rural
oxfordshire england Bird Study 37(2) 73ndash83
httpsdoiorg10108000063659009477043
Sharma M amp Sharma R K (2015) Ecology and breeding biology of Indian stone curlew
(Burhinus indicus) Nature Environment and Pollution Technology 14(2) 423ndash426
Suryawanshi K 2021 Nesting behaviour and diet of Shikra Accipiter badius in Ajanta
Maharashtra Indian BIRDS 17 (2) XXndashXX
Trivedi V amp Vaghela S (2020) Avifauna of saurashtra university campus Rajkot Gujarat
India Journal of Threatened Taxa 12(13) 16764ndash16774
httpsdoiorg1011609jott5113121316764-16774
Suggested citation
Dave D (2021) Observations on nesting pattern of different bird species around university road
Rajkot Prithivya An Official Newsletter of WCB Research Foundation and WCB Research Lab
Vol 1(2) 4-11
AMIN ET AL Record of Leucism in Indian Flying Fox
Prithivya | August 2021 12
Record of Leucism in Indian Flying Fox Pteropus giganteus (Mammalia
Chiroptera Pteropodidae) from South Gujarat India
Amin Siddharth M1 Patel Hiren J2 and Vaghela Prashant P3
1 C129 Bhagyoday Society Opposite Sahyog Police chowki Gorwa Refinery Road
Vadodara - 390024(Gujarat) India 2Sardar Patel Zoological Park Kevadiya ndash 393151(Gujarat) India 3C-27 New Narmada Colony Chhani Jakatnaka Vadodara - 390024(Gujarat) India
E-mail hirenp9408gmailcom
Abstract
Leucism in fruit bat species Pteropus giganteus (Brunnich 1782) is recorded for the first
time from India based on photographic evidence collected from the Anaval Village located in
Surat District of South Gujarat India A total lack of pigmentation in the whole body due to
the failure of melanocytes to migrate to the skin and hair follicles resulting in white or
whitish hairs pale skin but normal coloured eyes are the sign of leucism The present record
can serve as baseline data and will also help understand colour aberration in bats
Key Words Colour aberration Chiropteran Pigmentation Mutation
Introduction
The Indian Flying Fox is one of the most common and widely distributed chiropterans found
in India Pakistan Sri Lanka Bhutan Nepal Bangladesh Maldives Myanmar and China
(Tsang 2020 Johnsingh amp Manjrekar 2013 Srinivasulu amp Srinivasulu 2012) Flying Fox is
the largest fruit bat known to occur on mainland India (Bates et al 1994) out of 13 Indian
fruit bat species (Bates amp Harrison 1997 Srinivasulu et al 2010) It has a reddish-brown
head with a darker sometimes
blackish snout pale brownish-
yellow shoulders and hindneck
yellowish-brown ventrally and
black wings (Prater 1971) It is
a colonial species and roosts
during the day often in the
midst of busy towns villages
on large trees along the
roadside near cropland and
water bodies (Bates et al 1994
Johnsingh amp Manjrekar 2013
Menon 2014) Their roosting
Figure 1 Leucistic individual roosting along with the
normal individuals
AMIN ET AL Record of Leucism in Indian Flying Fox
Prithivya | August 2021 13
colonies are generally found on large trees such as Ficus benghalensis F religiosa
Tamarindus indica Mangifera indica Dalbergia sissoo and Eucalyptus sp (Vendan 2003)
and the colony size can vary from hundreds to several thousands of individuals (Bastawade
amp Mahabal 1976) Although fruit bats are responsible for many ecological services (Saikia
2018) yet Indian Flying Fox is one of the most persecuted fruit bats in South Asia and is
listed as vermin under Schedule V of the Indian Wildlife (Protection) Act and IUCN Red List
Data included it as a Least Concern species (Tsang 2020)
In mammals a wide variety of colours and forms are found as a result of the presence of
certain pigments mostly melanin which provides colour to the skin hairs and eyes
(Nordlund et al 1998 Uieda 2000 Lucati amp Loacutepez Baucells 2016) Often this pigment is
affected as a result of mutations giving rise to diverse colour aberrations The effect of such
abnormal colouration is generally the pigmentation anomalies of chromatic disorders (Rook
et al 1998) Similar to other mammals bats are also vulnerable to genetic disorders that
affect pigmentation Globally such chromatic disorders are being reported at an increasing
rate in bats (Lucati amp Loacutepez Baucells 2016) and are caused by either an increase or a
decrease in the production of melanin in some regions or over the entire body (Hofreiter amp
Schoneberg 2010 Abreu et al 2013) These include albinism leucism piebaldism
hypomelanism and melanism (Lucati amp Loacutepez Baucells 2016) Among these conditions
leucism stands out as a rare phenomenon in nature
Leucism is a total lack of pigmentation in the whole body due to the failure of melanocytes to
migrate to the skin and hair follicles resulting in white or whitish hairs pale skin but
normal coloured eyes It occurs regardless of the normal production of the enzyme tyrosinase
and melanin Moreover it can be caused by one of the several mutations that will give rise to
apparently similar phenotypes (van Grouw 2006 2013 Abreu et al 2013 Lucati amp
Loacutepez‐ Baucells 2016) The occurrence of colour aberration in 55 Indian mammalian species
has been compiled by Mahabal et al (2019) Although cases of albinism and piebaldism have
been reported in the family Pteropodidae (Neal 1971 Karim 1983 Anonymous 2012
Anonymous 2013) however there is no report on colour aberration in Indian Flying Fox
(Pteropus giganteus) Here we report the first case of leucism in Indian Flying Fox from
Surat district of South Gujarat India
AMIN ET AL Record of Leucism in Indian Flying Fox
Prithivya | August 2021 14
Observations
On 18 June 2017 we were on the way to Vansda National Park and at 1230 h we stopped as
we saw a group of Indian Flying Fox roosting on Ficus religiosa near Anaval Village
(20838degN 73263degE) in Surat District Gujarat Suddenly all the fruit bats flew in the sky as
a local was hunting them with the help of a catapult maybe for eating purposes In the
middle of all these at 1249 h a white bat flying in the sky grabbed our attention as it flew
further to roost on one of the branches with other Indian Flying Fox We took some
photographs (Figure 1) and observed with the help of binoculars to note down its
characteristics Its whole body ie both fur and skin were white or whitish including
patagium and ears but it had normal black coloured eyes With the help of the classification
proposed by Lucati amp Loacutepez Baucells (2016) we identified it as a case of leucism and not
albinism
The roosting colony had around 250 individuals and was situated near a village pond among
human habitation on the roadside We observed the leucistic individual at least for an hour
and also alerted the locals to cease hunting of bats The leucistic individual was probably a
female and showed similar activity as that of normal individuals such as opening and closing
of wings folding the wings around belly and grooming
Discussion
Although physiological causes of colouration including melanism are evident (Caro 2005)
the genetic processes responsible for these colour variations remain unknown in most
mammals (Lucati amp Loacutepez Baucells 2016) Moreover chromatic disorders in bats can affect
both fur and skin including patagium ears and muzzle and their impact on the survival rate
is vague (Lucati amp Loacutepez Baucells 2016) However bats are most likely less vulnerable to
predation than the majority of diurnal animals as they are active at night and prefer dark
roosting sites (Buys et al 2002 Rocha et al 2013) Lucati amp Loacutepez Baucells (2016) states
that aberrant individuals roosting in sheltered places such as caves mines and buildings
may have greater survival rates than the one roosting in the open leaves Here we found the
leucistic Indian Flying Fox roosting in the open leaves and is likely to be vulnerable to
predation
Albinism is one of the most commonly occurring colour aberrations in bats (Lucati amp Loacutepez
Baucells 2016) In the family Pteropodidae albinism has been reported in Cynopterus sphinx
AMIN ET AL Record of Leucism in Indian Flying Fox
Prithivya | August 2021 15
from Nepal (Anonymous 2013) Lissonycteris angolensis from Uganda (Neal 1971) and
Rousettus leschenaultia from India (Karim 1983) while piebaldism is reported in Rousettus
amplexicaudatus from Philippines (Anonymous 2012) However another such colour
aberration leucism is not yet reported from the family Pteropodidae In this regard our report
of leucism in Pteropus giganteus can be the first of its kind in the entire range of its
distribution
Today bats in India face the harsh reality of declining habitats and resources ultimately
making them disappear altogether (Graham 2001 Tsang 2020) and the peoplersquos perception
regarding the presence of bats in their surroundings for different myths These facts raise an
urgent need to protect bats throughout the world by studying more about their behaviour and
ecology Further studies on Pteropus giganteus from Gujarat are mainly sighting reports
(Mahato et al 2012) and on roosting sites (Vyas amp Upadhyay 2014) Due to the lack of
information on colour aberration in the family Pteropodidae this report can add importance
to bat biologists
Acknowledgement
We are thankful to Dhaivat Patel and Vivek Patel for assisting us in fieldwork
References
Abreu M S L Machado R Barbieri F Freitas N S amp Oliveira L R 2013 Anomalous
colour in Neotropical mammals a review with new records for Didelphis sp
(Didelphidae Didelphimorphia) and Arctocephalus australis (Otariidae Carnivora)
Brazilian Journal of Biology 73 185ndash194
Anonymous 2012 Monfort Bat Sanctuary Blanca Bella Website
httpwwwmonfortbatsanctuaryorgblanca-bellac12m [Accessed 20 October
2019] Anonymous 2013 SMCRF (Small Mammals Conservation amp Research
Foundation) Website httpwwwsmcrforgindexphp [Accessed 20 October
2019]
Bastawade D B amp Mahabal A 1976 Some behavioural aspects of the Indian flying fox
Pteropus giganteus giganteus Bio-Vigyanam 2 209ndash212
Bates P J J amp Harrison D L 1997 Bats of the Indian Subcontinent Harrison Zoological
Museum Publication UK 258pp
Bates P J J Harrison D L amp Muni M 1994 The bats of western India Part 1 JBNHS
AMIN ET AL Record of Leucism in Indian Flying Fox
Prithivya | August 2021 16
91 (2) 1ndash15
Buys J Heijligers H amp Dorenbosch M 2002 First record of an albino long-eared bat
Plecotus auritus in The Netherlands Lutra 45 49ndash52
Caro T 2005 The adaptive significance of coloration in mammals BioScience55 125ndash136
Graham G L 2001 Bats of the World St Martinrsquos Press New York New York
160pp Hofreiter M amp Schoneberg T 2010
The genetic and evolutionary basis of colour variation in vertebrates Cellular and Molecular
Life Science 67 2591ndash2603
Johnsingh A J T amp Manjrekar N (eds) 2013 Mammals of South Asia Volume 2
Universities Press (India) Private Limited Telangana India pp 545ndash547
Karim K B 1983 A note on an albino Rousettus leschenaulti Bat Research News 24 39ndash
40
Lucati F amp Loacutepez Baucells A 2016 Chromatic disorders in bats a review of pigmentation
anomalies and the misuse of terms to describe them Mammal review 47(2) 112ndash123
Mahabal A Sharma R M Patil R N amp Jadhav S 2019 Colour aberration in Indian
mammals a review from 1886 to 2017 Journal of Threatened Taxa 11(6) 13690ndash
13719 Mahato A K R Kumar V V amp Patel N 2012 Indian flying fox in
Hamirsir Lake Bhuj city needs conservation attention Current Science 103(4)
354ndash355
Menon V 2014 Indian mammals a field guide Hachette India pp 386 Tsang SM
2020 Pteropus giganteus (errata version published in 2021) The IUCN Red List of
Threatened Species 2020 eT18725A194134899
httpsdxdoiorg102305IUCNUK2020-3RLTST18725A194134899en
Downloaded on 10 April 2021
Neal E 1971 Uganda Quest Collins London UK
Nordlund J J Boissy R E Hearing V J King R A Oetting W S amp Ortonne J P
(Eds) 1998 The pigmentary system physiology and pathophysiology Oxford
University Press New York
Prater S H 1971 The Book of Indian Animals (Revised) Bombay Natural History Society
Bombay pp 200ndash201
Rocha P A Feijo J A Donato C R amp Ferrari S F 2013 Leucism in Sebarsquos short-
tailed bat Carolliaperspicillata (Linnaeus 1758) from a rock shelter in northeastern
AMIN ET AL Record of Leucism in Indian Flying Fox
Prithivya | August 2021 17
Brazil Chiroptera Neotropical 19 1151ndash1153
Rook A Wilkinson D S Ebling F J B Champion R H amp Burton J L 1998
Textbook of Dermatology 6th edn Blackwell Science Boston Massachusetts USA
Saikia U 2018 A review of chiropterological studies and a distributional list of the
bat fauna of India Records of the Zoological Survey of India 118(3) 242ndash280
Srinivasulu C amp Srinivasulu B 2012 South Asian mammals their diversity distribution
and status Springer Science amp Business Media
Srinivasulu C Racey P A amp Mistry S 2010 A key to the bats (Mammalia Chiroptera)
of South Asia Journal of Threatened Taxa 2(7) 1001ndash1076
Uieda W 2000 A review of complete albinism in bats with five new cases from Brazil Acta
Chiropterologica 2 97ndash105
Van Grouw H 2006 Not every white bird is an albino sense and nonsense about colour
aberrations in birds Dutch Birding 28(2) 79ndash89
Van Grouw H 2013 What colour is that bird British birds 106 17ndash29
Vendan S E 2003 Roost and diet selection in the Indian Flying Fox Pteropus giganteus
(Mega chiroptera) MSc Thesis Madurai Kamaraj University India 85pp
Vyas R amp Upadhyay K 2014 Study of the Indian Flying Fox (Pteropus giganteus)
Colonies of Jambughoda Wildlife Sanctuary Gujarat India Record of the largest
roosting congregation at Targol Small Mammal Mail 6(1) 2ndash8
Suggested citation
Amin S Patel H and Vaghela P (2021) Record of Leucism in Indian Flying Fox Pteropus
giganteus (Mammalia Chiroptera Pteropodidae) from South Gujarat India Prithivya An
Official Newsletter of WCB Research Foundation and WCB Research Lab Vol 1(2) 12-17
THAKKAR amp GOHIL Birds behaviour during the Annular solar eclipse
Prithivya | August 2021 18
Notes on behavioural observation of some water birds during the Annular Solar
Eclipse
Thakkar Karan and Gohil Bharatsinh
Department of Life Sciences Maharaja Krishnakumarsinhji Bhavnagar University
Bhavnagar-364001 Gujarat India E-mail ksonpal07gmailcom
Abstract
In this communication we report the behaviour of various water birds observed during the annular
solar eclipse which happened on 26th November 2019 We observed the behaviour of eight species of
birdsrsquo viz Greater Flamingoes Phoenicopterus roseus the Indian Cormorant Phalacrocorax
fuscicollis Pied Avocet Recurvirostra avosetta Black-winged stilt Himantopus himantopus Eurasian
spoonbill Platalea leucorodia Northern shoveler Spatula clypeata Little grebe Tachybaptus
ruficollis and Dalmatian pelican Pelecanus crispus throughout the eclipse period ie from 805 AM
to 1051 AM Various behavioural chan`ges were observed in all the targeted species except the
Indian cormorant It rested on a pole for the whole eclipse period Detailed observations are given in
the note Reduction in light levels due to solar eclipse does affect the activity of birds
Key Words Solar Eclipse Behaviour Birds Bhavnagar
An annular solar eclipse was visible from 805 to 1051 AM on 26 December 2019 in India
Solar eclipse a rare and uncommon environmental event can influence and modulate the
behaviour of animals (Murdin 2001 Gil-burmann amp Beltrami 2003) Following observations
were made during the eclipse at airport Road Lake (21762837deg N 72183624deg E) in
Bhavnagar city using Nikon binoculars (1050)
Greater flamingos (n=24) on the day of the eclipse were seen foraging constantly from 805-
920 AM All of them started calling together from 921 to 935 AM After the peak of the
eclipse (ie after 921 AM) many flamingo individuals started preening Activities of Indian
cormorants varied throughout the eclipse period Pied avocets (n=13) were observed feeding
through the initial phase of the eclipse ie from 805 to 850 AM But pied avocets went onto
the resting phase from 851 to 935 AM Eight of them continued resting even after 935 AM
while the other five started feeding again Black-winged stilts (n=50) were seen resting in a
flock throughout the study period But as the eclipse increased flocks of black-winged stilts
from outside the lake started arriving and joined the original flock of 50 A group of five
black-winged stilts arrived at 852 followed by a flock of 20 at 906 AM Three other groups
of 30 50 and 10 black-winged stilts arrived from 921 to 935 AM Eurasian spoonbills
(n=30) were seen resting in water during the initial stage of eclipse ie from 808 to 920
AM From 921 to 935 AM five spoonbills started feeding 21 continued resting while 12
THAKKAR amp GOHIL Birds behaviour during the Annular solar eclipse
Prithivya | August 2021 19
started vocalizing and four flew away from the lake After 935 AM 12 individuals
continued calling 29 rested in water whereas eight individuals arrived from outside the lake
Activities of northern shoveler (n=80) varied throughout the eclipse Little cormorant (n=1)
rested on a pole for most of the observation It started feeding at 921 to 935 AM along with
one little cormorant which arrived from somewhere outside the lake After 935 both
perched at the wood in the lake Little grebe (n=1) spent most of the time feeding Between
935 and 950 AM it was joined by a flock of eight grebes that arrived from outside the lake
Pelicans (n=2) rested on a small patch of land in the lake throughout the study period
Table 1 Ethogram
Bird
Time intervals
0805-
0820
0821-
0835
0836-
0850
0851-
0905
0906-
0920
0921-
0935
0936-
0950
Greater
flamingo FD(n=24) FD(n=24) FD(n=24) FD(n=24) FD(n=24) C(n=24)
PR(n=4)
FD(n=17)C
(n=3)
Indian
Cormorant Rp(n=2) Rp(n=2)
Fi(n=2)
FD(n=4)
Rp(n=2)Fb
(n=2) Rp(n=1) Rp(n=1)Fb(n=1) _
Pied
Avocet FD(n=13) FD(n=13) FD(n=13) Rw(n=13) Rw(n=13) Rw(n=13)
FD(n=5)R
w(n=8)
Black
winged stilt Rw(n=50) Rw(n=50) Rw(n=50)
Rw(n=50)F
i(n=5)
Rw(n=55)
Fi(n=20)
Rw(n=75)
Fi(n=30)
Fi(n=50) Fi(n=10) Rw(n=165)
Eurasian
Spoonbill Rw(n=30) Rw(n=30)
Rw(n=30)
FD(n=4) Rw(n=34) Rw(n=34)
FD(n=5)C(n=12)
Fo(n=4)
Rw(n=21)
Fi(n=8)
C(n=13)
Rw(n=29)
Northern
Shoveler
PR(n=10)
Rl(n= 50)
Rw(n=20)
Rl(n= 50)
Rw(n=20)
PR(n=4)
Rw(n=50)
Rl(n=10)
Rw(n=54)
Rl(n=10)
FD(n=5)
Rw(n=54)
Rl(n=5)
Rw(n=54)
Rl(n=10)
Rw(n=54)
Rl(n=10)
Little
Cormorant Rp(n=1) Rp(n=1) Rp(n=1) Rp(n=1) Rp(n=1) FD(n=1) Fi(n=1) Rp(n=2)
Little grebe Rw(n=1) FD(n=1) FD(n=1) FD(n=1) FD(n=2) Fi(n=8)FD(n=10) FD(n=18)
Dalmatian
pelican Rl(n=2) Rl(n=2) Rl(n=2) Rl(n=2) Rl(n=2) Rl(n=2) Rl(n=2)
THAKKAR amp GOHIL Birds behaviour during the Annular solar eclipse
Prithivya | August 2021 20
Table 2 Different type of behaviours observed in bird species
BEHAVIOURS
FD Feeding
R Resting
Rp resting on an object prolonged perching on a pole or a stick in water
Rl resting on land simply sitting or standing with no noticeable movement
Rw resting in water no efforts for movement and neck resting on body(in case of ducks)
F Flight
Fb taking off from place A within a lake and settling at place B within a lake
Fa taking off from place A within a lake and settling at same place
Fo taking off from within lake and flying outside the lake
Fi arrived at lake from outside the lake
PR Preening
C Calling making some kind of voice could either be begging call roosting call or some other
B Bathing Rapid action of submerging in water and coming out
Kumar S (1981) observed the changes in the activity of cattle egrets because of the solar
eclipse Trigunayat (1997) observed that roosting Black-crowned Night-herons altered a
variety of behaviours including increased calling preening and perch shifting Nanikov et
al (2001) also mention behavioural changes in several birds due to solar eclipse A similar
trend was observed in this study as well From these limited field observations we can
conclude that reduced light level due to annular solar eclipse does interrupt normal bird
behaviour patterns
Acknowledgements
The first author is very thankful to Mr Dhavalkumar Vargiya for his kind support and
encouragement in the preparation for this article
References
Altmann J 1974Observational Study of Behavior Sampling MethodsBehaviour 49(34)
227-267 Retrieved on March 23 2020 from wwwjstororgstable4533591 bull Gil-
Burmann C Beltrami M 2003 Effect of the solar eclipse on the behavior of a
captive group of hamadryas baboons (Papio hamadryas) Zoo Biology 22 299ndash303
Kumar S 1981 Solar eclipse ndash notes on behavior of egrets J Bombay natural history
society78 3 133-136
Murdin P 2001 Effects of the 2001 total solar eclipse on African wildlife Astronomy
THAKKAR amp GOHIL Birds behaviour during the Annular solar eclipse
Prithivya | August 2021 21
Geophysics 42 40ndash42
Nankinov D Dalakthieva S Nikolov B Shurulinkov P Popov K Kirilov S Zareva
K Borisov B Stojanov G Nankinov N Minchev N Kjichukov D Nikolov I
Stanchev R Ganchev E 2001Studying the behaviour of birds during the solar
eclipse on August 11 1999 mdash Russian Ornithological Journal 142 355-369
Trigunayat M M 1997 Some behavioral observations on Night Heron Nycticorax
nycticorax (Linnaeus) during the total solar eclipse in Keoladeo National Park
Bharatpur IndiaPavo 3561ndash65
Tramer E J 2000 Bird Behavior During a Total Solar Eclipse The Wilson Bulletin 112(3)
431ndash432
Suggested citation
Thakkar K and Gohil B (2021) Notes on behavioural observation of some water birds during the
Annular Solar Eclipse Prithivya An Official Newsletter of WCB Research Foundation and WCB
Research Lab Vol 1(2) 18-21
MARJADI D Restoration of Earth with Biobased Polymer
Prithivya | August 2021 22
Restoration of Earth with Biobased Polymer
Marjadi Darshan
Shree Ramkrishna Institute of Computer Education amp Applied Sciences MTB Campus
Athwalines Surat-395001
E-mail darshanmarjadisrkiacin
Humanity is facing increasingly numerous challenges in life despite the great advancements
in science and technology over the last century All the needs of modern society eg food
fuel energy and materials are highly dependent on diminishing fossil resources The
demand for creating and using plastic throughout the world driven by the increasing usage of
plastic-based materials has been increasing and adding stress to the current waste
management infrastructures There is significant interest to decrease the reliance on
petroleum-based plastic products which causes global environmental pollution The
advancement in science and technology has enabled mankind to live longer and consume
more of the worlds resources More than eight million tons of plastic waste leak into oceans
every year which can be eased through innovative redesigns of packaging materials
Issues such as global climate change and depletion of fossil fuels both resulting from the
increased usage of energy have triggered alarms among scientists and politicians worldwide
Therefore governments industries and academia are inputting much effort towards finding a
sustainable solution for the increasing energy crisis However a similar concerted effort is
still lacking to bring about the creation and usage of sustainable materials in the modern
lifestyle In addition to the increasing demand for energy the usage of materials in the
modern lifestyle has also been increasing rapidly Considering the widespread usage of
plastics in food packaging clothes shelter communication transportation construction
health care and leisure industries plastics are the most dependable material among the other
materials that mankind is currently dependent upon Currently most of the plastics that are
widely used in various sectors are produced from petrochemical products The plastic
industry has been among the most profitable businesses and is expected to grow further
especially because of their increased demands from rapidly developing countries like India
and other parts of South-East Asia While plastics are superior materials in terms of their
production costs and diverse properties the sustainability of this synthetic material is
undoubtedly an issue that needs to be addressed Biobased and biodegradable polymeric
materials are considered amongst the most suitable alternatives for some applications The
MARJADI D Restoration of Earth with Biobased Polymer
Prithivya | August 2021 23
excessive usage of petroleum also contributes to the increased emission of CO2into the
atmosphere which is thought to be among the principal reasons for global warming and
climate change These are some of the strong and valid reasons leading towards the
development of technologies to produce biobased and biodegradable plastics
Science and technology have created the modern lifestyle that mankind is living in which
efficiency is the keyword Drawing an analogy from a bacterial culture in a shaken flask the
depletion of nutrients and the simultaneous accumulation of toxic wastes are the main
reasons for the onset of the stationary growth phase and the subsequent death phase
However unlike bacteria mankind is aware of the consequences of such activities As a
result the world population is now concerned about sustainable development
Biobased and biodegradable plastics most likely to remain less superior in terms of
production cost and material properties compared to petrochemical plastics Petroleum-based
plastics have serious environmental and social impacts due to their non-degradable nature
and the leaching of carcinogenic substances like dioxin when exposed to scratch or heat
Compared to the ease at which fossil resources are utilized renewable biobased materials
will need more effort and efficiency to be used in daily life However biobased materials are
considered superior in terms of sustainability and environmental friendly provided that they
are used judiciously and in a contented manner Hence it is in our hands to utilize our
knowledge of the environment to work towards the restoration of the earth and make it free
from single-use plastics
Suggested citation
Marjadi D (2021) Restoration of Earth with Biobased Polymer Prithivya An Official
Newsletter of WCB Research Foundation and WCB Research Lab Vol 1(2) 22-23
PATEL amp PATEL Single-use surgical mask
Prithivya | August 2021 24
Single-use surgical mask Human lifesaver or Biodiversity destroyer
Patel Jeel1 and Patel Rushika2 3
1GMERS Sola Civil Medical College Ahmedabad-380008 (Gujarat) India 2Assistant Professor Rai University Dholaka Ahmedabad-380008 (Gujarat) India 3Fellow Wildlife and Conservation Biology Research Foundation Pata-384265 (Gujarat)
India
E-mail rush2907gmailcom
The green lines represent sustainable and biodiversity conservation ways The dark brown
lines represent possible threats of single-use surgical mask to the biodiversity
Key Words Disposable mask Plastic and micro plastic pollution Conservation Threats
The COVID-19 is transmitted by respiratory droplets or aerosols and can survive in the air
for more than 24 hrs which was detected and momentarily created a pandemic situation
globally The only way to stop the transmission is to wear face mask washing hands
frequently and to maintain social distance Wearing a mask is declared as one of the
important precautionary measures by the World Health Organization (WHO) and
policymakers in every country because masks help in the significant reduction of infection
caused by touching the facemouthnose with contaminated hands (Schmutz et al 2020) The
virus COVID19has increased the demand for the surgical single-used mask in the healthcare
professionals as well as among the community Such masks are made up of polypropylene or
PATEL amp PATEL Single-use surgical mask
Prithivya | August 2021 25
high-density polyethylene (HDPE) a fossil-derived plastic which has a very high half-life
(Dharmaraj et al 2021)The mask production to the disposal statistics is presented in Table 1
Based on the reusability the mask is divided into two major groupsrsquo disposable (made up of
polymers) and reusable mask (made up of cloth material) in terms of production In present
study the details of only disposable mask is presented
Calculated based on the global entries of masks and gloves mentioned (200 millionmonth)
The average of one mask and single glove weight is 225plusmn001
Mask a threat to the ecosystem
In current situation recycling of any household medical waste is not a feasible and advisable
solution as there is a chance that it may be exposed to infectious particles There are no
particular laws or guidelines for separation and segregation which might involve several
issues Globally the dumping of masks was observed in areas such as roadside river oceans
and several open areas Usually such masks sustain in the environment for a longer period of
time (more than 400 years)(Hasan et al 2021) The misconception of masks to various birds
animals and marine creatures considering as a food and leads to trapping and entangling in
the strips of masks The single-use surgical mask not only adds litter to the environment but
No Statistics Reference
1 Estimated worldwide usage of disposable mask 129
billionmonth
Prata et al 2020
2 Production in China as on Feb 2020 116 millionday Adyel 2020
3 Order of mask in Japan as of April 2020 over 600
millionmonth
Fadare and Okoffo
2020
4 Mask disposal in the UK 53 millionday Website URL 1
5 Gloves and mask entered into the environment 200
millionmonth
Website URL 2
6 Mask reached to oceans 15 billion
Marine plastic pollution increased in last year 6200 tonnes
Website URL 3
7 Mask waste generation in India Minimum 928week
Maximum 4640week
Selvaranjan et al 2021
8 Plastic footprint in the environment due to mask and gloves
45times105 KgMonth
Present Study
Table 1 Global mask production usage and disposable statistics
PATEL amp PATEL Single-use surgical mask
Prithivya | August 2021 26
also hurting and killing a wide range of terrestrial and marine living organisms Moreover
the production process of such masks also releases greenhouse gases (Prata et al 2021) The
disposal of mask also reported as a novel source of micro plastic pollution in the environment
and entry point of the food chain (Hasan et al 2021) The single-use surgical masks are also
noted as a major causative agent of secondary disease outbreaks in all life forms including
humans (Fadare and Okoffo 2020) India does not have any sufficient resources for the
household medical waste management (Prata et al 2021) Every minute 10 kg of disposed
masks and gloves entered into the environment (Table 1)Hence it is very important to deal
with the mentioned issues and look into more sustainable sources at individual level
Herewith we suggest some measures by which we can protect the environment without
compromising human health in current pandemic situation
Snip the strips of the masks before the disposal to avoid the entangling and entrapping
issues
Dispose masks as a separate medical waste and submit it to plastic recycling
companies
Moving towards the development of biopolymer mask (Torres and Torre 2021)
Biopolymer mask were made up of gluten and nanofibers having 95 efficiency
A reusable mask could be applied in routine life for the general community Regular
cloth masks having multi-layer of high thread-count and textiles are moderately
effective and reported to block 50-70 fine droplets and particles Reusable masks
help in the reduction of waste production (85 ) Moreover economically viable
option in a country like India as it is 37 times cheaper than other masks (Prata et al
2021)
References
Adyel T M 2020 Accumulation of plastic waste during COVID-19 Science 396(6509)
1314ndash1315 httpsdoiorg101056nejmms2004740
Dharmaraj S Ashokkumar V Hariharan S Manibharathi A Show P L Chong C T
ampNgamcharussrivichai C 2021 The COVID-19 pandemic face mask waste A
blooming threat to the marine environment Chemosphere Elsevier Ltd
httpsdoiorg101016jchemosphere2021129601
Fadare O O ampOkoffo E D 2020 Covid-19 face masks A potential source of
microplastic fibers in the environment Science of The Total Environment 737
140279 httpsdoiorg101016jscitotenv2020140279
PATEL amp PATEL Single-use surgical mask
Prithivya | August 2021 27
Hasan N A Heal R D Bashar A amp Haque M M 2021 Face masks protecting the
wearer but neglecting the aquatic environment - A perspective from Bangladesh
Environmental Challenges 4 100126 httpsdoiorg101016jenvc2021100126
Prata J C Silva A L P Duarte A C amp Rocha-Santos T 2021 Disposable over
Reusable Face Masks Public Safety or Environmental Disaster Environments 8(4)
31 httpsdoiorg103390environments8040031
Schmutz M Hischier R Batt T Wick P Nowack B Waumlger P ampSom C 2020
Cotton and surgical masksmdashwhat ecological factors are relevant for their
sustainability Sustainability (Switzerland) 12(24) 1ndash13
httpsdoiorg103390su122410245
Selvaranjan K Navaratnam S Rajeev P ampRavintherakumaran N 2021 Environmental
challenges induced by extensive use of face masks during COVID-19 A review and
potential solutions Environmental Challenges 3 100039
httpsdoiorg101016jenvc2021100039
Torres F G amp De-la-Torre G E 2021 Face mask waste generation and management
during the COVID-19 pandemic An overview and the Peruvian case Science of the
Total Environment 786 147628 httpsdoiorg101016jscitotenv2021147628
Website URL 1 httpswwwgreenpeaceorguknewssingle-use-face-masks-hurting-
wildlife-what-you-can-do [Accessed on 23rd June 2021]
Website URL 2 httpswwwgreenmatterscompface-masks-wildlife [Accessed on 23rd June
2021]
Website URL 3 httpseconomictimesindiatimescomnewsenvironmentecosystem-under-
threat-as-birds-and-marine-life-ensnared-in-discarded-face-maskswidespread-
contaminationslideshow80230026cms [Accessed on 23rd June 2021]
Suggested citation
Patel J and Patel R (2021) Single-use surgical mask Human lifesaver or Biodiversity destroyer
Prithivya An Official Newsletter of WCB Research Foundation and WCB Research Lab Vol 1 (2)
24-27
PITHVA amp DHARAIYA Perception of forest staff about wildlife
Prithivya | August 2021 28
Does the contemplation of forest field staff about wildlife differ than a common man
Pithva Krishna1 2 and Dharaiya Nishith1
1 Wildlife and Conservation Biology Research Lab Hemchandracharya North Gujarat
University Patan (Gujarat) India 2Institute of Environment Education and Research Bharati Vidyapeeth Deemed University
Pune India
E-mail krishnapithva17gmailcom
Introduction
A field-based training was organized by Vadodara wildlife division Gujarat forest
department and WCB Research Lab of Hemchandracharya North Gujarat University from
September 17th to 19th 2020 with the aim to enhance the capacity of forest field staff for
monitoring and rescue of sloth bear and associated fauna The training was organized at
Jambughoda wildlife sanctuary Central Gujarat Along with the awareness about sloth bear
a small survey was carried out to understand how the field staff envisages the wildlife that is
found in their work place Total 18 frontline forest staff of different cadre such as beat guards
and round foresters from different forest ranges of central Gujarat has participated in this
survey
This study provides an insight on how
forest staffrsquos perception differs in different
animals As Q method provides qualitative
and quantitative data which helps
identifying peoplersquos perception in detail As
participants have to provide justification of
their answers it reveals some underlying
conflicts or reasons These justifications of
participants can help identify the gaps and
can be better used for conservation planning
as well as capacity building of forest field
staff
Figure 1 Forest frontline staff organizing
photos on Q Board copy Nishith Dharaiya
PITHVA amp DHARAIYA Perception of forest staff about wildlife
Prithivya | August 2021 29
Methodology
We used Q methodology for this study this method is designed and developed by William
Stephenson in 1930s (McKeown amp Thomas 1988)and allows to disclose underlying reasons
This method is widely used in social sciences studies In this method photos were used
instead of statements to know respondentrsquos perception allowing them to justify their answer
in detail without any restriction This method allows both qualitative and quantitative data on
perception of the person being interviewed
We categorised the Q Method into two parts first organising 16 photos of locally found
animals on a Q-board (figure 1(b)) followed by explanation for each photo which are placed
on Q-board by the respondent As shown in the figure 1(a) the participants were asked to
organise photos in Q- board as per their liking and disliking towards the animals and to
provide reasons which were recorded in mobile phone devise A list of all the wildlife photos
used for this survey is provided in table 1
-3 -2 -1 0 +1 +2 +3
Negative Positive Neutral
Figure 1(a) Representative sort of organized Q-
board by a participant
Figure 1(b) A Q-board on which the
respondents organize the photos
PITHVA amp DHARAIYA Perception of forest staff about wildlife
Prithivya | August 2021 30
Photo
ID
Common name Scientific name
1 Wild boar Sus scrofa
2 Hanuman langur Semnopithecus entellus
3 Indian cobra Najanaja
4 Indian giant flying squirrel Petauristaphilippensis
5 Small Indian civet Viverricula indica
6 Sloth bear Melursus ursinus
7 Indian hare Lepus nigricollis
8 Indian python Python molursus
9 Barn owl Tyto alba
10 Grey francolin Francolinuspondicerianus
11 Red-wattled lapwing Vanellus indicus
12 Rhesus macaque Macaca mulatta
13 Black kite Milvus migrans
14 Common krait Bungarus caeruleus
15 Indian crested porcupine Hystrix indica
16 Blue bull Boselaphustragocamelus
Q sort analysis
In this study three factors were derived based on participantrsquosjustification which is explained
in detail in the result section A factor in this study is a category representingthe group of
people who have similar perspective(Brown 1980) The higher the factor loading the more
highly that sorts are correlated with that factor (Ramlo 2008 Ramlo amp Newman 2011)The
sorts refer to the photos assembled by participants on Q-board (figure 1(b))In order to
analyse the data a software PQMethod(httpschmolckorgqmethod)was used which is
specially designed for Q-analysis Q sorts are the number of participants that took part in the
survey All the data were entered manually in this software and correlation was calculated
among each sort The correlation matrix for the extracted factor was analysed through a
principal component factor analysis with varimax rotationfor which options are provided in
the software (figure 2)
Table 1 Photos of wildlife used for this study
PITHVA amp DHARAIYA Perception of forest staff about wildlife
Prithivya | August 2021 31
Results and Discussion
The three factors that emerged
are shown in Table 2 with
automatic pre-flagging
Participants having similar
perceptions are put together in
their respective factors and
marked in bold and have ldquoXrdquo
next to their score Out of 18
sorts 17 sorts were found
complete by the software and
were further analysed Each of
three factors represents a different perspective towards the photos provided to them
Participants were named as PART001 PART002 and so on to keep their identity unrevealed
In table 2 there are 8 participants belonging to factor 1 with 29 of the variance explained
followed by 7 participants in factor 2 having 26 explained variance and 2 participants
belonging to factor 3 with 14 explained varianceOnce factor score calculated by the
software distinguishing tables were developed in this analysis for each factor which differ
from each other that is explained further in this section The distinguishing tables for each
factor explains differences between factors(Brown 1971 Ramlo amp Newman 2011 Brown
1993)In order to determine distinguishing statements average Z-score of respondentrsquos factor
score was calculated by the software
Figure 2 Screenshot of analytical option available in PQM
method Software
PITHVA amp DHARAIYA Perception of forest staff about wildlife
Prithivya | August 2021 32
Table 2 Extracted factor score from Q-sorts
Q-Sorts ID Factor 1 Factor 2 Factor 3
1 PART001 08530X 01248 -01223
2 PART002 00414 08084X 01708
3 PART003 06945X 00471 03983
4 PART004 07683X 01839 -00156
5 PART005 05450X 00166 02332
6 PART006 04208 07241X 04006
7 PART007 01728 01377 09013X
8 PART008 06930X 05214 03237
9 PART009 06516X 04289 04265
10 PART010 05119 06142X 00921
11 PART011 08475X -00072 -02626
12 PART012 03742 -05333 04456
13 PART013 00481 08292X 03240
14 PART014 -00002 06395X -03574
15 PART015 06577X 02179 01940
16 PART016 -00614 01991 06372X
17 PART017 04469 07611X 01835
18 PART018 05679 07564X 01465
Explained variance 29 26 14
Note number in bold shows respondents belong to those respective factors
Table 3 shows different factor score for each animal photo and depending on statistical
significance the photo load to a specific factor The above table contains 16 photos and their
grid position for all three factors (perception table 2) For example Indian python was
disliked by participants therefore it is scored at -2 for respondents grouped under factor 1 +1
for factor 2 andfor factor 3 it was scored at +2 For factor 1 the most liked species by
participants is Indian hare and most disliked species is wild boar Most liked species for
factor 2 is Indian leopard and most disliked animal is fruit bat For factor 3 most liked
species is Indian hare scored at +3 and most disliked species is wild boar scored at -3 by the
participants
PITHVA amp DHARAIYA Perception of forest staff about wildlife
Prithivya | August 2021 33
Table 3 Aggregate factor values of each 16 photos
Aggregate values
No Photos Factor 1 Factor 2 Factor 3
1 Indian python -2 1 2
2 Hanuman langur 0 0 2
3 Monitor lizard -1 -2 -1
4 Red-wattled lapwing 1 -1 1
5 Sloth bear 2 2 0
6 Indian hare 3 1 3
7 Leopard 2 3 0
8 Grey francolin 1 -1 -1
9 Indian giant flying squirrel 1 1 -2
10 Blue bull 0 0 0
11 Small Indian civet 0 0 -1
12 Fruit bat (Flying fox) -1 -3 -2
13 Indian cobra -2 2 1
14 Barn owl 0 0 0
15 Indian chameleon -1 -1 0
16 Wild boar -3 -2 -3
Factor 1 Economic impact
This factor was described by 8 participants mainly concerning economic impact Animals
that cause harm economically by destroying crops and threat to human life and livestock
Participants of factor 1 thinks fruit bat Indian python and Indian cobra causes high level of
economic harm Grey francolin is scored +1 due to its contribution to reduce impact by eating
pest insects from agricultural field Though the most disliked animal is wild boar for factor 1
as shown in table 3
PITHVA amp DHARAIYA Perception of forest staff about wildlife
Prithivya | August 2021 34
Table 4 Distinguishing photos for factor 1
Factor 2 Aesthetic spiritual values and conservation aspects
This factor explains aesthetic spiritual values and conservation aspects which includes
appearance tourist attraction rehabilitation and religious belief There are 7 responses in this
factor (table 2) Respondents are observed to have negative opinions towards animals which
play major role in economic loss but positive towards animalrsquos beauty and its natural
charisma Table 5 shows how score of animals for factor 2 is different from the score of
factor 1 and factor 3 For example Indian cobra is scored at +2 in factor 2 as it is attractive to
participants but it is scored -2 for factor 1 as it threatens human life
Table5 Distinguishing photos for factor 2
Photo
ID Photos
Grid
position
for
Factor 1
Z-score
of
Factor 1
Grid
position
for
Factor 2
Z-score
of
Factor 2
Grid
position
for
Factor 3
Z-score
of
Factor 3
13 Indian cobra -2 -119 2 127 1 037
6 Indian hare 3 148 1 067 3 189
1 Indian python -2 -103 1 034 2 122
4 Red-wattled
lapwing 1 014 -1 -065 1 079
16 Wild boar -3 -189 -2 -125 -3 -201
Photo
ID Photos
Grid
position
for
Factor
1
Z-score
of
Factor
1
Grid
position
for
Factor
2
Z-score
of
Factor
2
Grid
position
for
Factor
3
Z-score
of
Factor 3
8 Grey francolin 1 095 -1 -046 -1 -067
12 Fruit bat (Flying -1 -02 -3 -182 -2 -11
1 Indian python -2 -103 1 034 2 122
13 Indian cobra -2 -119 2 127 1 037
PITHVA amp DHARAIYA Perception of forest staff about wildlife
Prithivya | August 2021 35
Factor 3 Lack of awareness
This factor describes lack of awareness which includes lack of interest compared to other
animals and species This factor mainly concerns individuals who lacks knowledge proper
information and are not aware about the species For example in table 6 the score of Indian
giant flying squirrel differs from factor 3 to factor 1 and 2 as it is scored at -2 +1 and +1
respectively The justification for negative score given by the participants is that they are not
aware about the presence of the species therefore they do not have any information on the
species
Table 6 Distinguishing photos for factor 3
Photo
ID Photos
Grid
position
for
Factor 1
Z-score
of
Factor
1
Grid
position
for
Factor 2
Z-score
of
Factor
2
Grid
position
for
Factor 3
Z-score
of
Factor 3
1 Indian python -2 -103 1 034 2 122
2 Hanuman langur 0 -02 0 -045 2 110
13 Indian cobra -2 -119 2 127 1 037
5 Sloth bear 2 138 2 135 0 -000
7 Leopard 2 133 3 181 0 -000
9 Indian giant flying
squirrel 1 096 1 062 -2 -122
Conclusion
The perception of forest field staff was better understood using Q method analysis
considering various aspects It is seen that participants tend to like animals such as Indian
leopard sloth bear Hanuman langur and Indian hare as they are scored positive or neutral
The animals that are not given negative score in any factor due to their appearance are seen
frequently and does not lack awareness It is observed from the data that frontline forest staff
lacks knowledge about animals that are not seen or present in their forest rangebeat As
frontline forest staff they should be aware about existence of animal species that are found in
Gujarat state along with their ecological importance threats and conservation values Some
participants were not even aware about the existence of the species in the wild such as Indian
giant flying squirrel Although being frontline forest staff their perception is biased towards
animals such as wild boar monitor lizard and flying fox bat due to the economic loss they
PITHVA amp DHARAIYA Perception of forest staff about wildlife
Prithivya | August 2021 36
may cause and weird appearance Their perception becomes the same as a common man
when every animal should be equal to frontline forest staff as it is their job to protect forest
and its animals Some participants believe in superstitions of bad luck of barn owl and
monitor lizard which shows their common man perception and lack of right information
Recommendations
A separate training or workshops should be organised by forest department focused on
animal species found in Gujarat This will help them enhancing their existing knowledge and
it will provide them with some scientific insights Having basic scientific knowledge will
help remove some barriers like superstitions and other beliefs Field trips should be organised
in different part of state to gain practical experience Team building activities should be
conducted between staff of different forest divisions
Acknowledgements
We are thankful to all the forest field staff who participated in this survey We also thank to
the Deputy Conservator of Forests Vadodara Wildlife Division of Gujarat Forest Department
and sincerely acknowledge the help from our research team members
References
Brown S R (1980) Political subjectivity applications of Q methodology inpolitical science
E Ramlo S and Newman I (2011) Q Methodology and Its Position in the Mixed-Methods
Continuum Operant Subjectivity 34(3) 172ndash191
McKeown B and Thomas D B (1988) Q Methodology SAGE Publications
R Brown S (1993) A Primer on Q Methodology Operant Subjectivity 16(34) 91ndash138
Ramlo S E (2008) Determining the various perspectives and consensus within a classroom
using Q methodology AIP Conference Proceedings 1064 179ndash182
httpsdoiorg10106313021248
Suggested citation
Pithva K and Dharaiya N (2021) Does the contemplation of forest field staff about wildlife differ
than a common man Prithivya An Official Newsletter of WCB Research Foundation and WCB
Research Lab Vol 1(2) 28-36
PANCHAL amp JHA Qualitative phytochemical analysis
Prithivya | August 2021 37
Qualitative phytochemical analysis of some medicinal plants (leaves) from the
surrounding area of Talod Taluka North Gujarat India
Panchal Mital and Jha Charumati
Department of Botany Smt Panchal Science college Talod ndash383215 North Gujarat India
E-mail mitalpanchal0gmailcom
Abstract
The tremendous biological variety of North-Eastern India has long been recognised Five medicinal
plants were chosen for this study Manilkara zapota (L) van Royen Manilkara hexandra (Roxb)
Dub Mangifera indica L Madhuca indica JF Gmel and Annona squamosa L The purpose of this
study was to look into the existence of Phytochemicals such as Alkaloid Amino acid Carbohydrate
Protein Glycoside Tannin Terpenoid Saponin Flavonoid and Steroids in the medicinal plants that
were chosen For the organic solvent extraction the Soxhlet apparatus was utilized Water acetone
and chloroform were utilised as solvents Our findings show that the examined plants crude aqueous
and organic solvent extracts contain medicinally relevant bioactive components justifying their usage
in traditional medicines for the treatment of various ailments
Key Words Qualitative phytochemical analysis Manikara zapota M hexandra Madhuka
indica Mangifera indica Annona squamosa
Introduction
Phytochemicals are non-nutritive substances Chemical compounds are produced naturally on
plants during metabolic processes and contain a wide range of proactive and disease-
preventive qualities These compounds are known to be produced by plants in order to defend
themselves Recent study has shown that they can also play a vital role in illness prevention
in humans Even some of these herbs have been used for millennia as traditional medicine
Most phytochemicals such as flavonoids carotenoids and polyphenols have antibacterial
action and can be used to treat infections The following plant species were studied
Manilkara zapota (L) van Royen M hexandra (Roxb) Dub Mangifera indica L Madhuca
indica JF Gmel and Annona squamosa L
Plants play a universal function in the treatment of sickness as seen by their use in every
major system of medicine regardless of philosophical foundation Plants are vital to the
pharmaceutical industry because they are a rich supply of pharmaceuticals and a vast
reservoir of chemical variety for drug development screening procedures The majority of the
medications mentioned in the Indian medicinal system are derived from plants
PANCHAL amp JHA Qualitative phytochemical analysis
Prithivya | August 2021 38
Medicinal plants have been used to treat disease all across the world for thousands of years It
is generally understood that some plants with active chemicals can limit microbial
development Plants ability to generate chemicals via secondary metabolism determines their
antimicrobial potency Secondary metabolites emerged as the most important class of
chemicals with a wide spectrum of antibacterial and antifungal properties When compared
to conventional fungicides used to inhibit microbial growth and survival these plant
chemicals have different structures and activities
Plants are a major source of Traditional medicine and can be used to cure a variety of
conditions with little adverse effects Traditional medical practises are not only beneficial in
the treatment of diseases but they also aid in the discovery of pharmaceutically active
compounds in plants which can aid in the commercial manufacture of pharmaceuticals From
ancient times the importance of plant diversification in health care has been extensively
recognised According to a literature review more than 50000 plant species have been
successfully employed for medical purposes globally with flowering plants accounting for
over 13 of these
Material and methods Plant collection and Identification
M zapota (L) van Royen M hexandra (Roxb) Dub M indica L M indica JF Gmel
and A squamosa L were among the plant species studied The plants were harvested from
the land in the Talod taluka in North Gujarat India The washed plant leaves were kept in for
drying after being cleaned with tap water around 2-3 times to evaporate the water content
With the use of a mechanical blender the sample was ground into a fine powder after drying
The powder is then kept in an airtight plastic container for future usage with adequate
labelling
Extraction technique
Extraction is the separation of inert plant tissue constituents from medicinally active plant
tissue constituents using a conventional extraction process Menstrum is a selective solvent
that is used to eliminate inert material and to obtain the curative part of the procedure through
therapy
PANCHAL amp JHA Qualitative phytochemical analysis
Prithivya | August 2021 39
Method and Plant extraction
Solvent extraction
The crude plant extract was made using the Soxhlet extraction method 10 gm of powdered
plant material was placed into a thimble and 300 ml of solvents were extracted separately
Acetone and chloroform were utilized as solvents In a syphon tube of an extractor the
extraction process continued for 24 hours until the solvent became colourless The extract
was then placed in a beaker The extract was then retained and cooked on a hot plate at 30- 40
degC until all of the solvent had evaporated The dried extract was stored at 4degC in a refrigerator
for future phytochemical investigation
Methods of phytochemical analysis
Alkaloid
Wagnerrsquos test A few drops of Wagners reagent were applied to 2mg of extract that had
been acidified with 15 percent vv hydrochloric acid The presence of alkaloids is indicated
by a yellow or brown ppt
Carbohydrates
Molischrsquos test 2mg of ethanolic extract was mixed with 10ml water filtered and
concentrated 2ml of conc sulphuric acid was added to these 2 drops of freshly prepared 20
alcoholic alpha-naphthol solution forming a layer below the mixture red-violet ring showing
the existence of carbohydrates that disappears when sufficient alkali is added
Amino acid
Ninhydrin test Boil for a few minutes 2ml Ninhydrin reagent + 2ml extract The production
of blue colour indicates the presence of amino acids
Steroids
Salkowski reaction 2mg of dry extract was combined with chloroform to the chloroform
layer sulphuric acid was gently introduced by the sides of the test tube The emergence of a
red colour indicated the presence of steroids
Tannin A few drops of a 5 percent wv Fecl3 solution were added to 1-2 ml of the ethanolic
extract Gallo tannins are shown by a green colour whereas pseudo tannins are indicated by a
brown colour
Flavonoids After mixing 2ml of each extract with a few drops of 20 sodium hydroxide a
bright yellow colour was seen A few drops of 70 dilute hydrochloric acid were added to
PANCHAL amp JHA Qualitative phytochemical analysis
Prithivya | August 2021 40
this and the yellow coloration disappeared The presence of flavonoids in the sample extract
is shown by the formation and disappearance of yellow colour
Saponins 6ml distilled water was added to 2 ml of each extract and rapidly shaken the
presence of saponin is indicated by the production of bubbles or persistent foam
Proteins adding 1 ml of 40 percent sodium hydroxide and a few drops of 1 percent copper
sulphate to 2ml of each extract The production of violet colour shows the presence of peptide
linkage molecules in the sample extract
Glycosides 05ml of glacial acetic acid and 3 drops of 1 aqueous ferric chloride solution
added in to 1ml of each extract The creation of a brown ring at the interface shows the
presence of glycosides in the sample extract
Terpenoids 1ml of each solvent is mixed with 05ml chloroform and a few drops of strong
sulphuric acid to produce a reddish-brown precipitate that confirms the presence of Terpenoid
in the extract
Table 1 Preliminary Phytochemical analysis
Class of
compounds
Manilkara
zapota
Manilkara
hexandra
Mangifera
indica
Madhuka
indica
Annona
squamosa AE CE WE AE CE WE AE CE WE AE CE WE AE CE WE
Alkaloid + + - + - - + + - + - - + - -
Amino acid - - - - - - - - - - - - - - -
Carbohydr
ate
+ + - + - + + - - - - - - - -
Protein - - + + - + + - + - - - - - +
Glycoside + - - + - + - - - - - + - - -
Tannin - - + - - - + + + + - + + + +
Terpenoid - + - - - - - - - - - + - - -
Saponin - + + + - + + - + + - + + - -
Flavonoid - + + - - + - - + - - + + - -
Steroid + - + - - + - - + - - - - - -
Where lsquo+rsquo = positive and lsquo-rsquo = negative
AE= Acetone extract CE= Chloroform extract WE= Water extract
Alkaloid carbohydrate glycoside and steroid are all found in Acetone extract of M zapota
leaves Chloroform extract of M zapota leaves contains alkaloid carbohydrate terpenoid
PANCHAL amp JHA Qualitative phytochemical analysis
Prithivya | August 2021 41
saponin and flavonoid Protein Tannin Saponin Flavonoid and Steroid can be found in the
aqueous extract of M zapota leaves alkaloid carbohydrate protein glycoside and saponin
are all found in Acetone extract of M hexandra leaves All phytochemicals are missing in the
chloroform extract of M hexandra leaves Aqueous extract of M hexandra leaves contains
carbohydrate protein glycoside saponin flavonoid and steroid Alkaloid Carbohydrate
Protein Tannin and Saponin are all found in Acetone extract of M indica leaves Alkaloid
and Tannin are found in Chloroform extract of M indica leaves Protein Tannin Saponin
Flavonoid and Steroid are found in aqueous extract of M indica leaves Alkaloid and
Tannin are found in Acetone extract of M indica leaves Chloroform extract of M indica
leaves is devoid of all phytochemicals Aqueous extract of M indica leaves contains
Glycoside Tannin Terpenoid Saponin and Flavonoid Alkaloid Tannin Saponin and
Flavonoid are all found in Acetone extract of A squamosa leaves Aqueous extract of A
squamosa leaves contains protein and tannin
Discussion
Plant samples were subjected to phytochemical analysis which confirmed the existence of
elements with medicinal and physiological properties Phytochemicals such as carbohydrate
amino acid protein tannin flavonoid saponin glycoside steroid terpenoid and alkaloids
were found in the plant extracts
Tannins attach to proline-rich proteins preventing them from being synthesized Flavonoids
are hydroxylated phenolic compounds that plants produce in response to microbial infection
and have been discovered to have antibacterial properties in vitro against a wide range of
pathogens Their capacity to combine with extracellular and soluble proteins as well as the
bacterial cell wall is most likely the reason for their activity They are also powerful
antioxidants with anticancer properties
Saponins which are known to have an anti-inflammatory impact were also discovered in the
plant extracts Saponins have the ability to coagulate and precipitate red blood cells Saponins
are known for their ability to produce foams in aqueous solutions as well as their hemolytic
activity cholesterol binding capabilities and bitterness Steroids have been shown to have
antimicrobial characteristics and they are extremely essential molecules particularly in
regard to sex hormones For millennia alkaloids have been associated with medical purposes
and cytotoxicity is one of their most prevalent biological features Alkaloids have been shown
PANCHAL amp JHA Qualitative phytochemical analysis
Prithivya | August 2021 42
to have analgesic antispasmodic and antibacterial effects by several researchers Glycosides
have been shown to reduce blood pressure in numerous studies The findings of this study
indicate that the detected phytochemical substances may be bioactive constituents and that
these plants are proving to be a valuable reservoir of bioactive compounds with significant
medical value
Conclusion
The findings demonstrated that the plants investigated contained medicinally essential
components Many previous investigations had accumulated evidence that the discovered
phytochemical was bioactive Several studies have demonstrated that these phytochemicals
contribute pharmacological and physiological qualities to the plants researched in the
treatment of various illnesses As a result extracts from these plants could be considered a
valuable source of drugs Further research should be carried out to separate purify and
characterize the active ingredients responsible for the activity of these plants as well as
further work to isolate purify and characterize the active constituents responsible for the
action of these Plants In addition more research into the putative mechanisms of action of
these extracts is urged
Acknowledgement
Authors are thankful to Disha life sciences Pvt Ltd for practical work during this study
References
Ashwin Godghate Rajaram Sawant Ashok Sutar (2012) Phytochemical Analysis of
Ethanolic extract of Roots of Carrisa carandus Linn RasayanJChem 5(4)456-
459
K Girija P Udaya Chandrika K Lakshman N Pruthvi (2010) Evaluation of Antimicrobial
activity of various Bark extracts of Bombax malabaricum IntJResPharmSci
1(2)199-204
Khalid S Shahzad A Bashrat N Abubakar M Anwar P (2018) Phytochemical screening and
Analysis of selected Medicinal Plants in Gujarat J Phytochemistry Biochem 2108
Kodangala C Saha S Kodangala P (2010) Phytochemical studies of Aerial parts of the Plant
Leucas lavandulaefolia Der Pharma Chemica 2(5)434-437
PANCHAL amp JHA Qualitative phytochemical analysis
Prithivya | August 2021 43
Manash PS et al (2016) Phytochemical Analysis of Traditional Medicinal Plants and their
Antimicrobial activity An Experience from North East India J Pharm Res
1(1)000104
Prabhavathi R M Prasad M P and Jayaramu M (2016) Studies on Qualitative and
Quantitative Phytochemical Analysis of Cissus quadrangularis Advances in Applied
Science Research 7(4)11-17
Pushpendra K Patel Narendra K Prajapati and BK Dubey (2012) Madhuka indica A
Review of its Medicinal property IJPSR 3(5) 942-950
RNS Yadav and Munia Agrawala (2011) Phytochemical analysis of some medicinal plants
Journal of Phytology 3(1)10-14
S Hemadri Reddy Aisha Khalid AL-Hinai Hajer Hafed AL-Yaqoobi and Fatima Jafar AL-
Ajmi (2016) Phytochemical analysis antimicrobial screening and Hypoglycemic
effect of some selected Medicinal plant extract from Oman Journal of Experimental
Biology and Agricultural Sciences 4(2)218-224
Suggested citation
Panchal M and Jha C (2021) Qualitative phytochemical analysis of some medicinal plants (leaves)
from the surrounding area of Talod Taluka North Gujarat India Prithivya An Official Newsletter
of WCB Research Foundation and WCB Research Lab Vol 1(2) 37-43
DHARAIYA A Remote sensing
Prithivya | August 2021 44
Remote sensing An overview with fundamentals and applications
Dharaiya Aditya
Geology Department MG Science Institute Ahmadabad ndash 380009 (Gujarat) India
E-mail adiradhugmailcom
Introduction
The general concept of remote sensing can be inferred by a simple statement ie the
acquisition of information from a specific distance Scientifically it is the science of
acquiring information about an object or phenomenon by measuring emitted and reflected
radiation (Ray 2013) According to Lillesand et al (2015) remote sensing is defined as the
science and techniques of obtaining information about an object land area phenomenon or
ecosystem process acquired by a device that is not in direct contact with the object area or
phenomenon under investigation The data collection is done remotely using various sensors
which may be further analyzed to obtain information about the objects areas or phenomenon
These acquired data can be of many forms such as variations in force distributions acoustic
wave and electromagnetic energy distributions Joseph (2005) has discussed modern remote
sensing as an extension of the natural phenomenon of visual perception of objects Apart
from visible spectrum the electromagnetic radiation from the ultraviolet to far infrared and
the microwave regions is used for remote sensing The observations which are directly
inferred through electromagnetic radiation (EMR) from the sun or self-emitted radiance is
called passive remote sensing Whereas in active remote sensing the electromagnetic
radiations of a specific wavelength or band of wavelengths are generated to illuminate the
targets and reflected or back-scattered EMR are recorded to gain information for example
LiDAR RADAR SAR etc Based on its applicability remote sensing is defined as sensing
of the earthrsquos surface from the space by making use of the properties of electromagnetic wave
emitted reflected or diffracted by the sensed objects for the purpose of improving natural
resource management land use and environmental protection The classification of remote
sensing is further based on the selection of EMR (eg optical and microwave Navalgund et
al (2007)) When the sensors detect the solar radiation in the visible and infrared wavelength
regions reflectedscattered or emitted from the earth is said as optical remote sensing and in
microwave remote sensing uses interference and polarization concepts with electromagnetic
energy that detects the scattered energy returning from the terrain and records it as an image
The main purpose of remote sensing is to have an organized systematic and large amount of
DHARAIYA A Remote sensing
Prithivya | August 2021 45
data collection in order to acquire information about 2 or 3 dimensions of real objects One
can get large and broad global coverage and repeatability of data to obtain a multipurpose
information through various earth observation satellite sensors which helps in detecting
things that are normally absent in visible spectra such as Land-surface temperature
Underground or sub-surface water etc There are several Earth Observation (EO) Satellites
namely Cartosat series Landsat series Sentinel 1 2 MODIS RISAT 1 and RADARSAT 2
Resourcesat Envisat IRS 1A Oceansat 2 and many more
Electromagnetic Spectrum
Electromagnetic radiation or EMR is the term used to describe all of the different types of
energies released by electromagnetic processes Visible light is just one of many forms of
electromagnetic energy Radio waves infrared light and X rays are all forms of
electromagnetic radiation The
electromagnetic waves are formed by
the vibrations of electric and magnetic
fields these vary in magnitude in a
direction perpendicular to the direction
of propagation of radiations at a
constant speed of light (c= 3108
ms)Figure 1 shows a generalized
concept of EMR These differ from
mechanical waves as they need not
require a medium to propagate
hence it is able to travel through air
and solid materials and can also
travel through the vacuum of space Thus to define the EMR scientifically it can be said as a
form of energy emitted or absorbed by charged particles which exhibits wave-like behavior
as it travels through space
The electromagnetic spectrum is the entire range of all possible frequencies of
electromagnetic radiation (Figure 2) This includes the electromagnetic energy ranging from
Gamma rays to radio waves where the wavelength becomes longer so the energy and
frequency gradually decreases There are four kinds of resolution that are described from the
EMR spectrum are as follows
Figure 1 Illustration on the concept of EMR in which
propagation of electric and magnetic field is shown
Source - httpwwwfaoorg3t0355eT0355E02HTM accessed on 25
th
April
2021
DHARAIYA A Remote sensing
Prithivya | August 2021 46
1 Spectral resolution ndash it is the variation in the reflectanceemittance as a function of
wavelength Spectral responses are recorded by separate spectral bands such as Red Blue
Green Thermal NIR etc Figure 3 depicts the spectral resolution through a reflectance
curve It is further divided into 4 class sub classes
a Panchromatic ndash It consists
of only 1 band (BW)
b Colour ndash It consists the
combinations of 3 colors of
visible spectrum (RGB)
c Multispectral ndash consists of
3 to 10 bands and offers
Medium level spectral
resolution(Feng et al 2020)
d Hyper spectral ndash consists
of 100s of band and offers
higher spectral resolution (Feng et al 2020)
The combinations of spectral reflectance from two or more wavelength that indicate the
relative abundance of feature of interest are known as spectral indices Vegetation indices are
the most popular type but other indices are available for burned area built-up features
Figure 2 Electromagnetic spectrum showing waves and the radiations with respect to
wavelength and frequency
Figure 3 Spectral reflectance curve to determine spectral
resolution
Source -httpgsphumboldtedu accessed on 8th
April 2021
Source ndashLillesand et al (2015) Remote sensing and Image interpretation 7e
DHARAIYA A Remote sensing
Prithivya | August 2021 47
hydrologic and geologic features The band combinations for formulating spectral indices
vary from satellite to satellite Some of the most common spectral indices are listed in
Table1
No Spectral indices Formulation
(Band combinations)
1 NDVI (Normalised Difference Vegetation
Index)
NIR ndash Red NIR + Red (Where NIR is
Near-infrared band)
2 NDWI (Normalised Difference Water Index)
NDMI (Normalised Difference Moisture Index)
NIR - SWIR NIR + SWIR
3 AVI (Advanced Vegetation Index) [NIR (1-Red) (NIR-Red)] 13
4 NDSI (Normalised Difference Snow Index) Green ndash SWIR Green + SWIR
5 SAVI (Soil Adjusted Vegetation Index) ((NIR ndash R) (NIR + R + L)) (1 + L)
Where L is soil brightness correction
factor
6 MSI (Moisture Stress Index) MIR NIR Where MIR is Middle-wave
Infrared
7 NDGI (Normalised Difference Glacier Index) NIR ndash Green NIR + Green
8 NDBI (Normalised Difference Built-up Index) SWIR ndash NIR SWIR + NIR
9 BSI (Bare Soil Index) ((Red + SWIR) ndash (NIR + Blue)) ((Red
+ SWIR) + (NIR + Blue))
2 Spatial resolutionndashIt is described as the measure of the smallest object that can be resolved
by the sensor or the ground area imaged for the instantaneous field of view (IFOV) of the
ground sensor or the linear dimension on the ground represented by each pixel in the
reflectanceemittance determined by the shape size and texture of the target as discussed in
the book entitled Advance Remote Sensing 2012 It is expressed in meters like (250 m 80
m 10 m 1 m resolutions etc) Figure 4 is an example of spatial resolution
10 m resolution 30 m resolution
(a) (b)
Table 1 Different kinds of Spectral indices with respect to their formulations of band
Source -httpsgiscrackcomlist-of-spectral-indices
Source -httpsgiscrackcomlist-of-spectral-indices
Source -httpsgiscrackcomlist-of-spectral-indices
combinations
Figure 4 Example of Spatial Resolution by imagery acquired from Sentinel (a) and Landsat (b)
satellite sensors
Source -httpsgiscrackcomlist-of-spectral-indices
DHARAIYA A Remote sensing
Prithivya | August 2021 48
3Temporal resolution ndash the amount of time needed to revisit and acquire data for the exact
same location is called temporal resolution for example the revisit time period of Landsat is
16 days and that of Sentinel is 10 days Figure 5 shows the processed temporal resolution
4 Radiometric resolution ndash When an image is acquired by a sensor its sensitivity to the
magnitude of the electromagnetic energy determines the radiometric resolution The finer the
radiometric resolution of a sensor the more sensitive it is to detecting small differences in
reflected or emitted energy
Components and process of remote sensing
Figure 6 briefly describes the
process of remote sensing
Though the methods for
collection processing and
interpretation of remotely sensed
data are diverse imaging systems
have the following essential
components
Figure 5 Example of Temporal resolution of Las Vegas over time in 1973 2000 and 2006
Figure 6 A generalized process components of remote
sensing technology
Source- httpsseos-projecteuremotesensing
Source - httpswwwgisoutlookcom2019 accessed on 8th
April 2021
DHARAIYA A Remote sensing
Prithivya | August 2021 49
1 Energy source or illumination
This is the basic requirement for process of remote sensing to have a source of energy that
illuminates electromagnetic energy to the target of interest for example Active and passive
ensors Mostly the sensors are passive which tends to measure the solar radiation reflected
from the target
2 Interaction with the atmosphere
Before the electromagnetic radiation reaches the Earths surface it has to travel through some
distance of the Earths atmosphere Particles and gases in the atmosphere can affect the
incoming light and radiation and such type of effects are caused by the mechanisms
of scattering and absorption (Figure 7)Scattering occurs when particles or large gas
molecules present in the atmosphere interacts and cause the electromagnetic radiation to be
redirected from its
original path It depends
on several factors
including the
wavelength of the
radiation the abundance
of particles or gases and
the distance the radiation
travels through the
atmosphere There are three 3 types of scattering which take place are described in Table 2
All the different types of scattering with examples are briefly shown in figure 8
No Types of Scattering Particle size
(Micro meters
μm)
Examples
1 Rayleigh lt 01 μm Small specks of Dust N2 O2
molecules
2 Mie ~ 1 to 10 μm Pollen Smoke Water vapour
3 Non ndash Selective gt 10 μm Water droplets and large dust
particles
Figure 7 Interaction of EMR with atmosphere (a) Scattering and (b)
Absorption
Table 2 Different types of scattering occur when EMR interacts with the atmosphere
Reference httpswwwnrcangccamaps-tools-publications
DHARAIYA A Remote sensing
Prithivya | August 2021 50
Absorption is the other main mechanism when EMR interacts with the atmosphere In
Contrast to scattering it causes molecules in the atmosphere to absorb specific amount of
energy at various wavelengths O3 CO2 and water vapour are 3 main atmospheric
constituents which absorbs radiation Those areas of the EMR spectrum which are not
severely influenced by atmospheric absorption and thus are useful for remote sensors are
called Atmospheric windows (Figure 9) The visible portion of the spectrum to which our
eyes are most sensitive corresponds to both the atmospheric window and the peak energy
level of the sun
Figure 8 Different types of scattering when EMR interacts in the atmosphere or with the
Earthrsquos surface
Figure 9 Atmospheric window showing the transmission of molecules at different wavelength
with respect to different radiations
Source - httpwwwgeooregonstateedu accessed on 8th
April 2021
Source - httpwwwsarraceniacomastronomy accessed on 8th
April 2021
DHARAIYA A Remote sensing
Prithivya | August 2021 51
3 Interaction with the target
After the interaction with atmosphere once the energy makes its way to the target through the
atmosphere it interacts with the target depending on the properties of both the target and the
radiation Figure 10 shows such examples of interaction This can take place a second time as
the energy travels back from the target to sensor Several interactions are possible when
electromagnetic energy encounters matter whether solid liquid or gases are as follows
Radiation may be transmitted or passed through the substance
It may be absorbed and give up its energy largely to heating the substance
It may be emitted as a function of its emissivity and temperature
It may be reflected in 2 ways specular and diffused (Scattered)
4 Recording of Energy by the sensor
After the energy has been scattered by or emitted from the earthrsquos surface there is a need for
a sensor which is mounted on a satellite to collect and record the EMR The sensors are
popularly known by EMR region they sense Remote sensing has a broad classification of
optical and microwave as well as active and passive remote sensing as discussed by
Navalgund et al(2007) Feng et al (2020) Ray (2013) The sensors for taking
observations needs to be mounted on a platform This could be ground based (eg handheld
radiometers) airborne (eg Drone AVIRIS sensor of NASA on board aircraft) or space-
borne (ie satellite based)
Figure 10 EMR interaction with the Earthrsquos Surface
Source httpswwwslideservecomportia copy Rick Lathrop accessed on 25th
April 2021
DHARAIYA A Remote sensing
Prithivya | August 2021 52
5 Transmission Reception and Processing
The energy recorded by the sensor has to be transmitted often in electronic form to a
receiving and processing station at the earth where the data are processed and stored in digital
form
6 Interpretation and analysis
Furthermore this processed data is interpreted visually and digitally to extract information
about the target which was illuminated There are numerous specialised instruments or
hardware and software used that are commonly known as image processing tools which
involves four basic steps viz image correctionrestoration image enhancement image
transformation and image classification
7 Application
The final element or component of remote sensing process is achieved when we apply the
extracted and processed information in solving a particular issue or problem Specialists who
work in each application theme are able to perform and carry out this task
Applications of remote sensing
Every application itself has some specific demands for spectral spatial radiometric and
temporal resolution of the satellite sensor (Shandilya et al 2013) In modern era the remote
sensing proved very effective to understand and resolve the challenges in almost all the
fields few of its major applications are illustrated in this article
1 Geology
In the field of geosciences the remote sensing techniques are applied to interpret and analyse
the bedrock lithological structural formations sedimentation(Merritt et al 2014 Stead et
al 2019) planetary surface monitoring (Clark et al 2003 Des Marais et al 2002 Shepard
et al 2001)geo-hazards and mineral exploration through observation and modelling
techniques
DHARAIYA A Remote sensing
Prithivya | August 2021 53
2 Hydrology
Some examples of applications of remote
sensing in hydrological science include
soil moisture estimation flood and
wetland monitoring watershed and
drainage modelling river delta change
detection and many more Figure 11 and
12are an example of one of the studies
undertaken for hydrological modelling
and mapping of wetlands respectively
(Dharaiya 2020a Dharaiya et al 2021)
3 Glaciology
By means of remote sensing one can acquire information and map the ice concentration ice
type or motion(Frey et al 2014 Jiyang Chen amp Ohmura 1990) iceberg detection glacier
copy
Adi
tya
D
Figure 11 Drainage modelling in Jambughoda
Wildlife sanctuary Gujarat (after Dharaiya
2020a)
copy
Aditya
D Figure 12 Mapping of wetlands in Patan district Gujarat (Dharaiya et al 2021)
DHARAIYA A Remote sensing
Prithivya | August 2021 54
dynamics (Pratibha amp Kulkarni 2018 Remya et al 2019) monitor snow thickness
(Gantayat et al 2014 Kulkarni et al 2002) meteorological change research snow-water
equivalence snowmelt run-off estimation and many more
4 Agriculture
In the science of agriculture the remote sensing is mostly used as a decision-making tool viz
for crop type classification crop condition assessment crop yield estimation soil characters
soil management practices and compliance monitoring (Zheng et al 2014)
5 Forestry
Forestry is one of the major sectors where remote sensing has proved as very effective tool It
has been used for reconnaissance mapping commercial forestry and environmental
monitoring are some objectives which can be fulfilled and that further helps in managing and
conserving the natural resources Figure 13 is an example of mapping the forest coverat
Ratanmahal wildlife sanctuary Gujarat using spectral indices
6 Land use Land cover (LULC)
Yacouba et al (2010) has discussed the LULC with reference to two terms lsquoland usersquo which
refers to the purpose the land serves and lsquoland coverrsquo refers to natural surface cover on the
ground For example it is widely used in habitat and natural resource management urban
expansion baseline mapping risk assessment legal boundaries for tax evaluation change
Figure 13 Forest cover map of Ratanmahal wildlife sanctuary Gujarat copy Aditya Dharaiya
DHARAIYA A Remote sensing
Prithivya | August 2021 55
detection etc Figure 14 and 15depicts the LULC classification and change detection of
wetlands respectively (Dharaiya 2020b Dharaiya et al 2021)
copy
Adity
a D
Figure 14 LULC classification with vegetation cover in Girnar Wildlife sanctuary
Gujarat (After Dharaiya 2020b)
Figure 15 Change detection of wetlands in Patan district Gujarat using Landsat 8 OLI
(Dharaiya et al 2021)
DHARAIYA A Remote sensing
Prithivya | August 2021 56
7 Coastal monitoring
Remote sensing can be used to gather information about oceanic processes(physical and
biological) oil spill (Alesheikh et al 1997 Fingas amp Brown 1997) and shipping by means
of remote sensing
Several other applications according to Shandilya et al (2013) include planimetry or land
surveying using very high spatial resolution satellites (30 cm) Generating Digital Elevation
Models (DEMs) from remote sensing products are used to generate elevation profiles by
means of radar interferometry radargrammetry and photogrammetry To extract the
planimetric details about mineral exploration activities topographic mapping and surface
monitoring base map imagery provides a priori information about the areas
Conclusion
This emerging technique of remote sensing is a significant tool to monitor the Earthrsquos
surface It has progressively expanded applications which allow users to collect interpret
and manipulate data over vast areas Multi-temporal satellite data help to delineate changes of
the earthrsquos surface thus it can be also said to be a useful and handy tool for all the users as it
increases the accuracy efficiency and quality of the analysis in such a way that it can be
helpful in decision-making process Furthermore the products can be conveniently used by
other scientists too who are even not much familiar with this technology and for the greatest
level of detail to be extracted
References
Alesheikh A A Ghorbanali A amp Nouri N (1997) Coastline change detection using
remote sensing International Journal of Environmental Science and Technology 4(1)
1ndash11
Clark R N Swayze G A Livo K E Kokaly R F Sutley S J Dalton J B
McDougal R R amp Gent C A (2003) Imaging spectroscopy Earth and planetary
remote sensing with the USGS Tetra order and expert systems Journal of
Geophysical Research E Planets 108(12) httpsdoiorg1010292002je001847
Des Marais D J Harwit M O Jucks K W Kasting J F Lin D N C Lunine J I
Schneider J Seager S Traub W A amp Woolf N J (2002) Remote sensing of
DHARAIYA A Remote sensing
Prithivya | August 2021 57
planetary properties and biosignatures on extrasolar terrestrial planets Astrobiology
2(2) 153ndash181 httpsdoiorg10108915311070260192246
Dharaiya A (2020a)Monitoring and assessment of forest ecosystem using geospatial
technology A case study of Jambughoda wildlife sanctuary Gujarat India Poster
presented at ISRS National Symposium-2020
Dharaiya A (2020b) Habitat Analysis of Girnar Wildlife Sanctuary using Geospatial
Techniques Paper presented at National Map Competition GIS Day-2020
Dharaiya N Bhati R and Patel J (2021) Ecological studies on selected wetlands of Patan
district to prepare management plan for long-term conservation Technical Report
WCB Research Foundation Patan 91Pp
Feng X He L Cheng Q Long X amp Yuan Y (2020) Hyperspectral and multispectral
remote sensing image fusion based on endmember spatial information Remote
Sensing 12(6) 1ndash17 httpsdoiorg103390rs12061009
Fingas M F amp Brown C E (1997) Review of oil spill remote sensing Spill Science and
Technology Bulletin 4(4) 199ndash208 httpsdoiorg101016S1353-2561(98)00023-1
Frey H Machguth H Huss M Huggel C Bajracharya S Bolch T Kulkarni A
Linsbauer A Salzmann N amp Stoffel M (2014) Estimating the volume of glaciers
in the Himalayan-Karakoram region using different methods Cryosphere 8(6) 2313ndash
2333 httpsdoiorg105194tc-8-2313-2014
Gantayat P Kulkarni A V amp Srinivasan J (2014) Estimation of ice thickness using
surface velocities and slope Case study at Gangotri Glacier India Journal of
Glaciology 60(220) 277ndash282 httpsdoiorg1031892014JoG13J078
Jiyang Chen amp Ohmura A (1990) Estimation of Alpine glacier water resources and their
change since the 1870s Hydrology in Mountainous Regions I 5(193) 127ndash135
Joseph G (2005) Fundamentals of Remote sensing 2e Orient Blackswan 2Rev ed Pp i-
xi 1-486
DHARAIYA A Remote sensing
Prithivya | August 2021 58
Kulkarni A V Srinivasulu J Manjul S S amp Mathur P (2002) Field based spectral
reflectance studies to develop NDSI method for snow cover monitoring Journal of
the Indian Society of Remote Sensing 30(1ndash2) 73ndash80
httpsdoiorg101007BF02989978
Lillesand T Kiefer R Chipman J (2015) Remote sensing and Image interpretation 7e
John Wiley amp sons Inc Pp 1-736
Merritt A J Chambers J E Murphy W Wilkinson P B West L J Gunn D A
Meldrum P I Kirkham M amp Dixon N (2014) 3D ground model development for
an active landslide in Liasmudrocks using geophysical remote sensing and
geotechnical methods Landslides 11(4) 537ndash550 httpsdoiorg101007s10346-
013-0409-1
Navalgund R Jayaraman V Roy P (2007) Remote sensing applications An overview
Current Science 93(12) 1747-1766
Pratibha S amp Kulkarni A V (2018) Decadal change in supraglacial debris cover in Baspa
basin Western Himalaya Current Science 114(4) 792ndash799
httpsdoiorg1018520csv114i04792-799
Ray S (2013) Basics of Remote Sensing Remote Sensing Image Analysis Including the
Spatial Domain 1ndash15 httpsdoiorg1010071-4020-2560-2_1
Remya S N Kulkarni A V Pradeep S amp Shrestha D G (2019) Volume estimation of
existing and potential glacier lakes Sikkim Himalaya India Current Science 116(4)
620ndash627 httpsdoiorg1018520csv116i4620-627
Shandilya K K Shukla S P amp Pathak V (2013) Applications of Remote sensing
Horizons of Earth sciences Vol 10 1ndash12
Shepard M K Campbell B A Bulmer M H Farr T G Gaddis L R amp Plaut J J
(2001) The roughness of natural terrain A planetary and remote sensing perspective
Journal of Geophysical Research E Planets 106(E12) 32777ndash32795
httpsdoiorg1010292000JE001429
DHARAIYA A Remote sensing
Prithivya | August 2021 59
Stead D Donati D Wolter A amp Sturzenegger M (2019) Application of remote sensing
to the investigation of rock slopes Experience gained and lessons learned ISPRS
International Journal of Geo-Information 8(7) httpsdoiorg103390ijgi8070296
Yacouba D Guangdao H amp Xingping W (2010) Applications of Remote Sensing in
Land UseLand Cover Change Detection in Puer and Simao Counties Yunnan
Province Report and Opinion 2(9) 7ndash16
Zheng B Campbell J B Serbin G amp Galbraith J M (2014) Remote sensing of crop
residue and tillage practices Present capabilities and future prospects Soil and
Tillage Research 138 26ndash34 httpsdoiorg101016jstill201312009
Types of resolution used in remote sensing
httpwwwedcuriedunrsclassesnrs409rslectureshowremotesensonworkpdfacce
ssed on 24th April 2021
Components of remote sensing ndash Scattering and absorption httpswwwnrcangccamaps-
tools-publicationssatellite-imagery-air-photosremote-sensing-
tutorialsintroductioninteractions-atmosphere14635accessed on 24th April 2021
Basic concepts of Electromagnetic radiation and
spectrumhttpgsphumboldteduOLMCoursesGSP_216_Onlinelesson1-
2spectrumhtmlaccessed on 24th April 2021
Concept of spectral indices httpswwwl3harrisgeospatialcomdocsspectralindiceshtml
accessed on 25th April 2021
Suggested citation
Dharaiya A (2021) Remote sensing and An overview with fundamentals and applications
Prithivya An Official Newsletter of WCB Research Foundation and WCB Research Lab Vol 1(2)
44-59
M I PATEL AWARD 2021
Prithivya | August 2021 60
M I Patel Award for Young Wildlife amp Conservation Biologist
Nominations for 2021 Award
Ms Shivangi Mishra
Shivangi is a Senior Research Fellow (Basic Scientific
Research Fellow UGC) at University of Lucknow and is
currently working on Egyptian Vultures She has also
worked on Butterflies of Uttar Pradesh from 2014- 2016
She has presented her research on Egyptian Vultures in
Conference of Raptor Research Foundation in 2018
(South Africa) 2019 (USA) and awarded with William C
Andersen Award and James Koplin Award respectively In
future also she wants to contribute her research for the
conservation of Egyptian Vultures in India
Dr Tarang Kumar Shah
Tarang is an Assistant Professor in Fisheries polytechnic at
Dau Shri VasudevChandrakarKamdhenuVishwaVidyalaya
Durg He studied the Effect of Thymus linearis plant
Extract on Growth Performance and Non-Specific Immune
Responses of endangered Golden Mahseer (Tor
putitora)against the disease caused
byOomycetesSaprolegniaparastica He found that the leaf
extract of Thymus plant has the antifungal properties and a
small quantity of which can control the population against
saprolegniosis
Dr Sujit Kolangath
Sujit is a subject specialist in animal biotechnology at
Wildlife Research amp Training Center Gorewada Nagpur
He studied the qualitative and quantitative aspect of
hepatoozoonfelis epidemiology in a tiger cub He reported
that the infection is transmitted by ingestion of infected
ticks infected prey and carrion and concurrent infection
with bacterial or viral infections may be fatal to the
infected animal
M I PATEL AWARD 2021
Prithivya | August 2021 61
Ms Jis Sebastian
Jis recently completed her doctoral research in Botany
from Madurai Kamraj University Madurai- Tamil Nadu
She is studying the pattern of diversity spatial distribution
and community structure of epiphytic orchids of southern
Western Ghatsresponds to availibility of
microenviornments (Microhabitat supported by
Microclimates) in the structurally diverse trees There for
Conservation of epiphytic orchids would ensure
conservation of old aged natural structurally complex
trees in the forest ecosystem
Dr Harshil Patel
Harshil is a naturalist working mainly on systematics and
taxonomy of reptiles and amphibians He studied the
amphibians amp reptiles of northern Western Ghats of
Gujarat He found a new Miocene divergent endemic
lineage of a racer snake evolutionary history of an
endemic snake resulted in the resurrection of a genus
reinvestigation of a gecko species complex that resulted
into the discovery of two new species
The final round including the presentation by the nominees followed by the award
ceremony will be conducted on September 27 2021 at M N College Visnagar (Gujarat)
WCB and the M I Patel Award committee congratulate all the nominees and wishing all
the best for their presentation
Applications and nomination for the 2022 awards are now open through our website
(wwwwcbresearchin) till June 30 2022
ANNOUNCEMENT
Prithivya | August 2021 62
ANNOUNCEMENT
Prithivya | August 2021 63
WINNERS OF MANGROVE DAY POSTER
COMPETITION
Prithivya | August 2021 64
WCB Research Foundation with K J Somaiya College Mubai have organized Digital and
Handmade Posters Competition on the occasion of World Mangrove Day July 26 2021 Out
of entries of thirty participants three best posters were selected by the committee and
awarded
Posters of Winners
1st Prize Digital Poster Ms Yukta Sawant
WINNERS OF MANGROVE DAY POSTER
COMPETITION
Prithivya | August 2021 65
1st Prize Digital Poster Ms Yukta Sawant
1st Prize Handmade Poster Ms Tanya Sawardekar
WCB RESEARCH FOUNDATION GOVERNING COUNCIL
Prithivya | August 2021 66
Governing Council of WCB Research Foundation
Executive
Director
Dr Hardik Patel Assistant Professor
Parul University Vadodara
phardik80gmailcom
Director of
Research
Dr Nishith Dharaiya Associate Professor
HNG University Patan
nadharaiyanguacin
Member Dr Sagarika Damle Associate Professor amp Head
Department of Life Sciences KC College Mumbai
sagarikadamlekccollegeeduin
Member Dr Nuria Selva Associate Professor
Institute of Nature Conservation
Polish Academy of Science Krakow Poland
nuriaselvagmailcom
Member Mr Pratik Desai Jr Research Fellow
WCB Research Lab Patan
pratikdesai825gmailcom
Member Mr M S Patel Associate Professor
M N College Visnagar martinleemsgmailcom
Member Dr Haresh Gondaliya Assistant Professor
Shri G D Modi Science College Palanpur hareshgondliya55gmailcom
Member Mr Prasad Patil Range Forest Officer
Gujarat Forest Department jalu1890gmailcom
Member Ms Madhuri Padaya Assistant Professor
K J Somaiya College of Science Mumbai padayamadhuriyahoocom
Member Dr Jagruti Rathod Director
Center for Nature amp Ecosystem Wellbeing Vadodara
rathod21gmailcom
Member
Secretary
Ms Jahnvi Patel Admin Officer
WCB Research Foundation Patan
adminwcbresearchin
Page 1 of 7 Pruthivya An official newsletter of WCB Research Foundation
Guidelines to authors and contributors 1 | P a g e
Instructions for authors
Scope Prithivya is a tri-annual newsletter of WCB Research Foundation and will
publish manuscripts on wildlife conservation biology and its allied areas
Guidelines to contributors of Prithiviya
Manuscript Types Prithiviya publishes original research articles short notes
field notes reviews and comments Submissions should be in English (UK) only
All manuscripts should be easy to read and comprehend Manuscripts may be
edited for length content and style and be sent to referees when found to be
appropriate The editor will discuss contributions with authors and advise to
modified whenever required
Submission is considered on the condition that papers are previously
unpublished have not been offered simultaneously elsewhere and that all
contributors have read and approved the contents
The editor will acknowledge manuscript contributions and assign them a unique
registration number which latter must be quoted in correspondence Papers are
peer-reviewed although the editor reserves the right to reject one without a
review
Preparation and submission of manuscripts
1 Title page Add full title Authors name and affiliation with email of all the Authors Abstract (250 Words) and Key words (4-5)
2 Submitted manuscripts should generally follow the normal convention of
scientific manuscripts keywords generally not appearing in the title
Introduction Materials and Methods Results and Discussion
Acknowledgments Authors contribution (optional) Appendices (optional) and
References) with the replacement or addition of sections allowed in between
the Introduction and the Acknowledgments
3 The manuscript should be typed in MS Word with left-aligned typesetting and
only true type fonts (Times new roman preferable) should be used The line
spacing must be 15 and the font size of 12 Headings should be bold and sub-
headings should be made italicized
Page 2 of 7 Pruthivya An official newsletter of WCB Research Foundation
Guidelines to authors and contributors 2 | P a g e
4 Title A concise informative and attractive and short title with 5-20 words will
be encouraged
5 Abstract Word limit for the abstract is 250 words and should contain a
summary of all major findings or conclusions of the study however abstract
is not required in case of short notes field notes and other short
communication
6 Introduction should be clearly written and must covering the objectives and
significance of the study
7 Methodology A detailed methodology is always encouraged The methodology
should contain the study area (if applicable) data collection analysis and
interpretation Authors should also mention the instruments software used
for the experiments and analysis
8 Result and discussions which contain main result with proper references
and authentic justifications include graph table photographs (No checklist
it directly goes into appendix or supplementary data)
9 Conclusions A short and comprehensive conclusion with significant novel
findings and depicting your research in a nut-shell
10 Acknowledgments which contain all funds support persons who help
during project or research or findings name of university other than they work
etc
11 Checklist-based papers like trip reports should contain dates of the trip total
number of birders or participants Mammals reptiles amphibians
invertebrates etc
12 Manuscripts should be sent electronically as an email attachment to the
Editorial Assistant with a cover letter to helliphellip
13 The text tables figurephotograph captions (which must be self-explanatory)
and appendices should be combined in one Microsoft Wordreg (ldquodocrdquo OR
ldquodocxrdquo) file format The preferred font is lsquoTimes New Romanrsquo in 12 point
14 Photographs artwork maps (the outlines of the Republic of India should
conform to Government of India regulations) diagrams etc should be
digitized and sent separately along with the manuscript or if they are large
Page 3 of 7 Pruthivya An official newsletter of WCB Research Foundation
Guidelines to authors and contributors 3 | P a g e
files in separate trailing e-mails These should be in TIFF and at least 8times11
inches in 300 dpi resolutions JPEG files must be lsquomaximumrsquo quality ie at
their minimum compression Maps should be marked with a scale and North
arrow and should carry a clear caption
15 Authors whose work involves the handling of any necessary permissions from
the requisite government agencies to do so The editor reserves the right to
view such permissions at herhis discretion
16 While photographing nestingcourtship display or any behavioural activity
including those of nests eggs courtship etc authorsphotographers must
ensure the safety of the animals involved and also ensure that they do not
disturb in any way whatsoever in the course of their photography The editor
reserves the right to view permissions for such activities within protected
areas The editorreferee reserves the right to query an author regarding the
ethics of photography and the methodology followed while photographing
including that of rejecting a manuscript if unsatisfied on these counts
Types of Manuscript
1 Short Research articles 2000 to 2500 words
2 Short notes Up to 1500 words
3 Important sightings 250-350 words with proper GPS location and
photographic evidence
4 Important findings 250-500 words with proper GPS location with image
5 Full-length Research paper Up to 10000 words with appendix excluding
photographs only
Other important Guidelines
Scientific binomials should comprise the generic and specific names but should
not include the name of the author and year of citation Scientific trinomials
should be mentioned only if the nature of the manuscript requires them
For example both the English and scientific name must be given thus ldquoHouse
Crow Corvus splendensrdquo thereafter only the English name ldquoHouse Crowrdquo will
suffice English and scientific names should follow the proper book that should
be mention in reference and title of the table
Page 4 of 7 Pruthivya An official newsletter of WCB Research Foundation
Guidelines to authors and contributors 4 | P a g e
Metric units and their international symbols must be used eg ldquosq kmrdquo and
ldquo1000 m aslrdquo dates and times should be of the form of MMDDYYYY (January
01 2021rdquo and ldquo1345 hrdquo respectively
Tables should be within gridlines (which may or may not be printed) Tables
should never be formatted with wrap-around text
Latitude and longitude coordinates should follow the format ldquo27807ordmN
74094ordmErdquo
Enzyme Nomenclature The trivial names recommended by the IUPAC-IUB
Commission should be used When the enzyme is the main subject of a paper
its code number and systematic name should be stated in its first citation in the
paper
Symbols and Abbreviations Use only standard abbreviations The use of non-
standard abbreviations can be extremely confusing to readers Avoid
abbreviations in the title The full term for which an abbreviation stands should
precede its first use in the text unless it is a standard unit of measurement
Page number (page 1 0f 10 formats) must be on top right corner of the word
documents font size 10 and times new roman word type
Citation and References Prithivya encourages the authors to use Mendely EndNote or other reference management tools for proper citations We follow APA referencing style
Do not abbreviate references pagination should be given in the expanded form
eg ldquoindashvi 1ndash250rdquo not ldquovi 250rdquo the page numbers should be separated by an
lsquoEnrsquo dash
Italics should be used for book titles but not volume numbers when citing
periodicals use italics for the journal name not the article title
References should be arranged alphabetically by the first author (and in the case
of more than one author by second and subsequent authors)
Citations to references in the text should follow the style ldquo(Santharam 1978)rdquo
ldquo(Barua amp Sharma 1999)rdquo ldquo(Pande et al 2002)rdquo ldquo(Lainer 1999 2004)rdquo ldquo(Lainer
1999abcd Lainer 1999a 2000a)rdquo [for several papers by an authors from
Page 5 of 7 Pruthivya An official newsletter of WCB Research Foundation
Guidelines to authors and contributors 5 | P a g e
amultiple calendar years] and ldquo(Neelakantan et al 1993 Sashikumar et
al 2011)rdquo
A string of citations in the text should follow a chronological not an alphabetical
order thus ldquo(Ali amp Ripley 1981 Kazmierczak 2000 Grimmett et al 2011)rdquo
When citing unpublished sources please use the following formats if the source
is written material ldquo(Harkirat Sangha in litt e-mailletter dated 02 January
2013)rdquo if oral ldquo(Rajah Jayapal verbally dated 15 December 2013)rdquo
When citing from e-Bird or any other magazine checklist please enter the author
of the e-Bird checklistrsquos name or others name and the year the checklist was
uploaded in the text ldquo(Raman 1994)rdquo If a checklist thatrsquos shared amongst
multiple observers is being referred to only the relevant checklist(s) should be
used for citation
See examples below for detailed formatting
Journal articles
Pittie A 2011 The dates of seven new taxa described by W E Brooks (Certhia
Hodgsoni Sitta Cashmirensis Dumeticola
major Horites [sic] Pallidus Phylloscopus Tytleri Motacilla Cashmirensis
and Alauda Guttata) Prithiviya7 (2) 54ndash55
Naoroji R amp Sangha H S 2011 Threats to habitat and wildlife in Changthang
and Rupshu areas of Ladakh a case study at Hanle Prithiviya7 (1) 2ndash6
Choudhary D N Mandal J N Mishra A amp Ghosh T K 2010 First ever
breeding record of Black-necked Stork Ephippiorhynchus asiaticus from
Bihar Prithiviya6 (3) 80ndash82
Books
Futehally Z (ed) 2006 India through its birds 1st ed Bangalore India
Dronequill Publishers Pvt Ltd Pp indashii 1ndash214
Pittie A 2010 Birds in books three hundred years of South Asian ornithologymdash
a bibliography 1st ed Ranikhet Permanent Black Pp indashxxi 1ndash845
Sashikumar C Praveen J Palot M J amp Nameer P O 2011 Birds of Kerala
status and distribution 1st ed Kottayam Kerala DC Books Pp 1ndash835 Book chapter
Pittie A 2011 Stray Feathers (1872ndash1899) (p 247) In Priority The dating of
scientific names in ornithology a directory to the literature and its
Page 6 of 7 Pruthivya An official newsletter of WCB Research Foundation
Guidelines to authors and contributors 6 | P a g e
reviewers Dickinson E C Overstreet L K Dowsett R J amp Bruce M D
(eds) Northampton UK Aves Press Limited Website
2013 Kadalundi makes history with new gull species The
Hindu (Thiruvananthapuram ed) dated February 7 2013
Website httpwwwthehinducomtodays-papertp-nationaltp-
keralakadalundi-makes-history-with-new-gull-speciesarticle4388171ece
[Accessed on 21 July 2014] Any magazine checklist
Raman T R S 1994 Website
URL httpebirdorgebirdviewchecklistsubID=S21694571 [Accessed on
15
December 2015]
ETHICAL MATTERS Authors involving in the usage of experimental animals and human subjects in their
research work should seek approval from the appropriate Institutional Animal Ethics
Committee in accordance with Principles of Laboratory Animal Care The material
and methods section of the manuscript should include a statement to prove that the
investigation was approved and that informed consent was obtained
Disclaimer
While every care is taken of manuscripts and their accompanying
material Prithiviya cannot be held responsible for accidental loss or damage of
any material sent for publication or for their return whether they are accepted
for publication or not
Material published in Prithiviya reflects the views of the authors and not
necessarily those of the publishers editors referees etc
The editor reserves the rights to make necessary changes in manuscripts in
consultation with the author
All submissions are evaluated under the assumption that the conditions listed here have been understood and accepted by the author(s)
Submission fees There will be no submission fees for e-publication however we
may produce the reprints on request and on payment basis
Page 7 of 7 Pruthivya An official newsletter of WCB Research Foundation
Guidelines to authors and contributors 7 | P a g e
Special announcements
We also accept announcement of workshop webinar conference symposium job
opportunities academic courses etc with nominal charges and guarantee for its
wider circulation
Contacts Editor in Chief Dr Sagarika Damle Emailvisaanikagmailcom Associate Editors Dr Nishith Dharaiya
Email nadharaiyagmailcom Dr Jagruti Rathod Email rathod21gmailcom Editorial Assistant Ms Rinku Bhati
Email bhatirinku178gmailcom
WCB Research FoundationAdding Science to Conservation
wwwwcbresearchin
- 001_Cover Page
- 002_Editorial Board_2
- 003_Table of Contents_Issue 2
- 004_Editorial and Directors Column
- 005_Chaudhary and Desai 1-3
- 006_Dave 4-11
- 007_Amin et al 12-17
- 008_Thakkar and Gohil 18-21
- 009_Marjadi 22-23
- 010_Patel and Patel 24-27
- 011_Pithva and Dharaiya 28-36
- 012_Panchal and Jha 37-43
- 013_Dhaaraiya 44-59
- 014_MI Patel Award Nominee 60-61
- 015_Announcements 62-63
- 016_Posters Competition Winners 64-65
- 017_ WCB Council and Board 66
- 018_Prithiviya_Guidelines Final
- 019_Last page
-
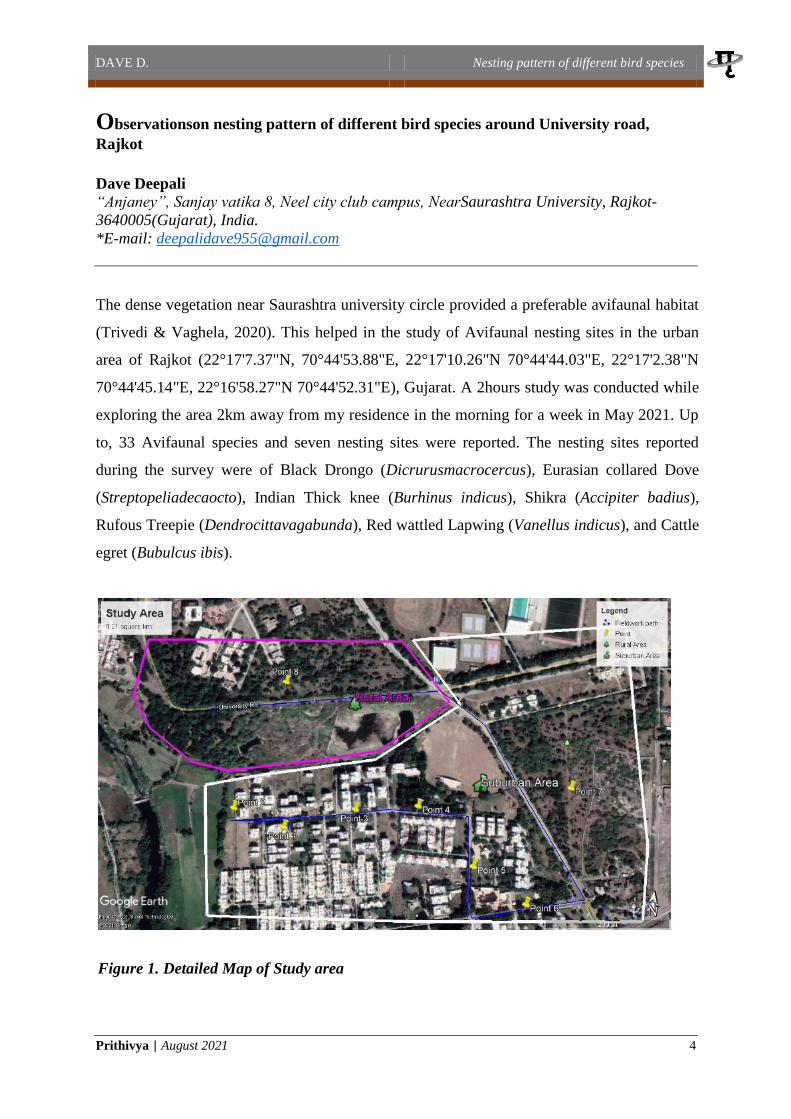
DAVE D Nesting pattern of different bird species
Prithivya | August 2021 4
Observationson nesting pattern of different bird species around University road
Rajkot
Dave Deepali ldquoAnjaneyrdquo Sanjay vatika 8 Neel city club campus NearSaurashtra University Rajkot-
3640005(Gujarat) India
E-mail deepalidave955gmailcom
The dense vegetation near Saurashtra university circle provided a preferable avifaunal habitat
(Trivedi amp Vaghela 2020) This helped in the study of Avifaunal nesting sites in the urban
area of Rajkot (22deg17737N 70deg445388E 22deg171026N 70deg444403E 22deg17238N
70deg444514E 22deg165827N 70deg445231E) Gujarat A 2hours study was conducted while
exploring the area 2km away from my residence in the morning for a week in May 2021 Up
to 33 Avifaunal species and seven nesting sites were reported The nesting sites reported
during the survey were of Black Drongo (Dicrurusmacrocercus) Eurasian collared Dove
(Streptopeliadecaocto) Indian Thick knee (Burhinus indicus) Shikra (Accipiter badius)
Rufous Treepie (Dendrocittavagabunda) Red wattled Lapwing (Vanellus indicus) and Cattle
egret (Bubulcus ibis)
Figure 1 Detailed Map of Study area
DAVE D Nesting pattern of different bird species
Prithivya | August 2021 5
Point1 from the above figure indicates my residence where fieldwork was started Based on
vegetation and human disturbance the study area was divided into two parts Sub-urban Area
and Rural Area Point 7 and 8 indicates plantations done by the Saurashtra University The
line transect method was used for the field survey Images were captured with the help of
Canon 1200D 55-250 mm lens
Figure 2(a) Figure 2(b)
Figure 2(c) Figure 2(d)
Figure 2 Different photographs of saurashtra university plantation area (Study Area)
Black Drongo (Dicrurusmacrocercus)
The nesting season for Black Drongo is April to August with 3-4eggs as clutch size and 14-
15days incubation period The nest of Black drongo was observed at Point 8 (22deg17737N
70deg445388E) in the plantation site of Saurashtra University It is about 9 to 10 feet high
from ground level and built with twigs rootlets and threads Drongo is known to be a
protective parent and its mobbing behaviour towards Greater Coucal (Centropus sinensis)
Rose-ringed Parakeet (Alexandrinuskrameri) and Asian Koel (Eudynamysscolopaceus) were
DAVE D Nesting pattern of different bird species
Prithivya | August 2021 6
observed during the survey (Nijman 2004) Interspecies interaction between Eurasian
Collared-Dove and Black Drongo was observed during the survey and in previous studies
(Jahan et al 2018) as well where two Eurasian collared Dove made nest near the nest of
Black Drongo Usually birds like Dove do not cause any harm to Drongo Feeding gills for
both species is different as well (Ali 2017 Grimmettet al 2011) Therefore to protect their
eggs from other predators Dove makes their nest in the vicinity of Drongorsquos nest
Figure 3 (a) Figure 3 (b)
Eurasian collared Dove (Streptopeliadecaocto)
The nesting season for Eurasian collared Dove is throughout the year The nest was
observed at Point 8 in the plantation site
of Saurashtra University (22deg17737N
70deg445388E) It was made with twigs
and rootlets at 8-9feet height The clutch
size is 1-2 (Robertson 1990) and
incubation period of eggs is 15-19 days
Within a distance of 3 meters two nests
of Eurasian collared Dove were found
Both nests were in the vicinity of Black
Drongorsquos nest Itrsquos a great example of
species-species interaction By making
nests nearby aggressive Drongorsquos nests
Figure 4 A photograph presenting the nest
of Eurasian collared Dove
(Streptopeliadecaocto) Detailed Map of
Study area
Figure 3 Photographs presenting nest of Black Drongo (Dicrurusmacrocercus)
DAVE D Nesting pattern of different bird species
Prithivya | August 2021 7
Dove could gain protection from other predator species (Jahan et al 2018)
Indian Thick-knee (Burhinus indicus)
Indian Thick-knee is also known as Indian Stone curlew Its nest was found at Point 8 in the
plantation site of Saurashtra University (22deg17737N 70deg445388E) The breeding season
is from March to April The nest was made on the ground surrounded by dead leaves and few
twigs The clutch size for stone curlew is two (Sharma amp Sharma 2015) with incubation
period around 24 days While exploring the study area one egg and one hatchling were
observed which were wonderfully camouflaged with the colour of the ground The egg was
off-white coloured with random brown spots on it At the end of May 2021 another egg was
found broken Both male and female are involved in caring and protecting the hatchlings
against predators (Sharma amp Sharma 2015)
Figure 5 (a) Nest with hatchling and egg Figure 5 (b) Egg
Figure 5 (c) Hatchling Figure 5 (d) Adult Indian Thick-knee
Figure 5 Different photographs of Indian Thick-knee (Burhinus indicus) presenting
developmental stages
DAVE D Nesting pattern of different bird species
Prithivya | August 2021 8
Shikra (Accipiter badius)
The nesting season for Shikra is March to June Shikrarsquos nest was found at Point 8
(22deg171026N 70deg444403E) in the
plantation site of the Saurashtra
University The nest built with twigs
and rootlets at 20feet height from
ground level was observed on the
tallest tree The clutch size for the
Shikra is 3 to 4 eggs with 18-21days
incubation period Usually females
hatch the eggs but in rare cases males
hatch eggs as observed by
Suryawanshi (2021) During the
survey female Shikra was observed
chasing Large-grey Babbler (Argyamalcolmi)
Rufous Treepie (Dendrocittavagabunda)
The breeding season for Rufous Treepie is April to June and with clutch size 3-6eggs
At Point 8 of Saurashtra University plantation site (22deg17737N 70deg445388E) two to three
individuals of Rufous Treepie were seen
Figure 6 A photograph of Adult female Shikra
(Accipiter badius) and her nest
Figure 7 Adult Rufous treepie (Dendrocitta vagabunda) and her nest
DAVE D Nesting pattern of different bird species
Prithivya | August 2021 9
One of them was seen carrying food material while the other was collecting the nesting
materials A single nest of Rufous Treepie was observed and was built with twigs dead
leaves threads old clothing material rootlets and cotton The nest was found at a height of
approximately 20 feet On May 16th 2021 Rufous Treepie was seen feeding juvenile Koel
After a few days another Rufous Treepie was found hatching the eggs
Red-wattled Lapwing (Vanellus indicus)
Breeding season for Red-wattled Lapwing is April to June The egg or nest was not part of the
observation however a juvenile was observed at Point 3 of the Sub-urban area (22deg17238N
70deg444514E) A survey was conducted in May and the eggs might be laid during April The
clutch size is 3 to 4 with an incubation period of 28-30 days The nesting of this bird has no
protection strategies other than camouflaging the eggs with the surroundings to protect those
(Balkhande et al 2017)
Figure 8 (a) Juvenile Red-wattled Lapwing Figure 8 (b) Adult Red-wattled Lapwing
Figure 8 Photographic presentation of juvenile and adult Red-wattled Lapwing (Vanellus
indicus)
Cattle Egret (Bubulcus ibis)
The breeding season for Cattle Egret is June to August Between Point 5 and 6
(22deg165827N 70deg445231E) ten to twelve Cattle Egret nests were found and Egrets
were observed in their breeding plumage During their breeding season adults develop
orange buff plumage on the back breast and crown area Cattle Egrets from their nest in
DAVE D Nesting pattern of different bird species
Prithivya | August 2021 10
colonies Rootlets and twigs are used to build nests Clutch size for Cattle Egret is 2-4 and
the incubation period is between 22-28 days (Patankar et al 2007)
Fig 9 (a) Fig 9 (b)
Figure 9 Cattle egrets (Bubulcus ibis) and their colony
Acknowledgements
I would like to express my gratitude to DrJagruti Rathod for guiding and inspiring me
throughout my study I would also like to thank all the members of WCB Research
Foundation for organizing this internship program and giving me a chance to expand my
knowledge
References
Ali (2017) The Bookof Indian Birds Bombay Natural History Society ISBN 8173714851
Ali Hadjela amp Hassan Syed amp Rana Shahnaz amp Beg Mirza amp Mahmood-ul-Hassan
Muhammad (2007) Brood parasitism of Asian koel (Eudynamys scolopacea) on the
house crow (Corvus splendens) in Pothwar region of Pakistan Pakistan Journal of
Agricultural Sciences 44 627
Balkhande Dr Jayvardhan (2017) Study of Nesting pattern and breeding Biology of Red-
Wattled Lapwing Vanellus Indicus in agricultural field near to Asna River bridge
Nanded (Maharashtra) Research maGma An International Multidisciplinary Journal
ISSN NO- 2456-7078 VOL-1 ISSUE-6 AUG-2017
Grimmett et al (2011) Birds of Indian Subcontinent Helm field guides
ISBN 9781408127636
DAVE D Nesting pattern of different bird species
Prithivya | August 2021 11
Jahan I Begum S Feeroz M M Das D K amp Datta A K (2018) Nesting pattern of
birds in Jahangirnagar University Campus Bangladesh Journal of Threatened Taxa
10(5) 11618ndash11635 httpsdoiorg1011609jot279910511618-11635
Nijman V (2004) Seasonal variation in naturally occurring mobbing behaviour of drongos
(Dicruridae) towards two avian predators Ethology Ecology and Evolution 16(1)
25ndash32 httpsdoiorg1010800892701420049522651
Patankar Pratyush amp Desai Isha amp Shinde Kavita amp Balakrishnan Suresh (2007) Ecology
and breeding biology of the Cattle Egret Bubulcus ibis in an industrial area at
Vadodara Gujarat Zoos Print Journal 22 1011609JoTTZPJ15662885-8
Robertson H A (1990) Breeding of collared doves streptopelia decaocto in rural
oxfordshire england Bird Study 37(2) 73ndash83
httpsdoiorg10108000063659009477043
Sharma M amp Sharma R K (2015) Ecology and breeding biology of Indian stone curlew
(Burhinus indicus) Nature Environment and Pollution Technology 14(2) 423ndash426
Suryawanshi K 2021 Nesting behaviour and diet of Shikra Accipiter badius in Ajanta
Maharashtra Indian BIRDS 17 (2) XXndashXX
Trivedi V amp Vaghela S (2020) Avifauna of saurashtra university campus Rajkot Gujarat
India Journal of Threatened Taxa 12(13) 16764ndash16774
httpsdoiorg1011609jott5113121316764-16774
Suggested citation
Dave D (2021) Observations on nesting pattern of different bird species around university road
Rajkot Prithivya An Official Newsletter of WCB Research Foundation and WCB Research Lab
Vol 1(2) 4-11
AMIN ET AL Record of Leucism in Indian Flying Fox
Prithivya | August 2021 12
Record of Leucism in Indian Flying Fox Pteropus giganteus (Mammalia
Chiroptera Pteropodidae) from South Gujarat India
Amin Siddharth M1 Patel Hiren J2 and Vaghela Prashant P3
1 C129 Bhagyoday Society Opposite Sahyog Police chowki Gorwa Refinery Road
Vadodara - 390024(Gujarat) India 2Sardar Patel Zoological Park Kevadiya ndash 393151(Gujarat) India 3C-27 New Narmada Colony Chhani Jakatnaka Vadodara - 390024(Gujarat) India
E-mail hirenp9408gmailcom
Abstract
Leucism in fruit bat species Pteropus giganteus (Brunnich 1782) is recorded for the first
time from India based on photographic evidence collected from the Anaval Village located in
Surat District of South Gujarat India A total lack of pigmentation in the whole body due to
the failure of melanocytes to migrate to the skin and hair follicles resulting in white or
whitish hairs pale skin but normal coloured eyes are the sign of leucism The present record
can serve as baseline data and will also help understand colour aberration in bats
Key Words Colour aberration Chiropteran Pigmentation Mutation
Introduction
The Indian Flying Fox is one of the most common and widely distributed chiropterans found
in India Pakistan Sri Lanka Bhutan Nepal Bangladesh Maldives Myanmar and China
(Tsang 2020 Johnsingh amp Manjrekar 2013 Srinivasulu amp Srinivasulu 2012) Flying Fox is
the largest fruit bat known to occur on mainland India (Bates et al 1994) out of 13 Indian
fruit bat species (Bates amp Harrison 1997 Srinivasulu et al 2010) It has a reddish-brown
head with a darker sometimes
blackish snout pale brownish-
yellow shoulders and hindneck
yellowish-brown ventrally and
black wings (Prater 1971) It is
a colonial species and roosts
during the day often in the
midst of busy towns villages
on large trees along the
roadside near cropland and
water bodies (Bates et al 1994
Johnsingh amp Manjrekar 2013
Menon 2014) Their roosting
Figure 1 Leucistic individual roosting along with the
normal individuals
AMIN ET AL Record of Leucism in Indian Flying Fox
Prithivya | August 2021 13
colonies are generally found on large trees such as Ficus benghalensis F religiosa
Tamarindus indica Mangifera indica Dalbergia sissoo and Eucalyptus sp (Vendan 2003)
and the colony size can vary from hundreds to several thousands of individuals (Bastawade
amp Mahabal 1976) Although fruit bats are responsible for many ecological services (Saikia
2018) yet Indian Flying Fox is one of the most persecuted fruit bats in South Asia and is
listed as vermin under Schedule V of the Indian Wildlife (Protection) Act and IUCN Red List
Data included it as a Least Concern species (Tsang 2020)
In mammals a wide variety of colours and forms are found as a result of the presence of
certain pigments mostly melanin which provides colour to the skin hairs and eyes
(Nordlund et al 1998 Uieda 2000 Lucati amp Loacutepez Baucells 2016) Often this pigment is
affected as a result of mutations giving rise to diverse colour aberrations The effect of such
abnormal colouration is generally the pigmentation anomalies of chromatic disorders (Rook
et al 1998) Similar to other mammals bats are also vulnerable to genetic disorders that
affect pigmentation Globally such chromatic disorders are being reported at an increasing
rate in bats (Lucati amp Loacutepez Baucells 2016) and are caused by either an increase or a
decrease in the production of melanin in some regions or over the entire body (Hofreiter amp
Schoneberg 2010 Abreu et al 2013) These include albinism leucism piebaldism
hypomelanism and melanism (Lucati amp Loacutepez Baucells 2016) Among these conditions
leucism stands out as a rare phenomenon in nature
Leucism is a total lack of pigmentation in the whole body due to the failure of melanocytes to
migrate to the skin and hair follicles resulting in white or whitish hairs pale skin but
normal coloured eyes It occurs regardless of the normal production of the enzyme tyrosinase
and melanin Moreover it can be caused by one of the several mutations that will give rise to
apparently similar phenotypes (van Grouw 2006 2013 Abreu et al 2013 Lucati amp
Loacutepez‐ Baucells 2016) The occurrence of colour aberration in 55 Indian mammalian species
has been compiled by Mahabal et al (2019) Although cases of albinism and piebaldism have
been reported in the family Pteropodidae (Neal 1971 Karim 1983 Anonymous 2012
Anonymous 2013) however there is no report on colour aberration in Indian Flying Fox
(Pteropus giganteus) Here we report the first case of leucism in Indian Flying Fox from
Surat district of South Gujarat India
AMIN ET AL Record of Leucism in Indian Flying Fox
Prithivya | August 2021 14
Observations
On 18 June 2017 we were on the way to Vansda National Park and at 1230 h we stopped as
we saw a group of Indian Flying Fox roosting on Ficus religiosa near Anaval Village
(20838degN 73263degE) in Surat District Gujarat Suddenly all the fruit bats flew in the sky as
a local was hunting them with the help of a catapult maybe for eating purposes In the
middle of all these at 1249 h a white bat flying in the sky grabbed our attention as it flew
further to roost on one of the branches with other Indian Flying Fox We took some
photographs (Figure 1) and observed with the help of binoculars to note down its
characteristics Its whole body ie both fur and skin were white or whitish including
patagium and ears but it had normal black coloured eyes With the help of the classification
proposed by Lucati amp Loacutepez Baucells (2016) we identified it as a case of leucism and not
albinism
The roosting colony had around 250 individuals and was situated near a village pond among
human habitation on the roadside We observed the leucistic individual at least for an hour
and also alerted the locals to cease hunting of bats The leucistic individual was probably a
female and showed similar activity as that of normal individuals such as opening and closing
of wings folding the wings around belly and grooming
Discussion
Although physiological causes of colouration including melanism are evident (Caro 2005)
the genetic processes responsible for these colour variations remain unknown in most
mammals (Lucati amp Loacutepez Baucells 2016) Moreover chromatic disorders in bats can affect
both fur and skin including patagium ears and muzzle and their impact on the survival rate
is vague (Lucati amp Loacutepez Baucells 2016) However bats are most likely less vulnerable to
predation than the majority of diurnal animals as they are active at night and prefer dark
roosting sites (Buys et al 2002 Rocha et al 2013) Lucati amp Loacutepez Baucells (2016) states
that aberrant individuals roosting in sheltered places such as caves mines and buildings
may have greater survival rates than the one roosting in the open leaves Here we found the
leucistic Indian Flying Fox roosting in the open leaves and is likely to be vulnerable to
predation
Albinism is one of the most commonly occurring colour aberrations in bats (Lucati amp Loacutepez
Baucells 2016) In the family Pteropodidae albinism has been reported in Cynopterus sphinx
AMIN ET AL Record of Leucism in Indian Flying Fox
Prithivya | August 2021 15
from Nepal (Anonymous 2013) Lissonycteris angolensis from Uganda (Neal 1971) and
Rousettus leschenaultia from India (Karim 1983) while piebaldism is reported in Rousettus
amplexicaudatus from Philippines (Anonymous 2012) However another such colour
aberration leucism is not yet reported from the family Pteropodidae In this regard our report
of leucism in Pteropus giganteus can be the first of its kind in the entire range of its
distribution
Today bats in India face the harsh reality of declining habitats and resources ultimately
making them disappear altogether (Graham 2001 Tsang 2020) and the peoplersquos perception
regarding the presence of bats in their surroundings for different myths These facts raise an
urgent need to protect bats throughout the world by studying more about their behaviour and
ecology Further studies on Pteropus giganteus from Gujarat are mainly sighting reports
(Mahato et al 2012) and on roosting sites (Vyas amp Upadhyay 2014) Due to the lack of
information on colour aberration in the family Pteropodidae this report can add importance
to bat biologists
Acknowledgement
We are thankful to Dhaivat Patel and Vivek Patel for assisting us in fieldwork
References
Abreu M S L Machado R Barbieri F Freitas N S amp Oliveira L R 2013 Anomalous
colour in Neotropical mammals a review with new records for Didelphis sp
(Didelphidae Didelphimorphia) and Arctocephalus australis (Otariidae Carnivora)
Brazilian Journal of Biology 73 185ndash194
Anonymous 2012 Monfort Bat Sanctuary Blanca Bella Website
httpwwwmonfortbatsanctuaryorgblanca-bellac12m [Accessed 20 October
2019] Anonymous 2013 SMCRF (Small Mammals Conservation amp Research
Foundation) Website httpwwwsmcrforgindexphp [Accessed 20 October
2019]
Bastawade D B amp Mahabal A 1976 Some behavioural aspects of the Indian flying fox
Pteropus giganteus giganteus Bio-Vigyanam 2 209ndash212
Bates P J J amp Harrison D L 1997 Bats of the Indian Subcontinent Harrison Zoological
Museum Publication UK 258pp
Bates P J J Harrison D L amp Muni M 1994 The bats of western India Part 1 JBNHS
AMIN ET AL Record of Leucism in Indian Flying Fox
Prithivya | August 2021 16
91 (2) 1ndash15
Buys J Heijligers H amp Dorenbosch M 2002 First record of an albino long-eared bat
Plecotus auritus in The Netherlands Lutra 45 49ndash52
Caro T 2005 The adaptive significance of coloration in mammals BioScience55 125ndash136
Graham G L 2001 Bats of the World St Martinrsquos Press New York New York
160pp Hofreiter M amp Schoneberg T 2010
The genetic and evolutionary basis of colour variation in vertebrates Cellular and Molecular
Life Science 67 2591ndash2603
Johnsingh A J T amp Manjrekar N (eds) 2013 Mammals of South Asia Volume 2
Universities Press (India) Private Limited Telangana India pp 545ndash547
Karim K B 1983 A note on an albino Rousettus leschenaulti Bat Research News 24 39ndash
40
Lucati F amp Loacutepez Baucells A 2016 Chromatic disorders in bats a review of pigmentation
anomalies and the misuse of terms to describe them Mammal review 47(2) 112ndash123
Mahabal A Sharma R M Patil R N amp Jadhav S 2019 Colour aberration in Indian
mammals a review from 1886 to 2017 Journal of Threatened Taxa 11(6) 13690ndash
13719 Mahato A K R Kumar V V amp Patel N 2012 Indian flying fox in
Hamirsir Lake Bhuj city needs conservation attention Current Science 103(4)
354ndash355
Menon V 2014 Indian mammals a field guide Hachette India pp 386 Tsang SM
2020 Pteropus giganteus (errata version published in 2021) The IUCN Red List of
Threatened Species 2020 eT18725A194134899
httpsdxdoiorg102305IUCNUK2020-3RLTST18725A194134899en
Downloaded on 10 April 2021
Neal E 1971 Uganda Quest Collins London UK
Nordlund J J Boissy R E Hearing V J King R A Oetting W S amp Ortonne J P
(Eds) 1998 The pigmentary system physiology and pathophysiology Oxford
University Press New York
Prater S H 1971 The Book of Indian Animals (Revised) Bombay Natural History Society
Bombay pp 200ndash201
Rocha P A Feijo J A Donato C R amp Ferrari S F 2013 Leucism in Sebarsquos short-
tailed bat Carolliaperspicillata (Linnaeus 1758) from a rock shelter in northeastern
AMIN ET AL Record of Leucism in Indian Flying Fox
Prithivya | August 2021 17
Brazil Chiroptera Neotropical 19 1151ndash1153
Rook A Wilkinson D S Ebling F J B Champion R H amp Burton J L 1998
Textbook of Dermatology 6th edn Blackwell Science Boston Massachusetts USA
Saikia U 2018 A review of chiropterological studies and a distributional list of the
bat fauna of India Records of the Zoological Survey of India 118(3) 242ndash280
Srinivasulu C amp Srinivasulu B 2012 South Asian mammals their diversity distribution
and status Springer Science amp Business Media
Srinivasulu C Racey P A amp Mistry S 2010 A key to the bats (Mammalia Chiroptera)
of South Asia Journal of Threatened Taxa 2(7) 1001ndash1076
Uieda W 2000 A review of complete albinism in bats with five new cases from Brazil Acta
Chiropterologica 2 97ndash105
Van Grouw H 2006 Not every white bird is an albino sense and nonsense about colour
aberrations in birds Dutch Birding 28(2) 79ndash89
Van Grouw H 2013 What colour is that bird British birds 106 17ndash29
Vendan S E 2003 Roost and diet selection in the Indian Flying Fox Pteropus giganteus
(Mega chiroptera) MSc Thesis Madurai Kamaraj University India 85pp
Vyas R amp Upadhyay K 2014 Study of the Indian Flying Fox (Pteropus giganteus)
Colonies of Jambughoda Wildlife Sanctuary Gujarat India Record of the largest
roosting congregation at Targol Small Mammal Mail 6(1) 2ndash8
Suggested citation
Amin S Patel H and Vaghela P (2021) Record of Leucism in Indian Flying Fox Pteropus
giganteus (Mammalia Chiroptera Pteropodidae) from South Gujarat India Prithivya An
Official Newsletter of WCB Research Foundation and WCB Research Lab Vol 1(2) 12-17
THAKKAR amp GOHIL Birds behaviour during the Annular solar eclipse
Prithivya | August 2021 18
Notes on behavioural observation of some water birds during the Annular Solar
Eclipse
Thakkar Karan and Gohil Bharatsinh
Department of Life Sciences Maharaja Krishnakumarsinhji Bhavnagar University
Bhavnagar-364001 Gujarat India E-mail ksonpal07gmailcom
Abstract
In this communication we report the behaviour of various water birds observed during the annular
solar eclipse which happened on 26th November 2019 We observed the behaviour of eight species of
birdsrsquo viz Greater Flamingoes Phoenicopterus roseus the Indian Cormorant Phalacrocorax
fuscicollis Pied Avocet Recurvirostra avosetta Black-winged stilt Himantopus himantopus Eurasian
spoonbill Platalea leucorodia Northern shoveler Spatula clypeata Little grebe Tachybaptus
ruficollis and Dalmatian pelican Pelecanus crispus throughout the eclipse period ie from 805 AM
to 1051 AM Various behavioural chan`ges were observed in all the targeted species except the
Indian cormorant It rested on a pole for the whole eclipse period Detailed observations are given in
the note Reduction in light levels due to solar eclipse does affect the activity of birds
Key Words Solar Eclipse Behaviour Birds Bhavnagar
An annular solar eclipse was visible from 805 to 1051 AM on 26 December 2019 in India
Solar eclipse a rare and uncommon environmental event can influence and modulate the
behaviour of animals (Murdin 2001 Gil-burmann amp Beltrami 2003) Following observations
were made during the eclipse at airport Road Lake (21762837deg N 72183624deg E) in
Bhavnagar city using Nikon binoculars (1050)
Greater flamingos (n=24) on the day of the eclipse were seen foraging constantly from 805-
920 AM All of them started calling together from 921 to 935 AM After the peak of the
eclipse (ie after 921 AM) many flamingo individuals started preening Activities of Indian
cormorants varied throughout the eclipse period Pied avocets (n=13) were observed feeding
through the initial phase of the eclipse ie from 805 to 850 AM But pied avocets went onto
the resting phase from 851 to 935 AM Eight of them continued resting even after 935 AM
while the other five started feeding again Black-winged stilts (n=50) were seen resting in a
flock throughout the study period But as the eclipse increased flocks of black-winged stilts
from outside the lake started arriving and joined the original flock of 50 A group of five
black-winged stilts arrived at 852 followed by a flock of 20 at 906 AM Three other groups
of 30 50 and 10 black-winged stilts arrived from 921 to 935 AM Eurasian spoonbills
(n=30) were seen resting in water during the initial stage of eclipse ie from 808 to 920
AM From 921 to 935 AM five spoonbills started feeding 21 continued resting while 12
THAKKAR amp GOHIL Birds behaviour during the Annular solar eclipse
Prithivya | August 2021 19
started vocalizing and four flew away from the lake After 935 AM 12 individuals
continued calling 29 rested in water whereas eight individuals arrived from outside the lake
Activities of northern shoveler (n=80) varied throughout the eclipse Little cormorant (n=1)
rested on a pole for most of the observation It started feeding at 921 to 935 AM along with
one little cormorant which arrived from somewhere outside the lake After 935 both
perched at the wood in the lake Little grebe (n=1) spent most of the time feeding Between
935 and 950 AM it was joined by a flock of eight grebes that arrived from outside the lake
Pelicans (n=2) rested on a small patch of land in the lake throughout the study period
Table 1 Ethogram
Bird
Time intervals
0805-
0820
0821-
0835
0836-
0850
0851-
0905
0906-
0920
0921-
0935
0936-
0950
Greater
flamingo FD(n=24) FD(n=24) FD(n=24) FD(n=24) FD(n=24) C(n=24)
PR(n=4)
FD(n=17)C
(n=3)
Indian
Cormorant Rp(n=2) Rp(n=2)
Fi(n=2)
FD(n=4)
Rp(n=2)Fb
(n=2) Rp(n=1) Rp(n=1)Fb(n=1) _
Pied
Avocet FD(n=13) FD(n=13) FD(n=13) Rw(n=13) Rw(n=13) Rw(n=13)
FD(n=5)R
w(n=8)
Black
winged stilt Rw(n=50) Rw(n=50) Rw(n=50)
Rw(n=50)F
i(n=5)
Rw(n=55)
Fi(n=20)
Rw(n=75)
Fi(n=30)
Fi(n=50) Fi(n=10) Rw(n=165)
Eurasian
Spoonbill Rw(n=30) Rw(n=30)
Rw(n=30)
FD(n=4) Rw(n=34) Rw(n=34)
FD(n=5)C(n=12)
Fo(n=4)
Rw(n=21)
Fi(n=8)
C(n=13)
Rw(n=29)
Northern
Shoveler
PR(n=10)
Rl(n= 50)
Rw(n=20)
Rl(n= 50)
Rw(n=20)
PR(n=4)
Rw(n=50)
Rl(n=10)
Rw(n=54)
Rl(n=10)
FD(n=5)
Rw(n=54)
Rl(n=5)
Rw(n=54)
Rl(n=10)
Rw(n=54)
Rl(n=10)
Little
Cormorant Rp(n=1) Rp(n=1) Rp(n=1) Rp(n=1) Rp(n=1) FD(n=1) Fi(n=1) Rp(n=2)
Little grebe Rw(n=1) FD(n=1) FD(n=1) FD(n=1) FD(n=2) Fi(n=8)FD(n=10) FD(n=18)
Dalmatian
pelican Rl(n=2) Rl(n=2) Rl(n=2) Rl(n=2) Rl(n=2) Rl(n=2) Rl(n=2)
THAKKAR amp GOHIL Birds behaviour during the Annular solar eclipse
Prithivya | August 2021 20
Table 2 Different type of behaviours observed in bird species
BEHAVIOURS
FD Feeding
R Resting
Rp resting on an object prolonged perching on a pole or a stick in water
Rl resting on land simply sitting or standing with no noticeable movement
Rw resting in water no efforts for movement and neck resting on body(in case of ducks)
F Flight
Fb taking off from place A within a lake and settling at place B within a lake
Fa taking off from place A within a lake and settling at same place
Fo taking off from within lake and flying outside the lake
Fi arrived at lake from outside the lake
PR Preening
C Calling making some kind of voice could either be begging call roosting call or some other
B Bathing Rapid action of submerging in water and coming out
Kumar S (1981) observed the changes in the activity of cattle egrets because of the solar
eclipse Trigunayat (1997) observed that roosting Black-crowned Night-herons altered a
variety of behaviours including increased calling preening and perch shifting Nanikov et
al (2001) also mention behavioural changes in several birds due to solar eclipse A similar
trend was observed in this study as well From these limited field observations we can
conclude that reduced light level due to annular solar eclipse does interrupt normal bird
behaviour patterns
Acknowledgements
The first author is very thankful to Mr Dhavalkumar Vargiya for his kind support and
encouragement in the preparation for this article
References
Altmann J 1974Observational Study of Behavior Sampling MethodsBehaviour 49(34)
227-267 Retrieved on March 23 2020 from wwwjstororgstable4533591 bull Gil-
Burmann C Beltrami M 2003 Effect of the solar eclipse on the behavior of a
captive group of hamadryas baboons (Papio hamadryas) Zoo Biology 22 299ndash303
Kumar S 1981 Solar eclipse ndash notes on behavior of egrets J Bombay natural history
society78 3 133-136
Murdin P 2001 Effects of the 2001 total solar eclipse on African wildlife Astronomy
THAKKAR amp GOHIL Birds behaviour during the Annular solar eclipse
Prithivya | August 2021 21
Geophysics 42 40ndash42
Nankinov D Dalakthieva S Nikolov B Shurulinkov P Popov K Kirilov S Zareva
K Borisov B Stojanov G Nankinov N Minchev N Kjichukov D Nikolov I
Stanchev R Ganchev E 2001Studying the behaviour of birds during the solar
eclipse on August 11 1999 mdash Russian Ornithological Journal 142 355-369
Trigunayat M M 1997 Some behavioral observations on Night Heron Nycticorax
nycticorax (Linnaeus) during the total solar eclipse in Keoladeo National Park
Bharatpur IndiaPavo 3561ndash65
Tramer E J 2000 Bird Behavior During a Total Solar Eclipse The Wilson Bulletin 112(3)
431ndash432
Suggested citation
Thakkar K and Gohil B (2021) Notes on behavioural observation of some water birds during the
Annular Solar Eclipse Prithivya An Official Newsletter of WCB Research Foundation and WCB
Research Lab Vol 1(2) 18-21
MARJADI D Restoration of Earth with Biobased Polymer
Prithivya | August 2021 22
Restoration of Earth with Biobased Polymer
Marjadi Darshan
Shree Ramkrishna Institute of Computer Education amp Applied Sciences MTB Campus
Athwalines Surat-395001
E-mail darshanmarjadisrkiacin
Humanity is facing increasingly numerous challenges in life despite the great advancements
in science and technology over the last century All the needs of modern society eg food
fuel energy and materials are highly dependent on diminishing fossil resources The
demand for creating and using plastic throughout the world driven by the increasing usage of
plastic-based materials has been increasing and adding stress to the current waste
management infrastructures There is significant interest to decrease the reliance on
petroleum-based plastic products which causes global environmental pollution The
advancement in science and technology has enabled mankind to live longer and consume
more of the worlds resources More than eight million tons of plastic waste leak into oceans
every year which can be eased through innovative redesigns of packaging materials
Issues such as global climate change and depletion of fossil fuels both resulting from the
increased usage of energy have triggered alarms among scientists and politicians worldwide
Therefore governments industries and academia are inputting much effort towards finding a
sustainable solution for the increasing energy crisis However a similar concerted effort is
still lacking to bring about the creation and usage of sustainable materials in the modern
lifestyle In addition to the increasing demand for energy the usage of materials in the
modern lifestyle has also been increasing rapidly Considering the widespread usage of
plastics in food packaging clothes shelter communication transportation construction
health care and leisure industries plastics are the most dependable material among the other
materials that mankind is currently dependent upon Currently most of the plastics that are
widely used in various sectors are produced from petrochemical products The plastic
industry has been among the most profitable businesses and is expected to grow further
especially because of their increased demands from rapidly developing countries like India
and other parts of South-East Asia While plastics are superior materials in terms of their
production costs and diverse properties the sustainability of this synthetic material is
undoubtedly an issue that needs to be addressed Biobased and biodegradable polymeric
materials are considered amongst the most suitable alternatives for some applications The
MARJADI D Restoration of Earth with Biobased Polymer
Prithivya | August 2021 23
excessive usage of petroleum also contributes to the increased emission of CO2into the
atmosphere which is thought to be among the principal reasons for global warming and
climate change These are some of the strong and valid reasons leading towards the
development of technologies to produce biobased and biodegradable plastics
Science and technology have created the modern lifestyle that mankind is living in which
efficiency is the keyword Drawing an analogy from a bacterial culture in a shaken flask the
depletion of nutrients and the simultaneous accumulation of toxic wastes are the main
reasons for the onset of the stationary growth phase and the subsequent death phase
However unlike bacteria mankind is aware of the consequences of such activities As a
result the world population is now concerned about sustainable development
Biobased and biodegradable plastics most likely to remain less superior in terms of
production cost and material properties compared to petrochemical plastics Petroleum-based
plastics have serious environmental and social impacts due to their non-degradable nature
and the leaching of carcinogenic substances like dioxin when exposed to scratch or heat
Compared to the ease at which fossil resources are utilized renewable biobased materials
will need more effort and efficiency to be used in daily life However biobased materials are
considered superior in terms of sustainability and environmental friendly provided that they
are used judiciously and in a contented manner Hence it is in our hands to utilize our
knowledge of the environment to work towards the restoration of the earth and make it free
from single-use plastics
Suggested citation
Marjadi D (2021) Restoration of Earth with Biobased Polymer Prithivya An Official
Newsletter of WCB Research Foundation and WCB Research Lab Vol 1(2) 22-23
PATEL amp PATEL Single-use surgical mask
Prithivya | August 2021 24
Single-use surgical mask Human lifesaver or Biodiversity destroyer
Patel Jeel1 and Patel Rushika2 3
1GMERS Sola Civil Medical College Ahmedabad-380008 (Gujarat) India 2Assistant Professor Rai University Dholaka Ahmedabad-380008 (Gujarat) India 3Fellow Wildlife and Conservation Biology Research Foundation Pata-384265 (Gujarat)
India
E-mail rush2907gmailcom
The green lines represent sustainable and biodiversity conservation ways The dark brown
lines represent possible threats of single-use surgical mask to the biodiversity
Key Words Disposable mask Plastic and micro plastic pollution Conservation Threats
The COVID-19 is transmitted by respiratory droplets or aerosols and can survive in the air
for more than 24 hrs which was detected and momentarily created a pandemic situation
globally The only way to stop the transmission is to wear face mask washing hands
frequently and to maintain social distance Wearing a mask is declared as one of the
important precautionary measures by the World Health Organization (WHO) and
policymakers in every country because masks help in the significant reduction of infection
caused by touching the facemouthnose with contaminated hands (Schmutz et al 2020) The
virus COVID19has increased the demand for the surgical single-used mask in the healthcare
professionals as well as among the community Such masks are made up of polypropylene or
PATEL amp PATEL Single-use surgical mask
Prithivya | August 2021 25
high-density polyethylene (HDPE) a fossil-derived plastic which has a very high half-life
(Dharmaraj et al 2021)The mask production to the disposal statistics is presented in Table 1
Based on the reusability the mask is divided into two major groupsrsquo disposable (made up of
polymers) and reusable mask (made up of cloth material) in terms of production In present
study the details of only disposable mask is presented
Calculated based on the global entries of masks and gloves mentioned (200 millionmonth)
The average of one mask and single glove weight is 225plusmn001
Mask a threat to the ecosystem
In current situation recycling of any household medical waste is not a feasible and advisable
solution as there is a chance that it may be exposed to infectious particles There are no
particular laws or guidelines for separation and segregation which might involve several
issues Globally the dumping of masks was observed in areas such as roadside river oceans
and several open areas Usually such masks sustain in the environment for a longer period of
time (more than 400 years)(Hasan et al 2021) The misconception of masks to various birds
animals and marine creatures considering as a food and leads to trapping and entangling in
the strips of masks The single-use surgical mask not only adds litter to the environment but
No Statistics Reference
1 Estimated worldwide usage of disposable mask 129
billionmonth
Prata et al 2020
2 Production in China as on Feb 2020 116 millionday Adyel 2020
3 Order of mask in Japan as of April 2020 over 600
millionmonth
Fadare and Okoffo
2020
4 Mask disposal in the UK 53 millionday Website URL 1
5 Gloves and mask entered into the environment 200
millionmonth
Website URL 2
6 Mask reached to oceans 15 billion
Marine plastic pollution increased in last year 6200 tonnes
Website URL 3
7 Mask waste generation in India Minimum 928week
Maximum 4640week
Selvaranjan et al 2021
8 Plastic footprint in the environment due to mask and gloves
45times105 KgMonth
Present Study
Table 1 Global mask production usage and disposable statistics
PATEL amp PATEL Single-use surgical mask
Prithivya | August 2021 26
also hurting and killing a wide range of terrestrial and marine living organisms Moreover
the production process of such masks also releases greenhouse gases (Prata et al 2021) The
disposal of mask also reported as a novel source of micro plastic pollution in the environment
and entry point of the food chain (Hasan et al 2021) The single-use surgical masks are also
noted as a major causative agent of secondary disease outbreaks in all life forms including
humans (Fadare and Okoffo 2020) India does not have any sufficient resources for the
household medical waste management (Prata et al 2021) Every minute 10 kg of disposed
masks and gloves entered into the environment (Table 1)Hence it is very important to deal
with the mentioned issues and look into more sustainable sources at individual level
Herewith we suggest some measures by which we can protect the environment without
compromising human health in current pandemic situation
Snip the strips of the masks before the disposal to avoid the entangling and entrapping
issues
Dispose masks as a separate medical waste and submit it to plastic recycling
companies
Moving towards the development of biopolymer mask (Torres and Torre 2021)
Biopolymer mask were made up of gluten and nanofibers having 95 efficiency
A reusable mask could be applied in routine life for the general community Regular
cloth masks having multi-layer of high thread-count and textiles are moderately
effective and reported to block 50-70 fine droplets and particles Reusable masks
help in the reduction of waste production (85 ) Moreover economically viable
option in a country like India as it is 37 times cheaper than other masks (Prata et al
2021)
References
Adyel T M 2020 Accumulation of plastic waste during COVID-19 Science 396(6509)
1314ndash1315 httpsdoiorg101056nejmms2004740
Dharmaraj S Ashokkumar V Hariharan S Manibharathi A Show P L Chong C T
ampNgamcharussrivichai C 2021 The COVID-19 pandemic face mask waste A
blooming threat to the marine environment Chemosphere Elsevier Ltd
httpsdoiorg101016jchemosphere2021129601
Fadare O O ampOkoffo E D 2020 Covid-19 face masks A potential source of
microplastic fibers in the environment Science of The Total Environment 737
140279 httpsdoiorg101016jscitotenv2020140279
PATEL amp PATEL Single-use surgical mask
Prithivya | August 2021 27
Hasan N A Heal R D Bashar A amp Haque M M 2021 Face masks protecting the
wearer but neglecting the aquatic environment - A perspective from Bangladesh
Environmental Challenges 4 100126 httpsdoiorg101016jenvc2021100126
Prata J C Silva A L P Duarte A C amp Rocha-Santos T 2021 Disposable over
Reusable Face Masks Public Safety or Environmental Disaster Environments 8(4)
31 httpsdoiorg103390environments8040031
Schmutz M Hischier R Batt T Wick P Nowack B Waumlger P ampSom C 2020
Cotton and surgical masksmdashwhat ecological factors are relevant for their
sustainability Sustainability (Switzerland) 12(24) 1ndash13
httpsdoiorg103390su122410245
Selvaranjan K Navaratnam S Rajeev P ampRavintherakumaran N 2021 Environmental
challenges induced by extensive use of face masks during COVID-19 A review and
potential solutions Environmental Challenges 3 100039
httpsdoiorg101016jenvc2021100039
Torres F G amp De-la-Torre G E 2021 Face mask waste generation and management
during the COVID-19 pandemic An overview and the Peruvian case Science of the
Total Environment 786 147628 httpsdoiorg101016jscitotenv2021147628
Website URL 1 httpswwwgreenpeaceorguknewssingle-use-face-masks-hurting-
wildlife-what-you-can-do [Accessed on 23rd June 2021]
Website URL 2 httpswwwgreenmatterscompface-masks-wildlife [Accessed on 23rd June
2021]
Website URL 3 httpseconomictimesindiatimescomnewsenvironmentecosystem-under-
threat-as-birds-and-marine-life-ensnared-in-discarded-face-maskswidespread-
contaminationslideshow80230026cms [Accessed on 23rd June 2021]
Suggested citation
Patel J and Patel R (2021) Single-use surgical mask Human lifesaver or Biodiversity destroyer
Prithivya An Official Newsletter of WCB Research Foundation and WCB Research Lab Vol 1 (2)
24-27
PITHVA amp DHARAIYA Perception of forest staff about wildlife
Prithivya | August 2021 28
Does the contemplation of forest field staff about wildlife differ than a common man
Pithva Krishna1 2 and Dharaiya Nishith1
1 Wildlife and Conservation Biology Research Lab Hemchandracharya North Gujarat
University Patan (Gujarat) India 2Institute of Environment Education and Research Bharati Vidyapeeth Deemed University
Pune India
E-mail krishnapithva17gmailcom
Introduction
A field-based training was organized by Vadodara wildlife division Gujarat forest
department and WCB Research Lab of Hemchandracharya North Gujarat University from
September 17th to 19th 2020 with the aim to enhance the capacity of forest field staff for
monitoring and rescue of sloth bear and associated fauna The training was organized at
Jambughoda wildlife sanctuary Central Gujarat Along with the awareness about sloth bear
a small survey was carried out to understand how the field staff envisages the wildlife that is
found in their work place Total 18 frontline forest staff of different cadre such as beat guards
and round foresters from different forest ranges of central Gujarat has participated in this
survey
This study provides an insight on how
forest staffrsquos perception differs in different
animals As Q method provides qualitative
and quantitative data which helps
identifying peoplersquos perception in detail As
participants have to provide justification of
their answers it reveals some underlying
conflicts or reasons These justifications of
participants can help identify the gaps and
can be better used for conservation planning
as well as capacity building of forest field
staff
Figure 1 Forest frontline staff organizing
photos on Q Board copy Nishith Dharaiya
PITHVA amp DHARAIYA Perception of forest staff about wildlife
Prithivya | August 2021 29
Methodology
We used Q methodology for this study this method is designed and developed by William
Stephenson in 1930s (McKeown amp Thomas 1988)and allows to disclose underlying reasons
This method is widely used in social sciences studies In this method photos were used
instead of statements to know respondentrsquos perception allowing them to justify their answer
in detail without any restriction This method allows both qualitative and quantitative data on
perception of the person being interviewed
We categorised the Q Method into two parts first organising 16 photos of locally found
animals on a Q-board (figure 1(b)) followed by explanation for each photo which are placed
on Q-board by the respondent As shown in the figure 1(a) the participants were asked to
organise photos in Q- board as per their liking and disliking towards the animals and to
provide reasons which were recorded in mobile phone devise A list of all the wildlife photos
used for this survey is provided in table 1
-3 -2 -1 0 +1 +2 +3
Negative Positive Neutral
Figure 1(a) Representative sort of organized Q-
board by a participant
Figure 1(b) A Q-board on which the
respondents organize the photos
PITHVA amp DHARAIYA Perception of forest staff about wildlife
Prithivya | August 2021 30
Photo
ID
Common name Scientific name
1 Wild boar Sus scrofa
2 Hanuman langur Semnopithecus entellus
3 Indian cobra Najanaja
4 Indian giant flying squirrel Petauristaphilippensis
5 Small Indian civet Viverricula indica
6 Sloth bear Melursus ursinus
7 Indian hare Lepus nigricollis
8 Indian python Python molursus
9 Barn owl Tyto alba
10 Grey francolin Francolinuspondicerianus
11 Red-wattled lapwing Vanellus indicus
12 Rhesus macaque Macaca mulatta
13 Black kite Milvus migrans
14 Common krait Bungarus caeruleus
15 Indian crested porcupine Hystrix indica
16 Blue bull Boselaphustragocamelus
Q sort analysis
In this study three factors were derived based on participantrsquosjustification which is explained
in detail in the result section A factor in this study is a category representingthe group of
people who have similar perspective(Brown 1980) The higher the factor loading the more
highly that sorts are correlated with that factor (Ramlo 2008 Ramlo amp Newman 2011)The
sorts refer to the photos assembled by participants on Q-board (figure 1(b))In order to
analyse the data a software PQMethod(httpschmolckorgqmethod)was used which is
specially designed for Q-analysis Q sorts are the number of participants that took part in the
survey All the data were entered manually in this software and correlation was calculated
among each sort The correlation matrix for the extracted factor was analysed through a
principal component factor analysis with varimax rotationfor which options are provided in
the software (figure 2)
Table 1 Photos of wildlife used for this study
PITHVA amp DHARAIYA Perception of forest staff about wildlife
Prithivya | August 2021 31
Results and Discussion
The three factors that emerged
are shown in Table 2 with
automatic pre-flagging
Participants having similar
perceptions are put together in
their respective factors and
marked in bold and have ldquoXrdquo
next to their score Out of 18
sorts 17 sorts were found
complete by the software and
were further analysed Each of
three factors represents a different perspective towards the photos provided to them
Participants were named as PART001 PART002 and so on to keep their identity unrevealed
In table 2 there are 8 participants belonging to factor 1 with 29 of the variance explained
followed by 7 participants in factor 2 having 26 explained variance and 2 participants
belonging to factor 3 with 14 explained varianceOnce factor score calculated by the
software distinguishing tables were developed in this analysis for each factor which differ
from each other that is explained further in this section The distinguishing tables for each
factor explains differences between factors(Brown 1971 Ramlo amp Newman 2011 Brown
1993)In order to determine distinguishing statements average Z-score of respondentrsquos factor
score was calculated by the software
Figure 2 Screenshot of analytical option available in PQM
method Software
PITHVA amp DHARAIYA Perception of forest staff about wildlife
Prithivya | August 2021 32
Table 2 Extracted factor score from Q-sorts
Q-Sorts ID Factor 1 Factor 2 Factor 3
1 PART001 08530X 01248 -01223
2 PART002 00414 08084X 01708
3 PART003 06945X 00471 03983
4 PART004 07683X 01839 -00156
5 PART005 05450X 00166 02332
6 PART006 04208 07241X 04006
7 PART007 01728 01377 09013X
8 PART008 06930X 05214 03237
9 PART009 06516X 04289 04265
10 PART010 05119 06142X 00921
11 PART011 08475X -00072 -02626
12 PART012 03742 -05333 04456
13 PART013 00481 08292X 03240
14 PART014 -00002 06395X -03574
15 PART015 06577X 02179 01940
16 PART016 -00614 01991 06372X
17 PART017 04469 07611X 01835
18 PART018 05679 07564X 01465
Explained variance 29 26 14
Note number in bold shows respondents belong to those respective factors
Table 3 shows different factor score for each animal photo and depending on statistical
significance the photo load to a specific factor The above table contains 16 photos and their
grid position for all three factors (perception table 2) For example Indian python was
disliked by participants therefore it is scored at -2 for respondents grouped under factor 1 +1
for factor 2 andfor factor 3 it was scored at +2 For factor 1 the most liked species by
participants is Indian hare and most disliked species is wild boar Most liked species for
factor 2 is Indian leopard and most disliked animal is fruit bat For factor 3 most liked
species is Indian hare scored at +3 and most disliked species is wild boar scored at -3 by the
participants
PITHVA amp DHARAIYA Perception of forest staff about wildlife
Prithivya | August 2021 33
Table 3 Aggregate factor values of each 16 photos
Aggregate values
No Photos Factor 1 Factor 2 Factor 3
1 Indian python -2 1 2
2 Hanuman langur 0 0 2
3 Monitor lizard -1 -2 -1
4 Red-wattled lapwing 1 -1 1
5 Sloth bear 2 2 0
6 Indian hare 3 1 3
7 Leopard 2 3 0
8 Grey francolin 1 -1 -1
9 Indian giant flying squirrel 1 1 -2
10 Blue bull 0 0 0
11 Small Indian civet 0 0 -1
12 Fruit bat (Flying fox) -1 -3 -2
13 Indian cobra -2 2 1
14 Barn owl 0 0 0
15 Indian chameleon -1 -1 0
16 Wild boar -3 -2 -3
Factor 1 Economic impact
This factor was described by 8 participants mainly concerning economic impact Animals
that cause harm economically by destroying crops and threat to human life and livestock
Participants of factor 1 thinks fruit bat Indian python and Indian cobra causes high level of
economic harm Grey francolin is scored +1 due to its contribution to reduce impact by eating
pest insects from agricultural field Though the most disliked animal is wild boar for factor 1
as shown in table 3
PITHVA amp DHARAIYA Perception of forest staff about wildlife
Prithivya | August 2021 34
Table 4 Distinguishing photos for factor 1
Factor 2 Aesthetic spiritual values and conservation aspects
This factor explains aesthetic spiritual values and conservation aspects which includes
appearance tourist attraction rehabilitation and religious belief There are 7 responses in this
factor (table 2) Respondents are observed to have negative opinions towards animals which
play major role in economic loss but positive towards animalrsquos beauty and its natural
charisma Table 5 shows how score of animals for factor 2 is different from the score of
factor 1 and factor 3 For example Indian cobra is scored at +2 in factor 2 as it is attractive to
participants but it is scored -2 for factor 1 as it threatens human life
Table5 Distinguishing photos for factor 2
Photo
ID Photos
Grid
position
for
Factor 1
Z-score
of
Factor 1
Grid
position
for
Factor 2
Z-score
of
Factor 2
Grid
position
for
Factor 3
Z-score
of
Factor 3
13 Indian cobra -2 -119 2 127 1 037
6 Indian hare 3 148 1 067 3 189
1 Indian python -2 -103 1 034 2 122
4 Red-wattled
lapwing 1 014 -1 -065 1 079
16 Wild boar -3 -189 -2 -125 -3 -201
Photo
ID Photos
Grid
position
for
Factor
1
Z-score
of
Factor
1
Grid
position
for
Factor
2
Z-score
of
Factor
2
Grid
position
for
Factor
3
Z-score
of
Factor 3
8 Grey francolin 1 095 -1 -046 -1 -067
12 Fruit bat (Flying -1 -02 -3 -182 -2 -11
1 Indian python -2 -103 1 034 2 122
13 Indian cobra -2 -119 2 127 1 037
PITHVA amp DHARAIYA Perception of forest staff about wildlife
Prithivya | August 2021 35
Factor 3 Lack of awareness
This factor describes lack of awareness which includes lack of interest compared to other
animals and species This factor mainly concerns individuals who lacks knowledge proper
information and are not aware about the species For example in table 6 the score of Indian
giant flying squirrel differs from factor 3 to factor 1 and 2 as it is scored at -2 +1 and +1
respectively The justification for negative score given by the participants is that they are not
aware about the presence of the species therefore they do not have any information on the
species
Table 6 Distinguishing photos for factor 3
Photo
ID Photos
Grid
position
for
Factor 1
Z-score
of
Factor
1
Grid
position
for
Factor 2
Z-score
of
Factor
2
Grid
position
for
Factor 3
Z-score
of
Factor 3
1 Indian python -2 -103 1 034 2 122
2 Hanuman langur 0 -02 0 -045 2 110
13 Indian cobra -2 -119 2 127 1 037
5 Sloth bear 2 138 2 135 0 -000
7 Leopard 2 133 3 181 0 -000
9 Indian giant flying
squirrel 1 096 1 062 -2 -122
Conclusion
The perception of forest field staff was better understood using Q method analysis
considering various aspects It is seen that participants tend to like animals such as Indian
leopard sloth bear Hanuman langur and Indian hare as they are scored positive or neutral
The animals that are not given negative score in any factor due to their appearance are seen
frequently and does not lack awareness It is observed from the data that frontline forest staff
lacks knowledge about animals that are not seen or present in their forest rangebeat As
frontline forest staff they should be aware about existence of animal species that are found in
Gujarat state along with their ecological importance threats and conservation values Some
participants were not even aware about the existence of the species in the wild such as Indian
giant flying squirrel Although being frontline forest staff their perception is biased towards
animals such as wild boar monitor lizard and flying fox bat due to the economic loss they
PITHVA amp DHARAIYA Perception of forest staff about wildlife
Prithivya | August 2021 36
may cause and weird appearance Their perception becomes the same as a common man
when every animal should be equal to frontline forest staff as it is their job to protect forest
and its animals Some participants believe in superstitions of bad luck of barn owl and
monitor lizard which shows their common man perception and lack of right information
Recommendations
A separate training or workshops should be organised by forest department focused on
animal species found in Gujarat This will help them enhancing their existing knowledge and
it will provide them with some scientific insights Having basic scientific knowledge will
help remove some barriers like superstitions and other beliefs Field trips should be organised
in different part of state to gain practical experience Team building activities should be
conducted between staff of different forest divisions
Acknowledgements
We are thankful to all the forest field staff who participated in this survey We also thank to
the Deputy Conservator of Forests Vadodara Wildlife Division of Gujarat Forest Department
and sincerely acknowledge the help from our research team members
References
Brown S R (1980) Political subjectivity applications of Q methodology inpolitical science
E Ramlo S and Newman I (2011) Q Methodology and Its Position in the Mixed-Methods
Continuum Operant Subjectivity 34(3) 172ndash191
McKeown B and Thomas D B (1988) Q Methodology SAGE Publications
R Brown S (1993) A Primer on Q Methodology Operant Subjectivity 16(34) 91ndash138
Ramlo S E (2008) Determining the various perspectives and consensus within a classroom
using Q methodology AIP Conference Proceedings 1064 179ndash182
httpsdoiorg10106313021248
Suggested citation
Pithva K and Dharaiya N (2021) Does the contemplation of forest field staff about wildlife differ
than a common man Prithivya An Official Newsletter of WCB Research Foundation and WCB
Research Lab Vol 1(2) 28-36
PANCHAL amp JHA Qualitative phytochemical analysis
Prithivya | August 2021 37
Qualitative phytochemical analysis of some medicinal plants (leaves) from the
surrounding area of Talod Taluka North Gujarat India
Panchal Mital and Jha Charumati
Department of Botany Smt Panchal Science college Talod ndash383215 North Gujarat India
E-mail mitalpanchal0gmailcom
Abstract
The tremendous biological variety of North-Eastern India has long been recognised Five medicinal
plants were chosen for this study Manilkara zapota (L) van Royen Manilkara hexandra (Roxb)
Dub Mangifera indica L Madhuca indica JF Gmel and Annona squamosa L The purpose of this
study was to look into the existence of Phytochemicals such as Alkaloid Amino acid Carbohydrate
Protein Glycoside Tannin Terpenoid Saponin Flavonoid and Steroids in the medicinal plants that
were chosen For the organic solvent extraction the Soxhlet apparatus was utilized Water acetone
and chloroform were utilised as solvents Our findings show that the examined plants crude aqueous
and organic solvent extracts contain medicinally relevant bioactive components justifying their usage
in traditional medicines for the treatment of various ailments
Key Words Qualitative phytochemical analysis Manikara zapota M hexandra Madhuka
indica Mangifera indica Annona squamosa
Introduction
Phytochemicals are non-nutritive substances Chemical compounds are produced naturally on
plants during metabolic processes and contain a wide range of proactive and disease-
preventive qualities These compounds are known to be produced by plants in order to defend
themselves Recent study has shown that they can also play a vital role in illness prevention
in humans Even some of these herbs have been used for millennia as traditional medicine
Most phytochemicals such as flavonoids carotenoids and polyphenols have antibacterial
action and can be used to treat infections The following plant species were studied
Manilkara zapota (L) van Royen M hexandra (Roxb) Dub Mangifera indica L Madhuca
indica JF Gmel and Annona squamosa L
Plants play a universal function in the treatment of sickness as seen by their use in every
major system of medicine regardless of philosophical foundation Plants are vital to the
pharmaceutical industry because they are a rich supply of pharmaceuticals and a vast
reservoir of chemical variety for drug development screening procedures The majority of the
medications mentioned in the Indian medicinal system are derived from plants
PANCHAL amp JHA Qualitative phytochemical analysis
Prithivya | August 2021 38
Medicinal plants have been used to treat disease all across the world for thousands of years It
is generally understood that some plants with active chemicals can limit microbial
development Plants ability to generate chemicals via secondary metabolism determines their
antimicrobial potency Secondary metabolites emerged as the most important class of
chemicals with a wide spectrum of antibacterial and antifungal properties When compared
to conventional fungicides used to inhibit microbial growth and survival these plant
chemicals have different structures and activities
Plants are a major source of Traditional medicine and can be used to cure a variety of
conditions with little adverse effects Traditional medical practises are not only beneficial in
the treatment of diseases but they also aid in the discovery of pharmaceutically active
compounds in plants which can aid in the commercial manufacture of pharmaceuticals From
ancient times the importance of plant diversification in health care has been extensively
recognised According to a literature review more than 50000 plant species have been
successfully employed for medical purposes globally with flowering plants accounting for
over 13 of these
Material and methods Plant collection and Identification
M zapota (L) van Royen M hexandra (Roxb) Dub M indica L M indica JF Gmel
and A squamosa L were among the plant species studied The plants were harvested from
the land in the Talod taluka in North Gujarat India The washed plant leaves were kept in for
drying after being cleaned with tap water around 2-3 times to evaporate the water content
With the use of a mechanical blender the sample was ground into a fine powder after drying
The powder is then kept in an airtight plastic container for future usage with adequate
labelling
Extraction technique
Extraction is the separation of inert plant tissue constituents from medicinally active plant
tissue constituents using a conventional extraction process Menstrum is a selective solvent
that is used to eliminate inert material and to obtain the curative part of the procedure through
therapy
PANCHAL amp JHA Qualitative phytochemical analysis
Prithivya | August 2021 39
Method and Plant extraction
Solvent extraction
The crude plant extract was made using the Soxhlet extraction method 10 gm of powdered
plant material was placed into a thimble and 300 ml of solvents were extracted separately
Acetone and chloroform were utilized as solvents In a syphon tube of an extractor the
extraction process continued for 24 hours until the solvent became colourless The extract
was then placed in a beaker The extract was then retained and cooked on a hot plate at 30- 40
degC until all of the solvent had evaporated The dried extract was stored at 4degC in a refrigerator
for future phytochemical investigation
Methods of phytochemical analysis
Alkaloid
Wagnerrsquos test A few drops of Wagners reagent were applied to 2mg of extract that had
been acidified with 15 percent vv hydrochloric acid The presence of alkaloids is indicated
by a yellow or brown ppt
Carbohydrates
Molischrsquos test 2mg of ethanolic extract was mixed with 10ml water filtered and
concentrated 2ml of conc sulphuric acid was added to these 2 drops of freshly prepared 20
alcoholic alpha-naphthol solution forming a layer below the mixture red-violet ring showing
the existence of carbohydrates that disappears when sufficient alkali is added
Amino acid
Ninhydrin test Boil for a few minutes 2ml Ninhydrin reagent + 2ml extract The production
of blue colour indicates the presence of amino acids
Steroids
Salkowski reaction 2mg of dry extract was combined with chloroform to the chloroform
layer sulphuric acid was gently introduced by the sides of the test tube The emergence of a
red colour indicated the presence of steroids
Tannin A few drops of a 5 percent wv Fecl3 solution were added to 1-2 ml of the ethanolic
extract Gallo tannins are shown by a green colour whereas pseudo tannins are indicated by a
brown colour
Flavonoids After mixing 2ml of each extract with a few drops of 20 sodium hydroxide a
bright yellow colour was seen A few drops of 70 dilute hydrochloric acid were added to
PANCHAL amp JHA Qualitative phytochemical analysis
Prithivya | August 2021 40
this and the yellow coloration disappeared The presence of flavonoids in the sample extract
is shown by the formation and disappearance of yellow colour
Saponins 6ml distilled water was added to 2 ml of each extract and rapidly shaken the
presence of saponin is indicated by the production of bubbles or persistent foam
Proteins adding 1 ml of 40 percent sodium hydroxide and a few drops of 1 percent copper
sulphate to 2ml of each extract The production of violet colour shows the presence of peptide
linkage molecules in the sample extract
Glycosides 05ml of glacial acetic acid and 3 drops of 1 aqueous ferric chloride solution
added in to 1ml of each extract The creation of a brown ring at the interface shows the
presence of glycosides in the sample extract
Terpenoids 1ml of each solvent is mixed with 05ml chloroform and a few drops of strong
sulphuric acid to produce a reddish-brown precipitate that confirms the presence of Terpenoid
in the extract
Table 1 Preliminary Phytochemical analysis
Class of
compounds
Manilkara
zapota
Manilkara
hexandra
Mangifera
indica
Madhuka
indica
Annona
squamosa AE CE WE AE CE WE AE CE WE AE CE WE AE CE WE
Alkaloid + + - + - - + + - + - - + - -
Amino acid - - - - - - - - - - - - - - -
Carbohydr
ate
+ + - + - + + - - - - - - - -
Protein - - + + - + + - + - - - - - +
Glycoside + - - + - + - - - - - + - - -
Tannin - - + - - - + + + + - + + + +
Terpenoid - + - - - - - - - - - + - - -
Saponin - + + + - + + - + + - + + - -
Flavonoid - + + - - + - - + - - + + - -
Steroid + - + - - + - - + - - - - - -
Where lsquo+rsquo = positive and lsquo-rsquo = negative
AE= Acetone extract CE= Chloroform extract WE= Water extract
Alkaloid carbohydrate glycoside and steroid are all found in Acetone extract of M zapota
leaves Chloroform extract of M zapota leaves contains alkaloid carbohydrate terpenoid
PANCHAL amp JHA Qualitative phytochemical analysis
Prithivya | August 2021 41
saponin and flavonoid Protein Tannin Saponin Flavonoid and Steroid can be found in the
aqueous extract of M zapota leaves alkaloid carbohydrate protein glycoside and saponin
are all found in Acetone extract of M hexandra leaves All phytochemicals are missing in the
chloroform extract of M hexandra leaves Aqueous extract of M hexandra leaves contains
carbohydrate protein glycoside saponin flavonoid and steroid Alkaloid Carbohydrate
Protein Tannin and Saponin are all found in Acetone extract of M indica leaves Alkaloid
and Tannin are found in Chloroform extract of M indica leaves Protein Tannin Saponin
Flavonoid and Steroid are found in aqueous extract of M indica leaves Alkaloid and
Tannin are found in Acetone extract of M indica leaves Chloroform extract of M indica
leaves is devoid of all phytochemicals Aqueous extract of M indica leaves contains
Glycoside Tannin Terpenoid Saponin and Flavonoid Alkaloid Tannin Saponin and
Flavonoid are all found in Acetone extract of A squamosa leaves Aqueous extract of A
squamosa leaves contains protein and tannin
Discussion
Plant samples were subjected to phytochemical analysis which confirmed the existence of
elements with medicinal and physiological properties Phytochemicals such as carbohydrate
amino acid protein tannin flavonoid saponin glycoside steroid terpenoid and alkaloids
were found in the plant extracts
Tannins attach to proline-rich proteins preventing them from being synthesized Flavonoids
are hydroxylated phenolic compounds that plants produce in response to microbial infection
and have been discovered to have antibacterial properties in vitro against a wide range of
pathogens Their capacity to combine with extracellular and soluble proteins as well as the
bacterial cell wall is most likely the reason for their activity They are also powerful
antioxidants with anticancer properties
Saponins which are known to have an anti-inflammatory impact were also discovered in the
plant extracts Saponins have the ability to coagulate and precipitate red blood cells Saponins
are known for their ability to produce foams in aqueous solutions as well as their hemolytic
activity cholesterol binding capabilities and bitterness Steroids have been shown to have
antimicrobial characteristics and they are extremely essential molecules particularly in
regard to sex hormones For millennia alkaloids have been associated with medical purposes
and cytotoxicity is one of their most prevalent biological features Alkaloids have been shown
PANCHAL amp JHA Qualitative phytochemical analysis
Prithivya | August 2021 42
to have analgesic antispasmodic and antibacterial effects by several researchers Glycosides
have been shown to reduce blood pressure in numerous studies The findings of this study
indicate that the detected phytochemical substances may be bioactive constituents and that
these plants are proving to be a valuable reservoir of bioactive compounds with significant
medical value
Conclusion
The findings demonstrated that the plants investigated contained medicinally essential
components Many previous investigations had accumulated evidence that the discovered
phytochemical was bioactive Several studies have demonstrated that these phytochemicals
contribute pharmacological and physiological qualities to the plants researched in the
treatment of various illnesses As a result extracts from these plants could be considered a
valuable source of drugs Further research should be carried out to separate purify and
characterize the active ingredients responsible for the activity of these plants as well as
further work to isolate purify and characterize the active constituents responsible for the
action of these Plants In addition more research into the putative mechanisms of action of
these extracts is urged
Acknowledgement
Authors are thankful to Disha life sciences Pvt Ltd for practical work during this study
References
Ashwin Godghate Rajaram Sawant Ashok Sutar (2012) Phytochemical Analysis of
Ethanolic extract of Roots of Carrisa carandus Linn RasayanJChem 5(4)456-
459
K Girija P Udaya Chandrika K Lakshman N Pruthvi (2010) Evaluation of Antimicrobial
activity of various Bark extracts of Bombax malabaricum IntJResPharmSci
1(2)199-204
Khalid S Shahzad A Bashrat N Abubakar M Anwar P (2018) Phytochemical screening and
Analysis of selected Medicinal Plants in Gujarat J Phytochemistry Biochem 2108
Kodangala C Saha S Kodangala P (2010) Phytochemical studies of Aerial parts of the Plant
Leucas lavandulaefolia Der Pharma Chemica 2(5)434-437
PANCHAL amp JHA Qualitative phytochemical analysis
Prithivya | August 2021 43
Manash PS et al (2016) Phytochemical Analysis of Traditional Medicinal Plants and their
Antimicrobial activity An Experience from North East India J Pharm Res
1(1)000104
Prabhavathi R M Prasad M P and Jayaramu M (2016) Studies on Qualitative and
Quantitative Phytochemical Analysis of Cissus quadrangularis Advances in Applied
Science Research 7(4)11-17
Pushpendra K Patel Narendra K Prajapati and BK Dubey (2012) Madhuka indica A
Review of its Medicinal property IJPSR 3(5) 942-950
RNS Yadav and Munia Agrawala (2011) Phytochemical analysis of some medicinal plants
Journal of Phytology 3(1)10-14
S Hemadri Reddy Aisha Khalid AL-Hinai Hajer Hafed AL-Yaqoobi and Fatima Jafar AL-
Ajmi (2016) Phytochemical analysis antimicrobial screening and Hypoglycemic
effect of some selected Medicinal plant extract from Oman Journal of Experimental
Biology and Agricultural Sciences 4(2)218-224
Suggested citation
Panchal M and Jha C (2021) Qualitative phytochemical analysis of some medicinal plants (leaves)
from the surrounding area of Talod Taluka North Gujarat India Prithivya An Official Newsletter
of WCB Research Foundation and WCB Research Lab Vol 1(2) 37-43
DHARAIYA A Remote sensing
Prithivya | August 2021 44
Remote sensing An overview with fundamentals and applications
Dharaiya Aditya
Geology Department MG Science Institute Ahmadabad ndash 380009 (Gujarat) India
E-mail adiradhugmailcom
Introduction
The general concept of remote sensing can be inferred by a simple statement ie the
acquisition of information from a specific distance Scientifically it is the science of
acquiring information about an object or phenomenon by measuring emitted and reflected
radiation (Ray 2013) According to Lillesand et al (2015) remote sensing is defined as the
science and techniques of obtaining information about an object land area phenomenon or
ecosystem process acquired by a device that is not in direct contact with the object area or
phenomenon under investigation The data collection is done remotely using various sensors
which may be further analyzed to obtain information about the objects areas or phenomenon
These acquired data can be of many forms such as variations in force distributions acoustic
wave and electromagnetic energy distributions Joseph (2005) has discussed modern remote
sensing as an extension of the natural phenomenon of visual perception of objects Apart
from visible spectrum the electromagnetic radiation from the ultraviolet to far infrared and
the microwave regions is used for remote sensing The observations which are directly
inferred through electromagnetic radiation (EMR) from the sun or self-emitted radiance is
called passive remote sensing Whereas in active remote sensing the electromagnetic
radiations of a specific wavelength or band of wavelengths are generated to illuminate the
targets and reflected or back-scattered EMR are recorded to gain information for example
LiDAR RADAR SAR etc Based on its applicability remote sensing is defined as sensing
of the earthrsquos surface from the space by making use of the properties of electromagnetic wave
emitted reflected or diffracted by the sensed objects for the purpose of improving natural
resource management land use and environmental protection The classification of remote
sensing is further based on the selection of EMR (eg optical and microwave Navalgund et
al (2007)) When the sensors detect the solar radiation in the visible and infrared wavelength
regions reflectedscattered or emitted from the earth is said as optical remote sensing and in
microwave remote sensing uses interference and polarization concepts with electromagnetic
energy that detects the scattered energy returning from the terrain and records it as an image
The main purpose of remote sensing is to have an organized systematic and large amount of
DHARAIYA A Remote sensing
Prithivya | August 2021 45
data collection in order to acquire information about 2 or 3 dimensions of real objects One
can get large and broad global coverage and repeatability of data to obtain a multipurpose
information through various earth observation satellite sensors which helps in detecting
things that are normally absent in visible spectra such as Land-surface temperature
Underground or sub-surface water etc There are several Earth Observation (EO) Satellites
namely Cartosat series Landsat series Sentinel 1 2 MODIS RISAT 1 and RADARSAT 2
Resourcesat Envisat IRS 1A Oceansat 2 and many more
Electromagnetic Spectrum
Electromagnetic radiation or EMR is the term used to describe all of the different types of
energies released by electromagnetic processes Visible light is just one of many forms of
electromagnetic energy Radio waves infrared light and X rays are all forms of
electromagnetic radiation The
electromagnetic waves are formed by
the vibrations of electric and magnetic
fields these vary in magnitude in a
direction perpendicular to the direction
of propagation of radiations at a
constant speed of light (c= 3108
ms)Figure 1 shows a generalized
concept of EMR These differ from
mechanical waves as they need not
require a medium to propagate
hence it is able to travel through air
and solid materials and can also
travel through the vacuum of space Thus to define the EMR scientifically it can be said as a
form of energy emitted or absorbed by charged particles which exhibits wave-like behavior
as it travels through space
The electromagnetic spectrum is the entire range of all possible frequencies of
electromagnetic radiation (Figure 2) This includes the electromagnetic energy ranging from
Gamma rays to radio waves where the wavelength becomes longer so the energy and
frequency gradually decreases There are four kinds of resolution that are described from the
EMR spectrum are as follows
Figure 1 Illustration on the concept of EMR in which
propagation of electric and magnetic field is shown
Source - httpwwwfaoorg3t0355eT0355E02HTM accessed on 25
th
April
2021
DHARAIYA A Remote sensing
Prithivya | August 2021 46
1 Spectral resolution ndash it is the variation in the reflectanceemittance as a function of
wavelength Spectral responses are recorded by separate spectral bands such as Red Blue
Green Thermal NIR etc Figure 3 depicts the spectral resolution through a reflectance
curve It is further divided into 4 class sub classes
a Panchromatic ndash It consists
of only 1 band (BW)
b Colour ndash It consists the
combinations of 3 colors of
visible spectrum (RGB)
c Multispectral ndash consists of
3 to 10 bands and offers
Medium level spectral
resolution(Feng et al 2020)
d Hyper spectral ndash consists
of 100s of band and offers
higher spectral resolution (Feng et al 2020)
The combinations of spectral reflectance from two or more wavelength that indicate the
relative abundance of feature of interest are known as spectral indices Vegetation indices are
the most popular type but other indices are available for burned area built-up features
Figure 2 Electromagnetic spectrum showing waves and the radiations with respect to
wavelength and frequency
Figure 3 Spectral reflectance curve to determine spectral
resolution
Source -httpgsphumboldtedu accessed on 8th
April 2021
Source ndashLillesand et al (2015) Remote sensing and Image interpretation 7e
DHARAIYA A Remote sensing
Prithivya | August 2021 47
hydrologic and geologic features The band combinations for formulating spectral indices
vary from satellite to satellite Some of the most common spectral indices are listed in
Table1
No Spectral indices Formulation
(Band combinations)
1 NDVI (Normalised Difference Vegetation
Index)
NIR ndash Red NIR + Red (Where NIR is
Near-infrared band)
2 NDWI (Normalised Difference Water Index)
NDMI (Normalised Difference Moisture Index)
NIR - SWIR NIR + SWIR
3 AVI (Advanced Vegetation Index) [NIR (1-Red) (NIR-Red)] 13
4 NDSI (Normalised Difference Snow Index) Green ndash SWIR Green + SWIR
5 SAVI (Soil Adjusted Vegetation Index) ((NIR ndash R) (NIR + R + L)) (1 + L)
Where L is soil brightness correction
factor
6 MSI (Moisture Stress Index) MIR NIR Where MIR is Middle-wave
Infrared
7 NDGI (Normalised Difference Glacier Index) NIR ndash Green NIR + Green
8 NDBI (Normalised Difference Built-up Index) SWIR ndash NIR SWIR + NIR
9 BSI (Bare Soil Index) ((Red + SWIR) ndash (NIR + Blue)) ((Red
+ SWIR) + (NIR + Blue))
2 Spatial resolutionndashIt is described as the measure of the smallest object that can be resolved
by the sensor or the ground area imaged for the instantaneous field of view (IFOV) of the
ground sensor or the linear dimension on the ground represented by each pixel in the
reflectanceemittance determined by the shape size and texture of the target as discussed in
the book entitled Advance Remote Sensing 2012 It is expressed in meters like (250 m 80
m 10 m 1 m resolutions etc) Figure 4 is an example of spatial resolution
10 m resolution 30 m resolution
(a) (b)
Table 1 Different kinds of Spectral indices with respect to their formulations of band
Source -httpsgiscrackcomlist-of-spectral-indices
Source -httpsgiscrackcomlist-of-spectral-indices
Source -httpsgiscrackcomlist-of-spectral-indices
combinations
Figure 4 Example of Spatial Resolution by imagery acquired from Sentinel (a) and Landsat (b)
satellite sensors
Source -httpsgiscrackcomlist-of-spectral-indices
DHARAIYA A Remote sensing
Prithivya | August 2021 48
3Temporal resolution ndash the amount of time needed to revisit and acquire data for the exact
same location is called temporal resolution for example the revisit time period of Landsat is
16 days and that of Sentinel is 10 days Figure 5 shows the processed temporal resolution
4 Radiometric resolution ndash When an image is acquired by a sensor its sensitivity to the
magnitude of the electromagnetic energy determines the radiometric resolution The finer the
radiometric resolution of a sensor the more sensitive it is to detecting small differences in
reflected or emitted energy
Components and process of remote sensing
Figure 6 briefly describes the
process of remote sensing
Though the methods for
collection processing and
interpretation of remotely sensed
data are diverse imaging systems
have the following essential
components
Figure 5 Example of Temporal resolution of Las Vegas over time in 1973 2000 and 2006
Figure 6 A generalized process components of remote
sensing technology
Source- httpsseos-projecteuremotesensing
Source - httpswwwgisoutlookcom2019 accessed on 8th
April 2021
DHARAIYA A Remote sensing
Prithivya | August 2021 49
1 Energy source or illumination
This is the basic requirement for process of remote sensing to have a source of energy that
illuminates electromagnetic energy to the target of interest for example Active and passive
ensors Mostly the sensors are passive which tends to measure the solar radiation reflected
from the target
2 Interaction with the atmosphere
Before the electromagnetic radiation reaches the Earths surface it has to travel through some
distance of the Earths atmosphere Particles and gases in the atmosphere can affect the
incoming light and radiation and such type of effects are caused by the mechanisms
of scattering and absorption (Figure 7)Scattering occurs when particles or large gas
molecules present in the atmosphere interacts and cause the electromagnetic radiation to be
redirected from its
original path It depends
on several factors
including the
wavelength of the
radiation the abundance
of particles or gases and
the distance the radiation
travels through the
atmosphere There are three 3 types of scattering which take place are described in Table 2
All the different types of scattering with examples are briefly shown in figure 8
No Types of Scattering Particle size
(Micro meters
μm)
Examples
1 Rayleigh lt 01 μm Small specks of Dust N2 O2
molecules
2 Mie ~ 1 to 10 μm Pollen Smoke Water vapour
3 Non ndash Selective gt 10 μm Water droplets and large dust
particles
Figure 7 Interaction of EMR with atmosphere (a) Scattering and (b)
Absorption
Table 2 Different types of scattering occur when EMR interacts with the atmosphere
Reference httpswwwnrcangccamaps-tools-publications
DHARAIYA A Remote sensing
Prithivya | August 2021 50
Absorption is the other main mechanism when EMR interacts with the atmosphere In
Contrast to scattering it causes molecules in the atmosphere to absorb specific amount of
energy at various wavelengths O3 CO2 and water vapour are 3 main atmospheric
constituents which absorbs radiation Those areas of the EMR spectrum which are not
severely influenced by atmospheric absorption and thus are useful for remote sensors are
called Atmospheric windows (Figure 9) The visible portion of the spectrum to which our
eyes are most sensitive corresponds to both the atmospheric window and the peak energy
level of the sun
Figure 8 Different types of scattering when EMR interacts in the atmosphere or with the
Earthrsquos surface
Figure 9 Atmospheric window showing the transmission of molecules at different wavelength
with respect to different radiations
Source - httpwwwgeooregonstateedu accessed on 8th
April 2021
Source - httpwwwsarraceniacomastronomy accessed on 8th
April 2021
DHARAIYA A Remote sensing
Prithivya | August 2021 51
3 Interaction with the target
After the interaction with atmosphere once the energy makes its way to the target through the
atmosphere it interacts with the target depending on the properties of both the target and the
radiation Figure 10 shows such examples of interaction This can take place a second time as
the energy travels back from the target to sensor Several interactions are possible when
electromagnetic energy encounters matter whether solid liquid or gases are as follows
Radiation may be transmitted or passed through the substance
It may be absorbed and give up its energy largely to heating the substance
It may be emitted as a function of its emissivity and temperature
It may be reflected in 2 ways specular and diffused (Scattered)
4 Recording of Energy by the sensor
After the energy has been scattered by or emitted from the earthrsquos surface there is a need for
a sensor which is mounted on a satellite to collect and record the EMR The sensors are
popularly known by EMR region they sense Remote sensing has a broad classification of
optical and microwave as well as active and passive remote sensing as discussed by
Navalgund et al(2007) Feng et al (2020) Ray (2013) The sensors for taking
observations needs to be mounted on a platform This could be ground based (eg handheld
radiometers) airborne (eg Drone AVIRIS sensor of NASA on board aircraft) or space-
borne (ie satellite based)
Figure 10 EMR interaction with the Earthrsquos Surface
Source httpswwwslideservecomportia copy Rick Lathrop accessed on 25th
April 2021
DHARAIYA A Remote sensing
Prithivya | August 2021 52
5 Transmission Reception and Processing
The energy recorded by the sensor has to be transmitted often in electronic form to a
receiving and processing station at the earth where the data are processed and stored in digital
form
6 Interpretation and analysis
Furthermore this processed data is interpreted visually and digitally to extract information
about the target which was illuminated There are numerous specialised instruments or
hardware and software used that are commonly known as image processing tools which
involves four basic steps viz image correctionrestoration image enhancement image
transformation and image classification
7 Application
The final element or component of remote sensing process is achieved when we apply the
extracted and processed information in solving a particular issue or problem Specialists who
work in each application theme are able to perform and carry out this task
Applications of remote sensing
Every application itself has some specific demands for spectral spatial radiometric and
temporal resolution of the satellite sensor (Shandilya et al 2013) In modern era the remote
sensing proved very effective to understand and resolve the challenges in almost all the
fields few of its major applications are illustrated in this article
1 Geology
In the field of geosciences the remote sensing techniques are applied to interpret and analyse
the bedrock lithological structural formations sedimentation(Merritt et al 2014 Stead et
al 2019) planetary surface monitoring (Clark et al 2003 Des Marais et al 2002 Shepard
et al 2001)geo-hazards and mineral exploration through observation and modelling
techniques
DHARAIYA A Remote sensing
Prithivya | August 2021 53
2 Hydrology
Some examples of applications of remote
sensing in hydrological science include
soil moisture estimation flood and
wetland monitoring watershed and
drainage modelling river delta change
detection and many more Figure 11 and
12are an example of one of the studies
undertaken for hydrological modelling
and mapping of wetlands respectively
(Dharaiya 2020a Dharaiya et al 2021)
3 Glaciology
By means of remote sensing one can acquire information and map the ice concentration ice
type or motion(Frey et al 2014 Jiyang Chen amp Ohmura 1990) iceberg detection glacier
copy
Adi
tya
D
Figure 11 Drainage modelling in Jambughoda
Wildlife sanctuary Gujarat (after Dharaiya
2020a)
copy
Aditya
D Figure 12 Mapping of wetlands in Patan district Gujarat (Dharaiya et al 2021)
DHARAIYA A Remote sensing
Prithivya | August 2021 54
dynamics (Pratibha amp Kulkarni 2018 Remya et al 2019) monitor snow thickness
(Gantayat et al 2014 Kulkarni et al 2002) meteorological change research snow-water
equivalence snowmelt run-off estimation and many more
4 Agriculture
In the science of agriculture the remote sensing is mostly used as a decision-making tool viz
for crop type classification crop condition assessment crop yield estimation soil characters
soil management practices and compliance monitoring (Zheng et al 2014)
5 Forestry
Forestry is one of the major sectors where remote sensing has proved as very effective tool It
has been used for reconnaissance mapping commercial forestry and environmental
monitoring are some objectives which can be fulfilled and that further helps in managing and
conserving the natural resources Figure 13 is an example of mapping the forest coverat
Ratanmahal wildlife sanctuary Gujarat using spectral indices
6 Land use Land cover (LULC)
Yacouba et al (2010) has discussed the LULC with reference to two terms lsquoland usersquo which
refers to the purpose the land serves and lsquoland coverrsquo refers to natural surface cover on the
ground For example it is widely used in habitat and natural resource management urban
expansion baseline mapping risk assessment legal boundaries for tax evaluation change
Figure 13 Forest cover map of Ratanmahal wildlife sanctuary Gujarat copy Aditya Dharaiya
DHARAIYA A Remote sensing
Prithivya | August 2021 55
detection etc Figure 14 and 15depicts the LULC classification and change detection of
wetlands respectively (Dharaiya 2020b Dharaiya et al 2021)
copy
Adity
a D
Figure 14 LULC classification with vegetation cover in Girnar Wildlife sanctuary
Gujarat (After Dharaiya 2020b)
Figure 15 Change detection of wetlands in Patan district Gujarat using Landsat 8 OLI
(Dharaiya et al 2021)
DHARAIYA A Remote sensing
Prithivya | August 2021 56
7 Coastal monitoring
Remote sensing can be used to gather information about oceanic processes(physical and
biological) oil spill (Alesheikh et al 1997 Fingas amp Brown 1997) and shipping by means
of remote sensing
Several other applications according to Shandilya et al (2013) include planimetry or land
surveying using very high spatial resolution satellites (30 cm) Generating Digital Elevation
Models (DEMs) from remote sensing products are used to generate elevation profiles by
means of radar interferometry radargrammetry and photogrammetry To extract the
planimetric details about mineral exploration activities topographic mapping and surface
monitoring base map imagery provides a priori information about the areas
Conclusion
This emerging technique of remote sensing is a significant tool to monitor the Earthrsquos
surface It has progressively expanded applications which allow users to collect interpret
and manipulate data over vast areas Multi-temporal satellite data help to delineate changes of
the earthrsquos surface thus it can be also said to be a useful and handy tool for all the users as it
increases the accuracy efficiency and quality of the analysis in such a way that it can be
helpful in decision-making process Furthermore the products can be conveniently used by
other scientists too who are even not much familiar with this technology and for the greatest
level of detail to be extracted
References
Alesheikh A A Ghorbanali A amp Nouri N (1997) Coastline change detection using
remote sensing International Journal of Environmental Science and Technology 4(1)
1ndash11
Clark R N Swayze G A Livo K E Kokaly R F Sutley S J Dalton J B
McDougal R R amp Gent C A (2003) Imaging spectroscopy Earth and planetary
remote sensing with the USGS Tetra order and expert systems Journal of
Geophysical Research E Planets 108(12) httpsdoiorg1010292002je001847
Des Marais D J Harwit M O Jucks K W Kasting J F Lin D N C Lunine J I
Schneider J Seager S Traub W A amp Woolf N J (2002) Remote sensing of
DHARAIYA A Remote sensing
Prithivya | August 2021 57
planetary properties and biosignatures on extrasolar terrestrial planets Astrobiology
2(2) 153ndash181 httpsdoiorg10108915311070260192246
Dharaiya A (2020a)Monitoring and assessment of forest ecosystem using geospatial
technology A case study of Jambughoda wildlife sanctuary Gujarat India Poster
presented at ISRS National Symposium-2020
Dharaiya A (2020b) Habitat Analysis of Girnar Wildlife Sanctuary using Geospatial
Techniques Paper presented at National Map Competition GIS Day-2020
Dharaiya N Bhati R and Patel J (2021) Ecological studies on selected wetlands of Patan
district to prepare management plan for long-term conservation Technical Report
WCB Research Foundation Patan 91Pp
Feng X He L Cheng Q Long X amp Yuan Y (2020) Hyperspectral and multispectral
remote sensing image fusion based on endmember spatial information Remote
Sensing 12(6) 1ndash17 httpsdoiorg103390rs12061009
Fingas M F amp Brown C E (1997) Review of oil spill remote sensing Spill Science and
Technology Bulletin 4(4) 199ndash208 httpsdoiorg101016S1353-2561(98)00023-1
Frey H Machguth H Huss M Huggel C Bajracharya S Bolch T Kulkarni A
Linsbauer A Salzmann N amp Stoffel M (2014) Estimating the volume of glaciers
in the Himalayan-Karakoram region using different methods Cryosphere 8(6) 2313ndash
2333 httpsdoiorg105194tc-8-2313-2014
Gantayat P Kulkarni A V amp Srinivasan J (2014) Estimation of ice thickness using
surface velocities and slope Case study at Gangotri Glacier India Journal of
Glaciology 60(220) 277ndash282 httpsdoiorg1031892014JoG13J078
Jiyang Chen amp Ohmura A (1990) Estimation of Alpine glacier water resources and their
change since the 1870s Hydrology in Mountainous Regions I 5(193) 127ndash135
Joseph G (2005) Fundamentals of Remote sensing 2e Orient Blackswan 2Rev ed Pp i-
xi 1-486
DHARAIYA A Remote sensing
Prithivya | August 2021 58
Kulkarni A V Srinivasulu J Manjul S S amp Mathur P (2002) Field based spectral
reflectance studies to develop NDSI method for snow cover monitoring Journal of
the Indian Society of Remote Sensing 30(1ndash2) 73ndash80
httpsdoiorg101007BF02989978
Lillesand T Kiefer R Chipman J (2015) Remote sensing and Image interpretation 7e
John Wiley amp sons Inc Pp 1-736
Merritt A J Chambers J E Murphy W Wilkinson P B West L J Gunn D A
Meldrum P I Kirkham M amp Dixon N (2014) 3D ground model development for
an active landslide in Liasmudrocks using geophysical remote sensing and
geotechnical methods Landslides 11(4) 537ndash550 httpsdoiorg101007s10346-
013-0409-1
Navalgund R Jayaraman V Roy P (2007) Remote sensing applications An overview
Current Science 93(12) 1747-1766
Pratibha S amp Kulkarni A V (2018) Decadal change in supraglacial debris cover in Baspa
basin Western Himalaya Current Science 114(4) 792ndash799
httpsdoiorg1018520csv114i04792-799
Ray S (2013) Basics of Remote Sensing Remote Sensing Image Analysis Including the
Spatial Domain 1ndash15 httpsdoiorg1010071-4020-2560-2_1
Remya S N Kulkarni A V Pradeep S amp Shrestha D G (2019) Volume estimation of
existing and potential glacier lakes Sikkim Himalaya India Current Science 116(4)
620ndash627 httpsdoiorg1018520csv116i4620-627
Shandilya K K Shukla S P amp Pathak V (2013) Applications of Remote sensing
Horizons of Earth sciences Vol 10 1ndash12
Shepard M K Campbell B A Bulmer M H Farr T G Gaddis L R amp Plaut J J
(2001) The roughness of natural terrain A planetary and remote sensing perspective
Journal of Geophysical Research E Planets 106(E12) 32777ndash32795
httpsdoiorg1010292000JE001429
DHARAIYA A Remote sensing
Prithivya | August 2021 59
Stead D Donati D Wolter A amp Sturzenegger M (2019) Application of remote sensing
to the investigation of rock slopes Experience gained and lessons learned ISPRS
International Journal of Geo-Information 8(7) httpsdoiorg103390ijgi8070296
Yacouba D Guangdao H amp Xingping W (2010) Applications of Remote Sensing in
Land UseLand Cover Change Detection in Puer and Simao Counties Yunnan
Province Report and Opinion 2(9) 7ndash16
Zheng B Campbell J B Serbin G amp Galbraith J M (2014) Remote sensing of crop
residue and tillage practices Present capabilities and future prospects Soil and
Tillage Research 138 26ndash34 httpsdoiorg101016jstill201312009
Types of resolution used in remote sensing
httpwwwedcuriedunrsclassesnrs409rslectureshowremotesensonworkpdfacce
ssed on 24th April 2021
Components of remote sensing ndash Scattering and absorption httpswwwnrcangccamaps-
tools-publicationssatellite-imagery-air-photosremote-sensing-
tutorialsintroductioninteractions-atmosphere14635accessed on 24th April 2021
Basic concepts of Electromagnetic radiation and
spectrumhttpgsphumboldteduOLMCoursesGSP_216_Onlinelesson1-
2spectrumhtmlaccessed on 24th April 2021
Concept of spectral indices httpswwwl3harrisgeospatialcomdocsspectralindiceshtml
accessed on 25th April 2021
Suggested citation
Dharaiya A (2021) Remote sensing and An overview with fundamentals and applications
Prithivya An Official Newsletter of WCB Research Foundation and WCB Research Lab Vol 1(2)
44-59
M I PATEL AWARD 2021
Prithivya | August 2021 60
M I Patel Award for Young Wildlife amp Conservation Biologist
Nominations for 2021 Award
Ms Shivangi Mishra
Shivangi is a Senior Research Fellow (Basic Scientific
Research Fellow UGC) at University of Lucknow and is
currently working on Egyptian Vultures She has also
worked on Butterflies of Uttar Pradesh from 2014- 2016
She has presented her research on Egyptian Vultures in
Conference of Raptor Research Foundation in 2018
(South Africa) 2019 (USA) and awarded with William C
Andersen Award and James Koplin Award respectively In
future also she wants to contribute her research for the
conservation of Egyptian Vultures in India
Dr Tarang Kumar Shah
Tarang is an Assistant Professor in Fisheries polytechnic at
Dau Shri VasudevChandrakarKamdhenuVishwaVidyalaya
Durg He studied the Effect of Thymus linearis plant
Extract on Growth Performance and Non-Specific Immune
Responses of endangered Golden Mahseer (Tor
putitora)against the disease caused
byOomycetesSaprolegniaparastica He found that the leaf
extract of Thymus plant has the antifungal properties and a
small quantity of which can control the population against
saprolegniosis
Dr Sujit Kolangath
Sujit is a subject specialist in animal biotechnology at
Wildlife Research amp Training Center Gorewada Nagpur
He studied the qualitative and quantitative aspect of
hepatoozoonfelis epidemiology in a tiger cub He reported
that the infection is transmitted by ingestion of infected
ticks infected prey and carrion and concurrent infection
with bacterial or viral infections may be fatal to the
infected animal
M I PATEL AWARD 2021
Prithivya | August 2021 61
Ms Jis Sebastian
Jis recently completed her doctoral research in Botany
from Madurai Kamraj University Madurai- Tamil Nadu
She is studying the pattern of diversity spatial distribution
and community structure of epiphytic orchids of southern
Western Ghatsresponds to availibility of
microenviornments (Microhabitat supported by
Microclimates) in the structurally diverse trees There for
Conservation of epiphytic orchids would ensure
conservation of old aged natural structurally complex
trees in the forest ecosystem
Dr Harshil Patel
Harshil is a naturalist working mainly on systematics and
taxonomy of reptiles and amphibians He studied the
amphibians amp reptiles of northern Western Ghats of
Gujarat He found a new Miocene divergent endemic
lineage of a racer snake evolutionary history of an
endemic snake resulted in the resurrection of a genus
reinvestigation of a gecko species complex that resulted
into the discovery of two new species
The final round including the presentation by the nominees followed by the award
ceremony will be conducted on September 27 2021 at M N College Visnagar (Gujarat)
WCB and the M I Patel Award committee congratulate all the nominees and wishing all
the best for their presentation
Applications and nomination for the 2022 awards are now open through our website
(wwwwcbresearchin) till June 30 2022
ANNOUNCEMENT
Prithivya | August 2021 62
ANNOUNCEMENT
Prithivya | August 2021 63
WINNERS OF MANGROVE DAY POSTER
COMPETITION
Prithivya | August 2021 64
WCB Research Foundation with K J Somaiya College Mubai have organized Digital and
Handmade Posters Competition on the occasion of World Mangrove Day July 26 2021 Out
of entries of thirty participants three best posters were selected by the committee and
awarded
Posters of Winners
1st Prize Digital Poster Ms Yukta Sawant
WINNERS OF MANGROVE DAY POSTER
COMPETITION
Prithivya | August 2021 65
1st Prize Digital Poster Ms Yukta Sawant
1st Prize Handmade Poster Ms Tanya Sawardekar
WCB RESEARCH FOUNDATION GOVERNING COUNCIL
Prithivya | August 2021 66
Governing Council of WCB Research Foundation
Executive
Director
Dr Hardik Patel Assistant Professor
Parul University Vadodara
phardik80gmailcom
Director of
Research
Dr Nishith Dharaiya Associate Professor
HNG University Patan
nadharaiyanguacin
Member Dr Sagarika Damle Associate Professor amp Head
Department of Life Sciences KC College Mumbai
sagarikadamlekccollegeeduin
Member Dr Nuria Selva Associate Professor
Institute of Nature Conservation
Polish Academy of Science Krakow Poland
nuriaselvagmailcom
Member Mr Pratik Desai Jr Research Fellow
WCB Research Lab Patan
pratikdesai825gmailcom
Member Mr M S Patel Associate Professor
M N College Visnagar martinleemsgmailcom
Member Dr Haresh Gondaliya Assistant Professor
Shri G D Modi Science College Palanpur hareshgondliya55gmailcom
Member Mr Prasad Patil Range Forest Officer
Gujarat Forest Department jalu1890gmailcom
Member Ms Madhuri Padaya Assistant Professor
K J Somaiya College of Science Mumbai padayamadhuriyahoocom
Member Dr Jagruti Rathod Director
Center for Nature amp Ecosystem Wellbeing Vadodara
rathod21gmailcom
Member
Secretary
Ms Jahnvi Patel Admin Officer
WCB Research Foundation Patan
adminwcbresearchin
Page 1 of 7 Pruthivya An official newsletter of WCB Research Foundation
Guidelines to authors and contributors 1 | P a g e
Instructions for authors
Scope Prithivya is a tri-annual newsletter of WCB Research Foundation and will
publish manuscripts on wildlife conservation biology and its allied areas
Guidelines to contributors of Prithiviya
Manuscript Types Prithiviya publishes original research articles short notes
field notes reviews and comments Submissions should be in English (UK) only
All manuscripts should be easy to read and comprehend Manuscripts may be
edited for length content and style and be sent to referees when found to be
appropriate The editor will discuss contributions with authors and advise to
modified whenever required
Submission is considered on the condition that papers are previously
unpublished have not been offered simultaneously elsewhere and that all
contributors have read and approved the contents
The editor will acknowledge manuscript contributions and assign them a unique
registration number which latter must be quoted in correspondence Papers are
peer-reviewed although the editor reserves the right to reject one without a
review
Preparation and submission of manuscripts
1 Title page Add full title Authors name and affiliation with email of all the Authors Abstract (250 Words) and Key words (4-5)
2 Submitted manuscripts should generally follow the normal convention of
scientific manuscripts keywords generally not appearing in the title
Introduction Materials and Methods Results and Discussion
Acknowledgments Authors contribution (optional) Appendices (optional) and
References) with the replacement or addition of sections allowed in between
the Introduction and the Acknowledgments
3 The manuscript should be typed in MS Word with left-aligned typesetting and
only true type fonts (Times new roman preferable) should be used The line
spacing must be 15 and the font size of 12 Headings should be bold and sub-
headings should be made italicized
Page 2 of 7 Pruthivya An official newsletter of WCB Research Foundation
Guidelines to authors and contributors 2 | P a g e
4 Title A concise informative and attractive and short title with 5-20 words will
be encouraged
5 Abstract Word limit for the abstract is 250 words and should contain a
summary of all major findings or conclusions of the study however abstract
is not required in case of short notes field notes and other short
communication
6 Introduction should be clearly written and must covering the objectives and
significance of the study
7 Methodology A detailed methodology is always encouraged The methodology
should contain the study area (if applicable) data collection analysis and
interpretation Authors should also mention the instruments software used
for the experiments and analysis
8 Result and discussions which contain main result with proper references
and authentic justifications include graph table photographs (No checklist
it directly goes into appendix or supplementary data)
9 Conclusions A short and comprehensive conclusion with significant novel
findings and depicting your research in a nut-shell
10 Acknowledgments which contain all funds support persons who help
during project or research or findings name of university other than they work
etc
11 Checklist-based papers like trip reports should contain dates of the trip total
number of birders or participants Mammals reptiles amphibians
invertebrates etc
12 Manuscripts should be sent electronically as an email attachment to the
Editorial Assistant with a cover letter to helliphellip
13 The text tables figurephotograph captions (which must be self-explanatory)
and appendices should be combined in one Microsoft Wordreg (ldquodocrdquo OR
ldquodocxrdquo) file format The preferred font is lsquoTimes New Romanrsquo in 12 point
14 Photographs artwork maps (the outlines of the Republic of India should
conform to Government of India regulations) diagrams etc should be
digitized and sent separately along with the manuscript or if they are large
Page 3 of 7 Pruthivya An official newsletter of WCB Research Foundation
Guidelines to authors and contributors 3 | P a g e
files in separate trailing e-mails These should be in TIFF and at least 8times11
inches in 300 dpi resolutions JPEG files must be lsquomaximumrsquo quality ie at
their minimum compression Maps should be marked with a scale and North
arrow and should carry a clear caption
15 Authors whose work involves the handling of any necessary permissions from
the requisite government agencies to do so The editor reserves the right to
view such permissions at herhis discretion
16 While photographing nestingcourtship display or any behavioural activity
including those of nests eggs courtship etc authorsphotographers must
ensure the safety of the animals involved and also ensure that they do not
disturb in any way whatsoever in the course of their photography The editor
reserves the right to view permissions for such activities within protected
areas The editorreferee reserves the right to query an author regarding the
ethics of photography and the methodology followed while photographing
including that of rejecting a manuscript if unsatisfied on these counts
Types of Manuscript
1 Short Research articles 2000 to 2500 words
2 Short notes Up to 1500 words
3 Important sightings 250-350 words with proper GPS location and
photographic evidence
4 Important findings 250-500 words with proper GPS location with image
5 Full-length Research paper Up to 10000 words with appendix excluding
photographs only
Other important Guidelines
Scientific binomials should comprise the generic and specific names but should
not include the name of the author and year of citation Scientific trinomials
should be mentioned only if the nature of the manuscript requires them
For example both the English and scientific name must be given thus ldquoHouse
Crow Corvus splendensrdquo thereafter only the English name ldquoHouse Crowrdquo will
suffice English and scientific names should follow the proper book that should
be mention in reference and title of the table
Page 4 of 7 Pruthivya An official newsletter of WCB Research Foundation
Guidelines to authors and contributors 4 | P a g e
Metric units and their international symbols must be used eg ldquosq kmrdquo and
ldquo1000 m aslrdquo dates and times should be of the form of MMDDYYYY (January
01 2021rdquo and ldquo1345 hrdquo respectively
Tables should be within gridlines (which may or may not be printed) Tables
should never be formatted with wrap-around text
Latitude and longitude coordinates should follow the format ldquo27807ordmN
74094ordmErdquo
Enzyme Nomenclature The trivial names recommended by the IUPAC-IUB
Commission should be used When the enzyme is the main subject of a paper
its code number and systematic name should be stated in its first citation in the
paper
Symbols and Abbreviations Use only standard abbreviations The use of non-
standard abbreviations can be extremely confusing to readers Avoid
abbreviations in the title The full term for which an abbreviation stands should
precede its first use in the text unless it is a standard unit of measurement
Page number (page 1 0f 10 formats) must be on top right corner of the word
documents font size 10 and times new roman word type
Citation and References Prithivya encourages the authors to use Mendely EndNote or other reference management tools for proper citations We follow APA referencing style
Do not abbreviate references pagination should be given in the expanded form
eg ldquoindashvi 1ndash250rdquo not ldquovi 250rdquo the page numbers should be separated by an
lsquoEnrsquo dash
Italics should be used for book titles but not volume numbers when citing
periodicals use italics for the journal name not the article title
References should be arranged alphabetically by the first author (and in the case
of more than one author by second and subsequent authors)
Citations to references in the text should follow the style ldquo(Santharam 1978)rdquo
ldquo(Barua amp Sharma 1999)rdquo ldquo(Pande et al 2002)rdquo ldquo(Lainer 1999 2004)rdquo ldquo(Lainer
1999abcd Lainer 1999a 2000a)rdquo [for several papers by an authors from
Page 5 of 7 Pruthivya An official newsletter of WCB Research Foundation
Guidelines to authors and contributors 5 | P a g e
amultiple calendar years] and ldquo(Neelakantan et al 1993 Sashikumar et
al 2011)rdquo
A string of citations in the text should follow a chronological not an alphabetical
order thus ldquo(Ali amp Ripley 1981 Kazmierczak 2000 Grimmett et al 2011)rdquo
When citing unpublished sources please use the following formats if the source
is written material ldquo(Harkirat Sangha in litt e-mailletter dated 02 January
2013)rdquo if oral ldquo(Rajah Jayapal verbally dated 15 December 2013)rdquo
When citing from e-Bird or any other magazine checklist please enter the author
of the e-Bird checklistrsquos name or others name and the year the checklist was
uploaded in the text ldquo(Raman 1994)rdquo If a checklist thatrsquos shared amongst
multiple observers is being referred to only the relevant checklist(s) should be
used for citation
See examples below for detailed formatting
Journal articles
Pittie A 2011 The dates of seven new taxa described by W E Brooks (Certhia
Hodgsoni Sitta Cashmirensis Dumeticola
major Horites [sic] Pallidus Phylloscopus Tytleri Motacilla Cashmirensis
and Alauda Guttata) Prithiviya7 (2) 54ndash55
Naoroji R amp Sangha H S 2011 Threats to habitat and wildlife in Changthang
and Rupshu areas of Ladakh a case study at Hanle Prithiviya7 (1) 2ndash6
Choudhary D N Mandal J N Mishra A amp Ghosh T K 2010 First ever
breeding record of Black-necked Stork Ephippiorhynchus asiaticus from
Bihar Prithiviya6 (3) 80ndash82
Books
Futehally Z (ed) 2006 India through its birds 1st ed Bangalore India
Dronequill Publishers Pvt Ltd Pp indashii 1ndash214
Pittie A 2010 Birds in books three hundred years of South Asian ornithologymdash
a bibliography 1st ed Ranikhet Permanent Black Pp indashxxi 1ndash845
Sashikumar C Praveen J Palot M J amp Nameer P O 2011 Birds of Kerala
status and distribution 1st ed Kottayam Kerala DC Books Pp 1ndash835 Book chapter
Pittie A 2011 Stray Feathers (1872ndash1899) (p 247) In Priority The dating of
scientific names in ornithology a directory to the literature and its
Page 6 of 7 Pruthivya An official newsletter of WCB Research Foundation
Guidelines to authors and contributors 6 | P a g e
reviewers Dickinson E C Overstreet L K Dowsett R J amp Bruce M D
(eds) Northampton UK Aves Press Limited Website
2013 Kadalundi makes history with new gull species The
Hindu (Thiruvananthapuram ed) dated February 7 2013
Website httpwwwthehinducomtodays-papertp-nationaltp-
keralakadalundi-makes-history-with-new-gull-speciesarticle4388171ece
[Accessed on 21 July 2014] Any magazine checklist
Raman T R S 1994 Website
URL httpebirdorgebirdviewchecklistsubID=S21694571 [Accessed on
15
December 2015]
ETHICAL MATTERS Authors involving in the usage of experimental animals and human subjects in their
research work should seek approval from the appropriate Institutional Animal Ethics
Committee in accordance with Principles of Laboratory Animal Care The material
and methods section of the manuscript should include a statement to prove that the
investigation was approved and that informed consent was obtained
Disclaimer
While every care is taken of manuscripts and their accompanying
material Prithiviya cannot be held responsible for accidental loss or damage of
any material sent for publication or for their return whether they are accepted
for publication or not
Material published in Prithiviya reflects the views of the authors and not
necessarily those of the publishers editors referees etc
The editor reserves the rights to make necessary changes in manuscripts in
consultation with the author
All submissions are evaluated under the assumption that the conditions listed here have been understood and accepted by the author(s)
Submission fees There will be no submission fees for e-publication however we
may produce the reprints on request and on payment basis
Page 7 of 7 Pruthivya An official newsletter of WCB Research Foundation
Guidelines to authors and contributors 7 | P a g e
Special announcements
We also accept announcement of workshop webinar conference symposium job
opportunities academic courses etc with nominal charges and guarantee for its
wider circulation
Contacts Editor in Chief Dr Sagarika Damle Emailvisaanikagmailcom Associate Editors Dr Nishith Dharaiya
Email nadharaiyagmailcom Dr Jagruti Rathod Email rathod21gmailcom Editorial Assistant Ms Rinku Bhati
Email bhatirinku178gmailcom
WCB Research FoundationAdding Science to Conservation
wwwwcbresearchin
- 001_Cover Page
- 002_Editorial Board_2
- 003_Table of Contents_Issue 2
- 004_Editorial and Directors Column
- 005_Chaudhary and Desai 1-3
- 006_Dave 4-11
- 007_Amin et al 12-17
- 008_Thakkar and Gohil 18-21
- 009_Marjadi 22-23
- 010_Patel and Patel 24-27
- 011_Pithva and Dharaiya 28-36
- 012_Panchal and Jha 37-43
- 013_Dhaaraiya 44-59
- 014_MI Patel Award Nominee 60-61
- 015_Announcements 62-63
- 016_Posters Competition Winners 64-65
- 017_ WCB Council and Board 66
- 018_Prithiviya_Guidelines Final
- 019_Last page
-
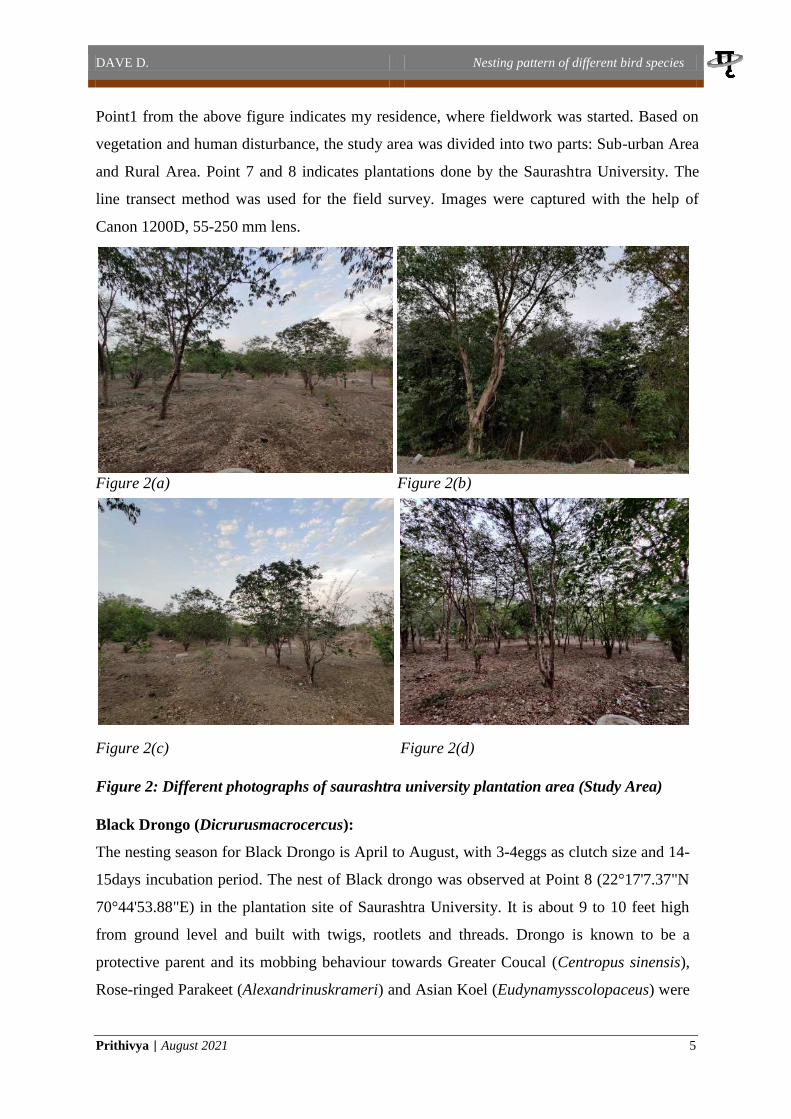
DAVE D Nesting pattern of different bird species
Prithivya | August 2021 8
Shikra (Accipiter badius)
The nesting season for Shikra is March to June Shikrarsquos nest was found at Point 8
(22deg171026N 70deg444403E) in the
plantation site of the Saurashtra
University The nest built with twigs
and rootlets at 20feet height from
ground level was observed on the
tallest tree The clutch size for the
Shikra is 3 to 4 eggs with 18-21days
incubation period Usually females
hatch the eggs but in rare cases males
hatch eggs as observed by
Suryawanshi (2021) During the
survey female Shikra was observed
chasing Large-grey Babbler (Argyamalcolmi)
Rufous Treepie (Dendrocittavagabunda)
The breeding season for Rufous Treepie is April to June and with clutch size 3-6eggs
At Point 8 of Saurashtra University plantation site (22deg17737N 70deg445388E) two to three
individuals of Rufous Treepie were seen
Figure 6 A photograph of Adult female Shikra
(Accipiter badius) and her nest
Figure 7 Adult Rufous treepie (Dendrocitta vagabunda) and her nest
DAVE D Nesting pattern of different bird species
Prithivya | August 2021 9
One of them was seen carrying food material while the other was collecting the nesting
materials A single nest of Rufous Treepie was observed and was built with twigs dead
leaves threads old clothing material rootlets and cotton The nest was found at a height of
approximately 20 feet On May 16th 2021 Rufous Treepie was seen feeding juvenile Koel
After a few days another Rufous Treepie was found hatching the eggs
Red-wattled Lapwing (Vanellus indicus)
Breeding season for Red-wattled Lapwing is April to June The egg or nest was not part of the
observation however a juvenile was observed at Point 3 of the Sub-urban area (22deg17238N
70deg444514E) A survey was conducted in May and the eggs might be laid during April The
clutch size is 3 to 4 with an incubation period of 28-30 days The nesting of this bird has no
protection strategies other than camouflaging the eggs with the surroundings to protect those
(Balkhande et al 2017)
Figure 8 (a) Juvenile Red-wattled Lapwing Figure 8 (b) Adult Red-wattled Lapwing
Figure 8 Photographic presentation of juvenile and adult Red-wattled Lapwing (Vanellus
indicus)
Cattle Egret (Bubulcus ibis)
The breeding season for Cattle Egret is June to August Between Point 5 and 6
(22deg165827N 70deg445231E) ten to twelve Cattle Egret nests were found and Egrets
were observed in their breeding plumage During their breeding season adults develop
orange buff plumage on the back breast and crown area Cattle Egrets from their nest in
DAVE D Nesting pattern of different bird species
Prithivya | August 2021 10
colonies Rootlets and twigs are used to build nests Clutch size for Cattle Egret is 2-4 and
the incubation period is between 22-28 days (Patankar et al 2007)
Fig 9 (a) Fig 9 (b)
Figure 9 Cattle egrets (Bubulcus ibis) and their colony
Acknowledgements
I would like to express my gratitude to DrJagruti Rathod for guiding and inspiring me
throughout my study I would also like to thank all the members of WCB Research
Foundation for organizing this internship program and giving me a chance to expand my
knowledge
References
Ali (2017) The Bookof Indian Birds Bombay Natural History Society ISBN 8173714851
Ali Hadjela amp Hassan Syed amp Rana Shahnaz amp Beg Mirza amp Mahmood-ul-Hassan
Muhammad (2007) Brood parasitism of Asian koel (Eudynamys scolopacea) on the
house crow (Corvus splendens) in Pothwar region of Pakistan Pakistan Journal of
Agricultural Sciences 44 627
Balkhande Dr Jayvardhan (2017) Study of Nesting pattern and breeding Biology of Red-
Wattled Lapwing Vanellus Indicus in agricultural field near to Asna River bridge
Nanded (Maharashtra) Research maGma An International Multidisciplinary Journal
ISSN NO- 2456-7078 VOL-1 ISSUE-6 AUG-2017
Grimmett et al (2011) Birds of Indian Subcontinent Helm field guides
ISBN 9781408127636
DAVE D Nesting pattern of different bird species
Prithivya | August 2021 11
Jahan I Begum S Feeroz M M Das D K amp Datta A K (2018) Nesting pattern of
birds in Jahangirnagar University Campus Bangladesh Journal of Threatened Taxa
10(5) 11618ndash11635 httpsdoiorg1011609jot279910511618-11635
Nijman V (2004) Seasonal variation in naturally occurring mobbing behaviour of drongos
(Dicruridae) towards two avian predators Ethology Ecology and Evolution 16(1)
25ndash32 httpsdoiorg1010800892701420049522651
Patankar Pratyush amp Desai Isha amp Shinde Kavita amp Balakrishnan Suresh (2007) Ecology
and breeding biology of the Cattle Egret Bubulcus ibis in an industrial area at
Vadodara Gujarat Zoos Print Journal 22 1011609JoTTZPJ15662885-8
Robertson H A (1990) Breeding of collared doves streptopelia decaocto in rural
oxfordshire england Bird Study 37(2) 73ndash83
httpsdoiorg10108000063659009477043
Sharma M amp Sharma R K (2015) Ecology and breeding biology of Indian stone curlew
(Burhinus indicus) Nature Environment and Pollution Technology 14(2) 423ndash426
Suryawanshi K 2021 Nesting behaviour and diet of Shikra Accipiter badius in Ajanta
Maharashtra Indian BIRDS 17 (2) XXndashXX
Trivedi V amp Vaghela S (2020) Avifauna of saurashtra university campus Rajkot Gujarat
India Journal of Threatened Taxa 12(13) 16764ndash16774
httpsdoiorg1011609jott5113121316764-16774
Suggested citation
Dave D (2021) Observations on nesting pattern of different bird species around university road
Rajkot Prithivya An Official Newsletter of WCB Research Foundation and WCB Research Lab
Vol 1(2) 4-11
AMIN ET AL Record of Leucism in Indian Flying Fox
Prithivya | August 2021 12
Record of Leucism in Indian Flying Fox Pteropus giganteus (Mammalia
Chiroptera Pteropodidae) from South Gujarat India
Amin Siddharth M1 Patel Hiren J2 and Vaghela Prashant P3
1 C129 Bhagyoday Society Opposite Sahyog Police chowki Gorwa Refinery Road
Vadodara - 390024(Gujarat) India 2Sardar Patel Zoological Park Kevadiya ndash 393151(Gujarat) India 3C-27 New Narmada Colony Chhani Jakatnaka Vadodara - 390024(Gujarat) India
E-mail hirenp9408gmailcom
Abstract
Leucism in fruit bat species Pteropus giganteus (Brunnich 1782) is recorded for the first
time from India based on photographic evidence collected from the Anaval Village located in
Surat District of South Gujarat India A total lack of pigmentation in the whole body due to
the failure of melanocytes to migrate to the skin and hair follicles resulting in white or
whitish hairs pale skin but normal coloured eyes are the sign of leucism The present record
can serve as baseline data and will also help understand colour aberration in bats
Key Words Colour aberration Chiropteran Pigmentation Mutation
Introduction
The Indian Flying Fox is one of the most common and widely distributed chiropterans found
in India Pakistan Sri Lanka Bhutan Nepal Bangladesh Maldives Myanmar and China
(Tsang 2020 Johnsingh amp Manjrekar 2013 Srinivasulu amp Srinivasulu 2012) Flying Fox is
the largest fruit bat known to occur on mainland India (Bates et al 1994) out of 13 Indian
fruit bat species (Bates amp Harrison 1997 Srinivasulu et al 2010) It has a reddish-brown
head with a darker sometimes
blackish snout pale brownish-
yellow shoulders and hindneck
yellowish-brown ventrally and
black wings (Prater 1971) It is
a colonial species and roosts
during the day often in the
midst of busy towns villages
on large trees along the
roadside near cropland and
water bodies (Bates et al 1994
Johnsingh amp Manjrekar 2013
Menon 2014) Their roosting
Figure 1 Leucistic individual roosting along with the
normal individuals
AMIN ET AL Record of Leucism in Indian Flying Fox
Prithivya | August 2021 13
colonies are generally found on large trees such as Ficus benghalensis F religiosa
Tamarindus indica Mangifera indica Dalbergia sissoo and Eucalyptus sp (Vendan 2003)
and the colony size can vary from hundreds to several thousands of individuals (Bastawade
amp Mahabal 1976) Although fruit bats are responsible for many ecological services (Saikia
2018) yet Indian Flying Fox is one of the most persecuted fruit bats in South Asia and is
listed as vermin under Schedule V of the Indian Wildlife (Protection) Act and IUCN Red List
Data included it as a Least Concern species (Tsang 2020)
In mammals a wide variety of colours and forms are found as a result of the presence of
certain pigments mostly melanin which provides colour to the skin hairs and eyes
(Nordlund et al 1998 Uieda 2000 Lucati amp Loacutepez Baucells 2016) Often this pigment is
affected as a result of mutations giving rise to diverse colour aberrations The effect of such
abnormal colouration is generally the pigmentation anomalies of chromatic disorders (Rook
et al 1998) Similar to other mammals bats are also vulnerable to genetic disorders that
affect pigmentation Globally such chromatic disorders are being reported at an increasing
rate in bats (Lucati amp Loacutepez Baucells 2016) and are caused by either an increase or a
decrease in the production of melanin in some regions or over the entire body (Hofreiter amp
Schoneberg 2010 Abreu et al 2013) These include albinism leucism piebaldism
hypomelanism and melanism (Lucati amp Loacutepez Baucells 2016) Among these conditions
leucism stands out as a rare phenomenon in nature
Leucism is a total lack of pigmentation in the whole body due to the failure of melanocytes to
migrate to the skin and hair follicles resulting in white or whitish hairs pale skin but
normal coloured eyes It occurs regardless of the normal production of the enzyme tyrosinase
and melanin Moreover it can be caused by one of the several mutations that will give rise to
apparently similar phenotypes (van Grouw 2006 2013 Abreu et al 2013 Lucati amp
Loacutepez‐ Baucells 2016) The occurrence of colour aberration in 55 Indian mammalian species
has been compiled by Mahabal et al (2019) Although cases of albinism and piebaldism have
been reported in the family Pteropodidae (Neal 1971 Karim 1983 Anonymous 2012
Anonymous 2013) however there is no report on colour aberration in Indian Flying Fox
(Pteropus giganteus) Here we report the first case of leucism in Indian Flying Fox from
Surat district of South Gujarat India
AMIN ET AL Record of Leucism in Indian Flying Fox
Prithivya | August 2021 14
Observations
On 18 June 2017 we were on the way to Vansda National Park and at 1230 h we stopped as
we saw a group of Indian Flying Fox roosting on Ficus religiosa near Anaval Village
(20838degN 73263degE) in Surat District Gujarat Suddenly all the fruit bats flew in the sky as
a local was hunting them with the help of a catapult maybe for eating purposes In the
middle of all these at 1249 h a white bat flying in the sky grabbed our attention as it flew
further to roost on one of the branches with other Indian Flying Fox We took some
photographs (Figure 1) and observed with the help of binoculars to note down its
characteristics Its whole body ie both fur and skin were white or whitish including
patagium and ears but it had normal black coloured eyes With the help of the classification
proposed by Lucati amp Loacutepez Baucells (2016) we identified it as a case of leucism and not
albinism
The roosting colony had around 250 individuals and was situated near a village pond among
human habitation on the roadside We observed the leucistic individual at least for an hour
and also alerted the locals to cease hunting of bats The leucistic individual was probably a
female and showed similar activity as that of normal individuals such as opening and closing
of wings folding the wings around belly and grooming
Discussion
Although physiological causes of colouration including melanism are evident (Caro 2005)
the genetic processes responsible for these colour variations remain unknown in most
mammals (Lucati amp Loacutepez Baucells 2016) Moreover chromatic disorders in bats can affect
both fur and skin including patagium ears and muzzle and their impact on the survival rate
is vague (Lucati amp Loacutepez Baucells 2016) However bats are most likely less vulnerable to
predation than the majority of diurnal animals as they are active at night and prefer dark
roosting sites (Buys et al 2002 Rocha et al 2013) Lucati amp Loacutepez Baucells (2016) states
that aberrant individuals roosting in sheltered places such as caves mines and buildings
may have greater survival rates than the one roosting in the open leaves Here we found the
leucistic Indian Flying Fox roosting in the open leaves and is likely to be vulnerable to
predation
Albinism is one of the most commonly occurring colour aberrations in bats (Lucati amp Loacutepez
Baucells 2016) In the family Pteropodidae albinism has been reported in Cynopterus sphinx
AMIN ET AL Record of Leucism in Indian Flying Fox
Prithivya | August 2021 15
from Nepal (Anonymous 2013) Lissonycteris angolensis from Uganda (Neal 1971) and
Rousettus leschenaultia from India (Karim 1983) while piebaldism is reported in Rousettus
amplexicaudatus from Philippines (Anonymous 2012) However another such colour
aberration leucism is not yet reported from the family Pteropodidae In this regard our report
of leucism in Pteropus giganteus can be the first of its kind in the entire range of its
distribution
Today bats in India face the harsh reality of declining habitats and resources ultimately
making them disappear altogether (Graham 2001 Tsang 2020) and the peoplersquos perception
regarding the presence of bats in their surroundings for different myths These facts raise an
urgent need to protect bats throughout the world by studying more about their behaviour and
ecology Further studies on Pteropus giganteus from Gujarat are mainly sighting reports
(Mahato et al 2012) and on roosting sites (Vyas amp Upadhyay 2014) Due to the lack of
information on colour aberration in the family Pteropodidae this report can add importance
to bat biologists
Acknowledgement
We are thankful to Dhaivat Patel and Vivek Patel for assisting us in fieldwork
References
Abreu M S L Machado R Barbieri F Freitas N S amp Oliveira L R 2013 Anomalous
colour in Neotropical mammals a review with new records for Didelphis sp
(Didelphidae Didelphimorphia) and Arctocephalus australis (Otariidae Carnivora)
Brazilian Journal of Biology 73 185ndash194
Anonymous 2012 Monfort Bat Sanctuary Blanca Bella Website
httpwwwmonfortbatsanctuaryorgblanca-bellac12m [Accessed 20 October
2019] Anonymous 2013 SMCRF (Small Mammals Conservation amp Research
Foundation) Website httpwwwsmcrforgindexphp [Accessed 20 October
2019]
Bastawade D B amp Mahabal A 1976 Some behavioural aspects of the Indian flying fox
Pteropus giganteus giganteus Bio-Vigyanam 2 209ndash212
Bates P J J amp Harrison D L 1997 Bats of the Indian Subcontinent Harrison Zoological
Museum Publication UK 258pp
Bates P J J Harrison D L amp Muni M 1994 The bats of western India Part 1 JBNHS
AMIN ET AL Record of Leucism in Indian Flying Fox
Prithivya | August 2021 16
91 (2) 1ndash15
Buys J Heijligers H amp Dorenbosch M 2002 First record of an albino long-eared bat
Plecotus auritus in The Netherlands Lutra 45 49ndash52
Caro T 2005 The adaptive significance of coloration in mammals BioScience55 125ndash136
Graham G L 2001 Bats of the World St Martinrsquos Press New York New York
160pp Hofreiter M amp Schoneberg T 2010
The genetic and evolutionary basis of colour variation in vertebrates Cellular and Molecular
Life Science 67 2591ndash2603
Johnsingh A J T amp Manjrekar N (eds) 2013 Mammals of South Asia Volume 2
Universities Press (India) Private Limited Telangana India pp 545ndash547
Karim K B 1983 A note on an albino Rousettus leschenaulti Bat Research News 24 39ndash
40
Lucati F amp Loacutepez Baucells A 2016 Chromatic disorders in bats a review of pigmentation
anomalies and the misuse of terms to describe them Mammal review 47(2) 112ndash123
Mahabal A Sharma R M Patil R N amp Jadhav S 2019 Colour aberration in Indian
mammals a review from 1886 to 2017 Journal of Threatened Taxa 11(6) 13690ndash
13719 Mahato A K R Kumar V V amp Patel N 2012 Indian flying fox in
Hamirsir Lake Bhuj city needs conservation attention Current Science 103(4)
354ndash355
Menon V 2014 Indian mammals a field guide Hachette India pp 386 Tsang SM
2020 Pteropus giganteus (errata version published in 2021) The IUCN Red List of
Threatened Species 2020 eT18725A194134899
httpsdxdoiorg102305IUCNUK2020-3RLTST18725A194134899en
Downloaded on 10 April 2021
Neal E 1971 Uganda Quest Collins London UK
Nordlund J J Boissy R E Hearing V J King R A Oetting W S amp Ortonne J P
(Eds) 1998 The pigmentary system physiology and pathophysiology Oxford
University Press New York
Prater S H 1971 The Book of Indian Animals (Revised) Bombay Natural History Society
Bombay pp 200ndash201
Rocha P A Feijo J A Donato C R amp Ferrari S F 2013 Leucism in Sebarsquos short-
tailed bat Carolliaperspicillata (Linnaeus 1758) from a rock shelter in northeastern
AMIN ET AL Record of Leucism in Indian Flying Fox
Prithivya | August 2021 17
Brazil Chiroptera Neotropical 19 1151ndash1153
Rook A Wilkinson D S Ebling F J B Champion R H amp Burton J L 1998
Textbook of Dermatology 6th edn Blackwell Science Boston Massachusetts USA
Saikia U 2018 A review of chiropterological studies and a distributional list of the
bat fauna of India Records of the Zoological Survey of India 118(3) 242ndash280
Srinivasulu C amp Srinivasulu B 2012 South Asian mammals their diversity distribution
and status Springer Science amp Business Media
Srinivasulu C Racey P A amp Mistry S 2010 A key to the bats (Mammalia Chiroptera)
of South Asia Journal of Threatened Taxa 2(7) 1001ndash1076
Uieda W 2000 A review of complete albinism in bats with five new cases from Brazil Acta
Chiropterologica 2 97ndash105
Van Grouw H 2006 Not every white bird is an albino sense and nonsense about colour
aberrations in birds Dutch Birding 28(2) 79ndash89
Van Grouw H 2013 What colour is that bird British birds 106 17ndash29
Vendan S E 2003 Roost and diet selection in the Indian Flying Fox Pteropus giganteus
(Mega chiroptera) MSc Thesis Madurai Kamaraj University India 85pp
Vyas R amp Upadhyay K 2014 Study of the Indian Flying Fox (Pteropus giganteus)
Colonies of Jambughoda Wildlife Sanctuary Gujarat India Record of the largest
roosting congregation at Targol Small Mammal Mail 6(1) 2ndash8
Suggested citation
Amin S Patel H and Vaghela P (2021) Record of Leucism in Indian Flying Fox Pteropus
giganteus (Mammalia Chiroptera Pteropodidae) from South Gujarat India Prithivya An
Official Newsletter of WCB Research Foundation and WCB Research Lab Vol 1(2) 12-17
THAKKAR amp GOHIL Birds behaviour during the Annular solar eclipse
Prithivya | August 2021 18
Notes on behavioural observation of some water birds during the Annular Solar
Eclipse
Thakkar Karan and Gohil Bharatsinh
Department of Life Sciences Maharaja Krishnakumarsinhji Bhavnagar University
Bhavnagar-364001 Gujarat India E-mail ksonpal07gmailcom
Abstract
In this communication we report the behaviour of various water birds observed during the annular
solar eclipse which happened on 26th November 2019 We observed the behaviour of eight species of
birdsrsquo viz Greater Flamingoes Phoenicopterus roseus the Indian Cormorant Phalacrocorax
fuscicollis Pied Avocet Recurvirostra avosetta Black-winged stilt Himantopus himantopus Eurasian
spoonbill Platalea leucorodia Northern shoveler Spatula clypeata Little grebe Tachybaptus
ruficollis and Dalmatian pelican Pelecanus crispus throughout the eclipse period ie from 805 AM
to 1051 AM Various behavioural chan`ges were observed in all the targeted species except the
Indian cormorant It rested on a pole for the whole eclipse period Detailed observations are given in
the note Reduction in light levels due to solar eclipse does affect the activity of birds
Key Words Solar Eclipse Behaviour Birds Bhavnagar
An annular solar eclipse was visible from 805 to 1051 AM on 26 December 2019 in India
Solar eclipse a rare and uncommon environmental event can influence and modulate the
behaviour of animals (Murdin 2001 Gil-burmann amp Beltrami 2003) Following observations
were made during the eclipse at airport Road Lake (21762837deg N 72183624deg E) in
Bhavnagar city using Nikon binoculars (1050)
Greater flamingos (n=24) on the day of the eclipse were seen foraging constantly from 805-
920 AM All of them started calling together from 921 to 935 AM After the peak of the
eclipse (ie after 921 AM) many flamingo individuals started preening Activities of Indian
cormorants varied throughout the eclipse period Pied avocets (n=13) were observed feeding
through the initial phase of the eclipse ie from 805 to 850 AM But pied avocets went onto
the resting phase from 851 to 935 AM Eight of them continued resting even after 935 AM
while the other five started feeding again Black-winged stilts (n=50) were seen resting in a
flock throughout the study period But as the eclipse increased flocks of black-winged stilts
from outside the lake started arriving and joined the original flock of 50 A group of five
black-winged stilts arrived at 852 followed by a flock of 20 at 906 AM Three other groups
of 30 50 and 10 black-winged stilts arrived from 921 to 935 AM Eurasian spoonbills
(n=30) were seen resting in water during the initial stage of eclipse ie from 808 to 920
AM From 921 to 935 AM five spoonbills started feeding 21 continued resting while 12
THAKKAR amp GOHIL Birds behaviour during the Annular solar eclipse
Prithivya | August 2021 19
started vocalizing and four flew away from the lake After 935 AM 12 individuals
continued calling 29 rested in water whereas eight individuals arrived from outside the lake
Activities of northern shoveler (n=80) varied throughout the eclipse Little cormorant (n=1)
rested on a pole for most of the observation It started feeding at 921 to 935 AM along with
one little cormorant which arrived from somewhere outside the lake After 935 both
perched at the wood in the lake Little grebe (n=1) spent most of the time feeding Between
935 and 950 AM it was joined by a flock of eight grebes that arrived from outside the lake
Pelicans (n=2) rested on a small patch of land in the lake throughout the study period
Table 1 Ethogram
Bird
Time intervals
0805-
0820
0821-
0835
0836-
0850
0851-
0905
0906-
0920
0921-
0935
0936-
0950
Greater
flamingo FD(n=24) FD(n=24) FD(n=24) FD(n=24) FD(n=24) C(n=24)
PR(n=4)
FD(n=17)C
(n=3)
Indian
Cormorant Rp(n=2) Rp(n=2)
Fi(n=2)
FD(n=4)
Rp(n=2)Fb
(n=2) Rp(n=1) Rp(n=1)Fb(n=1) _
Pied
Avocet FD(n=13) FD(n=13) FD(n=13) Rw(n=13) Rw(n=13) Rw(n=13)
FD(n=5)R
w(n=8)
Black
winged stilt Rw(n=50) Rw(n=50) Rw(n=50)
Rw(n=50)F
i(n=5)
Rw(n=55)
Fi(n=20)
Rw(n=75)
Fi(n=30)
Fi(n=50) Fi(n=10) Rw(n=165)
Eurasian
Spoonbill Rw(n=30) Rw(n=30)
Rw(n=30)
FD(n=4) Rw(n=34) Rw(n=34)
FD(n=5)C(n=12)
Fo(n=4)
Rw(n=21)
Fi(n=8)
C(n=13)
Rw(n=29)
Northern
Shoveler
PR(n=10)
Rl(n= 50)
Rw(n=20)
Rl(n= 50)
Rw(n=20)
PR(n=4)
Rw(n=50)
Rl(n=10)
Rw(n=54)
Rl(n=10)
FD(n=5)
Rw(n=54)
Rl(n=5)
Rw(n=54)
Rl(n=10)
Rw(n=54)
Rl(n=10)
Little
Cormorant Rp(n=1) Rp(n=1) Rp(n=1) Rp(n=1) Rp(n=1) FD(n=1) Fi(n=1) Rp(n=2)
Little grebe Rw(n=1) FD(n=1) FD(n=1) FD(n=1) FD(n=2) Fi(n=8)FD(n=10) FD(n=18)
Dalmatian
pelican Rl(n=2) Rl(n=2) Rl(n=2) Rl(n=2) Rl(n=2) Rl(n=2) Rl(n=2)
THAKKAR amp GOHIL Birds behaviour during the Annular solar eclipse
Prithivya | August 2021 20
Table 2 Different type of behaviours observed in bird species
BEHAVIOURS
FD Feeding
R Resting
Rp resting on an object prolonged perching on a pole or a stick in water
Rl resting on land simply sitting or standing with no noticeable movement
Rw resting in water no efforts for movement and neck resting on body(in case of ducks)
F Flight
Fb taking off from place A within a lake and settling at place B within a lake
Fa taking off from place A within a lake and settling at same place
Fo taking off from within lake and flying outside the lake
Fi arrived at lake from outside the lake
PR Preening
C Calling making some kind of voice could either be begging call roosting call or some other
B Bathing Rapid action of submerging in water and coming out
Kumar S (1981) observed the changes in the activity of cattle egrets because of the solar
eclipse Trigunayat (1997) observed that roosting Black-crowned Night-herons altered a
variety of behaviours including increased calling preening and perch shifting Nanikov et
al (2001) also mention behavioural changes in several birds due to solar eclipse A similar
trend was observed in this study as well From these limited field observations we can
conclude that reduced light level due to annular solar eclipse does interrupt normal bird
behaviour patterns
Acknowledgements
The first author is very thankful to Mr Dhavalkumar Vargiya for his kind support and
encouragement in the preparation for this article
References
Altmann J 1974Observational Study of Behavior Sampling MethodsBehaviour 49(34)
227-267 Retrieved on March 23 2020 from wwwjstororgstable4533591 bull Gil-
Burmann C Beltrami M 2003 Effect of the solar eclipse on the behavior of a
captive group of hamadryas baboons (Papio hamadryas) Zoo Biology 22 299ndash303
Kumar S 1981 Solar eclipse ndash notes on behavior of egrets J Bombay natural history
society78 3 133-136
Murdin P 2001 Effects of the 2001 total solar eclipse on African wildlife Astronomy
THAKKAR amp GOHIL Birds behaviour during the Annular solar eclipse
Prithivya | August 2021 21
Geophysics 42 40ndash42
Nankinov D Dalakthieva S Nikolov B Shurulinkov P Popov K Kirilov S Zareva
K Borisov B Stojanov G Nankinov N Minchev N Kjichukov D Nikolov I
Stanchev R Ganchev E 2001Studying the behaviour of birds during the solar
eclipse on August 11 1999 mdash Russian Ornithological Journal 142 355-369
Trigunayat M M 1997 Some behavioral observations on Night Heron Nycticorax
nycticorax (Linnaeus) during the total solar eclipse in Keoladeo National Park
Bharatpur IndiaPavo 3561ndash65
Tramer E J 2000 Bird Behavior During a Total Solar Eclipse The Wilson Bulletin 112(3)
431ndash432
Suggested citation
Thakkar K and Gohil B (2021) Notes on behavioural observation of some water birds during the
Annular Solar Eclipse Prithivya An Official Newsletter of WCB Research Foundation and WCB
Research Lab Vol 1(2) 18-21
MARJADI D Restoration of Earth with Biobased Polymer
Prithivya | August 2021 22
Restoration of Earth with Biobased Polymer
Marjadi Darshan
Shree Ramkrishna Institute of Computer Education amp Applied Sciences MTB Campus
Athwalines Surat-395001
E-mail darshanmarjadisrkiacin
Humanity is facing increasingly numerous challenges in life despite the great advancements
in science and technology over the last century All the needs of modern society eg food
fuel energy and materials are highly dependent on diminishing fossil resources The
demand for creating and using plastic throughout the world driven by the increasing usage of
plastic-based materials has been increasing and adding stress to the current waste
management infrastructures There is significant interest to decrease the reliance on
petroleum-based plastic products which causes global environmental pollution The
advancement in science and technology has enabled mankind to live longer and consume
more of the worlds resources More than eight million tons of plastic waste leak into oceans
every year which can be eased through innovative redesigns of packaging materials
Issues such as global climate change and depletion of fossil fuels both resulting from the
increased usage of energy have triggered alarms among scientists and politicians worldwide
Therefore governments industries and academia are inputting much effort towards finding a
sustainable solution for the increasing energy crisis However a similar concerted effort is
still lacking to bring about the creation and usage of sustainable materials in the modern
lifestyle In addition to the increasing demand for energy the usage of materials in the
modern lifestyle has also been increasing rapidly Considering the widespread usage of
plastics in food packaging clothes shelter communication transportation construction
health care and leisure industries plastics are the most dependable material among the other
materials that mankind is currently dependent upon Currently most of the plastics that are
widely used in various sectors are produced from petrochemical products The plastic
industry has been among the most profitable businesses and is expected to grow further
especially because of their increased demands from rapidly developing countries like India
and other parts of South-East Asia While plastics are superior materials in terms of their
production costs and diverse properties the sustainability of this synthetic material is
undoubtedly an issue that needs to be addressed Biobased and biodegradable polymeric
materials are considered amongst the most suitable alternatives for some applications The
MARJADI D Restoration of Earth with Biobased Polymer
Prithivya | August 2021 23
excessive usage of petroleum also contributes to the increased emission of CO2into the
atmosphere which is thought to be among the principal reasons for global warming and
climate change These are some of the strong and valid reasons leading towards the
development of technologies to produce biobased and biodegradable plastics
Science and technology have created the modern lifestyle that mankind is living in which
efficiency is the keyword Drawing an analogy from a bacterial culture in a shaken flask the
depletion of nutrients and the simultaneous accumulation of toxic wastes are the main
reasons for the onset of the stationary growth phase and the subsequent death phase
However unlike bacteria mankind is aware of the consequences of such activities As a
result the world population is now concerned about sustainable development
Biobased and biodegradable plastics most likely to remain less superior in terms of
production cost and material properties compared to petrochemical plastics Petroleum-based
plastics have serious environmental and social impacts due to their non-degradable nature
and the leaching of carcinogenic substances like dioxin when exposed to scratch or heat
Compared to the ease at which fossil resources are utilized renewable biobased materials
will need more effort and efficiency to be used in daily life However biobased materials are
considered superior in terms of sustainability and environmental friendly provided that they
are used judiciously and in a contented manner Hence it is in our hands to utilize our
knowledge of the environment to work towards the restoration of the earth and make it free
from single-use plastics
Suggested citation
Marjadi D (2021) Restoration of Earth with Biobased Polymer Prithivya An Official
Newsletter of WCB Research Foundation and WCB Research Lab Vol 1(2) 22-23
PATEL amp PATEL Single-use surgical mask
Prithivya | August 2021 24
Single-use surgical mask Human lifesaver or Biodiversity destroyer
Patel Jeel1 and Patel Rushika2 3
1GMERS Sola Civil Medical College Ahmedabad-380008 (Gujarat) India 2Assistant Professor Rai University Dholaka Ahmedabad-380008 (Gujarat) India 3Fellow Wildlife and Conservation Biology Research Foundation Pata-384265 (Gujarat)
India
E-mail rush2907gmailcom
The green lines represent sustainable and biodiversity conservation ways The dark brown
lines represent possible threats of single-use surgical mask to the biodiversity
Key Words Disposable mask Plastic and micro plastic pollution Conservation Threats
The COVID-19 is transmitted by respiratory droplets or aerosols and can survive in the air
for more than 24 hrs which was detected and momentarily created a pandemic situation
globally The only way to stop the transmission is to wear face mask washing hands
frequently and to maintain social distance Wearing a mask is declared as one of the
important precautionary measures by the World Health Organization (WHO) and
policymakers in every country because masks help in the significant reduction of infection
caused by touching the facemouthnose with contaminated hands (Schmutz et al 2020) The
virus COVID19has increased the demand for the surgical single-used mask in the healthcare
professionals as well as among the community Such masks are made up of polypropylene or
PATEL amp PATEL Single-use surgical mask
Prithivya | August 2021 25
high-density polyethylene (HDPE) a fossil-derived plastic which has a very high half-life
(Dharmaraj et al 2021)The mask production to the disposal statistics is presented in Table 1
Based on the reusability the mask is divided into two major groupsrsquo disposable (made up of
polymers) and reusable mask (made up of cloth material) in terms of production In present
study the details of only disposable mask is presented
Calculated based on the global entries of masks and gloves mentioned (200 millionmonth)
The average of one mask and single glove weight is 225plusmn001
Mask a threat to the ecosystem
In current situation recycling of any household medical waste is not a feasible and advisable
solution as there is a chance that it may be exposed to infectious particles There are no
particular laws or guidelines for separation and segregation which might involve several
issues Globally the dumping of masks was observed in areas such as roadside river oceans
and several open areas Usually such masks sustain in the environment for a longer period of
time (more than 400 years)(Hasan et al 2021) The misconception of masks to various birds
animals and marine creatures considering as a food and leads to trapping and entangling in
the strips of masks The single-use surgical mask not only adds litter to the environment but
No Statistics Reference
1 Estimated worldwide usage of disposable mask 129
billionmonth
Prata et al 2020
2 Production in China as on Feb 2020 116 millionday Adyel 2020
3 Order of mask in Japan as of April 2020 over 600
millionmonth
Fadare and Okoffo
2020
4 Mask disposal in the UK 53 millionday Website URL 1
5 Gloves and mask entered into the environment 200
millionmonth
Website URL 2
6 Mask reached to oceans 15 billion
Marine plastic pollution increased in last year 6200 tonnes
Website URL 3
7 Mask waste generation in India Minimum 928week
Maximum 4640week
Selvaranjan et al 2021
8 Plastic footprint in the environment due to mask and gloves
45times105 KgMonth
Present Study
Table 1 Global mask production usage and disposable statistics
PATEL amp PATEL Single-use surgical mask
Prithivya | August 2021 26
also hurting and killing a wide range of terrestrial and marine living organisms Moreover
the production process of such masks also releases greenhouse gases (Prata et al 2021) The
disposal of mask also reported as a novel source of micro plastic pollution in the environment
and entry point of the food chain (Hasan et al 2021) The single-use surgical masks are also
noted as a major causative agent of secondary disease outbreaks in all life forms including
humans (Fadare and Okoffo 2020) India does not have any sufficient resources for the
household medical waste management (Prata et al 2021) Every minute 10 kg of disposed
masks and gloves entered into the environment (Table 1)Hence it is very important to deal
with the mentioned issues and look into more sustainable sources at individual level
Herewith we suggest some measures by which we can protect the environment without
compromising human health in current pandemic situation
Snip the strips of the masks before the disposal to avoid the entangling and entrapping
issues
Dispose masks as a separate medical waste and submit it to plastic recycling
companies
Moving towards the development of biopolymer mask (Torres and Torre 2021)
Biopolymer mask were made up of gluten and nanofibers having 95 efficiency
A reusable mask could be applied in routine life for the general community Regular
cloth masks having multi-layer of high thread-count and textiles are moderately
effective and reported to block 50-70 fine droplets and particles Reusable masks
help in the reduction of waste production (85 ) Moreover economically viable
option in a country like India as it is 37 times cheaper than other masks (Prata et al
2021)
References
Adyel T M 2020 Accumulation of plastic waste during COVID-19 Science 396(6509)
1314ndash1315 httpsdoiorg101056nejmms2004740
Dharmaraj S Ashokkumar V Hariharan S Manibharathi A Show P L Chong C T
ampNgamcharussrivichai C 2021 The COVID-19 pandemic face mask waste A
blooming threat to the marine environment Chemosphere Elsevier Ltd
httpsdoiorg101016jchemosphere2021129601
Fadare O O ampOkoffo E D 2020 Covid-19 face masks A potential source of
microplastic fibers in the environment Science of The Total Environment 737
140279 httpsdoiorg101016jscitotenv2020140279
PATEL amp PATEL Single-use surgical mask
Prithivya | August 2021 27
Hasan N A Heal R D Bashar A amp Haque M M 2021 Face masks protecting the
wearer but neglecting the aquatic environment - A perspective from Bangladesh
Environmental Challenges 4 100126 httpsdoiorg101016jenvc2021100126
Prata J C Silva A L P Duarte A C amp Rocha-Santos T 2021 Disposable over
Reusable Face Masks Public Safety or Environmental Disaster Environments 8(4)
31 httpsdoiorg103390environments8040031
Schmutz M Hischier R Batt T Wick P Nowack B Waumlger P ampSom C 2020
Cotton and surgical masksmdashwhat ecological factors are relevant for their
sustainability Sustainability (Switzerland) 12(24) 1ndash13
httpsdoiorg103390su122410245
Selvaranjan K Navaratnam S Rajeev P ampRavintherakumaran N 2021 Environmental
challenges induced by extensive use of face masks during COVID-19 A review and
potential solutions Environmental Challenges 3 100039
httpsdoiorg101016jenvc2021100039
Torres F G amp De-la-Torre G E 2021 Face mask waste generation and management
during the COVID-19 pandemic An overview and the Peruvian case Science of the
Total Environment 786 147628 httpsdoiorg101016jscitotenv2021147628
Website URL 1 httpswwwgreenpeaceorguknewssingle-use-face-masks-hurting-
wildlife-what-you-can-do [Accessed on 23rd June 2021]
Website URL 2 httpswwwgreenmatterscompface-masks-wildlife [Accessed on 23rd June
2021]
Website URL 3 httpseconomictimesindiatimescomnewsenvironmentecosystem-under-
threat-as-birds-and-marine-life-ensnared-in-discarded-face-maskswidespread-
contaminationslideshow80230026cms [Accessed on 23rd June 2021]
Suggested citation
Patel J and Patel R (2021) Single-use surgical mask Human lifesaver or Biodiversity destroyer
Prithivya An Official Newsletter of WCB Research Foundation and WCB Research Lab Vol 1 (2)
24-27
PITHVA amp DHARAIYA Perception of forest staff about wildlife
Prithivya | August 2021 28
Does the contemplation of forest field staff about wildlife differ than a common man
Pithva Krishna1 2 and Dharaiya Nishith1
1 Wildlife and Conservation Biology Research Lab Hemchandracharya North Gujarat
University Patan (Gujarat) India 2Institute of Environment Education and Research Bharati Vidyapeeth Deemed University
Pune India
E-mail krishnapithva17gmailcom
Introduction
A field-based training was organized by Vadodara wildlife division Gujarat forest
department and WCB Research Lab of Hemchandracharya North Gujarat University from
September 17th to 19th 2020 with the aim to enhance the capacity of forest field staff for
monitoring and rescue of sloth bear and associated fauna The training was organized at
Jambughoda wildlife sanctuary Central Gujarat Along with the awareness about sloth bear
a small survey was carried out to understand how the field staff envisages the wildlife that is
found in their work place Total 18 frontline forest staff of different cadre such as beat guards
and round foresters from different forest ranges of central Gujarat has participated in this
survey
This study provides an insight on how
forest staffrsquos perception differs in different
animals As Q method provides qualitative
and quantitative data which helps
identifying peoplersquos perception in detail As
participants have to provide justification of
their answers it reveals some underlying
conflicts or reasons These justifications of
participants can help identify the gaps and
can be better used for conservation planning
as well as capacity building of forest field
staff
Figure 1 Forest frontline staff organizing
photos on Q Board copy Nishith Dharaiya
PITHVA amp DHARAIYA Perception of forest staff about wildlife
Prithivya | August 2021 29
Methodology
We used Q methodology for this study this method is designed and developed by William
Stephenson in 1930s (McKeown amp Thomas 1988)and allows to disclose underlying reasons
This method is widely used in social sciences studies In this method photos were used
instead of statements to know respondentrsquos perception allowing them to justify their answer
in detail without any restriction This method allows both qualitative and quantitative data on
perception of the person being interviewed
We categorised the Q Method into two parts first organising 16 photos of locally found
animals on a Q-board (figure 1(b)) followed by explanation for each photo which are placed
on Q-board by the respondent As shown in the figure 1(a) the participants were asked to
organise photos in Q- board as per their liking and disliking towards the animals and to
provide reasons which were recorded in mobile phone devise A list of all the wildlife photos
used for this survey is provided in table 1
-3 -2 -1 0 +1 +2 +3
Negative Positive Neutral
Figure 1(a) Representative sort of organized Q-
board by a participant
Figure 1(b) A Q-board on which the
respondents organize the photos
PITHVA amp DHARAIYA Perception of forest staff about wildlife
Prithivya | August 2021 30
Photo
ID
Common name Scientific name
1 Wild boar Sus scrofa
2 Hanuman langur Semnopithecus entellus
3 Indian cobra Najanaja
4 Indian giant flying squirrel Petauristaphilippensis
5 Small Indian civet Viverricula indica
6 Sloth bear Melursus ursinus
7 Indian hare Lepus nigricollis
8 Indian python Python molursus
9 Barn owl Tyto alba
10 Grey francolin Francolinuspondicerianus
11 Red-wattled lapwing Vanellus indicus
12 Rhesus macaque Macaca mulatta
13 Black kite Milvus migrans
14 Common krait Bungarus caeruleus
15 Indian crested porcupine Hystrix indica
16 Blue bull Boselaphustragocamelus
Q sort analysis
In this study three factors were derived based on participantrsquosjustification which is explained
in detail in the result section A factor in this study is a category representingthe group of
people who have similar perspective(Brown 1980) The higher the factor loading the more
highly that sorts are correlated with that factor (Ramlo 2008 Ramlo amp Newman 2011)The
sorts refer to the photos assembled by participants on Q-board (figure 1(b))In order to
analyse the data a software PQMethod(httpschmolckorgqmethod)was used which is
specially designed for Q-analysis Q sorts are the number of participants that took part in the
survey All the data were entered manually in this software and correlation was calculated
among each sort The correlation matrix for the extracted factor was analysed through a
principal component factor analysis with varimax rotationfor which options are provided in
the software (figure 2)
Table 1 Photos of wildlife used for this study
PITHVA amp DHARAIYA Perception of forest staff about wildlife
Prithivya | August 2021 31
Results and Discussion
The three factors that emerged
are shown in Table 2 with
automatic pre-flagging
Participants having similar
perceptions are put together in
their respective factors and
marked in bold and have ldquoXrdquo
next to their score Out of 18
sorts 17 sorts were found
complete by the software and
were further analysed Each of
three factors represents a different perspective towards the photos provided to them
Participants were named as PART001 PART002 and so on to keep their identity unrevealed
In table 2 there are 8 participants belonging to factor 1 with 29 of the variance explained
followed by 7 participants in factor 2 having 26 explained variance and 2 participants
belonging to factor 3 with 14 explained varianceOnce factor score calculated by the
software distinguishing tables were developed in this analysis for each factor which differ
from each other that is explained further in this section The distinguishing tables for each
factor explains differences between factors(Brown 1971 Ramlo amp Newman 2011 Brown
1993)In order to determine distinguishing statements average Z-score of respondentrsquos factor
score was calculated by the software
Figure 2 Screenshot of analytical option available in PQM
method Software
PITHVA amp DHARAIYA Perception of forest staff about wildlife
Prithivya | August 2021 32
Table 2 Extracted factor score from Q-sorts
Q-Sorts ID Factor 1 Factor 2 Factor 3
1 PART001 08530X 01248 -01223
2 PART002 00414 08084X 01708
3 PART003 06945X 00471 03983
4 PART004 07683X 01839 -00156
5 PART005 05450X 00166 02332
6 PART006 04208 07241X 04006
7 PART007 01728 01377 09013X
8 PART008 06930X 05214 03237
9 PART009 06516X 04289 04265
10 PART010 05119 06142X 00921
11 PART011 08475X -00072 -02626
12 PART012 03742 -05333 04456
13 PART013 00481 08292X 03240
14 PART014 -00002 06395X -03574
15 PART015 06577X 02179 01940
16 PART016 -00614 01991 06372X
17 PART017 04469 07611X 01835
18 PART018 05679 07564X 01465
Explained variance 29 26 14
Note number in bold shows respondents belong to those respective factors
Table 3 shows different factor score for each animal photo and depending on statistical
significance the photo load to a specific factor The above table contains 16 photos and their
grid position for all three factors (perception table 2) For example Indian python was
disliked by participants therefore it is scored at -2 for respondents grouped under factor 1 +1
for factor 2 andfor factor 3 it was scored at +2 For factor 1 the most liked species by
participants is Indian hare and most disliked species is wild boar Most liked species for
factor 2 is Indian leopard and most disliked animal is fruit bat For factor 3 most liked
species is Indian hare scored at +3 and most disliked species is wild boar scored at -3 by the
participants
PITHVA amp DHARAIYA Perception of forest staff about wildlife
Prithivya | August 2021 33
Table 3 Aggregate factor values of each 16 photos
Aggregate values
No Photos Factor 1 Factor 2 Factor 3
1 Indian python -2 1 2
2 Hanuman langur 0 0 2
3 Monitor lizard -1 -2 -1
4 Red-wattled lapwing 1 -1 1
5 Sloth bear 2 2 0
6 Indian hare 3 1 3
7 Leopard 2 3 0
8 Grey francolin 1 -1 -1
9 Indian giant flying squirrel 1 1 -2
10 Blue bull 0 0 0
11 Small Indian civet 0 0 -1
12 Fruit bat (Flying fox) -1 -3 -2
13 Indian cobra -2 2 1
14 Barn owl 0 0 0
15 Indian chameleon -1 -1 0
16 Wild boar -3 -2 -3
Factor 1 Economic impact
This factor was described by 8 participants mainly concerning economic impact Animals
that cause harm economically by destroying crops and threat to human life and livestock
Participants of factor 1 thinks fruit bat Indian python and Indian cobra causes high level of
economic harm Grey francolin is scored +1 due to its contribution to reduce impact by eating
pest insects from agricultural field Though the most disliked animal is wild boar for factor 1
as shown in table 3
PITHVA amp DHARAIYA Perception of forest staff about wildlife
Prithivya | August 2021 34
Table 4 Distinguishing photos for factor 1
Factor 2 Aesthetic spiritual values and conservation aspects
This factor explains aesthetic spiritual values and conservation aspects which includes
appearance tourist attraction rehabilitation and religious belief There are 7 responses in this
factor (table 2) Respondents are observed to have negative opinions towards animals which
play major role in economic loss but positive towards animalrsquos beauty and its natural
charisma Table 5 shows how score of animals for factor 2 is different from the score of
factor 1 and factor 3 For example Indian cobra is scored at +2 in factor 2 as it is attractive to
participants but it is scored -2 for factor 1 as it threatens human life
Table5 Distinguishing photos for factor 2
Photo
ID Photos
Grid
position
for
Factor 1
Z-score
of
Factor 1
Grid
position
for
Factor 2
Z-score
of
Factor 2
Grid
position
for
Factor 3
Z-score
of
Factor 3
13 Indian cobra -2 -119 2 127 1 037
6 Indian hare 3 148 1 067 3 189
1 Indian python -2 -103 1 034 2 122
4 Red-wattled
lapwing 1 014 -1 -065 1 079
16 Wild boar -3 -189 -2 -125 -3 -201
Photo
ID Photos
Grid
position
for
Factor
1
Z-score
of
Factor
1
Grid
position
for
Factor
2
Z-score
of
Factor
2
Grid
position
for
Factor
3
Z-score
of
Factor 3
8 Grey francolin 1 095 -1 -046 -1 -067
12 Fruit bat (Flying -1 -02 -3 -182 -2 -11
1 Indian python -2 -103 1 034 2 122
13 Indian cobra -2 -119 2 127 1 037
PITHVA amp DHARAIYA Perception of forest staff about wildlife
Prithivya | August 2021 35
Factor 3 Lack of awareness
This factor describes lack of awareness which includes lack of interest compared to other
animals and species This factor mainly concerns individuals who lacks knowledge proper
information and are not aware about the species For example in table 6 the score of Indian
giant flying squirrel differs from factor 3 to factor 1 and 2 as it is scored at -2 +1 and +1
respectively The justification for negative score given by the participants is that they are not
aware about the presence of the species therefore they do not have any information on the
species
Table 6 Distinguishing photos for factor 3
Photo
ID Photos
Grid
position
for
Factor 1
Z-score
of
Factor
1
Grid
position
for
Factor 2
Z-score
of
Factor
2
Grid
position
for
Factor 3
Z-score
of
Factor 3
1 Indian python -2 -103 1 034 2 122
2 Hanuman langur 0 -02 0 -045 2 110
13 Indian cobra -2 -119 2 127 1 037
5 Sloth bear 2 138 2 135 0 -000
7 Leopard 2 133 3 181 0 -000
9 Indian giant flying
squirrel 1 096 1 062 -2 -122
Conclusion
The perception of forest field staff was better understood using Q method analysis
considering various aspects It is seen that participants tend to like animals such as Indian
leopard sloth bear Hanuman langur and Indian hare as they are scored positive or neutral
The animals that are not given negative score in any factor due to their appearance are seen
frequently and does not lack awareness It is observed from the data that frontline forest staff
lacks knowledge about animals that are not seen or present in their forest rangebeat As
frontline forest staff they should be aware about existence of animal species that are found in
Gujarat state along with their ecological importance threats and conservation values Some
participants were not even aware about the existence of the species in the wild such as Indian
giant flying squirrel Although being frontline forest staff their perception is biased towards
animals such as wild boar monitor lizard and flying fox bat due to the economic loss they
PITHVA amp DHARAIYA Perception of forest staff about wildlife
Prithivya | August 2021 36
may cause and weird appearance Their perception becomes the same as a common man
when every animal should be equal to frontline forest staff as it is their job to protect forest
and its animals Some participants believe in superstitions of bad luck of barn owl and
monitor lizard which shows their common man perception and lack of right information
Recommendations
A separate training or workshops should be organised by forest department focused on
animal species found in Gujarat This will help them enhancing their existing knowledge and
it will provide them with some scientific insights Having basic scientific knowledge will
help remove some barriers like superstitions and other beliefs Field trips should be organised
in different part of state to gain practical experience Team building activities should be
conducted between staff of different forest divisions
Acknowledgements
We are thankful to all the forest field staff who participated in this survey We also thank to
the Deputy Conservator of Forests Vadodara Wildlife Division of Gujarat Forest Department
and sincerely acknowledge the help from our research team members
References
Brown S R (1980) Political subjectivity applications of Q methodology inpolitical science
E Ramlo S and Newman I (2011) Q Methodology and Its Position in the Mixed-Methods
Continuum Operant Subjectivity 34(3) 172ndash191
McKeown B and Thomas D B (1988) Q Methodology SAGE Publications
R Brown S (1993) A Primer on Q Methodology Operant Subjectivity 16(34) 91ndash138
Ramlo S E (2008) Determining the various perspectives and consensus within a classroom
using Q methodology AIP Conference Proceedings 1064 179ndash182
httpsdoiorg10106313021248
Suggested citation
Pithva K and Dharaiya N (2021) Does the contemplation of forest field staff about wildlife differ
than a common man Prithivya An Official Newsletter of WCB Research Foundation and WCB
Research Lab Vol 1(2) 28-36
PANCHAL amp JHA Qualitative phytochemical analysis
Prithivya | August 2021 37
Qualitative phytochemical analysis of some medicinal plants (leaves) from the
surrounding area of Talod Taluka North Gujarat India
Panchal Mital and Jha Charumati
Department of Botany Smt Panchal Science college Talod ndash383215 North Gujarat India
E-mail mitalpanchal0gmailcom
Abstract
The tremendous biological variety of North-Eastern India has long been recognised Five medicinal
plants were chosen for this study Manilkara zapota (L) van Royen Manilkara hexandra (Roxb)
Dub Mangifera indica L Madhuca indica JF Gmel and Annona squamosa L The purpose of this
study was to look into the existence of Phytochemicals such as Alkaloid Amino acid Carbohydrate
Protein Glycoside Tannin Terpenoid Saponin Flavonoid and Steroids in the medicinal plants that
were chosen For the organic solvent extraction the Soxhlet apparatus was utilized Water acetone
and chloroform were utilised as solvents Our findings show that the examined plants crude aqueous
and organic solvent extracts contain medicinally relevant bioactive components justifying their usage
in traditional medicines for the treatment of various ailments
Key Words Qualitative phytochemical analysis Manikara zapota M hexandra Madhuka
indica Mangifera indica Annona squamosa
Introduction
Phytochemicals are non-nutritive substances Chemical compounds are produced naturally on
plants during metabolic processes and contain a wide range of proactive and disease-
preventive qualities These compounds are known to be produced by plants in order to defend
themselves Recent study has shown that they can also play a vital role in illness prevention
in humans Even some of these herbs have been used for millennia as traditional medicine
Most phytochemicals such as flavonoids carotenoids and polyphenols have antibacterial
action and can be used to treat infections The following plant species were studied
Manilkara zapota (L) van Royen M hexandra (Roxb) Dub Mangifera indica L Madhuca
indica JF Gmel and Annona squamosa L
Plants play a universal function in the treatment of sickness as seen by their use in every
major system of medicine regardless of philosophical foundation Plants are vital to the
pharmaceutical industry because they are a rich supply of pharmaceuticals and a vast
reservoir of chemical variety for drug development screening procedures The majority of the
medications mentioned in the Indian medicinal system are derived from plants
PANCHAL amp JHA Qualitative phytochemical analysis
Prithivya | August 2021 38
Medicinal plants have been used to treat disease all across the world for thousands of years It
is generally understood that some plants with active chemicals can limit microbial
development Plants ability to generate chemicals via secondary metabolism determines their
antimicrobial potency Secondary metabolites emerged as the most important class of
chemicals with a wide spectrum of antibacterial and antifungal properties When compared
to conventional fungicides used to inhibit microbial growth and survival these plant
chemicals have different structures and activities
Plants are a major source of Traditional medicine and can be used to cure a variety of
conditions with little adverse effects Traditional medical practises are not only beneficial in
the treatment of diseases but they also aid in the discovery of pharmaceutically active
compounds in plants which can aid in the commercial manufacture of pharmaceuticals From
ancient times the importance of plant diversification in health care has been extensively
recognised According to a literature review more than 50000 plant species have been
successfully employed for medical purposes globally with flowering plants accounting for
over 13 of these
Material and methods Plant collection and Identification
M zapota (L) van Royen M hexandra (Roxb) Dub M indica L M indica JF Gmel
and A squamosa L were among the plant species studied The plants were harvested from
the land in the Talod taluka in North Gujarat India The washed plant leaves were kept in for
drying after being cleaned with tap water around 2-3 times to evaporate the water content
With the use of a mechanical blender the sample was ground into a fine powder after drying
The powder is then kept in an airtight plastic container for future usage with adequate
labelling
Extraction technique
Extraction is the separation of inert plant tissue constituents from medicinally active plant
tissue constituents using a conventional extraction process Menstrum is a selective solvent
that is used to eliminate inert material and to obtain the curative part of the procedure through
therapy
PANCHAL amp JHA Qualitative phytochemical analysis
Prithivya | August 2021 39
Method and Plant extraction
Solvent extraction
The crude plant extract was made using the Soxhlet extraction method 10 gm of powdered
plant material was placed into a thimble and 300 ml of solvents were extracted separately
Acetone and chloroform were utilized as solvents In a syphon tube of an extractor the
extraction process continued for 24 hours until the solvent became colourless The extract
was then placed in a beaker The extract was then retained and cooked on a hot plate at 30- 40
degC until all of the solvent had evaporated The dried extract was stored at 4degC in a refrigerator
for future phytochemical investigation
Methods of phytochemical analysis
Alkaloid
Wagnerrsquos test A few drops of Wagners reagent were applied to 2mg of extract that had
been acidified with 15 percent vv hydrochloric acid The presence of alkaloids is indicated
by a yellow or brown ppt
Carbohydrates
Molischrsquos test 2mg of ethanolic extract was mixed with 10ml water filtered and
concentrated 2ml of conc sulphuric acid was added to these 2 drops of freshly prepared 20
alcoholic alpha-naphthol solution forming a layer below the mixture red-violet ring showing
the existence of carbohydrates that disappears when sufficient alkali is added
Amino acid
Ninhydrin test Boil for a few minutes 2ml Ninhydrin reagent + 2ml extract The production
of blue colour indicates the presence of amino acids
Steroids
Salkowski reaction 2mg of dry extract was combined with chloroform to the chloroform
layer sulphuric acid was gently introduced by the sides of the test tube The emergence of a
red colour indicated the presence of steroids
Tannin A few drops of a 5 percent wv Fecl3 solution were added to 1-2 ml of the ethanolic
extract Gallo tannins are shown by a green colour whereas pseudo tannins are indicated by a
brown colour
Flavonoids After mixing 2ml of each extract with a few drops of 20 sodium hydroxide a
bright yellow colour was seen A few drops of 70 dilute hydrochloric acid were added to
PANCHAL amp JHA Qualitative phytochemical analysis
Prithivya | August 2021 40
this and the yellow coloration disappeared The presence of flavonoids in the sample extract
is shown by the formation and disappearance of yellow colour
Saponins 6ml distilled water was added to 2 ml of each extract and rapidly shaken the
presence of saponin is indicated by the production of bubbles or persistent foam
Proteins adding 1 ml of 40 percent sodium hydroxide and a few drops of 1 percent copper
sulphate to 2ml of each extract The production of violet colour shows the presence of peptide
linkage molecules in the sample extract
Glycosides 05ml of glacial acetic acid and 3 drops of 1 aqueous ferric chloride solution
added in to 1ml of each extract The creation of a brown ring at the interface shows the
presence of glycosides in the sample extract
Terpenoids 1ml of each solvent is mixed with 05ml chloroform and a few drops of strong
sulphuric acid to produce a reddish-brown precipitate that confirms the presence of Terpenoid
in the extract
Table 1 Preliminary Phytochemical analysis
Class of
compounds
Manilkara
zapota
Manilkara
hexandra
Mangifera
indica
Madhuka
indica
Annona
squamosa AE CE WE AE CE WE AE CE WE AE CE WE AE CE WE
Alkaloid + + - + - - + + - + - - + - -
Amino acid - - - - - - - - - - - - - - -
Carbohydr
ate
+ + - + - + + - - - - - - - -
Protein - - + + - + + - + - - - - - +
Glycoside + - - + - + - - - - - + - - -
Tannin - - + - - - + + + + - + + + +
Terpenoid - + - - - - - - - - - + - - -
Saponin - + + + - + + - + + - + + - -
Flavonoid - + + - - + - - + - - + + - -
Steroid + - + - - + - - + - - - - - -
Where lsquo+rsquo = positive and lsquo-rsquo = negative
AE= Acetone extract CE= Chloroform extract WE= Water extract
Alkaloid carbohydrate glycoside and steroid are all found in Acetone extract of M zapota
leaves Chloroform extract of M zapota leaves contains alkaloid carbohydrate terpenoid
PANCHAL amp JHA Qualitative phytochemical analysis
Prithivya | August 2021 41
saponin and flavonoid Protein Tannin Saponin Flavonoid and Steroid can be found in the
aqueous extract of M zapota leaves alkaloid carbohydrate protein glycoside and saponin
are all found in Acetone extract of M hexandra leaves All phytochemicals are missing in the
chloroform extract of M hexandra leaves Aqueous extract of M hexandra leaves contains
carbohydrate protein glycoside saponin flavonoid and steroid Alkaloid Carbohydrate
Protein Tannin and Saponin are all found in Acetone extract of M indica leaves Alkaloid
and Tannin are found in Chloroform extract of M indica leaves Protein Tannin Saponin
Flavonoid and Steroid are found in aqueous extract of M indica leaves Alkaloid and
Tannin are found in Acetone extract of M indica leaves Chloroform extract of M indica
leaves is devoid of all phytochemicals Aqueous extract of M indica leaves contains
Glycoside Tannin Terpenoid Saponin and Flavonoid Alkaloid Tannin Saponin and
Flavonoid are all found in Acetone extract of A squamosa leaves Aqueous extract of A
squamosa leaves contains protein and tannin
Discussion
Plant samples were subjected to phytochemical analysis which confirmed the existence of
elements with medicinal and physiological properties Phytochemicals such as carbohydrate
amino acid protein tannin flavonoid saponin glycoside steroid terpenoid and alkaloids
were found in the plant extracts
Tannins attach to proline-rich proteins preventing them from being synthesized Flavonoids
are hydroxylated phenolic compounds that plants produce in response to microbial infection
and have been discovered to have antibacterial properties in vitro against a wide range of
pathogens Their capacity to combine with extracellular and soluble proteins as well as the
bacterial cell wall is most likely the reason for their activity They are also powerful
antioxidants with anticancer properties
Saponins which are known to have an anti-inflammatory impact were also discovered in the
plant extracts Saponins have the ability to coagulate and precipitate red blood cells Saponins
are known for their ability to produce foams in aqueous solutions as well as their hemolytic
activity cholesterol binding capabilities and bitterness Steroids have been shown to have
antimicrobial characteristics and they are extremely essential molecules particularly in
regard to sex hormones For millennia alkaloids have been associated with medical purposes
and cytotoxicity is one of their most prevalent biological features Alkaloids have been shown
PANCHAL amp JHA Qualitative phytochemical analysis
Prithivya | August 2021 42
to have analgesic antispasmodic and antibacterial effects by several researchers Glycosides
have been shown to reduce blood pressure in numerous studies The findings of this study
indicate that the detected phytochemical substances may be bioactive constituents and that
these plants are proving to be a valuable reservoir of bioactive compounds with significant
medical value
Conclusion
The findings demonstrated that the plants investigated contained medicinally essential
components Many previous investigations had accumulated evidence that the discovered
phytochemical was bioactive Several studies have demonstrated that these phytochemicals
contribute pharmacological and physiological qualities to the plants researched in the
treatment of various illnesses As a result extracts from these plants could be considered a
valuable source of drugs Further research should be carried out to separate purify and
characterize the active ingredients responsible for the activity of these plants as well as
further work to isolate purify and characterize the active constituents responsible for the
action of these Plants In addition more research into the putative mechanisms of action of
these extracts is urged
Acknowledgement
Authors are thankful to Disha life sciences Pvt Ltd for practical work during this study
References
Ashwin Godghate Rajaram Sawant Ashok Sutar (2012) Phytochemical Analysis of
Ethanolic extract of Roots of Carrisa carandus Linn RasayanJChem 5(4)456-
459
K Girija P Udaya Chandrika K Lakshman N Pruthvi (2010) Evaluation of Antimicrobial
activity of various Bark extracts of Bombax malabaricum IntJResPharmSci
1(2)199-204
Khalid S Shahzad A Bashrat N Abubakar M Anwar P (2018) Phytochemical screening and
Analysis of selected Medicinal Plants in Gujarat J Phytochemistry Biochem 2108
Kodangala C Saha S Kodangala P (2010) Phytochemical studies of Aerial parts of the Plant
Leucas lavandulaefolia Der Pharma Chemica 2(5)434-437
PANCHAL amp JHA Qualitative phytochemical analysis
Prithivya | August 2021 43
Manash PS et al (2016) Phytochemical Analysis of Traditional Medicinal Plants and their
Antimicrobial activity An Experience from North East India J Pharm Res
1(1)000104
Prabhavathi R M Prasad M P and Jayaramu M (2016) Studies on Qualitative and
Quantitative Phytochemical Analysis of Cissus quadrangularis Advances in Applied
Science Research 7(4)11-17
Pushpendra K Patel Narendra K Prajapati and BK Dubey (2012) Madhuka indica A
Review of its Medicinal property IJPSR 3(5) 942-950
RNS Yadav and Munia Agrawala (2011) Phytochemical analysis of some medicinal plants
Journal of Phytology 3(1)10-14
S Hemadri Reddy Aisha Khalid AL-Hinai Hajer Hafed AL-Yaqoobi and Fatima Jafar AL-
Ajmi (2016) Phytochemical analysis antimicrobial screening and Hypoglycemic
effect of some selected Medicinal plant extract from Oman Journal of Experimental
Biology and Agricultural Sciences 4(2)218-224
Suggested citation
Panchal M and Jha C (2021) Qualitative phytochemical analysis of some medicinal plants (leaves)
from the surrounding area of Talod Taluka North Gujarat India Prithivya An Official Newsletter
of WCB Research Foundation and WCB Research Lab Vol 1(2) 37-43
DHARAIYA A Remote sensing
Prithivya | August 2021 44
Remote sensing An overview with fundamentals and applications
Dharaiya Aditya
Geology Department MG Science Institute Ahmadabad ndash 380009 (Gujarat) India
E-mail adiradhugmailcom
Introduction
The general concept of remote sensing can be inferred by a simple statement ie the
acquisition of information from a specific distance Scientifically it is the science of
acquiring information about an object or phenomenon by measuring emitted and reflected
radiation (Ray 2013) According to Lillesand et al (2015) remote sensing is defined as the
science and techniques of obtaining information about an object land area phenomenon or
ecosystem process acquired by a device that is not in direct contact with the object area or
phenomenon under investigation The data collection is done remotely using various sensors
which may be further analyzed to obtain information about the objects areas or phenomenon
These acquired data can be of many forms such as variations in force distributions acoustic
wave and electromagnetic energy distributions Joseph (2005) has discussed modern remote
sensing as an extension of the natural phenomenon of visual perception of objects Apart
from visible spectrum the electromagnetic radiation from the ultraviolet to far infrared and
the microwave regions is used for remote sensing The observations which are directly
inferred through electromagnetic radiation (EMR) from the sun or self-emitted radiance is
called passive remote sensing Whereas in active remote sensing the electromagnetic
radiations of a specific wavelength or band of wavelengths are generated to illuminate the
targets and reflected or back-scattered EMR are recorded to gain information for example
LiDAR RADAR SAR etc Based on its applicability remote sensing is defined as sensing
of the earthrsquos surface from the space by making use of the properties of electromagnetic wave
emitted reflected or diffracted by the sensed objects for the purpose of improving natural
resource management land use and environmental protection The classification of remote
sensing is further based on the selection of EMR (eg optical and microwave Navalgund et
al (2007)) When the sensors detect the solar radiation in the visible and infrared wavelength
regions reflectedscattered or emitted from the earth is said as optical remote sensing and in
microwave remote sensing uses interference and polarization concepts with electromagnetic
energy that detects the scattered energy returning from the terrain and records it as an image
The main purpose of remote sensing is to have an organized systematic and large amount of
DHARAIYA A Remote sensing
Prithivya | August 2021 45
data collection in order to acquire information about 2 or 3 dimensions of real objects One
can get large and broad global coverage and repeatability of data to obtain a multipurpose
information through various earth observation satellite sensors which helps in detecting
things that are normally absent in visible spectra such as Land-surface temperature
Underground or sub-surface water etc There are several Earth Observation (EO) Satellites
namely Cartosat series Landsat series Sentinel 1 2 MODIS RISAT 1 and RADARSAT 2
Resourcesat Envisat IRS 1A Oceansat 2 and many more
Electromagnetic Spectrum
Electromagnetic radiation or EMR is the term used to describe all of the different types of
energies released by electromagnetic processes Visible light is just one of many forms of
electromagnetic energy Radio waves infrared light and X rays are all forms of
electromagnetic radiation The
electromagnetic waves are formed by
the vibrations of electric and magnetic
fields these vary in magnitude in a
direction perpendicular to the direction
of propagation of radiations at a
constant speed of light (c= 3108
ms)Figure 1 shows a generalized
concept of EMR These differ from
mechanical waves as they need not
require a medium to propagate
hence it is able to travel through air
and solid materials and can also
travel through the vacuum of space Thus to define the EMR scientifically it can be said as a
form of energy emitted or absorbed by charged particles which exhibits wave-like behavior
as it travels through space
The electromagnetic spectrum is the entire range of all possible frequencies of
electromagnetic radiation (Figure 2) This includes the electromagnetic energy ranging from
Gamma rays to radio waves where the wavelength becomes longer so the energy and
frequency gradually decreases There are four kinds of resolution that are described from the
EMR spectrum are as follows
Figure 1 Illustration on the concept of EMR in which
propagation of electric and magnetic field is shown
Source - httpwwwfaoorg3t0355eT0355E02HTM accessed on 25
th
April
2021
DHARAIYA A Remote sensing
Prithivya | August 2021 46
1 Spectral resolution ndash it is the variation in the reflectanceemittance as a function of
wavelength Spectral responses are recorded by separate spectral bands such as Red Blue
Green Thermal NIR etc Figure 3 depicts the spectral resolution through a reflectance
curve It is further divided into 4 class sub classes
a Panchromatic ndash It consists
of only 1 band (BW)
b Colour ndash It consists the
combinations of 3 colors of
visible spectrum (RGB)
c Multispectral ndash consists of
3 to 10 bands and offers
Medium level spectral
resolution(Feng et al 2020)
d Hyper spectral ndash consists
of 100s of band and offers
higher spectral resolution (Feng et al 2020)
The combinations of spectral reflectance from two or more wavelength that indicate the
relative abundance of feature of interest are known as spectral indices Vegetation indices are
the most popular type but other indices are available for burned area built-up features
Figure 2 Electromagnetic spectrum showing waves and the radiations with respect to
wavelength and frequency
Figure 3 Spectral reflectance curve to determine spectral
resolution
Source -httpgsphumboldtedu accessed on 8th
April 2021
Source ndashLillesand et al (2015) Remote sensing and Image interpretation 7e
DHARAIYA A Remote sensing
Prithivya | August 2021 47
hydrologic and geologic features The band combinations for formulating spectral indices
vary from satellite to satellite Some of the most common spectral indices are listed in
Table1
No Spectral indices Formulation
(Band combinations)
1 NDVI (Normalised Difference Vegetation
Index)
NIR ndash Red NIR + Red (Where NIR is
Near-infrared band)
2 NDWI (Normalised Difference Water Index)
NDMI (Normalised Difference Moisture Index)
NIR - SWIR NIR + SWIR
3 AVI (Advanced Vegetation Index) [NIR (1-Red) (NIR-Red)] 13
4 NDSI (Normalised Difference Snow Index) Green ndash SWIR Green + SWIR
5 SAVI (Soil Adjusted Vegetation Index) ((NIR ndash R) (NIR + R + L)) (1 + L)
Where L is soil brightness correction
factor
6 MSI (Moisture Stress Index) MIR NIR Where MIR is Middle-wave
Infrared
7 NDGI (Normalised Difference Glacier Index) NIR ndash Green NIR + Green
8 NDBI (Normalised Difference Built-up Index) SWIR ndash NIR SWIR + NIR
9 BSI (Bare Soil Index) ((Red + SWIR) ndash (NIR + Blue)) ((Red
+ SWIR) + (NIR + Blue))
2 Spatial resolutionndashIt is described as the measure of the smallest object that can be resolved
by the sensor or the ground area imaged for the instantaneous field of view (IFOV) of the
ground sensor or the linear dimension on the ground represented by each pixel in the
reflectanceemittance determined by the shape size and texture of the target as discussed in
the book entitled Advance Remote Sensing 2012 It is expressed in meters like (250 m 80
m 10 m 1 m resolutions etc) Figure 4 is an example of spatial resolution
10 m resolution 30 m resolution
(a) (b)
Table 1 Different kinds of Spectral indices with respect to their formulations of band
Source -httpsgiscrackcomlist-of-spectral-indices
Source -httpsgiscrackcomlist-of-spectral-indices
Source -httpsgiscrackcomlist-of-spectral-indices
combinations
Figure 4 Example of Spatial Resolution by imagery acquired from Sentinel (a) and Landsat (b)
satellite sensors
Source -httpsgiscrackcomlist-of-spectral-indices
DHARAIYA A Remote sensing
Prithivya | August 2021 48
3Temporal resolution ndash the amount of time needed to revisit and acquire data for the exact
same location is called temporal resolution for example the revisit time period of Landsat is
16 days and that of Sentinel is 10 days Figure 5 shows the processed temporal resolution
4 Radiometric resolution ndash When an image is acquired by a sensor its sensitivity to the
magnitude of the electromagnetic energy determines the radiometric resolution The finer the
radiometric resolution of a sensor the more sensitive it is to detecting small differences in
reflected or emitted energy
Components and process of remote sensing
Figure 6 briefly describes the
process of remote sensing
Though the methods for
collection processing and
interpretation of remotely sensed
data are diverse imaging systems
have the following essential
components
Figure 5 Example of Temporal resolution of Las Vegas over time in 1973 2000 and 2006
Figure 6 A generalized process components of remote
sensing technology
Source- httpsseos-projecteuremotesensing
Source - httpswwwgisoutlookcom2019 accessed on 8th
April 2021
DHARAIYA A Remote sensing
Prithivya | August 2021 49
1 Energy source or illumination
This is the basic requirement for process of remote sensing to have a source of energy that
illuminates electromagnetic energy to the target of interest for example Active and passive
ensors Mostly the sensors are passive which tends to measure the solar radiation reflected
from the target
2 Interaction with the atmosphere
Before the electromagnetic radiation reaches the Earths surface it has to travel through some
distance of the Earths atmosphere Particles and gases in the atmosphere can affect the
incoming light and radiation and such type of effects are caused by the mechanisms
of scattering and absorption (Figure 7)Scattering occurs when particles or large gas
molecules present in the atmosphere interacts and cause the electromagnetic radiation to be
redirected from its
original path It depends
on several factors
including the
wavelength of the
radiation the abundance
of particles or gases and
the distance the radiation
travels through the
atmosphere There are three 3 types of scattering which take place are described in Table 2
All the different types of scattering with examples are briefly shown in figure 8
No Types of Scattering Particle size
(Micro meters
μm)
Examples
1 Rayleigh lt 01 μm Small specks of Dust N2 O2
molecules
2 Mie ~ 1 to 10 μm Pollen Smoke Water vapour
3 Non ndash Selective gt 10 μm Water droplets and large dust
particles
Figure 7 Interaction of EMR with atmosphere (a) Scattering and (b)
Absorption
Table 2 Different types of scattering occur when EMR interacts with the atmosphere
Reference httpswwwnrcangccamaps-tools-publications
DHARAIYA A Remote sensing
Prithivya | August 2021 50
Absorption is the other main mechanism when EMR interacts with the atmosphere In
Contrast to scattering it causes molecules in the atmosphere to absorb specific amount of
energy at various wavelengths O3 CO2 and water vapour are 3 main atmospheric
constituents which absorbs radiation Those areas of the EMR spectrum which are not
severely influenced by atmospheric absorption and thus are useful for remote sensors are
called Atmospheric windows (Figure 9) The visible portion of the spectrum to which our
eyes are most sensitive corresponds to both the atmospheric window and the peak energy
level of the sun
Figure 8 Different types of scattering when EMR interacts in the atmosphere or with the
Earthrsquos surface
Figure 9 Atmospheric window showing the transmission of molecules at different wavelength
with respect to different radiations
Source - httpwwwgeooregonstateedu accessed on 8th
April 2021
Source - httpwwwsarraceniacomastronomy accessed on 8th
April 2021
DHARAIYA A Remote sensing
Prithivya | August 2021 51
3 Interaction with the target
After the interaction with atmosphere once the energy makes its way to the target through the
atmosphere it interacts with the target depending on the properties of both the target and the
radiation Figure 10 shows such examples of interaction This can take place a second time as
the energy travels back from the target to sensor Several interactions are possible when
electromagnetic energy encounters matter whether solid liquid or gases are as follows
Radiation may be transmitted or passed through the substance
It may be absorbed and give up its energy largely to heating the substance
It may be emitted as a function of its emissivity and temperature
It may be reflected in 2 ways specular and diffused (Scattered)
4 Recording of Energy by the sensor
After the energy has been scattered by or emitted from the earthrsquos surface there is a need for
a sensor which is mounted on a satellite to collect and record the EMR The sensors are
popularly known by EMR region they sense Remote sensing has a broad classification of
optical and microwave as well as active and passive remote sensing as discussed by
Navalgund et al(2007) Feng et al (2020) Ray (2013) The sensors for taking
observations needs to be mounted on a platform This could be ground based (eg handheld
radiometers) airborne (eg Drone AVIRIS sensor of NASA on board aircraft) or space-
borne (ie satellite based)
Figure 10 EMR interaction with the Earthrsquos Surface
Source httpswwwslideservecomportia copy Rick Lathrop accessed on 25th
April 2021
DHARAIYA A Remote sensing
Prithivya | August 2021 52
5 Transmission Reception and Processing
The energy recorded by the sensor has to be transmitted often in electronic form to a
receiving and processing station at the earth where the data are processed and stored in digital
form
6 Interpretation and analysis
Furthermore this processed data is interpreted visually and digitally to extract information
about the target which was illuminated There are numerous specialised instruments or
hardware and software used that are commonly known as image processing tools which
involves four basic steps viz image correctionrestoration image enhancement image
transformation and image classification
7 Application
The final element or component of remote sensing process is achieved when we apply the
extracted and processed information in solving a particular issue or problem Specialists who
work in each application theme are able to perform and carry out this task
Applications of remote sensing
Every application itself has some specific demands for spectral spatial radiometric and
temporal resolution of the satellite sensor (Shandilya et al 2013) In modern era the remote
sensing proved very effective to understand and resolve the challenges in almost all the
fields few of its major applications are illustrated in this article
1 Geology
In the field of geosciences the remote sensing techniques are applied to interpret and analyse
the bedrock lithological structural formations sedimentation(Merritt et al 2014 Stead et
al 2019) planetary surface monitoring (Clark et al 2003 Des Marais et al 2002 Shepard
et al 2001)geo-hazards and mineral exploration through observation and modelling
techniques
DHARAIYA A Remote sensing
Prithivya | August 2021 53
2 Hydrology
Some examples of applications of remote
sensing in hydrological science include
soil moisture estimation flood and
wetland monitoring watershed and
drainage modelling river delta change
detection and many more Figure 11 and
12are an example of one of the studies
undertaken for hydrological modelling
and mapping of wetlands respectively
(Dharaiya 2020a Dharaiya et al 2021)
3 Glaciology
By means of remote sensing one can acquire information and map the ice concentration ice
type or motion(Frey et al 2014 Jiyang Chen amp Ohmura 1990) iceberg detection glacier
copy
Adi
tya
D
Figure 11 Drainage modelling in Jambughoda
Wildlife sanctuary Gujarat (after Dharaiya
2020a)
copy
Aditya
D Figure 12 Mapping of wetlands in Patan district Gujarat (Dharaiya et al 2021)
DHARAIYA A Remote sensing
Prithivya | August 2021 54
dynamics (Pratibha amp Kulkarni 2018 Remya et al 2019) monitor snow thickness
(Gantayat et al 2014 Kulkarni et al 2002) meteorological change research snow-water
equivalence snowmelt run-off estimation and many more
4 Agriculture
In the science of agriculture the remote sensing is mostly used as a decision-making tool viz
for crop type classification crop condition assessment crop yield estimation soil characters
soil management practices and compliance monitoring (Zheng et al 2014)
5 Forestry
Forestry is one of the major sectors where remote sensing has proved as very effective tool It
has been used for reconnaissance mapping commercial forestry and environmental
monitoring are some objectives which can be fulfilled and that further helps in managing and
conserving the natural resources Figure 13 is an example of mapping the forest coverat
Ratanmahal wildlife sanctuary Gujarat using spectral indices
6 Land use Land cover (LULC)
Yacouba et al (2010) has discussed the LULC with reference to two terms lsquoland usersquo which
refers to the purpose the land serves and lsquoland coverrsquo refers to natural surface cover on the
ground For example it is widely used in habitat and natural resource management urban
expansion baseline mapping risk assessment legal boundaries for tax evaluation change
Figure 13 Forest cover map of Ratanmahal wildlife sanctuary Gujarat copy Aditya Dharaiya
DHARAIYA A Remote sensing
Prithivya | August 2021 55
detection etc Figure 14 and 15depicts the LULC classification and change detection of
wetlands respectively (Dharaiya 2020b Dharaiya et al 2021)
copy
Adity
a D
Figure 14 LULC classification with vegetation cover in Girnar Wildlife sanctuary
Gujarat (After Dharaiya 2020b)
Figure 15 Change detection of wetlands in Patan district Gujarat using Landsat 8 OLI
(Dharaiya et al 2021)
DHARAIYA A Remote sensing
Prithivya | August 2021 56
7 Coastal monitoring
Remote sensing can be used to gather information about oceanic processes(physical and
biological) oil spill (Alesheikh et al 1997 Fingas amp Brown 1997) and shipping by means
of remote sensing
Several other applications according to Shandilya et al (2013) include planimetry or land
surveying using very high spatial resolution satellites (30 cm) Generating Digital Elevation
Models (DEMs) from remote sensing products are used to generate elevation profiles by
means of radar interferometry radargrammetry and photogrammetry To extract the
planimetric details about mineral exploration activities topographic mapping and surface
monitoring base map imagery provides a priori information about the areas
Conclusion
This emerging technique of remote sensing is a significant tool to monitor the Earthrsquos
surface It has progressively expanded applications which allow users to collect interpret
and manipulate data over vast areas Multi-temporal satellite data help to delineate changes of
the earthrsquos surface thus it can be also said to be a useful and handy tool for all the users as it
increases the accuracy efficiency and quality of the analysis in such a way that it can be
helpful in decision-making process Furthermore the products can be conveniently used by
other scientists too who are even not much familiar with this technology and for the greatest
level of detail to be extracted
References
Alesheikh A A Ghorbanali A amp Nouri N (1997) Coastline change detection using
remote sensing International Journal of Environmental Science and Technology 4(1)
1ndash11
Clark R N Swayze G A Livo K E Kokaly R F Sutley S J Dalton J B
McDougal R R amp Gent C A (2003) Imaging spectroscopy Earth and planetary
remote sensing with the USGS Tetra order and expert systems Journal of
Geophysical Research E Planets 108(12) httpsdoiorg1010292002je001847
Des Marais D J Harwit M O Jucks K W Kasting J F Lin D N C Lunine J I
Schneider J Seager S Traub W A amp Woolf N J (2002) Remote sensing of
DHARAIYA A Remote sensing
Prithivya | August 2021 57
planetary properties and biosignatures on extrasolar terrestrial planets Astrobiology
2(2) 153ndash181 httpsdoiorg10108915311070260192246
Dharaiya A (2020a)Monitoring and assessment of forest ecosystem using geospatial
technology A case study of Jambughoda wildlife sanctuary Gujarat India Poster
presented at ISRS National Symposium-2020
Dharaiya A (2020b) Habitat Analysis of Girnar Wildlife Sanctuary using Geospatial
Techniques Paper presented at National Map Competition GIS Day-2020
Dharaiya N Bhati R and Patel J (2021) Ecological studies on selected wetlands of Patan
district to prepare management plan for long-term conservation Technical Report
WCB Research Foundation Patan 91Pp
Feng X He L Cheng Q Long X amp Yuan Y (2020) Hyperspectral and multispectral
remote sensing image fusion based on endmember spatial information Remote
Sensing 12(6) 1ndash17 httpsdoiorg103390rs12061009
Fingas M F amp Brown C E (1997) Review of oil spill remote sensing Spill Science and
Technology Bulletin 4(4) 199ndash208 httpsdoiorg101016S1353-2561(98)00023-1
Frey H Machguth H Huss M Huggel C Bajracharya S Bolch T Kulkarni A
Linsbauer A Salzmann N amp Stoffel M (2014) Estimating the volume of glaciers
in the Himalayan-Karakoram region using different methods Cryosphere 8(6) 2313ndash
2333 httpsdoiorg105194tc-8-2313-2014
Gantayat P Kulkarni A V amp Srinivasan J (2014) Estimation of ice thickness using
surface velocities and slope Case study at Gangotri Glacier India Journal of
Glaciology 60(220) 277ndash282 httpsdoiorg1031892014JoG13J078
Jiyang Chen amp Ohmura A (1990) Estimation of Alpine glacier water resources and their
change since the 1870s Hydrology in Mountainous Regions I 5(193) 127ndash135
Joseph G (2005) Fundamentals of Remote sensing 2e Orient Blackswan 2Rev ed Pp i-
xi 1-486
DHARAIYA A Remote sensing
Prithivya | August 2021 58
Kulkarni A V Srinivasulu J Manjul S S amp Mathur P (2002) Field based spectral
reflectance studies to develop NDSI method for snow cover monitoring Journal of
the Indian Society of Remote Sensing 30(1ndash2) 73ndash80
httpsdoiorg101007BF02989978
Lillesand T Kiefer R Chipman J (2015) Remote sensing and Image interpretation 7e
John Wiley amp sons Inc Pp 1-736
Merritt A J Chambers J E Murphy W Wilkinson P B West L J Gunn D A
Meldrum P I Kirkham M amp Dixon N (2014) 3D ground model development for
an active landslide in Liasmudrocks using geophysical remote sensing and
geotechnical methods Landslides 11(4) 537ndash550 httpsdoiorg101007s10346-
013-0409-1
Navalgund R Jayaraman V Roy P (2007) Remote sensing applications An overview
Current Science 93(12) 1747-1766
Pratibha S amp Kulkarni A V (2018) Decadal change in supraglacial debris cover in Baspa
basin Western Himalaya Current Science 114(4) 792ndash799
httpsdoiorg1018520csv114i04792-799
Ray S (2013) Basics of Remote Sensing Remote Sensing Image Analysis Including the
Spatial Domain 1ndash15 httpsdoiorg1010071-4020-2560-2_1
Remya S N Kulkarni A V Pradeep S amp Shrestha D G (2019) Volume estimation of
existing and potential glacier lakes Sikkim Himalaya India Current Science 116(4)
620ndash627 httpsdoiorg1018520csv116i4620-627
Shandilya K K Shukla S P amp Pathak V (2013) Applications of Remote sensing
Horizons of Earth sciences Vol 10 1ndash12
Shepard M K Campbell B A Bulmer M H Farr T G Gaddis L R amp Plaut J J
(2001) The roughness of natural terrain A planetary and remote sensing perspective
Journal of Geophysical Research E Planets 106(E12) 32777ndash32795
httpsdoiorg1010292000JE001429
DHARAIYA A Remote sensing
Prithivya | August 2021 59
Stead D Donati D Wolter A amp Sturzenegger M (2019) Application of remote sensing
to the investigation of rock slopes Experience gained and lessons learned ISPRS
International Journal of Geo-Information 8(7) httpsdoiorg103390ijgi8070296
Yacouba D Guangdao H amp Xingping W (2010) Applications of Remote Sensing in
Land UseLand Cover Change Detection in Puer and Simao Counties Yunnan
Province Report and Opinion 2(9) 7ndash16
Zheng B Campbell J B Serbin G amp Galbraith J M (2014) Remote sensing of crop
residue and tillage practices Present capabilities and future prospects Soil and
Tillage Research 138 26ndash34 httpsdoiorg101016jstill201312009
Types of resolution used in remote sensing
httpwwwedcuriedunrsclassesnrs409rslectureshowremotesensonworkpdfacce
ssed on 24th April 2021
Components of remote sensing ndash Scattering and absorption httpswwwnrcangccamaps-
tools-publicationssatellite-imagery-air-photosremote-sensing-
tutorialsintroductioninteractions-atmosphere14635accessed on 24th April 2021
Basic concepts of Electromagnetic radiation and
spectrumhttpgsphumboldteduOLMCoursesGSP_216_Onlinelesson1-
2spectrumhtmlaccessed on 24th April 2021
Concept of spectral indices httpswwwl3harrisgeospatialcomdocsspectralindiceshtml
accessed on 25th April 2021
Suggested citation
Dharaiya A (2021) Remote sensing and An overview with fundamentals and applications
Prithivya An Official Newsletter of WCB Research Foundation and WCB Research Lab Vol 1(2)
44-59
M I PATEL AWARD 2021
Prithivya | August 2021 60
M I Patel Award for Young Wildlife amp Conservation Biologist
Nominations for 2021 Award
Ms Shivangi Mishra
Shivangi is a Senior Research Fellow (Basic Scientific
Research Fellow UGC) at University of Lucknow and is
currently working on Egyptian Vultures She has also
worked on Butterflies of Uttar Pradesh from 2014- 2016
She has presented her research on Egyptian Vultures in
Conference of Raptor Research Foundation in 2018
(South Africa) 2019 (USA) and awarded with William C
Andersen Award and James Koplin Award respectively In
future also she wants to contribute her research for the
conservation of Egyptian Vultures in India
Dr Tarang Kumar Shah
Tarang is an Assistant Professor in Fisheries polytechnic at
Dau Shri VasudevChandrakarKamdhenuVishwaVidyalaya
Durg He studied the Effect of Thymus linearis plant
Extract on Growth Performance and Non-Specific Immune
Responses of endangered Golden Mahseer (Tor
putitora)against the disease caused
byOomycetesSaprolegniaparastica He found that the leaf
extract of Thymus plant has the antifungal properties and a
small quantity of which can control the population against
saprolegniosis
Dr Sujit Kolangath
Sujit is a subject specialist in animal biotechnology at
Wildlife Research amp Training Center Gorewada Nagpur
He studied the qualitative and quantitative aspect of
hepatoozoonfelis epidemiology in a tiger cub He reported
that the infection is transmitted by ingestion of infected
ticks infected prey and carrion and concurrent infection
with bacterial or viral infections may be fatal to the
infected animal
M I PATEL AWARD 2021
Prithivya | August 2021 61
Ms Jis Sebastian
Jis recently completed her doctoral research in Botany
from Madurai Kamraj University Madurai- Tamil Nadu
She is studying the pattern of diversity spatial distribution
and community structure of epiphytic orchids of southern
Western Ghatsresponds to availibility of
microenviornments (Microhabitat supported by
Microclimates) in the structurally diverse trees There for
Conservation of epiphytic orchids would ensure
conservation of old aged natural structurally complex
trees in the forest ecosystem
Dr Harshil Patel
Harshil is a naturalist working mainly on systematics and
taxonomy of reptiles and amphibians He studied the
amphibians amp reptiles of northern Western Ghats of
Gujarat He found a new Miocene divergent endemic
lineage of a racer snake evolutionary history of an
endemic snake resulted in the resurrection of a genus
reinvestigation of a gecko species complex that resulted
into the discovery of two new species
The final round including the presentation by the nominees followed by the award
ceremony will be conducted on September 27 2021 at M N College Visnagar (Gujarat)
WCB and the M I Patel Award committee congratulate all the nominees and wishing all
the best for their presentation
Applications and nomination for the 2022 awards are now open through our website
(wwwwcbresearchin) till June 30 2022
ANNOUNCEMENT
Prithivya | August 2021 62
ANNOUNCEMENT
Prithivya | August 2021 63
WINNERS OF MANGROVE DAY POSTER
COMPETITION
Prithivya | August 2021 64
WCB Research Foundation with K J Somaiya College Mubai have organized Digital and
Handmade Posters Competition on the occasion of World Mangrove Day July 26 2021 Out
of entries of thirty participants three best posters were selected by the committee and
awarded
Posters of Winners
1st Prize Digital Poster Ms Yukta Sawant
WINNERS OF MANGROVE DAY POSTER
COMPETITION
Prithivya | August 2021 65
1st Prize Digital Poster Ms Yukta Sawant
1st Prize Handmade Poster Ms Tanya Sawardekar
WCB RESEARCH FOUNDATION GOVERNING COUNCIL
Prithivya | August 2021 66
Governing Council of WCB Research Foundation
Executive
Director
Dr Hardik Patel Assistant Professor
Parul University Vadodara
phardik80gmailcom
Director of
Research
Dr Nishith Dharaiya Associate Professor
HNG University Patan
nadharaiyanguacin
Member Dr Sagarika Damle Associate Professor amp Head
Department of Life Sciences KC College Mumbai
sagarikadamlekccollegeeduin
Member Dr Nuria Selva Associate Professor
Institute of Nature Conservation
Polish Academy of Science Krakow Poland
nuriaselvagmailcom
Member Mr Pratik Desai Jr Research Fellow
WCB Research Lab Patan
pratikdesai825gmailcom
Member Mr M S Patel Associate Professor
M N College Visnagar martinleemsgmailcom
Member Dr Haresh Gondaliya Assistant Professor
Shri G D Modi Science College Palanpur hareshgondliya55gmailcom
Member Mr Prasad Patil Range Forest Officer
Gujarat Forest Department jalu1890gmailcom
Member Ms Madhuri Padaya Assistant Professor
K J Somaiya College of Science Mumbai padayamadhuriyahoocom
Member Dr Jagruti Rathod Director
Center for Nature amp Ecosystem Wellbeing Vadodara
rathod21gmailcom
Member
Secretary
Ms Jahnvi Patel Admin Officer
WCB Research Foundation Patan
adminwcbresearchin
Page 1 of 7 Pruthivya An official newsletter of WCB Research Foundation
Guidelines to authors and contributors 1 | P a g e
Instructions for authors
Scope Prithivya is a tri-annual newsletter of WCB Research Foundation and will
publish manuscripts on wildlife conservation biology and its allied areas
Guidelines to contributors of Prithiviya
Manuscript Types Prithiviya publishes original research articles short notes
field notes reviews and comments Submissions should be in English (UK) only
All manuscripts should be easy to read and comprehend Manuscripts may be
edited for length content and style and be sent to referees when found to be
appropriate The editor will discuss contributions with authors and advise to
modified whenever required
Submission is considered on the condition that papers are previously
unpublished have not been offered simultaneously elsewhere and that all
contributors have read and approved the contents
The editor will acknowledge manuscript contributions and assign them a unique
registration number which latter must be quoted in correspondence Papers are
peer-reviewed although the editor reserves the right to reject one without a
review
Preparation and submission of manuscripts
1 Title page Add full title Authors name and affiliation with email of all the Authors Abstract (250 Words) and Key words (4-5)
2 Submitted manuscripts should generally follow the normal convention of
scientific manuscripts keywords generally not appearing in the title
Introduction Materials and Methods Results and Discussion
Acknowledgments Authors contribution (optional) Appendices (optional) and
References) with the replacement or addition of sections allowed in between
the Introduction and the Acknowledgments
3 The manuscript should be typed in MS Word with left-aligned typesetting and
only true type fonts (Times new roman preferable) should be used The line
spacing must be 15 and the font size of 12 Headings should be bold and sub-
headings should be made italicized
Page 2 of 7 Pruthivya An official newsletter of WCB Research Foundation
Guidelines to authors and contributors 2 | P a g e
4 Title A concise informative and attractive and short title with 5-20 words will
be encouraged
5 Abstract Word limit for the abstract is 250 words and should contain a
summary of all major findings or conclusions of the study however abstract
is not required in case of short notes field notes and other short
communication
6 Introduction should be clearly written and must covering the objectives and
significance of the study
7 Methodology A detailed methodology is always encouraged The methodology
should contain the study area (if applicable) data collection analysis and
interpretation Authors should also mention the instruments software used
for the experiments and analysis
8 Result and discussions which contain main result with proper references
and authentic justifications include graph table photographs (No checklist
it directly goes into appendix or supplementary data)
9 Conclusions A short and comprehensive conclusion with significant novel
findings and depicting your research in a nut-shell
10 Acknowledgments which contain all funds support persons who help
during project or research or findings name of university other than they work
etc
11 Checklist-based papers like trip reports should contain dates of the trip total
number of birders or participants Mammals reptiles amphibians
invertebrates etc
12 Manuscripts should be sent electronically as an email attachment to the
Editorial Assistant with a cover letter to helliphellip
13 The text tables figurephotograph captions (which must be self-explanatory)
and appendices should be combined in one Microsoft Wordreg (ldquodocrdquo OR
ldquodocxrdquo) file format The preferred font is lsquoTimes New Romanrsquo in 12 point
14 Photographs artwork maps (the outlines of the Republic of India should
conform to Government of India regulations) diagrams etc should be
digitized and sent separately along with the manuscript or if they are large
Page 3 of 7 Pruthivya An official newsletter of WCB Research Foundation
Guidelines to authors and contributors 3 | P a g e
files in separate trailing e-mails These should be in TIFF and at least 8times11
inches in 300 dpi resolutions JPEG files must be lsquomaximumrsquo quality ie at
their minimum compression Maps should be marked with a scale and North
arrow and should carry a clear caption
15 Authors whose work involves the handling of any necessary permissions from
the requisite government agencies to do so The editor reserves the right to
view such permissions at herhis discretion
16 While photographing nestingcourtship display or any behavioural activity
including those of nests eggs courtship etc authorsphotographers must
ensure the safety of the animals involved and also ensure that they do not
disturb in any way whatsoever in the course of their photography The editor
reserves the right to view permissions for such activities within protected
areas The editorreferee reserves the right to query an author regarding the
ethics of photography and the methodology followed while photographing
including that of rejecting a manuscript if unsatisfied on these counts
Types of Manuscript
1 Short Research articles 2000 to 2500 words
2 Short notes Up to 1500 words
3 Important sightings 250-350 words with proper GPS location and
photographic evidence
4 Important findings 250-500 words with proper GPS location with image
5 Full-length Research paper Up to 10000 words with appendix excluding
photographs only
Other important Guidelines
Scientific binomials should comprise the generic and specific names but should
not include the name of the author and year of citation Scientific trinomials
should be mentioned only if the nature of the manuscript requires them
For example both the English and scientific name must be given thus ldquoHouse
Crow Corvus splendensrdquo thereafter only the English name ldquoHouse Crowrdquo will
suffice English and scientific names should follow the proper book that should
be mention in reference and title of the table
Page 4 of 7 Pruthivya An official newsletter of WCB Research Foundation
Guidelines to authors and contributors 4 | P a g e
Metric units and their international symbols must be used eg ldquosq kmrdquo and
ldquo1000 m aslrdquo dates and times should be of the form of MMDDYYYY (January
01 2021rdquo and ldquo1345 hrdquo respectively
Tables should be within gridlines (which may or may not be printed) Tables
should never be formatted with wrap-around text
Latitude and longitude coordinates should follow the format ldquo27807ordmN
74094ordmErdquo
Enzyme Nomenclature The trivial names recommended by the IUPAC-IUB
Commission should be used When the enzyme is the main subject of a paper
its code number and systematic name should be stated in its first citation in the
paper
Symbols and Abbreviations Use only standard abbreviations The use of non-
standard abbreviations can be extremely confusing to readers Avoid
abbreviations in the title The full term for which an abbreviation stands should
precede its first use in the text unless it is a standard unit of measurement
Page number (page 1 0f 10 formats) must be on top right corner of the word
documents font size 10 and times new roman word type
Citation and References Prithivya encourages the authors to use Mendely EndNote or other reference management tools for proper citations We follow APA referencing style
Do not abbreviate references pagination should be given in the expanded form
eg ldquoindashvi 1ndash250rdquo not ldquovi 250rdquo the page numbers should be separated by an
lsquoEnrsquo dash
Italics should be used for book titles but not volume numbers when citing
periodicals use italics for the journal name not the article title
References should be arranged alphabetically by the first author (and in the case
of more than one author by second and subsequent authors)
Citations to references in the text should follow the style ldquo(Santharam 1978)rdquo
ldquo(Barua amp Sharma 1999)rdquo ldquo(Pande et al 2002)rdquo ldquo(Lainer 1999 2004)rdquo ldquo(Lainer
1999abcd Lainer 1999a 2000a)rdquo [for several papers by an authors from
Page 5 of 7 Pruthivya An official newsletter of WCB Research Foundation
Guidelines to authors and contributors 5 | P a g e
amultiple calendar years] and ldquo(Neelakantan et al 1993 Sashikumar et
al 2011)rdquo
A string of citations in the text should follow a chronological not an alphabetical
order thus ldquo(Ali amp Ripley 1981 Kazmierczak 2000 Grimmett et al 2011)rdquo
When citing unpublished sources please use the following formats if the source
is written material ldquo(Harkirat Sangha in litt e-mailletter dated 02 January
2013)rdquo if oral ldquo(Rajah Jayapal verbally dated 15 December 2013)rdquo
When citing from e-Bird or any other magazine checklist please enter the author
of the e-Bird checklistrsquos name or others name and the year the checklist was
uploaded in the text ldquo(Raman 1994)rdquo If a checklist thatrsquos shared amongst
multiple observers is being referred to only the relevant checklist(s) should be
used for citation
See examples below for detailed formatting
Journal articles
Pittie A 2011 The dates of seven new taxa described by W E Brooks (Certhia
Hodgsoni Sitta Cashmirensis Dumeticola
major Horites [sic] Pallidus Phylloscopus Tytleri Motacilla Cashmirensis
and Alauda Guttata) Prithiviya7 (2) 54ndash55
Naoroji R amp Sangha H S 2011 Threats to habitat and wildlife in Changthang
and Rupshu areas of Ladakh a case study at Hanle Prithiviya7 (1) 2ndash6
Choudhary D N Mandal J N Mishra A amp Ghosh T K 2010 First ever
breeding record of Black-necked Stork Ephippiorhynchus asiaticus from
Bihar Prithiviya6 (3) 80ndash82
Books
Futehally Z (ed) 2006 India through its birds 1st ed Bangalore India
Dronequill Publishers Pvt Ltd Pp indashii 1ndash214
Pittie A 2010 Birds in books three hundred years of South Asian ornithologymdash
a bibliography 1st ed Ranikhet Permanent Black Pp indashxxi 1ndash845
Sashikumar C Praveen J Palot M J amp Nameer P O 2011 Birds of Kerala
status and distribution 1st ed Kottayam Kerala DC Books Pp 1ndash835 Book chapter
Pittie A 2011 Stray Feathers (1872ndash1899) (p 247) In Priority The dating of
scientific names in ornithology a directory to the literature and its
Page 6 of 7 Pruthivya An official newsletter of WCB Research Foundation
Guidelines to authors and contributors 6 | P a g e
reviewers Dickinson E C Overstreet L K Dowsett R J amp Bruce M D
(eds) Northampton UK Aves Press Limited Website
2013 Kadalundi makes history with new gull species The
Hindu (Thiruvananthapuram ed) dated February 7 2013
Website httpwwwthehinducomtodays-papertp-nationaltp-
keralakadalundi-makes-history-with-new-gull-speciesarticle4388171ece
[Accessed on 21 July 2014] Any magazine checklist
Raman T R S 1994 Website
URL httpebirdorgebirdviewchecklistsubID=S21694571 [Accessed on
15
December 2015]
ETHICAL MATTERS Authors involving in the usage of experimental animals and human subjects in their
research work should seek approval from the appropriate Institutional Animal Ethics
Committee in accordance with Principles of Laboratory Animal Care The material
and methods section of the manuscript should include a statement to prove that the
investigation was approved and that informed consent was obtained
Disclaimer
While every care is taken of manuscripts and their accompanying
material Prithiviya cannot be held responsible for accidental loss or damage of
any material sent for publication or for their return whether they are accepted
for publication or not
Material published in Prithiviya reflects the views of the authors and not
necessarily those of the publishers editors referees etc
The editor reserves the rights to make necessary changes in manuscripts in
consultation with the author
All submissions are evaluated under the assumption that the conditions listed here have been understood and accepted by the author(s)
Submission fees There will be no submission fees for e-publication however we
may produce the reprints on request and on payment basis
Page 7 of 7 Pruthivya An official newsletter of WCB Research Foundation
Guidelines to authors and contributors 7 | P a g e
Special announcements
We also accept announcement of workshop webinar conference symposium job
opportunities academic courses etc with nominal charges and guarantee for its
wider circulation
Contacts Editor in Chief Dr Sagarika Damle Emailvisaanikagmailcom Associate Editors Dr Nishith Dharaiya
Email nadharaiyagmailcom Dr Jagruti Rathod Email rathod21gmailcom Editorial Assistant Ms Rinku Bhati
Email bhatirinku178gmailcom
WCB Research FoundationAdding Science to Conservation
wwwwcbresearchin
- 001_Cover Page
- 002_Editorial Board_2
- 003_Table of Contents_Issue 2
- 004_Editorial and Directors Column
- 005_Chaudhary and Desai 1-3
- 006_Dave 4-11
- 007_Amin et al 12-17
- 008_Thakkar and Gohil 18-21
- 009_Marjadi 22-23
- 010_Patel and Patel 24-27
- 011_Pithva and Dharaiya 28-36
- 012_Panchal and Jha 37-43
- 013_Dhaaraiya 44-59
- 014_MI Patel Award Nominee 60-61
- 015_Announcements 62-63
- 016_Posters Competition Winners 64-65
- 017_ WCB Council and Board 66
- 018_Prithiviya_Guidelines Final
- 019_Last page
-
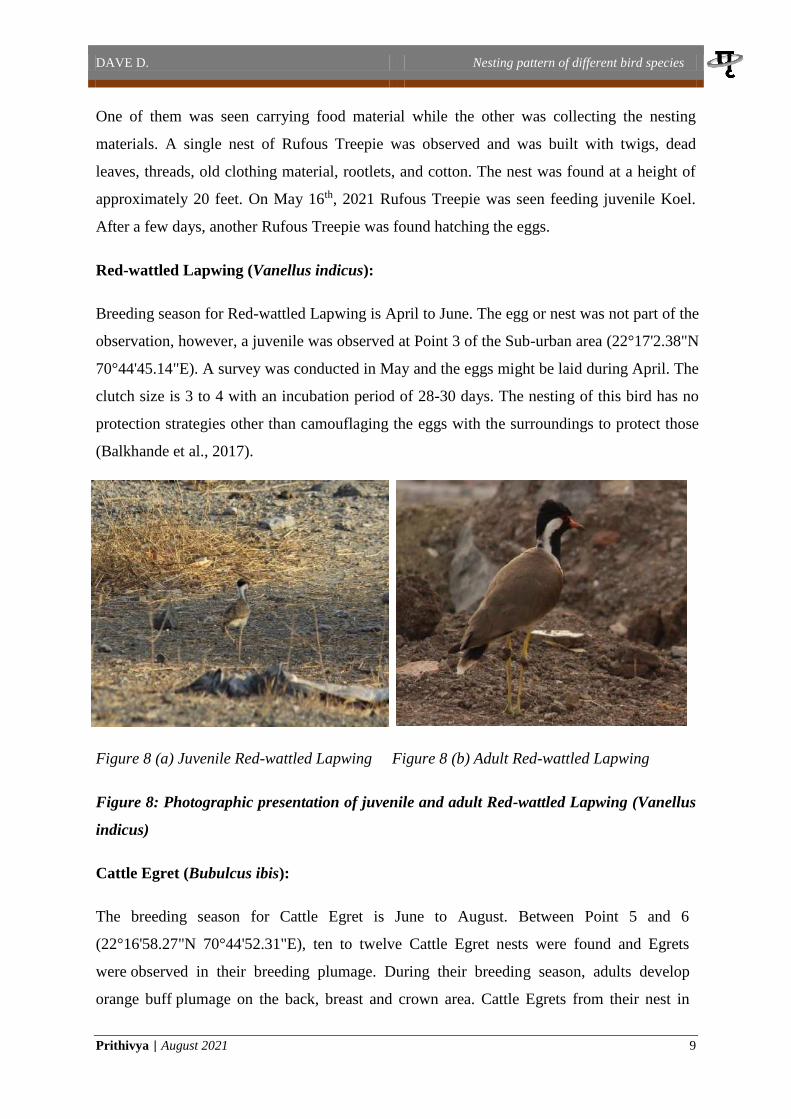
DAVE D Nesting pattern of different bird species
Prithivya | August 2021 9
One of them was seen carrying food material while the other was collecting the nesting
materials A single nest of Rufous Treepie was observed and was built with twigs dead
leaves threads old clothing material rootlets and cotton The nest was found at a height of
approximately 20 feet On May 16th 2021 Rufous Treepie was seen feeding juvenile Koel
After a few days another Rufous Treepie was found hatching the eggs
Red-wattled Lapwing (Vanellus indicus)
Breeding season for Red-wattled Lapwing is April to June The egg or nest was not part of the
observation however a juvenile was observed at Point 3 of the Sub-urban area (22deg17238N
70deg444514E) A survey was conducted in May and the eggs might be laid during April The
clutch size is 3 to 4 with an incubation period of 28-30 days The nesting of this bird has no
protection strategies other than camouflaging the eggs with the surroundings to protect those
(Balkhande et al 2017)
Figure 8 (a) Juvenile Red-wattled Lapwing Figure 8 (b) Adult Red-wattled Lapwing
Figure 8 Photographic presentation of juvenile and adult Red-wattled Lapwing (Vanellus
indicus)
Cattle Egret (Bubulcus ibis)
The breeding season for Cattle Egret is June to August Between Point 5 and 6
(22deg165827N 70deg445231E) ten to twelve Cattle Egret nests were found and Egrets
were observed in their breeding plumage During their breeding season adults develop
orange buff plumage on the back breast and crown area Cattle Egrets from their nest in
DAVE D Nesting pattern of different bird species
Prithivya | August 2021 10
colonies Rootlets and twigs are used to build nests Clutch size for Cattle Egret is 2-4 and
the incubation period is between 22-28 days (Patankar et al 2007)
Fig 9 (a) Fig 9 (b)
Figure 9 Cattle egrets (Bubulcus ibis) and their colony
Acknowledgements
I would like to express my gratitude to DrJagruti Rathod for guiding and inspiring me
throughout my study I would also like to thank all the members of WCB Research
Foundation for organizing this internship program and giving me a chance to expand my
knowledge
References
Ali (2017) The Bookof Indian Birds Bombay Natural History Society ISBN 8173714851
Ali Hadjela amp Hassan Syed amp Rana Shahnaz amp Beg Mirza amp Mahmood-ul-Hassan
Muhammad (2007) Brood parasitism of Asian koel (Eudynamys scolopacea) on the
house crow (Corvus splendens) in Pothwar region of Pakistan Pakistan Journal of
Agricultural Sciences 44 627
Balkhande Dr Jayvardhan (2017) Study of Nesting pattern and breeding Biology of Red-
Wattled Lapwing Vanellus Indicus in agricultural field near to Asna River bridge
Nanded (Maharashtra) Research maGma An International Multidisciplinary Journal
ISSN NO- 2456-7078 VOL-1 ISSUE-6 AUG-2017
Grimmett et al (2011) Birds of Indian Subcontinent Helm field guides
ISBN 9781408127636
DAVE D Nesting pattern of different bird species
Prithivya | August 2021 11
Jahan I Begum S Feeroz M M Das D K amp Datta A K (2018) Nesting pattern of
birds in Jahangirnagar University Campus Bangladesh Journal of Threatened Taxa
10(5) 11618ndash11635 httpsdoiorg1011609jot279910511618-11635
Nijman V (2004) Seasonal variation in naturally occurring mobbing behaviour of drongos
(Dicruridae) towards two avian predators Ethology Ecology and Evolution 16(1)
25ndash32 httpsdoiorg1010800892701420049522651
Patankar Pratyush amp Desai Isha amp Shinde Kavita amp Balakrishnan Suresh (2007) Ecology
and breeding biology of the Cattle Egret Bubulcus ibis in an industrial area at
Vadodara Gujarat Zoos Print Journal 22 1011609JoTTZPJ15662885-8
Robertson H A (1990) Breeding of collared doves streptopelia decaocto in rural
oxfordshire england Bird Study 37(2) 73ndash83
httpsdoiorg10108000063659009477043
Sharma M amp Sharma R K (2015) Ecology and breeding biology of Indian stone curlew
(Burhinus indicus) Nature Environment and Pollution Technology 14(2) 423ndash426
Suryawanshi K 2021 Nesting behaviour and diet of Shikra Accipiter badius in Ajanta
Maharashtra Indian BIRDS 17 (2) XXndashXX
Trivedi V amp Vaghela S (2020) Avifauna of saurashtra university campus Rajkot Gujarat
India Journal of Threatened Taxa 12(13) 16764ndash16774
httpsdoiorg1011609jott5113121316764-16774
Suggested citation
Dave D (2021) Observations on nesting pattern of different bird species around university road
Rajkot Prithivya An Official Newsletter of WCB Research Foundation and WCB Research Lab
Vol 1(2) 4-11
AMIN ET AL Record of Leucism in Indian Flying Fox
Prithivya | August 2021 12
Record of Leucism in Indian Flying Fox Pteropus giganteus (Mammalia
Chiroptera Pteropodidae) from South Gujarat India
Amin Siddharth M1 Patel Hiren J2 and Vaghela Prashant P3
1 C129 Bhagyoday Society Opposite Sahyog Police chowki Gorwa Refinery Road
Vadodara - 390024(Gujarat) India 2Sardar Patel Zoological Park Kevadiya ndash 393151(Gujarat) India 3C-27 New Narmada Colony Chhani Jakatnaka Vadodara - 390024(Gujarat) India
E-mail hirenp9408gmailcom
Abstract
Leucism in fruit bat species Pteropus giganteus (Brunnich 1782) is recorded for the first
time from India based on photographic evidence collected from the Anaval Village located in
Surat District of South Gujarat India A total lack of pigmentation in the whole body due to
the failure of melanocytes to migrate to the skin and hair follicles resulting in white or
whitish hairs pale skin but normal coloured eyes are the sign of leucism The present record
can serve as baseline data and will also help understand colour aberration in bats
Key Words Colour aberration Chiropteran Pigmentation Mutation
Introduction
The Indian Flying Fox is one of the most common and widely distributed chiropterans found
in India Pakistan Sri Lanka Bhutan Nepal Bangladesh Maldives Myanmar and China
(Tsang 2020 Johnsingh amp Manjrekar 2013 Srinivasulu amp Srinivasulu 2012) Flying Fox is
the largest fruit bat known to occur on mainland India (Bates et al 1994) out of 13 Indian
fruit bat species (Bates amp Harrison 1997 Srinivasulu et al 2010) It has a reddish-brown
head with a darker sometimes
blackish snout pale brownish-
yellow shoulders and hindneck
yellowish-brown ventrally and
black wings (Prater 1971) It is
a colonial species and roosts
during the day often in the
midst of busy towns villages
on large trees along the
roadside near cropland and
water bodies (Bates et al 1994
Johnsingh amp Manjrekar 2013
Menon 2014) Their roosting
Figure 1 Leucistic individual roosting along with the
normal individuals
AMIN ET AL Record of Leucism in Indian Flying Fox
Prithivya | August 2021 13
colonies are generally found on large trees such as Ficus benghalensis F religiosa
Tamarindus indica Mangifera indica Dalbergia sissoo and Eucalyptus sp (Vendan 2003)
and the colony size can vary from hundreds to several thousands of individuals (Bastawade
amp Mahabal 1976) Although fruit bats are responsible for many ecological services (Saikia
2018) yet Indian Flying Fox is one of the most persecuted fruit bats in South Asia and is
listed as vermin under Schedule V of the Indian Wildlife (Protection) Act and IUCN Red List
Data included it as a Least Concern species (Tsang 2020)
In mammals a wide variety of colours and forms are found as a result of the presence of
certain pigments mostly melanin which provides colour to the skin hairs and eyes
(Nordlund et al 1998 Uieda 2000 Lucati amp Loacutepez Baucells 2016) Often this pigment is
affected as a result of mutations giving rise to diverse colour aberrations The effect of such
abnormal colouration is generally the pigmentation anomalies of chromatic disorders (Rook
et al 1998) Similar to other mammals bats are also vulnerable to genetic disorders that
affect pigmentation Globally such chromatic disorders are being reported at an increasing
rate in bats (Lucati amp Loacutepez Baucells 2016) and are caused by either an increase or a
decrease in the production of melanin in some regions or over the entire body (Hofreiter amp
Schoneberg 2010 Abreu et al 2013) These include albinism leucism piebaldism
hypomelanism and melanism (Lucati amp Loacutepez Baucells 2016) Among these conditions
leucism stands out as a rare phenomenon in nature
Leucism is a total lack of pigmentation in the whole body due to the failure of melanocytes to
migrate to the skin and hair follicles resulting in white or whitish hairs pale skin but
normal coloured eyes It occurs regardless of the normal production of the enzyme tyrosinase
and melanin Moreover it can be caused by one of the several mutations that will give rise to
apparently similar phenotypes (van Grouw 2006 2013 Abreu et al 2013 Lucati amp
Loacutepez‐ Baucells 2016) The occurrence of colour aberration in 55 Indian mammalian species
has been compiled by Mahabal et al (2019) Although cases of albinism and piebaldism have
been reported in the family Pteropodidae (Neal 1971 Karim 1983 Anonymous 2012
Anonymous 2013) however there is no report on colour aberration in Indian Flying Fox
(Pteropus giganteus) Here we report the first case of leucism in Indian Flying Fox from
Surat district of South Gujarat India
AMIN ET AL Record of Leucism in Indian Flying Fox
Prithivya | August 2021 14
Observations
On 18 June 2017 we were on the way to Vansda National Park and at 1230 h we stopped as
we saw a group of Indian Flying Fox roosting on Ficus religiosa near Anaval Village
(20838degN 73263degE) in Surat District Gujarat Suddenly all the fruit bats flew in the sky as
a local was hunting them with the help of a catapult maybe for eating purposes In the
middle of all these at 1249 h a white bat flying in the sky grabbed our attention as it flew
further to roost on one of the branches with other Indian Flying Fox We took some
photographs (Figure 1) and observed with the help of binoculars to note down its
characteristics Its whole body ie both fur and skin were white or whitish including
patagium and ears but it had normal black coloured eyes With the help of the classification
proposed by Lucati amp Loacutepez Baucells (2016) we identified it as a case of leucism and not
albinism
The roosting colony had around 250 individuals and was situated near a village pond among
human habitation on the roadside We observed the leucistic individual at least for an hour
and also alerted the locals to cease hunting of bats The leucistic individual was probably a
female and showed similar activity as that of normal individuals such as opening and closing
of wings folding the wings around belly and grooming
Discussion
Although physiological causes of colouration including melanism are evident (Caro 2005)
the genetic processes responsible for these colour variations remain unknown in most
mammals (Lucati amp Loacutepez Baucells 2016) Moreover chromatic disorders in bats can affect
both fur and skin including patagium ears and muzzle and their impact on the survival rate
is vague (Lucati amp Loacutepez Baucells 2016) However bats are most likely less vulnerable to
predation than the majority of diurnal animals as they are active at night and prefer dark
roosting sites (Buys et al 2002 Rocha et al 2013) Lucati amp Loacutepez Baucells (2016) states
that aberrant individuals roosting in sheltered places such as caves mines and buildings
may have greater survival rates than the one roosting in the open leaves Here we found the
leucistic Indian Flying Fox roosting in the open leaves and is likely to be vulnerable to
predation
Albinism is one of the most commonly occurring colour aberrations in bats (Lucati amp Loacutepez
Baucells 2016) In the family Pteropodidae albinism has been reported in Cynopterus sphinx
AMIN ET AL Record of Leucism in Indian Flying Fox
Prithivya | August 2021 15
from Nepal (Anonymous 2013) Lissonycteris angolensis from Uganda (Neal 1971) and
Rousettus leschenaultia from India (Karim 1983) while piebaldism is reported in Rousettus
amplexicaudatus from Philippines (Anonymous 2012) However another such colour
aberration leucism is not yet reported from the family Pteropodidae In this regard our report
of leucism in Pteropus giganteus can be the first of its kind in the entire range of its
distribution
Today bats in India face the harsh reality of declining habitats and resources ultimately
making them disappear altogether (Graham 2001 Tsang 2020) and the peoplersquos perception
regarding the presence of bats in their surroundings for different myths These facts raise an
urgent need to protect bats throughout the world by studying more about their behaviour and
ecology Further studies on Pteropus giganteus from Gujarat are mainly sighting reports
(Mahato et al 2012) and on roosting sites (Vyas amp Upadhyay 2014) Due to the lack of
information on colour aberration in the family Pteropodidae this report can add importance
to bat biologists
Acknowledgement
We are thankful to Dhaivat Patel and Vivek Patel for assisting us in fieldwork
References
Abreu M S L Machado R Barbieri F Freitas N S amp Oliveira L R 2013 Anomalous
colour in Neotropical mammals a review with new records for Didelphis sp
(Didelphidae Didelphimorphia) and Arctocephalus australis (Otariidae Carnivora)
Brazilian Journal of Biology 73 185ndash194
Anonymous 2012 Monfort Bat Sanctuary Blanca Bella Website
httpwwwmonfortbatsanctuaryorgblanca-bellac12m [Accessed 20 October
2019] Anonymous 2013 SMCRF (Small Mammals Conservation amp Research
Foundation) Website httpwwwsmcrforgindexphp [Accessed 20 October
2019]
Bastawade D B amp Mahabal A 1976 Some behavioural aspects of the Indian flying fox
Pteropus giganteus giganteus Bio-Vigyanam 2 209ndash212
Bates P J J amp Harrison D L 1997 Bats of the Indian Subcontinent Harrison Zoological
Museum Publication UK 258pp
Bates P J J Harrison D L amp Muni M 1994 The bats of western India Part 1 JBNHS
AMIN ET AL Record of Leucism in Indian Flying Fox
Prithivya | August 2021 16
91 (2) 1ndash15
Buys J Heijligers H amp Dorenbosch M 2002 First record of an albino long-eared bat
Plecotus auritus in The Netherlands Lutra 45 49ndash52
Caro T 2005 The adaptive significance of coloration in mammals BioScience55 125ndash136
Graham G L 2001 Bats of the World St Martinrsquos Press New York New York
160pp Hofreiter M amp Schoneberg T 2010
The genetic and evolutionary basis of colour variation in vertebrates Cellular and Molecular
Life Science 67 2591ndash2603
Johnsingh A J T amp Manjrekar N (eds) 2013 Mammals of South Asia Volume 2
Universities Press (India) Private Limited Telangana India pp 545ndash547
Karim K B 1983 A note on an albino Rousettus leschenaulti Bat Research News 24 39ndash
40
Lucati F amp Loacutepez Baucells A 2016 Chromatic disorders in bats a review of pigmentation
anomalies and the misuse of terms to describe them Mammal review 47(2) 112ndash123
Mahabal A Sharma R M Patil R N amp Jadhav S 2019 Colour aberration in Indian
mammals a review from 1886 to 2017 Journal of Threatened Taxa 11(6) 13690ndash
13719 Mahato A K R Kumar V V amp Patel N 2012 Indian flying fox in
Hamirsir Lake Bhuj city needs conservation attention Current Science 103(4)
354ndash355
Menon V 2014 Indian mammals a field guide Hachette India pp 386 Tsang SM
2020 Pteropus giganteus (errata version published in 2021) The IUCN Red List of
Threatened Species 2020 eT18725A194134899
httpsdxdoiorg102305IUCNUK2020-3RLTST18725A194134899en
Downloaded on 10 April 2021
Neal E 1971 Uganda Quest Collins London UK
Nordlund J J Boissy R E Hearing V J King R A Oetting W S amp Ortonne J P
(Eds) 1998 The pigmentary system physiology and pathophysiology Oxford
University Press New York
Prater S H 1971 The Book of Indian Animals (Revised) Bombay Natural History Society
Bombay pp 200ndash201
Rocha P A Feijo J A Donato C R amp Ferrari S F 2013 Leucism in Sebarsquos short-
tailed bat Carolliaperspicillata (Linnaeus 1758) from a rock shelter in northeastern
AMIN ET AL Record of Leucism in Indian Flying Fox
Prithivya | August 2021 17
Brazil Chiroptera Neotropical 19 1151ndash1153
Rook A Wilkinson D S Ebling F J B Champion R H amp Burton J L 1998
Textbook of Dermatology 6th edn Blackwell Science Boston Massachusetts USA
Saikia U 2018 A review of chiropterological studies and a distributional list of the
bat fauna of India Records of the Zoological Survey of India 118(3) 242ndash280
Srinivasulu C amp Srinivasulu B 2012 South Asian mammals their diversity distribution
and status Springer Science amp Business Media
Srinivasulu C Racey P A amp Mistry S 2010 A key to the bats (Mammalia Chiroptera)
of South Asia Journal of Threatened Taxa 2(7) 1001ndash1076
Uieda W 2000 A review of complete albinism in bats with five new cases from Brazil Acta
Chiropterologica 2 97ndash105
Van Grouw H 2006 Not every white bird is an albino sense and nonsense about colour
aberrations in birds Dutch Birding 28(2) 79ndash89
Van Grouw H 2013 What colour is that bird British birds 106 17ndash29
Vendan S E 2003 Roost and diet selection in the Indian Flying Fox Pteropus giganteus
(Mega chiroptera) MSc Thesis Madurai Kamaraj University India 85pp
Vyas R amp Upadhyay K 2014 Study of the Indian Flying Fox (Pteropus giganteus)
Colonies of Jambughoda Wildlife Sanctuary Gujarat India Record of the largest
roosting congregation at Targol Small Mammal Mail 6(1) 2ndash8
Suggested citation
Amin S Patel H and Vaghela P (2021) Record of Leucism in Indian Flying Fox Pteropus
giganteus (Mammalia Chiroptera Pteropodidae) from South Gujarat India Prithivya An
Official Newsletter of WCB Research Foundation and WCB Research Lab Vol 1(2) 12-17
THAKKAR amp GOHIL Birds behaviour during the Annular solar eclipse
Prithivya | August 2021 18
Notes on behavioural observation of some water birds during the Annular Solar
Eclipse
Thakkar Karan and Gohil Bharatsinh
Department of Life Sciences Maharaja Krishnakumarsinhji Bhavnagar University
Bhavnagar-364001 Gujarat India E-mail ksonpal07gmailcom
Abstract
In this communication we report the behaviour of various water birds observed during the annular
solar eclipse which happened on 26th November 2019 We observed the behaviour of eight species of
birdsrsquo viz Greater Flamingoes Phoenicopterus roseus the Indian Cormorant Phalacrocorax
fuscicollis Pied Avocet Recurvirostra avosetta Black-winged stilt Himantopus himantopus Eurasian
spoonbill Platalea leucorodia Northern shoveler Spatula clypeata Little grebe Tachybaptus
ruficollis and Dalmatian pelican Pelecanus crispus throughout the eclipse period ie from 805 AM
to 1051 AM Various behavioural chan`ges were observed in all the targeted species except the
Indian cormorant It rested on a pole for the whole eclipse period Detailed observations are given in
the note Reduction in light levels due to solar eclipse does affect the activity of birds
Key Words Solar Eclipse Behaviour Birds Bhavnagar
An annular solar eclipse was visible from 805 to 1051 AM on 26 December 2019 in India
Solar eclipse a rare and uncommon environmental event can influence and modulate the
behaviour of animals (Murdin 2001 Gil-burmann amp Beltrami 2003) Following observations
were made during the eclipse at airport Road Lake (21762837deg N 72183624deg E) in
Bhavnagar city using Nikon binoculars (1050)
Greater flamingos (n=24) on the day of the eclipse were seen foraging constantly from 805-
920 AM All of them started calling together from 921 to 935 AM After the peak of the
eclipse (ie after 921 AM) many flamingo individuals started preening Activities of Indian
cormorants varied throughout the eclipse period Pied avocets (n=13) were observed feeding
through the initial phase of the eclipse ie from 805 to 850 AM But pied avocets went onto
the resting phase from 851 to 935 AM Eight of them continued resting even after 935 AM
while the other five started feeding again Black-winged stilts (n=50) were seen resting in a
flock throughout the study period But as the eclipse increased flocks of black-winged stilts
from outside the lake started arriving and joined the original flock of 50 A group of five
black-winged stilts arrived at 852 followed by a flock of 20 at 906 AM Three other groups
of 30 50 and 10 black-winged stilts arrived from 921 to 935 AM Eurasian spoonbills
(n=30) were seen resting in water during the initial stage of eclipse ie from 808 to 920
AM From 921 to 935 AM five spoonbills started feeding 21 continued resting while 12
THAKKAR amp GOHIL Birds behaviour during the Annular solar eclipse
Prithivya | August 2021 19
started vocalizing and four flew away from the lake After 935 AM 12 individuals
continued calling 29 rested in water whereas eight individuals arrived from outside the lake
Activities of northern shoveler (n=80) varied throughout the eclipse Little cormorant (n=1)
rested on a pole for most of the observation It started feeding at 921 to 935 AM along with
one little cormorant which arrived from somewhere outside the lake After 935 both
perched at the wood in the lake Little grebe (n=1) spent most of the time feeding Between
935 and 950 AM it was joined by a flock of eight grebes that arrived from outside the lake
Pelicans (n=2) rested on a small patch of land in the lake throughout the study period
Table 1 Ethogram
Bird
Time intervals
0805-
0820
0821-
0835
0836-
0850
0851-
0905
0906-
0920
0921-
0935
0936-
0950
Greater
flamingo FD(n=24) FD(n=24) FD(n=24) FD(n=24) FD(n=24) C(n=24)
PR(n=4)
FD(n=17)C
(n=3)
Indian
Cormorant Rp(n=2) Rp(n=2)
Fi(n=2)
FD(n=4)
Rp(n=2)Fb
(n=2) Rp(n=1) Rp(n=1)Fb(n=1) _
Pied
Avocet FD(n=13) FD(n=13) FD(n=13) Rw(n=13) Rw(n=13) Rw(n=13)
FD(n=5)R
w(n=8)
Black
winged stilt Rw(n=50) Rw(n=50) Rw(n=50)
Rw(n=50)F
i(n=5)
Rw(n=55)
Fi(n=20)
Rw(n=75)
Fi(n=30)
Fi(n=50) Fi(n=10) Rw(n=165)
Eurasian
Spoonbill Rw(n=30) Rw(n=30)
Rw(n=30)
FD(n=4) Rw(n=34) Rw(n=34)
FD(n=5)C(n=12)
Fo(n=4)
Rw(n=21)
Fi(n=8)
C(n=13)
Rw(n=29)
Northern
Shoveler
PR(n=10)
Rl(n= 50)
Rw(n=20)
Rl(n= 50)
Rw(n=20)
PR(n=4)
Rw(n=50)
Rl(n=10)
Rw(n=54)
Rl(n=10)
FD(n=5)
Rw(n=54)
Rl(n=5)
Rw(n=54)
Rl(n=10)
Rw(n=54)
Rl(n=10)
Little
Cormorant Rp(n=1) Rp(n=1) Rp(n=1) Rp(n=1) Rp(n=1) FD(n=1) Fi(n=1) Rp(n=2)
Little grebe Rw(n=1) FD(n=1) FD(n=1) FD(n=1) FD(n=2) Fi(n=8)FD(n=10) FD(n=18)
Dalmatian
pelican Rl(n=2) Rl(n=2) Rl(n=2) Rl(n=2) Rl(n=2) Rl(n=2) Rl(n=2)
THAKKAR amp GOHIL Birds behaviour during the Annular solar eclipse
Prithivya | August 2021 20
Table 2 Different type of behaviours observed in bird species
BEHAVIOURS
FD Feeding
R Resting
Rp resting on an object prolonged perching on a pole or a stick in water
Rl resting on land simply sitting or standing with no noticeable movement
Rw resting in water no efforts for movement and neck resting on body(in case of ducks)
F Flight
Fb taking off from place A within a lake and settling at place B within a lake
Fa taking off from place A within a lake and settling at same place
Fo taking off from within lake and flying outside the lake
Fi arrived at lake from outside the lake
PR Preening
C Calling making some kind of voice could either be begging call roosting call or some other
B Bathing Rapid action of submerging in water and coming out
Kumar S (1981) observed the changes in the activity of cattle egrets because of the solar
eclipse Trigunayat (1997) observed that roosting Black-crowned Night-herons altered a
variety of behaviours including increased calling preening and perch shifting Nanikov et
al (2001) also mention behavioural changes in several birds due to solar eclipse A similar
trend was observed in this study as well From these limited field observations we can
conclude that reduced light level due to annular solar eclipse does interrupt normal bird
behaviour patterns
Acknowledgements
The first author is very thankful to Mr Dhavalkumar Vargiya for his kind support and
encouragement in the preparation for this article
References
Altmann J 1974Observational Study of Behavior Sampling MethodsBehaviour 49(34)
227-267 Retrieved on March 23 2020 from wwwjstororgstable4533591 bull Gil-
Burmann C Beltrami M 2003 Effect of the solar eclipse on the behavior of a
captive group of hamadryas baboons (Papio hamadryas) Zoo Biology 22 299ndash303
Kumar S 1981 Solar eclipse ndash notes on behavior of egrets J Bombay natural history
society78 3 133-136
Murdin P 2001 Effects of the 2001 total solar eclipse on African wildlife Astronomy
THAKKAR amp GOHIL Birds behaviour during the Annular solar eclipse
Prithivya | August 2021 21
Geophysics 42 40ndash42
Nankinov D Dalakthieva S Nikolov B Shurulinkov P Popov K Kirilov S Zareva
K Borisov B Stojanov G Nankinov N Minchev N Kjichukov D Nikolov I
Stanchev R Ganchev E 2001Studying the behaviour of birds during the solar
eclipse on August 11 1999 mdash Russian Ornithological Journal 142 355-369
Trigunayat M M 1997 Some behavioral observations on Night Heron Nycticorax
nycticorax (Linnaeus) during the total solar eclipse in Keoladeo National Park
Bharatpur IndiaPavo 3561ndash65
Tramer E J 2000 Bird Behavior During a Total Solar Eclipse The Wilson Bulletin 112(3)
431ndash432
Suggested citation
Thakkar K and Gohil B (2021) Notes on behavioural observation of some water birds during the
Annular Solar Eclipse Prithivya An Official Newsletter of WCB Research Foundation and WCB
Research Lab Vol 1(2) 18-21
MARJADI D Restoration of Earth with Biobased Polymer
Prithivya | August 2021 22
Restoration of Earth with Biobased Polymer
Marjadi Darshan
Shree Ramkrishna Institute of Computer Education amp Applied Sciences MTB Campus
Athwalines Surat-395001
E-mail darshanmarjadisrkiacin
Humanity is facing increasingly numerous challenges in life despite the great advancements
in science and technology over the last century All the needs of modern society eg food
fuel energy and materials are highly dependent on diminishing fossil resources The
demand for creating and using plastic throughout the world driven by the increasing usage of
plastic-based materials has been increasing and adding stress to the current waste
management infrastructures There is significant interest to decrease the reliance on
petroleum-based plastic products which causes global environmental pollution The
advancement in science and technology has enabled mankind to live longer and consume
more of the worlds resources More than eight million tons of plastic waste leak into oceans
every year which can be eased through innovative redesigns of packaging materials
Issues such as global climate change and depletion of fossil fuels both resulting from the
increased usage of energy have triggered alarms among scientists and politicians worldwide
Therefore governments industries and academia are inputting much effort towards finding a
sustainable solution for the increasing energy crisis However a similar concerted effort is
still lacking to bring about the creation and usage of sustainable materials in the modern
lifestyle In addition to the increasing demand for energy the usage of materials in the
modern lifestyle has also been increasing rapidly Considering the widespread usage of
plastics in food packaging clothes shelter communication transportation construction
health care and leisure industries plastics are the most dependable material among the other
materials that mankind is currently dependent upon Currently most of the plastics that are
widely used in various sectors are produced from petrochemical products The plastic
industry has been among the most profitable businesses and is expected to grow further
especially because of their increased demands from rapidly developing countries like India
and other parts of South-East Asia While plastics are superior materials in terms of their
production costs and diverse properties the sustainability of this synthetic material is
undoubtedly an issue that needs to be addressed Biobased and biodegradable polymeric
materials are considered amongst the most suitable alternatives for some applications The
MARJADI D Restoration of Earth with Biobased Polymer
Prithivya | August 2021 23
excessive usage of petroleum also contributes to the increased emission of CO2into the
atmosphere which is thought to be among the principal reasons for global warming and
climate change These are some of the strong and valid reasons leading towards the
development of technologies to produce biobased and biodegradable plastics
Science and technology have created the modern lifestyle that mankind is living in which
efficiency is the keyword Drawing an analogy from a bacterial culture in a shaken flask the
depletion of nutrients and the simultaneous accumulation of toxic wastes are the main
reasons for the onset of the stationary growth phase and the subsequent death phase
However unlike bacteria mankind is aware of the consequences of such activities As a
result the world population is now concerned about sustainable development
Biobased and biodegradable plastics most likely to remain less superior in terms of
production cost and material properties compared to petrochemical plastics Petroleum-based
plastics have serious environmental and social impacts due to their non-degradable nature
and the leaching of carcinogenic substances like dioxin when exposed to scratch or heat
Compared to the ease at which fossil resources are utilized renewable biobased materials
will need more effort and efficiency to be used in daily life However biobased materials are
considered superior in terms of sustainability and environmental friendly provided that they
are used judiciously and in a contented manner Hence it is in our hands to utilize our
knowledge of the environment to work towards the restoration of the earth and make it free
from single-use plastics
Suggested citation
Marjadi D (2021) Restoration of Earth with Biobased Polymer Prithivya An Official
Newsletter of WCB Research Foundation and WCB Research Lab Vol 1(2) 22-23
PATEL amp PATEL Single-use surgical mask
Prithivya | August 2021 24
Single-use surgical mask Human lifesaver or Biodiversity destroyer
Patel Jeel1 and Patel Rushika2 3
1GMERS Sola Civil Medical College Ahmedabad-380008 (Gujarat) India 2Assistant Professor Rai University Dholaka Ahmedabad-380008 (Gujarat) India 3Fellow Wildlife and Conservation Biology Research Foundation Pata-384265 (Gujarat)
India
E-mail rush2907gmailcom
The green lines represent sustainable and biodiversity conservation ways The dark brown
lines represent possible threats of single-use surgical mask to the biodiversity
Key Words Disposable mask Plastic and micro plastic pollution Conservation Threats
The COVID-19 is transmitted by respiratory droplets or aerosols and can survive in the air
for more than 24 hrs which was detected and momentarily created a pandemic situation
globally The only way to stop the transmission is to wear face mask washing hands
frequently and to maintain social distance Wearing a mask is declared as one of the
important precautionary measures by the World Health Organization (WHO) and
policymakers in every country because masks help in the significant reduction of infection
caused by touching the facemouthnose with contaminated hands (Schmutz et al 2020) The
virus COVID19has increased the demand for the surgical single-used mask in the healthcare
professionals as well as among the community Such masks are made up of polypropylene or
PATEL amp PATEL Single-use surgical mask
Prithivya | August 2021 25
high-density polyethylene (HDPE) a fossil-derived plastic which has a very high half-life
(Dharmaraj et al 2021)The mask production to the disposal statistics is presented in Table 1
Based on the reusability the mask is divided into two major groupsrsquo disposable (made up of
polymers) and reusable mask (made up of cloth material) in terms of production In present
study the details of only disposable mask is presented
Calculated based on the global entries of masks and gloves mentioned (200 millionmonth)
The average of one mask and single glove weight is 225plusmn001
Mask a threat to the ecosystem
In current situation recycling of any household medical waste is not a feasible and advisable
solution as there is a chance that it may be exposed to infectious particles There are no
particular laws or guidelines for separation and segregation which might involve several
issues Globally the dumping of masks was observed in areas such as roadside river oceans
and several open areas Usually such masks sustain in the environment for a longer period of
time (more than 400 years)(Hasan et al 2021) The misconception of masks to various birds
animals and marine creatures considering as a food and leads to trapping and entangling in
the strips of masks The single-use surgical mask not only adds litter to the environment but
No Statistics Reference
1 Estimated worldwide usage of disposable mask 129
billionmonth
Prata et al 2020
2 Production in China as on Feb 2020 116 millionday Adyel 2020
3 Order of mask in Japan as of April 2020 over 600
millionmonth
Fadare and Okoffo
2020
4 Mask disposal in the UK 53 millionday Website URL 1
5 Gloves and mask entered into the environment 200
millionmonth
Website URL 2
6 Mask reached to oceans 15 billion
Marine plastic pollution increased in last year 6200 tonnes
Website URL 3
7 Mask waste generation in India Minimum 928week
Maximum 4640week
Selvaranjan et al 2021
8 Plastic footprint in the environment due to mask and gloves
45times105 KgMonth
Present Study
Table 1 Global mask production usage and disposable statistics
PATEL amp PATEL Single-use surgical mask
Prithivya | August 2021 26
also hurting and killing a wide range of terrestrial and marine living organisms Moreover
the production process of such masks also releases greenhouse gases (Prata et al 2021) The
disposal of mask also reported as a novel source of micro plastic pollution in the environment
and entry point of the food chain (Hasan et al 2021) The single-use surgical masks are also
noted as a major causative agent of secondary disease outbreaks in all life forms including
humans (Fadare and Okoffo 2020) India does not have any sufficient resources for the
household medical waste management (Prata et al 2021) Every minute 10 kg of disposed
masks and gloves entered into the environment (Table 1)Hence it is very important to deal
with the mentioned issues and look into more sustainable sources at individual level
Herewith we suggest some measures by which we can protect the environment without
compromising human health in current pandemic situation
Snip the strips of the masks before the disposal to avoid the entangling and entrapping
issues
Dispose masks as a separate medical waste and submit it to plastic recycling
companies
Moving towards the development of biopolymer mask (Torres and Torre 2021)
Biopolymer mask were made up of gluten and nanofibers having 95 efficiency
A reusable mask could be applied in routine life for the general community Regular
cloth masks having multi-layer of high thread-count and textiles are moderately
effective and reported to block 50-70 fine droplets and particles Reusable masks
help in the reduction of waste production (85 ) Moreover economically viable
option in a country like India as it is 37 times cheaper than other masks (Prata et al
2021)
References
Adyel T M 2020 Accumulation of plastic waste during COVID-19 Science 396(6509)
1314ndash1315 httpsdoiorg101056nejmms2004740
Dharmaraj S Ashokkumar V Hariharan S Manibharathi A Show P L Chong C T
ampNgamcharussrivichai C 2021 The COVID-19 pandemic face mask waste A
blooming threat to the marine environment Chemosphere Elsevier Ltd
httpsdoiorg101016jchemosphere2021129601
Fadare O O ampOkoffo E D 2020 Covid-19 face masks A potential source of
microplastic fibers in the environment Science of The Total Environment 737
140279 httpsdoiorg101016jscitotenv2020140279
PATEL amp PATEL Single-use surgical mask
Prithivya | August 2021 27
Hasan N A Heal R D Bashar A amp Haque M M 2021 Face masks protecting the
wearer but neglecting the aquatic environment - A perspective from Bangladesh
Environmental Challenges 4 100126 httpsdoiorg101016jenvc2021100126
Prata J C Silva A L P Duarte A C amp Rocha-Santos T 2021 Disposable over
Reusable Face Masks Public Safety or Environmental Disaster Environments 8(4)
31 httpsdoiorg103390environments8040031
Schmutz M Hischier R Batt T Wick P Nowack B Waumlger P ampSom C 2020
Cotton and surgical masksmdashwhat ecological factors are relevant for their
sustainability Sustainability (Switzerland) 12(24) 1ndash13
httpsdoiorg103390su122410245
Selvaranjan K Navaratnam S Rajeev P ampRavintherakumaran N 2021 Environmental
challenges induced by extensive use of face masks during COVID-19 A review and
potential solutions Environmental Challenges 3 100039
httpsdoiorg101016jenvc2021100039
Torres F G amp De-la-Torre G E 2021 Face mask waste generation and management
during the COVID-19 pandemic An overview and the Peruvian case Science of the
Total Environment 786 147628 httpsdoiorg101016jscitotenv2021147628
Website URL 1 httpswwwgreenpeaceorguknewssingle-use-face-masks-hurting-
wildlife-what-you-can-do [Accessed on 23rd June 2021]
Website URL 2 httpswwwgreenmatterscompface-masks-wildlife [Accessed on 23rd June
2021]
Website URL 3 httpseconomictimesindiatimescomnewsenvironmentecosystem-under-
threat-as-birds-and-marine-life-ensnared-in-discarded-face-maskswidespread-
contaminationslideshow80230026cms [Accessed on 23rd June 2021]
Suggested citation
Patel J and Patel R (2021) Single-use surgical mask Human lifesaver or Biodiversity destroyer
Prithivya An Official Newsletter of WCB Research Foundation and WCB Research Lab Vol 1 (2)
24-27
PITHVA amp DHARAIYA Perception of forest staff about wildlife
Prithivya | August 2021 28
Does the contemplation of forest field staff about wildlife differ than a common man
Pithva Krishna1 2 and Dharaiya Nishith1
1 Wildlife and Conservation Biology Research Lab Hemchandracharya North Gujarat
University Patan (Gujarat) India 2Institute of Environment Education and Research Bharati Vidyapeeth Deemed University
Pune India
E-mail krishnapithva17gmailcom
Introduction
A field-based training was organized by Vadodara wildlife division Gujarat forest
department and WCB Research Lab of Hemchandracharya North Gujarat University from
September 17th to 19th 2020 with the aim to enhance the capacity of forest field staff for
monitoring and rescue of sloth bear and associated fauna The training was organized at
Jambughoda wildlife sanctuary Central Gujarat Along with the awareness about sloth bear
a small survey was carried out to understand how the field staff envisages the wildlife that is
found in their work place Total 18 frontline forest staff of different cadre such as beat guards
and round foresters from different forest ranges of central Gujarat has participated in this
survey
This study provides an insight on how
forest staffrsquos perception differs in different
animals As Q method provides qualitative
and quantitative data which helps
identifying peoplersquos perception in detail As
participants have to provide justification of
their answers it reveals some underlying
conflicts or reasons These justifications of
participants can help identify the gaps and
can be better used for conservation planning
as well as capacity building of forest field
staff
Figure 1 Forest frontline staff organizing
photos on Q Board copy Nishith Dharaiya
PITHVA amp DHARAIYA Perception of forest staff about wildlife
Prithivya | August 2021 29
Methodology
We used Q methodology for this study this method is designed and developed by William
Stephenson in 1930s (McKeown amp Thomas 1988)and allows to disclose underlying reasons
This method is widely used in social sciences studies In this method photos were used
instead of statements to know respondentrsquos perception allowing them to justify their answer
in detail without any restriction This method allows both qualitative and quantitative data on
perception of the person being interviewed
We categorised the Q Method into two parts first organising 16 photos of locally found
animals on a Q-board (figure 1(b)) followed by explanation for each photo which are placed
on Q-board by the respondent As shown in the figure 1(a) the participants were asked to
organise photos in Q- board as per their liking and disliking towards the animals and to
provide reasons which were recorded in mobile phone devise A list of all the wildlife photos
used for this survey is provided in table 1
-3 -2 -1 0 +1 +2 +3
Negative Positive Neutral
Figure 1(a) Representative sort of organized Q-
board by a participant
Figure 1(b) A Q-board on which the
respondents organize the photos
PITHVA amp DHARAIYA Perception of forest staff about wildlife
Prithivya | August 2021 30
Photo
ID
Common name Scientific name
1 Wild boar Sus scrofa
2 Hanuman langur Semnopithecus entellus
3 Indian cobra Najanaja
4 Indian giant flying squirrel Petauristaphilippensis
5 Small Indian civet Viverricula indica
6 Sloth bear Melursus ursinus
7 Indian hare Lepus nigricollis
8 Indian python Python molursus
9 Barn owl Tyto alba
10 Grey francolin Francolinuspondicerianus
11 Red-wattled lapwing Vanellus indicus
12 Rhesus macaque Macaca mulatta
13 Black kite Milvus migrans
14 Common krait Bungarus caeruleus
15 Indian crested porcupine Hystrix indica
16 Blue bull Boselaphustragocamelus
Q sort analysis
In this study three factors were derived based on participantrsquosjustification which is explained
in detail in the result section A factor in this study is a category representingthe group of
people who have similar perspective(Brown 1980) The higher the factor loading the more
highly that sorts are correlated with that factor (Ramlo 2008 Ramlo amp Newman 2011)The
sorts refer to the photos assembled by participants on Q-board (figure 1(b))In order to
analyse the data a software PQMethod(httpschmolckorgqmethod)was used which is
specially designed for Q-analysis Q sorts are the number of participants that took part in the
survey All the data were entered manually in this software and correlation was calculated
among each sort The correlation matrix for the extracted factor was analysed through a
principal component factor analysis with varimax rotationfor which options are provided in
the software (figure 2)
Table 1 Photos of wildlife used for this study
PITHVA amp DHARAIYA Perception of forest staff about wildlife
Prithivya | August 2021 31
Results and Discussion
The three factors that emerged
are shown in Table 2 with
automatic pre-flagging
Participants having similar
perceptions are put together in
their respective factors and
marked in bold and have ldquoXrdquo
next to their score Out of 18
sorts 17 sorts were found
complete by the software and
were further analysed Each of
three factors represents a different perspective towards the photos provided to them
Participants were named as PART001 PART002 and so on to keep their identity unrevealed
In table 2 there are 8 participants belonging to factor 1 with 29 of the variance explained
followed by 7 participants in factor 2 having 26 explained variance and 2 participants
belonging to factor 3 with 14 explained varianceOnce factor score calculated by the
software distinguishing tables were developed in this analysis for each factor which differ
from each other that is explained further in this section The distinguishing tables for each
factor explains differences between factors(Brown 1971 Ramlo amp Newman 2011 Brown
1993)In order to determine distinguishing statements average Z-score of respondentrsquos factor
score was calculated by the software
Figure 2 Screenshot of analytical option available in PQM
method Software
PITHVA amp DHARAIYA Perception of forest staff about wildlife
Prithivya | August 2021 32
Table 2 Extracted factor score from Q-sorts
Q-Sorts ID Factor 1 Factor 2 Factor 3
1 PART001 08530X 01248 -01223
2 PART002 00414 08084X 01708
3 PART003 06945X 00471 03983
4 PART004 07683X 01839 -00156
5 PART005 05450X 00166 02332
6 PART006 04208 07241X 04006
7 PART007 01728 01377 09013X
8 PART008 06930X 05214 03237
9 PART009 06516X 04289 04265
10 PART010 05119 06142X 00921
11 PART011 08475X -00072 -02626
12 PART012 03742 -05333 04456
13 PART013 00481 08292X 03240
14 PART014 -00002 06395X -03574
15 PART015 06577X 02179 01940
16 PART016 -00614 01991 06372X
17 PART017 04469 07611X 01835
18 PART018 05679 07564X 01465
Explained variance 29 26 14
Note number in bold shows respondents belong to those respective factors
Table 3 shows different factor score for each animal photo and depending on statistical
significance the photo load to a specific factor The above table contains 16 photos and their
grid position for all three factors (perception table 2) For example Indian python was
disliked by participants therefore it is scored at -2 for respondents grouped under factor 1 +1
for factor 2 andfor factor 3 it was scored at +2 For factor 1 the most liked species by
participants is Indian hare and most disliked species is wild boar Most liked species for
factor 2 is Indian leopard and most disliked animal is fruit bat For factor 3 most liked
species is Indian hare scored at +3 and most disliked species is wild boar scored at -3 by the
participants
PITHVA amp DHARAIYA Perception of forest staff about wildlife
Prithivya | August 2021 33
Table 3 Aggregate factor values of each 16 photos
Aggregate values
No Photos Factor 1 Factor 2 Factor 3
1 Indian python -2 1 2
2 Hanuman langur 0 0 2
3 Monitor lizard -1 -2 -1
4 Red-wattled lapwing 1 -1 1
5 Sloth bear 2 2 0
6 Indian hare 3 1 3
7 Leopard 2 3 0
8 Grey francolin 1 -1 -1
9 Indian giant flying squirrel 1 1 -2
10 Blue bull 0 0 0
11 Small Indian civet 0 0 -1
12 Fruit bat (Flying fox) -1 -3 -2
13 Indian cobra -2 2 1
14 Barn owl 0 0 0
15 Indian chameleon -1 -1 0
16 Wild boar -3 -2 -3
Factor 1 Economic impact
This factor was described by 8 participants mainly concerning economic impact Animals
that cause harm economically by destroying crops and threat to human life and livestock
Participants of factor 1 thinks fruit bat Indian python and Indian cobra causes high level of
economic harm Grey francolin is scored +1 due to its contribution to reduce impact by eating
pest insects from agricultural field Though the most disliked animal is wild boar for factor 1
as shown in table 3
PITHVA amp DHARAIYA Perception of forest staff about wildlife
Prithivya | August 2021 34
Table 4 Distinguishing photos for factor 1
Factor 2 Aesthetic spiritual values and conservation aspects
This factor explains aesthetic spiritual values and conservation aspects which includes
appearance tourist attraction rehabilitation and religious belief There are 7 responses in this
factor (table 2) Respondents are observed to have negative opinions towards animals which
play major role in economic loss but positive towards animalrsquos beauty and its natural
charisma Table 5 shows how score of animals for factor 2 is different from the score of
factor 1 and factor 3 For example Indian cobra is scored at +2 in factor 2 as it is attractive to
participants but it is scored -2 for factor 1 as it threatens human life
Table5 Distinguishing photos for factor 2
Photo
ID Photos
Grid
position
for
Factor 1
Z-score
of
Factor 1
Grid
position
for
Factor 2
Z-score
of
Factor 2
Grid
position
for
Factor 3
Z-score
of
Factor 3
13 Indian cobra -2 -119 2 127 1 037
6 Indian hare 3 148 1 067 3 189
1 Indian python -2 -103 1 034 2 122
4 Red-wattled
lapwing 1 014 -1 -065 1 079
16 Wild boar -3 -189 -2 -125 -3 -201
Photo
ID Photos
Grid
position
for
Factor
1
Z-score
of
Factor
1
Grid
position
for
Factor
2
Z-score
of
Factor
2
Grid
position
for
Factor
3
Z-score
of
Factor 3
8 Grey francolin 1 095 -1 -046 -1 -067
12 Fruit bat (Flying -1 -02 -3 -182 -2 -11
1 Indian python -2 -103 1 034 2 122
13 Indian cobra -2 -119 2 127 1 037
PITHVA amp DHARAIYA Perception of forest staff about wildlife
Prithivya | August 2021 35
Factor 3 Lack of awareness
This factor describes lack of awareness which includes lack of interest compared to other
animals and species This factor mainly concerns individuals who lacks knowledge proper
information and are not aware about the species For example in table 6 the score of Indian
giant flying squirrel differs from factor 3 to factor 1 and 2 as it is scored at -2 +1 and +1
respectively The justification for negative score given by the participants is that they are not
aware about the presence of the species therefore they do not have any information on the
species
Table 6 Distinguishing photos for factor 3
Photo
ID Photos
Grid
position
for
Factor 1
Z-score
of
Factor
1
Grid
position
for
Factor 2
Z-score
of
Factor
2
Grid
position
for
Factor 3
Z-score
of
Factor 3
1 Indian python -2 -103 1 034 2 122
2 Hanuman langur 0 -02 0 -045 2 110
13 Indian cobra -2 -119 2 127 1 037
5 Sloth bear 2 138 2 135 0 -000
7 Leopard 2 133 3 181 0 -000
9 Indian giant flying
squirrel 1 096 1 062 -2 -122
Conclusion
The perception of forest field staff was better understood using Q method analysis
considering various aspects It is seen that participants tend to like animals such as Indian
leopard sloth bear Hanuman langur and Indian hare as they are scored positive or neutral
The animals that are not given negative score in any factor due to their appearance are seen
frequently and does not lack awareness It is observed from the data that frontline forest staff
lacks knowledge about animals that are not seen or present in their forest rangebeat As
frontline forest staff they should be aware about existence of animal species that are found in
Gujarat state along with their ecological importance threats and conservation values Some
participants were not even aware about the existence of the species in the wild such as Indian
giant flying squirrel Although being frontline forest staff their perception is biased towards
animals such as wild boar monitor lizard and flying fox bat due to the economic loss they
PITHVA amp DHARAIYA Perception of forest staff about wildlife
Prithivya | August 2021 36
may cause and weird appearance Their perception becomes the same as a common man
when every animal should be equal to frontline forest staff as it is their job to protect forest
and its animals Some participants believe in superstitions of bad luck of barn owl and
monitor lizard which shows their common man perception and lack of right information
Recommendations
A separate training or workshops should be organised by forest department focused on
animal species found in Gujarat This will help them enhancing their existing knowledge and
it will provide them with some scientific insights Having basic scientific knowledge will
help remove some barriers like superstitions and other beliefs Field trips should be organised
in different part of state to gain practical experience Team building activities should be
conducted between staff of different forest divisions
Acknowledgements
We are thankful to all the forest field staff who participated in this survey We also thank to
the Deputy Conservator of Forests Vadodara Wildlife Division of Gujarat Forest Department
and sincerely acknowledge the help from our research team members
References
Brown S R (1980) Political subjectivity applications of Q methodology inpolitical science
E Ramlo S and Newman I (2011) Q Methodology and Its Position in the Mixed-Methods
Continuum Operant Subjectivity 34(3) 172ndash191
McKeown B and Thomas D B (1988) Q Methodology SAGE Publications
R Brown S (1993) A Primer on Q Methodology Operant Subjectivity 16(34) 91ndash138
Ramlo S E (2008) Determining the various perspectives and consensus within a classroom
using Q methodology AIP Conference Proceedings 1064 179ndash182
httpsdoiorg10106313021248
Suggested citation
Pithva K and Dharaiya N (2021) Does the contemplation of forest field staff about wildlife differ
than a common man Prithivya An Official Newsletter of WCB Research Foundation and WCB
Research Lab Vol 1(2) 28-36
PANCHAL amp JHA Qualitative phytochemical analysis
Prithivya | August 2021 37
Qualitative phytochemical analysis of some medicinal plants (leaves) from the
surrounding area of Talod Taluka North Gujarat India
Panchal Mital and Jha Charumati
Department of Botany Smt Panchal Science college Talod ndash383215 North Gujarat India
E-mail mitalpanchal0gmailcom
Abstract
The tremendous biological variety of North-Eastern India has long been recognised Five medicinal
plants were chosen for this study Manilkara zapota (L) van Royen Manilkara hexandra (Roxb)
Dub Mangifera indica L Madhuca indica JF Gmel and Annona squamosa L The purpose of this
study was to look into the existence of Phytochemicals such as Alkaloid Amino acid Carbohydrate
Protein Glycoside Tannin Terpenoid Saponin Flavonoid and Steroids in the medicinal plants that
were chosen For the organic solvent extraction the Soxhlet apparatus was utilized Water acetone
and chloroform were utilised as solvents Our findings show that the examined plants crude aqueous
and organic solvent extracts contain medicinally relevant bioactive components justifying their usage
in traditional medicines for the treatment of various ailments
Key Words Qualitative phytochemical analysis Manikara zapota M hexandra Madhuka
indica Mangifera indica Annona squamosa
Introduction
Phytochemicals are non-nutritive substances Chemical compounds are produced naturally on
plants during metabolic processes and contain a wide range of proactive and disease-
preventive qualities These compounds are known to be produced by plants in order to defend
themselves Recent study has shown that they can also play a vital role in illness prevention
in humans Even some of these herbs have been used for millennia as traditional medicine
Most phytochemicals such as flavonoids carotenoids and polyphenols have antibacterial
action and can be used to treat infections The following plant species were studied
Manilkara zapota (L) van Royen M hexandra (Roxb) Dub Mangifera indica L Madhuca
indica JF Gmel and Annona squamosa L
Plants play a universal function in the treatment of sickness as seen by their use in every
major system of medicine regardless of philosophical foundation Plants are vital to the
pharmaceutical industry because they are a rich supply of pharmaceuticals and a vast
reservoir of chemical variety for drug development screening procedures The majority of the
medications mentioned in the Indian medicinal system are derived from plants
PANCHAL amp JHA Qualitative phytochemical analysis
Prithivya | August 2021 38
Medicinal plants have been used to treat disease all across the world for thousands of years It
is generally understood that some plants with active chemicals can limit microbial
development Plants ability to generate chemicals via secondary metabolism determines their
antimicrobial potency Secondary metabolites emerged as the most important class of
chemicals with a wide spectrum of antibacterial and antifungal properties When compared
to conventional fungicides used to inhibit microbial growth and survival these plant
chemicals have different structures and activities
Plants are a major source of Traditional medicine and can be used to cure a variety of
conditions with little adverse effects Traditional medical practises are not only beneficial in
the treatment of diseases but they also aid in the discovery of pharmaceutically active
compounds in plants which can aid in the commercial manufacture of pharmaceuticals From
ancient times the importance of plant diversification in health care has been extensively
recognised According to a literature review more than 50000 plant species have been
successfully employed for medical purposes globally with flowering plants accounting for
over 13 of these
Material and methods Plant collection and Identification
M zapota (L) van Royen M hexandra (Roxb) Dub M indica L M indica JF Gmel
and A squamosa L were among the plant species studied The plants were harvested from
the land in the Talod taluka in North Gujarat India The washed plant leaves were kept in for
drying after being cleaned with tap water around 2-3 times to evaporate the water content
With the use of a mechanical blender the sample was ground into a fine powder after drying
The powder is then kept in an airtight plastic container for future usage with adequate
labelling
Extraction technique
Extraction is the separation of inert plant tissue constituents from medicinally active plant
tissue constituents using a conventional extraction process Menstrum is a selective solvent
that is used to eliminate inert material and to obtain the curative part of the procedure through
therapy
PANCHAL amp JHA Qualitative phytochemical analysis
Prithivya | August 2021 39
Method and Plant extraction
Solvent extraction
The crude plant extract was made using the Soxhlet extraction method 10 gm of powdered
plant material was placed into a thimble and 300 ml of solvents were extracted separately
Acetone and chloroform were utilized as solvents In a syphon tube of an extractor the
extraction process continued for 24 hours until the solvent became colourless The extract
was then placed in a beaker The extract was then retained and cooked on a hot plate at 30- 40
degC until all of the solvent had evaporated The dried extract was stored at 4degC in a refrigerator
for future phytochemical investigation
Methods of phytochemical analysis
Alkaloid
Wagnerrsquos test A few drops of Wagners reagent were applied to 2mg of extract that had
been acidified with 15 percent vv hydrochloric acid The presence of alkaloids is indicated
by a yellow or brown ppt
Carbohydrates
Molischrsquos test 2mg of ethanolic extract was mixed with 10ml water filtered and
concentrated 2ml of conc sulphuric acid was added to these 2 drops of freshly prepared 20
alcoholic alpha-naphthol solution forming a layer below the mixture red-violet ring showing
the existence of carbohydrates that disappears when sufficient alkali is added
Amino acid
Ninhydrin test Boil for a few minutes 2ml Ninhydrin reagent + 2ml extract The production
of blue colour indicates the presence of amino acids
Steroids
Salkowski reaction 2mg of dry extract was combined with chloroform to the chloroform
layer sulphuric acid was gently introduced by the sides of the test tube The emergence of a
red colour indicated the presence of steroids
Tannin A few drops of a 5 percent wv Fecl3 solution were added to 1-2 ml of the ethanolic
extract Gallo tannins are shown by a green colour whereas pseudo tannins are indicated by a
brown colour
Flavonoids After mixing 2ml of each extract with a few drops of 20 sodium hydroxide a
bright yellow colour was seen A few drops of 70 dilute hydrochloric acid were added to
PANCHAL amp JHA Qualitative phytochemical analysis
Prithivya | August 2021 40
this and the yellow coloration disappeared The presence of flavonoids in the sample extract
is shown by the formation and disappearance of yellow colour
Saponins 6ml distilled water was added to 2 ml of each extract and rapidly shaken the
presence of saponin is indicated by the production of bubbles or persistent foam
Proteins adding 1 ml of 40 percent sodium hydroxide and a few drops of 1 percent copper
sulphate to 2ml of each extract The production of violet colour shows the presence of peptide
linkage molecules in the sample extract
Glycosides 05ml of glacial acetic acid and 3 drops of 1 aqueous ferric chloride solution
added in to 1ml of each extract The creation of a brown ring at the interface shows the
presence of glycosides in the sample extract
Terpenoids 1ml of each solvent is mixed with 05ml chloroform and a few drops of strong
sulphuric acid to produce a reddish-brown precipitate that confirms the presence of Terpenoid
in the extract
Table 1 Preliminary Phytochemical analysis
Class of
compounds
Manilkara
zapota
Manilkara
hexandra
Mangifera
indica
Madhuka
indica
Annona
squamosa AE CE WE AE CE WE AE CE WE AE CE WE AE CE WE
Alkaloid + + - + - - + + - + - - + - -
Amino acid - - - - - - - - - - - - - - -
Carbohydr
ate
+ + - + - + + - - - - - - - -
Protein - - + + - + + - + - - - - - +
Glycoside + - - + - + - - - - - + - - -
Tannin - - + - - - + + + + - + + + +
Terpenoid - + - - - - - - - - - + - - -
Saponin - + + + - + + - + + - + + - -
Flavonoid - + + - - + - - + - - + + - -
Steroid + - + - - + - - + - - - - - -
Where lsquo+rsquo = positive and lsquo-rsquo = negative
AE= Acetone extract CE= Chloroform extract WE= Water extract
Alkaloid carbohydrate glycoside and steroid are all found in Acetone extract of M zapota
leaves Chloroform extract of M zapota leaves contains alkaloid carbohydrate terpenoid
PANCHAL amp JHA Qualitative phytochemical analysis
Prithivya | August 2021 41
saponin and flavonoid Protein Tannin Saponin Flavonoid and Steroid can be found in the
aqueous extract of M zapota leaves alkaloid carbohydrate protein glycoside and saponin
are all found in Acetone extract of M hexandra leaves All phytochemicals are missing in the
chloroform extract of M hexandra leaves Aqueous extract of M hexandra leaves contains
carbohydrate protein glycoside saponin flavonoid and steroid Alkaloid Carbohydrate
Protein Tannin and Saponin are all found in Acetone extract of M indica leaves Alkaloid
and Tannin are found in Chloroform extract of M indica leaves Protein Tannin Saponin
Flavonoid and Steroid are found in aqueous extract of M indica leaves Alkaloid and
Tannin are found in Acetone extract of M indica leaves Chloroform extract of M indica
leaves is devoid of all phytochemicals Aqueous extract of M indica leaves contains
Glycoside Tannin Terpenoid Saponin and Flavonoid Alkaloid Tannin Saponin and
Flavonoid are all found in Acetone extract of A squamosa leaves Aqueous extract of A
squamosa leaves contains protein and tannin
Discussion
Plant samples were subjected to phytochemical analysis which confirmed the existence of
elements with medicinal and physiological properties Phytochemicals such as carbohydrate
amino acid protein tannin flavonoid saponin glycoside steroid terpenoid and alkaloids
were found in the plant extracts
Tannins attach to proline-rich proteins preventing them from being synthesized Flavonoids
are hydroxylated phenolic compounds that plants produce in response to microbial infection
and have been discovered to have antibacterial properties in vitro against a wide range of
pathogens Their capacity to combine with extracellular and soluble proteins as well as the
bacterial cell wall is most likely the reason for their activity They are also powerful
antioxidants with anticancer properties
Saponins which are known to have an anti-inflammatory impact were also discovered in the
plant extracts Saponins have the ability to coagulate and precipitate red blood cells Saponins
are known for their ability to produce foams in aqueous solutions as well as their hemolytic
activity cholesterol binding capabilities and bitterness Steroids have been shown to have
antimicrobial characteristics and they are extremely essential molecules particularly in
regard to sex hormones For millennia alkaloids have been associated with medical purposes
and cytotoxicity is one of their most prevalent biological features Alkaloids have been shown
PANCHAL amp JHA Qualitative phytochemical analysis
Prithivya | August 2021 42
to have analgesic antispasmodic and antibacterial effects by several researchers Glycosides
have been shown to reduce blood pressure in numerous studies The findings of this study
indicate that the detected phytochemical substances may be bioactive constituents and that
these plants are proving to be a valuable reservoir of bioactive compounds with significant
medical value
Conclusion
The findings demonstrated that the plants investigated contained medicinally essential
components Many previous investigations had accumulated evidence that the discovered
phytochemical was bioactive Several studies have demonstrated that these phytochemicals
contribute pharmacological and physiological qualities to the plants researched in the
treatment of various illnesses As a result extracts from these plants could be considered a
valuable source of drugs Further research should be carried out to separate purify and
characterize the active ingredients responsible for the activity of these plants as well as
further work to isolate purify and characterize the active constituents responsible for the
action of these Plants In addition more research into the putative mechanisms of action of
these extracts is urged
Acknowledgement
Authors are thankful to Disha life sciences Pvt Ltd for practical work during this study
References
Ashwin Godghate Rajaram Sawant Ashok Sutar (2012) Phytochemical Analysis of
Ethanolic extract of Roots of Carrisa carandus Linn RasayanJChem 5(4)456-
459
K Girija P Udaya Chandrika K Lakshman N Pruthvi (2010) Evaluation of Antimicrobial
activity of various Bark extracts of Bombax malabaricum IntJResPharmSci
1(2)199-204
Khalid S Shahzad A Bashrat N Abubakar M Anwar P (2018) Phytochemical screening and
Analysis of selected Medicinal Plants in Gujarat J Phytochemistry Biochem 2108
Kodangala C Saha S Kodangala P (2010) Phytochemical studies of Aerial parts of the Plant
Leucas lavandulaefolia Der Pharma Chemica 2(5)434-437
PANCHAL amp JHA Qualitative phytochemical analysis
Prithivya | August 2021 43
Manash PS et al (2016) Phytochemical Analysis of Traditional Medicinal Plants and their
Antimicrobial activity An Experience from North East India J Pharm Res
1(1)000104
Prabhavathi R M Prasad M P and Jayaramu M (2016) Studies on Qualitative and
Quantitative Phytochemical Analysis of Cissus quadrangularis Advances in Applied
Science Research 7(4)11-17
Pushpendra K Patel Narendra K Prajapati and BK Dubey (2012) Madhuka indica A
Review of its Medicinal property IJPSR 3(5) 942-950
RNS Yadav and Munia Agrawala (2011) Phytochemical analysis of some medicinal plants
Journal of Phytology 3(1)10-14
S Hemadri Reddy Aisha Khalid AL-Hinai Hajer Hafed AL-Yaqoobi and Fatima Jafar AL-
Ajmi (2016) Phytochemical analysis antimicrobial screening and Hypoglycemic
effect of some selected Medicinal plant extract from Oman Journal of Experimental
Biology and Agricultural Sciences 4(2)218-224
Suggested citation
Panchal M and Jha C (2021) Qualitative phytochemical analysis of some medicinal plants (leaves)
from the surrounding area of Talod Taluka North Gujarat India Prithivya An Official Newsletter
of WCB Research Foundation and WCB Research Lab Vol 1(2) 37-43
DHARAIYA A Remote sensing
Prithivya | August 2021 44
Remote sensing An overview with fundamentals and applications
Dharaiya Aditya
Geology Department MG Science Institute Ahmadabad ndash 380009 (Gujarat) India
E-mail adiradhugmailcom
Introduction
The general concept of remote sensing can be inferred by a simple statement ie the
acquisition of information from a specific distance Scientifically it is the science of
acquiring information about an object or phenomenon by measuring emitted and reflected
radiation (Ray 2013) According to Lillesand et al (2015) remote sensing is defined as the
science and techniques of obtaining information about an object land area phenomenon or
ecosystem process acquired by a device that is not in direct contact with the object area or
phenomenon under investigation The data collection is done remotely using various sensors
which may be further analyzed to obtain information about the objects areas or phenomenon
These acquired data can be of many forms such as variations in force distributions acoustic
wave and electromagnetic energy distributions Joseph (2005) has discussed modern remote
sensing as an extension of the natural phenomenon of visual perception of objects Apart
from visible spectrum the electromagnetic radiation from the ultraviolet to far infrared and
the microwave regions is used for remote sensing The observations which are directly
inferred through electromagnetic radiation (EMR) from the sun or self-emitted radiance is
called passive remote sensing Whereas in active remote sensing the electromagnetic
radiations of a specific wavelength or band of wavelengths are generated to illuminate the
targets and reflected or back-scattered EMR are recorded to gain information for example
LiDAR RADAR SAR etc Based on its applicability remote sensing is defined as sensing
of the earthrsquos surface from the space by making use of the properties of electromagnetic wave
emitted reflected or diffracted by the sensed objects for the purpose of improving natural
resource management land use and environmental protection The classification of remote
sensing is further based on the selection of EMR (eg optical and microwave Navalgund et
al (2007)) When the sensors detect the solar radiation in the visible and infrared wavelength
regions reflectedscattered or emitted from the earth is said as optical remote sensing and in
microwave remote sensing uses interference and polarization concepts with electromagnetic
energy that detects the scattered energy returning from the terrain and records it as an image
The main purpose of remote sensing is to have an organized systematic and large amount of
DHARAIYA A Remote sensing
Prithivya | August 2021 45
data collection in order to acquire information about 2 or 3 dimensions of real objects One
can get large and broad global coverage and repeatability of data to obtain a multipurpose
information through various earth observation satellite sensors which helps in detecting
things that are normally absent in visible spectra such as Land-surface temperature
Underground or sub-surface water etc There are several Earth Observation (EO) Satellites
namely Cartosat series Landsat series Sentinel 1 2 MODIS RISAT 1 and RADARSAT 2
Resourcesat Envisat IRS 1A Oceansat 2 and many more
Electromagnetic Spectrum
Electromagnetic radiation or EMR is the term used to describe all of the different types of
energies released by electromagnetic processes Visible light is just one of many forms of
electromagnetic energy Radio waves infrared light and X rays are all forms of
electromagnetic radiation The
electromagnetic waves are formed by
the vibrations of electric and magnetic
fields these vary in magnitude in a
direction perpendicular to the direction
of propagation of radiations at a
constant speed of light (c= 3108
ms)Figure 1 shows a generalized
concept of EMR These differ from
mechanical waves as they need not
require a medium to propagate
hence it is able to travel through air
and solid materials and can also
travel through the vacuum of space Thus to define the EMR scientifically it can be said as a
form of energy emitted or absorbed by charged particles which exhibits wave-like behavior
as it travels through space
The electromagnetic spectrum is the entire range of all possible frequencies of
electromagnetic radiation (Figure 2) This includes the electromagnetic energy ranging from
Gamma rays to radio waves where the wavelength becomes longer so the energy and
frequency gradually decreases There are four kinds of resolution that are described from the
EMR spectrum are as follows
Figure 1 Illustration on the concept of EMR in which
propagation of electric and magnetic field is shown
Source - httpwwwfaoorg3t0355eT0355E02HTM accessed on 25
th
April
2021
DHARAIYA A Remote sensing
Prithivya | August 2021 46
1 Spectral resolution ndash it is the variation in the reflectanceemittance as a function of
wavelength Spectral responses are recorded by separate spectral bands such as Red Blue
Green Thermal NIR etc Figure 3 depicts the spectral resolution through a reflectance
curve It is further divided into 4 class sub classes
a Panchromatic ndash It consists
of only 1 band (BW)
b Colour ndash It consists the
combinations of 3 colors of
visible spectrum (RGB)
c Multispectral ndash consists of
3 to 10 bands and offers
Medium level spectral
resolution(Feng et al 2020)
d Hyper spectral ndash consists
of 100s of band and offers
higher spectral resolution (Feng et al 2020)
The combinations of spectral reflectance from two or more wavelength that indicate the
relative abundance of feature of interest are known as spectral indices Vegetation indices are
the most popular type but other indices are available for burned area built-up features
Figure 2 Electromagnetic spectrum showing waves and the radiations with respect to
wavelength and frequency
Figure 3 Spectral reflectance curve to determine spectral
resolution
Source -httpgsphumboldtedu accessed on 8th
April 2021
Source ndashLillesand et al (2015) Remote sensing and Image interpretation 7e
DHARAIYA A Remote sensing
Prithivya | August 2021 47
hydrologic and geologic features The band combinations for formulating spectral indices
vary from satellite to satellite Some of the most common spectral indices are listed in
Table1
No Spectral indices Formulation
(Band combinations)
1 NDVI (Normalised Difference Vegetation
Index)
NIR ndash Red NIR + Red (Where NIR is
Near-infrared band)
2 NDWI (Normalised Difference Water Index)
NDMI (Normalised Difference Moisture Index)
NIR - SWIR NIR + SWIR
3 AVI (Advanced Vegetation Index) [NIR (1-Red) (NIR-Red)] 13
4 NDSI (Normalised Difference Snow Index) Green ndash SWIR Green + SWIR
5 SAVI (Soil Adjusted Vegetation Index) ((NIR ndash R) (NIR + R + L)) (1 + L)
Where L is soil brightness correction
factor
6 MSI (Moisture Stress Index) MIR NIR Where MIR is Middle-wave
Infrared
7 NDGI (Normalised Difference Glacier Index) NIR ndash Green NIR + Green
8 NDBI (Normalised Difference Built-up Index) SWIR ndash NIR SWIR + NIR
9 BSI (Bare Soil Index) ((Red + SWIR) ndash (NIR + Blue)) ((Red
+ SWIR) + (NIR + Blue))
2 Spatial resolutionndashIt is described as the measure of the smallest object that can be resolved
by the sensor or the ground area imaged for the instantaneous field of view (IFOV) of the
ground sensor or the linear dimension on the ground represented by each pixel in the
reflectanceemittance determined by the shape size and texture of the target as discussed in
the book entitled Advance Remote Sensing 2012 It is expressed in meters like (250 m 80
m 10 m 1 m resolutions etc) Figure 4 is an example of spatial resolution
10 m resolution 30 m resolution
(a) (b)
Table 1 Different kinds of Spectral indices with respect to their formulations of band
Source -httpsgiscrackcomlist-of-spectral-indices
Source -httpsgiscrackcomlist-of-spectral-indices
Source -httpsgiscrackcomlist-of-spectral-indices
combinations
Figure 4 Example of Spatial Resolution by imagery acquired from Sentinel (a) and Landsat (b)
satellite sensors
Source -httpsgiscrackcomlist-of-spectral-indices
DHARAIYA A Remote sensing
Prithivya | August 2021 48
3Temporal resolution ndash the amount of time needed to revisit and acquire data for the exact
same location is called temporal resolution for example the revisit time period of Landsat is
16 days and that of Sentinel is 10 days Figure 5 shows the processed temporal resolution
4 Radiometric resolution ndash When an image is acquired by a sensor its sensitivity to the
magnitude of the electromagnetic energy determines the radiometric resolution The finer the
radiometric resolution of a sensor the more sensitive it is to detecting small differences in
reflected or emitted energy
Components and process of remote sensing
Figure 6 briefly describes the
process of remote sensing
Though the methods for
collection processing and
interpretation of remotely sensed
data are diverse imaging systems
have the following essential
components
Figure 5 Example of Temporal resolution of Las Vegas over time in 1973 2000 and 2006
Figure 6 A generalized process components of remote
sensing technology
Source- httpsseos-projecteuremotesensing
Source - httpswwwgisoutlookcom2019 accessed on 8th
April 2021
DHARAIYA A Remote sensing
Prithivya | August 2021 49
1 Energy source or illumination
This is the basic requirement for process of remote sensing to have a source of energy that
illuminates electromagnetic energy to the target of interest for example Active and passive
ensors Mostly the sensors are passive which tends to measure the solar radiation reflected
from the target
2 Interaction with the atmosphere
Before the electromagnetic radiation reaches the Earths surface it has to travel through some
distance of the Earths atmosphere Particles and gases in the atmosphere can affect the
incoming light and radiation and such type of effects are caused by the mechanisms
of scattering and absorption (Figure 7)Scattering occurs when particles or large gas
molecules present in the atmosphere interacts and cause the electromagnetic radiation to be
redirected from its
original path It depends
on several factors
including the
wavelength of the
radiation the abundance
of particles or gases and
the distance the radiation
travels through the
atmosphere There are three 3 types of scattering which take place are described in Table 2
All the different types of scattering with examples are briefly shown in figure 8
No Types of Scattering Particle size
(Micro meters
μm)
Examples
1 Rayleigh lt 01 μm Small specks of Dust N2 O2
molecules
2 Mie ~ 1 to 10 μm Pollen Smoke Water vapour
3 Non ndash Selective gt 10 μm Water droplets and large dust
particles
Figure 7 Interaction of EMR with atmosphere (a) Scattering and (b)
Absorption
Table 2 Different types of scattering occur when EMR interacts with the atmosphere
Reference httpswwwnrcangccamaps-tools-publications
DHARAIYA A Remote sensing
Prithivya | August 2021 50
Absorption is the other main mechanism when EMR interacts with the atmosphere In
Contrast to scattering it causes molecules in the atmosphere to absorb specific amount of
energy at various wavelengths O3 CO2 and water vapour are 3 main atmospheric
constituents which absorbs radiation Those areas of the EMR spectrum which are not
severely influenced by atmospheric absorption and thus are useful for remote sensors are
called Atmospheric windows (Figure 9) The visible portion of the spectrum to which our
eyes are most sensitive corresponds to both the atmospheric window and the peak energy
level of the sun
Figure 8 Different types of scattering when EMR interacts in the atmosphere or with the
Earthrsquos surface
Figure 9 Atmospheric window showing the transmission of molecules at different wavelength
with respect to different radiations
Source - httpwwwgeooregonstateedu accessed on 8th
April 2021
Source - httpwwwsarraceniacomastronomy accessed on 8th
April 2021
DHARAIYA A Remote sensing
Prithivya | August 2021 51
3 Interaction with the target
After the interaction with atmosphere once the energy makes its way to the target through the
atmosphere it interacts with the target depending on the properties of both the target and the
radiation Figure 10 shows such examples of interaction This can take place a second time as
the energy travels back from the target to sensor Several interactions are possible when
electromagnetic energy encounters matter whether solid liquid or gases are as follows
Radiation may be transmitted or passed through the substance
It may be absorbed and give up its energy largely to heating the substance
It may be emitted as a function of its emissivity and temperature
It may be reflected in 2 ways specular and diffused (Scattered)
4 Recording of Energy by the sensor
After the energy has been scattered by or emitted from the earthrsquos surface there is a need for
a sensor which is mounted on a satellite to collect and record the EMR The sensors are
popularly known by EMR region they sense Remote sensing has a broad classification of
optical and microwave as well as active and passive remote sensing as discussed by
Navalgund et al(2007) Feng et al (2020) Ray (2013) The sensors for taking
observations needs to be mounted on a platform This could be ground based (eg handheld
radiometers) airborne (eg Drone AVIRIS sensor of NASA on board aircraft) or space-
borne (ie satellite based)
Figure 10 EMR interaction with the Earthrsquos Surface
Source httpswwwslideservecomportia copy Rick Lathrop accessed on 25th
April 2021
DHARAIYA A Remote sensing
Prithivya | August 2021 52
5 Transmission Reception and Processing
The energy recorded by the sensor has to be transmitted often in electronic form to a
receiving and processing station at the earth where the data are processed and stored in digital
form
6 Interpretation and analysis
Furthermore this processed data is interpreted visually and digitally to extract information
about the target which was illuminated There are numerous specialised instruments or
hardware and software used that are commonly known as image processing tools which
involves four basic steps viz image correctionrestoration image enhancement image
transformation and image classification
7 Application
The final element or component of remote sensing process is achieved when we apply the
extracted and processed information in solving a particular issue or problem Specialists who
work in each application theme are able to perform and carry out this task
Applications of remote sensing
Every application itself has some specific demands for spectral spatial radiometric and
temporal resolution of the satellite sensor (Shandilya et al 2013) In modern era the remote
sensing proved very effective to understand and resolve the challenges in almost all the
fields few of its major applications are illustrated in this article
1 Geology
In the field of geosciences the remote sensing techniques are applied to interpret and analyse
the bedrock lithological structural formations sedimentation(Merritt et al 2014 Stead et
al 2019) planetary surface monitoring (Clark et al 2003 Des Marais et al 2002 Shepard
et al 2001)geo-hazards and mineral exploration through observation and modelling
techniques
DHARAIYA A Remote sensing
Prithivya | August 2021 53
2 Hydrology
Some examples of applications of remote
sensing in hydrological science include
soil moisture estimation flood and
wetland monitoring watershed and
drainage modelling river delta change
detection and many more Figure 11 and
12are an example of one of the studies
undertaken for hydrological modelling
and mapping of wetlands respectively
(Dharaiya 2020a Dharaiya et al 2021)
3 Glaciology
By means of remote sensing one can acquire information and map the ice concentration ice
type or motion(Frey et al 2014 Jiyang Chen amp Ohmura 1990) iceberg detection glacier
copy
Adi
tya
D
Figure 11 Drainage modelling in Jambughoda
Wildlife sanctuary Gujarat (after Dharaiya
2020a)
copy
Aditya
D Figure 12 Mapping of wetlands in Patan district Gujarat (Dharaiya et al 2021)
DHARAIYA A Remote sensing
Prithivya | August 2021 54
dynamics (Pratibha amp Kulkarni 2018 Remya et al 2019) monitor snow thickness
(Gantayat et al 2014 Kulkarni et al 2002) meteorological change research snow-water
equivalence snowmelt run-off estimation and many more
4 Agriculture
In the science of agriculture the remote sensing is mostly used as a decision-making tool viz
for crop type classification crop condition assessment crop yield estimation soil characters
soil management practices and compliance monitoring (Zheng et al 2014)
5 Forestry
Forestry is one of the major sectors where remote sensing has proved as very effective tool It
has been used for reconnaissance mapping commercial forestry and environmental
monitoring are some objectives which can be fulfilled and that further helps in managing and
conserving the natural resources Figure 13 is an example of mapping the forest coverat
Ratanmahal wildlife sanctuary Gujarat using spectral indices
6 Land use Land cover (LULC)
Yacouba et al (2010) has discussed the LULC with reference to two terms lsquoland usersquo which
refers to the purpose the land serves and lsquoland coverrsquo refers to natural surface cover on the
ground For example it is widely used in habitat and natural resource management urban
expansion baseline mapping risk assessment legal boundaries for tax evaluation change
Figure 13 Forest cover map of Ratanmahal wildlife sanctuary Gujarat copy Aditya Dharaiya
DHARAIYA A Remote sensing
Prithivya | August 2021 55
detection etc Figure 14 and 15depicts the LULC classification and change detection of
wetlands respectively (Dharaiya 2020b Dharaiya et al 2021)
copy
Adity
a D
Figure 14 LULC classification with vegetation cover in Girnar Wildlife sanctuary
Gujarat (After Dharaiya 2020b)
Figure 15 Change detection of wetlands in Patan district Gujarat using Landsat 8 OLI
(Dharaiya et al 2021)
DHARAIYA A Remote sensing
Prithivya | August 2021 56
7 Coastal monitoring
Remote sensing can be used to gather information about oceanic processes(physical and
biological) oil spill (Alesheikh et al 1997 Fingas amp Brown 1997) and shipping by means
of remote sensing
Several other applications according to Shandilya et al (2013) include planimetry or land
surveying using very high spatial resolution satellites (30 cm) Generating Digital Elevation
Models (DEMs) from remote sensing products are used to generate elevation profiles by
means of radar interferometry radargrammetry and photogrammetry To extract the
planimetric details about mineral exploration activities topographic mapping and surface
monitoring base map imagery provides a priori information about the areas
Conclusion
This emerging technique of remote sensing is a significant tool to monitor the Earthrsquos
surface It has progressively expanded applications which allow users to collect interpret
and manipulate data over vast areas Multi-temporal satellite data help to delineate changes of
the earthrsquos surface thus it can be also said to be a useful and handy tool for all the users as it
increases the accuracy efficiency and quality of the analysis in such a way that it can be
helpful in decision-making process Furthermore the products can be conveniently used by
other scientists too who are even not much familiar with this technology and for the greatest
level of detail to be extracted
References
Alesheikh A A Ghorbanali A amp Nouri N (1997) Coastline change detection using
remote sensing International Journal of Environmental Science and Technology 4(1)
1ndash11
Clark R N Swayze G A Livo K E Kokaly R F Sutley S J Dalton J B
McDougal R R amp Gent C A (2003) Imaging spectroscopy Earth and planetary
remote sensing with the USGS Tetra order and expert systems Journal of
Geophysical Research E Planets 108(12) httpsdoiorg1010292002je001847
Des Marais D J Harwit M O Jucks K W Kasting J F Lin D N C Lunine J I
Schneider J Seager S Traub W A amp Woolf N J (2002) Remote sensing of
DHARAIYA A Remote sensing
Prithivya | August 2021 57
planetary properties and biosignatures on extrasolar terrestrial planets Astrobiology
2(2) 153ndash181 httpsdoiorg10108915311070260192246
Dharaiya A (2020a)Monitoring and assessment of forest ecosystem using geospatial
technology A case study of Jambughoda wildlife sanctuary Gujarat India Poster
presented at ISRS National Symposium-2020
Dharaiya A (2020b) Habitat Analysis of Girnar Wildlife Sanctuary using Geospatial
Techniques Paper presented at National Map Competition GIS Day-2020
Dharaiya N Bhati R and Patel J (2021) Ecological studies on selected wetlands of Patan
district to prepare management plan for long-term conservation Technical Report
WCB Research Foundation Patan 91Pp
Feng X He L Cheng Q Long X amp Yuan Y (2020) Hyperspectral and multispectral
remote sensing image fusion based on endmember spatial information Remote
Sensing 12(6) 1ndash17 httpsdoiorg103390rs12061009
Fingas M F amp Brown C E (1997) Review of oil spill remote sensing Spill Science and
Technology Bulletin 4(4) 199ndash208 httpsdoiorg101016S1353-2561(98)00023-1
Frey H Machguth H Huss M Huggel C Bajracharya S Bolch T Kulkarni A
Linsbauer A Salzmann N amp Stoffel M (2014) Estimating the volume of glaciers
in the Himalayan-Karakoram region using different methods Cryosphere 8(6) 2313ndash
2333 httpsdoiorg105194tc-8-2313-2014
Gantayat P Kulkarni A V amp Srinivasan J (2014) Estimation of ice thickness using
surface velocities and slope Case study at Gangotri Glacier India Journal of
Glaciology 60(220) 277ndash282 httpsdoiorg1031892014JoG13J078
Jiyang Chen amp Ohmura A (1990) Estimation of Alpine glacier water resources and their
change since the 1870s Hydrology in Mountainous Regions I 5(193) 127ndash135
Joseph G (2005) Fundamentals of Remote sensing 2e Orient Blackswan 2Rev ed Pp i-
xi 1-486
DHARAIYA A Remote sensing
Prithivya | August 2021 58
Kulkarni A V Srinivasulu J Manjul S S amp Mathur P (2002) Field based spectral
reflectance studies to develop NDSI method for snow cover monitoring Journal of
the Indian Society of Remote Sensing 30(1ndash2) 73ndash80
httpsdoiorg101007BF02989978
Lillesand T Kiefer R Chipman J (2015) Remote sensing and Image interpretation 7e
John Wiley amp sons Inc Pp 1-736
Merritt A J Chambers J E Murphy W Wilkinson P B West L J Gunn D A
Meldrum P I Kirkham M amp Dixon N (2014) 3D ground model development for
an active landslide in Liasmudrocks using geophysical remote sensing and
geotechnical methods Landslides 11(4) 537ndash550 httpsdoiorg101007s10346-
013-0409-1
Navalgund R Jayaraman V Roy P (2007) Remote sensing applications An overview
Current Science 93(12) 1747-1766
Pratibha S amp Kulkarni A V (2018) Decadal change in supraglacial debris cover in Baspa
basin Western Himalaya Current Science 114(4) 792ndash799
httpsdoiorg1018520csv114i04792-799
Ray S (2013) Basics of Remote Sensing Remote Sensing Image Analysis Including the
Spatial Domain 1ndash15 httpsdoiorg1010071-4020-2560-2_1
Remya S N Kulkarni A V Pradeep S amp Shrestha D G (2019) Volume estimation of
existing and potential glacier lakes Sikkim Himalaya India Current Science 116(4)
620ndash627 httpsdoiorg1018520csv116i4620-627
Shandilya K K Shukla S P amp Pathak V (2013) Applications of Remote sensing
Horizons of Earth sciences Vol 10 1ndash12
Shepard M K Campbell B A Bulmer M H Farr T G Gaddis L R amp Plaut J J
(2001) The roughness of natural terrain A planetary and remote sensing perspective
Journal of Geophysical Research E Planets 106(E12) 32777ndash32795
httpsdoiorg1010292000JE001429
DHARAIYA A Remote sensing
Prithivya | August 2021 59
Stead D Donati D Wolter A amp Sturzenegger M (2019) Application of remote sensing
to the investigation of rock slopes Experience gained and lessons learned ISPRS
International Journal of Geo-Information 8(7) httpsdoiorg103390ijgi8070296
Yacouba D Guangdao H amp Xingping W (2010) Applications of Remote Sensing in
Land UseLand Cover Change Detection in Puer and Simao Counties Yunnan
Province Report and Opinion 2(9) 7ndash16
Zheng B Campbell J B Serbin G amp Galbraith J M (2014) Remote sensing of crop
residue and tillage practices Present capabilities and future prospects Soil and
Tillage Research 138 26ndash34 httpsdoiorg101016jstill201312009
Types of resolution used in remote sensing
httpwwwedcuriedunrsclassesnrs409rslectureshowremotesensonworkpdfacce
ssed on 24th April 2021
Components of remote sensing ndash Scattering and absorption httpswwwnrcangccamaps-
tools-publicationssatellite-imagery-air-photosremote-sensing-
tutorialsintroductioninteractions-atmosphere14635accessed on 24th April 2021
Basic concepts of Electromagnetic radiation and
spectrumhttpgsphumboldteduOLMCoursesGSP_216_Onlinelesson1-
2spectrumhtmlaccessed on 24th April 2021
Concept of spectral indices httpswwwl3harrisgeospatialcomdocsspectralindiceshtml
accessed on 25th April 2021
Suggested citation
Dharaiya A (2021) Remote sensing and An overview with fundamentals and applications
Prithivya An Official Newsletter of WCB Research Foundation and WCB Research Lab Vol 1(2)
44-59
M I PATEL AWARD 2021
Prithivya | August 2021 60
M I Patel Award for Young Wildlife amp Conservation Biologist
Nominations for 2021 Award
Ms Shivangi Mishra
Shivangi is a Senior Research Fellow (Basic Scientific
Research Fellow UGC) at University of Lucknow and is
currently working on Egyptian Vultures She has also
worked on Butterflies of Uttar Pradesh from 2014- 2016
She has presented her research on Egyptian Vultures in
Conference of Raptor Research Foundation in 2018
(South Africa) 2019 (USA) and awarded with William C
Andersen Award and James Koplin Award respectively In
future also she wants to contribute her research for the
conservation of Egyptian Vultures in India
Dr Tarang Kumar Shah
Tarang is an Assistant Professor in Fisheries polytechnic at
Dau Shri VasudevChandrakarKamdhenuVishwaVidyalaya
Durg He studied the Effect of Thymus linearis plant
Extract on Growth Performance and Non-Specific Immune
Responses of endangered Golden Mahseer (Tor
putitora)against the disease caused
byOomycetesSaprolegniaparastica He found that the leaf
extract of Thymus plant has the antifungal properties and a
small quantity of which can control the population against
saprolegniosis
Dr Sujit Kolangath
Sujit is a subject specialist in animal biotechnology at
Wildlife Research amp Training Center Gorewada Nagpur
He studied the qualitative and quantitative aspect of
hepatoozoonfelis epidemiology in a tiger cub He reported
that the infection is transmitted by ingestion of infected
ticks infected prey and carrion and concurrent infection
with bacterial or viral infections may be fatal to the
infected animal
M I PATEL AWARD 2021
Prithivya | August 2021 61
Ms Jis Sebastian
Jis recently completed her doctoral research in Botany
from Madurai Kamraj University Madurai- Tamil Nadu
She is studying the pattern of diversity spatial distribution
and community structure of epiphytic orchids of southern
Western Ghatsresponds to availibility of
microenviornments (Microhabitat supported by
Microclimates) in the structurally diverse trees There for
Conservation of epiphytic orchids would ensure
conservation of old aged natural structurally complex
trees in the forest ecosystem
Dr Harshil Patel
Harshil is a naturalist working mainly on systematics and
taxonomy of reptiles and amphibians He studied the
amphibians amp reptiles of northern Western Ghats of
Gujarat He found a new Miocene divergent endemic
lineage of a racer snake evolutionary history of an
endemic snake resulted in the resurrection of a genus
reinvestigation of a gecko species complex that resulted
into the discovery of two new species
The final round including the presentation by the nominees followed by the award
ceremony will be conducted on September 27 2021 at M N College Visnagar (Gujarat)
WCB and the M I Patel Award committee congratulate all the nominees and wishing all
the best for their presentation
Applications and nomination for the 2022 awards are now open through our website
(wwwwcbresearchin) till June 30 2022
ANNOUNCEMENT
Prithivya | August 2021 62
ANNOUNCEMENT
Prithivya | August 2021 63
WINNERS OF MANGROVE DAY POSTER
COMPETITION
Prithivya | August 2021 64
WCB Research Foundation with K J Somaiya College Mubai have organized Digital and
Handmade Posters Competition on the occasion of World Mangrove Day July 26 2021 Out
of entries of thirty participants three best posters were selected by the committee and
awarded
Posters of Winners
1st Prize Digital Poster Ms Yukta Sawant
WINNERS OF MANGROVE DAY POSTER
COMPETITION
Prithivya | August 2021 65
1st Prize Digital Poster Ms Yukta Sawant
1st Prize Handmade Poster Ms Tanya Sawardekar
WCB RESEARCH FOUNDATION GOVERNING COUNCIL
Prithivya | August 2021 66
Governing Council of WCB Research Foundation
Executive
Director
Dr Hardik Patel Assistant Professor
Parul University Vadodara
phardik80gmailcom
Director of
Research
Dr Nishith Dharaiya Associate Professor
HNG University Patan
nadharaiyanguacin
Member Dr Sagarika Damle Associate Professor amp Head
Department of Life Sciences KC College Mumbai
sagarikadamlekccollegeeduin
Member Dr Nuria Selva Associate Professor
Institute of Nature Conservation
Polish Academy of Science Krakow Poland
nuriaselvagmailcom
Member Mr Pratik Desai Jr Research Fellow
WCB Research Lab Patan
pratikdesai825gmailcom
Member Mr M S Patel Associate Professor
M N College Visnagar martinleemsgmailcom
Member Dr Haresh Gondaliya Assistant Professor
Shri G D Modi Science College Palanpur hareshgondliya55gmailcom
Member Mr Prasad Patil Range Forest Officer
Gujarat Forest Department jalu1890gmailcom
Member Ms Madhuri Padaya Assistant Professor
K J Somaiya College of Science Mumbai padayamadhuriyahoocom
Member Dr Jagruti Rathod Director
Center for Nature amp Ecosystem Wellbeing Vadodara
rathod21gmailcom
Member
Secretary
Ms Jahnvi Patel Admin Officer
WCB Research Foundation Patan
adminwcbresearchin
Page 1 of 7 Pruthivya An official newsletter of WCB Research Foundation
Guidelines to authors and contributors 1 | P a g e
Instructions for authors
Scope Prithivya is a tri-annual newsletter of WCB Research Foundation and will
publish manuscripts on wildlife conservation biology and its allied areas
Guidelines to contributors of Prithiviya
Manuscript Types Prithiviya publishes original research articles short notes
field notes reviews and comments Submissions should be in English (UK) only
All manuscripts should be easy to read and comprehend Manuscripts may be
edited for length content and style and be sent to referees when found to be
appropriate The editor will discuss contributions with authors and advise to
modified whenever required
Submission is considered on the condition that papers are previously
unpublished have not been offered simultaneously elsewhere and that all
contributors have read and approved the contents
The editor will acknowledge manuscript contributions and assign them a unique
registration number which latter must be quoted in correspondence Papers are
peer-reviewed although the editor reserves the right to reject one without a
review
Preparation and submission of manuscripts
1 Title page Add full title Authors name and affiliation with email of all the Authors Abstract (250 Words) and Key words (4-5)
2 Submitted manuscripts should generally follow the normal convention of
scientific manuscripts keywords generally not appearing in the title
Introduction Materials and Methods Results and Discussion
Acknowledgments Authors contribution (optional) Appendices (optional) and
References) with the replacement or addition of sections allowed in between
the Introduction and the Acknowledgments
3 The manuscript should be typed in MS Word with left-aligned typesetting and
only true type fonts (Times new roman preferable) should be used The line
spacing must be 15 and the font size of 12 Headings should be bold and sub-
headings should be made italicized
Page 2 of 7 Pruthivya An official newsletter of WCB Research Foundation
Guidelines to authors and contributors 2 | P a g e
4 Title A concise informative and attractive and short title with 5-20 words will
be encouraged
5 Abstract Word limit for the abstract is 250 words and should contain a
summary of all major findings or conclusions of the study however abstract
is not required in case of short notes field notes and other short
communication
6 Introduction should be clearly written and must covering the objectives and
significance of the study
7 Methodology A detailed methodology is always encouraged The methodology
should contain the study area (if applicable) data collection analysis and
interpretation Authors should also mention the instruments software used
for the experiments and analysis
8 Result and discussions which contain main result with proper references
and authentic justifications include graph table photographs (No checklist
it directly goes into appendix or supplementary data)
9 Conclusions A short and comprehensive conclusion with significant novel
findings and depicting your research in a nut-shell
10 Acknowledgments which contain all funds support persons who help
during project or research or findings name of university other than they work
etc
11 Checklist-based papers like trip reports should contain dates of the trip total
number of birders or participants Mammals reptiles amphibians
invertebrates etc
12 Manuscripts should be sent electronically as an email attachment to the
Editorial Assistant with a cover letter to helliphellip
13 The text tables figurephotograph captions (which must be self-explanatory)
and appendices should be combined in one Microsoft Wordreg (ldquodocrdquo OR
ldquodocxrdquo) file format The preferred font is lsquoTimes New Romanrsquo in 12 point
14 Photographs artwork maps (the outlines of the Republic of India should
conform to Government of India regulations) diagrams etc should be
digitized and sent separately along with the manuscript or if they are large
Page 3 of 7 Pruthivya An official newsletter of WCB Research Foundation
Guidelines to authors and contributors 3 | P a g e
files in separate trailing e-mails These should be in TIFF and at least 8times11
inches in 300 dpi resolutions JPEG files must be lsquomaximumrsquo quality ie at
their minimum compression Maps should be marked with a scale and North
arrow and should carry a clear caption
15 Authors whose work involves the handling of any necessary permissions from
the requisite government agencies to do so The editor reserves the right to
view such permissions at herhis discretion
16 While photographing nestingcourtship display or any behavioural activity
including those of nests eggs courtship etc authorsphotographers must
ensure the safety of the animals involved and also ensure that they do not
disturb in any way whatsoever in the course of their photography The editor
reserves the right to view permissions for such activities within protected
areas The editorreferee reserves the right to query an author regarding the
ethics of photography and the methodology followed while photographing
including that of rejecting a manuscript if unsatisfied on these counts
Types of Manuscript
1 Short Research articles 2000 to 2500 words
2 Short notes Up to 1500 words
3 Important sightings 250-350 words with proper GPS location and
photographic evidence
4 Important findings 250-500 words with proper GPS location with image
5 Full-length Research paper Up to 10000 words with appendix excluding
photographs only
Other important Guidelines
Scientific binomials should comprise the generic and specific names but should
not include the name of the author and year of citation Scientific trinomials
should be mentioned only if the nature of the manuscript requires them
For example both the English and scientific name must be given thus ldquoHouse
Crow Corvus splendensrdquo thereafter only the English name ldquoHouse Crowrdquo will
suffice English and scientific names should follow the proper book that should
be mention in reference and title of the table
Page 4 of 7 Pruthivya An official newsletter of WCB Research Foundation
Guidelines to authors and contributors 4 | P a g e
Metric units and their international symbols must be used eg ldquosq kmrdquo and
ldquo1000 m aslrdquo dates and times should be of the form of MMDDYYYY (January
01 2021rdquo and ldquo1345 hrdquo respectively
Tables should be within gridlines (which may or may not be printed) Tables
should never be formatted with wrap-around text
Latitude and longitude coordinates should follow the format ldquo27807ordmN
74094ordmErdquo
Enzyme Nomenclature The trivial names recommended by the IUPAC-IUB
Commission should be used When the enzyme is the main subject of a paper
its code number and systematic name should be stated in its first citation in the
paper
Symbols and Abbreviations Use only standard abbreviations The use of non-
standard abbreviations can be extremely confusing to readers Avoid
abbreviations in the title The full term for which an abbreviation stands should
precede its first use in the text unless it is a standard unit of measurement
Page number (page 1 0f 10 formats) must be on top right corner of the word
documents font size 10 and times new roman word type
Citation and References Prithivya encourages the authors to use Mendely EndNote or other reference management tools for proper citations We follow APA referencing style
Do not abbreviate references pagination should be given in the expanded form
eg ldquoindashvi 1ndash250rdquo not ldquovi 250rdquo the page numbers should be separated by an
lsquoEnrsquo dash
Italics should be used for book titles but not volume numbers when citing
periodicals use italics for the journal name not the article title
References should be arranged alphabetically by the first author (and in the case
of more than one author by second and subsequent authors)
Citations to references in the text should follow the style ldquo(Santharam 1978)rdquo
ldquo(Barua amp Sharma 1999)rdquo ldquo(Pande et al 2002)rdquo ldquo(Lainer 1999 2004)rdquo ldquo(Lainer
1999abcd Lainer 1999a 2000a)rdquo [for several papers by an authors from
Page 5 of 7 Pruthivya An official newsletter of WCB Research Foundation
Guidelines to authors and contributors 5 | P a g e
amultiple calendar years] and ldquo(Neelakantan et al 1993 Sashikumar et
al 2011)rdquo
A string of citations in the text should follow a chronological not an alphabetical
order thus ldquo(Ali amp Ripley 1981 Kazmierczak 2000 Grimmett et al 2011)rdquo
When citing unpublished sources please use the following formats if the source
is written material ldquo(Harkirat Sangha in litt e-mailletter dated 02 January
2013)rdquo if oral ldquo(Rajah Jayapal verbally dated 15 December 2013)rdquo
When citing from e-Bird or any other magazine checklist please enter the author
of the e-Bird checklistrsquos name or others name and the year the checklist was
uploaded in the text ldquo(Raman 1994)rdquo If a checklist thatrsquos shared amongst
multiple observers is being referred to only the relevant checklist(s) should be
used for citation
See examples below for detailed formatting
Journal articles
Pittie A 2011 The dates of seven new taxa described by W E Brooks (Certhia
Hodgsoni Sitta Cashmirensis Dumeticola
major Horites [sic] Pallidus Phylloscopus Tytleri Motacilla Cashmirensis
and Alauda Guttata) Prithiviya7 (2) 54ndash55
Naoroji R amp Sangha H S 2011 Threats to habitat and wildlife in Changthang
and Rupshu areas of Ladakh a case study at Hanle Prithiviya7 (1) 2ndash6
Choudhary D N Mandal J N Mishra A amp Ghosh T K 2010 First ever
breeding record of Black-necked Stork Ephippiorhynchus asiaticus from
Bihar Prithiviya6 (3) 80ndash82
Books
Futehally Z (ed) 2006 India through its birds 1st ed Bangalore India
Dronequill Publishers Pvt Ltd Pp indashii 1ndash214
Pittie A 2010 Birds in books three hundred years of South Asian ornithologymdash
a bibliography 1st ed Ranikhet Permanent Black Pp indashxxi 1ndash845
Sashikumar C Praveen J Palot M J amp Nameer P O 2011 Birds of Kerala
status and distribution 1st ed Kottayam Kerala DC Books Pp 1ndash835 Book chapter
Pittie A 2011 Stray Feathers (1872ndash1899) (p 247) In Priority The dating of
scientific names in ornithology a directory to the literature and its
Page 6 of 7 Pruthivya An official newsletter of WCB Research Foundation
Guidelines to authors and contributors 6 | P a g e
reviewers Dickinson E C Overstreet L K Dowsett R J amp Bruce M D
(eds) Northampton UK Aves Press Limited Website
2013 Kadalundi makes history with new gull species The
Hindu (Thiruvananthapuram ed) dated February 7 2013
Website httpwwwthehinducomtodays-papertp-nationaltp-
keralakadalundi-makes-history-with-new-gull-speciesarticle4388171ece
[Accessed on 21 July 2014] Any magazine checklist
Raman T R S 1994 Website
URL httpebirdorgebirdviewchecklistsubID=S21694571 [Accessed on
15
December 2015]
ETHICAL MATTERS Authors involving in the usage of experimental animals and human subjects in their
research work should seek approval from the appropriate Institutional Animal Ethics
Committee in accordance with Principles of Laboratory Animal Care The material
and methods section of the manuscript should include a statement to prove that the
investigation was approved and that informed consent was obtained
Disclaimer
While every care is taken of manuscripts and their accompanying
material Prithiviya cannot be held responsible for accidental loss or damage of
any material sent for publication or for their return whether they are accepted
for publication or not
Material published in Prithiviya reflects the views of the authors and not
necessarily those of the publishers editors referees etc
The editor reserves the rights to make necessary changes in manuscripts in
consultation with the author
All submissions are evaluated under the assumption that the conditions listed here have been understood and accepted by the author(s)
Submission fees There will be no submission fees for e-publication however we
may produce the reprints on request and on payment basis
Page 7 of 7 Pruthivya An official newsletter of WCB Research Foundation
Guidelines to authors and contributors 7 | P a g e
Special announcements
We also accept announcement of workshop webinar conference symposium job
opportunities academic courses etc with nominal charges and guarantee for its
wider circulation
Contacts Editor in Chief Dr Sagarika Damle Emailvisaanikagmailcom Associate Editors Dr Nishith Dharaiya
Email nadharaiyagmailcom Dr Jagruti Rathod Email rathod21gmailcom Editorial Assistant Ms Rinku Bhati
Email bhatirinku178gmailcom
WCB Research FoundationAdding Science to Conservation
wwwwcbresearchin
- 001_Cover Page
- 002_Editorial Board_2
- 003_Table of Contents_Issue 2
- 004_Editorial and Directors Column
- 005_Chaudhary and Desai 1-3
- 006_Dave 4-11
- 007_Amin et al 12-17
- 008_Thakkar and Gohil 18-21
- 009_Marjadi 22-23
- 010_Patel and Patel 24-27
- 011_Pithva and Dharaiya 28-36
- 012_Panchal and Jha 37-43
- 013_Dhaaraiya 44-59
- 014_MI Patel Award Nominee 60-61
- 015_Announcements 62-63
- 016_Posters Competition Winners 64-65
- 017_ WCB Council and Board 66
- 018_Prithiviya_Guidelines Final
- 019_Last page
-
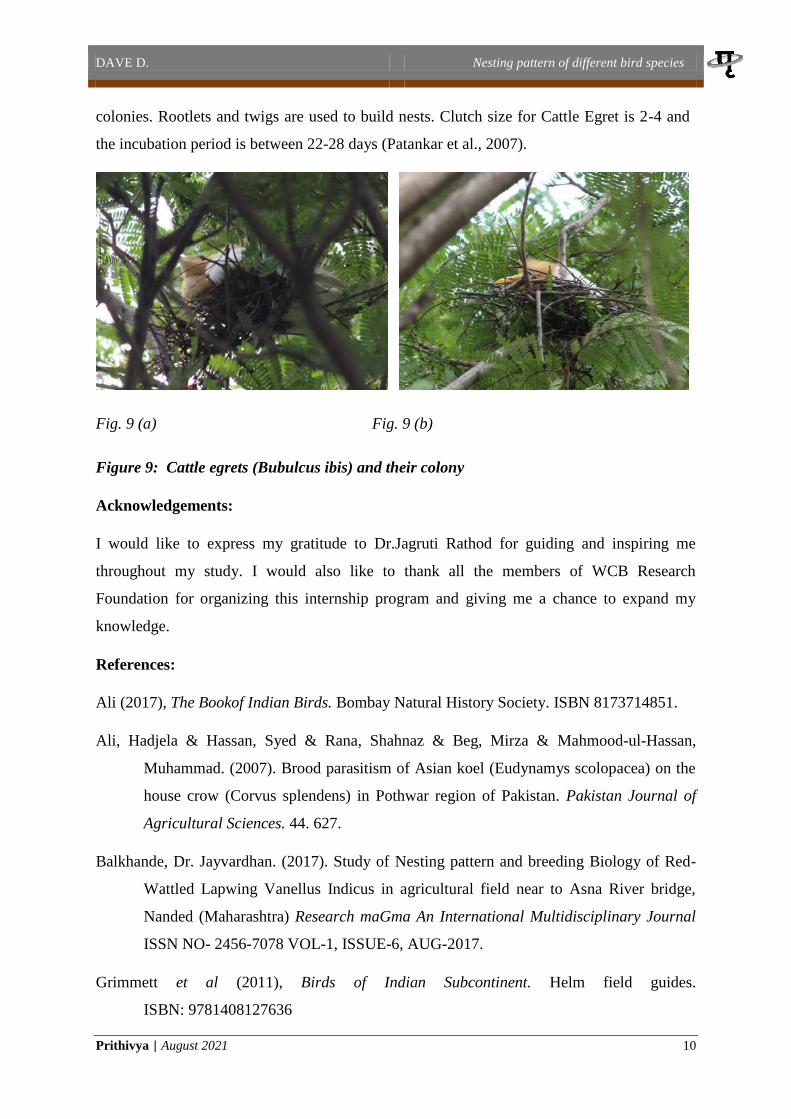
DAVE D Nesting pattern of different bird species
Prithivya | August 2021 10
colonies Rootlets and twigs are used to build nests Clutch size for Cattle Egret is 2-4 and
the incubation period is between 22-28 days (Patankar et al 2007)
Fig 9 (a) Fig 9 (b)
Figure 9 Cattle egrets (Bubulcus ibis) and their colony
Acknowledgements
I would like to express my gratitude to DrJagruti Rathod for guiding and inspiring me
throughout my study I would also like to thank all the members of WCB Research
Foundation for organizing this internship program and giving me a chance to expand my
knowledge
References
Ali (2017) The Bookof Indian Birds Bombay Natural History Society ISBN 8173714851
Ali Hadjela amp Hassan Syed amp Rana Shahnaz amp Beg Mirza amp Mahmood-ul-Hassan
Muhammad (2007) Brood parasitism of Asian koel (Eudynamys scolopacea) on the
house crow (Corvus splendens) in Pothwar region of Pakistan Pakistan Journal of
Agricultural Sciences 44 627
Balkhande Dr Jayvardhan (2017) Study of Nesting pattern and breeding Biology of Red-
Wattled Lapwing Vanellus Indicus in agricultural field near to Asna River bridge
Nanded (Maharashtra) Research maGma An International Multidisciplinary Journal
ISSN NO- 2456-7078 VOL-1 ISSUE-6 AUG-2017
Grimmett et al (2011) Birds of Indian Subcontinent Helm field guides
ISBN 9781408127636
DAVE D Nesting pattern of different bird species
Prithivya | August 2021 11
Jahan I Begum S Feeroz M M Das D K amp Datta A K (2018) Nesting pattern of
birds in Jahangirnagar University Campus Bangladesh Journal of Threatened Taxa
10(5) 11618ndash11635 httpsdoiorg1011609jot279910511618-11635
Nijman V (2004) Seasonal variation in naturally occurring mobbing behaviour of drongos
(Dicruridae) towards two avian predators Ethology Ecology and Evolution 16(1)
25ndash32 httpsdoiorg1010800892701420049522651
Patankar Pratyush amp Desai Isha amp Shinde Kavita amp Balakrishnan Suresh (2007) Ecology
and breeding biology of the Cattle Egret Bubulcus ibis in an industrial area at
Vadodara Gujarat Zoos Print Journal 22 1011609JoTTZPJ15662885-8
Robertson H A (1990) Breeding of collared doves streptopelia decaocto in rural
oxfordshire england Bird Study 37(2) 73ndash83
httpsdoiorg10108000063659009477043
Sharma M amp Sharma R K (2015) Ecology and breeding biology of Indian stone curlew
(Burhinus indicus) Nature Environment and Pollution Technology 14(2) 423ndash426
Suryawanshi K 2021 Nesting behaviour and diet of Shikra Accipiter badius in Ajanta
Maharashtra Indian BIRDS 17 (2) XXndashXX
Trivedi V amp Vaghela S (2020) Avifauna of saurashtra university campus Rajkot Gujarat
India Journal of Threatened Taxa 12(13) 16764ndash16774
httpsdoiorg1011609jott5113121316764-16774
Suggested citation
Dave D (2021) Observations on nesting pattern of different bird species around university road
Rajkot Prithivya An Official Newsletter of WCB Research Foundation and WCB Research Lab
Vol 1(2) 4-11
AMIN ET AL Record of Leucism in Indian Flying Fox
Prithivya | August 2021 12
Record of Leucism in Indian Flying Fox Pteropus giganteus (Mammalia
Chiroptera Pteropodidae) from South Gujarat India
Amin Siddharth M1 Patel Hiren J2 and Vaghela Prashant P3
1 C129 Bhagyoday Society Opposite Sahyog Police chowki Gorwa Refinery Road
Vadodara - 390024(Gujarat) India 2Sardar Patel Zoological Park Kevadiya ndash 393151(Gujarat) India 3C-27 New Narmada Colony Chhani Jakatnaka Vadodara - 390024(Gujarat) India
E-mail hirenp9408gmailcom
Abstract
Leucism in fruit bat species Pteropus giganteus (Brunnich 1782) is recorded for the first
time from India based on photographic evidence collected from the Anaval Village located in
Surat District of South Gujarat India A total lack of pigmentation in the whole body due to
the failure of melanocytes to migrate to the skin and hair follicles resulting in white or
whitish hairs pale skin but normal coloured eyes are the sign of leucism The present record
can serve as baseline data and will also help understand colour aberration in bats
Key Words Colour aberration Chiropteran Pigmentation Mutation
Introduction
The Indian Flying Fox is one of the most common and widely distributed chiropterans found
in India Pakistan Sri Lanka Bhutan Nepal Bangladesh Maldives Myanmar and China
(Tsang 2020 Johnsingh amp Manjrekar 2013 Srinivasulu amp Srinivasulu 2012) Flying Fox is
the largest fruit bat known to occur on mainland India (Bates et al 1994) out of 13 Indian
fruit bat species (Bates amp Harrison 1997 Srinivasulu et al 2010) It has a reddish-brown
head with a darker sometimes
blackish snout pale brownish-
yellow shoulders and hindneck
yellowish-brown ventrally and
black wings (Prater 1971) It is
a colonial species and roosts
during the day often in the
midst of busy towns villages
on large trees along the
roadside near cropland and
water bodies (Bates et al 1994
Johnsingh amp Manjrekar 2013
Menon 2014) Their roosting
Figure 1 Leucistic individual roosting along with the
normal individuals
AMIN ET AL Record of Leucism in Indian Flying Fox
Prithivya | August 2021 13
colonies are generally found on large trees such as Ficus benghalensis F religiosa
Tamarindus indica Mangifera indica Dalbergia sissoo and Eucalyptus sp (Vendan 2003)
and the colony size can vary from hundreds to several thousands of individuals (Bastawade
amp Mahabal 1976) Although fruit bats are responsible for many ecological services (Saikia
2018) yet Indian Flying Fox is one of the most persecuted fruit bats in South Asia and is
listed as vermin under Schedule V of the Indian Wildlife (Protection) Act and IUCN Red List
Data included it as a Least Concern species (Tsang 2020)
In mammals a wide variety of colours and forms are found as a result of the presence of
certain pigments mostly melanin which provides colour to the skin hairs and eyes
(Nordlund et al 1998 Uieda 2000 Lucati amp Loacutepez Baucells 2016) Often this pigment is
affected as a result of mutations giving rise to diverse colour aberrations The effect of such
abnormal colouration is generally the pigmentation anomalies of chromatic disorders (Rook
et al 1998) Similar to other mammals bats are also vulnerable to genetic disorders that
affect pigmentation Globally such chromatic disorders are being reported at an increasing
rate in bats (Lucati amp Loacutepez Baucells 2016) and are caused by either an increase or a
decrease in the production of melanin in some regions or over the entire body (Hofreiter amp
Schoneberg 2010 Abreu et al 2013) These include albinism leucism piebaldism
hypomelanism and melanism (Lucati amp Loacutepez Baucells 2016) Among these conditions
leucism stands out as a rare phenomenon in nature
Leucism is a total lack of pigmentation in the whole body due to the failure of melanocytes to
migrate to the skin and hair follicles resulting in white or whitish hairs pale skin but
normal coloured eyes It occurs regardless of the normal production of the enzyme tyrosinase
and melanin Moreover it can be caused by one of the several mutations that will give rise to
apparently similar phenotypes (van Grouw 2006 2013 Abreu et al 2013 Lucati amp
Loacutepez‐ Baucells 2016) The occurrence of colour aberration in 55 Indian mammalian species
has been compiled by Mahabal et al (2019) Although cases of albinism and piebaldism have
been reported in the family Pteropodidae (Neal 1971 Karim 1983 Anonymous 2012
Anonymous 2013) however there is no report on colour aberration in Indian Flying Fox
(Pteropus giganteus) Here we report the first case of leucism in Indian Flying Fox from
Surat district of South Gujarat India
AMIN ET AL Record of Leucism in Indian Flying Fox
Prithivya | August 2021 14
Observations
On 18 June 2017 we were on the way to Vansda National Park and at 1230 h we stopped as
we saw a group of Indian Flying Fox roosting on Ficus religiosa near Anaval Village
(20838degN 73263degE) in Surat District Gujarat Suddenly all the fruit bats flew in the sky as
a local was hunting them with the help of a catapult maybe for eating purposes In the
middle of all these at 1249 h a white bat flying in the sky grabbed our attention as it flew
further to roost on one of the branches with other Indian Flying Fox We took some
photographs (Figure 1) and observed with the help of binoculars to note down its
characteristics Its whole body ie both fur and skin were white or whitish including
patagium and ears but it had normal black coloured eyes With the help of the classification
proposed by Lucati amp Loacutepez Baucells (2016) we identified it as a case of leucism and not
albinism
The roosting colony had around 250 individuals and was situated near a village pond among
human habitation on the roadside We observed the leucistic individual at least for an hour
and also alerted the locals to cease hunting of bats The leucistic individual was probably a
female and showed similar activity as that of normal individuals such as opening and closing
of wings folding the wings around belly and grooming
Discussion
Although physiological causes of colouration including melanism are evident (Caro 2005)
the genetic processes responsible for these colour variations remain unknown in most
mammals (Lucati amp Loacutepez Baucells 2016) Moreover chromatic disorders in bats can affect
both fur and skin including patagium ears and muzzle and their impact on the survival rate
is vague (Lucati amp Loacutepez Baucells 2016) However bats are most likely less vulnerable to
predation than the majority of diurnal animals as they are active at night and prefer dark
roosting sites (Buys et al 2002 Rocha et al 2013) Lucati amp Loacutepez Baucells (2016) states
that aberrant individuals roosting in sheltered places such as caves mines and buildings
may have greater survival rates than the one roosting in the open leaves Here we found the
leucistic Indian Flying Fox roosting in the open leaves and is likely to be vulnerable to
predation
Albinism is one of the most commonly occurring colour aberrations in bats (Lucati amp Loacutepez
Baucells 2016) In the family Pteropodidae albinism has been reported in Cynopterus sphinx
AMIN ET AL Record of Leucism in Indian Flying Fox
Prithivya | August 2021 15
from Nepal (Anonymous 2013) Lissonycteris angolensis from Uganda (Neal 1971) and
Rousettus leschenaultia from India (Karim 1983) while piebaldism is reported in Rousettus
amplexicaudatus from Philippines (Anonymous 2012) However another such colour
aberration leucism is not yet reported from the family Pteropodidae In this regard our report
of leucism in Pteropus giganteus can be the first of its kind in the entire range of its
distribution
Today bats in India face the harsh reality of declining habitats and resources ultimately
making them disappear altogether (Graham 2001 Tsang 2020) and the peoplersquos perception
regarding the presence of bats in their surroundings for different myths These facts raise an
urgent need to protect bats throughout the world by studying more about their behaviour and
ecology Further studies on Pteropus giganteus from Gujarat are mainly sighting reports
(Mahato et al 2012) and on roosting sites (Vyas amp Upadhyay 2014) Due to the lack of
information on colour aberration in the family Pteropodidae this report can add importance
to bat biologists
Acknowledgement
We are thankful to Dhaivat Patel and Vivek Patel for assisting us in fieldwork
References
Abreu M S L Machado R Barbieri F Freitas N S amp Oliveira L R 2013 Anomalous
colour in Neotropical mammals a review with new records for Didelphis sp
(Didelphidae Didelphimorphia) and Arctocephalus australis (Otariidae Carnivora)
Brazilian Journal of Biology 73 185ndash194
Anonymous 2012 Monfort Bat Sanctuary Blanca Bella Website
httpwwwmonfortbatsanctuaryorgblanca-bellac12m [Accessed 20 October
2019] Anonymous 2013 SMCRF (Small Mammals Conservation amp Research
Foundation) Website httpwwwsmcrforgindexphp [Accessed 20 October
2019]
Bastawade D B amp Mahabal A 1976 Some behavioural aspects of the Indian flying fox
Pteropus giganteus giganteus Bio-Vigyanam 2 209ndash212
Bates P J J amp Harrison D L 1997 Bats of the Indian Subcontinent Harrison Zoological
Museum Publication UK 258pp
Bates P J J Harrison D L amp Muni M 1994 The bats of western India Part 1 JBNHS
AMIN ET AL Record of Leucism in Indian Flying Fox
Prithivya | August 2021 16
91 (2) 1ndash15
Buys J Heijligers H amp Dorenbosch M 2002 First record of an albino long-eared bat
Plecotus auritus in The Netherlands Lutra 45 49ndash52
Caro T 2005 The adaptive significance of coloration in mammals BioScience55 125ndash136
Graham G L 2001 Bats of the World St Martinrsquos Press New York New York
160pp Hofreiter M amp Schoneberg T 2010
The genetic and evolutionary basis of colour variation in vertebrates Cellular and Molecular
Life Science 67 2591ndash2603
Johnsingh A J T amp Manjrekar N (eds) 2013 Mammals of South Asia Volume 2
Universities Press (India) Private Limited Telangana India pp 545ndash547
Karim K B 1983 A note on an albino Rousettus leschenaulti Bat Research News 24 39ndash
40
Lucati F amp Loacutepez Baucells A 2016 Chromatic disorders in bats a review of pigmentation
anomalies and the misuse of terms to describe them Mammal review 47(2) 112ndash123
Mahabal A Sharma R M Patil R N amp Jadhav S 2019 Colour aberration in Indian
mammals a review from 1886 to 2017 Journal of Threatened Taxa 11(6) 13690ndash
13719 Mahato A K R Kumar V V amp Patel N 2012 Indian flying fox in
Hamirsir Lake Bhuj city needs conservation attention Current Science 103(4)
354ndash355
Menon V 2014 Indian mammals a field guide Hachette India pp 386 Tsang SM
2020 Pteropus giganteus (errata version published in 2021) The IUCN Red List of
Threatened Species 2020 eT18725A194134899
httpsdxdoiorg102305IUCNUK2020-3RLTST18725A194134899en
Downloaded on 10 April 2021
Neal E 1971 Uganda Quest Collins London UK
Nordlund J J Boissy R E Hearing V J King R A Oetting W S amp Ortonne J P
(Eds) 1998 The pigmentary system physiology and pathophysiology Oxford
University Press New York
Prater S H 1971 The Book of Indian Animals (Revised) Bombay Natural History Society
Bombay pp 200ndash201
Rocha P A Feijo J A Donato C R amp Ferrari S F 2013 Leucism in Sebarsquos short-
tailed bat Carolliaperspicillata (Linnaeus 1758) from a rock shelter in northeastern
AMIN ET AL Record of Leucism in Indian Flying Fox
Prithivya | August 2021 17
Brazil Chiroptera Neotropical 19 1151ndash1153
Rook A Wilkinson D S Ebling F J B Champion R H amp Burton J L 1998
Textbook of Dermatology 6th edn Blackwell Science Boston Massachusetts USA
Saikia U 2018 A review of chiropterological studies and a distributional list of the
bat fauna of India Records of the Zoological Survey of India 118(3) 242ndash280
Srinivasulu C amp Srinivasulu B 2012 South Asian mammals their diversity distribution
and status Springer Science amp Business Media
Srinivasulu C Racey P A amp Mistry S 2010 A key to the bats (Mammalia Chiroptera)
of South Asia Journal of Threatened Taxa 2(7) 1001ndash1076
Uieda W 2000 A review of complete albinism in bats with five new cases from Brazil Acta
Chiropterologica 2 97ndash105
Van Grouw H 2006 Not every white bird is an albino sense and nonsense about colour
aberrations in birds Dutch Birding 28(2) 79ndash89
Van Grouw H 2013 What colour is that bird British birds 106 17ndash29
Vendan S E 2003 Roost and diet selection in the Indian Flying Fox Pteropus giganteus
(Mega chiroptera) MSc Thesis Madurai Kamaraj University India 85pp
Vyas R amp Upadhyay K 2014 Study of the Indian Flying Fox (Pteropus giganteus)
Colonies of Jambughoda Wildlife Sanctuary Gujarat India Record of the largest
roosting congregation at Targol Small Mammal Mail 6(1) 2ndash8
Suggested citation
Amin S Patel H and Vaghela P (2021) Record of Leucism in Indian Flying Fox Pteropus
giganteus (Mammalia Chiroptera Pteropodidae) from South Gujarat India Prithivya An
Official Newsletter of WCB Research Foundation and WCB Research Lab Vol 1(2) 12-17
THAKKAR amp GOHIL Birds behaviour during the Annular solar eclipse
Prithivya | August 2021 18
Notes on behavioural observation of some water birds during the Annular Solar
Eclipse
Thakkar Karan and Gohil Bharatsinh
Department of Life Sciences Maharaja Krishnakumarsinhji Bhavnagar University
Bhavnagar-364001 Gujarat India E-mail ksonpal07gmailcom
Abstract
In this communication we report the behaviour of various water birds observed during the annular
solar eclipse which happened on 26th November 2019 We observed the behaviour of eight species of
birdsrsquo viz Greater Flamingoes Phoenicopterus roseus the Indian Cormorant Phalacrocorax
fuscicollis Pied Avocet Recurvirostra avosetta Black-winged stilt Himantopus himantopus Eurasian
spoonbill Platalea leucorodia Northern shoveler Spatula clypeata Little grebe Tachybaptus
ruficollis and Dalmatian pelican Pelecanus crispus throughout the eclipse period ie from 805 AM
to 1051 AM Various behavioural chan`ges were observed in all the targeted species except the
Indian cormorant It rested on a pole for the whole eclipse period Detailed observations are given in
the note Reduction in light levels due to solar eclipse does affect the activity of birds
Key Words Solar Eclipse Behaviour Birds Bhavnagar
An annular solar eclipse was visible from 805 to 1051 AM on 26 December 2019 in India
Solar eclipse a rare and uncommon environmental event can influence and modulate the
behaviour of animals (Murdin 2001 Gil-burmann amp Beltrami 2003) Following observations
were made during the eclipse at airport Road Lake (21762837deg N 72183624deg E) in
Bhavnagar city using Nikon binoculars (1050)
Greater flamingos (n=24) on the day of the eclipse were seen foraging constantly from 805-
920 AM All of them started calling together from 921 to 935 AM After the peak of the
eclipse (ie after 921 AM) many flamingo individuals started preening Activities of Indian
cormorants varied throughout the eclipse period Pied avocets (n=13) were observed feeding
through the initial phase of the eclipse ie from 805 to 850 AM But pied avocets went onto
the resting phase from 851 to 935 AM Eight of them continued resting even after 935 AM
while the other five started feeding again Black-winged stilts (n=50) were seen resting in a
flock throughout the study period But as the eclipse increased flocks of black-winged stilts
from outside the lake started arriving and joined the original flock of 50 A group of five
black-winged stilts arrived at 852 followed by a flock of 20 at 906 AM Three other groups
of 30 50 and 10 black-winged stilts arrived from 921 to 935 AM Eurasian spoonbills
(n=30) were seen resting in water during the initial stage of eclipse ie from 808 to 920
AM From 921 to 935 AM five spoonbills started feeding 21 continued resting while 12
THAKKAR amp GOHIL Birds behaviour during the Annular solar eclipse
Prithivya | August 2021 19
started vocalizing and four flew away from the lake After 935 AM 12 individuals
continued calling 29 rested in water whereas eight individuals arrived from outside the lake
Activities of northern shoveler (n=80) varied throughout the eclipse Little cormorant (n=1)
rested on a pole for most of the observation It started feeding at 921 to 935 AM along with
one little cormorant which arrived from somewhere outside the lake After 935 both
perched at the wood in the lake Little grebe (n=1) spent most of the time feeding Between
935 and 950 AM it was joined by a flock of eight grebes that arrived from outside the lake
Pelicans (n=2) rested on a small patch of land in the lake throughout the study period
Table 1 Ethogram
Bird
Time intervals
0805-
0820
0821-
0835
0836-
0850
0851-
0905
0906-
0920
0921-
0935
0936-
0950
Greater
flamingo FD(n=24) FD(n=24) FD(n=24) FD(n=24) FD(n=24) C(n=24)
PR(n=4)
FD(n=17)C
(n=3)
Indian
Cormorant Rp(n=2) Rp(n=2)
Fi(n=2)
FD(n=4)
Rp(n=2)Fb
(n=2) Rp(n=1) Rp(n=1)Fb(n=1) _
Pied
Avocet FD(n=13) FD(n=13) FD(n=13) Rw(n=13) Rw(n=13) Rw(n=13)
FD(n=5)R
w(n=8)
Black
winged stilt Rw(n=50) Rw(n=50) Rw(n=50)
Rw(n=50)F
i(n=5)
Rw(n=55)
Fi(n=20)
Rw(n=75)
Fi(n=30)
Fi(n=50) Fi(n=10) Rw(n=165)
Eurasian
Spoonbill Rw(n=30) Rw(n=30)
Rw(n=30)
FD(n=4) Rw(n=34) Rw(n=34)
FD(n=5)C(n=12)
Fo(n=4)
Rw(n=21)
Fi(n=8)
C(n=13)
Rw(n=29)
Northern
Shoveler
PR(n=10)
Rl(n= 50)
Rw(n=20)
Rl(n= 50)
Rw(n=20)
PR(n=4)
Rw(n=50)
Rl(n=10)
Rw(n=54)
Rl(n=10)
FD(n=5)
Rw(n=54)
Rl(n=5)
Rw(n=54)
Rl(n=10)
Rw(n=54)
Rl(n=10)
Little
Cormorant Rp(n=1) Rp(n=1) Rp(n=1) Rp(n=1) Rp(n=1) FD(n=1) Fi(n=1) Rp(n=2)
Little grebe Rw(n=1) FD(n=1) FD(n=1) FD(n=1) FD(n=2) Fi(n=8)FD(n=10) FD(n=18)
Dalmatian
pelican Rl(n=2) Rl(n=2) Rl(n=2) Rl(n=2) Rl(n=2) Rl(n=2) Rl(n=2)
THAKKAR amp GOHIL Birds behaviour during the Annular solar eclipse
Prithivya | August 2021 20
Table 2 Different type of behaviours observed in bird species
BEHAVIOURS
FD Feeding
R Resting
Rp resting on an object prolonged perching on a pole or a stick in water
Rl resting on land simply sitting or standing with no noticeable movement
Rw resting in water no efforts for movement and neck resting on body(in case of ducks)
F Flight
Fb taking off from place A within a lake and settling at place B within a lake
Fa taking off from place A within a lake and settling at same place
Fo taking off from within lake and flying outside the lake
Fi arrived at lake from outside the lake
PR Preening
C Calling making some kind of voice could either be begging call roosting call or some other
B Bathing Rapid action of submerging in water and coming out
Kumar S (1981) observed the changes in the activity of cattle egrets because of the solar
eclipse Trigunayat (1997) observed that roosting Black-crowned Night-herons altered a
variety of behaviours including increased calling preening and perch shifting Nanikov et
al (2001) also mention behavioural changes in several birds due to solar eclipse A similar
trend was observed in this study as well From these limited field observations we can
conclude that reduced light level due to annular solar eclipse does interrupt normal bird
behaviour patterns
Acknowledgements
The first author is very thankful to Mr Dhavalkumar Vargiya for his kind support and
encouragement in the preparation for this article
References
Altmann J 1974Observational Study of Behavior Sampling MethodsBehaviour 49(34)
227-267 Retrieved on March 23 2020 from wwwjstororgstable4533591 bull Gil-
Burmann C Beltrami M 2003 Effect of the solar eclipse on the behavior of a
captive group of hamadryas baboons (Papio hamadryas) Zoo Biology 22 299ndash303
Kumar S 1981 Solar eclipse ndash notes on behavior of egrets J Bombay natural history
society78 3 133-136
Murdin P 2001 Effects of the 2001 total solar eclipse on African wildlife Astronomy
THAKKAR amp GOHIL Birds behaviour during the Annular solar eclipse
Prithivya | August 2021 21
Geophysics 42 40ndash42
Nankinov D Dalakthieva S Nikolov B Shurulinkov P Popov K Kirilov S Zareva
K Borisov B Stojanov G Nankinov N Minchev N Kjichukov D Nikolov I
Stanchev R Ganchev E 2001Studying the behaviour of birds during the solar
eclipse on August 11 1999 mdash Russian Ornithological Journal 142 355-369
Trigunayat M M 1997 Some behavioral observations on Night Heron Nycticorax
nycticorax (Linnaeus) during the total solar eclipse in Keoladeo National Park
Bharatpur IndiaPavo 3561ndash65
Tramer E J 2000 Bird Behavior During a Total Solar Eclipse The Wilson Bulletin 112(3)
431ndash432
Suggested citation
Thakkar K and Gohil B (2021) Notes on behavioural observation of some water birds during the
Annular Solar Eclipse Prithivya An Official Newsletter of WCB Research Foundation and WCB
Research Lab Vol 1(2) 18-21
MARJADI D Restoration of Earth with Biobased Polymer
Prithivya | August 2021 22
Restoration of Earth with Biobased Polymer
Marjadi Darshan
Shree Ramkrishna Institute of Computer Education amp Applied Sciences MTB Campus
Athwalines Surat-395001
E-mail darshanmarjadisrkiacin
Humanity is facing increasingly numerous challenges in life despite the great advancements
in science and technology over the last century All the needs of modern society eg food
fuel energy and materials are highly dependent on diminishing fossil resources The
demand for creating and using plastic throughout the world driven by the increasing usage of
plastic-based materials has been increasing and adding stress to the current waste
management infrastructures There is significant interest to decrease the reliance on
petroleum-based plastic products which causes global environmental pollution The
advancement in science and technology has enabled mankind to live longer and consume
more of the worlds resources More than eight million tons of plastic waste leak into oceans
every year which can be eased through innovative redesigns of packaging materials
Issues such as global climate change and depletion of fossil fuels both resulting from the
increased usage of energy have triggered alarms among scientists and politicians worldwide
Therefore governments industries and academia are inputting much effort towards finding a
sustainable solution for the increasing energy crisis However a similar concerted effort is
still lacking to bring about the creation and usage of sustainable materials in the modern
lifestyle In addition to the increasing demand for energy the usage of materials in the
modern lifestyle has also been increasing rapidly Considering the widespread usage of
plastics in food packaging clothes shelter communication transportation construction
health care and leisure industries plastics are the most dependable material among the other
materials that mankind is currently dependent upon Currently most of the plastics that are
widely used in various sectors are produced from petrochemical products The plastic
industry has been among the most profitable businesses and is expected to grow further
especially because of their increased demands from rapidly developing countries like India
and other parts of South-East Asia While plastics are superior materials in terms of their
production costs and diverse properties the sustainability of this synthetic material is
undoubtedly an issue that needs to be addressed Biobased and biodegradable polymeric
materials are considered amongst the most suitable alternatives for some applications The
MARJADI D Restoration of Earth with Biobased Polymer
Prithivya | August 2021 23
excessive usage of petroleum also contributes to the increased emission of CO2into the
atmosphere which is thought to be among the principal reasons for global warming and
climate change These are some of the strong and valid reasons leading towards the
development of technologies to produce biobased and biodegradable plastics
Science and technology have created the modern lifestyle that mankind is living in which
efficiency is the keyword Drawing an analogy from a bacterial culture in a shaken flask the
depletion of nutrients and the simultaneous accumulation of toxic wastes are the main
reasons for the onset of the stationary growth phase and the subsequent death phase
However unlike bacteria mankind is aware of the consequences of such activities As a
result the world population is now concerned about sustainable development
Biobased and biodegradable plastics most likely to remain less superior in terms of
production cost and material properties compared to petrochemical plastics Petroleum-based
plastics have serious environmental and social impacts due to their non-degradable nature
and the leaching of carcinogenic substances like dioxin when exposed to scratch or heat
Compared to the ease at which fossil resources are utilized renewable biobased materials
will need more effort and efficiency to be used in daily life However biobased materials are
considered superior in terms of sustainability and environmental friendly provided that they
are used judiciously and in a contented manner Hence it is in our hands to utilize our
knowledge of the environment to work towards the restoration of the earth and make it free
from single-use plastics
Suggested citation
Marjadi D (2021) Restoration of Earth with Biobased Polymer Prithivya An Official
Newsletter of WCB Research Foundation and WCB Research Lab Vol 1(2) 22-23
PATEL amp PATEL Single-use surgical mask
Prithivya | August 2021 24
Single-use surgical mask Human lifesaver or Biodiversity destroyer
Patel Jeel1 and Patel Rushika2 3
1GMERS Sola Civil Medical College Ahmedabad-380008 (Gujarat) India 2Assistant Professor Rai University Dholaka Ahmedabad-380008 (Gujarat) India 3Fellow Wildlife and Conservation Biology Research Foundation Pata-384265 (Gujarat)
India
E-mail rush2907gmailcom
The green lines represent sustainable and biodiversity conservation ways The dark brown
lines represent possible threats of single-use surgical mask to the biodiversity
Key Words Disposable mask Plastic and micro plastic pollution Conservation Threats
The COVID-19 is transmitted by respiratory droplets or aerosols and can survive in the air
for more than 24 hrs which was detected and momentarily created a pandemic situation
globally The only way to stop the transmission is to wear face mask washing hands
frequently and to maintain social distance Wearing a mask is declared as one of the
important precautionary measures by the World Health Organization (WHO) and
policymakers in every country because masks help in the significant reduction of infection
caused by touching the facemouthnose with contaminated hands (Schmutz et al 2020) The
virus COVID19has increased the demand for the surgical single-used mask in the healthcare
professionals as well as among the community Such masks are made up of polypropylene or
PATEL amp PATEL Single-use surgical mask
Prithivya | August 2021 25
high-density polyethylene (HDPE) a fossil-derived plastic which has a very high half-life
(Dharmaraj et al 2021)The mask production to the disposal statistics is presented in Table 1
Based on the reusability the mask is divided into two major groupsrsquo disposable (made up of
polymers) and reusable mask (made up of cloth material) in terms of production In present
study the details of only disposable mask is presented
Calculated based on the global entries of masks and gloves mentioned (200 millionmonth)
The average of one mask and single glove weight is 225plusmn001
Mask a threat to the ecosystem
In current situation recycling of any household medical waste is not a feasible and advisable
solution as there is a chance that it may be exposed to infectious particles There are no
particular laws or guidelines for separation and segregation which might involve several
issues Globally the dumping of masks was observed in areas such as roadside river oceans
and several open areas Usually such masks sustain in the environment for a longer period of
time (more than 400 years)(Hasan et al 2021) The misconception of masks to various birds
animals and marine creatures considering as a food and leads to trapping and entangling in
the strips of masks The single-use surgical mask not only adds litter to the environment but
No Statistics Reference
1 Estimated worldwide usage of disposable mask 129
billionmonth
Prata et al 2020
2 Production in China as on Feb 2020 116 millionday Adyel 2020
3 Order of mask in Japan as of April 2020 over 600
millionmonth
Fadare and Okoffo
2020
4 Mask disposal in the UK 53 millionday Website URL 1
5 Gloves and mask entered into the environment 200
millionmonth
Website URL 2
6 Mask reached to oceans 15 billion
Marine plastic pollution increased in last year 6200 tonnes
Website URL 3
7 Mask waste generation in India Minimum 928week
Maximum 4640week
Selvaranjan et al 2021
8 Plastic footprint in the environment due to mask and gloves
45times105 KgMonth
Present Study
Table 1 Global mask production usage and disposable statistics
PATEL amp PATEL Single-use surgical mask
Prithivya | August 2021 26
also hurting and killing a wide range of terrestrial and marine living organisms Moreover
the production process of such masks also releases greenhouse gases (Prata et al 2021) The
disposal of mask also reported as a novel source of micro plastic pollution in the environment
and entry point of the food chain (Hasan et al 2021) The single-use surgical masks are also
noted as a major causative agent of secondary disease outbreaks in all life forms including
humans (Fadare and Okoffo 2020) India does not have any sufficient resources for the
household medical waste management (Prata et al 2021) Every minute 10 kg of disposed
masks and gloves entered into the environment (Table 1)Hence it is very important to deal
with the mentioned issues and look into more sustainable sources at individual level
Herewith we suggest some measures by which we can protect the environment without
compromising human health in current pandemic situation
Snip the strips of the masks before the disposal to avoid the entangling and entrapping
issues
Dispose masks as a separate medical waste and submit it to plastic recycling
companies
Moving towards the development of biopolymer mask (Torres and Torre 2021)
Biopolymer mask were made up of gluten and nanofibers having 95 efficiency
A reusable mask could be applied in routine life for the general community Regular
cloth masks having multi-layer of high thread-count and textiles are moderately
effective and reported to block 50-70 fine droplets and particles Reusable masks
help in the reduction of waste production (85 ) Moreover economically viable
option in a country like India as it is 37 times cheaper than other masks (Prata et al
2021)
References
Adyel T M 2020 Accumulation of plastic waste during COVID-19 Science 396(6509)
1314ndash1315 httpsdoiorg101056nejmms2004740
Dharmaraj S Ashokkumar V Hariharan S Manibharathi A Show P L Chong C T
ampNgamcharussrivichai C 2021 The COVID-19 pandemic face mask waste A
blooming threat to the marine environment Chemosphere Elsevier Ltd
httpsdoiorg101016jchemosphere2021129601
Fadare O O ampOkoffo E D 2020 Covid-19 face masks A potential source of
microplastic fibers in the environment Science of The Total Environment 737
140279 httpsdoiorg101016jscitotenv2020140279
PATEL amp PATEL Single-use surgical mask
Prithivya | August 2021 27
Hasan N A Heal R D Bashar A amp Haque M M 2021 Face masks protecting the
wearer but neglecting the aquatic environment - A perspective from Bangladesh
Environmental Challenges 4 100126 httpsdoiorg101016jenvc2021100126
Prata J C Silva A L P Duarte A C amp Rocha-Santos T 2021 Disposable over
Reusable Face Masks Public Safety or Environmental Disaster Environments 8(4)
31 httpsdoiorg103390environments8040031
Schmutz M Hischier R Batt T Wick P Nowack B Waumlger P ampSom C 2020
Cotton and surgical masksmdashwhat ecological factors are relevant for their
sustainability Sustainability (Switzerland) 12(24) 1ndash13
httpsdoiorg103390su122410245
Selvaranjan K Navaratnam S Rajeev P ampRavintherakumaran N 2021 Environmental
challenges induced by extensive use of face masks during COVID-19 A review and
potential solutions Environmental Challenges 3 100039
httpsdoiorg101016jenvc2021100039
Torres F G amp De-la-Torre G E 2021 Face mask waste generation and management
during the COVID-19 pandemic An overview and the Peruvian case Science of the
Total Environment 786 147628 httpsdoiorg101016jscitotenv2021147628
Website URL 1 httpswwwgreenpeaceorguknewssingle-use-face-masks-hurting-
wildlife-what-you-can-do [Accessed on 23rd June 2021]
Website URL 2 httpswwwgreenmatterscompface-masks-wildlife [Accessed on 23rd June
2021]
Website URL 3 httpseconomictimesindiatimescomnewsenvironmentecosystem-under-
threat-as-birds-and-marine-life-ensnared-in-discarded-face-maskswidespread-
contaminationslideshow80230026cms [Accessed on 23rd June 2021]
Suggested citation
Patel J and Patel R (2021) Single-use surgical mask Human lifesaver or Biodiversity destroyer
Prithivya An Official Newsletter of WCB Research Foundation and WCB Research Lab Vol 1 (2)
24-27
PITHVA amp DHARAIYA Perception of forest staff about wildlife
Prithivya | August 2021 28
Does the contemplation of forest field staff about wildlife differ than a common man
Pithva Krishna1 2 and Dharaiya Nishith1
1 Wildlife and Conservation Biology Research Lab Hemchandracharya North Gujarat
University Patan (Gujarat) India 2Institute of Environment Education and Research Bharati Vidyapeeth Deemed University
Pune India
E-mail krishnapithva17gmailcom
Introduction
A field-based training was organized by Vadodara wildlife division Gujarat forest
department and WCB Research Lab of Hemchandracharya North Gujarat University from
September 17th to 19th 2020 with the aim to enhance the capacity of forest field staff for
monitoring and rescue of sloth bear and associated fauna The training was organized at
Jambughoda wildlife sanctuary Central Gujarat Along with the awareness about sloth bear
a small survey was carried out to understand how the field staff envisages the wildlife that is
found in their work place Total 18 frontline forest staff of different cadre such as beat guards
and round foresters from different forest ranges of central Gujarat has participated in this
survey
This study provides an insight on how
forest staffrsquos perception differs in different
animals As Q method provides qualitative
and quantitative data which helps
identifying peoplersquos perception in detail As
participants have to provide justification of
their answers it reveals some underlying
conflicts or reasons These justifications of
participants can help identify the gaps and
can be better used for conservation planning
as well as capacity building of forest field
staff
Figure 1 Forest frontline staff organizing
photos on Q Board copy Nishith Dharaiya
PITHVA amp DHARAIYA Perception of forest staff about wildlife
Prithivya | August 2021 29
Methodology
We used Q methodology for this study this method is designed and developed by William
Stephenson in 1930s (McKeown amp Thomas 1988)and allows to disclose underlying reasons
This method is widely used in social sciences studies In this method photos were used
instead of statements to know respondentrsquos perception allowing them to justify their answer
in detail without any restriction This method allows both qualitative and quantitative data on
perception of the person being interviewed
We categorised the Q Method into two parts first organising 16 photos of locally found
animals on a Q-board (figure 1(b)) followed by explanation for each photo which are placed
on Q-board by the respondent As shown in the figure 1(a) the participants were asked to
organise photos in Q- board as per their liking and disliking towards the animals and to
provide reasons which were recorded in mobile phone devise A list of all the wildlife photos
used for this survey is provided in table 1
-3 -2 -1 0 +1 +2 +3
Negative Positive Neutral
Figure 1(a) Representative sort of organized Q-
board by a participant
Figure 1(b) A Q-board on which the
respondents organize the photos
PITHVA amp DHARAIYA Perception of forest staff about wildlife
Prithivya | August 2021 30
Photo
ID
Common name Scientific name
1 Wild boar Sus scrofa
2 Hanuman langur Semnopithecus entellus
3 Indian cobra Najanaja
4 Indian giant flying squirrel Petauristaphilippensis
5 Small Indian civet Viverricula indica
6 Sloth bear Melursus ursinus
7 Indian hare Lepus nigricollis
8 Indian python Python molursus
9 Barn owl Tyto alba
10 Grey francolin Francolinuspondicerianus
11 Red-wattled lapwing Vanellus indicus
12 Rhesus macaque Macaca mulatta
13 Black kite Milvus migrans
14 Common krait Bungarus caeruleus
15 Indian crested porcupine Hystrix indica
16 Blue bull Boselaphustragocamelus
Q sort analysis
In this study three factors were derived based on participantrsquosjustification which is explained
in detail in the result section A factor in this study is a category representingthe group of
people who have similar perspective(Brown 1980) The higher the factor loading the more
highly that sorts are correlated with that factor (Ramlo 2008 Ramlo amp Newman 2011)The
sorts refer to the photos assembled by participants on Q-board (figure 1(b))In order to
analyse the data a software PQMethod(httpschmolckorgqmethod)was used which is
specially designed for Q-analysis Q sorts are the number of participants that took part in the
survey All the data were entered manually in this software and correlation was calculated
among each sort The correlation matrix for the extracted factor was analysed through a
principal component factor analysis with varimax rotationfor which options are provided in
the software (figure 2)
Table 1 Photos of wildlife used for this study
PITHVA amp DHARAIYA Perception of forest staff about wildlife
Prithivya | August 2021 31
Results and Discussion
The three factors that emerged
are shown in Table 2 with
automatic pre-flagging
Participants having similar
perceptions are put together in
their respective factors and
marked in bold and have ldquoXrdquo
next to their score Out of 18
sorts 17 sorts were found
complete by the software and
were further analysed Each of
three factors represents a different perspective towards the photos provided to them
Participants were named as PART001 PART002 and so on to keep their identity unrevealed
In table 2 there are 8 participants belonging to factor 1 with 29 of the variance explained
followed by 7 participants in factor 2 having 26 explained variance and 2 participants
belonging to factor 3 with 14 explained varianceOnce factor score calculated by the
software distinguishing tables were developed in this analysis for each factor which differ
from each other that is explained further in this section The distinguishing tables for each
factor explains differences between factors(Brown 1971 Ramlo amp Newman 2011 Brown
1993)In order to determine distinguishing statements average Z-score of respondentrsquos factor
score was calculated by the software
Figure 2 Screenshot of analytical option available in PQM
method Software
PITHVA amp DHARAIYA Perception of forest staff about wildlife
Prithivya | August 2021 32
Table 2 Extracted factor score from Q-sorts
Q-Sorts ID Factor 1 Factor 2 Factor 3
1 PART001 08530X 01248 -01223
2 PART002 00414 08084X 01708
3 PART003 06945X 00471 03983
4 PART004 07683X 01839 -00156
5 PART005 05450X 00166 02332
6 PART006 04208 07241X 04006
7 PART007 01728 01377 09013X
8 PART008 06930X 05214 03237
9 PART009 06516X 04289 04265
10 PART010 05119 06142X 00921
11 PART011 08475X -00072 -02626
12 PART012 03742 -05333 04456
13 PART013 00481 08292X 03240
14 PART014 -00002 06395X -03574
15 PART015 06577X 02179 01940
16 PART016 -00614 01991 06372X
17 PART017 04469 07611X 01835
18 PART018 05679 07564X 01465
Explained variance 29 26 14
Note number in bold shows respondents belong to those respective factors
Table 3 shows different factor score for each animal photo and depending on statistical
significance the photo load to a specific factor The above table contains 16 photos and their
grid position for all three factors (perception table 2) For example Indian python was
disliked by participants therefore it is scored at -2 for respondents grouped under factor 1 +1
for factor 2 andfor factor 3 it was scored at +2 For factor 1 the most liked species by
participants is Indian hare and most disliked species is wild boar Most liked species for
factor 2 is Indian leopard and most disliked animal is fruit bat For factor 3 most liked
species is Indian hare scored at +3 and most disliked species is wild boar scored at -3 by the
participants
PITHVA amp DHARAIYA Perception of forest staff about wildlife
Prithivya | August 2021 33
Table 3 Aggregate factor values of each 16 photos
Aggregate values
No Photos Factor 1 Factor 2 Factor 3
1 Indian python -2 1 2
2 Hanuman langur 0 0 2
3 Monitor lizard -1 -2 -1
4 Red-wattled lapwing 1 -1 1
5 Sloth bear 2 2 0
6 Indian hare 3 1 3
7 Leopard 2 3 0
8 Grey francolin 1 -1 -1
9 Indian giant flying squirrel 1 1 -2
10 Blue bull 0 0 0
11 Small Indian civet 0 0 -1
12 Fruit bat (Flying fox) -1 -3 -2
13 Indian cobra -2 2 1
14 Barn owl 0 0 0
15 Indian chameleon -1 -1 0
16 Wild boar -3 -2 -3
Factor 1 Economic impact
This factor was described by 8 participants mainly concerning economic impact Animals
that cause harm economically by destroying crops and threat to human life and livestock
Participants of factor 1 thinks fruit bat Indian python and Indian cobra causes high level of
economic harm Grey francolin is scored +1 due to its contribution to reduce impact by eating
pest insects from agricultural field Though the most disliked animal is wild boar for factor 1
as shown in table 3
PITHVA amp DHARAIYA Perception of forest staff about wildlife
Prithivya | August 2021 34
Table 4 Distinguishing photos for factor 1
Factor 2 Aesthetic spiritual values and conservation aspects
This factor explains aesthetic spiritual values and conservation aspects which includes
appearance tourist attraction rehabilitation and religious belief There are 7 responses in this
factor (table 2) Respondents are observed to have negative opinions towards animals which
play major role in economic loss but positive towards animalrsquos beauty and its natural
charisma Table 5 shows how score of animals for factor 2 is different from the score of
factor 1 and factor 3 For example Indian cobra is scored at +2 in factor 2 as it is attractive to
participants but it is scored -2 for factor 1 as it threatens human life
Table5 Distinguishing photos for factor 2
Photo
ID Photos
Grid
position
for
Factor 1
Z-score
of
Factor 1
Grid
position
for
Factor 2
Z-score
of
Factor 2
Grid
position
for
Factor 3
Z-score
of
Factor 3
13 Indian cobra -2 -119 2 127 1 037
6 Indian hare 3 148 1 067 3 189
1 Indian python -2 -103 1 034 2 122
4 Red-wattled
lapwing 1 014 -1 -065 1 079
16 Wild boar -3 -189 -2 -125 -3 -201
Photo
ID Photos
Grid
position
for
Factor
1
Z-score
of
Factor
1
Grid
position
for
Factor
2
Z-score
of
Factor
2
Grid
position
for
Factor
3
Z-score
of
Factor 3
8 Grey francolin 1 095 -1 -046 -1 -067
12 Fruit bat (Flying -1 -02 -3 -182 -2 -11
1 Indian python -2 -103 1 034 2 122
13 Indian cobra -2 -119 2 127 1 037
PITHVA amp DHARAIYA Perception of forest staff about wildlife
Prithivya | August 2021 35
Factor 3 Lack of awareness
This factor describes lack of awareness which includes lack of interest compared to other
animals and species This factor mainly concerns individuals who lacks knowledge proper
information and are not aware about the species For example in table 6 the score of Indian
giant flying squirrel differs from factor 3 to factor 1 and 2 as it is scored at -2 +1 and +1
respectively The justification for negative score given by the participants is that they are not
aware about the presence of the species therefore they do not have any information on the
species
Table 6 Distinguishing photos for factor 3
Photo
ID Photos
Grid
position
for
Factor 1
Z-score
of
Factor
1
Grid
position
for
Factor 2
Z-score
of
Factor
2
Grid
position
for
Factor 3
Z-score
of
Factor 3
1 Indian python -2 -103 1 034 2 122
2 Hanuman langur 0 -02 0 -045 2 110
13 Indian cobra -2 -119 2 127 1 037
5 Sloth bear 2 138 2 135 0 -000
7 Leopard 2 133 3 181 0 -000
9 Indian giant flying
squirrel 1 096 1 062 -2 -122
Conclusion
The perception of forest field staff was better understood using Q method analysis
considering various aspects It is seen that participants tend to like animals such as Indian
leopard sloth bear Hanuman langur and Indian hare as they are scored positive or neutral
The animals that are not given negative score in any factor due to their appearance are seen
frequently and does not lack awareness It is observed from the data that frontline forest staff
lacks knowledge about animals that are not seen or present in their forest rangebeat As
frontline forest staff they should be aware about existence of animal species that are found in
Gujarat state along with their ecological importance threats and conservation values Some
participants were not even aware about the existence of the species in the wild such as Indian
giant flying squirrel Although being frontline forest staff their perception is biased towards
animals such as wild boar monitor lizard and flying fox bat due to the economic loss they
PITHVA amp DHARAIYA Perception of forest staff about wildlife
Prithivya | August 2021 36
may cause and weird appearance Their perception becomes the same as a common man
when every animal should be equal to frontline forest staff as it is their job to protect forest
and its animals Some participants believe in superstitions of bad luck of barn owl and
monitor lizard which shows their common man perception and lack of right information
Recommendations
A separate training or workshops should be organised by forest department focused on
animal species found in Gujarat This will help them enhancing their existing knowledge and
it will provide them with some scientific insights Having basic scientific knowledge will
help remove some barriers like superstitions and other beliefs Field trips should be organised
in different part of state to gain practical experience Team building activities should be
conducted between staff of different forest divisions
Acknowledgements
We are thankful to all the forest field staff who participated in this survey We also thank to
the Deputy Conservator of Forests Vadodara Wildlife Division of Gujarat Forest Department
and sincerely acknowledge the help from our research team members
References
Brown S R (1980) Political subjectivity applications of Q methodology inpolitical science
E Ramlo S and Newman I (2011) Q Methodology and Its Position in the Mixed-Methods
Continuum Operant Subjectivity 34(3) 172ndash191
McKeown B and Thomas D B (1988) Q Methodology SAGE Publications
R Brown S (1993) A Primer on Q Methodology Operant Subjectivity 16(34) 91ndash138
Ramlo S E (2008) Determining the various perspectives and consensus within a classroom
using Q methodology AIP Conference Proceedings 1064 179ndash182
httpsdoiorg10106313021248
Suggested citation
Pithva K and Dharaiya N (2021) Does the contemplation of forest field staff about wildlife differ
than a common man Prithivya An Official Newsletter of WCB Research Foundation and WCB
Research Lab Vol 1(2) 28-36
PANCHAL amp JHA Qualitative phytochemical analysis
Prithivya | August 2021 37
Qualitative phytochemical analysis of some medicinal plants (leaves) from the
surrounding area of Talod Taluka North Gujarat India
Panchal Mital and Jha Charumati
Department of Botany Smt Panchal Science college Talod ndash383215 North Gujarat India
E-mail mitalpanchal0gmailcom
Abstract
The tremendous biological variety of North-Eastern India has long been recognised Five medicinal
plants were chosen for this study Manilkara zapota (L) van Royen Manilkara hexandra (Roxb)
Dub Mangifera indica L Madhuca indica JF Gmel and Annona squamosa L The purpose of this
study was to look into the existence of Phytochemicals such as Alkaloid Amino acid Carbohydrate
Protein Glycoside Tannin Terpenoid Saponin Flavonoid and Steroids in the medicinal plants that
were chosen For the organic solvent extraction the Soxhlet apparatus was utilized Water acetone
and chloroform were utilised as solvents Our findings show that the examined plants crude aqueous
and organic solvent extracts contain medicinally relevant bioactive components justifying their usage
in traditional medicines for the treatment of various ailments
Key Words Qualitative phytochemical analysis Manikara zapota M hexandra Madhuka
indica Mangifera indica Annona squamosa
Introduction
Phytochemicals are non-nutritive substances Chemical compounds are produced naturally on
plants during metabolic processes and contain a wide range of proactive and disease-
preventive qualities These compounds are known to be produced by plants in order to defend
themselves Recent study has shown that they can also play a vital role in illness prevention
in humans Even some of these herbs have been used for millennia as traditional medicine
Most phytochemicals such as flavonoids carotenoids and polyphenols have antibacterial
action and can be used to treat infections The following plant species were studied
Manilkara zapota (L) van Royen M hexandra (Roxb) Dub Mangifera indica L Madhuca
indica JF Gmel and Annona squamosa L
Plants play a universal function in the treatment of sickness as seen by their use in every
major system of medicine regardless of philosophical foundation Plants are vital to the
pharmaceutical industry because they are a rich supply of pharmaceuticals and a vast
reservoir of chemical variety for drug development screening procedures The majority of the
medications mentioned in the Indian medicinal system are derived from plants
PANCHAL amp JHA Qualitative phytochemical analysis
Prithivya | August 2021 38
Medicinal plants have been used to treat disease all across the world for thousands of years It
is generally understood that some plants with active chemicals can limit microbial
development Plants ability to generate chemicals via secondary metabolism determines their
antimicrobial potency Secondary metabolites emerged as the most important class of
chemicals with a wide spectrum of antibacterial and antifungal properties When compared
to conventional fungicides used to inhibit microbial growth and survival these plant
chemicals have different structures and activities
Plants are a major source of Traditional medicine and can be used to cure a variety of
conditions with little adverse effects Traditional medical practises are not only beneficial in
the treatment of diseases but they also aid in the discovery of pharmaceutically active
compounds in plants which can aid in the commercial manufacture of pharmaceuticals From
ancient times the importance of plant diversification in health care has been extensively
recognised According to a literature review more than 50000 plant species have been
successfully employed for medical purposes globally with flowering plants accounting for
over 13 of these
Material and methods Plant collection and Identification
M zapota (L) van Royen M hexandra (Roxb) Dub M indica L M indica JF Gmel
and A squamosa L were among the plant species studied The plants were harvested from
the land in the Talod taluka in North Gujarat India The washed plant leaves were kept in for
drying after being cleaned with tap water around 2-3 times to evaporate the water content
With the use of a mechanical blender the sample was ground into a fine powder after drying
The powder is then kept in an airtight plastic container for future usage with adequate
labelling
Extraction technique
Extraction is the separation of inert plant tissue constituents from medicinally active plant
tissue constituents using a conventional extraction process Menstrum is a selective solvent
that is used to eliminate inert material and to obtain the curative part of the procedure through
therapy
PANCHAL amp JHA Qualitative phytochemical analysis
Prithivya | August 2021 39
Method and Plant extraction
Solvent extraction
The crude plant extract was made using the Soxhlet extraction method 10 gm of powdered
plant material was placed into a thimble and 300 ml of solvents were extracted separately
Acetone and chloroform were utilized as solvents In a syphon tube of an extractor the
extraction process continued for 24 hours until the solvent became colourless The extract
was then placed in a beaker The extract was then retained and cooked on a hot plate at 30- 40
degC until all of the solvent had evaporated The dried extract was stored at 4degC in a refrigerator
for future phytochemical investigation
Methods of phytochemical analysis
Alkaloid
Wagnerrsquos test A few drops of Wagners reagent were applied to 2mg of extract that had
been acidified with 15 percent vv hydrochloric acid The presence of alkaloids is indicated
by a yellow or brown ppt
Carbohydrates
Molischrsquos test 2mg of ethanolic extract was mixed with 10ml water filtered and
concentrated 2ml of conc sulphuric acid was added to these 2 drops of freshly prepared 20
alcoholic alpha-naphthol solution forming a layer below the mixture red-violet ring showing
the existence of carbohydrates that disappears when sufficient alkali is added
Amino acid
Ninhydrin test Boil for a few minutes 2ml Ninhydrin reagent + 2ml extract The production
of blue colour indicates the presence of amino acids
Steroids
Salkowski reaction 2mg of dry extract was combined with chloroform to the chloroform
layer sulphuric acid was gently introduced by the sides of the test tube The emergence of a
red colour indicated the presence of steroids
Tannin A few drops of a 5 percent wv Fecl3 solution were added to 1-2 ml of the ethanolic
extract Gallo tannins are shown by a green colour whereas pseudo tannins are indicated by a
brown colour
Flavonoids After mixing 2ml of each extract with a few drops of 20 sodium hydroxide a
bright yellow colour was seen A few drops of 70 dilute hydrochloric acid were added to
PANCHAL amp JHA Qualitative phytochemical analysis
Prithivya | August 2021 40
this and the yellow coloration disappeared The presence of flavonoids in the sample extract
is shown by the formation and disappearance of yellow colour
Saponins 6ml distilled water was added to 2 ml of each extract and rapidly shaken the
presence of saponin is indicated by the production of bubbles or persistent foam
Proteins adding 1 ml of 40 percent sodium hydroxide and a few drops of 1 percent copper
sulphate to 2ml of each extract The production of violet colour shows the presence of peptide
linkage molecules in the sample extract
Glycosides 05ml of glacial acetic acid and 3 drops of 1 aqueous ferric chloride solution
added in to 1ml of each extract The creation of a brown ring at the interface shows the
presence of glycosides in the sample extract
Terpenoids 1ml of each solvent is mixed with 05ml chloroform and a few drops of strong
sulphuric acid to produce a reddish-brown precipitate that confirms the presence of Terpenoid
in the extract
Table 1 Preliminary Phytochemical analysis
Class of
compounds
Manilkara
zapota
Manilkara
hexandra
Mangifera
indica
Madhuka
indica
Annona
squamosa AE CE WE AE CE WE AE CE WE AE CE WE AE CE WE
Alkaloid + + - + - - + + - + - - + - -
Amino acid - - - - - - - - - - - - - - -
Carbohydr
ate
+ + - + - + + - - - - - - - -
Protein - - + + - + + - + - - - - - +
Glycoside + - - + - + - - - - - + - - -
Tannin - - + - - - + + + + - + + + +
Terpenoid - + - - - - - - - - - + - - -
Saponin - + + + - + + - + + - + + - -
Flavonoid - + + - - + - - + - - + + - -
Steroid + - + - - + - - + - - - - - -
Where lsquo+rsquo = positive and lsquo-rsquo = negative
AE= Acetone extract CE= Chloroform extract WE= Water extract
Alkaloid carbohydrate glycoside and steroid are all found in Acetone extract of M zapota
leaves Chloroform extract of M zapota leaves contains alkaloid carbohydrate terpenoid
PANCHAL amp JHA Qualitative phytochemical analysis
Prithivya | August 2021 41
saponin and flavonoid Protein Tannin Saponin Flavonoid and Steroid can be found in the
aqueous extract of M zapota leaves alkaloid carbohydrate protein glycoside and saponin
are all found in Acetone extract of M hexandra leaves All phytochemicals are missing in the
chloroform extract of M hexandra leaves Aqueous extract of M hexandra leaves contains
carbohydrate protein glycoside saponin flavonoid and steroid Alkaloid Carbohydrate
Protein Tannin and Saponin are all found in Acetone extract of M indica leaves Alkaloid
and Tannin are found in Chloroform extract of M indica leaves Protein Tannin Saponin
Flavonoid and Steroid are found in aqueous extract of M indica leaves Alkaloid and
Tannin are found in Acetone extract of M indica leaves Chloroform extract of M indica
leaves is devoid of all phytochemicals Aqueous extract of M indica leaves contains
Glycoside Tannin Terpenoid Saponin and Flavonoid Alkaloid Tannin Saponin and
Flavonoid are all found in Acetone extract of A squamosa leaves Aqueous extract of A
squamosa leaves contains protein and tannin
Discussion
Plant samples were subjected to phytochemical analysis which confirmed the existence of
elements with medicinal and physiological properties Phytochemicals such as carbohydrate
amino acid protein tannin flavonoid saponin glycoside steroid terpenoid and alkaloids
were found in the plant extracts
Tannins attach to proline-rich proteins preventing them from being synthesized Flavonoids
are hydroxylated phenolic compounds that plants produce in response to microbial infection
and have been discovered to have antibacterial properties in vitro against a wide range of
pathogens Their capacity to combine with extracellular and soluble proteins as well as the
bacterial cell wall is most likely the reason for their activity They are also powerful
antioxidants with anticancer properties
Saponins which are known to have an anti-inflammatory impact were also discovered in the
plant extracts Saponins have the ability to coagulate and precipitate red blood cells Saponins
are known for their ability to produce foams in aqueous solutions as well as their hemolytic
activity cholesterol binding capabilities and bitterness Steroids have been shown to have
antimicrobial characteristics and they are extremely essential molecules particularly in
regard to sex hormones For millennia alkaloids have been associated with medical purposes
and cytotoxicity is one of their most prevalent biological features Alkaloids have been shown
PANCHAL amp JHA Qualitative phytochemical analysis
Prithivya | August 2021 42
to have analgesic antispasmodic and antibacterial effects by several researchers Glycosides
have been shown to reduce blood pressure in numerous studies The findings of this study
indicate that the detected phytochemical substances may be bioactive constituents and that
these plants are proving to be a valuable reservoir of bioactive compounds with significant
medical value
Conclusion
The findings demonstrated that the plants investigated contained medicinally essential
components Many previous investigations had accumulated evidence that the discovered
phytochemical was bioactive Several studies have demonstrated that these phytochemicals
contribute pharmacological and physiological qualities to the plants researched in the
treatment of various illnesses As a result extracts from these plants could be considered a
valuable source of drugs Further research should be carried out to separate purify and
characterize the active ingredients responsible for the activity of these plants as well as
further work to isolate purify and characterize the active constituents responsible for the
action of these Plants In addition more research into the putative mechanisms of action of
these extracts is urged
Acknowledgement
Authors are thankful to Disha life sciences Pvt Ltd for practical work during this study
References
Ashwin Godghate Rajaram Sawant Ashok Sutar (2012) Phytochemical Analysis of
Ethanolic extract of Roots of Carrisa carandus Linn RasayanJChem 5(4)456-
459
K Girija P Udaya Chandrika K Lakshman N Pruthvi (2010) Evaluation of Antimicrobial
activity of various Bark extracts of Bombax malabaricum IntJResPharmSci
1(2)199-204
Khalid S Shahzad A Bashrat N Abubakar M Anwar P (2018) Phytochemical screening and
Analysis of selected Medicinal Plants in Gujarat J Phytochemistry Biochem 2108
Kodangala C Saha S Kodangala P (2010) Phytochemical studies of Aerial parts of the Plant
Leucas lavandulaefolia Der Pharma Chemica 2(5)434-437
PANCHAL amp JHA Qualitative phytochemical analysis
Prithivya | August 2021 43
Manash PS et al (2016) Phytochemical Analysis of Traditional Medicinal Plants and their
Antimicrobial activity An Experience from North East India J Pharm Res
1(1)000104
Prabhavathi R M Prasad M P and Jayaramu M (2016) Studies on Qualitative and
Quantitative Phytochemical Analysis of Cissus quadrangularis Advances in Applied
Science Research 7(4)11-17
Pushpendra K Patel Narendra K Prajapati and BK Dubey (2012) Madhuka indica A
Review of its Medicinal property IJPSR 3(5) 942-950
RNS Yadav and Munia Agrawala (2011) Phytochemical analysis of some medicinal plants
Journal of Phytology 3(1)10-14
S Hemadri Reddy Aisha Khalid AL-Hinai Hajer Hafed AL-Yaqoobi and Fatima Jafar AL-
Ajmi (2016) Phytochemical analysis antimicrobial screening and Hypoglycemic
effect of some selected Medicinal plant extract from Oman Journal of Experimental
Biology and Agricultural Sciences 4(2)218-224
Suggested citation
Panchal M and Jha C (2021) Qualitative phytochemical analysis of some medicinal plants (leaves)
from the surrounding area of Talod Taluka North Gujarat India Prithivya An Official Newsletter
of WCB Research Foundation and WCB Research Lab Vol 1(2) 37-43
DHARAIYA A Remote sensing
Prithivya | August 2021 44
Remote sensing An overview with fundamentals and applications
Dharaiya Aditya
Geology Department MG Science Institute Ahmadabad ndash 380009 (Gujarat) India
E-mail adiradhugmailcom
Introduction
The general concept of remote sensing can be inferred by a simple statement ie the
acquisition of information from a specific distance Scientifically it is the science of
acquiring information about an object or phenomenon by measuring emitted and reflected
radiation (Ray 2013) According to Lillesand et al (2015) remote sensing is defined as the
science and techniques of obtaining information about an object land area phenomenon or
ecosystem process acquired by a device that is not in direct contact with the object area or
phenomenon under investigation The data collection is done remotely using various sensors
which may be further analyzed to obtain information about the objects areas or phenomenon
These acquired data can be of many forms such as variations in force distributions acoustic
wave and electromagnetic energy distributions Joseph (2005) has discussed modern remote
sensing as an extension of the natural phenomenon of visual perception of objects Apart
from visible spectrum the electromagnetic radiation from the ultraviolet to far infrared and
the microwave regions is used for remote sensing The observations which are directly
inferred through electromagnetic radiation (EMR) from the sun or self-emitted radiance is
called passive remote sensing Whereas in active remote sensing the electromagnetic
radiations of a specific wavelength or band of wavelengths are generated to illuminate the
targets and reflected or back-scattered EMR are recorded to gain information for example
LiDAR RADAR SAR etc Based on its applicability remote sensing is defined as sensing
of the earthrsquos surface from the space by making use of the properties of electromagnetic wave
emitted reflected or diffracted by the sensed objects for the purpose of improving natural
resource management land use and environmental protection The classification of remote
sensing is further based on the selection of EMR (eg optical and microwave Navalgund et
al (2007)) When the sensors detect the solar radiation in the visible and infrared wavelength
regions reflectedscattered or emitted from the earth is said as optical remote sensing and in
microwave remote sensing uses interference and polarization concepts with electromagnetic
energy that detects the scattered energy returning from the terrain and records it as an image
The main purpose of remote sensing is to have an organized systematic and large amount of
DHARAIYA A Remote sensing
Prithivya | August 2021 45
data collection in order to acquire information about 2 or 3 dimensions of real objects One
can get large and broad global coverage and repeatability of data to obtain a multipurpose
information through various earth observation satellite sensors which helps in detecting
things that are normally absent in visible spectra such as Land-surface temperature
Underground or sub-surface water etc There are several Earth Observation (EO) Satellites
namely Cartosat series Landsat series Sentinel 1 2 MODIS RISAT 1 and RADARSAT 2
Resourcesat Envisat IRS 1A Oceansat 2 and many more
Electromagnetic Spectrum
Electromagnetic radiation or EMR is the term used to describe all of the different types of
energies released by electromagnetic processes Visible light is just one of many forms of
electromagnetic energy Radio waves infrared light and X rays are all forms of
electromagnetic radiation The
electromagnetic waves are formed by
the vibrations of electric and magnetic
fields these vary in magnitude in a
direction perpendicular to the direction
of propagation of radiations at a
constant speed of light (c= 3108
ms)Figure 1 shows a generalized
concept of EMR These differ from
mechanical waves as they need not
require a medium to propagate
hence it is able to travel through air
and solid materials and can also
travel through the vacuum of space Thus to define the EMR scientifically it can be said as a
form of energy emitted or absorbed by charged particles which exhibits wave-like behavior
as it travels through space
The electromagnetic spectrum is the entire range of all possible frequencies of
electromagnetic radiation (Figure 2) This includes the electromagnetic energy ranging from
Gamma rays to radio waves where the wavelength becomes longer so the energy and
frequency gradually decreases There are four kinds of resolution that are described from the
EMR spectrum are as follows
Figure 1 Illustration on the concept of EMR in which
propagation of electric and magnetic field is shown
Source - httpwwwfaoorg3t0355eT0355E02HTM accessed on 25
th
April
2021
DHARAIYA A Remote sensing
Prithivya | August 2021 46
1 Spectral resolution ndash it is the variation in the reflectanceemittance as a function of
wavelength Spectral responses are recorded by separate spectral bands such as Red Blue
Green Thermal NIR etc Figure 3 depicts the spectral resolution through a reflectance
curve It is further divided into 4 class sub classes
a Panchromatic ndash It consists
of only 1 band (BW)
b Colour ndash It consists the
combinations of 3 colors of
visible spectrum (RGB)
c Multispectral ndash consists of
3 to 10 bands and offers
Medium level spectral
resolution(Feng et al 2020)
d Hyper spectral ndash consists
of 100s of band and offers
higher spectral resolution (Feng et al 2020)
The combinations of spectral reflectance from two or more wavelength that indicate the
relative abundance of feature of interest are known as spectral indices Vegetation indices are
the most popular type but other indices are available for burned area built-up features
Figure 2 Electromagnetic spectrum showing waves and the radiations with respect to
wavelength and frequency
Figure 3 Spectral reflectance curve to determine spectral
resolution
Source -httpgsphumboldtedu accessed on 8th
April 2021
Source ndashLillesand et al (2015) Remote sensing and Image interpretation 7e
DHARAIYA A Remote sensing
Prithivya | August 2021 47
hydrologic and geologic features The band combinations for formulating spectral indices
vary from satellite to satellite Some of the most common spectral indices are listed in
Table1
No Spectral indices Formulation
(Band combinations)
1 NDVI (Normalised Difference Vegetation
Index)
NIR ndash Red NIR + Red (Where NIR is
Near-infrared band)
2 NDWI (Normalised Difference Water Index)
NDMI (Normalised Difference Moisture Index)
NIR - SWIR NIR + SWIR
3 AVI (Advanced Vegetation Index) [NIR (1-Red) (NIR-Red)] 13
4 NDSI (Normalised Difference Snow Index) Green ndash SWIR Green + SWIR
5 SAVI (Soil Adjusted Vegetation Index) ((NIR ndash R) (NIR + R + L)) (1 + L)
Where L is soil brightness correction
factor
6 MSI (Moisture Stress Index) MIR NIR Where MIR is Middle-wave
Infrared
7 NDGI (Normalised Difference Glacier Index) NIR ndash Green NIR + Green
8 NDBI (Normalised Difference Built-up Index) SWIR ndash NIR SWIR + NIR
9 BSI (Bare Soil Index) ((Red + SWIR) ndash (NIR + Blue)) ((Red
+ SWIR) + (NIR + Blue))
2 Spatial resolutionndashIt is described as the measure of the smallest object that can be resolved
by the sensor or the ground area imaged for the instantaneous field of view (IFOV) of the
ground sensor or the linear dimension on the ground represented by each pixel in the
reflectanceemittance determined by the shape size and texture of the target as discussed in
the book entitled Advance Remote Sensing 2012 It is expressed in meters like (250 m 80
m 10 m 1 m resolutions etc) Figure 4 is an example of spatial resolution
10 m resolution 30 m resolution
(a) (b)
Table 1 Different kinds of Spectral indices with respect to their formulations of band
Source -httpsgiscrackcomlist-of-spectral-indices
Source -httpsgiscrackcomlist-of-spectral-indices
Source -httpsgiscrackcomlist-of-spectral-indices
combinations
Figure 4 Example of Spatial Resolution by imagery acquired from Sentinel (a) and Landsat (b)
satellite sensors
Source -httpsgiscrackcomlist-of-spectral-indices
DHARAIYA A Remote sensing
Prithivya | August 2021 48
3Temporal resolution ndash the amount of time needed to revisit and acquire data for the exact
same location is called temporal resolution for example the revisit time period of Landsat is
16 days and that of Sentinel is 10 days Figure 5 shows the processed temporal resolution
4 Radiometric resolution ndash When an image is acquired by a sensor its sensitivity to the
magnitude of the electromagnetic energy determines the radiometric resolution The finer the
radiometric resolution of a sensor the more sensitive it is to detecting small differences in
reflected or emitted energy
Components and process of remote sensing
Figure 6 briefly describes the
process of remote sensing
Though the methods for
collection processing and
interpretation of remotely sensed
data are diverse imaging systems
have the following essential
components
Figure 5 Example of Temporal resolution of Las Vegas over time in 1973 2000 and 2006
Figure 6 A generalized process components of remote
sensing technology
Source- httpsseos-projecteuremotesensing
Source - httpswwwgisoutlookcom2019 accessed on 8th
April 2021
DHARAIYA A Remote sensing
Prithivya | August 2021 49
1 Energy source or illumination
This is the basic requirement for process of remote sensing to have a source of energy that
illuminates electromagnetic energy to the target of interest for example Active and passive
ensors Mostly the sensors are passive which tends to measure the solar radiation reflected
from the target
2 Interaction with the atmosphere
Before the electromagnetic radiation reaches the Earths surface it has to travel through some
distance of the Earths atmosphere Particles and gases in the atmosphere can affect the
incoming light and radiation and such type of effects are caused by the mechanisms
of scattering and absorption (Figure 7)Scattering occurs when particles or large gas
molecules present in the atmosphere interacts and cause the electromagnetic radiation to be
redirected from its
original path It depends
on several factors
including the
wavelength of the
radiation the abundance
of particles or gases and
the distance the radiation
travels through the
atmosphere There are three 3 types of scattering which take place are described in Table 2
All the different types of scattering with examples are briefly shown in figure 8
No Types of Scattering Particle size
(Micro meters
μm)
Examples
1 Rayleigh lt 01 μm Small specks of Dust N2 O2
molecules
2 Mie ~ 1 to 10 μm Pollen Smoke Water vapour
3 Non ndash Selective gt 10 μm Water droplets and large dust
particles
Figure 7 Interaction of EMR with atmosphere (a) Scattering and (b)
Absorption
Table 2 Different types of scattering occur when EMR interacts with the atmosphere
Reference httpswwwnrcangccamaps-tools-publications
DHARAIYA A Remote sensing
Prithivya | August 2021 50
Absorption is the other main mechanism when EMR interacts with the atmosphere In
Contrast to scattering it causes molecules in the atmosphere to absorb specific amount of
energy at various wavelengths O3 CO2 and water vapour are 3 main atmospheric
constituents which absorbs radiation Those areas of the EMR spectrum which are not
severely influenced by atmospheric absorption and thus are useful for remote sensors are
called Atmospheric windows (Figure 9) The visible portion of the spectrum to which our
eyes are most sensitive corresponds to both the atmospheric window and the peak energy
level of the sun
Figure 8 Different types of scattering when EMR interacts in the atmosphere or with the
Earthrsquos surface
Figure 9 Atmospheric window showing the transmission of molecules at different wavelength
with respect to different radiations
Source - httpwwwgeooregonstateedu accessed on 8th
April 2021
Source - httpwwwsarraceniacomastronomy accessed on 8th
April 2021
DHARAIYA A Remote sensing
Prithivya | August 2021 51
3 Interaction with the target
After the interaction with atmosphere once the energy makes its way to the target through the
atmosphere it interacts with the target depending on the properties of both the target and the
radiation Figure 10 shows such examples of interaction This can take place a second time as
the energy travels back from the target to sensor Several interactions are possible when
electromagnetic energy encounters matter whether solid liquid or gases are as follows
Radiation may be transmitted or passed through the substance
It may be absorbed and give up its energy largely to heating the substance
It may be emitted as a function of its emissivity and temperature
It may be reflected in 2 ways specular and diffused (Scattered)
4 Recording of Energy by the sensor
After the energy has been scattered by or emitted from the earthrsquos surface there is a need for
a sensor which is mounted on a satellite to collect and record the EMR The sensors are
popularly known by EMR region they sense Remote sensing has a broad classification of
optical and microwave as well as active and passive remote sensing as discussed by
Navalgund et al(2007) Feng et al (2020) Ray (2013) The sensors for taking
observations needs to be mounted on a platform This could be ground based (eg handheld
radiometers) airborne (eg Drone AVIRIS sensor of NASA on board aircraft) or space-
borne (ie satellite based)
Figure 10 EMR interaction with the Earthrsquos Surface
Source httpswwwslideservecomportia copy Rick Lathrop accessed on 25th
April 2021
DHARAIYA A Remote sensing
Prithivya | August 2021 52
5 Transmission Reception and Processing
The energy recorded by the sensor has to be transmitted often in electronic form to a
receiving and processing station at the earth where the data are processed and stored in digital
form
6 Interpretation and analysis
Furthermore this processed data is interpreted visually and digitally to extract information
about the target which was illuminated There are numerous specialised instruments or
hardware and software used that are commonly known as image processing tools which
involves four basic steps viz image correctionrestoration image enhancement image
transformation and image classification
7 Application
The final element or component of remote sensing process is achieved when we apply the
extracted and processed information in solving a particular issue or problem Specialists who
work in each application theme are able to perform and carry out this task
Applications of remote sensing
Every application itself has some specific demands for spectral spatial radiometric and
temporal resolution of the satellite sensor (Shandilya et al 2013) In modern era the remote
sensing proved very effective to understand and resolve the challenges in almost all the
fields few of its major applications are illustrated in this article
1 Geology
In the field of geosciences the remote sensing techniques are applied to interpret and analyse
the bedrock lithological structural formations sedimentation(Merritt et al 2014 Stead et
al 2019) planetary surface monitoring (Clark et al 2003 Des Marais et al 2002 Shepard
et al 2001)geo-hazards and mineral exploration through observation and modelling
techniques
DHARAIYA A Remote sensing
Prithivya | August 2021 53
2 Hydrology
Some examples of applications of remote
sensing in hydrological science include
soil moisture estimation flood and
wetland monitoring watershed and
drainage modelling river delta change
detection and many more Figure 11 and
12are an example of one of the studies
undertaken for hydrological modelling
and mapping of wetlands respectively
(Dharaiya 2020a Dharaiya et al 2021)
3 Glaciology
By means of remote sensing one can acquire information and map the ice concentration ice
type or motion(Frey et al 2014 Jiyang Chen amp Ohmura 1990) iceberg detection glacier
copy
Adi
tya
D
Figure 11 Drainage modelling in Jambughoda
Wildlife sanctuary Gujarat (after Dharaiya
2020a)
copy
Aditya
D Figure 12 Mapping of wetlands in Patan district Gujarat (Dharaiya et al 2021)
DHARAIYA A Remote sensing
Prithivya | August 2021 54
dynamics (Pratibha amp Kulkarni 2018 Remya et al 2019) monitor snow thickness
(Gantayat et al 2014 Kulkarni et al 2002) meteorological change research snow-water
equivalence snowmelt run-off estimation and many more
4 Agriculture
In the science of agriculture the remote sensing is mostly used as a decision-making tool viz
for crop type classification crop condition assessment crop yield estimation soil characters
soil management practices and compliance monitoring (Zheng et al 2014)
5 Forestry
Forestry is one of the major sectors where remote sensing has proved as very effective tool It
has been used for reconnaissance mapping commercial forestry and environmental
monitoring are some objectives which can be fulfilled and that further helps in managing and
conserving the natural resources Figure 13 is an example of mapping the forest coverat
Ratanmahal wildlife sanctuary Gujarat using spectral indices
6 Land use Land cover (LULC)
Yacouba et al (2010) has discussed the LULC with reference to two terms lsquoland usersquo which
refers to the purpose the land serves and lsquoland coverrsquo refers to natural surface cover on the
ground For example it is widely used in habitat and natural resource management urban
expansion baseline mapping risk assessment legal boundaries for tax evaluation change
Figure 13 Forest cover map of Ratanmahal wildlife sanctuary Gujarat copy Aditya Dharaiya
DHARAIYA A Remote sensing
Prithivya | August 2021 55
detection etc Figure 14 and 15depicts the LULC classification and change detection of
wetlands respectively (Dharaiya 2020b Dharaiya et al 2021)
copy
Adity
a D
Figure 14 LULC classification with vegetation cover in Girnar Wildlife sanctuary
Gujarat (After Dharaiya 2020b)
Figure 15 Change detection of wetlands in Patan district Gujarat using Landsat 8 OLI
(Dharaiya et al 2021)
DHARAIYA A Remote sensing
Prithivya | August 2021 56
7 Coastal monitoring
Remote sensing can be used to gather information about oceanic processes(physical and
biological) oil spill (Alesheikh et al 1997 Fingas amp Brown 1997) and shipping by means
of remote sensing
Several other applications according to Shandilya et al (2013) include planimetry or land
surveying using very high spatial resolution satellites (30 cm) Generating Digital Elevation
Models (DEMs) from remote sensing products are used to generate elevation profiles by
means of radar interferometry radargrammetry and photogrammetry To extract the
planimetric details about mineral exploration activities topographic mapping and surface
monitoring base map imagery provides a priori information about the areas
Conclusion
This emerging technique of remote sensing is a significant tool to monitor the Earthrsquos
surface It has progressively expanded applications which allow users to collect interpret
and manipulate data over vast areas Multi-temporal satellite data help to delineate changes of
the earthrsquos surface thus it can be also said to be a useful and handy tool for all the users as it
increases the accuracy efficiency and quality of the analysis in such a way that it can be
helpful in decision-making process Furthermore the products can be conveniently used by
other scientists too who are even not much familiar with this technology and for the greatest
level of detail to be extracted
References
Alesheikh A A Ghorbanali A amp Nouri N (1997) Coastline change detection using
remote sensing International Journal of Environmental Science and Technology 4(1)
1ndash11
Clark R N Swayze G A Livo K E Kokaly R F Sutley S J Dalton J B
McDougal R R amp Gent C A (2003) Imaging spectroscopy Earth and planetary
remote sensing with the USGS Tetra order and expert systems Journal of
Geophysical Research E Planets 108(12) httpsdoiorg1010292002je001847
Des Marais D J Harwit M O Jucks K W Kasting J F Lin D N C Lunine J I
Schneider J Seager S Traub W A amp Woolf N J (2002) Remote sensing of
DHARAIYA A Remote sensing
Prithivya | August 2021 57
planetary properties and biosignatures on extrasolar terrestrial planets Astrobiology
2(2) 153ndash181 httpsdoiorg10108915311070260192246
Dharaiya A (2020a)Monitoring and assessment of forest ecosystem using geospatial
technology A case study of Jambughoda wildlife sanctuary Gujarat India Poster
presented at ISRS National Symposium-2020
Dharaiya A (2020b) Habitat Analysis of Girnar Wildlife Sanctuary using Geospatial
Techniques Paper presented at National Map Competition GIS Day-2020
Dharaiya N Bhati R and Patel J (2021) Ecological studies on selected wetlands of Patan
district to prepare management plan for long-term conservation Technical Report
WCB Research Foundation Patan 91Pp
Feng X He L Cheng Q Long X amp Yuan Y (2020) Hyperspectral and multispectral
remote sensing image fusion based on endmember spatial information Remote
Sensing 12(6) 1ndash17 httpsdoiorg103390rs12061009
Fingas M F amp Brown C E (1997) Review of oil spill remote sensing Spill Science and
Technology Bulletin 4(4) 199ndash208 httpsdoiorg101016S1353-2561(98)00023-1
Frey H Machguth H Huss M Huggel C Bajracharya S Bolch T Kulkarni A
Linsbauer A Salzmann N amp Stoffel M (2014) Estimating the volume of glaciers
in the Himalayan-Karakoram region using different methods Cryosphere 8(6) 2313ndash
2333 httpsdoiorg105194tc-8-2313-2014
Gantayat P Kulkarni A V amp Srinivasan J (2014) Estimation of ice thickness using
surface velocities and slope Case study at Gangotri Glacier India Journal of
Glaciology 60(220) 277ndash282 httpsdoiorg1031892014JoG13J078
Jiyang Chen amp Ohmura A (1990) Estimation of Alpine glacier water resources and their
change since the 1870s Hydrology in Mountainous Regions I 5(193) 127ndash135
Joseph G (2005) Fundamentals of Remote sensing 2e Orient Blackswan 2Rev ed Pp i-
xi 1-486
DHARAIYA A Remote sensing
Prithivya | August 2021 58
Kulkarni A V Srinivasulu J Manjul S S amp Mathur P (2002) Field based spectral
reflectance studies to develop NDSI method for snow cover monitoring Journal of
the Indian Society of Remote Sensing 30(1ndash2) 73ndash80
httpsdoiorg101007BF02989978
Lillesand T Kiefer R Chipman J (2015) Remote sensing and Image interpretation 7e
John Wiley amp sons Inc Pp 1-736
Merritt A J Chambers J E Murphy W Wilkinson P B West L J Gunn D A
Meldrum P I Kirkham M amp Dixon N (2014) 3D ground model development for
an active landslide in Liasmudrocks using geophysical remote sensing and
geotechnical methods Landslides 11(4) 537ndash550 httpsdoiorg101007s10346-
013-0409-1
Navalgund R Jayaraman V Roy P (2007) Remote sensing applications An overview
Current Science 93(12) 1747-1766
Pratibha S amp Kulkarni A V (2018) Decadal change in supraglacial debris cover in Baspa
basin Western Himalaya Current Science 114(4) 792ndash799
httpsdoiorg1018520csv114i04792-799
Ray S (2013) Basics of Remote Sensing Remote Sensing Image Analysis Including the
Spatial Domain 1ndash15 httpsdoiorg1010071-4020-2560-2_1
Remya S N Kulkarni A V Pradeep S amp Shrestha D G (2019) Volume estimation of
existing and potential glacier lakes Sikkim Himalaya India Current Science 116(4)
620ndash627 httpsdoiorg1018520csv116i4620-627
Shandilya K K Shukla S P amp Pathak V (2013) Applications of Remote sensing
Horizons of Earth sciences Vol 10 1ndash12
Shepard M K Campbell B A Bulmer M H Farr T G Gaddis L R amp Plaut J J
(2001) The roughness of natural terrain A planetary and remote sensing perspective
Journal of Geophysical Research E Planets 106(E12) 32777ndash32795
httpsdoiorg1010292000JE001429
DHARAIYA A Remote sensing
Prithivya | August 2021 59
Stead D Donati D Wolter A amp Sturzenegger M (2019) Application of remote sensing
to the investigation of rock slopes Experience gained and lessons learned ISPRS
International Journal of Geo-Information 8(7) httpsdoiorg103390ijgi8070296
Yacouba D Guangdao H amp Xingping W (2010) Applications of Remote Sensing in
Land UseLand Cover Change Detection in Puer and Simao Counties Yunnan
Province Report and Opinion 2(9) 7ndash16
Zheng B Campbell J B Serbin G amp Galbraith J M (2014) Remote sensing of crop
residue and tillage practices Present capabilities and future prospects Soil and
Tillage Research 138 26ndash34 httpsdoiorg101016jstill201312009
Types of resolution used in remote sensing
httpwwwedcuriedunrsclassesnrs409rslectureshowremotesensonworkpdfacce
ssed on 24th April 2021
Components of remote sensing ndash Scattering and absorption httpswwwnrcangccamaps-
tools-publicationssatellite-imagery-air-photosremote-sensing-
tutorialsintroductioninteractions-atmosphere14635accessed on 24th April 2021
Basic concepts of Electromagnetic radiation and
spectrumhttpgsphumboldteduOLMCoursesGSP_216_Onlinelesson1-
2spectrumhtmlaccessed on 24th April 2021
Concept of spectral indices httpswwwl3harrisgeospatialcomdocsspectralindiceshtml
accessed on 25th April 2021
Suggested citation
Dharaiya A (2021) Remote sensing and An overview with fundamentals and applications
Prithivya An Official Newsletter of WCB Research Foundation and WCB Research Lab Vol 1(2)
44-59
M I PATEL AWARD 2021
Prithivya | August 2021 60
M I Patel Award for Young Wildlife amp Conservation Biologist
Nominations for 2021 Award
Ms Shivangi Mishra
Shivangi is a Senior Research Fellow (Basic Scientific
Research Fellow UGC) at University of Lucknow and is
currently working on Egyptian Vultures She has also
worked on Butterflies of Uttar Pradesh from 2014- 2016
She has presented her research on Egyptian Vultures in
Conference of Raptor Research Foundation in 2018
(South Africa) 2019 (USA) and awarded with William C
Andersen Award and James Koplin Award respectively In
future also she wants to contribute her research for the
conservation of Egyptian Vultures in India
Dr Tarang Kumar Shah
Tarang is an Assistant Professor in Fisheries polytechnic at
Dau Shri VasudevChandrakarKamdhenuVishwaVidyalaya
Durg He studied the Effect of Thymus linearis plant
Extract on Growth Performance and Non-Specific Immune
Responses of endangered Golden Mahseer (Tor
putitora)against the disease caused
byOomycetesSaprolegniaparastica He found that the leaf
extract of Thymus plant has the antifungal properties and a
small quantity of which can control the population against
saprolegniosis
Dr Sujit Kolangath
Sujit is a subject specialist in animal biotechnology at
Wildlife Research amp Training Center Gorewada Nagpur
He studied the qualitative and quantitative aspect of
hepatoozoonfelis epidemiology in a tiger cub He reported
that the infection is transmitted by ingestion of infected
ticks infected prey and carrion and concurrent infection
with bacterial or viral infections may be fatal to the
infected animal
M I PATEL AWARD 2021
Prithivya | August 2021 61
Ms Jis Sebastian
Jis recently completed her doctoral research in Botany
from Madurai Kamraj University Madurai- Tamil Nadu
She is studying the pattern of diversity spatial distribution
and community structure of epiphytic orchids of southern
Western Ghatsresponds to availibility of
microenviornments (Microhabitat supported by
Microclimates) in the structurally diverse trees There for
Conservation of epiphytic orchids would ensure
conservation of old aged natural structurally complex
trees in the forest ecosystem
Dr Harshil Patel
Harshil is a naturalist working mainly on systematics and
taxonomy of reptiles and amphibians He studied the
amphibians amp reptiles of northern Western Ghats of
Gujarat He found a new Miocene divergent endemic
lineage of a racer snake evolutionary history of an
endemic snake resulted in the resurrection of a genus
reinvestigation of a gecko species complex that resulted
into the discovery of two new species
The final round including the presentation by the nominees followed by the award
ceremony will be conducted on September 27 2021 at M N College Visnagar (Gujarat)
WCB and the M I Patel Award committee congratulate all the nominees and wishing all
the best for their presentation
Applications and nomination for the 2022 awards are now open through our website
(wwwwcbresearchin) till June 30 2022
ANNOUNCEMENT
Prithivya | August 2021 62
ANNOUNCEMENT
Prithivya | August 2021 63
WINNERS OF MANGROVE DAY POSTER
COMPETITION
Prithivya | August 2021 64
WCB Research Foundation with K J Somaiya College Mubai have organized Digital and
Handmade Posters Competition on the occasion of World Mangrove Day July 26 2021 Out
of entries of thirty participants three best posters were selected by the committee and
awarded
Posters of Winners
1st Prize Digital Poster Ms Yukta Sawant
WINNERS OF MANGROVE DAY POSTER
COMPETITION
Prithivya | August 2021 65
1st Prize Digital Poster Ms Yukta Sawant
1st Prize Handmade Poster Ms Tanya Sawardekar
WCB RESEARCH FOUNDATION GOVERNING COUNCIL
Prithivya | August 2021 66
Governing Council of WCB Research Foundation
Executive
Director
Dr Hardik Patel Assistant Professor
Parul University Vadodara
phardik80gmailcom
Director of
Research
Dr Nishith Dharaiya Associate Professor
HNG University Patan
nadharaiyanguacin
Member Dr Sagarika Damle Associate Professor amp Head
Department of Life Sciences KC College Mumbai
sagarikadamlekccollegeeduin
Member Dr Nuria Selva Associate Professor
Institute of Nature Conservation
Polish Academy of Science Krakow Poland
nuriaselvagmailcom
Member Mr Pratik Desai Jr Research Fellow
WCB Research Lab Patan
pratikdesai825gmailcom
Member Mr M S Patel Associate Professor
M N College Visnagar martinleemsgmailcom
Member Dr Haresh Gondaliya Assistant Professor
Shri G D Modi Science College Palanpur hareshgondliya55gmailcom
Member Mr Prasad Patil Range Forest Officer
Gujarat Forest Department jalu1890gmailcom
Member Ms Madhuri Padaya Assistant Professor
K J Somaiya College of Science Mumbai padayamadhuriyahoocom
Member Dr Jagruti Rathod Director
Center for Nature amp Ecosystem Wellbeing Vadodara
rathod21gmailcom
Member
Secretary
Ms Jahnvi Patel Admin Officer
WCB Research Foundation Patan
adminwcbresearchin
Page 1 of 7 Pruthivya An official newsletter of WCB Research Foundation
Guidelines to authors and contributors 1 | P a g e
Instructions for authors
Scope Prithivya is a tri-annual newsletter of WCB Research Foundation and will
publish manuscripts on wildlife conservation biology and its allied areas
Guidelines to contributors of Prithiviya
Manuscript Types Prithiviya publishes original research articles short notes
field notes reviews and comments Submissions should be in English (UK) only
All manuscripts should be easy to read and comprehend Manuscripts may be
edited for length content and style and be sent to referees when found to be
appropriate The editor will discuss contributions with authors and advise to
modified whenever required
Submission is considered on the condition that papers are previously
unpublished have not been offered simultaneously elsewhere and that all
contributors have read and approved the contents
The editor will acknowledge manuscript contributions and assign them a unique
registration number which latter must be quoted in correspondence Papers are
peer-reviewed although the editor reserves the right to reject one without a
review
Preparation and submission of manuscripts
1 Title page Add full title Authors name and affiliation with email of all the Authors Abstract (250 Words) and Key words (4-5)
2 Submitted manuscripts should generally follow the normal convention of
scientific manuscripts keywords generally not appearing in the title
Introduction Materials and Methods Results and Discussion
Acknowledgments Authors contribution (optional) Appendices (optional) and
References) with the replacement or addition of sections allowed in between
the Introduction and the Acknowledgments
3 The manuscript should be typed in MS Word with left-aligned typesetting and
only true type fonts (Times new roman preferable) should be used The line
spacing must be 15 and the font size of 12 Headings should be bold and sub-
headings should be made italicized
Page 2 of 7 Pruthivya An official newsletter of WCB Research Foundation
Guidelines to authors and contributors 2 | P a g e
4 Title A concise informative and attractive and short title with 5-20 words will
be encouraged
5 Abstract Word limit for the abstract is 250 words and should contain a
summary of all major findings or conclusions of the study however abstract
is not required in case of short notes field notes and other short
communication
6 Introduction should be clearly written and must covering the objectives and
significance of the study
7 Methodology A detailed methodology is always encouraged The methodology
should contain the study area (if applicable) data collection analysis and
interpretation Authors should also mention the instruments software used
for the experiments and analysis
8 Result and discussions which contain main result with proper references
and authentic justifications include graph table photographs (No checklist
it directly goes into appendix or supplementary data)
9 Conclusions A short and comprehensive conclusion with significant novel
findings and depicting your research in a nut-shell
10 Acknowledgments which contain all funds support persons who help
during project or research or findings name of university other than they work
etc
11 Checklist-based papers like trip reports should contain dates of the trip total
number of birders or participants Mammals reptiles amphibians
invertebrates etc
12 Manuscripts should be sent electronically as an email attachment to the
Editorial Assistant with a cover letter to helliphellip
13 The text tables figurephotograph captions (which must be self-explanatory)
and appendices should be combined in one Microsoft Wordreg (ldquodocrdquo OR
ldquodocxrdquo) file format The preferred font is lsquoTimes New Romanrsquo in 12 point
14 Photographs artwork maps (the outlines of the Republic of India should
conform to Government of India regulations) diagrams etc should be
digitized and sent separately along with the manuscript or if they are large
Page 3 of 7 Pruthivya An official newsletter of WCB Research Foundation
Guidelines to authors and contributors 3 | P a g e
files in separate trailing e-mails These should be in TIFF and at least 8times11
inches in 300 dpi resolutions JPEG files must be lsquomaximumrsquo quality ie at
their minimum compression Maps should be marked with a scale and North
arrow and should carry a clear caption
15 Authors whose work involves the handling of any necessary permissions from
the requisite government agencies to do so The editor reserves the right to
view such permissions at herhis discretion
16 While photographing nestingcourtship display or any behavioural activity
including those of nests eggs courtship etc authorsphotographers must
ensure the safety of the animals involved and also ensure that they do not
disturb in any way whatsoever in the course of their photography The editor
reserves the right to view permissions for such activities within protected
areas The editorreferee reserves the right to query an author regarding the
ethics of photography and the methodology followed while photographing
including that of rejecting a manuscript if unsatisfied on these counts
Types of Manuscript
1 Short Research articles 2000 to 2500 words
2 Short notes Up to 1500 words
3 Important sightings 250-350 words with proper GPS location and
photographic evidence
4 Important findings 250-500 words with proper GPS location with image
5 Full-length Research paper Up to 10000 words with appendix excluding
photographs only
Other important Guidelines
Scientific binomials should comprise the generic and specific names but should
not include the name of the author and year of citation Scientific trinomials
should be mentioned only if the nature of the manuscript requires them
For example both the English and scientific name must be given thus ldquoHouse
Crow Corvus splendensrdquo thereafter only the English name ldquoHouse Crowrdquo will
suffice English and scientific names should follow the proper book that should
be mention in reference and title of the table
Page 4 of 7 Pruthivya An official newsletter of WCB Research Foundation
Guidelines to authors and contributors 4 | P a g e
Metric units and their international symbols must be used eg ldquosq kmrdquo and
ldquo1000 m aslrdquo dates and times should be of the form of MMDDYYYY (January
01 2021rdquo and ldquo1345 hrdquo respectively
Tables should be within gridlines (which may or may not be printed) Tables
should never be formatted with wrap-around text
Latitude and longitude coordinates should follow the format ldquo27807ordmN
74094ordmErdquo
Enzyme Nomenclature The trivial names recommended by the IUPAC-IUB
Commission should be used When the enzyme is the main subject of a paper
its code number and systematic name should be stated in its first citation in the
paper
Symbols and Abbreviations Use only standard abbreviations The use of non-
standard abbreviations can be extremely confusing to readers Avoid
abbreviations in the title The full term for which an abbreviation stands should
precede its first use in the text unless it is a standard unit of measurement
Page number (page 1 0f 10 formats) must be on top right corner of the word
documents font size 10 and times new roman word type
Citation and References Prithivya encourages the authors to use Mendely EndNote or other reference management tools for proper citations We follow APA referencing style
Do not abbreviate references pagination should be given in the expanded form
eg ldquoindashvi 1ndash250rdquo not ldquovi 250rdquo the page numbers should be separated by an
lsquoEnrsquo dash
Italics should be used for book titles but not volume numbers when citing
periodicals use italics for the journal name not the article title
References should be arranged alphabetically by the first author (and in the case
of more than one author by second and subsequent authors)
Citations to references in the text should follow the style ldquo(Santharam 1978)rdquo
ldquo(Barua amp Sharma 1999)rdquo ldquo(Pande et al 2002)rdquo ldquo(Lainer 1999 2004)rdquo ldquo(Lainer
1999abcd Lainer 1999a 2000a)rdquo [for several papers by an authors from
Page 5 of 7 Pruthivya An official newsletter of WCB Research Foundation
Guidelines to authors and contributors 5 | P a g e
amultiple calendar years] and ldquo(Neelakantan et al 1993 Sashikumar et
al 2011)rdquo
A string of citations in the text should follow a chronological not an alphabetical
order thus ldquo(Ali amp Ripley 1981 Kazmierczak 2000 Grimmett et al 2011)rdquo
When citing unpublished sources please use the following formats if the source
is written material ldquo(Harkirat Sangha in litt e-mailletter dated 02 January
2013)rdquo if oral ldquo(Rajah Jayapal verbally dated 15 December 2013)rdquo
When citing from e-Bird or any other magazine checklist please enter the author
of the e-Bird checklistrsquos name or others name and the year the checklist was
uploaded in the text ldquo(Raman 1994)rdquo If a checklist thatrsquos shared amongst
multiple observers is being referred to only the relevant checklist(s) should be
used for citation
See examples below for detailed formatting
Journal articles
Pittie A 2011 The dates of seven new taxa described by W E Brooks (Certhia
Hodgsoni Sitta Cashmirensis Dumeticola
major Horites [sic] Pallidus Phylloscopus Tytleri Motacilla Cashmirensis
and Alauda Guttata) Prithiviya7 (2) 54ndash55
Naoroji R amp Sangha H S 2011 Threats to habitat and wildlife in Changthang
and Rupshu areas of Ladakh a case study at Hanle Prithiviya7 (1) 2ndash6
Choudhary D N Mandal J N Mishra A amp Ghosh T K 2010 First ever
breeding record of Black-necked Stork Ephippiorhynchus asiaticus from
Bihar Prithiviya6 (3) 80ndash82
Books
Futehally Z (ed) 2006 India through its birds 1st ed Bangalore India
Dronequill Publishers Pvt Ltd Pp indashii 1ndash214
Pittie A 2010 Birds in books three hundred years of South Asian ornithologymdash
a bibliography 1st ed Ranikhet Permanent Black Pp indashxxi 1ndash845
Sashikumar C Praveen J Palot M J amp Nameer P O 2011 Birds of Kerala
status and distribution 1st ed Kottayam Kerala DC Books Pp 1ndash835 Book chapter
Pittie A 2011 Stray Feathers (1872ndash1899) (p 247) In Priority The dating of
scientific names in ornithology a directory to the literature and its
Page 6 of 7 Pruthivya An official newsletter of WCB Research Foundation
Guidelines to authors and contributors 6 | P a g e
reviewers Dickinson E C Overstreet L K Dowsett R J amp Bruce M D
(eds) Northampton UK Aves Press Limited Website
2013 Kadalundi makes history with new gull species The
Hindu (Thiruvananthapuram ed) dated February 7 2013
Website httpwwwthehinducomtodays-papertp-nationaltp-
keralakadalundi-makes-history-with-new-gull-speciesarticle4388171ece
[Accessed on 21 July 2014] Any magazine checklist
Raman T R S 1994 Website
URL httpebirdorgebirdviewchecklistsubID=S21694571 [Accessed on
15
December 2015]
ETHICAL MATTERS Authors involving in the usage of experimental animals and human subjects in their
research work should seek approval from the appropriate Institutional Animal Ethics
Committee in accordance with Principles of Laboratory Animal Care The material
and methods section of the manuscript should include a statement to prove that the
investigation was approved and that informed consent was obtained
Disclaimer
While every care is taken of manuscripts and their accompanying
material Prithiviya cannot be held responsible for accidental loss or damage of
any material sent for publication or for their return whether they are accepted
for publication or not
Material published in Prithiviya reflects the views of the authors and not
necessarily those of the publishers editors referees etc
The editor reserves the rights to make necessary changes in manuscripts in
consultation with the author
All submissions are evaluated under the assumption that the conditions listed here have been understood and accepted by the author(s)
Submission fees There will be no submission fees for e-publication however we
may produce the reprints on request and on payment basis
Page 7 of 7 Pruthivya An official newsletter of WCB Research Foundation
Guidelines to authors and contributors 7 | P a g e
Special announcements
We also accept announcement of workshop webinar conference symposium job
opportunities academic courses etc with nominal charges and guarantee for its
wider circulation
Contacts Editor in Chief Dr Sagarika Damle Emailvisaanikagmailcom Associate Editors Dr Nishith Dharaiya
Email nadharaiyagmailcom Dr Jagruti Rathod Email rathod21gmailcom Editorial Assistant Ms Rinku Bhati
Email bhatirinku178gmailcom
WCB Research FoundationAdding Science to Conservation
wwwwcbresearchin
- 001_Cover Page
- 002_Editorial Board_2
- 003_Table of Contents_Issue 2
- 004_Editorial and Directors Column
- 005_Chaudhary and Desai 1-3
- 006_Dave 4-11
- 007_Amin et al 12-17
- 008_Thakkar and Gohil 18-21
- 009_Marjadi 22-23
- 010_Patel and Patel 24-27
- 011_Pithva and Dharaiya 28-36
- 012_Panchal and Jha 37-43
- 013_Dhaaraiya 44-59
- 014_MI Patel Award Nominee 60-61
- 015_Announcements 62-63
- 016_Posters Competition Winners 64-65
- 017_ WCB Council and Board 66
- 018_Prithiviya_Guidelines Final
- 019_Last page
-