principles of six sigma - testbanklive.com chapter 2 principles of six sigma teaching notes this...
TRANSCRIPT
1
CHAPTER 2
Principles of Six Sigma
Teaching Notes
This chapter brings the Six Sigma principles and concepts into a sharp focus, and builds on the
need to integrate a performance management framework with operational requirements in
managing quality. In this chapter, we introduce the statistical basis for Six Sigma, and outline the
requirements for Six Sigma implementation. Key objectives for this chapter should be to assist
students:
To define the Six Sigma Body of Knowledge and show how it is being used as an
integrating framework for this textbook.
To appreciate that there is a need for organizations to align Six Sigma projects with an
organization’s strategy, and address any perceived weaknesses or threats that may have
been identified during the strategic planning process.
To understand that a problem is defined as: a deviation between what should be
happening and what actually is happening that is important enough to make someone
think the deviation ought to be corrected.
To learn to classify quality problems into one of five categories, including: a) conformance
problems, b) efficiency problems, c) unstructured performance problems, d) product
design problems, and e) process design problems.
To learn that Six Sigma can be applied to a wide variety of transactional,
administrative, and service areas in addition to manufacturing. However, differences
between services and manufacturing make opportunities in services more difficult to
identify, and projects more difficult to define. Small organizations can use Six Sigma,
although perhaps in a more informal fashion.

Chapter 2 – Process Concepts and Systems Thinking 2
To apply Six Sigma processes and concepts to service processes to enhance one of four
key measures of performance:
• Accuracy, as measured by correct financial figures, completeness of information, or
freedom from data errors
• Cycle time, which is a measure of how long it takes to do something, such as pay an
invoice
• Cost, that is, the internal cost of process activities (in many cases, cost is largely
determined by the accuracy and/or cycle time of the process; the longer it takes, and
the more mistakes that have to be fixed, the higher the cost)
• Customer satisfaction, which is typically the primary measure of success
To reinforce the definition of a process as “a fundamental way of viewing work in an
organization” (from Chapter 1) and to develop the concept of a set of processes, which
together, form a system – an integrated set of activities within an organization that work
together for the aim of the organization.
To develop the classifications of processes as:
1. Value-creation processes (sometimes called core processes), which are most
important to “running the business” and maintaining or achieving a sustainable
competitive advantage, and
2. Support processes, which those that contribute to the successful performance of an
organization’s value-creation processes, employees, and daily operations.
To understand the definitions and importance of variation in Six Sigma processes,
including: factors which are present as a natural part of a process and are referred to as
common causes of variation. Common causes are a result of the design of the product
and production system and generally account for about 80 to 95 percent of the observed
variation in the output of a production process. AND The remaining variation in a
production process is the result of special causes, often called assignable causes of
variation. Special causes arise from external sources that are not inherent in the process.
They appear sporadically and disrupt the random pattern of common causes.
To learn that in Six Sigma terminology, a nonconformance is any defect or error that
is passed on to the customer. In manufacturing we often use the term defect, and in
service applications, we generally use the term error to describe a nonconformance.
A nonconforming unit of work is one that has one or more defects or errors. For
discrete data, the two important metrics are the proportion nonconforming and
nonconformances per unit (NPU).
A common measure of output quality is defects per unit (DPU), computed as Number
of defects discovered/Number of units produced, and in Six Sigma metrics, defects per

Chapter 2 – Process Concepts and Systems Thinking 3
million opportunities (dpmo) = DPU 1000000/opportunities for error. A six-sigma
quality level corresponds to at most 3.4 dpmo.
To learn that quality in processes has a cumulative impact, where the quality output at
each stage in the process must be considered. If a process consists of many steps, each
step may create nonconformances, thus reducing the yield of the final output. One
measure that is often used to evaluate the quality of the entire process is rolled
throughput yield (RTY). RTY is the proportion of conforming units that results from
a series of process steps. Mathematically, it is the product of the yields from each
process step.
To appreciate that a structured problem solving process provides employees and teams
with a common language and a set of tools to communicate with each other. The Six
Sigma DMAIC methodology process provides this type of roadmap for conducting a
Six Sigma project.
To develop understanding of the Six Sigma stages of: 1) Define - the process of
drilling down to a more specific problem statement is sometimes called project
scoping; 2) Measure - collecting good data, observation, and careful listening; 3)
Analyze - focuses on why defects, errors, or excessive variation occur, and focuses on
the root cause; 4) Improve - focuses on idea generation, evaluation, and selection; 5)
Control - focuses on how to maintain the improvements.
To learn about Lean Six Sigma, defined as an integrated improvement approach to
improve goods and services and operations efficiency by reducing defects, variation,
and waste; and to apply classification of different types of muda (waste), and Kaizen
events to lean Six Sigma projects.
To define lean tools and learn how they can be used to develop a lean organization.
To understand how Six Sigma and Lean complement one another and how they are
converging.
ANSWERS TO REVIEW QUESTIONS
1. Briefly summarize the Six Sigma Body of Knowledge.
Ans. Six Sigma encompasses a vast collection of concepts, tools, and techniques that are
drawn from many areas of business, statistics, engineering, and practical experience. Many
of these subjects are technical; others deal with management and organizational issues.
Practitioners need a balanced set of both the “hard” and the “soft” disciplines in order to
apply and implement Six Sigma effectively. (See list in the body of the chapter for more
details.)
2. Describe the principal sources of ideas for Six Sigma projects.

Chapter 2 – Process Concepts and Systems Thinking 4
Ans. Ideas for Six Sigma projects stem from many sources. Often, they are driven by
needs and opportunities to achieve an organization’s strategic goals, objectives, and action
plans by which it seeks to create a competitive advantage. Six Sigma projects also stem
from the fundamental need to improve results, captured in measures such as profit, market
share, customer satisfaction, operational efficiency, product innovation, and quick
response.
3. What are dashboards and balanced scorecards? How do they support Six Sigma projects?
Ans. Dashboards typically consist of a small set of measures (five or six) that provide a
quick summary of process performance. This term stems from the analogy to an
automobile’s dashboard—a collection of indicators (speed, RPM, oil pressure, temperature,
etc.) that summarize key performance measures. Dashboards often use graphs, charts, and
other visual aids to communicate key measures and alert workers and managers when
performance is not where it should be.
The balanced scorecard is a summary of broad performance measures across the
organization. The purpose of the balanced scorecard is “to translate strategy into measures
that uniquely communicate your vision to the organization.” A balanced scorecard defines
the most important drivers of organizational success and consists of four perspectives:
Financial Perspective: Measures the ultimate results that the business provides to its
shareholders.
Internal Perspective: Focuses attention on the performance of the key internal
processes that drive the business.
Customer Perspective: Focuses on customer needs and satisfaction as well as market
share.
Innovation and Learning Perspective: Directs attention to the basis of a future
success—the organization’s people and infrastructure..
Dashboards and scorecards provide rich sources of information for tracking progress.
Results that are inferior to competitor’s performance, or which exhibit adverse trends often
suggest the need for Six Sigma improvement projects.
4. List and briefly define the five categories of quality-related problem types. What are the
best approaches for attacking each of these types of problems?
Ans. Research using more than a thousand applicable published cases suggests that
virtually every instance of quality-related problem-solving falls into one of five categories:
1. Conformance problems, which are characterized by unsatisfactory performance that
causes customer dissatisfaction, such as high levels of defects, service failures, or customer
complaints. The processes that create these results are typically well-specified and can be

Chapter 2 – Process Concepts and Systems Thinking 5
easily described.
2. Efficiency problems, which are characterized by unsatisfactory performance that causes
dissatisfaction from the standpoint of noncustomer stakeholders, such as managers of
financial or supply chain functions. Typical examples are high cost, excessive inventory,
low productivity, and other process inefficiencies.
3. Unstructured performance problems, which are characterized by unsatisfactory
performance by processes that are not well-specified or understood. For example, a
company might discover that employee turnover is much higher than desired or employee
satisfaction is low. The factors that contribute to such results do not stem from processes
that can easily be described.
4. Product design problems, which involve designing new products or redesigning existing
products to better satisfy customer needs. 5. Process design problems, which involve designing new processes or substantially
revising existing processes. These might include new factory processes to manufacture a
new product line or designing a more flexible assembly line.
Each of these categories of problems requires different approaches and methodologies.
Traditional Six Sigma methods are most applicable to conformance problems because the
processes that create the problems can be easily identified, measured, analyzed, and
changed. For efficiency problems, lean tools, which evolved from the Toyota producton
system, are generally used. Unstructured performance problems require more creative
approaches to solving them. For product and process design problems, special tools and
methods or a combination of many of these approaches are used (and fall under the scope
of DFSS – Design for Six Sigma). As Six Sigma has evolved, all of these tools and
approaches have been consolidated into the Six Sigma body of knowledge, making it a
powerful approach for any level of organizational problem solving.
5. Explain the application of Six Sigma in service organizations. How does it differ from
manufacturing? How is it similar?
Ans. Applying Six Sigma to services requires examination of four key measures of the
performance:
Accuracy, as measured by correct financial figures, completeness of information, or
freedom from data errors
Cycle time, which is a measure of how long it takes to do something, such as pay an
invoice
Cost, that is, the internal cost of process activities (in many cases, cost is largely
determined by the accuracy and/or cycle time of the process; the longer it takes, and
the more mistakes that have to be fixed, the higher the cost)
Customer satisfaction, which is typically the primary measure of success
While Six Sigma applies equally well in service areas as in manufacturing, it is true that
services have some unique characteristics. First, the culture of a service firm is usually less
scientific, and service employees typically do not think in terms of processes,

Chapter 2 – Process Concepts and Systems Thinking 6
measurements, and data. The processes are often invisible, complex, and not well defined
or well documented. Also, the work typically requires considerable human intervention, such
as customer interaction, underwriting or approval decisions, or manual report generation.
These differences make opportunities difficult to identify, and projects difficult to define.
Finally, similar service activities are often done in different ways. If you have three people
doing the same job, perhaps in three different locations, it is unlikely that they will do the
job in the same way. It should be noted that within the service sector, Six Sigma is beginning
to be called transactional Six Sigma.
6. What are process owners and stakeholders? How are they different from each other?
Ans. Individuals or groups, known as process owners, are accountable for process
performance and have the authority to control and improve their process. Process owners
may range from high-level executives who manage cross-functional processes to workers
who run a manufacturing cell or an assembly operation on the shop floor. They are
important members of Six Sigma project teams because of their understanding of and
involvement in processes. Other individuals or groups, called stakeholders, are or might
be affected by an organization’s actions and success; thus, they are vital to a Six Sigma
project. Stakeholders might include customers, the workforce, partners, collaborators,
governing boards, stockholders, donors, suppliers, taxpayers, regulatory bodies, policy
makers, funders, and local and professional communities.
7. Define the two general categories of processes in any organization and provide examples of
each.
Ans. The two general categories of processes and examples are:
1. Value-creation processes (sometimes called core processes), which are most important to
“running the business” and maintaining or achieving a sustainable competitive advantage, and
2. Support processes, which those that contribute to the successful performance of an
organization’s value-creation processes, employees, and daily operations.
Value-creation processes drive the creation of products and services, are critical to customer
satisfaction, and have a major impact on the strategic goals of an organization. They typically
include design, production/delivery, and other critical business processes.
Support processes provide infrastructure for value-creation processes but generally do not add
value directly to the product or service. A process such as order entry that might be thought of
as a value creation process for one company (e.g., a direct mail distributor) might be considered
as a support process for another (e.g., a custom manufacturer). In general, value creation
processes are driven by external customer needs while support processes are driven by internal
customer needs. Because value creation processes do add value to products and services, they
require a higher level of attention than do support processes.
Chapter 2 – Process Concepts and Systems Thinking 7
8. What are process requirements and how can they be identified?
Ans. Understanding the requirements that processes should meet is vital to improving
them. Given the diverse nature of value-creation processes, the requirements and
performance characteristics might vary significantly for different processes. In general,
value-creation process requirements are driven by consumer or external customer needs.
For example, if hotel customers expect fast, error-free check-in, then the check-in process
must be designed for speed and accuracy. Support process requirements, on the other hand,
are driven by internal customer needs and must be aligned with the needs of key value
creation processes. For example, information technology processes at a hotel must support
the check-in process requirements of speed and accuracy; this would require real-time
information on room availability.
9. Explain the concept of variation in processes. State the primary sources of process
variation.
Ans. Any process contains many sources of variation. In manufacturing, for example,
different lots of material vary in strength, thickness, or moisture content. Cutting tools have
inherent variation in their strength and composition. Even when measurements of several
items by the same instrument are the same, it is due to a lack of precision in the
measurement instrument; extremely precise instruments always reveal slight differences.
Similar variation occurs in services, particularly as a result of inconsistency in human
performance and the interface with technology.
10. Explain the difference between common and special cause of variation and provide some
examples.
Ans. The complex interactions of these variations in materials, tools, machines, operators,
and the environment are not easily understood. Variation due to any of these individual
sources appears at random; individual sources cannot be identified or explained. However
their combined effect is stable and can usually be predicted statistically. These factors are
present as a natural part of a process and are referred to as common causes of variation.
Common causes are a result of the design of the product and production system and
generally account for about 80 to 95 percent of the observed variation in the output of a
production process. Therefore, common cause variation can only be reduced if the product
is redesigned, or if better technology or training is provided for the production process.
The remaining variation in a production process is the result of special causes, often called
assignable causes of variation. Special causes arise from external sources that are not
inherent in the process. They appear sporadically and disrupt the random pattern of
common causes. Hence, they tend to be easily detectable using statistical methods, and
usually economical to correct. Unusual variation that results from isolated incidents can be
explained or corrected. A system governed only by common causes is called a stable

Chapter 2 – Process Concepts and Systems Thinking 8
system. Understanding a stable system and the differences between special and common
causes of variation is essential for managing any system.
11. What operational problems are caused by excessive variation?
Ans. Excessive variation can result in various “evils,” including:
Variation increases unpredictability. If we don’t understand the variation in a system,
we cannot predict its future performance.
Variation reduces capacity utilization. If a process has little variability, then managers
can increase the load on the process because they do not have to incorporate slack into
their production plans.
Variation contributes to a “bullwhip” effect. This well-known phenomenon occurs in
supply chains; when small changes in demand occur, the variation in production and
inventory levels becomes increasingly amplified upstream at distribution centers,
factories, and suppliers, resulting in unnecessary costs and difficulties in managing
material flow.
Variation makes it difficult to find root causes. Process variation makes it difficult to
determine whether problems are due to external factors such as raw materials or reside
within the processes themselves.
Variation makes it difficult to detect potential problems early. Unusual variation is a
signal that problems exist; if a process has little inherent variation, then it is easier to
detect when a problem actually does occur.
The evils of variation can be addressed by understanding the process and searching for, and
eliminating, root causes.
12. Explain Deming’s red bead and funnel experiments. What lessons do they provide?
Ans. The late W. Edwards Deming explained these concept relating to variation using two
simple, yet powerful experiments, the Red Bead and Funnel experiments, in his four-day
management seminars.
The Red Bead experiment proceeds as follows. A Foreman (usually Deming) selects
several volunteers from the audience: Six Willing Workers, a Recorder, two Inspectors, and
a Chief Inspector. The materials for the experiment include 4,000 wooden beads—800 red
and 3,200 white—and two Tupperware boxes, one slightly smaller than the other. Also, a
paddle with 50 holes or depressions is used to scoop up 50 beads, which is the prescribed
workload. In this experiment, the company is “producing” beads for a new customer who
needs only white beads and will not take red beads. The Foreman explains that everyone
will be an apprentice for three days to learn the job. During apprenticeship, the workers
may ask questions. Once production starts, however, no questions are allowed. The
procedures are rigid; no departures from procedures are permitted so that no variation in
performance will occur. The Foreman explains to the Willing Workers that their jobs

Chapter 2 – Process Concepts and Systems Thinking 9
depend on their performance and if they are dismissed, many others are willing to replace
them. Furthermore, no resignations are allowed. The company’s work standard, the
Foreman explains, is 50 beads per day.
The production process is simple: Mix the raw material and pour it into the smaller box.
Repeat this procedure, returning the beads from the smaller box to the larger one. Grasp the
paddle and insert it into the bead mixture. Raise the paddle at a 44-degree angle so that
every depression will hold a bead. The two Inspectors count the beads independently and
record the counts. The Chief Inspector checks the counts and announces the results, which
are written down by the Recorder. The Chief Inspector then dismisses the worker. When all
six Willing Workers have produced the day’s quota, the Foreman evaluates the results.
During “production” Deming would berate the poor performers and reward the good
performers. He would try to motivate them to do better, knowing, of course, that they
would not be able to affect the results.
This experiment leads to several important lessons about statistical thinking:
• Variation exists in systems and, if stable, can be predicted.
• All the variation in the production of red beads, and the variation from day to day of
any Willing Worker, came entirely from the process itself.
• Numerical goals are often meaningless.
• Management is responsible for the system.
Deming’s second experiment is the Funnel Experiment. Its purpose is to show that people
can and do affect the outcomes of many processes and create unwanted variation by
“tampering” with the process, or indiscriminately trying to remove common causes of
variation. In this experiment, a funnel is suspended above a table with a target drawn on a
tablecloth. The goal is to hit the target. Participants drop a marble through the funnel and
mark the place where the marble eventually lands. Rarely will the marble rest on the target.
This variation is due to common causes in the process. One strategy is to simply leave the
funnel alone, which creates some variation of points around the target. This may be called:
Rule 1. However, many people believe they can improve the results by adjusting the
location of the funnel. Three other possible rules for adjusting the funnel are:
Rule 2. Measure the deviation from the point at which the marble comes to rest and the
target. Move the funnel an equal distance in the opposite direction from its current
position.
Rule 3. Measure the deviation from the point at which the marble comes to rest and the
target. Set the funnel an equal distance in the opposite direction of the error from the
target.
Rule 4. Place the funnel over the spot where the marble last came to rest.
Clearly the first rule—leave the funnel alone—results in the least variation. People use
these rules inappropriately all the time, causing more variation than would normally occur.
Chapter 2 – Process Concepts and Systems Thinking 10
As can be shown by numerous examples, errors are usually compounded by an
inappropriate reaction, using rules 2-4. All of these policies stem from a lack of
understanding of variation, which originates from not understanding the process.
13. What are metrics, and why are they important?
Ans. A metric is a verifiable measurement of some particular characteristic, stated either
numerically (e.g., percentage of defects) or in qualitative terms (e.g., level of satisfaction –
“poor” or “excellent”). Metrics provide information on performance, allow managers to
evaluate performance and make decisions, communication with one another, identify
opportunities for improvement, and frame expectations for employees, customers,
suppliers, and other stakeholders. Metrics are vital in Six Sigma applications because they
facilitate fact-based decisions.
14. Explain the difference between a measure and an indicator.
Ans. Measures and indicators refer to the numerical information that results from
measurement; that is, measures and indicators are numerical values associated with a
metric. The term indicator is often used for measurements that are not a direct or exclusive
measure of performance. For instance, you cannot directly measure dissatisfaction, but you
can use the number of complaints or lost customers as indicators of dissatisfaction.
Measurements and indicators provide critical information about business performance and
are fundamental to Six Sigma.
15. What is the difference between a discrete metric and a continuous metric? Provide some
examples.
Ans. A discrete metric is countable. For example, a dimension is either within tolerance
or out of tolerance, an order is complete or incomplete, or an invoice can have one, two,
three, or any number of errors. In quality control terminology, a performance characteristic
that is either present or absent in the product or service under consideration is called an
attribute, and such data are referred to as attributes data. Some examples are whether
the correct zip code was used in shipping an order; or by comparing a dimension to
specifications, such as whether the diameter of a shaft falls within specification limits of
1.60 ± 0.01 inch. They are typically expressed as numerical counts or as proportions.
Continuous metrics, such as length, time, or weight, are concerned with the degree of
conformance to specifications. In quality control, continuous performance characteristics
are often called variables, and such data are referred to as variables data.
16. What is a nonconformance? How does it differ from a nonconforming unit of work?
Ans. A defect, or nonconformance, is any mistake or error that is passed on to the
customer. A unit of work is the output of a process or an individual process step. A unit of
work might be a completed product ready to ship to a customer, a subassembly, an

Chapter 2 – Process Concepts and Systems Thinking 11
individual part produced on a machine, or a package to be delivered to a customer. A
nonconforming unit of work is one that has one or more defects or errors.
17. Explain how to calculate the dpmo metric.
Ans. A common measure of output quality is defects per unit (DPU), computed as
Number of defects discovered/Number of units produced, and in Six Sigma metrics,
defects per million opportunities (dpmo) = DPU 1000000/opportunities for error. A
six-sigma quality level corresponds to at most 3.4 dpmo.
18. Explain the theoretical basis of a six sigma quality level (3.4 dpmo).
Ans. The theoretical basis for Six Sigma is statistical theory. A six sigma quality level
corresponds to a process variation equal half of the design tolerance (in terms of the
process capability index, Cp = 2.0) while allowing the mean to shift as much as 1.5
standard deviations from the target. The allowance of a shift in the distribution is
important, since no process can be maintained in perfect control.
19. What is the difference between throughput yield (TY) and rolled throughput yield (RTY)?
Ans. If nonconformances per unit (NPU) has been calculated and nonconformances occur
randomly, we can estimate the number of units that have no nonconformances—called
throughput yield (TY)—using the following formula:
TY = e-NPU (2.7)
If a process consists of many steps, each step may create nonconformances, thus reducing
the yield of the final output. One measure that is often used to evaluate the quality of the
entire process is rolled throughput yield (RTY). RTY is the proportion of conforming
units that results from a series of process steps. Mathematically, it is the product of the
yields from each process step.
20. What are the key themes common to all problem-solving methodologies?
Ans. Although each methodology is distinctive in its own right, they share many common
themes:
1. Redefining and analyzing the problem: Collect and organize information, analyze the data
and underlying assumptions, and reexamine the problem for new perspectives, with the goal
of achieving a workable problem definition.
2. Generating ideas: “Brainstorm” to develop potential solutions.
3. Evaluating and selecting ideas: Determine whether the ideas have merit and will achieve
the problem solver’s goal.
4. Implementing ideas: Sell the solution and gain acceptance by those who must use them.
These themes are reflected in the principal problem solving methodology used by Six

Chapter 2 – Process Concepts and Systems Thinking 12
Sigma, DMAIC—define, measure, analyze, improve, and control—which will be
discussed further in question 21.
21. Describe the steps in the DMAIC methodology.
Ans. General Electric’s approach to Six Sigma implementation uses a problem solving
approach (DMAIC) and employs five phases. Under each of these are sub-steps that make
up the work for each phase.
a) Define (D)
i) Identify customers and their priorities.
ii) Identify a project suitable for Six Sigma efforts based on business
objectives as well as customer needs and feedback.
iii) Identify CTQ’s (critical to quality characteristics) that the customer
considers to have the most impact on quality.
b) Measure (M)
i) Determine how to measures the process and how is it performing.
ii) Identify the key internal processes that influence CTQ’s and measure the
defects currently generated relative to those processes
c) Analyze (A)
i) Determine the most likely causes of defects.
ii) Understand why defects are generated by identifying the key variables
that are most likely to create process variation.
d) Improve (I)
i) Identify means to remove the causes of the defects.
ii) Confirms the key variables and quantify their effects on the CTQ’s.
iii) Identify the maximum acceptable ranges of the key variables and a
system for measuring deviations of the variables.
iv) Modify the process to stay within the acceptable range.
e) Control
i) Determine how to maintain the improvements.
ii) Put tools in place to ensure that the key variables remain within the
maximum acceptable ranges under the modified process.
Note that this approach is similar to the other quality improvement approaches and
incorporates many of the same ideas. The key difference is the emphasis placed on
customer requirements and the use of statistical tools and methodologies.
22. What is project scoping? Why is it important to good problem solving?
Ans. The process of drilling down to a more specific problem statement is sometimes
called project scoping. The general nature of the problem is usually described in the
project charter, but is often rather vague. One must describe the problem in very specific
operational terms that facilitate further analysis. In addition, A good problem statement
Chapter 2 – Process Concepts and Systems Thinking 13
should also identify customers and the CTQs that have the most impact on product or
service performance, describe the current level of performance or the nature of errors or
customer complaints, identify the relevant performance metrics, benchmark best
performance standards, calculate the cost/revenue implications of the project, and quantify
the expected level of performance from a successful Six Sigma effort.
23. How does Lean Six Sigma differ from the traditional concept of Six Sigma?
Ans. As organizations developed Six Sigma capabilities to address conformance problems,
they began to realize that many important business problems fell into the category of
efficiency problems and assigned these problems to Six Sigma experts and project teams.
As a result, Six Sigma teams began to use tools of lean production to improve process
efficiency. As the tools of Six Sigma and lean production merged, the concept of Lean Six
Sigma (LSS) emerged, drawing upon the best practices of both approaches. Lean Six
Sigma can be defined as an integrated improvement approach to improve goods and
services and operations efficiency by reducing defects, variation, and waste.
24. Explain the principles of lean thinking and the seven categories of waste.
Ans. Lean thinking refers to approaches that focus on the elimination of waste in all
forms, and smooth, efficient flow of materials and information throughout the value chain
to obtain faster customer response, higher quality, and lower costs. A simple way of
defining it is “getting more done with less.” In any process, activities may be classified as
value-added or non-value-added. Lean thinking considers non-value-added activities as
waste, or to use the common Japanese term, muda.
The Toyota Motor Company classified waste into seven major categories:
1. Overproduction
2. Waiting time
3. Unnecessary transportation
4. Unnecessary processing
5. Inventory
6. Unnecessary motion
7. Production defects
Lean approaches focus on the elimination of waste in all these forms throughout the entire
value chain to achieve faster customer response, reduced inventories, higher quality, and
better human resources.
25. What is a kaizen event?
Ans. Lean improvements are often implemented using kaizen events. A kaizen event is an
intense and rapid improvement process in which a team or a department throws all its

Chapter 2 – Process Concepts and Systems Thinking 14
resources into an improvement project over a short time period, as opposed to traditional
kaizen applications, which are performed on a part-time basis.
26. Describe the principal tools used in lean production.
Ans. The principal tools used in lean production include:
The 5S’s. The 5S’s are derived from Japanese terms: seiri (sort), seiton (set in order),
seiso (shine), seiketsu (standardize), and shitsuke (sustain). They define a system for
workplace organization and standardization.
Visual controls. Visual controls are indicators for tools, parts, and production activities
that are placed in plain sight of all workers so that everyone can understand the status
of the system at a glance. Thus, if a machine goes down, or a part is defective or
delayed, immediate action can be taken.
Efficient layout and standardized work. The layout of equipment and processes is
designed according to the best operational sequence, by physically linking and
arranging machines and process steps most efficiently, often in a cellular arrangement.
Standardizing the individual tasks by clearly specifying the proper method reduces
wasted human movement and energy.
Pull production. In this system (also known as kanban or just-in-time), upstream
suppliers do not produce until the downstream customer signals a need for parts.
Single minute exchange of dies (SMED). SMED refers to rapid changeover of tooling
and fixtures in machine shops so that multiple products in smaller batches can be run on
the same equipment. Reducing setup time adds value to the operation and facilitates
smoother production flow.
Total productive maintenance. Total productive maintenance is designed to ensure that
equipment is operational and available when needed.
Source inspection. Inspection and control by process operators guarantees that product
passed on to the next production stage conforms to specifications.
Continuous improvement. Continuous improvement provides the link to Six Sigma. In
order to make lean production work, one must get to the root causes of problems and
permanently remove them. Teamwork is an integral part of continuous improvement in
lean environments. Many techniques that we discuss in subsequent chapters are used.
27. What is the Theory of Constraints (TOC)? Briefly explain the key principles.
Ans. The Theory of Constraints (TOC) is a set of principles that focuses on increasing
process throughput by maximizing the utilization of all bottleneck activities in a process.
Throughput is commonly defined as the average number of goods or services completed
per time period in a process. TOC views throughput as the amount of money generated per
time period through actual sales. For most business organizations the goal is to maximize
throughput, thereby maximizing cash flow. Inherent in this definition is that it makes little
sense to make a good or service until it can be sold, and that excess inventory is wasteful.
Thus, TOC supports lean thinking.
Chapter 2 – Process Concepts and Systems Thinking 15
In TOC, a constraint is anything in an organization that limits it from moving toward or
achieving its goal. Constraints determine the throughput of a facility, because they limit
production output to their own capacity. There are two basic types of constraints: physical
and nonphysical. A physical constraint is associated with the capacity of a resource such as
a machine, employee, or workstation. Physical constraints result in process bottlenecks. A
bottleneck work activity is one that effectively limits the capacity of the entire process. At a
bottleneck, the input exceeds the capacity, restricting the total output that is capable of
being produced. A nonbottleneck work activity is one in which idle capacity exists. A
nonphysical constraint is environmental or organizational, such as low product demand or
an inefficient management policy or procedure. Inflexible work rules, inadequate labor
skills, and poor management are all forms of constraints.
Because the number of constraints is typically small, the TOC focuses on identifying them,
managing bottleneck and nonbottleneck work activities, linking them to the market to
ensure an appropriate product mix, and scheduling the NBN resources to enhance
throughput.
28. What are the differences between lean and Six Sigma?
Ans. Both Six Sigma and lean are driven by customer requirements, focus on real dollar
savings, have the ability to make significant financial impacts on the organization, and can
easily be used in non-manufacturing environments. Both exploit data and logical problem-
solving analysis.
Some differences clearly exist between lean and Six Sigma. First, they attack different
types of problems. Lean addresses visible problems in processes, for example, inventory,
material flow, and safety. Six Sigma is more concerned with less visible problems, for
example, variation in performance. In essence, lean is focused on efficiency by reducing
waste and improving process flow, whereas Six Sigma is focused on effectiveness by
reducing errors and defects. Another difference is that lean tools are more intuitive and
easier to apply by anybody in the workplace, whereas many Six Sigma tools require
advanced training and expertise of Black Belt or Master Black Belt specialists (or
consultant equivalents). For example, the concept of the 5S’s is easier to grasp than
statistical methods. Thus, organizations might be well-advised to start with basic lean
principles and evolve toward more sophisticated Six Sigma approaches. However, it is
important to integrate both approaches with a common goal—improving business results.
ANSWERS TO DISCUSSION QUESTIONS z
1. Review the Six Sigma Body of Knowledge. What topics have you covered in previous
courses at your school? Which topics are new to you?

Chapter 2 – Process Concepts and Systems Thinking 16
Ans. Answers will vary, depending on curriculum. Most business programs include
requirements for statistics, organization behavior (leadership and teams), and operations
management (process design and improvement, lean management, statistical process
control, TQM, project management concepts). Others may have more depth with advanced
statistics, such as design of experiments, or provide a “stand-alone” project management
course. A “capstone” course is generally required, where students are introduced to
strategic planning and certain aspects of business results.
2. How might you apply the concepts of dashboards and balanced scorecards to your personal
life?
Ans. As noted earlier, a dashboard can be thought of as a collection of indicators that
summarize key performance measures. Key personal measures might be developed to
include health, family relationships, skill development (career and personal), career
success, financial well-being, and spiritual balance. Specific health measures could be
weight and number of hours per week of exercise. Family relationships could be measured
by hours of quality time with each family member. Skill development could be counted in
the number of course and seminars completed, to name a few.
The balanced scorecard is a summary of broad performance measures across the
organization. The purpose of the balanced scorecard is “to translate strategy into measures
that uniquely communicate your vision to the organization.” A balanced scorecard defines
the most important drivers of organizational success and consists of four perspectives:
Financial Perspective: Measures the ultimate results that the business provides to its
shareholders.
Internal Perspective: Focuses attention on the performance of the key internal
processes that drive the business.
Customer Perspective: Focuses on customer needs and satisfaction as well as market
share.
Innovation and Learning Perspective: Directs attention to the basis of a future
success—the organization’s people and infrastructure.
When applied to career planning, the balance scorecard could be a very valuable tool
for tracking performance against a strategic career plan. For example, the financial
perspective could be applied to tracking an individual’s income against one, three, and
five year goals. The internal perspective could match the results of periodic
performance review outcomes versus desired or anticipated results. Customer needs and
perspectives would have to be related to a defined set of customers (supervisors to
whom one reports, colleagues with whom one interacts, outside customers or suppliers,
etc.), and appropriate measures developed. The innovation and learning perspective
could be used to measure skill and experience development, also versus a plan for
accomplishment of those objectives.
Chapter 2 – Process Concepts and Systems Thinking 17
3. Discuss some of the key processes associated with the following business activities for a
typical company: sales and marketing, supply chain management, managing information
technology, and managing human resources.
Ans. Key business processes for sales and marketing could include the process for identifying
and selling products/services to customers; another one for order handling and processing for
repeat sales; supply chain management that requires processes for ordering routine and special
materials and supplies; and information technology management that requires processes to
develop computer systems and programs. Other processes are needed to handle routine,
repetitive processing jobs, such as payrolls; and HRM requires processes for recruiting, hiring,
orienting new hires, performance review, and employee separation, among others. See below
for a more extensive view.
4. List some of the common processes that a student performs. What would the requirements
of these processes be? What types of variation exist in these processes? How can these
processes be improved using a Six Sigma approach?
Ans. Students in a Six Sigma course might perform a personal TQM project and be asked
to identify a number of processes with objectives for improvement. Some processes might
be to get ready for class, course preparation, eating a healthy diet, etc. Some typical
objectives are get up on time (no snooze alarm), study chapters before coming to class, eat
no more than one “junk food” item out of the vending machine each day, etc. The
requirements of such processes would be to determine the goal or objective, measure the
actual versus the goal, determine the “gap” between those two measures, and take
corrective action. Depending on the habits of the individual, the variation might be quite
large. For example, if a student had been in the habit of “cramming” for exams, consistent,
regular study over the entire term might be difficult and lead to large variations.
Students might use the DMAIC process in order to make improvements. To do so, they
would need to define the “critical to quality” characteristics that they desired (such as those
things that contribute to higher grades), decide how to measure and analyze them (by using
a PTQM checksheet and scatter diagrams, for example), and then deciding on required
improvements and a control process to “hold the gains.”
5. Outline how the DMAIC process might be used to improve a process in a school or
university. What data or information might be difficult to obtain? Why?
Ans. One of the authors was actually involved in this type of process at both the program level
and the course level. At that time, prior to the growing popularity of Six Sigma, he attempted
with some success, to use TQ principles and tools in the course design process. In either
design or improvement projects, the process should begin with problem definition and
development of a list of customer needs and expectations (CTQ issues) as well as team
formation in the Define stage, move on to Measurement of what is currently done and
required metrics, Analysis is required to determine where improvements might be made,

Chapter 2 – Process Concepts and Systems Thinking 18
investigation of possible Improvements and whether they solve the perceived problem, and
ending with Control of the new process so that what the customer sees and believes the quality
of the product to be (perceived quality) will be continually delivered. It must be expected that
certain metrics will be difficult to find and may have to be created. Also, information relating
to personnel may be restricted, due to confidentiality.
6. In a true story related by our colleague Professor James W. Dean, Jr., the general manager
of an elevator company was frustrated with the lack of cooperation between the mechanical
engineers who designed new elevators and the manufacturing engineers who determined
how to produce them. The mechanical engineers would often completely design a new
elevator without consulting with the manufacturing engineers, and then expect the factory
to somehow figure out how to build it. Often the new products were difficult or nearly
impossible to build, and their quality and cost suffered as a result. The designs were sent
back to the mechanical engineers (often more than once) for engineering changes to
improve their manufacturability, and customers sometimes waited for months for
deliveries. The general manager believed that if the two groups of engineers would
communicate early in the design process, many of the problems would be solved. At his
wits’ end, he found a large empty room in the plant and had both groups moved into it. The
manager relaxed a bit, but a few weeks later he returned to a surprise. The two groups of
engineers had finally learned to cooperate—by building a wall of bookcases and file
cabinets right down the middle of the room, separating them from each other! What would
you do in this situation? Relate this to Six Sigma and systems thinking.
Ans. Traditionally, there have been high "walls" built between design engineers and
manufacturing engineers, so the Dean story is surprising, but not unbelievable. In fact, in
many companies, there is a saying that Design develops the product requirements and
"throws the new design over the wall" for Manufacturing to make. The implication is that
neither side has wanted to talk to, or cooperate with, the other. Quality assurance personnel
may be able to "bridge the gap" or "tear down the walls" between these groups by focusing
on the needs of the organization to design a product with the customer in mind, where the
customer can be seen as the immediate group (Manufacturing) by the design engineers, as
well as the ultimate customers or consumers of the finished product. The Six Sigma
approach would suggest that the areas need to have some common training on problem-
solving approaches, while systems thinking would require that they explore the interactions
between functions and the “client-customer” relationships that they have or wish to have.
7. Discuss some examples of “waste” in your life? How might they be avoided through lean
thinking?
Ans. Answers will vary, depending on the student’s definition of “waste.” Often the
definition will revolve around waste of time and money, the two things that students seem
to always have a limited amount of (or think that they do). Many students will waste time
playing video games. Others waste time due to poor study habits. Some students waste
money on gambling. Others waste money by making unnecessary purchases, such as

Chapter 2 – Process Concepts and Systems Thinking 19
spending too much for cellphone use. Lean thinking is sometimes defined as “getting more
done with less,” which could be applied to all of these cases. To break the habit of
excessive video gaming, the student must set priorities and plan to use time more
efficiently. Setting a goal to limit game playing to a certain amount of time per day, with a
control chart used to plot actual time spent, could reduce this waste substantially. Poor
study habits lead to too much (or too little) time being applied to each subject. This could
be improved by applying the 5-S’s to the study location, arranging computers, books, and
other materials to be close at hand, etc. A goal of not spending more than x number of
minutes on a difficult problem often results in more efficient use of time. Continuous
improvement over time is a worthy objective for reducing all types of personal waste.
8. The Six Sigma philosophy seeks to develop technical leadership through extensive training,
then use it in team-based projects designed to improve processes. To what extent are these
two concepts (technical experts versus team experts) at odds? What must be done to
prevent them from blocking success in improvement projects?
Ans. Ideally, the skills of technical experts (green or black Belts) will complement those of
team members (often called subject matter experts, or SME’s). The two types of experts may
be at odds if they cannot agree ways to analyze problems, what their measures show, and how
to implement improvements and hold the gains through appropriate control techniques. To
prevent them from clashing in such a way as to harm the results of the Six Sigma process, it is
useful to see that each has training and/or orientation to the environmental factors, methods,
and concepts used by the others. Also, the project champion has responsibility to see that any
disputes are mediated and resolved in such a way as to enhance project success.
9. Discuss the following questions related to the case study Applying Lean Six Sigma in a
Financial Services Firm in the text:
a. How was the lean effort at the financial services firm structured organizationally?
b. What role did the kaizen event play in improving the way that the project was
structured?
c. After the team had narrowed the focus to nine “quick hit” projects, what were the most
significant results (outlined for four of the projects)? Which lean tools may/could have
been used in order to realize these results?
Ans.
a. The first step was forming a cross-functional team comprised of fund accounting,
quality, and the central operations employees.
b. The kaizen event, identified 30 possible improvement items and ranked them based on
impact (high vs. low) and ease of implementation (easy vs. difficult). The projects were
divided into two categories: quick-hit projects that they could realistically solve and
implement within 90 days, and longer, strategic infrastructure improvements that
required additional time to address. The team quickly recognized that longer-term
Chapter 2 – Process Concepts and Systems Thinking 20
strategic projects— improving error tracking, creating a capacity model, and developing
a project management process—were necessary to answer the fundamental questions.
Actively measuring these errors would allow managers to quickly identify process steps
that present high levels of risk. The capacity model would help define utilization rates
for each fund accountant and team. Ultimately, the project management process will
ensure a robust process for getting everyone involved in process improvement. Finally,
nine quick hit projects were selected from the original list of 30. The projects were
divided among the original five team members, and subject-matter experts and
information technology resources were assigned to each project.
c. The most significant results from the four projects included:
1. Eliminating line-by-line comparison of pre- and post-trial balances. In the past, this
had been, a time-consuming, high-risk process. The improvement team developed a
new value to be calculated on the pre- and post-trial balances to allow a quick
comparison, thus eliminating the need for line-by-line reviews.
2. Simplifying the corporate action (CA) review process. This process had been
cumbersome, relied too much on people to catch discrepancies, and entailed four
inspection and sign-off points were needed to ensure quality of information. The team
developed a new daily automated report to compare the required values from the
system to a secondary source, highlighting any discrepancies. Since its implementation
there have been zero errors in the application of CA and a daily time savings of four
hours.
3. Creating an automatic feed of expense payments. The team redesigned the process to
automatically feed the expense information from the original source on a daily basis,
thus eliminating the need for distribution, entry, and verification steps.
4. Eliminating manual price change sheets. This had been a time-consuming, manual
process which introduced the possibility of data entry errors and miscalculations. The
improvement team redesigned and automated the report to replace the manual process.
Now a percent NAV change report is generated daily, thus reducing or eliminating
miscalculations and rework.
It is easy to hypothesize where lean tools may/could have contributed to process
improvements. These include:
5 S’s – used to define a system for workplace organization and standardization.
Efficient layout and standardized work. The layout of equipment and processes is
designed according to the best operational sequence, by physically linking and
arranging machines and process steps most efficiently, often in a cellular
arrangement. Standardizing the individual tasks by clearly specifying the proper
method reduces wasted human movement and energy.
Pull production. In this system (also known as kanban or just-in-time), upstream
suppliers do not produce until the downstream customer signals a need for parts.
Single minute exchange of dies (SMED). Reducing setup time adds value to the
operation and facilitates smoother production flow.

Chapter 2 – Process Concepts and Systems Thinking 21
Source inspection. Inspection and control by process operators guarantees that
product passed on to the next production stage conforms to specifications.
Continuous improvement. All of the projects could be seen as falling under this
category of continuous improvement.
10. Discuss the following questions related to the INFICON Six Sigma in Practice vignette:
a. What role did training play in their application of lean Six Sigma methods to their
operations?
b. How did INFICON use the 5S lean Six Sigma tools in order to to improve space
utilization, manufacturing efficiencies, problem solving, and their competitiveness?
Ans.
a. Training played a vital part in implementing a 5S program at INFICON. The consulting
group, CNYTDO, provided requisite coursework and helped identify projects for 6
company employees to become Six Sigma Black Belts. At the same time, CNYTDO
provided basic training in Lean Six Sigma and Lean to a majority of the company.
Individuals across all product families were trained in the four-step methodology of TWI
Job Instruction (JI).
b. These individuals were placed into teams that were tasked with developing breakdowns
of jobs that needed to be trained. By developing a workforce knowledgeable in Lean Six
Sigma supported by the standardized training methodology of TWI, INFICON began to
incorporate both the saving in efficiencies and floor space that Lean and Lean Six Sigma
promised. The initiatives resulted in reducing cycle time by 25%, floor space from 15% to
30%, and rework by 12%.
COMMENTS ON THINGS TO DO
1. Write down your process for preparing for an exam. How could this process be improved
to make it shorter and/or more effective? Compare your process to those of your
classmates. How might you collectively develop an improved process?
Comment: Answers will vary, depending on the exam preparation processes of the students. If
several students develop a flow chart, then unnecessary delays and operations can be
identified and discarded. Collectively, the students might then divide up, with half preparing
for the next exam by using their “old” approach and half using a new “systematic” approach.
They could then compare notes on time, learning, and grades, after the exam.
2. Interview a manager at organization to identify the value-creation and support processes
used. What techniques does the company use to improve them?
Comment: This exercise is designed to further students' awareness of the breadth of the
"quality movement" and help them confirm how and whether the theory of quality is being
applied in a practical settings in business and industry. As defined earlier, value-creation
Chapter 2 – Process Concepts and Systems Thinking 22
processes (sometimes called core processes), are most important to “running the business”
and maintaining or achieving a sustainable competitive advantage. Support processes, are
those that contribute to the successful performance of an organization’s value-creation
processes, employees, and daily operations, but do not direcctly add value to the product or
service. Various improvement techniques are widely known among trained quality managers,
but their use often depends on the size of the firm and the industry. Students may find that
most companies are tracking some output measures that can be helpful in uncovering
opportunities for error. Some Pareto charts and control charts may be found in many firms.
Don’t expect to see cause-and-effect diagrams, scatter diagrams, correlation and regression,
or experimental design, except in the most sophisticated quality-minded organizations (for
example, those with a Six Sigma program).
3. Identify some examples of problems in each of the five problem-solving categories
discussed in this chapter. Draw from your personal experiences.
Comment: The five problem-solving categories include: a) conformance problems, b)
efficiency problems, c) unstructured performance problems, d) product design problems,
and e) process design problems. Students may provide examples similar to the ones found in
the text, such as:
1. Conformance problems, which are characterized by unsatisfactory performance that
causes customer dissatisfaction, such as high levels of defects, service failures, or customer
complaints. The processes that create these results are typically well-specified and can be
easily described.
2. Efficiency problems, which are characterized by unsatisfactory performance that causes
dissatisfaction from the standpoint of noncustomer stakeholders, such as managers of
financial or supply chain functions. Typical examples are high cost, excessive inventory,
low productivity, and other process inefficiencies.
3. Unstructured performance problems, which are characterized by unsatisfactory
performance by processes that are not well-specified or understood. For example, a
company might discover that employee turnover is much higher than desired or employee
satisfaction is low. The factors that contribute to such results do not stem from processes
that can easily be described.
4. Product design problems, which involve designing new products or redesigning
existing products to better satisfy customer needs.
5. Process design problems, which involve designing new processes or substantially
revising existing processes. These might include new factory processes to manufacture a
new product line or designing a more flexible assembly line.
4. Three popular web sites for Six Sigma are http://www.ge.com/sixsigma,
http://www.isixsigma.com, and http://www.sixsigmaformum.com. Explore these sites and
classify information you can find there into the topical areas of the Six Sigma Body of
Knowledge.
Chapter 2 – Process Concepts and Systems Thinking 23
Comment: This project is designed to help the student to find how Six Sigma is viewed by
various interested parties and reflected on their websites. Don’t be surprised to see lack of
agreement on topical areas that are suggested.
5. Devise a red-bead type of experiment using bags of M&M candies. Implement the
experiment in class.
Comment: This project is designed to give students a hands-on feel for the concept of
variability, as illustrated by this variation on W. Edwards Deming’s experiment. If
“defects” are defined as those colors which are rarely found in bags of M&M’s, then the
percentage of those colors will remain constant across many, many bags of the candy, no
matter what the “skill level” of the workers are.
6. Set up and implement the funnel experiment using household items. Can you replicate the
results discussed in this chapter?
Comment: Like the previous project, this project is designed to give students a hands-on
feel for the concept of variability, as illustrated by this variation on W. Edwards Deming’s
experiment. In this case, the funnel will show that machine adjustments based on random
observation of results is not generally effective, and is often counter-productive.
SOLUTIONS TO PROBLEMS
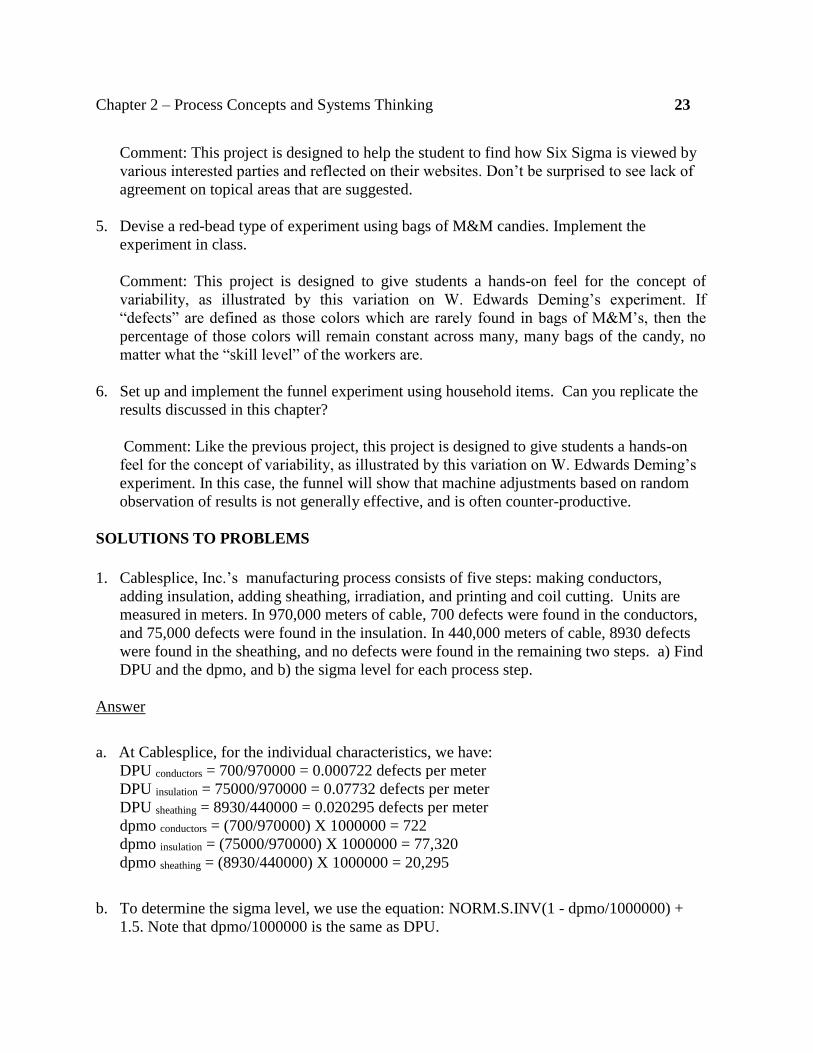
1. Cablesplice, Inc.’s manufacturing process consists of five steps: making conductors,
adding insulation, adding sheathing, irradiation, and printing and coil cutting. Units are
measured in meters. In 970,000 meters of cable, 700 defects were found in the conductors,
and 75,000 defects were found in the insulation. In 440,000 meters of cable, 8930 defects
were found in the sheathing, and no defects were found in the remaining two steps. a) Find
DPU and the dpmo, and b) the sigma level for each process step.
Answer
a. At Cablesplice, for the individual characteristics, we have:
DPU conductors = 700/970000 = 0.000722 defects per meter
DPU insulation = 75000/970000 = 0.07732 defects per meter
DPU sheathing = 8930/440000 = 0.020295 defects per meter
dpmo conductors = (700/970000) X 1000000 = 722
dpmo insulation = (75000/970000) X 1000000 = 77,320
dpmo sheathing = (8930/440000) X 1000000 = 20,295
b. To determine the sigma level, we use the equation: NORM.S.INV(1 - dpmo/1000000) +
1.5. Note that dpmo/1000000 is the same as DPU.

Chapter 2 – Process Concepts and Systems Thinking 24
NORM.S.INV calculation in the Excel® spreadsheet, we get:
NORM.S.INV conductors = (1 - 0.000722) + 1.5 = 4.69
NORM.S.INV insulation = (1 - 0.07732) + 1.5 = 2.92
NORM.S.INV sheathing = (1 - 0.020295) + 1.5 = 3.55
See spreadsheet Ch02-Solutions for computerized solutions.
2. For the Cablesplice’s process, described in Problem 1, find the rolled throughput yield
(RTY) for the five step process.
Answer
The RTY for the five steps in Cablecom’s manufacturing process would be:
RTY = 0. 999278 X 0. 922680 X 0. 979705 X 1.0 X 1.0 = 0.903302 or 90.33%
3. JW Famcor Company makes an artificial leather-like product for the fashion accessory
market. The material is made in sheets and has the appearance of a thin rug. Each sheet is
36 inches wide and 100 feet long and is wound into a roll. The quality manager has
requested that 100 rolls be inspected. Twenty seven non-conformances were found.
a. Calculate the nonconformances per unit (NPU) and the throughput yield.
b. If the production process consists of three steps, with step 1 having a TY of 93 percent;
step 2; 89 percent, and step 3, 92 percent what is the rolled throughput yield (RTY), and the
proportion nonconforming?
Answer
3. a. To calculate the NPU, use:
NPU = Number of nonconformances found/number of units inspected = 27/100 = 0.27
TY = e-NPU = e -0.27 = 0.763 or 76.3% will be free from nonconformances.
b. The RTY for the three steps in the process would be:
RTY = 0.93 X 0.89 X 0.92 = 0.762 or 76.2% yield
4. Miricelwell Insurance Company processes insurance policy applications in batches of 100.
One day, they had 12 batches to process and after inspection, it was found that four batches
had nonconforming policies. One batch had 3 nonconformances, another had 6, another had

Chapter 2 – Process Concepts and Systems Thinking 25
2, and another had 1 nonconformance. What were (a) the proportion nonconforming for
each batch, (b) the nonconformances per unit (NPU), in total for the 12 batches, and (c) the
Total yield (TY) for the 12 batches?
Answer
4. 1) the proportion nonconforming for each batch, was 0.03, 0.06, 0.02, and 0.01
2) the nonconformances per unit (NPU), in total for the 12 batches was:
NPU = (3 + 6 + 2 + 1)/ (12 * 100) = 12 / 1200 = 0.01
3) Total yield (TY) for the 10 batches = TY = e-NPU = e -0.01 = 0.99 or 99.0% will be free
from nonconformances, which agrees with the NPU figure, as well.
5. Tremblor Airlines measured their numbers of lost bags in one month and found that they
had lost 150 bags for 10,000 customers. If the average number of bags per customer is 1.3,
how many errors per million opportunities (epmo) does this represent? The worldwide rate
of baggage mishandling reported by SITA (Société Internationale de Télécommunications
Aéronautiques) in 2011 was 12.07 per 1,000 passengers. If the average number of checked
bags per passenger is assumed to be 1.3, how many errors per million opportunities (epmo)
does this represent? How does this compare with the rate for Tremblor – better or worse?
Answer
5. epmo = (Number of defects discovered) /opportunities for error x 1000000
Thus, a defect rate of 150 bags for 10,000 customers, if the average number of bags per
customer is 1.3 is:
epmo = 150/[10,000)(1.3)] x 1000000 = 11,538
12.07 per 1,000 is equivalent to 12,070 dpmo if each passenger only had one bag.
However, customers may have different numbers of bags; thus the number of opportunities
for error must be based on the average number of bags per customer. If the average number
of bags per customer is 1.3, and an airline recorded 12.07 lost bags for 1000 passengers in a
month, then
epmo = 12.07/[1,000)(1.3)] x 1000000 = 9,285
The epmo number for Tremblor is somewhat worse than the SITA number.
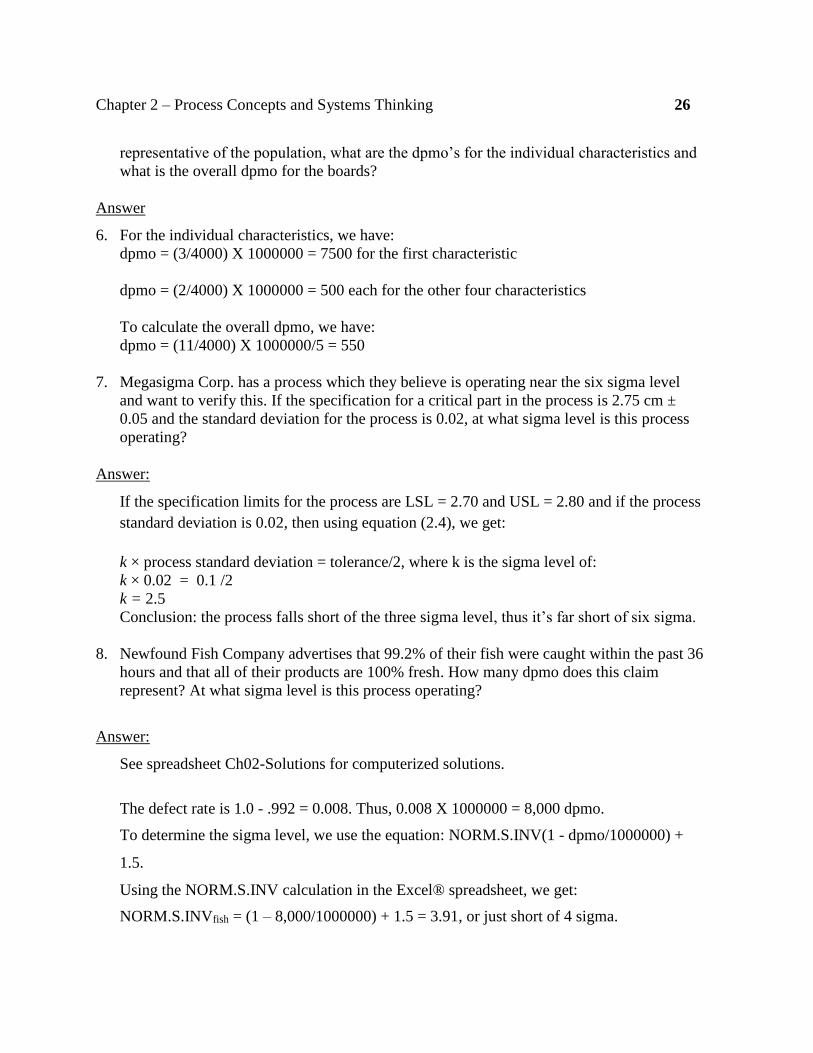
6. Boardwork Electronics manufactures 250,000 circuit boards per month. A random sample
of 4,000 boards is inspected every week for five characteristics. During a recent week,
three defects were found for one characteristic, and two defects each were found for the
other four characteristics. If these inspections produced defect counts that were
Chapter 2 – Process Concepts and Systems Thinking 26
representative of the population, what are the dpmo’s for the individual characteristics and
what is the overall dpmo for the boards?
Answer
6. For the individual characteristics, we have:
dpmo = (3/4000) X 1000000 = 7500 for the first characteristic
dpmo = (2/4000) X 1000000 = 500 each for the other four characteristics
To calculate the overall dpmo, we have:
dpmo = (11/4000) X 1000000/5 = 550
7. Megasigma Corp. has a process which they believe is operating near the six sigma level
and want to verify this. If the specification for a critical part in the process is 2.75 cm ±
0.05 and the standard deviation for the process is 0.02, at what sigma level is this process
operating?
Answer:
If the specification limits for the process are LSL = 2.70 and USL = 2.80 and if the process
standard deviation is 0.02, then using equation (2.4), we get:
k × process standard deviation = tolerance/2, where k is the sigma level of:
k × 0.02 = 0.1 /2
k = 2.5
Conclusion: the process falls short of the three sigma level, thus it’s far short of six sigma.
8. Newfound Fish Company advertises that 99.2% of their fish were caught within the past 36
hours and that all of their products are 100% fresh. How many dpmo does this claim
represent? At what sigma level is this process operating?
Answer:
See spreadsheet Ch02-Solutions for computerized solutions.
The defect rate is 1.0 - .992 = 0.008. Thus, 0.008 X 1000000 = 8,000 dpmo.
To determine the sigma level, we use the equation: NORM.S.INV(1 - dpmo/1000000) +
1.5.
Using the NORM.S.INV calculation in the Excel® spreadsheet, we get:
NORM.S.INVfish = (1 – 8,000/1000000) + 1.5 = 3.91, or just short of 4 sigma.
Chapter 2 – Process Concepts and Systems Thinking 27
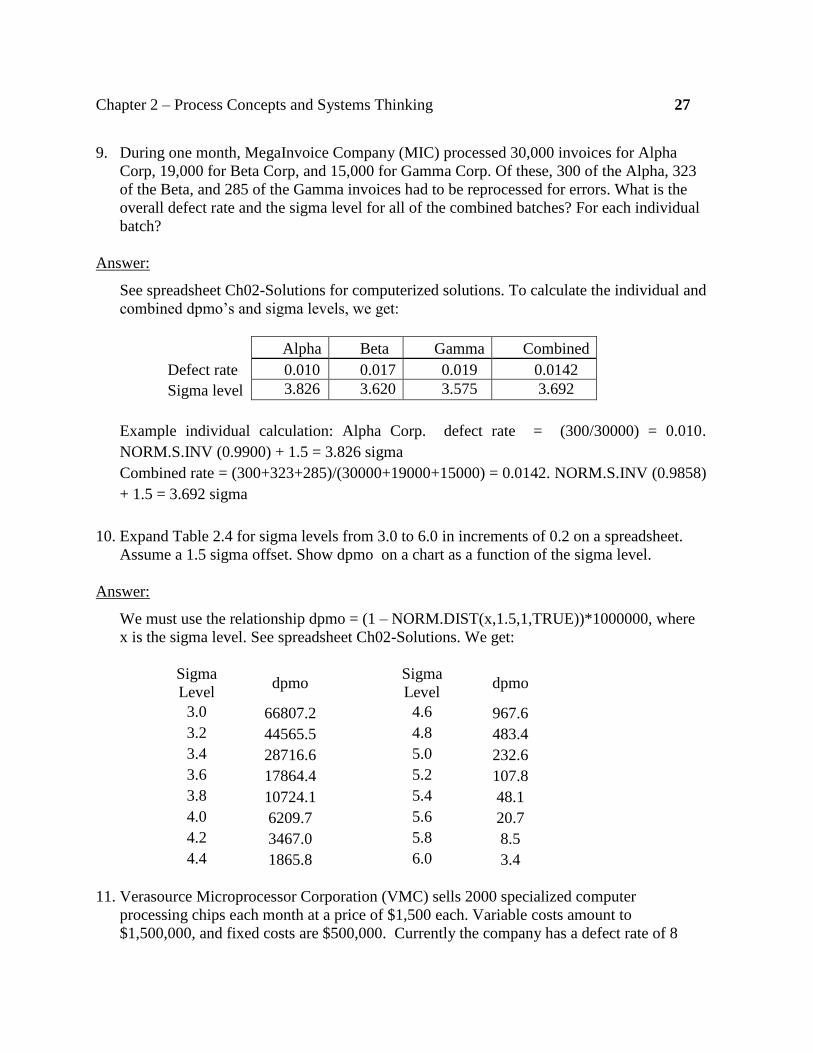
9. During one month, MegaInvoice Company (MIC) processed 30,000 invoices for Alpha
Corp, 19,000 for Beta Corp, and 15,000 for Gamma Corp. Of these, 300 of the Alpha, 323
of the Beta, and 285 of the Gamma invoices had to be reprocessed for errors. What is the
overall defect rate and the sigma level for all of the combined batches? For each individual
batch?
Answer:
See spreadsheet Ch02-Solutions for computerized solutions. To calculate the individual and
combined dpmo’s and sigma levels, we get:
Alpha Beta Gamma Combined
Defect rate 0.010 0.017 0.019 0.0142
Sigma level 3.826 3.620 3.575 3.692
Example individual calculation: Alpha Corp. defect rate = (300/30000) = 0.010.
NORM.S.INV (0.9900) + 1.5 = 3.826 sigma
Combined rate = (300+323+285)/(30000+19000+15000) = 0.0142. NORM.S.INV (0.9858)
+ 1.5 = 3.692 sigma
10. Expand Table 2.4 for sigma levels from 3.0 to 6.0 in increments of 0.2 on a spreadsheet.
Assume a 1.5 sigma offset. Show dpmo on a chart as a function of the sigma level.
Answer:
We must use the relationship dpmo = (1 – NORM.DIST(x,1.5,1,TRUE))*1000000, where
x is the sigma level. See spreadsheet Ch02-Solutions. We get:
Sigma
Level dpmo
Sigma
Level dpmo
3.0 66807.2
4.6 967.6
3.2 44565.5
4.8 483.4
3.4 28716.6
5.0 232.6
3.6 17864.4
5.2 107.8
3.8 10724.1
5.4 48.1
4.0 6209.7
5.6 20.7
4.2 3467.0
5.8 8.5
4.4 1865.8
6.0 3.4
11. Verasource Microprocessor Corporation (VMC) sells 2000 specialized computer
processing chips each month at a price of $1,500 each. Variable costs amount to
$1,500,000, and fixed costs are $500,000. Currently the company has a defect rate of 8

Chapter 2 – Process Concepts and Systems Thinking 28
percent (which are chips returned by customers, scrapped by VMC, and replaced). Note
that the variable costs include the cost of producing the defective chips.
a. What is the hidden cost to the company of making this rate of defectives instead of 2000
good chips each month?
b. Suppose a Six Sigma effort can reduce the defects to a six sigma level (assume for
simplicity that the defective rate is essentially zero). What is the impact on profitability?
Answer:
a) In order to produce and sell 2,000 good computer chips, VMC must start 2,000/0.92 =
2,174 chips into production. However, since the variable cost of $1,500,000 includes the
cost of making scrap, the unit variable cost is therefore not $1,500,000/ 2,000 = $750 but
$1,500,000/2,174 = $689.97. Thus the price paid for poor quality, sometimes called the
hidden factory, is 174 x $689.97 = $120,060. This additional cost is incurred to make
useless products that can’t be sold.
b) If a quality improvement initiative achieves a six sigma defect level, the defective rate is
essentially zero. This will remove the variable cost of making the 174 defective units. The
table below shows that the $120,055 poor quality cost is eliminated from the variable costs,
and the saved money falls to the bottom line to increase profits. Thus, the profit increased
to $1,120,060. The 8% reduction in operational costs produced a 12% increase in profit
($120060/ $1000000).
Monthly Baseline Monthly Six Sigma Results
Sales: 2000 X $1500.00 = 3000000 Sales: 2000 X $1500.00 = 3000000
Variable Cost: 2174 X $ 689.97 = 1500000 Variable Cost: 2000 X $ 689.97 = 1379940
Contribution margin 1500000 Contribution margin 1620060
Fixed cost 500000 Fixed cost 50000
Net Profit 1000000 Net Profit 1120060
Profit margin 0.333 Profit margin 0.373