prime multi-family investment opportunity · a quaint, established downtown las vegas neighborhood...
TRANSCRIPT

• PRIME MULTI-FAMILY INVESTMENT OPPORTUNITY• 52 VERY SPACIOUS APARTMENT UNITS• BELOW MARKET RENTS
• BELOW MARKET ASKING PSF• LOCATED IN A QUALIFIED OPPORTUNITY ZONE
DOWNTOWN LAS VEGAS Prime Multi-Family Investment Opportunity505-515 S. 13th Street, Las Vegas, NV 89101 | Palm Garden Apartments
SunCommercial Real Estate, Inc.
Sun Commercial Real Estate, Inc., 6140 Brent Thurman Way, Suite 140, Las Vegas, Nevada 89148702 | 968 | 7300 Phone • 702 | 968 | 7301 Fax • www.SunCommercialRE.com

OFFERING MEMORANDUM: PRIME INVESTMENT OPPORTUNITY 2
Confidentiality & disClosure
The information contained herein was obtained from sources believed reliable, however, Sun Commercial Real Estate, Inc. any of its agents or employees make no guaranty, warranty or representation as to the completeness and/or accuracy thereof, inclusive of any current and future projected returns. Anyone utilizing this analysis does so at their own risk and agrees to hold Sun Commercial Real Estate, Inc., its agents and employees harmless. The presentation of this property is subject to error, omissions change of price or conditions prior to sale, or withdrawal without notice.
SUN COMMERCIAL REAL ESTATE, INC. (the “Broker”) has been retained on an exclusive basis to market the property described herein (the “Property”). Broker has been authorized by the Seller of the Property (the “Seller”) to prepare and distribute the enclosed information (the “Material”) for the purpose of soliciting offers to purchase from interested parties. More detailed financial, title and tenant lease information may be made available upon request following the mutual execution of a letter of intent or contract to purchase between the Seller and a prospective purchaser. You are invited to review this opportunity and make an offer to purchase based upon your analysis. If your offer results in the Seller choosing to open negotiations with you, you will be asked to provide financial references. The eventual purchaser will be chosen based upon an assessment of price, terms, ability to close the transaction and such other matters as the Seller deems appropriate.
The Material is intended solely for the purpose of soliciting expressions of interest from qualified investors for the acquisition of the Property. The Material is not to be copied and/or used for any other purpose or made available to any other person without the express written consent of Broker or Seller. The Material does not purport to be all-inclusive or to contain all of the information that a prospective buyer may require. The information contained in the Material has been obtained from the Seller and other sources and has not been verified by the Seller or its affiliates. The pro forma is delivered only as an accommodation and neither the Seller, Broker, nor any of their respective affiliates, agents, representatives, employees, parents, subsidiaries, members, managers, partners, shareholders, directors, or officers, makes any representation or warranty regarding such pro forma. Purchaser must make its own investigation of the Property and any existing or available financing, and must independently confirm the accuracy of the projections contained in the pro forma.
Seller reserves the right, for any reason, to withdraw the Property from the market. Seller has no obligation, express or implied, to accept any offer. Further, Seller has no obligation to sell the Property unless and until the Seller executes and delivers a signed agreement of purchase and sale on terms acceptable to the Seller, in its sole discretion. By submitting an offer, a purchaser will be deemed to have acknowledged the foregoing and agreed to release Seller and Broker from any liability with respect thereto.
Property walk-throughs are to be conducted by appointment only. Contact Brokers for additional information.
Cathy Jones, CPA, SIOR, CCIMCEO
NV Lic # B0056010.CORP
Michael HsuSenior Vice President
NV Lic # S.0051609.LLC
Paul MiachikaExecutive Vice President
NV Lic # S.0184612
Sun Commercial Real Estate, Inc.6140 Brent Thurman Way, Suite 140, Las Vegas, Nevada 89148
702 | 968 | 7300 Ph • 702 | 968 | 7301 Faxwww.SunCommercialRE.com
OFFERING MEMORANDUM: PRIME INVESTMENT OPPORTUNITY 3
Property Highlights
Property Location
Section 1
Section 2
Aerial - Looking WestSurrounding AerialProperty PhotosAssessor Parcel MapOpportunity Zone
Property Summary & Investment HighlightsProperty Overview
Las Vegas New DevelopmentsNevada Business Advantages
Las Vegas Overview Section 3
table of Contents

OFFERING MEMORANDUM: PRIME INVESTMENT OPPORTUNITY 4
ProPerty summary & investment HigHligHts
PROPERTY SUMMARY
Very well maintained 52 unit apartment complex located in a quaint, established Downtown Las Vegas neighborhood surrounded by updated townhome complexes. The surrounding area offers plenty of employment opportunities, shopping and dining experiences. Compared to the apartment complexes in the area, these 52 units are very spacious and 34 of them uniquely in 2 stories similar to town homes. The inner courtyard is a little oasis featuring both a pool and barbecue grill and the property furthermore offers on-site laundry facilities, paid parking in the back and plenty of street parking in the front. The property is located within walking distance from public transportation and just a 5-7 minute drive from the Charleston/I-15 interchange, and the Charleston/I-515 interchange.
INVESTMENT HIGHLIGHTS
• Unique Multi-Family Investment Opportunity
• VERY Spacious Updated Apartment Units; ±400 SF larger than the average unit sold in the area
• Easy access to area amenities and Demand Generators including Las Vegas “Strip”, Downtown Fremont Street Experience, and the Charleston/I-15 Freeway Interchange
• Very Well Maintained Property and Neighborhood
• Located in a Qualified Opportunity Zone
• Asking price PSF is significantly below average sold price PSF for the area
OFFERING MEMORANDUM: PRIME INVESTMENT OPPORTUNITY 5
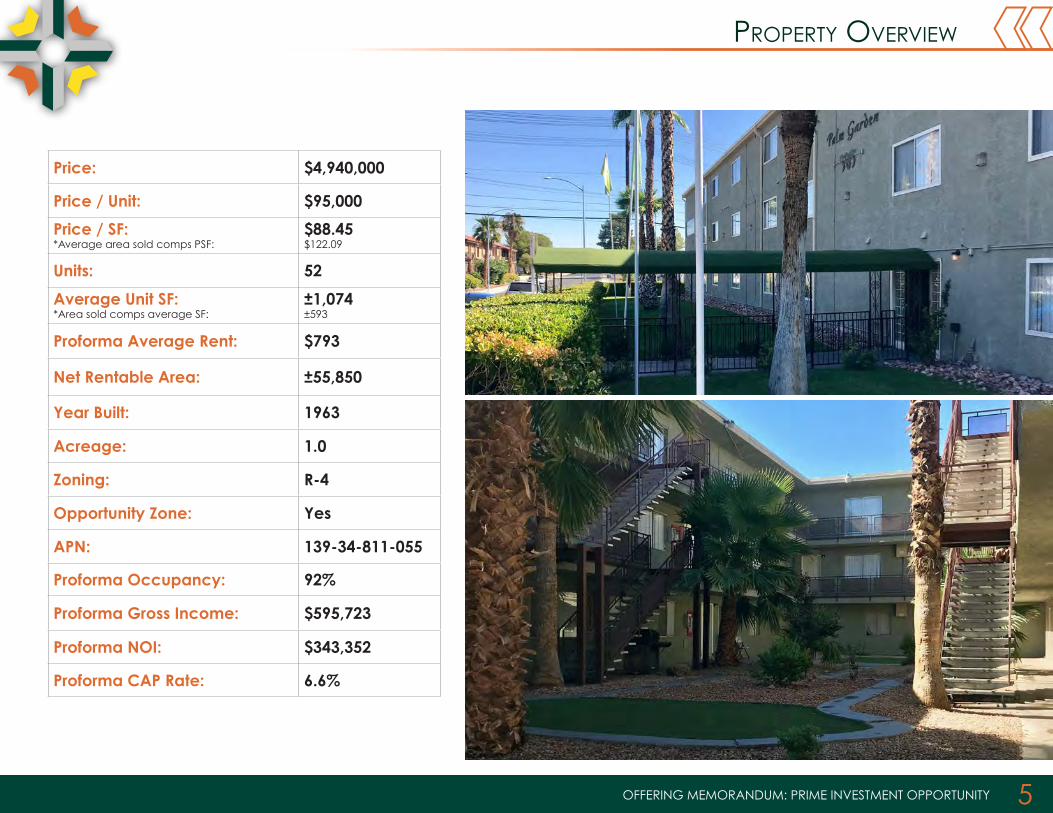
ProPerty overview
Price: $4,940,000
Price / Unit: $95,000
Price / SF:*Average area sold comps PSF:
$88.45$122.09
Units: 52
Average Unit SF: *Area sold comps average SF:
±1,074±593
Proforma Average Rent: $793
Net Rentable Area: ±55,850
Year Built: 1963
Acreage: 1.0
Zoning: R-4
Opportunity Zone: Yes
APN: 139-34-811-055
Proforma Occupancy: 92%
Proforma Gross Income: $595,723
Proforma NOI: $343,352
Proforma CAP Rate: 6.6%
OFFERING MEMORANDUM: PRIME INVESTMENT OPPORTUNITY 6
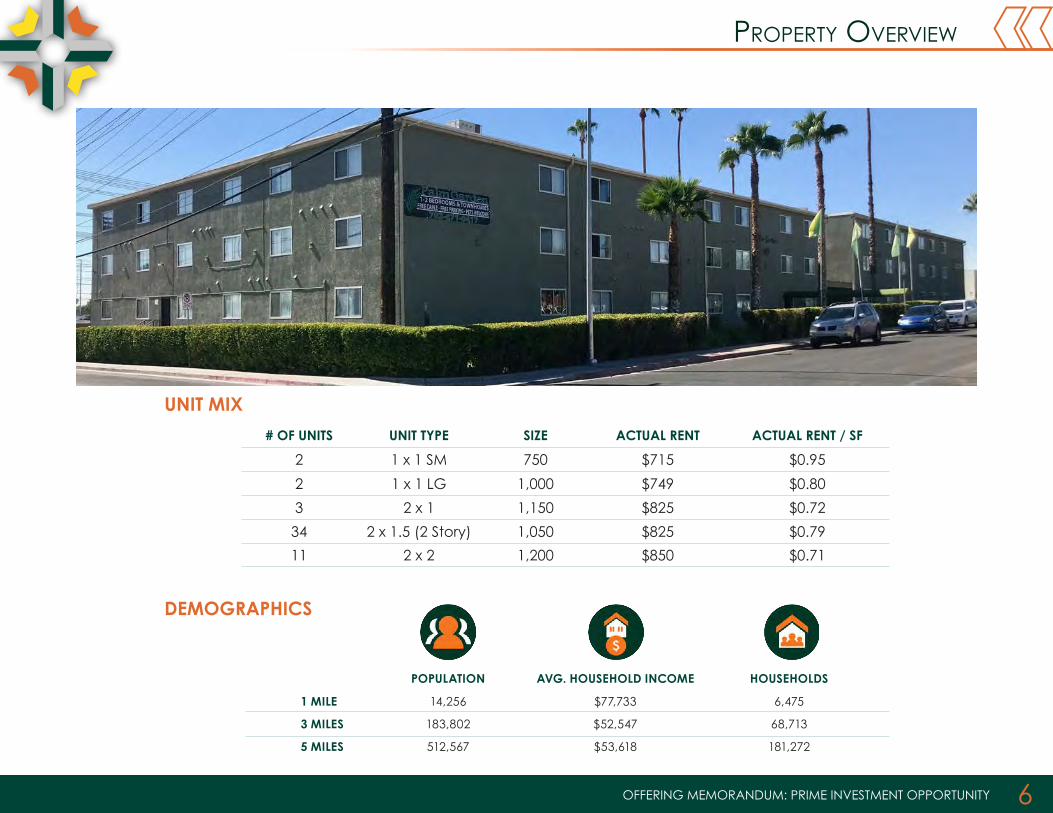
ProPerty overview
# OF UNITS UNIT TYPE SIZE ACTUAL RENT ACTUAL RENT / SF
2 1 x 1 SM 750 $715 $0.95
2 1 x 1 LG 1,000 $749 $0.80
3 2 x 1 1,150 $825 $0.72
34 2 x 1.5 (2 Story) 1,050 $825 $0.79
11 2 x 2 1,200 $850 $0.71
UNIT MIX
DEMOGRAPHICS
1 MILE
3 MILES
5 MILES
14,256
183,802
512,567
POPULATION
$77,733
$52,547
$53,618
AVG. HOUSEHOLD INCOME
6,475
68,713
181,272
HOUSEHOLDS

OFFERING MEMORANDUM: PRIME INVESTMENT OPPORTUNITY 7
aerial - looking west
S. MARYLAND PARKWAY
E. CHARLESTON BOULEVARDE. C
LARK AVENUE
S. 13TH STREET
SUBJECT PROPERTY
S. MARYLAND PARKWAY
World Market Center Las
VegasLas Vegas North Premium
Outlets
LEWIS AVENUE
E. BRIDGER AVENUE
E. BON
NEV
ILLE AVEN
UE
FREMONT STREET
Fremont Street Experience
GA
SS A
VEN
UE
Clark County Government
Center

OFFERING MEMORANDUM: PRIME INVESTMENT OPPORTUNITY 8
surrounding aerial
E. CHARLESTON BOULEVARD
E. SAHARA AVENUE
S. LA
S VEG
AS BO
ULEVA
RD
Clark County Government
Center
Fremont Street
Downtown Las Vegas
Arts District Las Vegas
The Strat
Las Vegas North Premium
Outlets
SUBJECT PROPERTY
SITE

OFFERING MEMORANDUM: PRIME INVESTMENT OPPORTUNITY 9
ProPerty PHotos

OFFERING MEMORANDUM: PRIME INVESTMENT OPPORTUNITY 10
ProPerty PHotos

OFFERING MEMORANDUM: PRIME INVESTMENT OPPORTUNITY 11
ProPerty PHotos

OFFERING MEMORANDUM: PRIME INVESTMENT OPPORTUNITY 12
ProPerty PHotos

OFFERING MEMORANDUM: PRIME INVESTMENT OPPORTUNITY 13
Ë5
E5E5
E5
E5
E5>E5 "E5 >E5
410
814
812
811
801
810801
CLARK AVE
RUE 13
019
040
044
015
025020019
015
002
007
017
016
010
029
030
031
032
035
039018
040
041
042
89-028
002 003013 014 015 016 017 018 019 020 022023
VAC 20040512:02469
VAC 250466
VAC
778:
6251
54
VAC
2043
:200
2564
VAC
1700
:165
9545
VAC 47610
VAC
167
672
VAC 47610VAC 412963VAC 412963 VAC 412963
VAC 126:412963VAC 126:412963VAC 412963 VAC 412963
THIR
TEEN
TH S
T
EIG
HTH
ST
LEWIS AVE
MAR
YLAN
D PK
WY
THIR
TEEN
TH S
T
CLARK AVE
SEVE
NTH
ST
EIG
HTH
ST
NINT
H ST
TENT
H ST
GARCES AVE
GASS AVE
ELEV
ENTH
ST
CHARLESTON BLVD
PB 1-35
PB 1-35
PB 1-35
PB 1-51
PB 1-35
PB 1-51
PB 1-51
PB 1-13
PB 4-6PB 1-116
PB 1-2
PB 2-89
PB 1-13
PB 2-63
7
1
3
4
5
6
234
1112
15
121
(21)
(1)
(19)(18)
8
1314
PT16
PT16
1027
17
11
1112
13
1516
17
192021
232425
27
78
910
1112
1314
1516
1718
19
212223
2526
27
293031
12
34
5
78
910
1112
1415
16
181920
2223
24252627
301234
8910
1
34
67
9
1112
13
18
22
67
910
18
22
25
28
31
10
2425268
765
9
1314
1514
103031
32
89
51
3
6
89
56
8
23
5
8
12
34
9
5
78
17
19
26
29
32
34
56
89
11
20
22
30
32
23
45
7
910
12
15
18
20
23
2526
28
3031
1
15
17
20
23
2526
45
8
1112
13
26
67
12
16
18
20
22
24
26
28 1
11121315
17 19 20
23
32
12
34
5
1 2 3
22
1
2
3
4 5
7
1
9
1415
16
89
1011
1213
12
34
56
7
32
25
2814
1516
1718
20
22
4
(22)(23)
(25)(26)
(27)(28)
(29)
2
3PT 2PT 2
(31)(30)
1819
10
14
18
22
26
20
24
28
32
6
13
17
21
2829
31
567
2
5
8
10
17
1920
21
2324
5
8
1112
1314
1516
1920
21
2324
2627
2930
32
9876543
21
23
16
1312
11
16 294
2
45
7
1011
1213
14
1718
1920
2122
2324
2526
271516
2829
3031
32
32
7
1
4
67
9
1718
1920
21
24
1718
56
78
1011
1213
1415
272829
3031
6
910
1112
1314
1516
18
202122232425
2728
3031
7
10
12
1718
19
21
23
29
31
1
6
8
11
1314
17
19
2122
24
27
29
32
2
1618
19
19
21
241415
1617
1819
2021
2223
2425
1011
1314
15
17
19
21
23
25
27
2930
3132
10
1416 18
16
181920
2122
15
16
1920
2122
2324
2526
2728
2930
3132
2930
2526
2728
222310
1112
13
2930
31
2627
5
4
3
76
1011
1213
14
16
PT10
10PTPT10
PT10
1
1
57.3
9
140
50 140
20
58 50
140
35
8012
5.61
39.67
135
R=20 12550
112.72
15
140
250
83.451.3
140
140
136.3
20
80
20
140
80
140
20
5140
80
10
80
140
40140
20
80
80
80140
140
20
80
20
140
140
80
140
140
140
140
20
80
140
5
140
140
140
140
140
5
80
80
140
140
80
140
140
20
140
140
80 20
192.26
75.5
2
133.0665.16
121.
93
155.47
75.5
2
61.37 107.98
134.05
161
110
62.5127.41
140
140
140
140
140
140
140
160
125
140
42.96
87.0
6
48.33
20
40
140
140
140
140
40
20
140
140
140
20
140
140140
140
80
140
140
20
40
140
40
140
140
130
80
2040
20
140
115
20
140
20
R=20
50
50
140.04
139.92
139.92 R=25
139.
3415
50
42.5
37.5
32.5
20
70
70
25
25
25
2525
11
1510
25
255
20
25
25
25
140
160
25
25
25
2550
29
111
2525
25
25
25
25
25
25
9
140
9
2525
817
2515
1025
22325
25421
25120
140
25
25
25
25
25
25
25
25
25
25
25
140
14
78.6320
92.5 25
25
105.19140
25
25
140
25
25
2515
2525
25
25
25
25
25
25
25
25
25
25
25
25
25
25
25
25
45.0178.45
25
26
25
25
25
46
3933
26
25
25
25
25
2510
1525
25
25
25
25
25
1510
25
196
2512
13
25
25
93.47 55.2
7
132.15
66.3
2
140
50 50
25
25
25
25
25
25
1312
4025
37.5
187
140
25
25
25
140
140
25
25
7
97.67
50
50
R=20
100 25
65
135.32 160.5310
160 70
215.
26
84.0
7
29.1
1
20
49.1
249
.1320
130
2525
2525
139.99
90
100
140
75
130
115
140
125
150.
2
139.98
50.0
1
50
5551.2 200 20218.9810
92.1
4010
46.6
366
10
60R=20
50
50
30
60 79.6260 60 60 60 60
30
R=20 20
50
5050
104.55
5050
87
145
50
50
81.1
4
68.81
40
60 60 60 60 65 65 65 66.8
65
60
25
16026
801
75
130
140
801
401 PT 28
115
140
801
80113018
13
14
10
10
16 2319
15
13
9
19
18
11
15
21
22
2
1
3
15
22
F 9
16
21
20
20
23
12
16
R=24
115.08
125.
19
701007
026
33
33012
3
PB 1-13
028
MAR
YLAN
D P
KWY
012
VEGA VERDE ADDITION80 50 60
021
C MARYLAND TRACT NO 2 813 037 MARYLAND TRACT NO 1
PB 2-63 HUNTRIDGE SUBDIVISION TRACTS 1,2 & 3 AMD
PM 116-24
MAR
YLAN
D PK
WY
29
WARDIEADD
033
006
02733
RESUB WARDIE ADDITION021
1
PM67-25
PM 67-25
ADDLADDSPB 1-2
19
VAC 778:625154
PIONEER HEIGHTS
011
VAC 20010605:1270
VAC 20020509:1844
043
15
LADDS ADDITION2
R=20
65.0
1
172.
01
337.
16
055152.4 R=10
1
50
PM118-8
401
130.04
PB 1-13
29
SIXT
H ST31
32
3029 2
WARDIE ADD
14
12
SOUTHADD
140
50801
11
VAC 890721:526
034
008
E044
BONNEVILLE AVE
8081322
30
PT14
3231
1415
16
801 045
25
R=30
21
25
27
31
24
26
3029
289
87
654
32
123 24456
34
56
78
910
14
29
3132
30
2728
801296.16
409.
74
L=212.86
401
50
PIONEERHEIGHTS
046
VAC 20010605:1270
VAC 625154
VAC 20020509:1844
140
301.03
12
34
56
7
34
89
1011
2928
2726
2524
2223
2120
1
25
17
34
56
7
98
1011
1615
1413
12
29 350
140801
140 75
801
150
100
1
100
139.99140
801
50
140
PM 122-17
130
57.0
2
140
139.95
034002
005
001
004
003
012
014023
024021
028013
024
005
009
012
013
022
009
038
0070.4
0050.8
0140.16
0130.41
0120.24
0110.16
0101.83
0090.16
0170.98
0080.48
0050.32
0080.37
0060.24
0050.24
0010.32
0021.97
0020.38
068
217
218
225
239
031
033
037
038
064
041
043
042
044
009
015
014
013
012
011010109
116
111112
074075
076
077
078
105
104
103
102
101
010
011
015
010
008
006
012013
002
051
061003
001
036
006
223
240
243
242
005
003
124043021
120098020 046044
002 045072 045 057 027 028018222
046019 055 026056001 029003221 020
054
089
025 030004057021053220 024
005058 001052
219 023004
032051 059022088015 090
006
060023014
087091 034024224 013
022092025012 049 086 021093
026 061011 007048027 020
035
062010 122028 019007045 119
036
048029018008227 009118044
094 017065 083228 016
049
053007 030 016095
082 015066054031 096
120
050
014067 081032 097080033
098
055
079034241 099
041069 100035 012
070039009
038071
037 072 056108
073 057107
001003
106
002 003 004001
007090
0600.7
0110.49
0630.35
036
021
012
NO
TES
This map is for assessment use only and does NOT represent a survey.
No liability is assumed for the accuracy of the data deliniated herein. Information on roads and other non-assessed parcels may be obtained from the Road Document Listing in the Assessor's Office.
This map is compiled from official records, including surveys and deeds, but only contains the information required for assessment. See the recorded documents for more detailed legal information.
MA
P LE
GE
ND
USE THIS SCALE(FEET) WHEN MAP REDUCED FROM 11X17 ORIGINAL
ASSESSOR'S PARCELS - CLARK COUNTY, NV.
Scale: 1" = 200' 1/8/2019
T20S R61E 34 S 2 SE 4 139-34-8
31
30
19
1
1314
121110987
6 5 4 3 2
3635343332
29 28 27 26
24
25
23222120
18 17 16 15
BO
OK
SEC
.
MA
P
2
3
4
5
6
7
8
1
2
3
4
51
8
7
5
6
4 8
203
PARCEL BOUNDARYSUB BOUNDARY
ROAD EASEMENTPM/LD BOUNDARY
HISTORIC LOT LINEMATCH / LEADER LINE
ROAD PARCEL NUMBERPARCEL NUMERACREAGE
PARCEL SUB/SEQ NUMBER
PLAT RECORDING NUMBERBLOCK NUMBERLOT NUMBERGOV. LOT NUMBER
10010011.00
202PB 24-45
55
GL5
HISTORIC SUB BOUNDARYHISTORIC PM/LD BOUNDARY
15
8 4
Rev:
TAX DIST
0 200 400 600 800100 SECTION LINE
CONDOMINIUM UNITAIR SPACE PCLRIGHT OF WAY PCLSUB-SURFACE PCL
139
161162
140138
163
124 123
177 178
125
176
Briana Johnson - Assessor
q
SUBJECT SUBJECT PROPERTYPROPERTY
Ë5
E5E5
E5
E5
E5>E5 "E5 >E5
410
814
812
811
801
810801
CLARK AVE
RUE 13
019
040
044
015
025020019
015
002
007
017
016
010
029
030
031
032
035
039018
040
041
042
89-028
002 003013 014 015 016 017 018 019 020 022023
VAC 20040512:02469
VAC 250466
VAC
778:
6251
54
VAC
2043
:200
2564
VAC
1700
:165
9545
VAC 47610
VAC
167
672
VAC 47610VAC 412963VAC 412963 VAC 412963
VAC 126:412963VAC 126:412963VAC 412963 VAC 412963
THIR
TEEN
TH S
T
EIG
HTH
STLEWIS AVE
MAR
YLAN
D PK
WY
THIR
TEEN
TH S
T
CLARK AVE
SEVE
NTH
ST
EIG
HTH
ST
NINT
H ST
TENT
H ST
GARCES AVE
GASS AVE
ELEV
ENTH
ST
CHARLESTON BLVD
PB 1-35
PB 1-35
PB 1-35
PB 1-51
PB 1-35
PB 1-51
PB 1-51
PB 1-13
PB 4-6PB 1-116
PB 1-2
PB 2-89
PB 1-13
PB 2-63
7
1
3
4
5
6
234
1112
15
121
(21)
(1)
(19)(18)
8
1314
PT16
PT16
1027
17
11
1112
13
1516
17
192021
232425
27
78
910
1112
1314
1516
1718
19
212223
2526
27
293031
12
34
5
78
910
1112
1415
16
181920
2223
24252627
301234
8910
1
34
67
9
1112
13
18
22
67
910
18
22
25
28
31
10
2425268
765
9
1314
1514
103031
32
89
51
3
6
89
56
8
23
5
8
12
34
9
5
78
17
19
26
29
32
34
56
89
11
20
22
30
32
23
45
7
910
12
15
18
20
23
2526
28
3031
1
15
17
20
23
2526
45
8
1112
13
26
67
12
16
18
20
22
24
26
28 1
11121315
17 19 20
23
32
12
34
5
1 2 3
22
1
2
3
4 5
7
1
9
1415
16
89
1011
1213
12
34
56
7
32
25
2814
1516
1718
20
22
4
(22)(23)
(25)(26)
(27)(28)
(29)
2
3PT 2PT 2
(31)(30)
1819
10
14
18
22
26
20
24
28
32
6
13
17
21
2829
31
567
2
5
8
10
17
1920
21
2324
5
8
1112
1314
1516
1920
21
2324
2627
2930
32
9876543
21
23
16
1312
11
16 294
2
45
7
1011
1213
14
1718
1920
2122
2324
2526
271516
2829
3031
32
32
7
1
4
67
9
1718
1920
21
24
1718
56
78
1011
1213
1415
272829
3031
6
910
1112
1314
1516
18
202122232425
2728
3031
7
10
12
1718
19
21
23
29
31
1
6
8
11
1314
17
19
2122
24
27
29
32
2
1618
19
19
21
241415
1617
1819
2021
2223
2425
1011
1314
15
17
19
21
23
25
27
2930
3132
10
1416 18
16
181920
2122
15
16
1920
2122
2324
2526
2728
2930
3132
2930
2526
2728
222310
1112
13
2930
31
2627
5
4
3
76
1011
1213
14
16
PT10
10PTPT10
PT10
1
1
57.3
9
140
50 140
20
58 50
140
35
8012
5.61
39.67
135
R=20 12550
112.72
15
140
250
83.451.3
140
140
136.3
20
80
20
140
80
140
20
5140
80
10
80
140
40140
20
80
80
80140
140
20
80
20
140
140
80
140
140
140
140
20
80
140
5
140
140
140
140
140
5
80
80
140
140
80
140
140
20
140
140
80 20
192.26
75.5
2
133.0665.16
121.
93
155.47
75.5
2
61.37 107.98
134.05
161
110
62.5127.41
140
140
140
140
140
140
140
160
125
140
42.96
87.0
6
48.33
20
40
140
140
140
140
40
20
140
140
140
20
140
140140
140
80
140
140
20
40
140
40
140
140
130
80
2040
20
140
115
20
140
20
R=20
50
50
140.04
139.92
139.92 R=25
139.
3415
50
42.5
37.5
32.5
20
70
70
25
25
25
2525
11
1510
25
255
20
25
25
25
140
160
25
25
25
2550
29
111
2525
25
25
25
25
25
25
9
140
9
2525
817
2515
1025
22325
25421
25120
140
25
25
25
25
25
25
25
25
25
25
25
140
14
78.6320
92.5 25
25
105.19140
25
25
140
25
25
2515
2525
25
25
25
25
25
25
25
25
25
25
25
25
25
25
25
25
45.0178.45
25
26
25
25
25
46
3933
26
25
25
25
25
2510
1525
25
25
25
25
25
1510
25
196
2512
13
25
25
93.47 55.2
7
132.15
66.3
2
140
50 50
25
25
25
25
25
25
1312
4025
37.5
187
140
25
25
25
140
140
25
25
7
97.67
50
50
R=20
100 25
65
135.32 160.5310
160 70
215.
26
84.0
7
29.1
1
20
49.1
249
.1320
130
2525
2525
139.99
90
100
140
75
130
115
140
125
150.
2
139.98
50.0
1
50
5551.2 200 20218.9810
92.1
4010
46.6
366
10
60R=20
50
50
30
60 79.6260 60 60 60 60
30
R=20 20
50
5050
104.55
5050
87
145
50
50
81.1
4
68.81
40
60 60 60 60 65 65 65 66.8
65
60
25
16026
801
75
130
140
801
401 PT 28
115
140
801
80113018
13
14
10
10
16 2319
15
13
9
19
18
11
15
21
22
2
1
3
15
22
F 9
16
21
20
20
23
12
16
R=24
115.08
125.
19
701007
026
33
33012
3
PB 1-13
028
MAR
YLAN
D P
KWY
012
VEGA VERDE ADDITION80 50 60
021
C MARYLAND TRACT NO 2 813 037 MARYLAND TRACT NO 1
PB 2-63 HUNTRIDGE SUBDIVISION TRACTS 1,2 & 3 AMD
PM 116-24
MAR
YLAN
D PK
WY
29
WARDIEADD
033
006
02733
RESUB WARDIE ADDITION021
1
PM67-25
PM 67-25
ADDLADDSPB 1-2
19
VAC 778:625154
PIONEER HEIGHTS
011
VAC 20010605:1270
VAC 20020509:1844
043
15
LADDS ADDITION2
R=20
65.0
1
172.
01
337.
16
055152.4 R=10
1
50
PM118-8
401
130.04
PB 1-13
29
SIXT
H ST31
32
3029 2
WARDIE ADD
14
12
SOUTHADD
140
50801
11
VAC 890721:526
034
008
E044
BONNEVILLE AVE
80
8132230
PT14
3231
1415
16
801 045
25
R=30
21
25
27
31
24
26
3029
289
87
654
32
123 24456
34
56
78
910
14
29
3132
30
2728
801296.16
409.
74
L=212.86
401
50
PIONEERHEIGHTS
046
VAC 20010605:1270
VAC 625154
VAC 20020509:1844
140
301.03
12
34
56
7
34
89
1011
2928
2726
2524
2223
2120
1
25
17
34
56
7
98
1011
1615
1413
12
29 350
140801
140 75
801
150
100
1
100
139.99140
801
50
140
PM 122-17
130
57.0
2
140
139.95
034002
005
001
004
003
012
014023
024021
028013
024
005
009
012
013
022
009
038
0070.4
0050.8
0140.16
0130.41
0120.24
0110.16
0101.83
0090.16
0170.98
0080.48
0050.32
0080.37
0060.24
0050.24
0010.32
0021.97
0020.38
068
217
218
225
239
031
033
037
038
064
041
043
042
044
009
015
014
013
012
011010109
116
111112
074075
076
077
078
105
104
103
102
101
010
011
015
010
008
006
012013
002
051
061003
001
036
006
223
240
243
242
005
003
124043021
120098020 046044
002 045072 045 057 027 028018222
046019 055 026056001 029003221 020
054
089
025 030004057021053220 024
005058 001052
219 023004
032051 059022088015 090
006
060023014
087091 034024224 013
022092025012 049 086 021093
026 061011 007048027 020
035
0 62010 122028 019007045 119
036
048029018008227 009118044
094 017065 083228 016
049
053007 030 016095
082 015066054031 096
120
050
014067 081032 097080033
098
055
079034241 099
041069 100035 012
070039009
038071
037 072 056108
073 057107
001003
106
002 003 004001
007090
0600.7
0110.49
0630.35
036
021
012
NO
TES
This map is for assessment use only and does NOT represent a survey.
No liability is assumed for the accuracy of the data deliniated herein. Information on roads and other non-assessed parcels may be obtained from the Road Document Listing in the Assessor's Office.
This map is compiled from official records, including surveys and deeds, but only contains the information required for assessment. See the recorded documents for more detailed legal information.
MA
P LE
GE
ND
USE THIS SCALE(FEET) WHEN MAP REDUCED FROM 11X17 ORIGINAL
ASSESSOR'S PARCELS - CLARK COUNTY, NV.
Scale: 1" = 200' 1/8/2019
T20S R61E 34 S 2 SE 4 139-34-8
31
30
19
1
1314
121110987
6 5 4 3 2
3635343332
29 28 27 26
24
25
23222120
18 17 16 15
BO
OK
SEC
.
MA
P
2
3
4
5
6
7
8
1
2
3
4
51
8
7
5
6
4 8
203
PARCEL BOUNDARYSUB BOUNDARY
ROAD EASEMENTPM/LD BOUNDARY
HISTORIC LOT LINEMATCH / LEADER LINE
ROAD PARCEL NUMBERPARCEL NUMERACREAGE
PARCEL SUB/SEQ NUMBER
PLAT RECORDING NUMBERBLOCK NUMBERLOT NUMBERGOV. LOT NUMBER
10010011.00
202PB 24-45
55
GL5
HISTORIC SUB BOUNDARYHISTORIC PM/LD BOUNDARY
15
8 4
Rev:
TAX DIST
0 200 400 600 800100 SECTION LINE
CONDOMINIUM UNITAIR SPACE PCLRIGHT OF WAY PCLSUB-SURFACE PCL
139
161162
140138
163
124 123
177 178
125
176
Briana Johnson - Assessor
q
assessor PareCel maP

OFFERING MEMORANDUM: PRIME INVESTMENT OPPORTUNITY 14
las vegas overview
CHOOSE LAS VEGASWHY LAS VEGAS?
#1 Trade Show Destination
Trade Show News Network
Top State for Economic Growth Potential
Business Facilities (2018)
#1 State in the WestWith a probusiness environment, low cost of living and high quality of life, Nevada ranks as the top
state to do business in the western U.S.
Most Entrepreneur-Friendly StateAccording to a 2017 review by the nonpartisan
SBE Council, Nevada ranked number one as the most friendly state for entrepreneurs.
Reach 60 Million CustomersStrategically located within a one day drive of 10 major U.S. cities and Mexico. That is in reach of 60
million potential customers.
Most Secure Area in U.S.According to FEMA, southern Nevada is the least likely region in the United States to experience a
natural disaster.
147,238 Hotel Rooms in 2018
Las Vegas Convention and Visitors Authority
2nd Busiest Origination & Destination Airport in U.S.
McCarran Airport Annual Report (2017)
42,116,800 Million Visitors in 2018
Las Vegas Convention and Visitors Authority
Best Economic Health Ranking in the U.S.Forbes American Dream Index (2017)
Source: Las Vegas Global Economic Alliance

OFFERING MEMORANDUM: PRIME INVESTMENT OPPORTUNITY 15
las vegas overview (Con’t)
UNITED STATES
NEVADA
CLARK COUNTY, NV
2018 Total Population
330,088,668
2018 Total Population
3,025,735
2018 Total Population
2,209,677
2023 Total Population
343,954,683
2023 Total Population
3,273,446
2023 Total Population
2,410,174
2018 Median Age
38.3
2018 Median Age
37.5
2018 Median Age
36.8
2023 Median Age
39.0
2023 Median Age
37.7
2023 Median Age
36.9
Source: (STDB) Site To Do Business
POPULATION

OFFERING MEMORANDUM: PRIME INVESTMENT OPPORTUNITY 16
las vegas overview (Con’t)
2018 TOP EMPLOYERS
50,000+Employees
Hotel-Casino
11,600Employees
Hotel-Casino
27,000Employees
Hotel-Casino
2,700Employees
Hotel-Casino
1,514Financial Services
14,000Employees
Hotel-Casino
5,099Employees
Health Care
3,575Employees
Health Care
7,188Employees
Health Care
12,000Employees
Hotel-Casino
Source:Vegas Inc.

OFFERING MEMORANDUM: PRIME INVESTMENT OPPORTUNITY 17
las vegas overview (Con’t)
FUTURE SPORTS CAPITAL OF THE WORLDRaiders Stadium - $1.9 Billion 62-acres west of the Strip | Debut 2020
T-Mobile Arena - Home to the Vegas Golden Knights Highest grossing arena in the world | 20,000 Seating Capacity
Raiders Corporate Headquarters 320,000 SF Practice Facility | Debut Spring 2020
Las Vegas Ballpark - $150 Million 10,000 Seating Capacity | Debut April 2019
Vegas Golden Knights Practice Facility UFC Corporate Headquarters

OFFERING MEMORANDUM: PRIME INVESTMENT OPPORTUNITY 18
las vegas overview (Con’t)
McCarran International Airport • 2018 welcomed 49.7 Million passengers - Record High• 2nd busiest origination & destination (O&D) airport in the U.S. (more travelers begin or end their trips in
Las Vegas)• Ranked 8th busiest airport in North America in terms of passenger traffic - 2017• Ranked 26th busiest airport worldwide in terms of passenger traffic - 2017• Nominated the last seven (7) years in World Travel Awards
TRANSPORTATION & HIGHER EDUCATION
UNLV School of Medicine • Full-scale, four-year medical school offering an MD program in emergency medicine, family medicine
& pediatrics, surgery, and more. • Serves as the core infrastructure for the entire medical community• Project is estimated at over $230 Million (2022 Completion)• Project consists of two buildings over 230,000 square feet on 9.11 acres
www.unlv.edu/medicine
University of Nevada - Las Vegas (UNLV)• Enrollment of over 30,450 with over 200 programs• The William F. Harrah College of Hotel Administration consistently ranks among the top hospitality
programs in the country• William S. Boyd School of Law is ranked 59th of 194 accredited law schools in the U.S. & Boyd’s lawyering
process program is ranked 1st in the nation for legal writing programs• UNLV School of Dental Medicine’s DDS program is accredited by the Commission on Dental Accreditation
College of Southern Nevada (CSN) • Enrollment of approximately 33,900• 7th largest community college in the United States• Largest and most ethnically diverse college in Nevada• Continuously accredited by the Northwest Commission on Colleges and Universities since 1975

OFFERING MEMORANDUM: PRIME INVESTMENT OPPORTUNITY 19
nevada business advantages
LOW COST OF DOING BUSINESS:The combination of our zero inventory tax, a rich transportation infrastructure, and the geographic location of the state’s two largest urban centers are prime reasons that top brands like Amazon, Wal-Mart, Levi Strauss & Co., Barnes & Noble, Ur-ban Outfitters, and others choose Nevada to stage their warehousing and distribution strategies.
Collectively, the cities of Las Vegas, Reno, Sparks, Carson City and surrounding towns are less than one day’s drive over arterial interstate highways to near-ly 60 million consumers as well as to the major U.S. deep water seaports serving the Pacific Rim. Major Union Pacific and Southern Pacific rail connections in Las Vegas and Reno also, too, play an essential role in carrying the world’s freight from the Pacific Coast to America’s Heartland and beyond.
Nevada offers a very competitive cost of doing business and is attracting more and more compa-nies each day from higher-cost regions.
NEVADA HAS:• An abundance of economical commercial
real estate
• Competitive utility rates for commercial operations
• Low-cost startup, regulatory, licensing and annual fees
• Proximity to West Coast/California markets and businesses, reducing shipping and storage costs
• Excellent air cargo costs for shipping by air out of Nevada
• Nevada business incentives
1. Tax abatements for job creation, capital investment and intellectual property development
2. Workforce development training grants
3. Catalyst Fund to support new business or expansion in state
EXCELLENT TAX ADVANTAGES:
NO Personal Income Tax
NO Corporate Income Tax
NO Unitary Tax
NO Franchise Tax
NO Inventory Tax
NO Estate Tax
NO Inheritance Tax
NEVADA BUSINESS ADVANTAGES
Provided by:
www.diversifynevada.com

OFFERING MEMORANDUM: PRIME INVESTMENT OPPORTUNITY 20
nevada business advantages (Con't)
MORE ON LOW COSTS OF DISTRIBUTION TO WEST COAST MARKETS:The combination of our zero inventory tax, a rich trans-portation infrastructure, and the geographic location of the state’s urban centers are prime reasons that top brands like Amazon, Wal-Mart, Levi Strauss & Co., Barnes & Noble, Urban Outfitters, and others choose Nevada to stage their warehousing and distribution strategies.
Las Vegas is less than one day’s drive over arterial In-terstate highways to nearly 60 million consumers as well as to the major U.S. deep water seaports serving the Pacific Rim. Major Union Pacific and Southern Pacific rail connections in Las Vegas play an essential role in carrying the world’s freight from the Pacific Coast to America’s Heartland and beyond.
Globally, McCarran International Airport in Las Vegas has been a Top 20 airport for more than five years, an-nually serving more than 40 million and handling more than 189 million pounds of cargo. More important, the airport is served by nonstop flights to and from nearly all major metropolitan areas in the United States as well
as several important global centers in Europe, Asia and Latin America.
MORE ON NEVADA’S TAX ADVANTAGES:Nevada ranks a very favorable third in the Tax Founda-tion’s 2012 Business Tax Climate Index, an independent ranking of states in five areas of taxation: corporate taxes; individual income taxes, sales taxes, unemploy-ment insurance taxes, and taxes on property, including residential and commercial property.
The Tax Climate Index comparison to neighboring states is significant: California ranks 48th, Arizona 27th, Idaho 21st, Oregon 13th and Utah 10th.
In addition to the Tax Climate Index, Nevada ranks sec-ond in the nation for lowest state and local tax burden – an estimated 7.5% of income.
The state’s historically strong logistics and distribution business sector is as much a statement of tax policy – no Inventory Tax – as it is of the excellence of its air, rail and highway arterial infrastructure and proximity to major markets and ports.
Employment
1.48MJUL 2019
Spending
$5.44BMAY 2019
Provided by:
www.diversifynevada.com
NV State Population
3.03M2018

OFFERING MEMORANDUM: PRIME INVESTMENT OPPORTUNITY 21
las vegas new develoPments
$15.7 Billion in New Capital Investment is Driving Growth
1. Resorts World Las Vegas - $4.0 Billion 2. The Drew (Former Fontainebleau) - $3.1 Billion
• $4 billion Strip resort project with a heavy Asian theme began construction in 2017. • Resorts World, developed by the Genting Group, is being built at the former site of the Stardust and Echelon. • Genting, which bought the site from Boyd in 2013 for $350 million, will be using the partially constructed Echelon structures for this property. • With a projected opening set for 2020, the initial phase will have 3,100 rooms, a 100,000-square-foot casino, shops and restaurants spread across its 88-acre site.
• The Drew is comprised of three hotels inclusive of 24 restaurants and 95,000 square feet of gaming. • The $3 billion hotel will have ±3,800 rooms and 500,000 square feet of convention and meeting space. • This project is expected to create approximately 11,000 jobs in Nevada, comprised of 3,500 construction jobs and 7,000 permanent jobs. • Project to begin in 2020 with 2022 Q2 completion date.
1
3
2
4
5
68
910

OFFERING MEMORANDUM: PRIME INVESTMENT OPPORTUNITY 22
las vegas new develoPments (Con't)
5. Union Village - $1.2 Billion
4. Convention Center Expansion - $1.4 Billion
6. Switch - $1 Billion
• Union Village will be the first Integrated Health Village in the world, and is listed as the largest healthcare building project in the United States. • The $1.2 billion dollar, 155-acre planned development not only covers healthcare, but retail, entertainment, and senior living as well. • Approximately 355,000 square feet have been completed, totaling $300 million in work, with another 476,000 square feet to be under construction soon.
• Las Vegas Convention Center will be renovated and expanded into a $1.4 billion Las Vegas Global Business District. • Planned in four phases, new facilities will replace the 26-acre Riviera Hotel site, adding ±1.4 million square-feet of exhibit and meeting space. • Phase Two of the project is projected to be completed in 2020.• Expected to draw an additional 600,000 visitors a year, drive $2.1 billion in economic activity during construction and have an annual economic impact of $810 million when finished.
• Switch is a globally recognized leader in future-proof data center design, superscale cloud, unparalleled telecom gateways and energy sustainability. • Its Southern Nevada expansion includes a $1 billion data storage site on 200 acres near its two existing data storage facilities at South Jones Boulevard and the 215 Beltway. • Idea to link 50 million people within 14 milliseconds of data hosted at each of the company’s data hubs via a superloop of fiber optic cable connecting its Reno and Las Vegas supernaps sites, with a planned facilities in LA and SF.
3. Las Vegas Stadium - $1.9 Billion
• The Oakland Raiders will move to Las Vegas for the 2020 NFL season. • The groundbreaking ceremony took place in November 2017 for a new $1.9 billion stadium just west of the Strip. • The venue’s horse-shoe shape, designed by Manica Architecture, would accommodate 65,000 spectators, 8,000 cars, tailgating amenities and mixed-use commercial facilities. • The design shows a retractable natural turf field. • This venue would also allow Las Vegas to host the annual Super Bowl.

OFFERING MEMORANDUM: PRIME INVESTMENT OPPORTUNITY 23
las vegas new develoPments (Con't)
7. Project Neon - $1 Billion
9. Palms Renovation - $690 Million
8. Extreme Sports Park - $800 Million
10. Park MGM (Former Monte Carlo) - $650 Million
• Project Neon is the largest public works project in Nevada history. • $1 billion effort to redesign and widen Interstate 15 from the U.S. Highway 95 interchange to Sahara Avenue by July 2019. • Currently this road is the busiest stretch of highway in Nevada with 300,000 vehicles daily. Traffic through the corridor is expected to double by 2035.
• Station Casinos enhanced nearly every feature of the resort, completing $690 million in improvements. • Remodel included redesigned/renovated hotel rooms, 60 new hotel rooms, 29,000 square foot nightclub, new 73,000 square foot pool club, several celebrity chef restaurants, new spa, meeting/convention space, new covered parking spaces, refresh of the Pearl Theater, renovated casino floor, and a new front desk registration area to name a few. •Completed April 2019.
• Josh Kearney’s $800M extreme sports park called The Edge received county approval in 2017. • 130-acre at the SEC of Las Vegas Boulevard and Sunset Road, adjacent to Town Square Las Vegas, a 1.2M SF class A open air shopping, dining, office and entertainment center.• The Park is expected to have surfing/wake boarding/rock climbing/mountain biking/indoor skydiving/bungee jumping/zip lines and a 15-story, 640 room hotel with a casino, convention space, restaurants and two rooftop pools. • Project will take approximately 2.5 years to complete.
• A transformation occurring in Las Vegas is the conversion of the Monte Carlo into two hotels: a 2,700-room luxury resort Park MGM and a 292-room hotel NoMad Las Vegas. • This $650 million makeover was completed at the end of 2018. • The new resort will feature two hotels, redesigned rooms, an Italian market Eataly with cafes, walk-up counters and dine-in restaurants. • The properties will have amenities such as dining and casinos as well as a 5,300-seat theater at the Park MGM.

The information contained herein was obtained from sources believed reliable, however, Sun Commercial Real Estate, Inc. any of its agents or employees make no guaranty, warranty or representation as to the completeness and/or accuracy thereof, inclusive of any current and future projected returns. Anyone utilizing this analysis does so at their own risk and agrees to hold Sun Commercial Real Estate, Inc., its agents and employees harmless. The presentation of this property is subject to error, omissions change of price or conditions prior to sale, or withdrawal without notice.
6140 Brent Thurman Way, Suite 140, Las Vegas, Nevada 89148 • 702 | 968 | 7300 Ph • 702 | 968 | 7301 Fax • www.SunCommercialRE.com
Exclusively listed by: Cathy Jones, CPA, SIOR, CCIM
CEO702-968-7320
[email protected] Lic # B.0056010.CORP
Paul MiachikaExecutive Vice President
NV Lic # S.0184612
Michael HsuSenior Vice President
NV Lic # S.0182767