preventive infrastructure master plan
TRANSCRIPT

ASIAN DEVELOPMENT BANK
FINAL REPORT
TA 4605-COO: STRENGTHENING DISASTER MANAGEMENT AND MITIGATION
(COMPONENT 2: PREVENTIVE INFRASTRUCTURE MASTER PLAN)
March 2007
The MPC Group InternationalM I C R O F I N A N C E • P L A N N I N G • C O M M U N I T YThe MPC Group International
M I C R O F I N A N C E • P L A N N I N G • C O M M U N I T Y
In association with
VOLUME 1: MASTER PLAN


i
CURRENCY EQUIVALENTS (as of 23 March 2007)
Currency Unit – New Zealand Dollar (NZ$)
NZ$1.00 = US$0.71 US$1.00 = NZ$1.41
ABBREVIATIONS AADDT Average annual daily traffic AC Asphalt concrete ACC Aid Coordinating Committee ADB Asian Development Bank ADSL Asymmetric Digital Subscriber Line AMD Aid Management Division APS Aitutaki Power Supply AS/NZS Australian Standard/New Zealand Standard ATC Air Traffic Control AusAID Australian Agency for International Development AVG Average AWF Aitutaki Waste Facility BOD Biochemical oxygen demand CAANZ Civil Aviation Authority of New Zealand CAPEX Capital Expenditure CBDAMPIC Community Based Development of Adaptation Measures for Pacific Island Countries CEAL Cyclone Emergency Assistance Loan CI Cook Islands CIAA Cook Islands Airport Authority CIANGO Cook Islands Association of NGO’s CIGOV Cook Islands Government CIIC Cook Islands Investment Corporation CIMMRISP Cook Islands Ministry of Marine Resources Institutional Strengthening Project CIPA Cook Islands Port Authority CISD Cook Islands Statistics Office CITTC Cook Islands Trade Training Center CITV Cook Islands Television CLIMAP ADB Climate Change Adaptation Program for the Pacific COPED Concrete coastal protection device CROP Council of Regional Organizations CRRP Cyclone Recovery and Reconstruction Program CRP Climate Risk Profile DBST Double Bituminous Surface Treatment DME Distance Measuring Equipment DNHRD Department of National Human Resource Development DOH Department of Health DPA Development Partnership Agreement DRM Disaster Risk Management EC Evacuation Center EXCIL Express Cook Islands Line Agency Ltd EIA Environmental Impact Assessment EMC Emergency Management Center EMCI Emergency Management Cook Islands ENSO El Niño/Southern Oscillation FY Financial Year or Fiscal Year

ii EXECUTIVE SUMMARY
GCM Global Climate Model GDP Gross Domestic Product gensets Generator sets GHD GHD Consultants HRD Human Resource Development IA Island Administration IC Island Council ICAO International Civil Aviation Organization ICT Information, Communications and Technology IEE Initial Environmental Examination IGCI International Global Change Institute ILS Instrument Landing System IMP Infrastructure Master Plan IPCC Intergovernmental Panel on Climate Change JICA Japan International Cooperation Agency LBGES Labor-based Government Equipment Supported LPG Liquefied Petroleum Gas MC Micro Shelter MDG Millennium Development Goals MFEM Ministry of Finance & Economic Management MMR Ministry of Marine Resources MOH Ministry of Health MOT Ministry of Transport MOW Ministry of Works MSL Mean Sea Level NBC National Building Code NDB Non-directional Beacon NDMO National Disaster Management Office NDRMC National Disaster Risk Management Council NDRMP National Disaster Risk Management Plan NED National Energy Division NEDS National Economic Development Strategy NES National Environment Service NGO Non Government Organization NIWA National Institute for Water and Atmospheric Research NSDP National Sustainable Development Plan NWS National Waste Strategy NZ New Zealand NZAID New Zealand Agency for International Development O&M Operations & Maintenance OHRD Office of Human Resources Development OI Outer Islands OICDU Outer Islands Infrastructure Development Unit OIDP Outer Islands Development Program OMIA Office of the Minister of Island Administration OPEX Operating Expenditure OPM Office of the Prime Minister PAB Project Adaptation Brief PCC Project Coordinating Committee PD Police Department PDU Project Development Unit PERCA Public Expenditure Review Committee and Audit PFL Pacific Forum Line PICCAP Pacific Islands Climate Change Assistance Program

iii
PIU Project Implementation Unit PMG Pitt Media Group PPP Public-Private Partnership PPU Policy and Planning Unit PSC Public Service Commission REAP Rarotonga Environmental Awareness Program RIC Rarotonga Island Council ROW Right-of-way SBST Single Bituminous Surface Treatment SLIS Survey and Land Information Service SOE State Owned Enterprises SOPAC South Pacific Islands Applied Geoscience Commission SPC South Pacific Commission SPCZ South Pacific Convergence Zone SRES Special Report on Emissions Scenarios TA Technical Assistance TAU Te Aponga Uira TCI Telecom Cook Islands TEU Twenty foot equivalent unit TNZ Telecom New Zealand TOR Terms of Reference TVNZ Television New Zealand UNDP United Nations Development Program VASIS Visual Approach Slope Indicator System VOR Variable Omni-range WDC Waste Disposal Center WHO World Health Organization WMD Waste Management Division WWD Water Works Division RWF Rarotonga Waste Facility
WEIGHTS AND MEASURES g Gram g/c.d Gram per capita per day (waste generation) Ha Hectares kL Kiloliter Km Kilometre km2 square kilometres L Liters L/c.d Liters per capita per day (water use) Kbs Kilobytes per second kg/c.d Kilogram per capita per day (waste generation) M Meters m2 square meters m3 Cubic meters Mg Milligram mg/L Milligram per liter (concentration) m/s meters per second Mm Millimetres oC degrees centigrade
NOTES: (i) The fiscal year (FY) of the Government of the Cook Islands ends on 30 June. FY
before a calendar year denotes the year in which the fiscal year ends, e.g., FY2006/2007 ends on 30 June 2007.

iv EXECUTIVE SUMMARY
ABSTRACT Recent studies have shown that the Cook Islands’ social infrastructure has limited preparedness against weather-related vulnerability. The inherent geographical vulnerability of the country to climate change can be ameliorated by initiating integrated infrastructure and social development, including human resources development. Consequently, there is a need for ‘climate proofing’ the country, i.e. to enhance the country’s adaptive capacity and resilience to climate change, both by the construction, operation and maintenance of suitably planned resilient infrastructure and by the development of strengthened capacities for this purpose and for disaster management and mitigation. The TA established a Preventive Master Plan that sets out the path to long term preparedness of the islands to respond to disaster by minimizing the potential harmful effects of future emergencies, and to climate change. Master Plan preparation began with an initial on-site assessment of infrastructure throughout the islands and a review of on-going plans and projects. A long list of infrastructure development needs was identified, which included projects already conceived and either planned or under construction; projects that answer principal needs as identified by the Government and Island Administrations; replacement of critical infrastructure; and, future infrastructure that will be needed to address the requirements arising from economic growth and climate change impacts. The TA used a four-pronged approach to set priorities and conceptualize the master plan, based on a top-down assessment of infrastructure requirements, a bottom-up assessment by islanders, the provision of agreed minimum level of service in each sector, and consideration of means of climate proofing. These were reinforced by means of infrastructure condition surveys, socio-economic development and demand forecasting, development of a climate risk profile, and extensive consultations. A series of workshops and consultations were undertaken throughout the TA to provide stakeholders with a direct input into the Master Planning process. Following project identification, broad cost estimates were applied, covering both capital and ongoing operation and maintenance costs. A multi-criteria analysis was carried out to broadly identify priority projects. An interactive ranking method was then applied to rank projects through dialogue with key stakeholders. Profiles of each project were prepared. Institutional and organizational considerations, for the governance, legal provision and policy frameworks for the delivery of essential basic services were assessed and recommendations developed. In order to address constraints faced by the government, an institutional strengthening strategy was developed that addressed the progressive development of well resourced agencies and pools of technical skills, utilizing, where appropriate, external resources through outsourcing, and special resource allocation to key agencies. Legal and regulatory provisions for climate proofing were also addressed by a review of the building code and legislative provisions governing planning and siting of infrastructure.

v
CONTENTS
VOLUME 1: MASTER PLAN
EXECUTIVE SUMMARY 1
I. INTRODUCTION 1 A. Background to TA 1 B. Objectives of the Technical Assistance 1 C. Scope of the Technical Assistance 2
II. APPROACH 3 A. Initial Assessment 3 B. Overall Approach 3 C. Methodology 3
III. SUMMARY OF BUDGET EXPENDITURES 2005-2006 8
IV. INTERACTIVE RANKING METHOD 10
V. POLICY AND PLANNING REVIEW 12 A. National Sustainable Development Plan 12 B. Budget Policy Statement 2006-2007, March 2006 13 C. Outer Island Strategic Plans 14 D. Outer Islands Development Program 14
VI. CLIMATE CHANGE CONSIDERATIONS 14
VII. INSTITUTIONAL & ORGANIZATIONAL CONSIDERATIONS 16 A. Outline 16 B. Background 16 C. Institutional Strategy 17
VIII. MASTER PLAN PROJECTS 17 A. Master Plan Considerations 17 B. Project Identification and Priorities 18 C. Explanatory Notes 19 D. Sector Commentary 20 E. Island Commentary 22
IX. FUNDING REQUIREMENTS 22 A. Funding Agencies 22 B. Private Sector Funding 23
PART 1: MASTER PLAN 27
I. INTRODUCTION 27
II. APPROACH 27 A. Introduction 27 B. Sector Development Strategy Objectives 27 C. Project Identification Process 27 D. Project Prioritization Process 28 E. Population Projections 28

vi EXECUTIVE SUMMARY
III. AIR TRANSPORT SECTOR 30 A. Introduction 30 B. Sector Overview 30 C. Needs Assessment - Rarotonga International Airport 34 D. Needs Assessment - Domestic Airports 37 E. Sector Development Strategy 40 F. National Transport Policy Study 44 G. Air Transport Sector Performance Monitoring Plan 46 H. Recommendations for Institutional Arrangements 46
IV. MARINE TRANSPORT SECTOR 48 A. Introduction 48 B. Sector Overview 48 C. Needs Assessment 52 D. Sector Development Strategy 55 E. National Transport Policy Study 57 F. Marine Transport Sector Performance Monitoring Plan 61 G. Recommendations for Institutional Arrangements 61
V. ROAD SECTOR 62 A. Introduction 62 B. Sector Overview 62 C. Needs Assessment 64 D. Sector Development Strategy 66 E. Road Sector Performance Monitoring Plan 67 F. Recommendations for Institutional Arrangements 69
VI. WATER SUPPLY SECTOR 69 A. Sector Overview 69 B. Objectives 70 C. Existing Status 70 D. Planning Criteria 72 E. Needs Assessment 74 F. Sector Development Strategy 76 G. Water Supply Sector Performance Monitoring 81 H. Key Recommendations for Institutional Strengthening 81
VII. ENERGY SECTOR 82 A. Sector Overview 82 B. Objectives 83 C. Existing Status 83 D. Planning Criteria 84 E. Needs Assessment 85 F. Sector Development Strategy 86 G. Energy Sector Performance Monitoring 89 H. Key Recommendations for Institutional Strengthening 89
VIII. SANITATION SECTOR 92 A. Sector Overview 92 B. Objectives 93 C. Existing Status 93 D. Planning Criteria 94 E. Needs Assessment 96 F. Sector Development Strategy 99

vii
G. Sanitation Sector Performance Monitoring 104 H. Key Recommendations for Institutional Strengthening 104
IX. SOLID WASTE MANAGEMENT SECTOR 105 A. Sector Overview 105 B. Objectives 105 C. Existing Status 106 D. Planning Criteria 107 E. Needs Assessment 108 F. Sector Development Strategy 110 G. Solid Waste Management Sector Performance Monitoring 114 H. Key Recommendations for Institutional Strengthening 114
X. TELECOMMUNICATIONS 115 A. Sector Overview 115 B. Objectives 115 C. Existing Status 116 D. Planning Criteria 117 E. Needs Assessment 117 F. Sector Development Strategy 119 G. Telecommunications Sector Performance Monitoring 120 H. Key Recommendations for Institutional Strengthening 120
XI. MAINTENANCE FACILITIES 120 A. Introduction 120 B. Sector Overview 122 C. Needs Assessment 122 D. Institutional 123 E. Climate Change Adaptation 123 F. Sector Development Strategy 123 G. Monitoring 124
XII. EMERGENCY MANAGEMENT CENTERS 127 A. Introduction 127 B. Sector Overview 127 C. Needs Assessment 127 D. Climate Change Adaptation 130 E. Sector Development Strategy 130 F. Monitoring 131
XIII. INFRASTRUCTURE MASTER PLAN 133 A. Project Identification and Priorities 133 B. Explanatory Notes 133 C. Sector Commentary 138 D. Island Commentary 139
PART 2: INSTITUTIONAL ANALYSIS & PREVENTATIVE CAPACITY DEVELOPMENT 143
I. INTRODUCTION 143
II. SUMMARY OF BUDGET EXPENDITURES 2005-2006 143
III. CURRENT GOVERNMENT ORGANIZATIONAL STRUCTURE 145

viii EXECUTIVE SUMMARY
IV. CROSS-CUTTING ISSUES 147 A. A National Economic Development Strategy 147 B. Project Implementation 148 C. Management and Maintenance of Outer Islands Infrastructure 150 D. Private Sector Participation 151 E. Legislation and Regulations 153 F. Land 154 G. Municipal Services 155 H. Monitoring Water Resources 157 I. The Principle of User Pays or Cost Recovery 159
V. SECTOR ANALYSIS 160 A. Air Transport 160 B. Marine Transport 167 C. Road Transport 173 D. Energy 178 E. The Municipal Services 186 F. Telecommunications 202 G. Evacuation Centers 202
VI. SUMMARY AND CONCLUSIONS 204 A. Introduction 204 B. A National Economic Development Strategy (NEDS) 205 C. Project Implementation 205 D. Management and Maintenance of Outer Islands Infrastructure 206 E. Private Sector Participation 207 F. Legislation and Regulations 208 G. Land 208 H. Municipal Services 208 I. Air Transport Services 209 J. Marine Transport Services 209 K. Roads 210 L. Energy 210 M. Telecommunications and Media 211 N. Evacuation Centers 211
PART 3: CLIMATE CHANGE CONSIDERATIONS 215
I. SUMMARY 215
II. CLIMATE PROOFING PROJECTS UNDER THE INFRASTRUCTURE MASTER PLAN 216
III. INTRODUCTION 219 A. Situation 219 B. Hurricane Season 2005 219
IV. COOK ISLANDS VULNERABILITIES 221 A. Political 221 B. Socio - Economic 221 C. Population 221 D. Health 222 E. Environment 222

ix
V. CLIMATE RELATED DISASTERS AND EXTREME EVENTS – AN OVERVIEW 223
A. Cyclones Impacts 2005 224 B. High Sea Levels and Extreme Wave Heights 225 C. Rainfall 226 D. Droughts 227 E. Strong Winds 227 F. Extreme High Temperatures 228
VI. CLIMATE RELATED IMPACTS FROM EXTREME EVENTS 229 A. Possible Future Climate Scenarios 229 B. Impacts from Climate Change on Key Sectors 230
VII. GENERAL COUNTRY VULNERABILITY ANALYSIS 232 A. Risks from Climate Change Exacerbate Country Vulnerability 235 B. Climate Proofing Projects, Plans And Programs 235 C. Cost Benefit Analysis 235
VIII. EXAMPLES OF CLIMATE PROOFING 236 A. Example 1: Design of the Breakwater for the Western Basin, Avatiu Harbor, Rarotonga 236 B. Example 2 : Rainwater Harvesting 245
IX. CONSEQUENCES OF INACTION 251
X. BUILDING CODE AND REGULATIONS 256 A. Principal Climate Proofing Issues 256 B. The Existing Building Code and the Need for Revisions 257 C. Application and Enforcement of the Building Code 259 D. Regulations on Bulk and Location Issues 259 E. Recommendations 260
VOLUME 2: APPENDIXES
Appendix 1: Risk Assessment for All Projects
Appendix 2: Project Profile Narratives & Project Identification
Appendix 3: Tabular Summary of Project Cost Estimates by Sector
Appendix 4: Tabular Summary of Projects by Island
Appendix 5: Project Profiles
Appendix 6: Multicriteria Prioritization Process
Appendix 7: Test Results for Project Prioritization Tool
Appendix 8: Report on Consultations
Appendix 9: Cost Data
Appendix 10: Engineering Data
Appendix 11: Island Inventory
Appendix 12: References

x EXECUTIVE SUMMARY
Map: Cook Islands

EXECUTIVE SUMMARY 1
EXECUTIVE SUMMARY
I. INTRODUCTION
A. Background to TA
1. Between 4 February and 8 March 2005, the Cook Islands experienced five damaging cyclones within a period of five weeks, four of which were assigned a severity rating of Category 51 and caused damage to homes and essential public infrastructure. The Government and its agencies provided early warning information dissemination, evacuation and emergency relief to the affected population with the support of international and regional relief agencies. Following the cyclones, the Government assessed the physical damage but it lacked all of the necessary capacity and resources to finance the immediate recovery and reinstatement of basic services.
2. On 30 June 2005, the Asian Development Bank (ADB) approved a loan for the Cyclone Emergency Assistance (CEAL) Project for the sum of US$2.85 million, effective from 14 July 2005. The loan was to mitigate the social and economic impact of the cyclone damage by providing the necessary concessional resources to assist the Government implement a comprehensive recovery program. The total cost of the CEA Project is estimated at US$7.9 million.
3. The 2005 cyclones highlighted the need for a long-term national climate change adaptation strategy and an integrated infrastructure development plan which incorporates climate change adaptation concepts. The strategy and plan should include policies and priorities both to support economic and social development and protect the country’s basic infrastructure against weather-related impacts.
4. As with most Pacific island states, the Cook Islands’ social infrastructure is ill-prepared against weather-related vulnerability, as highlighted under the Climate Change Adaptation Project for the Pacific . The inherent geographical vulnerability of the country to climate change can be ameliorated by initiating integrated infrastructure and social development, including human resources development. Consequently, there is a need for ‘climate proofing’ the country, i.e. to enhance the country’s adaptive capacity and resilience to climate change, including the impacts of extreme events. Strengthening disaster management and mitigation capacity will help to ensure that future social and infrastructure programs will incorporate climate change adaptation and mitigation strategies.
B. Objectives of the Technical Assistance
5. The objective of the Technical Assistance (TA) was to assist the Government of the Cook Islands in the following:
• To strengthen disaster and recovery management, including damage assessment,
aid management and operational coordination; • To establish financial controls required to ensure good governance in the
management of the rapid disbursement of recovery funds; • To develop a far-reaching and a systematic approach to mitigating the country’s
vulnerability to adverse weather conditions;
1 Category 5 - Their wind speeds exceeded 200 kilometers per hour (kph) with cyclone Meena peaking at 280
kph; cyclone Nancy at 241kph; cyclone Olaf at 259 kph and cyclone Percy at 212 kph. Four of the 5 cyclones were given the maximum severity rating of category 5 (RRP:COO 39118 June 2005:1)

2 EXECUTIVE SUMMARY
• To establish institutions and environmentally sustainable infrastructure with capacity to impede the reoccurrence of a disaster with harmful effects on communities and key infrastructure.
6. The TA has developed, through a consultative process, robust disaster management operation and control mechanisms to support efficient and effective implementation of the Cyclone Emergency Assistance Program Loan as well as strengthen preparedness for future disasters; and a preventive Master Plan to develop long-term preparedness of the Cook Islands to respond to disasters by minimizing the potential harmful impacts of future emergencies.
C. Scope of the Technical Assistance
7. The TA was divided into two components:
1. Component 1
8. Immediate establishment of a rapid, effective and robust response capability through efficiently coordinated networks of skilled personnel to administer disaster mitigation operation.
2. Component 2
9. Preparation of a comprehensive and integrated environmentally sustainable preventive infrastructure Master Plan covering basic infrastructure including the transport, water, sanitation, power and telecommunications sectors; and recommendations for an effective governance and policy framework for the delivery and maintenance of infrastructure in these sectors.

EXECUTIVE SUMMARY 3
II. APPROACH
A. Initial Assessment
10. The project began with an initial assessment of infrastructure throughout the islands, and a review of on-going plans and projects. The initial review identified a long list of infrastructure development needs which may be summarized as follows:
• projects under construction which require further investment before they can be completed (e.g. completion of Tauhunu Harbor on Manihiki)
• projects with funding but requiring feasibility studies and detailed engineering design before implementation can proceed (e.g. Avarua-Pokoinu Road)
• a broad range of infrastructure needs identified by the CI government and Island Administrations which require further investigations and feasibility study before the project scope can be defined (e.g. projects listed in the Outer Islands strategic plans and business plans)
• replacement of existing infrastructure nearing the end of its design life (e.g. Rarotonga water ring mains and radio navigation aids at Rarotonga International Airport)
• infrastructure needs not yet identified to support economic development targets in the National Sustainable Development Plan (NSDP) (e.g. harbor development to support a goal of increasing marine sector product value by 20%)
• infrastructure needs not yet identified to preserve the environment and protect the islands against climate change impacts.
11. Given the limited CI government capital budget and donor funding, there was a need to closely identify the total infrastructure needs of the country in the foreseeable future (20 years), estimate their costs, and establish priorities.
B. Overall Approach
12. The TA used a four-pronged approach in the study as summarized in Figure 1 below encompassing:
• Top down assessment of requirements needed to support economic development of the entire country. The assessment sought to develop strategies and identify infrastructure projects which will support attainment of the Outcome Targets contained in the NSDP.
• Bottom up assessment of requirements already identified by the Island Administrations and proposed in their strategic plans.
• Provide a minimum level of service in the transport, water, sanitation, power and telecommunications sectors to every household in the country.
• Climate proofing: additional infrastructure development needed to preserve the environment and protect the islands from climate change impacts.
C. Methodology
13. The master planning process involved the following steps:
1. Review Existing Projects and Plans
14. This step was completed in the inception phase, and documented in the Inception Report.

4 EXECUTIVE SUMMARY
2. Create Infrastructure Inventory and Condition Database.
15. The team collected and reviewed all available design and field-measured data pertaining to infrastructure. This was augmented by the hands-on knowledge of our own local team members and discussions with national and local government officials. As a starting point, in each sector, they compiled a summary of the state of the infrastructure for each island detailing its condition, adequacy and the main issues relating to that sector. They also undertook a field assessment of the infrastructure on key islands to verify the reliability of the collected information.
16. The team worked closely with the parallel NZAID-funded GHD project (that started in early May 2006) which included an assessment of ports and harbors in the outer islands. The team also held discussions with the operators and maintenance technicians of key public and private infrastructure to assess practical issues and difficulties that they face. We considered this an important step as the islands are remote and often spare parts, and even advice to solve a problem, can take several weeks or sometimes months to reach where they are needed. The operators and local residents were also able to provide an insight into the needs of the Outer Islands. The information thus gained was used to identify capacity building needs in drawing up training programs, and was valuable in ensuring that processes recommended are simple and appropriate for local conditions.
17. As some of the current assets are nearing the end of their design life, in assessing the condition of the various plants and structures, the team estimated the timing for their eventual replacement. This in itself formed a significant investment over the study planning horizon.
3. Forecast Socio-economic Development and Infrastructure Demand
18. The adopted philosophy for this study was that infrastructure development should support and facilitate economic development, not vice versa. Existing visions and strategic plans were taken into consideration and augmented with assumed development strategies where necessary. Therefore as a first step, the team identified in broad terms the socio-
National Sustainable Development Plan
Infrastructure Master Plan
Outer Island Strategic Plans Minimum Level of ServiceStandards
Targets for infrastructureTargets for other sectors
TransportWater supply and sanitationPowerTelecommunicationsEmergency services
Top downassessment and planningof national requirements
Bottom upassessment and planning
of each island'srequirements
Infrastructure projects and otherneeds identified in the islandstrategic plans and businessplans
Needs and priorities forprotection against climate
change impacts
Needs and priorities to supporteconomic development
Figure 1: Overall Approach

EXECUTIVE SUMMARY 5
economic settings, and known or planned economic developments for each island. This was based on the current island strategic plans, the NSDP and discussions with the national and local governments. Where no plan existed or it was unclear or ambiguous, we assumed an economic development direction for planning purposes.
19. The assumed economic development scenarios became the basis for the planning of the infrastructure on each island. The team discussed the scenarios with the relevant stakeholder agencies, and where appropriate, the communities, in order to seek their concurrence prior to proceeding with appraising the infrastructure needs and priorities.
20. The above approach enabled the projection of populations and types of transport needs and impacts that would influence the infrastructure development. In particular, key activities such as tourism, aquaculture, fisheries and agriculture were identified as these affect the numbers and movements of populations on the islands as well as power and water needs which are often the constraint on development or expansion of industries.
21. Next, based on the economic development scenarios, population forecasts were prepared, which in turn became the basis for establishing the demands and planning parameters for utility services – water supply, sanitation, solid waste and energy supply and telecommunication infrastructure. These projections are contained in Part 1.
22. Demand projections for transport infrastructure will depend on the expected flow of goods and visitors to the islands. Therefore, based on the adopted economic development scenario for each island, estimated projections were prepared of the volumes of shipping and aircraft together with the types of vessels needed to meet forecast demands.
4. Define Minimum Levels of Service in Key Sectors
23. The Infrastructure Master Plan should provide every island with a minimum level of service in the water, sanitation, power, telecommunications and transport sectors. Minimum performance standards in each sector were addressed in the Inception Workshop with input from a wide range of public and private sector representatives from all sectors. The Inception Workshop results are summarized in Appendix 8 – Stakeholder Meeting Summaries. Performance standards for each sector are described in Part 1 – Master Plan. This equity principle is not specifically referred to in the NSDP but it is inferred in the many goals and targets described in the document.
24. These minimum standards were used as a checklist in evaluating the numerous projects being proposed for the outer islands. They assisted in identifying gaps in the provision of infrastructure and assisted in setting priorities to ensure that no island or settlement is ‘left behind’.
25. The requirement to provide every Cook Islander with a minimum level of service involves a substantial cost and depending on how the equity principle is applied, will affect the prioritization process. It also will require commitments on the part of the Government and Island Administrations to provide a minimum annual level of expenditure on operations and maintenance.
5. Consultations with stakeholders
26. A series of workshops and consultations were undertaken throughout the TA to provide stakeholders with a direct input into the master planning process. Participating stakeholders and details of relevant meetings and workshops are outlined and collated in Appendix 8.
6. Develop updated Climate Risk Profile for Cook Islands
27. An updated Climate Risk Profile was prepared by IGCI and is contained in Part 3.

6 EXECUTIVE SUMMARY
7. Review Building Legislation and Recommend Changes
28. The National Building Code for the Cook Islands was last updated in September 1990. The performance requirements and deemed-to-satisfy provisions are based on or refer directly to NZ and Australian standards for design, construction and materials. A review was made of NZ and Australian standards to identify all updates and determine which may require a specific revision of the Cook Islands National Building Code. In addition, Australia has prepared specific provisions for strengthening structures to withstand cyclones. These were reviewed along with other key legislation governing buildings and recommendations were made on changes needed in the National Building Code. These are also contained in Part 3.
8. Project identification
29. As discussed above, infrastructure requirements were identified and the scope of projects developed using four methods:
• a top down approach taking account of national social economic development plans and targets as laid out in the NSDP
• a bottom up approach to address the infrastructure requirements identified in the island administrations’ strategic and current business plans
• a requirement to provide a minimum level of infrastructure for each sector on each island
• infrastructure requirements identified in response to the Climate Risk Profile to be prepared by the TA.
30. The project identification process was based on data and projections developed from the following sources:
• inventory and condition of infrastructure on all islands developed in Step (ii) above; • assessment of infrastructure requirements identified within the work done by GHD
Consultants; • forecasts of population, economic activities and income levels developed in Step (iii)
above which will be transformed into quantitative levels of demand in each sector on each island;
• existing studies and long-term plans prepared by various sector agencies such as the Ministry of Works (MOW), Cook Islands Airport Authority (CIAA), Cook Islands Ports Authority (CIPA), CI Telecom and Te Aponga Uira (TAU), (Rarotonga Electricity company).
31. Most projects identified in the various documents reviewed were intended for implementation in the short or medium term (0-5 or 5-10 years). As mentioned earlier, the Master Plan designed by the team has a longer time horizon of 20 years. In certain sectors this required agreement on a national strategy for infrastructure development because of the high costs involved.
32. The Climate Risk Profile (CRP) has two significant implications for infrastructure development in the Cook Islands. First, it revealed that the design standard and condition of much of the existing infrastructure was inadequate to withstand the more frequent, more extreme weather events forecast in the future. Therefore one aspect of project identification was refurbishment or replacement of existing infrastructure to meet future climate conditions.
33. Second, the CRP revealed the need for new infrastructure to protect the islands against climate change impacts, as opposed to supporting economic development. Construction of foreshore protection of strategic assets, such as the airport, is an example.
34. The project identification process is outlined in Figure 2.

EXECUTIVE SUMMARY 7
9. Cost estimates
35. The TA estimated construction costs for all identified projects. However, these are broad order-of-magnitude costs only, based on recent project experience, unless specific cost estimates are available from feasibility studies or engineering designs. Costs are expressed in 2006 prices. The costings used are all contained in Appendix 9 and can be used as a basis for detailed costing during feasibility and design.
36. Annual operating and maintenance (O&M) costs were estimated in a similar fashion to provide an indication of the annual recurrent expenditure required for the project. The implementation of expensive infrastructure capital works, without Government committing to annual budgeted maintenance costs is a serious and on-going issue in all Pacific Island states.
10. Project Prioritization
37. A multi-criteria analysis was carried out for projects in each sector. It was not possible to carry out an economic analysis of the identified projects. This can only be done during the feasibility study stage of project implementation.
38. Projects already programd for implementation under the Outer Islands Development Program were placed at the top of the priorities list. We do not expect to adjust programs which are under way. However, projects which are in the pipeline but not yet committed were subject to analysis and prioritization the same as other newly identified projects.
39. Elements of the multi-criteria evaluation tool are illustrated in Error! Reference source not found. below. More details of the project prioritization process are outlined in Appendix 6.
Minimum levels of serviceMinimum levels of service
NSDP targets NSDP targets
Consultations with stakeholders Consultations with stakeholders
Climate change adaptation and environmental needsClimate change adaptation and environmental needs
Project identification and feasibility studiesProject identification and feasibility studies
Infrastructure Infrastructure Projects Projects
Project IdentificationProject Identification
Outer Island Strategic PlansOuter Island Strategic Plans
CIGOV and private sector strategic plansCIGOV and private sector strategic plans
Site visits to Outer IslandsSite visits to Outer Islands
120 projects, studies 120 projects, studies and programs and programs = = 86 projects86 projects
Figure 2: Project Identification

8 EXECUTIVE SUMMARY
Figure 3: Multi-criteria Evaluation Tool
Engineering and environmental requirementsEngineering and environmental requirements
Multi Multi - -criteria evaluation toolcriteria evaluation tool
Expected funding levelsExpected funding levels
Project Project Priorities Priorities
CIGOV and donor programsCIGOV and donor programs
• • NSDP goalsNSDP goals
• • Economic and financial criteriaEconomic and financial criteria
• • Environmental and climate change adaptationEnvironmental and climate change adaptation
• • Meet basic needs of the communityMeet basic needs of the community 44 projects for 44 projects for short term short term 11--5 years 5 years
11. Develop Schedule of Investment Requirements
40. The team utilized the ranking tool and consultations to develop an indicative investment program based on the priorities and construction costs established in the previous steps beginning in FY 2007-2008. A more detailed fully ranked action plan of planned and new projects was also developed based on a 5 year rolling master plan time frame. This was based on an annual budget of about $10 million per year over the 5 year period. These comprise an indicative annual CI government Capital budget of $5 million, committed NZAID budget (over 5 years) of $20 million, and other potential bilateral and multilateral funding.
41. It is expected that each year, a review of the 5 year rolling Master Plan will occur. New projects would be identified and added to the list which would then be subject to additional review and ranking. This would include a re-application of the interactive ranking tool by the stakeholder focal group. It is essential that this annual review occurs as events such as natural disasters, revised policies and economic conditions alter needs and priorities.
III. SUMMARY OF BUDGET EXPENDITURES 2005-2006
42. Government recurrent and development expenditures extracted from the 2005-2006 Appropriation Amendment are summarized in the following tables. Table 1 shows the government’s and island administrations’ total recurrent gross expenditure of NZ$53.2million and capital expenditure of NZ$5.3 million. The capital expenditure budget is supplemented by further foreign funding of NZ$14.1 million = NZ$19.4 million.

EXECUTIVE SUMMARY 9
Table 1: Budget Estimates for 2005 - 2006
Gross Expenditure
Trading Revenue
Net Appropriation
Gross Expenditure
Trading Revenue
Net Appropriation
Ministries & Ministerial Support 42,958,894 1,892,200 41,066,694 43,775,918 1,901,100 41,874,818
Outer Islands 9,420,399 2,308,194 7,112,205 9,420,399 2,308,194 7,112,205
Total Recurrent Expenditure 52,379,293 4,200,394 48,178,899 53,196,317 4,209,294 48,987,023
Capital Expenditure 2,706,640 2,706,640 2,894,640 2,894,640
Capital Contingency for Outer Islands 2,400,000 2,400,000
Total Capital Expenditure 2,706,640 - 2,706,640 5,294,640 - 5,294,640
Foreign Funding 14,142,000 14,142,000 14,142,000 14,142,000
Total Development Expenditure 16,848,640 - 16,848,640 19,436,640 - 19,436,640
Total Expenditure 69,227,933 4,200,394 65,027,539 72,632,957 4,209,294 68,423,663
Description
2004-2005 2005-2006 Estimates
Source: Cook Islands Appropriation Amendment 2005-2006
43. The breakdown of capital expenditure and foreign funding by island is shown in Table 2. The exact amount spent in each island is not known because the capital contingency for outer islands in the capital expenditure column (NZ$2.4 million) and the usage of a major portion of foreign funding (NZ$11.682 million) have yet to be determined.
Table 2: Budget Estimate 2005 - 2006 by Island
Is la n d
R a ro to n g a
A itu ta k i
A t iu
M a n g a ia
M a u k e
M it ia ro
M a n ih ik i
R a k a h a n g a
P a lm e rs to n
P e n rh yn
P u k a p u k a
N a s s a u C a p ita l C o n tin g e n c y fo r o u te r is la n d s F o re ig n A id
T O T A L
C a p ita l E x p e n d itu re
2 ,8 9 4 ,6 4 0
T o ta l
3 ,5 9 4 ,6 4 0
A id F u n d in g
7 0 0 ,0 0 0
2 ,4 0 0 ,0 0 0
1 7 4 ,0 0 0
2 4 ,0 0 0
5 2 ,0 0 0
2 4 ,0 0 0
1 2 4 ,0 0 0
5 3 4 ,0 0 0
3 5 2 ,0 0 0
3 8 ,0 0 0
3 8 ,0 0 0
4 0 0 ,0 0 0
5 3 4 ,0 0 0
3 5 2 ,0 0 0
5 2 ,0 0 0
-
1 7 4 ,0 0 0
2 4 ,0 0 0
2 4 ,0 0 0
1 2 4 ,0 0 0
3 8 ,0 0 0
3 8 ,0 0 0
4 0 0 ,0 0 0
2 ,4 0 0 ,0 0 0
1 1 ,6 8 2 ,0 0 0
1 9 ,4 3 6 ,6 4 0 5 ,2 9 4 ,6 4 0 1 1 ,6 8 2 ,0 0 0
1 4 ,1 4 2 ,0 0 0
44. The breakdown of capital expenditure and foreign funding by sector is shown in Table 3 and again the breakdown of the capital contingency for the outer islands and the foreign funding have yet to be determined.
45. The amount spent on operations and maintenance of facilities and equipment is not known at present because a part is contained in Recurrent Expenditure, for example staff emoluments and spare parts, and the remainder is contained in Capital Expenditure in the form of repairs and rehabilitation works.

10 EXECUTIVE SUMMARY
Table 3: Budget Estimate 2005 - 2006 by Sector S ec to r
T ranspo rt- roads
T ranspo rt- a ir
T ranspo rt- po rts
W a te r
S an ita tion
S o lid W as te
E lec tric ity
T e lecom m un ica tions
H ea lth
E duca tion
E nvironm en t
O the r - B u ild ings O the r - E qu ipm ent/M ach ine ry O u te r Is lands
O the r
T O T AL
578 ,640
5 ,294 ,640 14 ,142 ,000 19 ,436 ,640
2 ,400 ,000 2 ,400 ,000
11 ,682 ,000 11 ,682 ,000
C ap ita l E xp en d itu re A id F u n d in g T o ta l
500 ,000 500 ,000
850 ,000 850 ,000
1 ,100 ,000 1 ,100 ,000
775 ,000 210 ,000 985 ,000
-
30 ,000 30 ,000
120 ,000 120 ,000
300 ,000 300 ,000
600 ,000 600 ,000
140 ,000 140 ,000
21 ,000
130 ,000 130 ,000
578 ,640
21 ,000
Source: Cook Islands Appropriations Amendment 2005-2006
IV. INTERACTIVE RANKING METHOD
46. The ranking of projects for implementation under the Project was carried out with the aid of a prioritization tool. Generally, such rankings are agreed through dialogue and discussed within a national working group comprising senior government representatives and Cabinet members to reflect “technical” needs” (as identified at the line agency level) and policies of government. However, given the large number of projects, and at the request of MFEM a prioritization tool was developed under this TA to assist with the process of ranking projects for implementation over the short to medium term.
47. The tool is based on a multi-objective criteria evaluation process with the aim of enabling quick prioritization of projects in the “absence” of a detailed national economic policy being in place. It is noted that the tool is not a substitute for objective assessment and it is not a project feasibility evaluation mechanism. It is assumed that projects that have been identified and submitted to MFEM for implementation have already been scrutinized at the line ministry level and their feasibility has been, or will be, determined before the final decision for execution. Seven criteria have been adopted to assist with the evaluation of projects. These are:
Type of Criterion (quantity)
Assessment in terms of contribution to
Economic (2) national economic growth Social (2) social harmony Environmental (1) protecting or improving the environment Private sector (1) private sector development General (1) meeting the National Sustainable Development
Plan (NSDP)
48. While developing this tool, the following underlying aspects were taken into consideration in an attempt to maximize understanding and ease of use for those who will be using this system to assess projects.

EXECUTIVE SUMMARY 11
• Has to be easy to use – has to have a balance between complexity / detail and simplicity • Be suitable for all sectors – the evaluation must incorporate cross-sectoral issues and/or
criteria • Be able to be adjusted to reflect national priorities (such government policy) and
extraordinary events (such as national disasters) 49. Project assessment was carried out by a focal group which was a representative cross-section of the government and civil society so as to incorporate a range of perspectives and interests with regards to infrastructure in the outer islands. It is suggested that in the future, the focal group comprise high level persons that are able to make decisions for the sector that they represent. Civil society and the private sector must be incorporated to ensure a balance in the group.
50. In cases where the priority of Government changes according to national policies, there is the ability to adjust weighting factors accordingly. Should Government wish to focus on social or economic factors, the policy factor within these criterion can be increased to show that it is of high priority. There is also a special adjustment factor that alters the ranking of projects due to unforeseen circumstances, for example natural and non-natural disasters.
51. As the tool is used through future iterations, there is a need for a ‘sanity check’ on the prioritization process to ensure that the tool is robust enough to withstand all conditions. There is also a need to qualify the results to ensure that the ranking of projects does, in actual fact, reflect the priorities of Government and the people of the Cook Islands according to national policies.
52. A full description of the multi criteria prioritization process appears in Appendix 6, with narratives for users on how to rate projects. An example of the scoring form is also given in this executive summary.
53. Once a project was identified, a project profile was created as this assisted the focal group with the assessment and evaluation of projects. A lot of thought was necessary in filling in these project profiles, as this will give all relevant information pertaining to each project. The rationale, objectives and features for a project are key information for assessment.
54. Project profiles are also given in Appendices 2 and 3.
55. Details of the tool are shown in Figure 4: Project Profile Tool.
Figure 4: Project Profile Tool
1. Will the project contribute towards meeting National Sustainable Development Plan goals?
• Goal 1 – equal opportunity for health and education towards establishing an inclusive and vibrant society
• Goal 2 – society built on law and order and good governance at all levels
• Goal 3 – innovative and well-managed private sector-led economy
• Goal 4 – sustainable use and management of natural resources and environment
• Goal 5 – strengthened and affordable basic infrastructure, transport and utilities to support national development
• Goal 6 – a safe, secure and resilient community
• Goal 7 – an effective foreign affairs policy that meets the future needs and aspirations of the Cook Islands people

12 EXECUTIVE SUMMARY
2. Will the project contribute to national economic development and growth?
• Low cost/direct beneficiaries
• Savings for users relative to the cost of the project investment
• Directly addresses performance constraints
3. Will the project contribute to national revenue?
• Boost to revenue relative to the cost of the investment in the project
• Share of operation and maintenance costs
4. Will the project lead to improved living standards?
• Contributes to meeting minimum level of service standards
• Leads to health improvements
• Provides social and cultural amenities
• Contributes to increasing national knowledge base
5. Will the project contribute to a better environment?
• Mitigates against or adapts to climate change
• Improves the physical environment
6. Will the project provide an enabling environment for private sector involvement?
• Contributes to developing the private sector
• Increases the skill level of the private sector
7. Will the project promote community support and involvement?
• Addresses concerns of traditional leaders
• Addresses concerns of civil society groups e.g. NGO’s & religious leaders
• Involves community contribution to equity
V. POLICY AND PLANNING REVIEW
56. The key documents reviewed in the course of this project are briefly outlined here.
A. National Sustainable Development Plan
57. In 2003 the CI government held a National Development Forum to develop a framework to guide national development into the future. Based on the country’s needs and priorities expressed in this Forum, government with the assistance of its development partners, has evolved a National Sustainable Development Plan (NSDP). The document has now been finalized and is was launched at a National Forum in January 2007 together with the Preventive Infrastructure Master Plan.
58. The primary objective of the NSDP is:
“To build a sustainable future that meets our economic and social needs in partnership with government, the private sector and local, regional and international
EXECUTIVE SUMMARY 13
stakeholders, without compromising prudent economic management, environmental integrity, social stability and the needs of future generations.”
59. The NSDP sets out nine sustainable development goals:
• Well-managed private sector-led economic development: macroeconomic management and private sector development.
• Well-educated, healthy and productive people: education, health, human resource development, youth, gender, social welfare and sports.
• Sustainable use and management of our natural resources and environment: marine, land, agriculture, environment, waste and water.
• Strengthened and affordable basic infrastructure, transport and utilities to support national economic development: information, communication and technology, energy, road, sea and air transport, airports and harbors.
• A society built on law and order and good governance at all levels of government, private sector and local communities: parliamentary and whole of government governance, outer island development, public finance governance, law and order.
• Strengthened national coordination and information system for development planning, monitoring and evaluation: information systems and statistics, institutional coordination.
• A society that treasures cultural heritage, values and identity while respecting cultural diversity: history, culture, language, heritage sites, traditional knowledge and practices.
• An effective foreign affairs policy that meets the needs and aspirations of the Cook Islands: international relations, aid effectiveness, Council of Regional Organizations (CROP) effectiveness.
• A safe, secure and resilient Cook Islands: all hazard risk management, immigration and border control, transnational security
60. For each goal the NSDP: (i) provides key baseline indicators, (ii) sets out a series of strategies and (iii) provides key outcome targets for 2006-2010.
61. The NSDP can be viewed as an ‘umbrella’ under which policy, planning, priority-setting and resource allocation should take place. The NSDP contains a specific goal, No. 4, for basic infrastructure development. In addition, attainment of several other goals will depend directly on the successful development of supporting infrastructure, especially: (No. 1) economic development, (No. 3) sustainable natural resources and environment and parts of (No. 9) a safe Cook Islands.
B. Budget Policy Statement 2006-2007, March 2006
62. The policy statement identifies six key areas on which the government will focus, in accordance with the National Sustainable Development Plan:
• Governance and Law & Order • Economic Development • Social Cohesion • Outer Islands Development • Infrastructure Development • Environmental Sustainability
63. The Infrastructure Master Plan (IMP) focuses on three of these priorities: outer islands development, infrastructure development and environmental sustainability, while taking account of the remaining three priorities as well.

14 EXECUTIVE SUMMARY
C. Outer Island Strategic Plans
64. As part of ADB TA 3795-COO Preparing the Outer Islands Development Program in 2003, socio-economic profiles and five-year strategic plans for 2000-2005 were prepared for each island (some were later revised to cover 2003-2008). The strategic plans, in addition to defining the island’s aspirations for future development, also identified a list of specific needs in various sectors, including specific infrastructure improvements. In subsequent years each island administration prepared an annual business plan as part of the budgetary process. The annual business plans contain a request for implementation of high-priority projects identified in the strategic plans as well as new projects.
65. The island profiles were summarized in the Inception Report together with a list of infrastructure projects contained in their 2003-2008 strategic plans and their FY2006-2007 business plans.
D. Outer Islands Development Program
66. The CI Government, the New Zealand Agency for International Development (NZAID) and the Australian Agency for International Development (AusAID) have established a program for the period 2005-2008 to develop infrastructure on the outer islands. This is described in the Development Partnership Agreement (DPA) signed between the three governments. The NZAID and AusAID funding is NZ$6 million spread over three years. In addition, the CI Government budget provides approximately NZ$2.5 million CAPEX (capital expenditure) funding for outer island infrastructure and equipment purchases. Taken together there is approximately NZ$4.1 million per year available for infrastructure development over the next three years.
67. The CI Government has encountered problems in implementing infrastructure development projects in the outer islands: construction works have been started but not completed and preparation of projects for implementation has lagged behind available funding. The Aid Management Division (AMD) of MFEM provides secretariat support to the Aid Coordinating Committee (ACC) and is responsible for program management of aid funds. MFEM has proposed that an Outer Islands Infrastructure Project Development Unit (PDU) be established within the AMD to prepare and implement projects under the DPA. This is discussed further under institutional arrangements.
VI. CLIMATE CHANGE CONSIDERATIONS
68. The world is warming. The effect of a warmer world on low lying island countries such as the Cook Islands can be significant. Climate change conditions are envisaged already as impacts from extreme events such as tropical cyclones, intense periods of rainfall or droughts and extremely high winds, or air temperatures that have been felt across the country over the past decade. The effect of these impacts across a widely scattered group like the Cook Islands means that normal conditions of climate which comprise a southern and northern group of islands affected by trade winds, medium probability of cyclone activity in the summer season, and generally moist conditions throughout, will change by exceeding the current “normal” extreme event occurrences. These maritime influenced conditions will contribute to an increased development of extreme events both during and outside current climate seasons, e.g., such as cyclone season, affecting already vulnerable areas and sections of society who reside on these islands.

EXECUTIVE SUMMARY 15
69. During El Niño events, the South Pacific Convergence Zone (SPCZ) drifts eastwards, warmer than normal ocean water temperatures fuel cyclonic activity further east than usual, thus affecting the northern group of islands as an area of formation, and the southern group of islands at higher risk than usual because of the shift eastwards of cyclone tracking. A climate change scenario points toward this effect as a more common feature around the Cook Islands with at least a 20% increase in cyclonic activity both within and outside of current cyclone seasons.
70. Climate scenarios based upon Global Circulation Models outline that in this region of the Pacific extreme events will increase along with significant impacts upon the people and their environment. The Intergovernmental Panel on Climate Change (IPCC) in its Fourth Assessment Report (2003) outlined that for Small Island States (SIS) in the Pacific region, the following scenarios could be identified with some confidence. The scenarios are:
• Rise in sea level. Sea level may rise 0.5meter (in a best-guess scenario) to 1meter
(in a worst case scenario) by 2100. • Increase in surface air temperature. Air temperature could increase 1.6º-3.4ºC by
2100 • Changes in rainfall. Rainfall could either rise or fall by about 20% from current rates
in 2100 leading to more intense floods or droughts. • Increased frequency of more El- Niño like conditions. The balance of evidence
indicates that El Niño conditions may occur more frequently, leading to higher rainfall in the central Pacific and northern Polynesia.
• Increased intensity of cyclones. Cyclones may become more intense in the future, with wind speeds increasing by as much as 20%; it is unknown whether cyclones will become more frequent.
71. Within the context of socioeconomic development, climate change thus has a profound impact upon current and future development initiatives. A wide range of scientific, technical, and research oriented initiatives have been undertaken over the past decade to try to better define what these effects could be and to quantify the cost of the impacts.
72. The Cook Islands is a vulnerable country already at risk from changes in social, political, economic, and environmental factors. Taking into account climate change exacerbates vulnerability under each of these risk areas.
73. Understanding how to manage climate change risk reduction is embedded into a process which follows a parallel then convergent pathway to the current project design and development processes. Each step in the climate risk reduction process delves into more site specific information and data requirements enabling the level of the climate risk to be assigned to a project to be identified, and in turn as project feasibility is examined, working closely with project engineers, and other experts, identifying least cost solutions to address the risks. Quantifying the cost of climate change risk is an end result of the process.
74. The Climate Risk Profile in Part 3 provides an initial snapshot of how the current climate may change and to what effect these changes may have on the Cook Islands. Economic development in the Cook Islands is at risk from both current climate conditions as well as changing climate conditions in the future. These risks can be highlighted specifically by identifying how project developments may be affected by current climate parameters, such as rainfall, temperature, high winds, cyclones, and sea-level rise, among others. In other words how sensitive are the possible projects to a range of climate parameters, and if possible changes do occur to those parameters, what will be the impact and flow-on effect to the project and the surrounding environment.
75. The profile scopes out the identified projects under the Infrastructure Master Plan framework for their climate sensitivity and recommends that those projects most at risk from the identified climate parameters will need to undergo a further assessment once more

16 EXECUTIVE SUMMARY
project information is developed. The required assessment, called a Project Adaptation Brief provides for a preliminary detailed assessment of the conditions that could affect the project into the future over and above current normal conditions.
76. Once undertaken and completed, the Brief results in a set of terms of references for a climate expert to undertake detailed feasibility as part of a project feasibility team on the specific project, with resultant options or solutions available for modifying the proposed project to ensure climate impacts are minimized, reduced, or addressed. The TOR and the individual selected to undertake this assessment are integral parts of the feasibility team and work closely with the key expertise available for the project design, e.g., engineers, financial managers, etc. This resultant work “climate proofs” the project to an acceptable level of risk and least cost design and implementation.
77. The climate proofed project thus paves the way for a least cost design and implementation procedure integrated or mainstreamed into existing planning, design and implementation processes that takes into account increased risk from climate change. The quantification of the difference between developing the project without taking into account climate change, and developing the project with climate change risk taken into account is called the “incremental cost”.
78. The consequences of inaction or not taking into account climate change risks in an already vulnerable situation escalates overall project O&M costs, including any rehabilitation costs which are likely to occur during the lifetime of the project. There is also an increased impact on potential benefits to the surrounding environment and people.
VII. INSTITUTIONAL & ORGANIZATIONAL CONSIDERATIONS
A. Outline
79. The objective of the TA’s institutional component was to assess the governance, effectiveness and policy frameworks for the delivery of essential basic services; to assess the management of infrastructure assets and the management and disbursement of disaster recovery funds and make recommendations for changes to improve effectiveness and efficiency.
80. The results of this component are contained in Part 2 – Institutional Assessment. The part of the report contains a review of all policy and planning; an evaluation of current institutions; a discussion of cross-sectoral, government-wide issues and potential solutions; and a detailed analysis for each sector. Existing policy, legislation and regulation have been assessed. Business plans and the responsibilities and performance of participating stakeholders have been reviewed. The analysis identifies institutional constraints, discusses alternative strategies for addressing these constraints and makes specific recommendations for improved sector efficiency and service delivery.
B. Background
81. Faced with a financial crisis that included difficulties meeting loan repayments and a Treasury struggling to make fortnightly salary payments, the Cook Islands Government undertook a wide ranging restructure and reform of agencies between 1996 and 1998. The number of government ministries and departments were drastically reduced through rationalization and consolidation.
82. Part of the restructure was the incorporation, as state owned enterprises (SOE) of the financially sustainable activities of the provision of electricity to Rarotonga and the operation of international airports and harbors for Rarotonga and Aitutaki. Te Aponga Uira was established as an SOE well before the reform took place and so was Airport Authority.

EXECUTIVE SUMMARY 17
Coupled with the restructure and downsizing of the public service was the significant decentralization of functions to Island Governments. Difficulties with capacity soon resulted in the recentralization of both education and health services except for Palmerston and Rakahanga Island which maintain full devolution for all Government Services.
C. Institutional Strategy
83. Part 2 outlines and analyses the institutional and governance constraints facing Government as it plans, implements and maintains infrastructure. It suggests strategies to address the constraints which are based on the following philosophy:
• Well resourced agencies responsible for the functions of policy and planning; implementation (engineering and construction), operations and maintenance; and monitoring and enforcement;
• The establishment of pools of technical skills in government or technical ministries with funds available to provide fly-in services to the OIs as needed;
• Outsourcing of design, construction, operations and maintenance of works to either government agencies or the private sector;
• Key agencies such as AMD and the Office of the Minister of Island Administration (OMIA) having the funds to outsource works to other government agencies or the private sector on a fee for service basis
84. During the course of the TA, the team met with many stakeholders throughout Government, the private sector, island communities and NGO’s. The logistics of these meetings are detailed in Appendix 8 – Consultations. Following the identification of key constraints to institutional efficiency and effectiveness, the team discussed options for change and improvement. The results of these discussions were presented and discussed during three workshops over the course of the TA. The findings and options were met with support, but also the realization that much has to be done to progress them in conjunction with the development of the physical infrastructure. The results of these discussions, and preliminary outlines of how they could be adopted are presented in Part 2
85. The strategic approach proposed is founded upon the following criteria:
• Develop and put in place an effective and realistic economic development strategy; • Develop sectoral policies that are instructed by and support the national economic
strategy; • Develop, maintain and enforce an effective system for monitoring and evaluating
performance; • Develop and implement a policy for outsourcing of services and create a stable enabling
environment for its achievement; • Pursue policies to build up private sector capacity so as to maximize private sector
involvement in the construction, operation and maintenance of infrastructure; • Government to invest in capacity building so as to achieve its medium and long term
targets;
VIII. MASTER PLAN PROJECTS
A. Master Plan Considerations
86. It is important to re-state the boundaries of the study and the eventual Master Plan as developed under this TA:

18 EXECUTIVE SUMMARY
Defined by ADB TOR • Coverage of strategic infrastructure sectors of Transport, Water, Sanitation and Solid
Waste, Energy, Telecommunications. • Focus on the Outer Islands. • Master Plan excludes Health, Education, Agriculture, Fisheries and other sectors.
Defined by CI Government
• Included Emergency Management Centers (EMCs) and Maintenance Facilities as essential infrastructure.
• CI Government funding limit for Master Plan sectors = $NZ 50 million in next 5 years. • Includes projects in donor pipelines e.g. NZAID-funded Outer Islands Development
Program (OIDP) and Cyclone Recovery and Reconstruction Program (CRRP), and People’s Republic of China’s (PCR) assistance.
• Excludes recurrent expenditures, periodic maintenance and equipment replacement. • Includes capital expenditures for improvements, major repairs and reconstruction.
Defined by Team
• Capital cost estimates are in NZ$, 2006 prices, and provide 15% contingency and 10% for engineering
• Master Plan excludes asset replacements funded from SOE commercial borrowing (e.g. CIAA navaids, TAU generators, all CI Telecom projects).
• Annual O&M costs in CI Government recurrent budget are included • Annual O&M costs in SOE budgets are excluded
B. Project Identification and Priorities
87. The Infrastructure Master Plan comprises the projects in 10 sectors. Project Profiles have been developed based on an assessment of short and long term needs in Rarotonga, Aitutaki and the remaining Outer Islands. Profiles for 111 projects have been compiled on a sector basis. They include 82 capital works projects and 5 studies for funding through the Government (either from the annual budgets, loans or grants from donor agencies). In addition, Profiles have been included for 20 energy projects to be funded from Te Aponga Uira’s (TAU) capital expenditure budget and for 4 projects to be funded from Telecom Cook Island’s (TCI) capital expenditure budgets.
88. The capital works projects have an estimated capital cost of $237 million. The CI government requested that priorities should be assigned to projects with a view to identifying high-priority projects which could be implemented in the next five years with a funding limit of approximately $50 million. Priorities were established in each sector based on:
• The multi-criteria evaluation tool described in Appendix 6. • Adjustments to recognize urgent technical needs as identified by Government and at
workshops. • Projects approved for construction or in donors’ pipelines were given highest priority.
89. The prioritization resulted in the identification of 44 projects with an estimated capital cost of $55 million. These include projects funded by NZAID’s Cyclone Recovery and Reconstruction Program and Outer Island Development Program and the inner ring road project assisted by PCR.
90. Capital and Operating and Maintenance (O&M) costs were estimated for all projects. Costs are expressed in NZ$, 2006 prices, and capital costs include 15% physical contingency and 10% for engineering. Projects and costs (tabulated by sector and by island) are shown in Table 4, Table 5 and Figure 5.

EXECUTIVE SUMMARY 19
C. Explanatory Notes
91. Sectors: The Master Plan does not cover all infrastructure in the Cook Islands. It covers the sectors named in the Terms of Reference (TOR) agreed between the ADB and CI government as those which require the greatest investment in infrastructure. These are Transport (air, marine and roads), Water Supply, Sanitation, Solid Waste Management, Energy and Telecommunications. The Master Plan excludes infrastructure for Health, Education, Agriculture, Fisheries, Marine Resources and other sectors. Government may wish to add supporting infrastructure for these sectors into the Master Plan at a later date.
92. Maintenance and Emergency Management Centers: Maintenance Facilities and Emergency Management Centers were added when it became evident that investment was required in these facilities in order to (1) support maintenance of the infrastructure in the Outer Islands and (2) achieve one of the key objectives of the Master Plan namely protection against climate change impacts. The Master Plan includes maintenance buildings and workshops in the Outer Islands and test laboratories essential for operation and maintenance of infrastructure. The Master Plan excludes offices for government agencies or state-owned enterprises.
93. Focus on the Outer Islands: The TOR directed that the Master Plan focus on the Outer Islands, and the emphasis in the short term is to repair cyclone damage and correct infrastructure deficiencies in the Outer Islands. The needs of Rarotonga and Aitutaki were also assessed in detail and tend to predominate in the longer term as described below.
94. Scope of Projects: The Master Plan includes major repairs, rehabilitation and reconstruction of infrastructure which has been damaged by cyclones, deteriorated from insufficient maintenance or simply reached the end of its design life. The Master Plan generally excludes periodic maintenance and replacement of plant and equipment, although new plant and equipment are included as part of many projects.
95. Climate Change Adaptation: The Master Plan has marked projects which are especially at risk from extreme weather events and identified the type of adaptation measures required. At-risk projects will require additional study (a Project Adaptation Brief) at the feasibility or detailed engineering design stage to determine the appropriate adaptation measures and associated costs. The capital costs shown for the Master Plan projects represent best international practice but, except for the 15% physical contingency, do not include the cost of climate change adaptation measures.
96. State Owned Enterprises: The Master Plan includes major investments in infrastructure operated by SOEs which will require CI Government funding assistance. This includes a covered Departures building at Rarotonga Airport and a second generator station for TAU. The Master Plan excludes replacement of assets which SOEs such as CIAA, CIPA and TAU will fund from reserves set aside for this purpose. Examples include the Instrument Landing System (ILS) and VOR/DME at the airport and new generators for TAU. 110. Telecommunications: was included in the Master Plan TOR and was reviewed with the other sectors. However, telecommunications are provided by Telecom CI (TCI), a private company, therefore investment and O&M costs are excluded from the Master Plan.
97. O&M Costs: The Master Plan estimates the additional O&M requirements and costs associated with each project which will need to be added to Government’s recurrent expenditure budget. However, the additional O&M costs of SOE infrastructure projects are not included – on the assumption that those costs will be incorporated into SOE operating plans. For example, the O&M cost of the Avatiu Harbor western basin development will be absorbed into CIPA’s budget. The exception is the Outer Island airports taken over by CIAA after improvement. They will require specific O&M budget support from the government.

20 EXECUTIVE SUMMARY
D. Sector Commentary
98. Marine Transport has the highest capital cost requirement. In the short term the major need is to reconstruct the Outer Island harbors damaged by cyclones. The construction costs are high but the facilities should operate for many decades. In the long term the high capital cost is for improvements to Avatiu Harbor and protection of Rarotonga’s north coast from the airport to Avarua which has been included in the Marine Transport Sector.
99. Roads have the second highest cost requirement because of the high cost of improving the inner ring road in Rarotonga and roads in Aitutaki and Outer Islands in the short term, and the cost of rehabilitating the main ring road in Rarotonga in the long term.
Table 4: Capital O & M Costs by Sector
Short Term 1-5 Years Total 20 Years
Sector No. of Projects
Capital Cost
$ million
% O&M Cost
$ million
Capital Cost
$ million
% O&M Cost
$ million
Air Transport 10 5.8 10.4% 0.23 31.0 13.1% 0.53 Marine Transport 15 12.3 22.3% 0.58 62.6 26.4% 0.73 Roads 7 8.8 16.0% 0.44 50.8 21.4% 0.78 Water Supply 18 9.4 17.0% 0.13 23.5 9.9% 1.07 Sanitation 9 4.8 8.7% 0.27 11.0 4.6% 0.59 Solid Waste Management 5 1.0 1.8% 0.08 2.9 1.2% 0.23 Energy 13 4.9 8.9% 0.18 44.8 18.9% 2.40 Maintenance Facilities 5 1.8 3.2% 0.59 1.8 0.7% 0.59 Evacuation Mgt Centers 4 6.5 11.7% 0.09 9.1 3.8% 0.34
Total 86 55.2 100.0% 2.58 237.5 100.0% 7.25

EXECUTIVE SUMMARY 21
Figure 5: Capital Costs by Sector
0.0
10.0
20.0
30.0
40.0
50.0
60.0
70.0
Mainten
ance
Facilit
ies
Solid W
aste
Manag
emen
t
Evacu
ation
Man
agem
ent C
entre
s
Sanita
tion
Wate
r Sup
ply
Air Tran
sport
Energy
Roads
Marine
Transp
ort
Cap
ital C
ost E
stim
ate
$ M
illio
nLong Term 5-20 YearsShort Term 1-5 Years
100. Energy project priorities include the rehabilitation of power systems in the Outer Islands in the short term. The high cost in the long term is created by the need to construct a second power generation plant in Rarotonga which will require government funding. Total Energy sector costs are much higher than shown if TAU’s capital improvement program is included but because it will be internally funded it is excluded from the Master Plan. It is emphasized however that TAU’s program addresses key priorities such as increasing the generation capacity on Rarotonga.
101. Air Transport priorities are to improve the Northern Group airports for Saab 340 service and provide a separate departures area in Rarotonga Airport. Longer term capital costs are to implement cyclone protective measures at Rarotonga and continue improvements to the Outer Island Airports.
102. Water Supply improvements are needed in all islands and are given a high priority. Capital costs of individual projects tend to be less than the civil works costs associated with harbor or airport improvements. Over the 20 year period O&M costs are proportionately higher.
103. Sanitation improvements are needed in all islands with highest priority given to treatment plants in Rarotonga. Overall capital costs are not as high as other sectors therefore it should be possible to achieve all targets for the Sanitation sector. The same principle applies to Solid Waste Management.
104. Provision of Emergency Management Centers in all islands is one of the highest priorities and has the fourth highest capital cost in the short term. Equally, Maintenance Facilities have to be provided in all Outer Islands in the short term to improve the Island Administrations’ capacity to maintain all other infrastructure.

22 EXECUTIVE SUMMARY
E. Island Commentary
105. The distribution of capital costs across the islands is shown in Table 5. In the short term about 60% of costs are for projects in the Outer Islands (excluding Aitutaki) with only 32% in Rarotonga and 8% in Aitutaki. This is to be expected given the Outer Islands’ needs in all sectors and the high capital costs of harbor and airport projects in current programs.
106. In the longer term, projects in Rarotonga represent 67% of total capital cost, Aitutaki 12% and the Outer Islands 21%. After priorities in the Outer Islands are satisfied in the next five years the focus must be redirected to addressing major investments required in nearly all sectors. Several projects such as coastal protection, road rehabilitation and harbor improvements involve high capital costs and will require staging over several years.
Table 5: Capital Costs by Island
Short Term 1-5 Years Total 20 Years
Island Capital Cost
$ million %
Capital Cost
$ million %
Rarotonga 17.8 32.21% 159.9 67.33% Aitutaki 4.6 8.24% 29.1 12.23% Atiu 1.9 3.38% 2.6 1.10% Mangaia 4.0 7.32% 9.4 3.97% Mauke 2.9 5.29% 3.7 1.55% Mitiaro 3.3 5.98% 4.1 1.71% Manihiki 3.5 6.41% 3.5 1.49% Nassau 0.3 0.60% 0.3 0.14% Penrhyn 1.7 3.08% 1.7 0.72% Pukapuka 3.3 5.89% 3.5 1.48% Rakahanga 0.1 0.14% 0.1 0.05% Outer Islands 2.8 5.11% 2.8 1.19% Southern Group Islands 0.8 1.49% 5.5 2.32% Northern Group Islands 8.2 14.86% 11.3 4.74%
Total 55.2 100.00% 237.5 100.00% Rarotonga 17.8 32.21% 159.9 67.33% Aitutaki 4.6 8.24% 29.1 12.23% Outer Islands 2.8 5.11% 2.8 1.19% Southern Group 12.9 23.45% 25.3 10.65% Northern Group 17.1 30.98% 20.5 8.61%
Outer Islands Subtotal 32.9 59.54% 48.6 20.45% Total 55.2 100.00% 237.5 100.00%
IX. FUNDING REQUIREMENTS
A. Funding Agencies
107. 121. The high-priority investment projects identified for implementation in the next five years have a total capital cost of $55.2 million. At present, the main funding sources are:
• NZAID Cyclone Reconstruction and Rehabilitation Programme (CRRP)

EXECUTIVE SUMMARY 23
• NZAID Outer Islands Development Programme (OIDP) • CIGOV capital expenditure (CAPEX) • Asian Development Bank • Government of China • Other bilateral funding (European Union etc.)
108. The status of funding as of November 2006 is summarized in Table 6. Of the $55.2 million required, funding for $20.9 million has been committed or is likely to be approved from NZAID and CIGOV sources, leaving a requirement for $34.3 million. These figures include CIGOV’s contribution to the Rarotonga Inner Ring Road Improvement Project but exclude China’s contribution which is not shown in Table 6.
109. It appears that most high priority projects in the air and marine sectors may be funded from NZAID sources, although this is not certain if project cost estimates increase during the detailed engineering design stage. CIGOV and interested donors therefore need to address the unfunded priorities particularly the Evacuation Management Centers, Water Supply and Energy projects in the Outer Islands and Sanitation improvements in Rarotonga.
110. The projects shown in Table 6 are in various stages of preparation. Refer to the individual project profiles in Appendix 5. Those already taken up are being prepared following the donors’ procedures and several projects are nearly ready for construction. The unfunded projects will require feasibility studies to define the scope of work and cost estimates and conduct the necessary studies of economic feasibility, environmental assessment, resettlement and other donor safeguards required by donors.
B. Private Sector Funding
111. The majority of the short-term projects will require funding from CIGOV with or without donor assistance. The private sector will be involved in the design and construction stages and possibly in operations and maintenance of completed facilities but most projects are not suitable for private sector funding.
112. The exceptional projects which, under the right concession arrangement with CIGOV, might provide a sufficient financial return on investment to attract private sector funding include:
• Rarotonga Airport Passenger Terminal Improvement, $3.5 million • Avatiu Harbour Western Basin Development Completion, $2.0 million • Rarotonga Solid Waste Management Projects, $1.0 million
113. The private sector has expressed interest in the airport and solid waste management projects. Feasibility studies for these projects should include an investigation of options for private sector involvement.

24 EXECUTIVE SUMMARY
Table 6: Summary of Funding Requirements in 1 – 5 years Project ID Project Name
Capital O&MAIR TRANSPORT SECTORATW06PYE Penrhyn Airport Improvement 0.8 0.1 OIDP proposedATW05MHX Manihiki Airport Improvement 0.8 0.1 OIDP proposedATW07PZK Pukapuka Airport Improvement 0.8 0.1 OIDP proposedATW08RAR Rarotonga Airport Passenger Terminal Improvement 3.5 NA
SUBTOTAL 5.8 0.2MARINE TRANSPORT SECTORMTW01AIU Atiu Harbour Repairs 0.2 0.1 CRRP construction 2007MTW05MHX Manihiki Harbours Reconstruction 2.4 0.1 OIDP proposedMTW06NAS Nassau Harbour Development 0.3 0.1 OIDP proposedMTW02MGS Mangaia Harbour Reconstruction 2.2 0.1 CRRP construction 2007MTW03MUK Mauke Harbour Reconstruction 1.8 0.1 CRRP construction 2007MTW04MOI Mitiaro Harbour Reconstruction 2.5 0.1 OIDP proposedMTW07PYE Penrhyn Harbour Rehabilitation 0.9 0.1MTW10RAR Avatiu Harbour Western Basin Development Completion 2.0 0.0
SUBTOTAL 12.3 0.6ROAD TRANSPORT SECTORRTW07RAR Inner Ring Road Improvement Nikao-Takuvaine 2.0 0.0 CIGOV contributionRTW01RAR Rarotonga Road Safety Program 0.9 0.1RTW06NAT Outer Islands Road Improvement Program 2.4 0.1RTW02RAR Rarotonga Trarffic Management Improvements 0.3 0.1RTW05AIT Aitutaki Road Improvements 3.3 0.2 CAPEX proposed
SUBTOTAL 8.8 0.4WATER SUPPLY SECTOR
Replacement of old sections of the distribution sub-main on Rarotonga 3.2 Pending 06/07 budget releaseWSW02RAR Installation of distribution system isolation valves on Rarotonga 0.2 0.0 Pending 06/07 budget releaseWSW19MUK Mauke water supply distribution system upgrade 1.1 0.0 Pending 06/07 budget releaseWSW17MGS Mangaia water supply distribution system upgrade 1.8 0.0 Pending 06/07 budget releaseWSW14NGI Northern islands community rainwater catchment & storage refurbishment 0.2 0.0WSW15NGI Supply and installation of household rainwater systems for northern islands 1.2 0.0WSW07AIT Aitutaki water supply headworks upgrade 0.4 0.0WSW18AIU Atiu water supply system upgrade 0.5 0.0WSW20MOI Mitiaro water supply system upgrade 0.8 0.0
SUBTOTAL 9.4 0.1SANITATION SECTORSNW01RAR Construction of Rarotonga village sewerage networks – Stage 1 4.5 0.2SNW03RAR Rehabilitation of Tereora/Tepuka neighborhood sewerage system 0.3 0.0
SUBTOTAL 4.8 0.3SOLID WASTE MANAGEMENT SECTORSWW01RAR Construction of Rarotonga solid waste transfer station 0.5 0.0SWW02RAR Rarotonga hazardous waste handling facilities upgrade 0.5 0.1
SUBTOTAL 1.0 0.1ENERGY SECTOR
Aitutaki eletricity generator replacement 0.9 Pending 06/07 budget releaseRakahanga stand-by generator repair 0.0 Pending 06/07 budget releaseRakahanga wind power generator erection 0.1 Pending 06/07 budget release
ENW09AIU Atiu electricity supply distribution system upgrade 1.2 0.2ENW02PYE Exchange of Penrhyn generators 0.0 NAENW03NAT Outer islands electrical wiring standardisation program 0.2 0.0ENW04PZK Pukapuka electricity supply upgrade 2.5 NA
SUBTOTAL 4.9 0.2MAINTENANCE FACILITIESMFW05NGI Construct Northern Group regional facility for repair of plant and machinery 0.2 0.1MFW03SGI Build new facilities and supply tools for Aitutaki, Atiu and Mauke 0.6 0.2MFW04NGI Build new facilities and supply tools Rakahanga, Palmerston and Nassau 0.5 0.2MFW01SGI Modify and refurbish facilities and supply tools on Mangaia, and Mitiaro 0.3 0.1MFW02NGI Modify and refurbish facilities on Penrhyn and Pukapuka 0.3 0.1
SUBTOTAL 1.8 0.6EVACUATION MANAGEMENT CENTRESEMW04NGI Construct and furnish new EMC on northern islands 6.1 0.1EMW03MHX Complete repair works on Manihiki facilities 0.4 0.0
SUBTOTAL 6.5 0.1TOTAL 55.2 2.6
SUMMARY OF FUNDING STATUS IN NOVEMBER 2006Included in NZAID Cyclone Rehabilitation and Reconstruction Programme 4.2 0.2Proposed for inclusion in NZAID Outer Islands Development Programme 7.5 0.5Approved for inclusion in CIGOV capital expenditure programme 9.3 0.1Proposed for inclusion in CIGOV capital expenditure programme 3.3 0.2Funding required over next 1-5 years 34.3 1.8
Funding Status from Aid Management Division
Cost Estimates (NZ$M)

PART 1: MASTER PLAN


27
PART 1: MASTER PLAN
I. INTRODUCTION
114. This Part of the report presents the results of the review, needs assessment and project identification and prioritization which were conducted for each of the 10 sectors included in the Infrastructure Master Plan.
115. The 10 sectors included those specified in the original Terms of Reference namely Air Transport, Marine Transport, Roads, Water Supply, Sanitation, Solid Waste Management, Energy and Telecommunications and two additions made in the course of the work: Maintenance Facilities and Evacuation Management Centers. It was evident that maintenance garages and workshops on the Outer Islands needed to be improved in order to provide essential operations and maintenance support for infrastructure projects after they were completed. Evacuation Management Centers are lacking in several Outer Islands or need of repair and these projects have been added to the Master Plan and given high priority.
11. The results of the work in each sector are presented in a consistent format:
• Introduction • Sector Overview – services, major infrastructure by island, level of service, existing
and forecasted demand • Needs Assessment – condition of existing infrastructure, current government and
donor programs • Climate Change Adaptation Measures – summary from Part 3 • Sector Development Strategy – sector objectives, project identification and priorities • Sector Policy and Feasibility Studies – recommendations for additional studies
needed to guide sector development • Sector Performance Monitoring Plan • Recommendations for Institutional Arrangements – summary from Part 4
12. The sector work is supported by detailed Project Profiles contained in Appendix 5, Stakeholder Meeting Summaries in Appendices 8 9 and 10.
II. APPROACH
A. Introduction
13. This section briefly outlines the approach used to identify and prioritize the projects in the Master Plan. The approach is explained more completely in Appendix 6. B. Sector Development Strategy Objectives
14. The Cook Islands (CI) Government has finalized the National Sustainable Development Plan, and is a signatory to the Regional Pacific Plan. These Plans, and other Cook Island policies, govern the overall approach of the project. C. Project Identification Process
15. With policies and existing action plans in mind, the team undertook extensive review of current infrastructure. Combined with climate change, population and economic projections, they developed a range of relevant, cost-effective engineering solutions. These

28
were presented and contrasted with needs and expectations identified during community and CI Government consultations. D. Project Prioritization Process
116. Projects in each sector have been grouped into short-term (1 to 5 years in the future), medium-term (the period 5 to 10 years ahead) and long-term (the period 10 to 20 years time). Within each time period the projects needed in the sector are listed but not prioritized as government programming would be carried out across all the sectors taking into account national policies and needs. Priority ranking of projects beyond the short term is not warranted given that priorities will change over time.
117. Projects were however ranked in drawing up the recommended master plan for implementation in the short-term (i.e. over the first five years into the future). The results are discussed and illustrated in Section XIII. The process was carried out by both the project team and a focal group drawn from a number of government departments and representatives of the private sector. The methodology for assessing and ranking projects together with the results of the ranking of the short to medium term projects is included in Appendices 5 and 6 – Project Profiles and Multi-Criteria Prioritization Process.
E. Population Projections
118. Demographic data, references and population forecasts for each island based on Cook Islands Statistics Office (CISO) records are included in Appendix 11. Although there is a slight increase in the national population over time, it is not necessarily due to increase in the resident population as visitor numbers are also included.
119. In fact, based on the CISO records, there has been a net decrease in the residential population on all of the islands in the past 10 years, most probably due to the emigration precipitated by the 1996 economic crisis. Long-term historical data suggests that populations on the islands have been fairly stable with little growth (with a slight decline on some islands) since the mid 1970’s. However, since 1996, the decline has been steady and informal data suggests that the trend is continuing. Notwithstanding, it is considered that with an economic policy in place in the near future, the residential population declines will level off and will rebound slightly. Therefore, the 2001 population levels are considered to be reasonable for master planning purposes. Consequently, it was assumed that the resident population on each island will revert to the 2001 levels and stay stable over the next 20 years. In the absence of detailed demographic analyses and an effective economic policy for each island, this is reasonable for broad-scale development strategy formulation.
120. By contrast, visitor numbers have been growing spectacularly since 1996. Growth since 1996 has been at an annual average rate of 49% a year. CISO collates information on the number of visitors on the islands on a quarterly basis. The data is available from 2000 to present. This information, when averaged for the year gives a reasonable estimate of the visitor population on the islands at any one time and so has been adopted as the basis for forecasting future visitor population numbers. During the period from 2000 to 2005 the annual growth rate has been gradually declining from 69% to 35%. It was assumed for master planning purposes that the trend will continue and will level off at 1% per annum by the year 2014. When projected over the planning period, the visitor population on the islands is predicted to increase from about 10,100 in 2006 to 16,500 in 2016 and 18,300 in 2026.
121. The overwhelming majority, about 87%, of the visitors to the Cook Islands are bound for Rarotonga, and of the rest, some 10% go to Aitutaki with the balance visiting the rest of the outer islands. For planning purpose the assumed visitor distribution was Rarotonga 87%, Aitutaki 10%, and Atiu, Mauke and Manihiki 1% each. The adopted overall population projections on each island to the year 2026 are summarized in Table 7.

29
Table 7: Population Projections Island 2006 2011 2016 2021 2026Rarotonga 18,250 22,250 23,820 24,690 25,380
Southern Group 5,010 5,560 5,760 5,880 5,980Aitutaki 2,760 3,220 3,400 3,500 3,580Mangaia 740 740 740 740 740Atiu 710 750 760 770 780Mauke 570 620 630 640 650Mitiaro 230 230 230 230 230ManuaeTakutea
Northern Group 1,930 1,970 2,000 2,010 2,020Palmerston 50 50 50 50 50Pukapuka 670 670 670 670 670Nassau 80 80 80 80 80Manihiki 600 640 670 680 690Rakahanga 160 160 160 160 160Penrhyn 360 360 360 360 360Suwarrow 10 10 10 10 10
Total Cook Islands 25,190 29,780 31,580 32,580 33,380 Source: Cook Islands Statistical Bulletin, September Quarter 2006

30
III. AIR TRANSPORT SECTOR
A. Introduction
122. Air transport plays a vital role in supporting the Cook Islands’ social and economic development, due to the overwhelming importance of tourism to the economy and the long distances which separate the islands. This chapter assesses the Cook Islands’ requirement for international and domestic air transport services and identifies the need for airport infrastructure improvements. In the immediate term, the focus is upon air transport improvements needed in the Outer Islands to support their economic development and social well-being, reduce isolation and arrest the de-population of the islands. Airport improvements in the Outer Islands are the subject of a detailed technical study by the government at present, and the assessment described in this chapter draws heavily on the work being done by the Ministry of Transport (MOT), Cook Islands Airports Authority (CIAA), Aid Management Division (AMD) and NZAID.
B. Sector Overview
1. Air Transport Services
123. International passenger and cargo services are provided principally by Air New Zealand which operates daily or twice-daily services to Auckland normally with the Airbus A320 (146 seats) , thrice-weekly services to Papeete and Los Angeles with the Boeing B767 (234 seats), and a once weekly service to Fiji. Pacific Blue has begun a twice-weekly service between Rarotonga and Auckland and onwards to Australia with a Boeing B737 (144-180 seats). Services to Auckland provide connections to Australia and all major points in the Asian-Pacific region and services to Los Angeles provide connections to all North American cities and to major European points. Air New Zealand is expected to provide the same or similar services in the foreseeable future. The B767 used on the Auckland-Rarotonga-Los Angeles service will be replaced by the Boeing B777 (315 seats) in early 2007. The inaugural flight of the Boeing 777 to Rarotonga took place on 22 December 2006.
124. Foreign air carriers have provided regular charter passenger services to Rarotonga in the past (e.g. Canada 3000, Air Nauru, Royal Tongan and Polynesian Airlines). At present there are only occasional specialty charter or general aviation flights but the prospect exists for resumption of weekly charter flights in the future. There are occasional charter flights from Tahiti to Aitutaki.
125. Air Rarotonga is the sole domestic air carrier flying scheduled services to the Outer Islands. It operates one Saab 340 (34 seats) and three Bandeirante (12 seats) aircrafts. The Saab 340 is used almost exclusively to serve the Aitutaki route. The Bandeirante operates on the remaining routes and supplements the Saab 340 on the Aitutaki route. The current frequency of scheduled services is shown in Table 8.
2. Airports
126. Rarotonga International Airport and Aitutaki Airport are operated by the CIAA. Rarotonga was completed in 1974 and has operated with its original facilities for the past 32 years, with the exception of incremental changes made in the passenger terminal building such as extension of the roof over the departures check-in area, and construction of hangars by the private sector. In 2005 the airport suffered minor damage from Cyclone Olaf at the runway 08 end: scouring of the runway threshold embankment and damage to the foundation of the Instrument Landing System (ILS) equipment building at the end of the drainage channel. The airport is generally adequate for the current aircraft, passenger and cargo traffic levels but important facilities and items of equipment such as the ILS, Variable

31
Omni-range (VOR) and airfield lighting are nearing the end of their design life and will need replacement in the next few years. The airport land use plan is shown in Figure 7.
127. Aitutaki Airport was upgraded in 2004 with the sealing of runway 14/32, installation of runway lighting, construction of a passenger terminal building and provision of fire fighting and rescue services etc. The airport is certified under Civil Aviation Rules Part 1392 for aircraft with 30 seats or more and the runway is sufficient for larger turbo-prop aircraft such as the ATR42 and Bombardier Q400. There has been the occasional ATR42 charter from Tahiti. The airport land use plan is shown in Figure 8.
128. The remaining airports in Atiu, Mangaia, Mauke and Mitiaro in the Southern Group and Manihiki, Penrhyn and Pukapuka in the Northern Group are basic airstrips consisting of a crushed coral runway, a small apron (sometimes concrete) and a very basic passenger shelter. There is no runway lighting and the only navaids are Non-Directional Beacons (NDBs) in Manihiki and Penrhyn. The airports are licensed to Island Councils or community groups and the Island Administrations have taken on the responsibility for keeping the runways in serviceable condition and providing fuel storage and refuelling services.
129. Air Rarotonga serves these outer island airports using the Bandeirantes with an occasional flight by the Saab 340 to Manihiki, Penrhyn and Atiu. Air Rarotonga is reluctant to provide further Saab 340 service because of unsatisfactory runway conditions and the difficulty in arranging fuel. None of the airports are certified in accordance with Civil Aviation Rules Part 139, which is required for scheduled Saab 340 services.
Table 8: Domestic Airports and Services Island Usable Runway
Length Air Rarotonga Service Frequency
Aitutaki 1800m sealed runway
5-6 flights per day
Mangaia 950m coral runway 2 flights per week Atiu 1200m coral runway 3 flights per week Mauke 1200m coral runway 2 flights per week Mitiaro 1200m coral runway 2 flights per week Palmerston No airport - Pukapuka 1200m coral runway 6-10 charters per year Nassau No airport - Manihiki 1200m coral runway 1 flight per week Rakahanga Airport destroyed - Penrhyn 1200m coral runway 1 flight per week Suwarrow No airport -
Source: CI MOT and Air Rarotonga
3. Air Traffic
a. International Air Traffic
130. The growth in traffic at Rarotonga International Airport between 2000 and 2005 is summarized in Table 9. The airport is handling approximately 8000 aircraft movements per year and origin-destination passengers (excluding transit passengers) are expected to exceed 300,000 in 2006. International and domestic passenger traffic has grown at 4.3% per annum during the period 2000-2005. Inbound and outbound cargo has increased at 3.8% and 2.4% per annum respectively.
2 Civil Aviation Rules, Part 139 Aerodromes – Certification, Civil Aviation Authority of New Zealand, July 2002

32
Table 9: Rarotonga International Airport Traffic Year 2000 2001 2002 2003 2004 2005 Aircraft Movements International Scheduled Domestic Scheduled Other Total
1147 4487
1227 3977
1180 4062
1409 4595
1488 4866
1751 5025 1200 7976
Origin-Destination Passengers International Domestic Total
163,430 64,101 227,581
167,580 67,272 234,852
166,083 70,332 252,381
177,548 74,833 252,758
189,397 81,361 270,758
202,014 78,725 280,739
Air Cargo Tons Inbound Air Cargo Tons Outbound
659 290
675 415
740 650
765 677
Source: CIAA
b. International Traffic Forecasts
131. The most recent traffic forecast for Rarotonga was made as part of the runway extension feasibility study3 completed in 2004. This study estimated low-medium-high growth rates of 4.0-5.5-7.3% p.a. in the short term up to 2007 moderating to 3.5-5.0-6.5% p.a. between 2008 and 2012 (total international and domestic passengers). The recent actual growth of 4.3% p.a. is between the low and median forecast and in line with Airports Council International (ACI) Asia/Pacific Region forecast of 4.2% p.a. for the region. With a growth rate of 4.5% p.a. total passenger traffic would increase to 375,000 in 2011 and 465,000 in 2016.
132. The feasibility study made air cargo forecasts under various scenarios for exports of pawpaw and fish which are very tentative. The important point is that the study concluded that cargo capacity provided by scheduled passenger services will be sufficient for both inbound and outbound cargo demand for the foreseeable future.
133. Growth in aircraft movements is normally lower than growth in passengers because air carriers switch to larger, more economical aircraft as Air New Zealand is expected to do with the B777.
c. Domestic Air Traffic
134. Services to the northern group are much less frequent than to the southern group, which is reflected in the lower passenger traffic. Trips per capita are shown in Table 10. Aitutaki is not a representative case because the majority of passengers are tourists visiting the island. The other southern group islands generate an average of between 8 and 9 annual trips per person based on the 2001 census. In sharp contrast, the northern group islands generate fewer than 2 annual trips per person, which indicates a substantial unsatisfied demand (although the air fares are higher to the northern group which will reduce traffic compared to the equivalent islands in the southern group).
3 Rarotonga Airport Runway Extension Feasibility, Executive Summary Report, Airport Planning (NZ) Ltd., March
2004

33
Table 10: Domestic Passenger Traffic and Projections
Source: CIAA, 2001 Census and Consultant’s estimate 135. The number of domestic flights and passengers between Rarotonga and the Outer Islands between 2000 and 2005 is shown in Figure 6. Inter-island activity is excluded. Aitutaki passenger traffic is not shown because the scale is much higher: passengers increased from 48,000 to 60,000 per year from 2000 to 2005
Figure 6: Domestic Air Traffic 2000 - 2004, Departing and Arriving Passengers
Air Rarotonga Domestic Flights
0
500
1000
1500
2000
2500
3000
3500
2000 2001 2002 2003 2004
Year
Dep
artin
g +
Arr
ivin
g Fl
ight
s
AitutakiAtiuMangaiaMaukeMitiaroManihikiPenrhynPukapuka
Air Rarotonga Domestic Passengers (Excl Aitutaki)
0
1000
2000
3000
4000
5000
6000
7000
2000 2001 2002 2003 2004 2005
Year
Dep
artin
g +
Arr
ivin
g Pa
ssen
gers
Atiu
Mangaia
Mauke
Mitiaro
Manihiki
Penrhyn
Pukapuka
Source: CIAA
d. Domestic Traffic Forecasts
136. Aitutaki:Passenger traffic (refer to Table 10) has grown by 25% over the past five years i.e. an average of 4.6% per year. Much of the traffic is composed of day trippers to the lagoon. Air Rarotonga has plans to acquire a second Saab 340 (and could acquire a larger aircraft such as the Bombardier Q400 in the future) therefore air service capacity is not expected to constrain traffic growth. How much additional growth can be accommodated by the island’s facilities is open to question. It is assumed that reasonable growth in day trip traffic can be accommodated by the tourist boat services. Overnight traffic depends on the quantity of tourism accommodation available. Assuming continued incremental growth in small hotels – but no major international-class hotel – then it is reasonable to expect recent
Island 2005 Arr + Dep
Passengers
2001 Population
Annual Trips Per Person
Annual Growth Rate
2000-2005
2010 Forecasted Arr + Dep
Passengers Aitutaki 60,042 1946 30.9 4.6% 75,000 Atiu 6421 744 8.6 3.1% 7500 Mangaia 5787 623 9.3 7.1% 9000 Mauke 3207 470 6.8 0% 4000 Mitiaro 1908 230 8.3 3.7% 2300 Manihiki est. 800 515 1.6 0% 5000 Penrhyn est. 440 357 1.2 0% 3500 Pukapuka est.100 664 0.2 0% 3000

34
growth to continue in the short term. Thus Aitutaki could expect 75,000 – 80,000 annual air passengers after five years.
137. Southern Group: Growth has varied by island, with Mangaia experiencing the highest growth, according to the data obtained by the Consultants. The overall trend in the Southern Group is for continued growth and the 2010 estimates are based on a combination of projecting existing growth rates forward and assuming that most islands will achieve a trip rate of 10 trips per person. The projections are shown in Table 10.
138. Northern Group: Traffic has been flat over the past five years, limited by the capacity provided by the Bandeirante service. The trips per person generated by the Northern Group islands are extremely low, reflecting a significant unsatisfied demand. The 2010 passenger estimates assume the airports are improved to enable the Saab 340 to provide much higher capacity, and the islands will begin to generate traffic with similar trip rates as the Southern Group islands.
139. Insufficient data is available to make forecasts of domestic air cargo.
C. Needs Assessment - Rarotonga International Airport
1. Land Use Plan
140. Auckland International Airport Limited prepared a land use plan4 for Rarotonga in 2001, see Figure 7. The land use plan identifies areas where facilities will be expanded or relocated in future. The principal facilities addressed in the land use plan were:
• Extension of the runway by 220m to the east • Construction of an additional taxiway • Extension of the apron to the east and west in front of the Air Rarotonga hangar • Provision of additional car parking • Reserved areas for expanding air cargo • Development of the passenger terminal in the same location
141. The land use plan does not provide an implementation schedule for developing or expanding facilities.
2. Runway Extension
142. Airbiz of New Zealand carried out a feasibility study5 of lengthening the runway to allow larger aircraft such as the B777 to land and take off fully loaded on non-stop flights between Rarotonga and Los Angeles. More than 200m additional length is required. Extension to the west over the reef was deemed to be impractical in terms of cost and exposure to the sea.
143. A 222m extension of the runway at the 26 end was examined in detail. It is physically feasible to construct the extension on the available land. However, the cost of construction is extremely high (about $14 million) and the extension will require the relocation of buildings and fuel storage tanks outside the airport in order for the runway to comply with the revised approach and take-off obstacle clearance surfaces. It would even affect the height of vessels in Avatiu Harbor. The benefit to be gained in terms of additional payload (passengers or cargo) is small compared to the total cost of the project and the study did not recommend construction of the runway extension.
4 Rarotonga International Airport Development, 10 Year Land Use Plan, Auckland International Airport Ltd., June 2001 5 Rarotonga Airport Runway Extension Feasibility, Executive Summary Report, Airport Planning (NZ) Ltd., March 2004

35
144. Air New Zealand has indicated that the runway extension does not affect its decisions on what aircraft type and sectors it will operate to Rarotonga. The small loss of payload is a minor consideration compared to the other commercial concerns and criteria. For these reasons, the runway extension is excluded from the infrastructure master plan.
3. Passenger Terminal Building
145. Several studies have been carried out on the passenger terminal including a proposal to construct an entirely new international public concourse, check-in and departures area. Costs in the order of $20 million are mentioned.
146. Passenger terminal requirements are determined by peak period traffic since it is the capacity of the aircraft being served which creates the requirement for processing facilities and terminal space. The low frequency of international flights makes it highly unlikely that the airport will be required to handle two or three times the present number peak period passengers. Some increase can be expected when B767 (234 seats) is replaced by the B777 (315 seats).
147. In the short term the CIAA faces an internationally mandated requirement to separate arriving and departing passengers. This will require construction of a departures building or covering the existing grassed area between emigration and the arrivals hall and providing access to the apron. Departing passengers will no longer be permitted to enter the arrivals hall.
148. Increased capacity in the baggage hall will be needed when the B777 begins service in April 2007. The CIAA has plans to enlarge the building install a larger carousel and make changes in the immigration and customs areas. This is viewed as high priority.
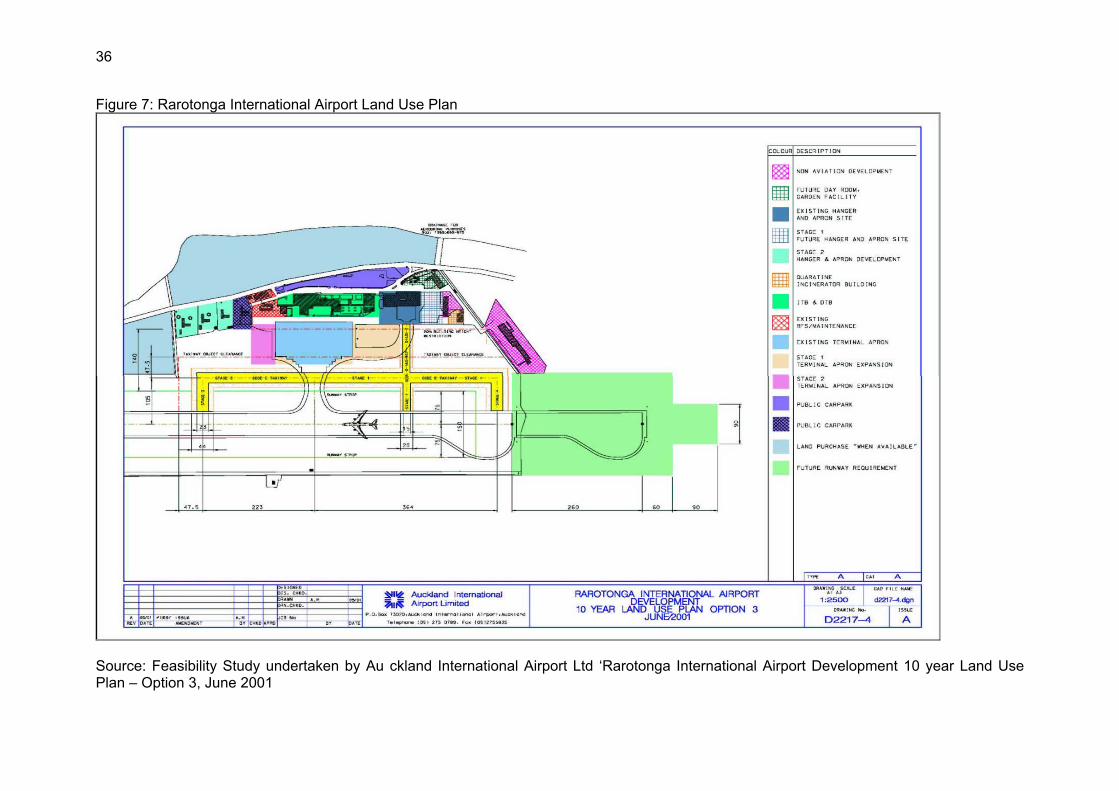
36
Figure 7: Rarotonga International Airport Land Use Plan
Source: Feasibility Study undertaken by Au ckland International Airport Ltd ‘Rarotonga International Airport Development 10 year Land Use Plan – Option 3, June 2001

37
4. Airside Facilities
149. After 32 years of operation many capital equipment items are nearing the end of their useful life and will need to be replaced in the near future. These include:
• Instrument landing system (ILS) $1.6 million (scheduled for 2009-2010) • Variable Omni-range (VOR) en-route navaid $1.2 million • Airfield lighting system including cables, transformers and controllers • Other visual aids such as Visual Approach Slope Indicator System (VASIS)
150. CIAA has set aside reserves for the ILS and VOR but further funding will be required for the airfield lighting and other equipment.
151. Presently Air Rarotonga parks its aircraft on the taxiway connecting its hangar and the apron. The need for more parking space will increase when Air Rarotonga acquires a second Saab 340, which can be provided by extending the apron as shown in the land use plan.
D. Needs Assessment - Domestic Airports
1. Air Rarotonga Service Plan for the Outer Islands
152. The minimum standards for Outer Island airports were identified in consultations with the Ministry of Transport, the Island Councils, Air Rarotonga management and participants at the Inception and Mid-Term Workshops. These are summarized as:
• Each airfield should have a runway length sufficient for regular domestic air services now and in future, namely 1300 m for the Bandeirante and 1500 - 1800 m for the Saab 340 (which will suffice for larger turboprop aircraft as well).
• Airports should be improved to comply with Civil Aviation Rules Part 139 to allow regular services by aircraft with 30+ seats such as the Saab 340, wherever possible. It is recognized this requirement is not be practical at all airports.
• Sufficient aviation fuel storage should be provided at all Northern Group airports to support regular air services and emergency flights.
• Airports should be operated and maintained to allow for uninterrupted, safe air services at all times.
• Air Outer Islands should receive regular air services, with frequencies and passenger and cargo capacity consistent with the demands generated by residents and tourists.
153. In the short term, airport requirements in the Outer Islands are determined by Air Rarotonga’s plans for developing its services. The carrier faces several operational and financial constraints imposed by the small island populations, low demand (except on Aitutaki), long distances to the Northern Group and the unreliability of fuel supplies, especially in the Northern Group. At present, Air Rarotonga operates scheduled services with the Saab 340 only to Aitutaki (with occasional flights to other islands in emergencies) which limits its utilization to about 1700 hours per year compared to an average of roughly 2400 hours reported by other operators. This has a major impact on aircraft operating costs.
154. The three Bandeirantes are used to serve the remaining Outer Islands and are only able to fly to the Northern Group airports with a reduced payload (eight or nine passengers) which makes these services uneconomical – even with the present high fares. The solution is to improve the outer island airports and provide sufficient fuel supplies to permit Saab 340 scheduled services. This will increase the Saab 340’s utilization and significantly increase the available passenger and air cargo capacity.

38
155. Air Rarotonga wishes to introduce scheduled Saab 340 services to Manihiki, Penrhyn and Atiu. This will require improving these airports sufficiently to be licensed under Civil Aviation Rules Part 139 which lays out requirements for airports with regular air services by aircraft with 30 seats or more. Mangaia is another possibility. For the time being, Mauke and Mitiaro will continue to be served by the Bandeirante or a successor small aircraft such as the Beech 1900.
156. Pukapuka is a special case. Air Rarotonga plans only to provide a charter service to the island. Given that Manihiki and Penrhyn are to be upgraded for Saab 340 service then it makes operational sense to improve Pukapuka to permit Saab 340 operations – on a less frequent basis which may not require meeting full Part 139 requirements.
2. CI Government and NZAID Outer Island Programs
157. In May 2006, Air Rarotonga, MOT, CIAA and the Office of the Minister of Island Administration (OMIA) carried out a joint investigation of the condition of the three northern airports, Pukapuka, Manihiki and Penrhyn, and prepared a civil engineering works program for upgrading6. It was proposed to implement the improvements by shipping construction plant and equipment from Rarotonga and using equipment operators recruited for the project and local labor under the supervision of a construction manager. The estimated cost of civil works excluding land acquisition, engineering design, construction management and mobilization of some heavy equipment is: Pukapuka $403,000; Manihiki $534,000; and Penrhyn $425,000 for a total of $1.363 million.
158. In support of this initiative NZAID has offered to include airport improvements in its Outer Islands Development Program (OIDP). With NZAID assistance, AMD retained GHD Consultants of New Zealand to (1) investigate the condition of all Outer Island airports excluding Aitutaki, (2) identify what improvements are required to operate the Saab 340 and Bandeirante aircraft as planned by Air Rarotonga and (3) prepare indicative cost estimates in advance of further detailed engineering survey and design stages. GHD visited the Southern Group airports in April 2006 and the Northern Group airports in August 2006. Reports have been submitted by GHD for the airports that formed part of the visit.
159. GHD recommends that a full land survey of the airports and their environs be undertaken immediately as a starting point for any detailed engineering design and cost estimation. The Cook Islands Government is in the process of procuring this land survey and is now calling for tenders. GHD also recommends that a land use plan be prepared for each airport to identify areas which should be reserved for further airport development.
160. The minimum scope of works identified by both the MOT-CIAA-OMIA and GHD investigations include: re-profiling and compacting the runway, grading the runway strip and end areas, improvements to airfield drainage, removal of obstacles to provide a category 3C runway (Saab 340), provision of runway markings and windsock.
3. Manihiki, Penrhyn, Pukapuka and Atiu Airports
161. Runway Dimensions and Surfacing: The Saab 340 requires 1500m runway length as a preferred minimum and 1300m absolute minimum. The equivalent Bandeirante requirements are 1300m and 1100m. Air Rarotonga’s aircraft can operate on crushed limestone pavements at several frequencies per week provided the surfaces are properly maintained. A sealed runway is preferred for daily frequencies or more, as at Aitutaki.
162. Part 139 Requirements: In addition to the runway length required by Air Rarotonga, certification to Part 139 requires the airports comply with MOT and International Civil Aviation Organization (ICAO) standards governing runway grading and marking, runway strip, visual aids, obstacle clearances, fire fighting and rescue services. Achieving the runway strip dimensions and obstacle clearances will require agreements with landowners 6 Manihiki, Penrhyn, Pukapuka Airports Civil Engineering Works for Upgrading, Tropicana Limited, July 2006

39
on land acquisition and clearance of buildings and trees which protrude into the obstacle clearance areas.
163. NAVAIDs and Runway Lighting: Manihiki and Penrhyn NDBs need to be replaced with state-of-the art equipment. Air Rarotonga would also like to operate night flights to Manihiki and Penrhyn to increase the utilization of the Saab 340. This would require installation of airfield lighting, PAPI, obstacle lights and a standby generator.
164. Operations and Maintenance (O&M) Requirement: Following improvement and certification to Part 139, the airports will require a much higher standard of O&M than provided at present. In particular, the runway will require regular inspection, sweeping and repair to maintain the crushed limestone graded surface and keeping it free of stones, grass, ruts and potholes. The airports will be subject to regular inspections by MOT similar to Aitutaki. O&M is discussed under institutional arrangements below.
165. Aviation Fuel Supplies: Air Rarotonga will require a three months’ supply of aviation fuel in the northern islands, which translates into approximately 50,000L at Penrhyn and 10,000L at Manihiki. The air service will depend upon a regular supply of fuel by marine transport.
166. Long Term Requirements: The airport improvements to meet Part 139 for the Saab 340 will be sufficient for larger turbo-prop aircraft such as the Bombardier Q400 and the ATR42, except for some operational requirements such as fire fighting and rescue equipment and fuel supply). Therefore these standards should be sufficient for many years. In future, it may be necessary to seal the runway and construct a passenger terminal if regional international traffic were to develop (e.g. maritime patrol, regional services from Tahiti).
4. Other Outer Island Airports
167. Mangaia: The 950m runway cannot be extended due to physical restrictions. There is a suitable area on the east side of the island where a longer runway could be constructed. Traffic to Mangaia has been growing and the long-term prospects for tourism, agriculture and other economic activities are promising. Air Rarotonga would introduce Saab 340 service if a longer runway were available. A new airport complying with Part 139 would cost in excess of $5 million and a detailed feasibility study is needed to determine the best solution.
168. Mauke and Mitiaro: Do not generate sufficient traffic to support a Saab 340 service and Air Rarotonga plans to continue services with Bandeirante (or successor aircraft). Both runways need to be repaired and maintained at a proper standard.
169. Rakahanga, Nassau and Palmerston: Rakahanga’s airstrip was destroyed by cyclones some years ago and reconstruction costs would be extremely high. The potential air traffic generated by the island’s small population is too small to support an air service. However, Rakahanga will benefit from improved service to Manihiki. There is no possibility of developing airstrips on Palmerston or Nassau.
5. Aitutaki Airport
170. Aitutaki is served with a combination of five to six Saab and Bandeirante scheduled flights per day (except Sundays) and occasional charters from Rarotonga. Air Rarotonga can increase the frequency of service to meet increasing demand and, in addition, plans to acquire a second Saab, therefore route capacity should not be an issue in the foreseeable future. The airport was improved in 1992 and its facilities and equipment are generally sufficient to meet expected traffic in the short term. The runway is scheduled for resealing in 2010 or thereabouts. See Figure 8 for the Aitutaki Airport Land Use Plan
171. In the next several years the airport may require improvement to handle international services depending on interest shown by the air carriers. Services from Tahiti using

40
ATR42/72 or Bombardier Q400 are the most likely expectation. These aircraft carry 40-80 passengers and therefore would require improvements to the existing passenger terminal and increased aircraft handling capacity.
172. In the longer term jets in the A320/B737 category might serve Aitutaki. This would require a major investment in runway strengthening (asphalt concrete (AC) overlay), enlarged apron, fuelling, aircraft support equipment and a new terminal building.
6. Climate Change Adaptation Requirements
a. Outer Island Airports
173. The Climate Risk Profile (CRP) has determined that many of the proposed airport improvements will be affected by climate change parameters which include sea level rise, sea surge, high winds and intense rainfall. The Northern Group airports and Aitutaki are most vulnerable because of their low elevations. The CRP has recommended that Project Adaptation Briefs (PAB) be conducted at the feasibility or detailed engineering stage. Refer to Part 3.
174. Adaptation measures envisaged for the airports focus on protecting the runway from flooding and sea surge. Engineering measures include raising the runway profile and providing sufficient cross-slope, constructing adequate airfield drainage. Most runways are located close to the shoreline and some type of foreshore protection may be feasible. The key requirement is prevent scouring or flooding which would close the runway. Airports with navaids (NDB) and runway lighting also require protection of this equipment and standby power.
175. Airports in the Southern Group constructed on the Makatea Plateau are at less risk and do not require PAB.
b. Rarotonga Airport
176. Cyclone Olaf demonstrated that the airport is at risk of serious damage and even prolonged closure from weather events. Critical facilities are:
• Air Traffic Control (ATC) tower which, although not at risk from sea surges, could be damaged by high winds and debris. ATC equipment is old and nearing the end of its design life and the building needs some renovation.
• Electrical controls, transformers and standby generator located immediately on the landside of the road.
• Runway 08 approach lighting and the embankment are very exposed to sea surges. 177. A separate project has been identified to provide protection against cyclones. The PAB and risk assessment would identify the range of damage that the airport could sustain under various scenarios, the consequent operational availability, and the estimated cost of preventing damage.
E. Sector Development Strategy
1. Objectives
178. 78. The objectives of the air transport sector development strategy are:
• Provide the necessary standard of safety, aircraft and passenger handling capacity, and levels of service at Rarotonga to meet the requirements of international civil aviation
• Increase the passenger and cargo capacity and frequency of air service provided to the Outer Islands

41
• Increase the reliability of service so that flights are not cancelled through fuel shortages or runway damage
• Reduce the operating costs of air transport services • Ensure airport facilities satisfy MOT and ICAO safety requirements through repair,
upgrading, operation and maintenance of airport facilities to prescribed standards • Implement the necessary climate change adaptation measures to ensure airports are
not made inoperable by extreme weather events.

42
Figure 8: Aitutaki Airport Land Use Plan
Source: Auckland International Airport Ltd’s ‘Rarotonga International Airport Development 10 Year Land Use Plan Option 3, June 2001’

43
2. Project Identification
179. The Infrastructure Master Plan has formulated 10 airport improvement projects which will support these objectives. The projects have been identified from a review of engineering reports, discussions with MOT, CIAA, Air Rarotonga and GHD Consultants, field visits and inspections of the four Northern Group airports and Aitutaki and Atiu Airports, and consultations with Island Councils and Administrations in all the Outer Islands.
180. The 10 Airport Improvement projects are:
Project ID: Description:
ATW01AIU ATW05MHX ATW06PYE ATW07PZK
Atiu, Manihiki, Penrhyn and Pukapuka Airport Improvements: upgrading to meet Part 139 requirements involving runway repair and re-profiling, grading the runway strip, improving drainage, new visual aids and clearance of obstacles.
ATW02MGS Mangaia Airport Development: construction of a Part 139 airport at a new location.
ATW03MUK ATW04MOI
Mauke and Mitiaro Airport Improvements: runway repairs and re-profiling to accommodate continued Bandeirante and occasional Saab 340 service in the short term and further improvement to Part 139 in the longer term.
ATW08RAR Rarotonga Airport Passenger Terminal Improvement: construction of an enclosed departures area, enlargement of the arrivals area and installation of a new baggage carousel enabling the airport to satisfy security and B777 requirements.
ATW09RAR Rarotonga Airport Cyclone Protection Works: package of measures including protection of the runway 08 end and relocation of the ATC tower, electrical controls and standby generator to the south side of the runway. This project could be extended to include replacement of airfield lighting and eastern extension of the apron.
ATW10AIT Aitutaki Airport Improvement for International Operations: if air carriers introduce international services the following improvements will be required: runway strengthening overlay (as opposed to reseal), expansion of the terminal building, apron and parking, upgrading of firefighting and rescue category, customs and immigration processing facilities.
181. Project Profiles: Detailed descriptions of the rationale, scope of work, capital and O&M costs and implementation arrangements for each project are contained in Appendix 5 Project Profiles.
182. Feasibility studies have been completed for Atiu, Manihiki, Penrhyn and Pukapuka Airport Improvement projects and the next stage is field surveys, detailed engineering design and environmental assessment. The remaining projects require feasibility and environmental studies before the final scope of work and costs can be determined.
183. Capital and Annual O&M Costs: Estimates for each project are shown in Table 11. Capital costs are in 2006 prices and include civil works and equipment, 15% physical contingency and 10% engineering and project management.
184. Capital costs exclude land acquisition or compensation to landowners for tree cutting and cropping and removal of structures. These costs cannot be determined until (1) the amount of land and number of trees or structures are identified from the land survey and airport zoning study (identification of obstacles) and (2) negotiations are undertaken with landowners. It would be reasonable to expect landowners to allow the project to remove or crop some trees without compensation, as their contribution to the project, especially as they are direct beneficiaries of the investment and may gain increased revenues from landing fees.

44
185. Capital cost estimates provide for current engineering design standards which may not provide sufficient protection from future severe weather events. Project Adaptation Briefs are identified for at-risk projects which may result in additional costs which cannot be estimated at this stage.
3. Project Prioritization
186. The 10 airport improvement projects were evaluated and ranked using the multi-criteria evaluation tool described in Appendix 6. The ranking was adjusted to take account of practical implementation considerations, budget limits and projects in donor pipelines. The results are shown in Table 11. Four projects will be implemented in the short term (1-5 years) with a total cost of $5.75 million.
187. Penhryn and Manihiki are the CI Government’s and Air Rarotonga’s highest priorities and NZAID has identified these projects for inclusion in the Outer Islands Development Program (OIDP). Pukapuka has been included as well because it can be implemented using the same construction resources for Penrhyn and Manihiki, to gain economies of scale, and it is included in the OIDP pipeline.
188. Any improvements needed for Rarotonga to meet international safety and security requirements and to provide a satisfactory level of service to international air carriers must be given priority.
189. The remaining projects can be prepared for implementation when funds become available. Atiu is the next highest priority project and should be implemented as soon as possible. The improvements to Aitutaki should only be undertaken if and when air carriers have definite plans to introduce direct international services.
F. National Transport Policy Study
190. Air and marine transport are vital for sustaining the economic development and social well-being of the islands. Air service is dependent on inter-island shipping for supplying aviation fuel to the Outer Islands. At present, the government does not have an air and marine transport policy to define national objectives for the sectors and lay out a strategy and supporting policies, regulatory actions and other measures for achieving those objectives. The Outer Islands depend on private sector air and shipping services which do not receive any financial assistance from the government.
191. Given the low populations, low traffic, long distances and high operating costs the level of both air and marine transport service is extremely low, especially in the Northern Group. Scheduled services are once per week at most and passenger air fares and cargo rates are extremely high. There are strong indications of unsatisfied demand, even with the high air fares. For example, the waiting period for obtaining a seat between Rarotonga and Manihiki or Penrhyn is as much as two months, and Pukapuka has no scheduled service.

45
Table 11: Air Transport Projects and Priorities
Project ID Project Name Capital Cost
Estimate $ million
Annual O&M Cost Estimate
$ million
Land or Control of Land Use Required1
Project Adaptation
Brief for Climate Change
Funding Status
Short Term 1-5 years ATW06PYE Penrhyn Airport Improvement 0.75 0.075 Yes Yes OIDP ATW05MHX Manihiki Airport Improvement 0.75 0.075 Yes Yes OIDP ATW07PZK Pukapuka Airport Improvement 0.75 0.075 Yes Yes OIDP ATW08RAR Rarotonga Airport Passenger Terminal Improvement 3.50 NA No No Subtotal 5.75 0.225 Long Term 5-20 years ATW01AIU Atiu Airport Improvement 0.75 0.075 Yes No ATW09RAR Rarotonga Airport Cyclone Protection Works 5.00 NA Possibly Yes ATW03MUK Mauke Airport Improvement 0.75 0.075 Yes Yes ATW04MOI Mitiaro Airport Improvement 0.75 0.075 Yes Yes ATW02MGS Mangaia Airport Development 5.00 0.075 Yes Yes ATW10AIT Aitutaki Airport Improvement for Intl Operations 13.00 NA Yes Yes Total 31.25 0.525 AMS01NAT National Transport Policy Study 0.25 0 No No 1. Cost estimates exclude land acquisition costs.

46
192. The low level of service has significant negative impacts, which contribute directly to the downward economic spiral, isolation and depopulation in the Outer Islands. Government is intervening by upgrading the airports and repairing the harbors in the Outer Islands which promise to improve reliability and reduce the carriers’ operating costs but these measures alone are not sufficient. It is unreasonable to rely totally on the private sector in the circumstances faced by the Outer Islands and some form of government intervention is required to improve levels of service and reverse this negative spiral. A comprehensive transport policy study is required to inform decisions on further investments in transport infrastructure and define feasible interventions to improve levels of service and reduce user costs.
193. In the air transport sector, the type of policy and intervention envisaged would ensure that each island receive a scheduled air service at least once per week. Most islands have sufficient demand for this level of service at present except for Pukapuka where the standard could be relaxed to twice-monthly service. Pukapuka’s needs could be met if government financial support were given to Air Rarotonga to operate this service.
194. The National Transport Policy has been included in the Infrastructure Master Plan and is shown in Table 11 as a short-term project with an estimated cost of $0.25 million.
G. Air Transport Sector Performance Monitoring Plan
195. The objectives of the air transport sector plan are outlined in Section F above. Achievement involves significant investment (1) by CIGOV in airport facilities and improved maintenance as outlined in the infrastructure master plan, (2) by Air Rarotonga in additional aircraft, crew and services and (3) by Air New Zealand and possibly Pacific Blue and other foreign carriers in international services. The MOT is the appropriate agency in CIGOV for monitoring sector performance and reporting progress in achieving sector objectives.
196. Sector performance can be monitored through a relatively few, easy-to-measure indicators which include:
• Air passenger and cargo traffic: growth in traffic is the most direct measure of sector performance.
• Frequency of service, capacity and load factors provided between Rarotonga and each Outer Island are indicators if demand for service is being satisfied.
• Air fares and cargo rates in terms per passenger-km or kg-km are indicators if investments in infrastructure are delivering benefits in terms of reduced user costs.
• Regular airport inspection reports on compliance with Part 139 and maintenance of critical airport facilities will indicate if the O&M arrangements and budgets provided by CIGOV are effective.
• Incident reports relating to air safety and security will indicate the extent to which international standards are being achieved.
197. It is recommended that MOT provide CIGOV with an annual Air Transport Sector Performance Report which (1) summarizes sector performance using the above indicators, (2) provides a narrative assessment of progress and (3) makes recommendations for additional interventions needed to correct deficiencies and achieve sector objectives.
H. Recommendations for Institutional Arrangements
198. The following is a summary of the recommended institutional arrangements for implementation of the air transport sector strategy. Refer to Part 2 for further discussion and details.

47
199. Government will commission the national transport policy review immediately after the development of a National Economic Development Strategy. OPM will assist MOT in the development of the transport policy and monitoring performance against a suite of valid indicators that measure the sector’s efficiency and effectiveness as described above.
200. There will be a staged transfer of responsibilities for Outer Island airports to CIAA. On taking over responsibilities of an airport, CIAA will enter into a contractual arrangement with the Island Administration to manage and operate the airport. CIAA will train Island Administration staff as airport managers and safety officers and in equipment operation and airstrip maintenance.
201. CIAA will take over responsibilities for Penrhyn, Manihiki and Atiu airports as they are upgraded to Part 139 certification and financial and administrative agreements have been reached with Government and the Island Administrations. MOT will undertake the training of local inspectors for Part 139 certification and develop operations manuals for Part 139 airports. Other airports will be taken over only after land leasing and licensing agreements are reached with landowners and financial and administrative arrangements are reached with Government and Island Administrations.

48
IV. MARINE TRANSPORT SECTOR
A. Introduction
202. This chapter addresses the Cook Islands’ requirements for marine transport and identifies proposed harbor infrastructure improvements. In the short term the focus is upon repairs and reconstruction of harbors in the Outer Islands damaged by cyclones. At present, repair and upgrading of the Outer Island harbors is the subject of detailed technical study by the government and the assessment described in this chapter draws heavily on the work being done by the Aid Management Division (AMD) and NZAID.
203. The port and harbor improvements needed in future in Rarotonga and Aitutaki are assessed separately. Both Avatiu Harbor in Rarotonga and Aitutaki Harbor are being rehabilitated and improved to increase capacity and operational efficiency. Both harbors can be developed further to deal with increasing traffic, attract new traffic and reduce cargo shipping costs.
B. Sector Overview
1. Shipping Services
204. International container shipping services are operated from New Zealand and Fiji by Reef Shipping, through its local agent Express Cook Islands Line Agency Ltd (EXCIL) and Forum Pacific Line. Both international providers operate a service approximately every three weeks.
205. Inter-island shipping services are operated by Taio Shipping Ltd. with two vessels, MV Manui Nui and MV Maunga Roa. Both vessels are at the end of their useful lives and will need to be replaced within two years. Taio provides ten and six sailings per year to the Southern and Northern Group islands respectively. None of the harbors except Penrhyn can handle larger vessels therefore cargoes are palletized and transferred by barge to shore. Damage and losses are inevitable. Diesel fuel purchased by the Island Councils for the electricity generators is carried in large tanks aboard ship. Each Island Council has 1600 L tanks which are transported to the ship for filling and then taken back to shore. Petrol and aviation fuel are transported by drum or special 2000L aviation fuel tanks. Each island stores fuel sufficient for two months. The low traffic generated by the Outer Islands and the necessary lighterage means that service is infrequent and costs are high. Mataroa Shipping has one vessel, MV Miss Mataroa, for a domestic service but has not operated for several months due to financial and other problems.
206. Outer Island residents also rely on the inter-island shipping service for passenger transport because air service is limited and costly. The level of service is very poor due to a lack of passenger accommodation and the infrequent service.
207. Taio Shipping Ltd is seeking a replacement vessel for the two existing ships which will be able to carry a small number of containers in addition to palletized cargo. It’s not clear what passenger accommodations will be provided.
208. Two new players have recently shown interest in the domestic market. The motor sailor Kwai has commenced trading between Honolulu, the northern Group and Rarotonga. The vessel can carry 200 tons of pallet cargo, 8 passengers in cabins and 12-16 foresail passengers. The vessel has plans to include freezer space capable of carrying 4-5 tons of red snapper to a large market in Honolulu on the condition that blast freezers are available in the northern islands. The master of the locally registered Picton Castle is reported to have purchased two vessels, which are being converted to schooners for carrying 12 high end tourists and a similar number of budget passengers. The vessels will have limited cargo

49
space of around 30 tons. It is planned for one of these vessels to work exclusively in the Cook Islands while the other operates regionally.
2. Harbors
a. Rarotonga – Avatiu
209. Avatiu Harbor serves as the international port of entry for all cargo to the Cook Islands and the origin of all cargo shipped to the Outer Islands, except for Aitutaki which receives containers and other cargoes direct from New Zealand. A plan of Avatiu Harbor is shown in Error! Reference source not found.. The main facilities are:
• Four quays providing berths for international and inter-island shipping (see Error! Reference source not found.), large fishing boats and yachts, CI Te Kukupa patrol boat and smaller craft up to 33m in the western basin.
• International and inter-island transit sheds, container handling shed • Container marshalling and storage areas • CI Gas LPG storage depot • Eastern and western breakwaters • Office buildings for CIPA, Harbormaster, shipping and other companies with business
in the harbor • Police Department licensing office, Ministry of Marine Resources
210. The harbor cannot handle ships above approximately 60m in length which prevents larger container liners and cruise ships from entering the harbor.
211. The harbor has endured many cyclones although not without some damage. When a cyclone is expected the entire port area is evacuated: small boats are lifted ashore and out of danger; larger vessels put to sea or station themselves on the leeward side of the island; containers, CIPA equipment and all loose items are removed to inland locations; transit sheds are emptied and doors left open. The most damage suffered was destruction of the partly completed western breakwater by Cyclone Sally in 1987.
b. Aitutaki
212. Aitutaki Harbor comprised the Arutanga Channel leading to a small basin and finger quay. Ships cannot berth at the quay because of the channel depth (maximum <2m at high tide) and restricted basin space. CIPA has a lighter operation using two old barges, which can each transport one full TEU and up to three empty containers. The port operates two mobile cranes with 18-20t capacity each, and two forklifts with 3.5t and 6t capacity respectively. Aitutaki Harbor’s main quay has a hardstand area adequate for two barges and a 20t mobile crane.

50
CI Gas LPG Storage Depot
Transit sheds
Western basin
Inter-island berths
CI Te Kukupa berth
General boat berths (high masts)
Container storage area
Western breakwater
International berths
Eastern breakwater
Quay now extended to west and constructed over causeway
Main basin
Figure 9: Aviatiu Harbour, Rarotonga

51
213. Reef Shipping provides a regular monthly service delivering an average of 40 containers, which require two days to unload. Mataroa International used to provide a monthly service with break bulk cargo.
c. Outer Island Harbors
214. The harbors in the Outer Islands typically comprise a channel cut through the reef flat to a small basin containing a dock area and small boat ramp. Some harbors have concrete seawalls to provide a measure of protection to the channel and basin. Typically the dock area comprises of a concrete paved quay and a small handstand area. Each island has one or more barges or large dinghies for transferring cargoes from the ship which are unloaded onto the quay by HIAB truck owned by the Island Administration. Pallets are then moved to a nearby storage shed.
215. Penrhyn has the only harbor (Omoka) in the Outer Islands which is directly accessible by ship. It and the airport were constructed by the US military during the Second World War. Ships enter the lagoon through a passage north of Moananui and are able to berth alongside the quay and unload cargo directly onto the quay pavement. The dock area also contains fuel storage tanks for the CI patrol boat, Te Kukupa.
216. The smaller islands have very basic infrastructure: Pukapuka has a narrow, shallow channel cut through the reef into the lagoon. Cargoes are unloaded from the barge at a beach (Yato) in front of the storage shed. Nassau has no harbor and cargoes are ferried by boat to the reef edge and trucked across the reef flat at low tide. Palmerston has a shallow channel in the reef but no quay and cargoes are unloaded on the beach.
217. Manihiki, Penrhyn and Pukapuka also have small boat wharfs inside the lagoon at each village for serving the barges or dinghies transferring cargoes and fuel from the main harbor to the separate villages.
3. Marine Traffic
218. Traffic volumes handled at Rarotonga and Aitutaki are summarized in Table 12 and Table 13. Overall, Rarotonga has experienced a healthy growth in international commercial activity in terms of numbers of arrivals, containers and total tonnage. The decrease in cruise vessels and yachts in 2005 is no doubt due to the cyclones that year. There is every expectation of continued increase in traffic due to growth in the economy and tourism.
219. Port traffic in Aitutaki has increased in terms of container activity but decreased in terms of break bulk cargo tons as shown in Table 13. The decline in inter-island shipping services no doubt accounts for the decrease in break bulk cargo.
220. No traffic data are presented for the Outer Islands.
Table 12: Port of Call Arrivals and Departures - Rarotonga
Category 2002/2003 2003/2004 2004/2005 Average Growth,
% per year General – International 33 31 66 25.7 General - Domestic 50 58 54 2.6 Tankers 28 20 25 -3.7 Cruise Vessels 13 30 24 22.4 Yachts 161 142 98 -15.1 Fishing Boats 147 258 452 44.9 Total Arrivals/Departures 432 539 719 18.3 Source: CIPA

52
Table 13: Annual Revenue Tons - Rarotonga and Aitutaki
Category 2002/2003 2003/2004 2004/2005 Average Growth,
% per year Rarotonga
Full Container Load, TEU 36,763 44,215 47,259 8.6 Less than Container Load, TEU 8,393 7,541 7,052 -5.6 Total Containers 45,156 51,756 54,311 6.3 Break Bulk 12,805 17,017 17,459 10.8 Vehicles 330 320 278 -5.5 Bulk Fuel 19,968 19,645 21,830 3.0 Total Tonnage 77,929 88,418 93,600 6.2
Aitutaki Full Container Load, TEU 3,357 5,662 6,432 23.9 Less than Container Load, TEU 2,329 2,404 1,687 -10.1 Total Containers 5,686 8,066 8,119 12.5 Break Bulk 9,650 5,415 2,425 -36.6 Vehicles NA NA NA NA Bulk Fuel NA NA NA NA Total Tonnage 15,336 13,481 10,544 -11.6
TEU = Twenty foot equivalent unit Source: CIPA
C. Needs Assessment
1. Rarotonga- Avatiu Harbor
221. CIPA is currently implementing Stage 2 of the western basin development to relieve congestion and delays in the harbor, and provide more quay capacity and improved protection for small craft as well as rectifying damage caused by the 2005 cyclones. The development aims to maximize the quay length available within the basin for vessels up to 33m in length. The main works involve:
• Widening, deepening and re-shaping the basin excavated in a previous stage • Construction of additional sheet-piled quay walls • Construction of additional concrete quays • Completion of the south breakwater return • Reconstruction of the main western breakwater • Protection works to all newly cut faces • A slipway and launching ramp • Reshaping/extending the hardstand areas adjacent to the basin • Improvement to access roads.
222. The total estimated cost of Stage 2 is $2.6 million. Construction of Stages 2A, 2B and 2C will be completed by the end of 2006.
223. CIPA also wishes to implement a further Stage 3 depending on funding availability. It would include completion of the north breakwater return, rock protection to all basin faces and miscellaneous works such as power, fresh water, toilets and a small building.
224. In the medium term the port will require continued incremental upgrading to provide more area for container marshalling and storage. Already containers are being triple-stacked for lack of space. Alternatives are to relocate the CI Gas LPG depot outside of the port area, freeing up a large area or developing an ‘inland port’ where containers could be processed

53
by customs and stored. Either scheme will require further feasibility and engineering studies before any decision can be made.
225. The long term development of the port depends on its capacity to handle larger vessels with lengths of 60m or more. The present channel dimensions and the length and geometry of the quay line restrict the port to smaller international vessels. Cruise liners and larger container vessels cannot dock at the quay. At present Reef Shipping would like to operate a larger container vessel to Rarotonga and Aitutaki and continue to other islands which would cut container transport costs significantly. CIPA envisages straightening the quayline and extending it towards the reef together with reconstructing the seawall and widening and deepening the channel. This is a very major undertaking and will require detailed economic, engineering and environmental studies to determine if the scheme is feasible.
226. A larger port would generate significant economic benefits in the form of reduced cargo transport costs. Regular cruise liner traffic will also provide increased economic opportunities although there will be additional costs associated with large influxes of daily visitors.
2. Aitutaki Harbor
227. The port facilities are very basic comprising two quays at right angles and an L-shaped storage area behind the quays and an additional unpaved storage area south of the quay. The quay is need of repairs and pavements are broken and uneven. The only channel navigation aid is a transit but there are no channel marker buoys. There is limited storage area in the CIPA garage where its cranes and forklifts are stored and maintained. Containers are either transported to shippers’ premises or unpacked in the open behind a temporary fence.
228. CIPA is carrying out needed repairs to the quay walls and hardstand area, and has ordered a new 22m barge capable of carrying two TEUs and a new 25t fork lift. This will provide sufficient cargo handling capacity for the foreseeable future.
229. CIPA proposes to develop the harbor in stages7 progressively deepening the Arutanga Channel and enlarging the basin. Stage 1 involves dredging the channel and basin to clear loose sediment (-3m MSL) and permit entry to yachts. An environmental study by University of Auckland8 indicates that Stage 1 is expected to have a negligible effect on the lagoon. Later Stages 2 and 3 involve deepening and widening the channel and basin to allow container ships to berth at the quay. Further detailed study is required before any decision could be made on enlarging the channel and basin beyond Stage 1.
3. Outer Island Harbors
230. The minimum standards for Outer Island harbours were identified in consultations with the Island Councils, domestic ship operators, shippers, consultants for NZAID’s Outer Islands Development Programme and participants at the Inception and Mid-Term Workshops. There is agreement on the following requirements:
• Each island should have a harbour which allows for safe transfer of passengers and cargoes in most weather conditions.
• Each harbour should be provided with a channel through the reef, basin, quay, small boat ramp, breakwater or seawall, and visual navigation aids sufficient for existing lighter operations.
• Each harbour should be provided with crane and storage shed for the handling, unpacking and storage of cargoes.
7 Aitutaki Harbor Development, Ministry of Works and Cook Islands Ports Authority, November 2003 8 Preliminary Assessment of Environmental Effects of Proposed Channel and Harbor Improvements, Aitutaki, Auckland Uniservices Ltd.,University of Auckland, April 2004

54
231. The Island Councils and some private sector stakeholders also identified the need for harbours to handle ships or barges large enough to unload 20-foot containers. Only Penrhyn and Aitutaki have this capability at present. A container service would reduce unit transport costs and losses and provide the level of logistical support needed for tourism development on a larger scale. However, the feasibility of 20-foot container service to the many Outer Islands is uncertain due to the low volumes of traffic and the main inter-island shipping service has no immediate plans to provide a container service to each island. Nonetheless, the harbour improvement schemes include provision of a ramp for larger barges capable of carrying a 20-ft container, which possibly may be delayed to a later stage.
232. CI Government is planning to repair and improve harbor facilities in the Outer Islands with funding from the Outer Islands Development Program (OIDP) or the Cyclone Recovery and Reconstruction Program (CRRP). To this end AMD retained the services of GHD Consultants of New Zealand to (1) investigate the condition of all the outer island harbors excluding Aitutaki, (2) review works completed to date and prepare feasible concepts for upgrading works, and (3) prepare indicative cost estimates in advance of further detailed engineering survey and design stages. GHD visited the Southern Group harbors in April 2006 and the Northern Group in August 2006. Draft reports9 on the Southern Group islands were submitted in July 2006 and reports on the Northern Group in October and November 2006.
233. The master plan Consultant team formed part of the AMD-NZAID-GHD-ADB mission, which visited the Northern Goup Islands in August and participated in the stakeholder consultations held on each island to address infrastructure requirements including improvements needed in the harbors. The recommendations made by GHD were accepted by the Island Councils and will form the basis of immediate and short-medium term harbor infrastructure projects in the infrastructure master plan.
234. Atiu, Mangaia, Mauke, Mitiaro, Manihiki and Rakahanga Harbors: require some or all of the following works:
• Remove the encroaching reef and improve the channel to a uniform 3m depth • Enlarge the basin and construct a new 25m quay and 15m wide small boat ramp
close to the shoreline to improve basin protection • Construct or extend the breakwater to protect channel and basin • Construct a seawall to protect channel and basin • Install new bollards and fendering to quay line wall • Install additional beacon light and reflector channel markers on the seawall ends • Construct a concrete landing ramp to enable future loading barge access (possible
future stage works). 235. Penrhyn Harbor: was inspected in 2002 by the Royal Australian Army10 as well as by GHD Consultants in August 2006. The scope of work recommended by both investigations is similar namely:
• Replace entire sheet piling with concrete wall anchored by geotextile mesh • Construct gabion walls to protect harbor walls north and south of the main quays • Repair or replace quay pavements • Replace bollards and install new fendering • Dredge berth area and shipping channel • Provide navigation markers in main shipping channel
9 Design Concept for Proposed Harbor Upgrade, Atiu, Mangaia, Mauke, Mitiaro (4 reports), GHD Consultants, July 2006 10 Wharf Facility Shore Protection, Penhryn Island, 19th Chief Engineer Works, Royal Australian Army Engineers, June 2002
55
236. Pukapuka Harbor: requires construction of concrete jetty, boat ramp and small hardstand area at Yato. A second small jetty is needed on Motu Ko for transferring air passengers, cargo and fuel. The boat passage across the reef flat needs to be cleared and improved and channel markers installed.
237. Nassau: requires construction of a small harbor. The Scope of Works is expected to include: excavation of a channel and small basin; construction of concrete quay or jetty on the foreshore (5 x 20 m); installation of channel markers, bollards and fendering; reconstruction and widening of the concrete causeway to the beach ridge.
4. Climate Change Adaptation Measures
a. Harbor Project Adaptation Briefs
238. The Climate Risk Profile (CRP) has determined that virtually all harbor reconstruction or improvement projects will be affected by climate change parameters which include sea level rise, sea surge, high winds and intense rainfall. The CRP has recommended that Project Adaptation Briefs (PAB) be conducted at the feasibility or detailed engineering stage. Refer to Part 3.
239. Adaptation measures envisaged for the harbors focus on protecting the breakwaters, quays and ramps from breaking waves and sea surges, and the construction of seawalls to provide safe operating conditions in most sea conditions.
b. Rarotonga North Coast Protection
240. Following Cyclone Sally in 1987 several studies and actions were taken to improve protection of infrastructure between Avarua and the international airport. The Avarua Harbor breakwater was disassembled and used to amour the Avarua foreshore revetment. JICA undertook two studies of constructing breakwaters on the reef flat, armored revetments and concrete parapets on the foreshore. The associated costs were extremely high (>NZ$200 million at 1992 prices) and the JICA analysis showed the scheme to be uneconomic. Recommendations were made to (1) reconsider selective protection of strategic infrastructure units including the runway end and Avatiu Harbor, (2) relocate strategic assets such as the fuel depots inland and (3) continue with computer analysis and scale model testing of alternative protective schemes. Four areas where protective schemes are required are: runway end, the fuel storage depots, Avatiu Harbor West Breakwater, and Avarua foreshore.
241. Given the cyclone experience in 2005 the master plan recommends that CIGOV re-open examination of options for protecting the north coast. This will involve detailed coastal engineering studies, scale model testing, feasibility studies and risk assessment required to define feasible solutions. Four sub-projects are envisaged:
• Construction of offshore breakwater to protect runway end • Relocation or construction of offshore breakwater and sea wall for the Triad Pacific
Petroleum P (TPP) fuel depot • Construction of Avatiu Western Breakwater • Construction of Avarua Marina or alternative scheme
D. Sector Development Strategy
1. Objectives
242. The objectives of the marine transport sector development strategy are:

56
• Provide the necessary harbor, berth and cargo handling capacity required to meet traffic requirements in terms of size and draught of vessels, number of vessels and volume and type of cargo.
• Provide operational efficiencies and level of service at Avatiu and Aitutaki Harbors to minimize shipping and facilities operating costs
• Provide fit-for-purpose harbors which remain sufficiently calm to allow boats to operate in most sea conditions
• Provide robust, durable harbor structures able to survive damage in all but the most extreme weather conditions
• Increase safety for seamen and reduce damage and losses of vessels, cargoes and equipment
• Increase the frequency of inter-island shipping service • Reduce the operating cost of inter-island shipping service • Increase the level of service provide for passengers on inter-island shipping services • Minimize adverse impacts on the marine environment.
2. Project Identification
243. The infrastructure master plan has formulated 15 harbor projects which will support these objectives. The projects have been identified from a review of engineering reports, discussions with AMD, CIPA and GHD Consultants, field visits and inspections of the four Northern Group airports and Aitutaki and Atiu Airports, and consultations with Island Councils and Island Administrations in all the Outer Islands.
244. The 15 projects are:
Project ID: Description: MTW01AIU Atiu Harbor Repairs MTW05MHX Manihiki Harbors Reconstruction MTW06NAS Nassau Harbor Development MTW02MGS Mangaia Harbor Reconstruction MTW03MUK Mauke Harbor Reconstruction MTW04MOI Mitiaro Harbor Reconstruction MTW07PYE Penrhyn Harbor Rehabilitation MTW10RAR Avatiu Harbor Western Basin Completion MTW11RAR Avatiu Harbor Container Facilities MTW14RAR Avarua Waterfront Protection MTW08PZK Pukapuka Jetty Development MTW09RAK Rakahanga Harbor Improvement MTW12RAR Avatiu Harbor Waterfront Development MTW13RAR Avatiu Harbor Expansion MTW15AIT Aitutaki Harbor Development Stage 1 245. Project Profiles: Detailed descriptions of the rationale, scope of work, capital and O&M costs and implementation arrangements for each project are contained in Appendix 5 Project Profiles.
246. Capital and Annual O&M Costs: Estimates for each project are shown in Table 14 based on estimates prepared in previous reports. Capital costs are in 2006 prices and include civil works and equipment, 15% physical contingency and 10% engineering and project management.
247. Capital costs exclude land acquisition. Most harbors are on crown land and further land is not required. However, one or two projects may affect customary lands.

57
248. Capital cost estimates provide for current engineering design standards which may not provide sufficient protection from future severe weather events. Project Adaptation Briefs are identified for at-risk projects which may result in additional costs which cannot be estimated at this stage.
3. Project Prioritization
249. The 15 projects were evaluated and ranked using the multi-criteria evaluation tool described in the Appendix 6. The ranking was adjusted to take account of practical implementation considerations, budget limits and projects in donor pipelines. The results are shown in Table 14. Eight projects will be implemented in the short term (1-5 years) with a total cost of $12.31 million.
250. Three projects – Atiu, Mangaia and Mauke Harbors – have already been approved for funding by ADB’s CEAL Project, NZAID’s Cyclone Recovery and Reconstruction Program (CRRP) and are scheduled to begin construction in 2007. Figure 10 shows the proposed Mangaia Harbor improvements. Three other projects - Manihiki, Nassau and Mitiaro - are being reviewed by CI Government and NZAID for inclusion in the Outer Islands Development Program (OIDP).
251. Penrhyn is the remaining high-priority harbor in the Outer Islands because of its strategic importance in providing fuel storage for the Air Rarotonga’s planned Saab 340 service and for the CI Te Kukupa patrol boat.
252. Completion of the western basin development in Avatiu is also considered a priority because of the increasing traffic in Avatiu and the economic benefits it will bring to Rarotonga.
E. National Transport Policy Study
253. Marine and air transport are vital for sustaining the economic development and social well-being of the islands. Air service depends on inter-island shipping for supplying aviation fuel to the Outer Islands. At present, the government does not have an air and marine transport policy to define national objectives for the sectors and lay out a strategy and supporting policies, regulatory actions and other measures for achieving those objectives. The Outer Islands depend on private sector air and shipping services which do not receive any financial assistance from the government.
254. Given the low populations, low traffic, long distances and high operating costs the level of both air and marine transport service is extremely low, especially in the Northern Group. Frequencies are very low: six trips per year to the Northern Group and ten trips per year to the Southern Group. Many residents cannot afford the high air fares and rely on the inter-island service to reach Rarotonga and other islands.
255. The low level of service has significant negative impacts, which contribute directly to the downward economic spiral, isolation and depopulation in the Outer Islands. Government is intervening by upgrading the airports and repairing the harbors in the Outer Islands which promise to improve reliability and reduce the carriers’ operating costs but these measures alone are not sufficient. It is unreasonable to rely totally on the private sector in the circumstances faced by the Outer Islands and some form of government intervention is required to improve levels of service and reverse this negative spiral. A comprehensive transport policy study is required to inform decisions on further investments in transport infrastructure and define feasible interventions to improve levels of service and reduce user costs.
256. In the marine transport sector, the type of policy and intervention envisaged would be to ensure that each island receives shipping service once per month and ships provided

58
reasonable passenger accommodation. It is recommended that the government carry out detailed assessment of alternatives for providing this level of service. A National Transport Policy Study covering both air and marine transport to the Outer Islands has been included in the Infrastructure Master Plan and is shown as a short-term project with an estimated cost of $0.25 million

59
Table 14: Marine Transport Projects and Priorities
Project ID Project Name Capital Cost
Estimate $ million
Annual O&M Cost Estimate
$ million
Land or Control of Land Use Required1
Project Adaptation
Brief for Climate Change
Funding Status
Short Term 1-5 years MTW01AIU Atiu Harbor Repairs 0.16 0.065 No Yes CRRP 2007 MTW05MHX Manihiki Harbors Reconstruction 2.40 0.105 No Yes OIDP MTW06NAS Nassau Harbor Development 0.33 0.030 No Yes OIDP MTW02MGS Mangaia Harbor Reconstruction 2.20 0.065 No Yes CRRP 2007 MTW03MUK Mauke Harbor Reconstruction 1.80 0.065 No Yes CRRP 2007 MTW04MOI Mitiaro Harbor Reconstruction 2.50 0.065 No Yes OIDP MTW07PYE Penrhyn Harbor Rehabilitation 0.92 0.075 No Yes MTW10RAR Avatiu Harbor Western Basin Completion 2.00 NA No Yes Subtotal 12.31 0.471 Long Term 5-20 years MTW11RAR Avatiu Harbor Container Facilities 3.50 NA Yes No MTW14RAR Avarua Waterfront Protection 20.00 NA No Yes MTW08PZK Pukapuka Jetty Development 0.27 0.060 Yes Yes MTW09RAK Rakahanga Harbor Improvement 0.03 0.030 No No MTW12RAR Avatiu Harbor Waterfront Development 1.50 NA No Yes MTW13RAR Avatiu Harbor Expansion 20.00 NA No Yes MTW15AIT Aitutaki Harbor Development Stage 1 5.00 NA No Yes Total 62.61 0.560 1. Cost estimates exclude land acquisition costs.

60
Figure 10: Proposed Mangaia Harbor Improvement

61
F. Marine Transport Sector Performance Monitoring Plan
257. The objectives of the Marine Transport Sector Plan are outlined in Section E above. Achievement involves significant investment in harbor facilities and improved maintenance as outlined in the Infrastructure Master Plan and the CI Government intervention in the inter-island shipping service to provide a better level of service than at present. The MOT is the appropriate agency in the CI Government for monitoring sector performance and reporting progress in achieving sector objectives.
258. Sector performance can be monitored through a relatively few, easy-to-measure indicators which include:
• Cargo traffic, vessel arrivals and inter-island passenger traffic: growth in traffic is the most direct measure of sector performance.
• Frequency of service provided between Rarotonga and each Outer Island is the best level of service measure for inter-island shipping.
• Unit cargo and container rates and passenger fares are indicators if investments in infrastructure are delivering benefits in terms of reduced user costs.
• Regular seaport inspection reports on maintenance of harbor and equipment will indicate if the O&M arrangements and budgets provided by the Cook Islands Government are effective.
• Incident reports relating to safety and security will indicate the extent to which international standards are being achieved.
259. It is recommended that MOT provide the Cook Islands Government with an annual Marine Transport Sector Performance Report which (1) summarizes sector performance using the above indicators, (2) provides a narrative assessment of progress and (3) makes recommendations for additional interventions needed to correct deficiencies and achieve sector objectives.
G. Recommendations for Institutional Arrangements
260. The following is a summary of the recommended institutional arrangements for implementation of the Marine Transport Sector Strategy. Refer to Part 2 for further discussion and details.
261. Government will commission a national transport policy review immediately after the development of a National Economic Development Strategy. OPM will assist MOT in the development of the transport policy and monitoring performance against a suite of valid indicators that measure the sector’s efficiency and effectiveness.
262. The proposed Project Development Unit (PDU) would be the executing agency for the upgrading and commissioning of Outer Island harbors. As such PDU would be responsible for prioritization and inclusion of projects in works program and the appointment of implementing agent for each project.
263. CIIC will undertake a due diligence study of CIPA to ascertain the true value of activities and assets of the Avatiu and Aitutaki port facilities with a view to:
• Contracting longshoreman and security activities to the private sector; • Deliberating the case for leasing the operations and management of ports to the
private sector.

62
V. ROAD SECTOR
A. Introduction
264. This chapter addresses the Cook Islands’ requirements for road infrastructure improvements. The focus is upon improvements in Rarotonga’s road network where the main road investment requirements will occur. However, there are also road requirements in Aitutaki and other Outer Islands which need to be included in the Infrastructure Master Plan.
B. Sector Overview
1. Rarotonga Road Network
265. The road network comprises the Ara Tapu main ring road (32km), the Ara Metua (back) inner ring road (approximately 20 km), the short feeder roads, which connect to these two ring roads, and the street network in Avarua. There are approximately 100 km of sealed and 90 km of unsealed public roads on the island.
266. The Ara Tapu is a two-lane road with a carriageway width varying between 6 and 7m. There is a 1 km dual carriageway section along the Avarua waterfront with angle parking on both sides of the median and in front of the landside shops. The pavement surface is Double Bituminous Surface Treatment (DBST) in fair to good condition. In 2005 a 50-100m section of road located at the west end of the airport runway was washed out by Cyclone Olaf. Along most of its length the road is located within a few meters of the shoreline and hence is at risk of serious damage and closure from sea surges and flooding from heavy rains.
267. The right-of-way (ROW) varies between 10 and 12m, which is narrower than normally provided in other countries and therefore presents safety and maintenance problems. Hedges and signs built up to the ROW obscure line-of-sight distances for traffic on the road and those entering from side roads. In many areas there is very limited space for pedestrian traffic and there is no room for side drainage ditches along most of the road length. Repairs to water, power and telecommunications lines buried within this narrow strip affect the pavement structure and pavement depressions and edge failures are common.
268. The road has numerous short bridges and culverts. Most are in acceptable condition but many require repair, or reconstruction in some cases. A number of bridges have been reconstructed over the past several years.
269. The Ara Metua is a winding, single-lane road, except for the sections immediately east and west of Avarua. The pavement surface is DBST or Single BST (SBST) and is in fair condition for most of its length. Fortunately traffic is very light except in the Avarua area so that the road geometry and surface condition does not represent a serious problem for the time being. The MOW’s priority is to complete and upgrade sections of the Ara Metua so that it can be used as a diversion route in the event the main ring road is closed for any reason.
270. The government is receiving technical and financial assistance from China to upgrade a 5.5 km section of the Ara Metua between the roundabout in Avarua and Pokoinu Road and including Pokoinu Road to the main ring road immediately west of the airport. This will enable traffic to bypass the highly trafficked sections of the main ring road along the Avarua foreshore, Avatiu Harbor and the airport, which are most vulnerable to cyclones.
271. The works will include realignment to eliminate the worst curves and provide a 40 km/hr design speed, relocation of utilities to one side of the roadway, clearance of trees and structures as needed, and construction of a 8m roadway with 6-7m two-lane carriageway within a 10m ROW. Work completed to date includes a survey, identification of the new alignment and ROW, and identification of land take requirements. The next step will be consultation with landowners leading to land acquisition. The MOW will be responsible for acquiring the ROW and relocating the utilities in advance of construction. The estimated cost

63
of utilities relocation is $2 million. The estimated road construction cost is $5.6 million (roughly $1 million per km). Land acquisition costs are unknown at this point.
272. The Ara Metua has three gaps: in Rutaki (near the uncompleted Vaimaanga Sheraton Hotel site); Titikaveka; and behind Muri Lagoon. The MOW would like to complete these missing road sections but the chief obstacle is acquiring the ROW from property owners, could prove difficult, which is unlikely in the foreseeable future. Unless Government were to exercise its authority pursuant to the Cook Islands Act 1915 by acquiring the sections by warrant, which is not a desired outcome, however it has been done by way of consultations and consensus.
273. Apart from the small street grid in Avarua the remaining roads in Rarotonga are short feeder roads, which connect to the two ring roads. Most of these are not legal in that the government does not have title to the ROW and the roads are built on the properties of the landowners on either side of the road. This problem is expected to persist indefinitely.
2. Outer Island Road Networks
274. The Outer Island roads are constructed of crushed coral or ‘lagoon mud’. Several years ago the MOW shipped its road sealing vehicles to Aitutaki, Mangaia and Atiu and provided a SBST on the main roads in Aitutaki and the village roads in Mangaia and Atiu as shown above. The length of roads on the OIs is summarized in Table 15.
Table 15: Outer Island Road Lengths Island Road Length, km Comment
Aitutaki 59 16km sealed Mangaia 58 3km sealed Atiu NA 8.9km sealed Mauke 40 Unsealed Mitiaro 21 Unsealed Palmerston 2 Unsealed Pukapuka 9 Unsealed Nassau NA Unsealed Manihiki NA Unsealed Rakahanga 2 Unsealed Penrhyn 2 Unsealed Suwarrow NA Unsealed
275. The Outer Island roads are generally in fair condition and, although potholes and ruts are common, the roads are adequate for the very low levels of motorcycle and motor vehicle traffic. The most important requirement is that roads connecting the communities with critical infrastructure such as the Emergency Management Centre, hospital, harbor and airport will remain passable except in the most extreme weather events. This will require some minor reconstruction where necessary (e.g. raising grades and providing better drainage).
276. It is proposed that the most critical road repairs in the OIs be implemented as additions to the planned airport and harbor improvement projects when the necessary engineering skills and construction machinery are on the island. It will be a simple matter for the contractors to re-profile roads, raise embankments and make drainage improvements before they demobilize. An example is the Pukapuka causeway linking Yato and Roto which was destroyed by Cyclone Percy and partially reconstructed by Island Administration. This area requires reconstruction and swamp drainage.
3. Vehicle Population and Road Traffic
277. Over the past five years the vehicle population in all categories except utility vehicles has been increasing at high rates. The private vehicle ownership rate (counting cars/jeeps/vans/pickups) is roughly 300 vehicles per 1000 population but it includes the
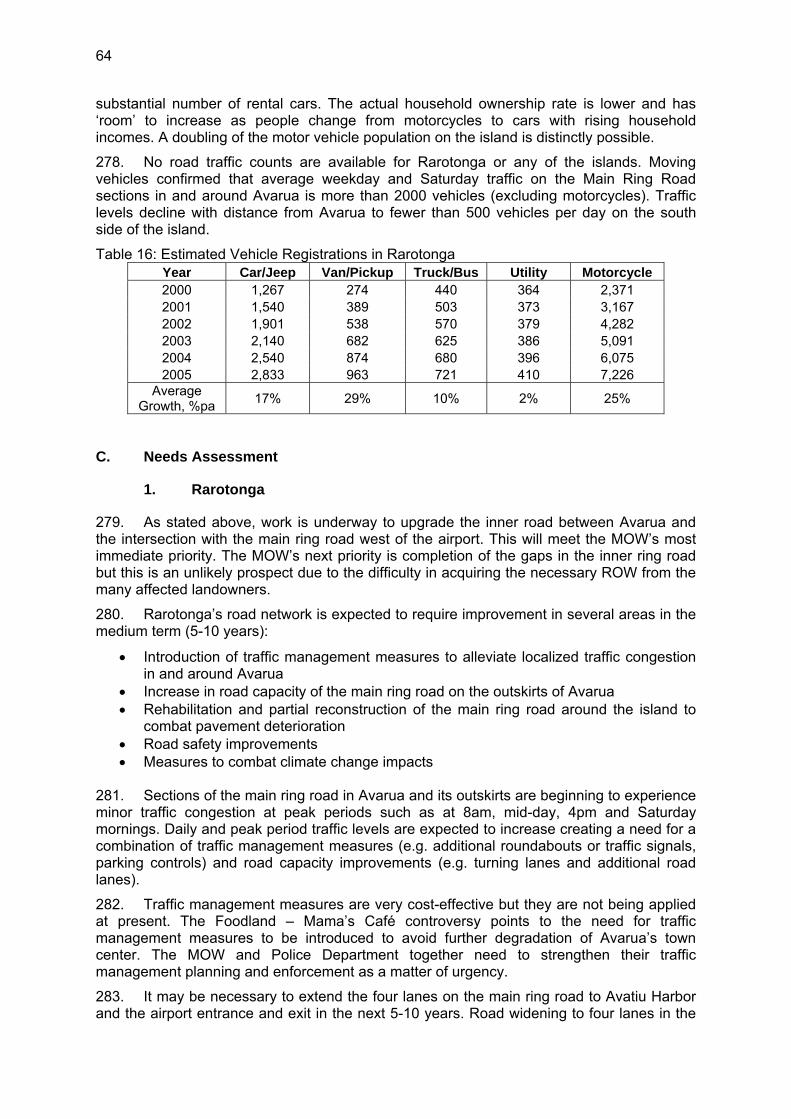
64
substantial number of rental cars. The actual household ownership rate is lower and has ‘room’ to increase as people change from motorcycles to cars with rising household incomes. A doubling of the motor vehicle population on the island is distinctly possible.
278. No road traffic counts are available for Rarotonga or any of the islands. Moving vehicles confirmed that average weekday and Saturday traffic on the Main Ring Road sections in and around Avarua is more than 2000 vehicles (excluding motorcycles). Traffic levels decline with distance from Avarua to fewer than 500 vehicles per day on the south side of the island.
Table 16: Estimated Vehicle Registrations in Rarotonga Year Car/Jeep Van/Pickup Truck/Bus Utility Motorcycle 2000 1,267 274 440 364 2,371 2001 1,540 389 503 373 3,167 2002 1,901 538 570 379 4,282 2003 2,140 682 625 386 5,091 2004 2,540 874 680 396 6,075 2005 2,833 963 721 410 7,226
Average Growth, %pa 17% 29% 10% 2% 25%
C. Needs Assessment
1. Rarotonga
279. As stated above, work is underway to upgrade the inner road between Avarua and the intersection with the main ring road west of the airport. This will meet the MOW’s most immediate priority. The MOW’s next priority is completion of the gaps in the inner ring road but this is an unlikely prospect due to the difficulty in acquiring the necessary ROW from the many affected landowners.
280. Rarotonga’s road network is expected to require improvement in several areas in the medium term (5-10 years):
• Introduction of traffic management measures to alleviate localized traffic congestion in and around Avarua
• Increase in road capacity of the main ring road on the outskirts of Avarua • Rehabilitation and partial reconstruction of the main ring road around the island to
combat pavement deterioration • Road safety improvements • Measures to combat climate change impacts
281. Sections of the main ring road in Avarua and its outskirts are beginning to experience minor traffic congestion at peak periods such as at 8am, mid-day, 4pm and Saturday mornings. Daily and peak period traffic levels are expected to increase creating a need for a combination of traffic management measures (e.g. additional roundabouts or traffic signals, parking controls) and road capacity improvements (e.g. turning lanes and additional road lanes).
282. Traffic management measures are very cost-effective but they are not being applied at present. The Foodland – Mama’s Café controversy points to the need for traffic management measures to be introduced to avoid further degradation of Avarua’s town center. The MOW and Police Department together need to strengthen their traffic management planning and enforcement as a matter of urgency.
283. It may be necessary to extend the four lanes on the main ring road to Avatiu Harbor and the airport entrance and exit in the next 5-10 years. Road widening to four lanes in the

65
easterly direction through Tupapa is probably infeasible due to the land acquisition required. A practical solution is probably a combination of minor widening together with turning lanes, and some improvements in the inner ring road to divert local traffic away from the main ring road.
284. The main ring road pavement is deteriorating continuously over time as a result of (1) surface course aging, (2) increased axle loads (heavier trucks) in relation to the pavement bearing strength, (3) installation of utility lines which continuously weakens the pavement and (4) increased rainfall which soaks and weakens the pavement. The MOW is continuously providing maintenance to the road but eventually it will prove economic to rehabilitate the heavily trafficked sections on the north, east and west sides of the island. Such rehabilitation is expected in the next 5-10 years. Conventional road economics suggest that the DBST surface should be rehabilitated with an asphaltic concrete (AC) pavement when average annual daily traffic (AADT) exceeds 3000-5000 vehicles.
285. Road safety is expected to become an increasingly important issue as traffic levels increase. Many factors come into play: (1) the lack of separation between motor vehicles and pedestrians except in Avarua and sections in Arorangi, (2) the mix of motorcycles and motor vehicles, (3) sub-standard road geometric standards, (4) short line-of-sight distances, (5) uneven pavement surfaces and (6) poor lighting, just to name a few. A concerted effort to implement the ‘four Es of road safety’ is needed: Engineering, Education, Enforcement and Emergency. Engineering involves a broad range of infrastructure improvements including road geometry changes, traffic signals, road markings, barriers, signage, lighting, pedestrian pathways and pedestrian islands to name a few. Education involves driver training and public awareness programs; Enforcement is a responsibility of the Traffic Police; and Emergency refers to the provision of rapid ambulance paramedic response.
286. The main ring road is at risk from sea surges due to its proximity to the shoreline and from flooding due to increased intense rainfall. It is impractical to relocate the road, therefore other mitigation measures must be considered. These include raising the embankment height in low-lying areas, improving side drainage, increasing bridge and culvert openings and armoring embankment sides to resist scouring.
2. Aitutaki
287. Aitutaki has approximately 60 km of road with crushed coral base of which 16 km were sealed with a Single Bituminous Surface Treatment (SBST) by MOW several years ago. This SBST will require an additional seal in the coming years which could be combined with other sealing work. The Island Administration has been extending the road network by constructing a crushed coral road base along the south and east shores. The Island Administration would like to provide improve the cross-drainage on this road and seal it and unsealed sections of other roads.
3. Outer Islands
288. The minimum standards for Outer Island roads were identified in consultations with the Island Councils and participants at the Inception and Mid-Term Workshops. These are summarized as:
• Main roads in villages should be sealed. This has been achieved on several Southern Group islands and, while desirable from an environmental viewpoint, is not economic or practical.
• Roads providing access to emergency management centers, harbours, airports, power supply and telecommunications buildings, schools and health clinics should be improved to a gravel/crushed limestone standard and maintained in good repair.
• Roads providing access to harbours and airports should be climate-proofed against sea surges and flooding.

66
289. The roads on the outer islands are mainly non-engineered crushed coral pavements, except for small lengths of sealed road in the villages in Atiu and Mangaia. Traffic levels are very low, mainly trucks and motorbikes. Road surfaces can be maintained in good condition with adequate routine maintenance programs well within the capacity of the island administrations. All the road networks have some sections which require repairs or improvements outside of routine maintenance to ensure that they are passable in all but severe weather events. The focus should be on main roads connecting villages, emergency management centers, telecommunications, health, school, harbor and airport facilities.
4. Climate Change Adaptation Measures
290. The Climate Risk Profile (CRP) has determined that most road improvements will be affected by climate change parameters which include sea level rise, sea surge, high winds and intense rainfall. Refer to Part 3.
291. Adaptation measures envisaged for roads focus on protecting the roadway and drainage structures from scouring from flooding and sea surge. Engineering measures include raising the road elevation, providing sufficient cross drainage including bridge openings, and protecting road embankments.
D. Sector Development Strategy
1. Objectives
292. The objectives of the road sector development strategy are:
• Reduce the number of road accidents, serious injuries and deaths • Introduce effective traffic and parking management measures to maintain the
physical environment and village ambience in the Avarua area • Ensure the integrity of the main road network in Rarotonga in providing access to key
infrastructure and services even with the occurrence of cyclones and other extreme weather events
• Rehabilitate, strengthen and maintain road pavements and drainage structures to preserve road assets and minimize total road transport cost (combined road user and agency costs)
• Provide all-weather road access to key infrastructure and services in each of the Outer Islands.
2. Project Identification
293. The Infrastructure Master Plan has formulated seven road projects which will support these objectives. The projects have been identified from a review of engineering reports, discussions with MOW, field inspections and consultations with Island Councils.
Project ID: Description: RTW01RAR Rarotonga Road Safety Program RTW02RAR Rarotonga Traffic Management RTW03RAR Rarotonga Main Ring Road Rehabilitation RTW04RAR Rarotonga Inner Ring Road Completion RTW05AIT Aitutaki Road Improvements RTW06NAT Outer Islands Road Improvements RTW07RAR Inner Ring Road Nikao-Takuvaine

67
294. Project Profiles: Detailed descriptions of the rationale, scope of work, capital and O&M costs and implementation arrangements for each project are contained in Appendix 5 Project Profiles.
295. Capital and Annual O&M Costs: Estimates for each project, shown in Table 17, are based on estimates prepared in previous reports and the cost of comparative road works in the World Bank ROCKS database. Capital costs are in 2006 prices and include civil works and equipment, 15% physical contingency and 10% engineering and project management.
296. Capital costs exclude land acquisition. Small quantities of land to widen the road right-of-way are expected to be required for several projects.
297. Capital cost estimates provide for current engineering design standards which may not provide sufficient protection from future severe weather events. Project Adaptation Briefs are identified for at-risk projects which may result in additional costs which cannot be estimated at this stage.
3. Project Prioritization
298. The seven projects were evaluated and ranked using the multi-criteria evaluation tool described in Appendix 6. The ranking was adjusted to take account of practical implementation considerations, budget limits and projects in donor pipelines. The results are shown in Table 17. Five projects will be implemented in the short term (1-5 years) with a total cost of $6.83 million.
299. The Inner Ring Road Nikao-Takuvaine Improvement is already in the government’s program. China will fund the road construction but the government’s contribution to the project is relocation of utilities with an estimated cost of $2 million presumably from CAPEX.
E. Road Sector Performance Monitoring Plan
300. The objectives of the road sector plan are outlined in Section E above. Achievement involves significant investment in road infrastructure and improved maintenance as outlined in the infrastructure master plan. The MOW is the appropriate agency in CIGOV for monitoring sector performance and reporting progress in achieving sector objectives.
301. Sector performance can be monitored through reports from MOW and the Island Administrations. The drawback is most indicators measure inputs, such as expenditure on road maintenance, but do not provide an accurate picture of output or road condition. This is an issue common to road administrations around the world. Nonetheless, the road network in the Cook Islands is very simple and the following measures should be obtainable without much difficulty:
• Road accident, serious injuries and deaths as recorded by the Police Department – Rarotonga and Aitutaki.
• Annual traffic counts at fixed locations to monitor traffic growth – Rarotonga. • Annual traffic speed measurements and parking occupancy surveys to monitor level
of service – Rarotonga. • Annual road condition surveys to measure road roughness and condition of
pavements, drainage, markings and road furniture – required for each island 302. It is recommended that MOW provide CIGOV with an annual Road Sector Performance Report which (1) summarizes sector performance using the above indicators, (2) provides a narrative assessment of progress and (3) makes recommendations for additional interventions needed to correct deficiencies and achieve sector objectives.

68
Table 17: Roads Projects and Priorities
Project ID Project Name Capital Cost
Estimate $ million
Annual O&M Cost Estimate
$ million
Land or Control of Land Use Required1
Project Adaptation
Brief for Climate Change
Funding Status
Short Term 1-5 years RTW07RAR Inner Ring Road Nikao-Takuvaine 2.00 0.015 Yes Yes CAPEX RTW01RAR Rarotonga Road Safety Program 0.85 .075 No No RTW06NAT Outer Islands Road Improvements 2.40 0.100 No Yes RTW02RAR Rarotonga Traffic Management 0.28 0.050 Yes No RTW05AIT Aitutaki Road Improvements 3.30 0.196 No Yes Subtotal 6.83 0.436 Long Term 5-20 years RTW03RAR Rarotonga Main Ring Road Rehabilitation 30.00 0.310 Yes Yes RTW04RAR Rarotonga Inner Ring Road Completion 12.00 0.035 Yes Yes Total 50.83 0.781

69
F. Recommendations for Institutional Arrangements
303. The following is a summary of the recommended institutional arrangements for implementation of the road sector strategy. Refer to Part 2 for further discussion and details.
304. Government will commission a review of the road sector immediately after the development of a National Economic Development Study. The review will include a cost study on all aspects of road construction and maintenance. The outputs of the review will be a national strategy for road development and maintenance and an analysis of the potential areas of increased private sector participation. OPM will assist MOW in the development of the national strategy and business and action plans with indicators, baseline data and targets that are realistic and capable of providing valid information.
305. The strategic planning, road planning and traffic management and contract management capacity of MOW will be developed. MOW will assist the Outer Islands with strategic planning and the design of proposed works and will build their capacity to manage and supervise contractors.
306. MOW’s and the Island Administrations’ capacity to develop and manage contracts, operational efficiency and financial control will be strengthened. CIIC will assist MOW and Island Administrations to implement increased private sector participation. OMIA will continue to act as a liaison point for Outer Islands engaging MOW and increasingly the private sector to provide assistance.
307. The Department of Police and MOT will coordinate with the Ministry for Education and civil society organizations to mainstream road safety education and awareness at the secondary school level, provide driver training and raise public awareness.
VI. WATER SUPPLY SECTOR
A. Sector Overview
308. The water supply sector has been receiving considerable support from the government and donor agencies in recent years. The sector attracts the highest allocation of funds from the government capital expenditure of all the sectors, amounting to about 15% of the national budget on capital expenditure. Donor agencies injected a further 9% of the aid funds into the sector bringing the overall national expenditure in the water sector to just under $1 million in fiscal year 2005/0611
309. There has been a steady improvement in overall water supply coverage since 1990 and in 2001 access to sources of water supply exceeded 99% on Rarotonga and was about 87% overall on the outer islands. However, there is still a large disparity between the southern and northern groups; on the latter about 35% of the people (representing around 5% of the national resident population) still rely on carting water to their houses from bores and public water tanks12. The recent cyclones have caused considerable damage to water infrastructure on the affected northern islands thus compounding an already stressed situation. Despite these setbacks, the country is expected to reach its Millennium Development Goals of providing water to more than 95% of its population.
310. The water sector suffers from major institutional constraints in operation and management of assets due to an overlap of functions arising from policy gaps, the wide geographic spread of the islands, and a general shortage of skilled professionals compounded by a “brain drain” to the larger economies of New Zealand, and to a lesser
11 Cook Islands Appropriations Amendment 2005-2006 12 Cook Islands Millennium Development Goals National Report, June 2005

70
extent Australia. In short, there is a need for institutional strengthening and streamlining of services through a comprehensive water sector policy review.
311. Due to the nature of life on resource-limited islands, Cook Islanders are highly conscious of the need to conserve water. Despite this awareness, water is provided to consumers free of charge which does little to encourage water savings, especially as western cultural lifestyles are adopted. This is already a point of concern on the two main islands of Rarotonga and Aitutaki and is an emerging problem on the other islands.
B. Objectives
312. The CI Government’s objectives in the water sector are; to provide sufficient quantities of potable water to all consumers in the Cook Islands and, where applicable, to operate secure water distribution networks with minimal loss. The National Sustainable Development Plan Targets directly affecting infrastructure development are summarized in Appendices 9 and 10.
313. The aims in the water sector under this project are to establish an investment program that will enable the CI Government to reach its stated objectives through the construction of environmentally sustainable infrastructure and improved efficiency of operation and management of water assets.
C. Existing Status
314. Existing water assets and their condition on each island and observations made during the field visits under this project are summarized in Appendices 9 and 10. A brief description of the existing status of water supply in Rarotonga and the Southern and Northern Islands is presented below.
1. Rarotonga
315. On Rarotonga the water supply system comprises 12 intakes from spring and surface water sources, with no treatment of the raw water apart from a coarse gravel filter screen, and a gravity fed distribution pipe network. A ring main around the island supplies most consumers, except those living at higher elevations which cannot be supplied by gravity. The town reticulated water system is also used for agricultural purposes. Households that are not connected to the central system rely on rainwater capture and on-site storage tanks as their source of supply, which is augmented by purchasing and carting in water from the town network during extended dry periods. Effectively, all households on Rarotonga (MOW advised in excess of 99%) have access to clean water.
316. Water quality is variable with piped water becoming turbid after extended and intense rainfall periods. None of the water sources are disinfected, so people either boil the water or buy bottled water for potable use. Diarrhea and other water-borne diseases are noticeable on Rarotonga.
317. MOW staff advised that many of the pipes are old and heavily corroded and therefore require replacement. Because water is provided free of charge, there is little incentive for householders to fix leaking taps and pipes on their property, thus leading to more wastage. Although MOW estimates indicate water loss in excess of 70%, neither the sources nor consumers are metered so water losses cannot be determined with any reliability. MOW has an ongoing program of pipe replacement and is in the process of renewing most of the ring main. Is there any data to indicate the no of kilometers of pipe work replacement that Waterworks has completed, it would be useful to then determine the balance to complete the overall replacement network?
318. As Rarotonga is the main economic center of the Cook Islands, it also acts as the national center for the repair of plant and equipment. Consequently, any pump or other equipment break downs on the island can be repaired promptly.

71
2. Southern Islands
319. The water supply on the Southern Islands is also centralized, with consumers being serviced through a reticulated distribution system. Groundwater is the primary source of water on Aitutaki, Atiu and Mauke; whereas both surface water (three intakes) and groundwater sources are used on Mangaia. People on Mitiaro rely on a combination of spring water and rainwater. The centralized system is also used for agricultural purposes on all of the southern islands except for Aitutaki.
320. As there is no treatment on any of the islands, water quality is non-potable and often brackish, indicating that exploitation of the water lenses is at the limit of sustainability with saltwater intrusion an increasing threat. Consumers increasingly rely on augmenting their supplies with rainwater capture from their own roofs. Community rainfall catchments and storage are also used as a back up supply during extended dry periods. Inadequate water quality is a major concern on Aitutaki as incidence of diarrhea and other water-borne diseases are significant and the island has the second largest tourist population in the Cook Islands.
321. For all of the systems, untreated water from the bores is pumped to storage, from where water is piped under gravity to the consumers. Nearly all systems have problems with frequent pump failures and lengthy downtimes due to delays in getting units shipped to Rarotonga for repairs. Consequently, the quality of service to consumers is less than satisfactory. In addition, the existing pumps are nearing the end of their useful lives and the long hours of operation necessitated by the downtime of the standby units accelerate wear and tear, thus increasing pump maintenance costs.
322. The pipe networks, as on Rarotonga, were mostly built in the late 1960s and their condition reflects their age. As most of the pipes are of galvanized steel, corrosion is prevalent giving rise to high leakage losses from the network. There are further losses at the consumer level as leaking taps and in-house pipes are not repaired. Because water is pumped, at least from the source to the distribution tanks, these high losses have a direct cost implication.
3. Northern Islands
323. All islands in the Northern Group rely on rainwater as their primary source of water supply. Additionally, in most villages, roofs on public buildings and other dedicated rainfall catchment roofs are used to collect rainwater for large community storage facilities which; provide water for community premises, are sources of water for households that do not have on-site tanks and also act as back up supplies in case of extended dry weather periods.
324. Most households capture roof runoff and store it on site in storage tanks, which range in size from 2,000 L to 10,000 L, depending on household size and affluence. It was observed during the field inspections that many of the houses affected by the March 2005 cyclones on Pukapuka, and to a lesser extent by Cyclone Martin (in 1997!) on Rakahanga, are still without roofs and even rainwater water tanks. This has had a serious impact on the livelihood of the local people who have to rely on carting water from the community tanks. In addition, many of the houses, especially on Penrhyn (the most drought-prone island), capture runoff from only part of the roof area as the guttering is missing or corroded away, thus making very inefficient use of scarce resources. Although the new 6,000 L tanks have integrated covers, many of the older tanks do not or are poorly covered with no screens to keep out leaves and other debris. These uncovered tanks are unsafe and provide a breeding place for mosquitoes. Water quality is variable as none of the tanks observed had first-flush diversion mechanisms.
325. Many of the old community tanks are of concrete construction with external steel bands or rods which provide additional support and maintain water tightness. Typically their capacity is 44,000 L. However, most of the tanks are old (up to 40 years old) and are in

72
unsound structural condition. Leakage and rusted external steel bands are a common problem.
326. Several shallow wells were inspected along coastal areas in Pukapuka but many appeared to be contaminated with seepage of effluent from nearby septic tanks, pig holding areas and wind-blown debris. The wells are less than 5 m deep and water quality would also be affected by tidal variations. Studies carried out by Tony Falkland in 2001 under an AusAID funded project indicated that water quality is acceptable for non-potable use. However, as a general observation, the shallow water lens under most of the atolls in the Northern Group would be at risk from contamination from seepage of waste from onsite sanitation systems and, to a lesser extent, roaming pigs, which have highly concentrated wastes. Should these groundwater supplies be used as a reticulated source of water to households, catchment management practices and treatment, especially disinfection, would be required.
D. Planning Criteria
1. Proposed Level of Service
327. Suggested minimum standards for levels of service which could be adopted for prioritizing water projects over the planning period are:
• The quantity of water available is adequate to meet the daily needs of the entire population of the island (including expected visitors where applicable) under 1 in 10 year drought conditions;
• The quality of supply meets World Health Organization (WHO) guidelines for safe drinking water except for microbiological parameters or the Cook Islands standards if such standards are developed in the future; and
• Water supply headworks (intakes, treatment facilities and storages including rainwater tanks) are protected from the elements to an agreed level of risk under the expected climate change conditions.
328. It is noted that while achieving WHO guideline levels for microbiological parameters is desirable and could probably be attained on the islands with reticulated water supply systems, it would be very difficult to achieve on the northern islands where most households rely on rainwater capture from their own roofs. Disinfection of such sources would not be practical. Therefore, setting potable water targets is not considered practical in the medium term. Further, it is noted that “adequate quantity” is variable depending on the island and the degree of affluence of the population. In general, the per capita use on Rarotonga and Aitutaki is higher than on the other islands. These are addressed in the following sub-section.
329. The above criteria were discussed with stakeholders during the workshops and consultation meetings. There was a general concurrence with the criteria.
2. Demand Projections
330. The adopted planning criteria for the water sector are included in Appendices 9 and 10. For planning purposes, the daily per capita demand was assumed to be 250 L/c.d on Rarotonga and 150 L/c.d on the outer islands. It was further assumed that for islands which have reticulated water supply systems, water losses are 70% at present but will be reduced to 15% and 20% on Rarotonga and the outer islands respectively. Based on these assumptions and the population projections in Table 7, the projected water demands and production requirements on each island are presented in Table 18.
331. In Table 18 the required production capacity includes factoring for water losses in the distribution system. Given the flat population growth forecasts, there will be an actual

73
reduction in production requirements as water losses are reduced from the current high levels. The beneficial impact of this would be the conservation of scarce freshwater resources.
3. Institutional and Policy Considerations
332. Water Resources has been classed as a Municipal Service along with Sanitation and Solid Waste Management. Institutional and policy considerations for Municipal Services are discussed in detail in Part 2 – Institutional Analysis. An essential precursor to major investment in the water sector is that a national policy for the management of water supply and the O&M of assets be in place. Without such measures it is difficult to formulate a sustainable sector development plan.
4. Climate Adaptation
333. Climate change scenarios and adaptation needs are detailed in Part 3 – Climate Change. The key indications from the modelling are that there will be more occurrences of high intensity rainfall events and longer spells of drought events. The implications of this are primarily for storage sizing and capture efficiency – rainwater tanks will need to be larger as the dry periods become longer. For surface resources, the implications are that turbidity will increase during the wet season, thus necessitating sedimentation as well as filtration, and yields will be lower during the dry season due to the longer dry spells, thus potentially requiring more storage capacity.
Table 18: Water Demand Projections
Existing Production
Capacity (L/s)2006 2016 2006 2016 2006 2016
Rarotonga 18,250 23,820 4,563 5,955 176 81 200
Southern Group IslandsAitutaki 2,760 3,400 414 510 16.0 7.4 10.4Mangaia 740 740 111 111 4.3 1.6 3.3Atiu 710 760 107 114 4.1 1.6 1.7Mauke 570 630 86 95 3.3 1.4 1.7Mitiaro 230 230 35 35 1.3 0.5 1.2ManuaeSub-total SGI 5,010 5,760 752 864 29.0 12.5 18.3
Northern Group Islands N/A*Palmerston 50 50 8 8 0.1Pukapuka 670 670 101 101 1.5Nassau 80 80 12 12 0.2Manihiki 500 670 75 101 1.5Rakahanga 160 160 24 24 0.3Penrhyn 360 360 54 54 0.8Suwarrow 10 10 2 2 0.0Sub-total NGI 1,830 2,000 275 300 4.3Total 25,090 31,580 5,589 7,119 205.0 97.9 218.3* Note no reticulated systems on the Northern Islands at present
Production Needs (L/s)Island Population
Wastewater Generation (m3/d)
334. Other considerations specific to the water sector include the location of treatment facilities and water storage at elevations to protect them from sea surges and floods, and strengthening and covering of above ground structures such as rainwater tanks and storage.

74
335. In developing the capital cost estimates for each project in the development strategy, an incremental cost of climate change adaptation works has been included. The incremental costs are of order of magnitude accuracy and are for indicative purposes only. Detailed estimates will be required based on more reliable modelling of the climate change effects on specific projects.
E. Needs Assessment
1. Asset Rehabilitation
336. There is priority need for a comprehensive rehabilitation and continuous maintenance program of the water supply systems on all of the islands. On Rarotonga and most of the southern islands a large percentage of the old pipelines in the distribution networks need replacement. This is essential in order to reduce the existing high system losses and to eliminate infiltration of contaminants at worn out pipe joints. A rehabilitation program could be drawn up as part of an asset management plan for each island.
337. Pumps at the headworks of several of the systems in the southern islands are nearing or beyond their design life and should be replaced. A replacement schedule should be incorporated into the abovementioned asset management plan.
338. On islands without reticulated water, especially in the Northern Group, there is a priority need for the supply of rainwater tanks to ensure that all households have at least some onsite storage. It is noted that on islands that have a reticulated water supply, the government invests the taxpayers’ money to build the water supply scheme. However, on islands without such centralized systems, the onus is on households to secure their own water supply and the government only provides the community storage for use as the back up source. Therefore, it can be argued that in order to provide a more equitable share of the water sector budget allocation, the government could fund the supply of one rainwater tank for each household and a replacement tank say every 10 years or the nominal useful life of the polyethylene rainwater tanks which are widely used in the northern islands. The standard capacity of the tank could be calculated for each island based on local rainfall patterns and average family and household size. Based on initial sizing using the climate change model to predict future rainfall patterns, it is estimated that a nominal 6,000 L capacity tank should suffice for most households. Under this scheme, should households wish to have larger tanks, they would have to purchase them at their own expense.
339. A systematic gutter inspection and rehabilitation program is required to ensure that houses fitted with rainwater tanks utilize all of the roof area to capture rainfall runoff and that gutters and spoutings are in good order. From a preliminary census conducted under this study, only about 50% of the households on the northern islands use the full roof area to capture rainwater. This figure is only about 16% on the southern islands. As the quality of the rainwater is better than that of the groundwater it is considered that greater reliance should be made on rainwater for potable use on the southern islands. In fact, the installation of rainwater tanks should be made mandatory for all new buildings in the Cook Islands.
340. The old community tanks and those damaged by the recent cyclones are in need of repairs. This would involve installation of internal liners to stop the leakage, replacement of the external steel bands and repair of the tank roofs.
2. Water Quality and Improvement
341. None of the sources are disinfected so people either boil the water or buy bottled water for potable use. Diarrhea and other water-borne diseases are noticeable on Rarotonga and Aitutaki (the two primary tourist centers) and Manihiki. There is also anecdotal evidence of similar problems on the other islands, however, this is not apparent from statistical records as people do not generally report diarrhea, except in severe cases. However, disinfection of all water supplies would be very costly and is not considered achievable in the medium term.

75
342. It is recommended that due to the higher population densities, higher standard of living and greater tourist numbers on Rarotonga and Aitutaki, the water supply on these two islands be fully treated to potable standards. In the case of the former, this would involve a conventional treatment process of sedimentation, filtration and disinfection. However, given the higher salinity concentrations of the groundwater supply on Aitutaki, treatment would likely be in the form of reverse osmosis or ultra-filtration. For both islands, any such project should be preceded by a feasibility study which would include the technical aspects of treatment process selection, optimizing the number of plants and their locations and economic analyses. It should also include a survey of all households to ascertain a willingness to pay for potable quality supply and acceptance of a calculated tariff based on full cost recovery. The latter aspect would be very important in the case of Aitutaki because the reverse osmosis units cost substantially more than conventional processes. A 70% willingness to connect should be the minimum level of support achieved prior to commencement of the projects.
343. It is recommended that on the outer islands which have distribution networks, water supplies be disinfected. As the turbidity of the groundwater is generally very low, power supplies are overall reliable and the systems are not large, ultraviolet radiation or ozonation would be preferable to chlorination as the form of disinfection. This should be carried out within the medium term.
344. For islands that rely on rainwater capture, some improvements in water quality could be made through the installation of first-flush diversion devices, inlet screens and roof covers on rainwater tanks.
3. System Operation Efficiency Improvements
345. Given the very limited knowledge of the available yield of water sources, water supplied, consumer demand and water losses, there is an acute need for improvement of the operational efficiency of the centralized water supply schemes, especially on Rarotonga. As a starting point, meters should be installed at all water intakes, isolating valves should be installed in the distribution system to enable the tracking and quantifying of water losses. These works, together with the data from property connection meters, would enable the operators to determine water usage and losses.
346. There is a need for better source management. The yields of most sources are not known and water quality is not monitored regularly. A regular monitoring program of discharge measurement and water quality testing needs to be put in place both for existing and potential new sources such as groundwater. In addition, the work started under the AusAID program (the Tony Falkland investigations) should be continued.
347. Where groundwater sources are of poor water quality, catchment areas could be created on low-traffic areas (such as school sports fields) to capture rainfall infiltration and store the water in underground galleries. The system could comprise an impervious liner placed at a depth of say 0.5 m to 1.0 m below surface with agricultural drain pipes used to drain the captured water percolating through the ground above it into the storage gallery. Provided that the surface area is kept clear of pigs and cars, the quality of the water would be adequate for non potable use. It is suggested that such a system be piloted to investigate its feasibility. If successful, it could be installed on islands such as Palmerston.
4. Water Conservation
348. The existing water supply on each island is currently adequate under normal or average climatic conditions, and with declining or near static population projection, this should be the case for the foreseeable future. However, as water is regarded as free, with no tariffs payable, its use is generally inefficient and wasteful. There is no metering of production or consumption of this vital resource. Further, resources are finite, so there is an urgent need to develop much more efficient ways of utilization if resources are to be

76
adequate for future generations. While on the northern islands, where rainwater water harvesting is practiced, there is an awareness of the limited resources, on the southern islands there is much less appreciation of this fact. This will become an increasing problem and it is vital that a community awareness program be put in place to promote water conservation. This should be an ongoing program and made part of the school curriculum for children.
349. In communities where water is piped to each household free of charge, there is little incentive for consumers to fix leaking taps and pipes on their property, thus leading to more wastage. It is recommended that water meters be installed on all property connections on islands that have reticulated systems. In the short term this would enable planners to get a better understanding of the water demand by consumers, raise awareness about water being a finite resource that needs to be monitored and would also provide the flexibility to put in place a tariff collection system in the future.
350. The proposal to pipe water from community tanks to households on islands which at present rely on on-site capture of rainwater is of concern. The community tanks serve as emergency supplies in times of extended dry periods and piping water from such tanks to households for daily use could encourage wasteful practices and lead to water shortages in dry periods.
5. Emergency Supplies
351. The lessons learnt from the cyclones in 2005 are that the sources of supply, particularly on islands which depend on stored rainwater, need greater protection as contamination by seawater could severely reduce the available supplies of potable water at a time where replenishment by shipping is hampered by rough seas. The current initiative to install underground storages under micro-shelters and strengthen community tanks at the Emergency Management Centers (EMC) has merit and should be made mandatory on all islands.
6. Operator Training
352. There are usually one or two technicians/mechanics on each of the OIs who are responsible, among other duties, for the operation and maintenance of the water supply system. However, their skill level is limited to routine maintenance and basic repairs. They are also constrained by a lack of proper tools and spare parts apart from basic items such as fan belts etc. Consequently, breakdowns require calling in technicians from Rarotonga or sending the equipment to Rarotonga for repairs. Both alternatives are subject to scheduled air/shipping transport timetables and can mean delays of weeks or months.
353. In short, the main issues in the water sector are a lack of awareness of the finite nature of existing resources and hence a need for water conservation, public health risks due to lack of disinfection, corroded pipelines where a network is in place leading to high losses and inefficient operation of distribution systems where they are in place.
F. Sector Development Strategy
1. Short Term
354. A recommended list of water sector projects necessary in the next 5 years is presented in Table 19, together with capital and annual operation expenditure estimates, land requirements and climate change adaptation works. A profile sheet for each identified project is included in Appendices 5 and 6 – Project Profiles and Prioritization Process and a project adaptation brief is included in Part 3 – Climate Change.

77
355. As can be seen from Table 19, the focus in the short-term is on service delivery by upgrading supply capacity and capability through rehabilitation of the headworks on most of the islands and provision of new rainwater tanks for the islands in the Northern Group.
356. The total CAPEX of the recommended capital works projects is $9.36 million however, four of the nine capital works projects are already committed with commencement pending release of funds from the 2006/07 budget. The committed projects account for $6.31 million out of the total capital works in the sector. The annual operating expenditure (OPEX) for O&M of the recommended projects has been estimated at $130,000.
357. The estimated cost increment for ensuring that the works are adapted to the predicted climate change conditions is of the order of $270,000 or about 3% of the total investment. However, on a project by project basis, the incremental cost increase is 5% to 10%.
358. In addition to the capital works, six studies are recommended. These are also shown in Table 19. The studies are a prerequisite for proposed works in the medium-term and include feasibility of treating the water supply systems on Rarotonga and Aitutaki, tariffs and cost recovery in the Southern Group and development of a water loss reduction program for Rarotonga. A pilot study for an alternate form of water supply is proposed for Palmerston. The estimated cost of these studies is approximately $1.3 million.
359. Apart from the above capital works, it is recommended that an ongoing program be initiated comprising the projects indicated in Table 20. These projects are essential for sustainable operation and are designed to monitor operational performance of the systems, build capacity and enhance the skills of the operators, and to periodically upgrade the water supply asset management plans and master plans. When annualized, the estimated cost of these projects is equivalent to approximately $0.49 million per annum.
Table 19: Summary of Suggested Ongoing Projects in the Water Supply Sector Project Frequency Cost
Estimate ID Name ($ million)
OPMP05WS Annual water supply systems operation and management performance audits
Annual 0.15
OPCB02WS National public awareness program on water conservation
Annual 0.08
OPCB05WS Periodic skill upgrade and training of water supply system operators and technicians
Tri-annual 0.06
OPPS04WS Prepare and maintain water supply asset management plans for all islands
Annual 0.05
OPPS05WS Update of water supply management plans (for all islands)
5-yearly 0.90
2. Medium Term
360. The suggested projects required in the medium-term (the period 5-10 years from present) are summarized in Table 21. The focus during this period should be on improving water quality in the southern islands where a reticulated water supply system is in place. Most of the projects are, however, subject to the findings of the feasibility studies, including public willingness to pay, undertaken during the preceding short-term period.
361. The CAPEX estimate of the medium term projects is $14.10 million over the 5-year period, of which about 60% is for treatment facilities on Rarotonga and Aitutaki. The associated annual OPEX of the projects is approximately $0.94 million. The estimated cost increment for ensuring that the works are adapted to the predicted climate change conditions is of the order of $160,000.

78
362. If a tariff of $1/m3 is assumed on Rarotonga and Aitutaki, the revenue generated from water sales would be about $2.4 million per annum based on the demand projections for 2016. This would more than offset the annual operating costs. The cost of $1 per 1,000 L is not unrealistic for potable water and compares very favorably with current bottled water prices of $2.50 per 2 L bottle. Therefore, the introduction of a user-pays system for delivering drinking water to households has a lot of merit.
3. Long Term
363. It is difficult to project water supply asset requirements beyond 10 years, particularly as population projections are also quite uncertain. Notwithstanding, a list of anticipated projects that will likely be required in the long-term are shown in Table 22. The focus on the period 10-20 years from now would be on asset maintenance and upgrade and system expansion. It would also be an appropriate time to consider introduction of a reticulated system for non-potable water on the northern islands in order to improve the quality of life and service. Typically, upgrade of water systems is required every 10 years or so as mechanical equipment begins to fail and design capacities are reached. Therefore, the actual need and timing for the upgrade of identified projects would depend on demand and condition of the assets.
364. The estimate capital expenditure required during the 10-year period would be of the order of $22.5 million (in current prices).

79
Table 20: Summary of Suggested Projects in the Water Supply Sector - Short Term Project Cost Estimate ($ million) Land Required Climate Change Adaptation
ID1/ Name CAPEX2/ OPEX (per annum)
(Yes/No) PAB Prepared (Yes/No)
Cost increment ($ million)
Capital Works Replacement of old sections of the distribution sub-
main on Rarotonga* 3.15 No No None
WSW02RAR Installation of distribution system isolation valves on Rarotonga*
0.20 0.01 No No None
WSW16MUK Mauke water supply distribution system upgrade* 1.12 0.02 No Yes 0.08 WSW14MGS Mangaia water supply distribution system upgrade* 1.84 0.04 No Yes 0.09 WSW07AIT Aitutaki water supply headworks upgrade 0.35 0.01 Yes Yes 0.01 WSW12NGI Northern islands community rainwater catchment and
storage refurbishment 0.20 0.01 No Yes 0.02
WSW13NGI Supply and installation of household rainwater systems for northern islands
1.20 0.00 No No None
WSW15AIU Atiu water supply system upgrade 0.50 0.02 Yes Yes 0.02 WSW17MOI Mitiaro water supply system upgrade 0.80 0.02 No Yes 0.05 Sub-total Capital Works 9.36 0.13 0.27 Studies WSS01RAR Rarotonga water loss study 0.30 WSS02NAT Development of national water supply planning
criteria and guidelines 0.10
WSS03RAR Rarotonga water supply treatment feasibility study 0.30 WSS04AIT Aitutaki water supply treatment feasibility study 0.30 WSS05SGI Southern Islands water supply tariff feasibility study 0.10 WSS06PAL Palmerston water source augmentation pilot study 0.20 Sub-total Studies 1.30 Total Water Supply Short Term Projects 10.66 0.13 0.27 Notes: 1. Projects with ID have project profile sheets included in Appendices 5 and 6 –Project Profiles and Prioritization Process
2. Land costs are not included in CAPEX 3. Projects marked with * already have funding approved and are pending the Fiscal Year 2006/07 budget release

80
Table 21: Summary of Suggested Projects in the Water Supply Sector - Medium Term Project Cost Estimate ($ million) Land Required Climate Change Adaptation
ID1/ Name CAPEX2/ OPEX (per annum)
(Yes/No) PAB Prepared (Yes/No)
Cost increment ($ million)
Capital Works WSW01RAR Rarotonga distribution network rehabilitation 3.00 0.15 No No None WSW03RAR Construction of Rarotonga water treatment facilities 7.00 0.40 Yes Yes 0.10 WSW04RAR Supply and installation of property connection meters
on Rarotonga 1.20 0.04 No No None
WSW05RAR Rarotonga water loss reduction program 0.50 0.04 No No None WSW06SGI Southern islands EMC water storages rehabilitation or
reconstruction 0.10 0.02 No Yes 0.01
WSW08AIT Construction of Aitutaki water treatment plants 1.50 0.20 Yes Yes 0.03 WSW09SGI Construction of disinfection facilities on the southern
islands 0.20 0.02 No Yes 0.01
WSW10SGI Installation of property service meters on the southern islands
0.50 0.04 No No None
WSW11NGI Northern islands EMC water storages rehabilitation or construction
0.10 0.03 No Yes 0.01
Total Water Supply Medium Term Projects 14.10 0.94 0.16 Notes: 1. Projects with ID have project profile sheets included in Appendices 5 and 6 –Project Profiles and Prioritization Process
2. Land costs are not included in CAPEX

81
Table 22: Summary of Suggested Projects in the Water Supply Sector - Long Term
Project Cost Estimate ID Name ($ million) Rarotonga ongoing rehabilitation program 2.00
Rarotonga water treatment facilities upgrade 7.00
Aitutaki water treatment plant upgrade 1.50
Southern islands ongoing water supply rehabilitation program 4.00
Southern islands upgrade of disinfection facilities 0.30
Northern islands household rainwater tank renewal program 1.50
Northern islands community rainwater storage refurbishment program
0.20
Construction of northern islands non-potable water distribution network system
6.00
Summary Water Supply Long Term Projects 22.50 G. Water Supply Sector Performance Monitoring
365. Apart from the annual water supply system audits, the following parameters could be measured and recorded on an annual basis as indicators of the performance of the sector.
366. For islands with reticulated water supply systems:
• Service area coverage – how many people are provided with potable or at least clean water;
• Water loss as a percentage of production; • Cost of delivery per unit volume of water ($/m3) • Percentage of time water quality meets WHO guidelines – except microbiological
until disinfection is installed. 367. For islands with no reticulated water supply systems:
• Number of houses with access to permanent water source (onsite rainwater tank); • Frequency of water shortages; • Percentage of time water quality meets WHO guidelines – except microbiological
H. Key Recommendations for Institutional Strengthening
368. For sustainable and efficient management of the sector, it is important that institutional structures are put in place with clearly defined responsibilities and functions. This needs to be complemented by capacity building and institutional strengthening within the key agencies and that a culture of ongoing skill upgrade is established in the agencies. A detailed analysis of institutional issues within the water supply sector is included in the Municipal Services section of Part 2 – Institutional Analysis. (Municipal Services covers the three sectors; Water, Sanitation and Solid Waste Management.) Key points and recommendations are summarized below.
369. Three options have been proposed for the institutional future of municipal services. Firm institutional recommendations are, at this time, highly contentious and beyond the scope of this TA.

82
370. Until such time as Government develops its National Economic Development Strategy (NEDS) and three Government stakeholders take ownership and display a willingness to undertake responsibility and reduce fragmentation there is little hope of formulating, adopting and implementing a national policy for the management of water resources.
371. The preferred option would be for the sector to maintain the status quo and cease policy and regulatory work in the sector until such time as a NEDS is approved. Government would then, on completion of the NEDS undertake a comprehensive sector wide review with a view to developing consolidated policy and regulations, reduce duplication, consolidate capacity and take note of international experience and lessons learned.
372. The doubtful validity of many of the indicators in business plans within the Municipal Services sector and the nature of performance indicators and associated targets are a reflection of ineffective management regimes, no clear ownership of policies and planning or regulation at the national level, the absence of a realistic vision for the future and associated economic and social goals. It is expected that the policy unit at OPM will provide leadership in the development of a consolidated municipal services policy. The Policy Unit will then be able to assist in the development of business and action plans with SMART13) indicators, reliable baseline data and realistic targets.
373. Laboratory services are integral to the monitoring of water resources. Again several options have been discussed. The preferred option would see Government establish a central testing facility for all environmental testing in conjunction with and under the management of the existing MOH laboratory. Donor funding would be required to equip such an institution and provide the training for staff. Government would need to fund the technical staff and the on-going O&M costs.
VII. ENERGY SECTOR
A. Sector Overview
374. Electricity supply on the Cook Islands is a combination of reticulated and private systems. There is a predominant reliance on diesel fuel but the use of renewable energy sources is increasing. Service coverage is very good with over 95% of households nationally either connected to a central electricity supply or having their own solar panels. Service is less than 24 hours per day on many of the outer islands.
375. According to the Census 2001 report, 79% of households use liquefied petroleum gas (LPG) for cooking and of the 21% using kerosene & firewood, most were in the outer islands. The Cook Islands has one of the highest ratings in the world for carbon dioxide emissions per capita14 . This reflects the heavy reliance on fossil fuels as the primary source of energy.
376. Under the National Sustainable Development Plan (NSDP), the Cook Islands Government set a target of 20% reduction in per capita consumption and 30% increase in renewable energy use by 2010. Whilst the former is considered achievable, the latter appears highly unlikely at this stage. Having said that, overall, the sector is in a satisfactory state and with some modest investment and a good community awareness campaign, the targets could be achieved.
377. The Government did not allocate any funds for expenditure in the sector in fiscal year 2005/06. However, donor agencies contributed $300,000, mostly for emergency repairs in 13 Specific, Measurable, Achievable, Relevant, Timely 14 Cook Islands Millennium Development Goals Report, June 2005

83
the aftermath of the 2005 cyclones15. The lack of direct investment by the Cook Islands Government is because on Rarotonga, which accounts for more than 85% of the national electricity generation, the state-owned enterprise, Te Aponga Uira (TAU) has its own capital expenditure program which is generally funded out of revenue or borrowings on the commercial market.
378. Like the water sector, the energy sector is hindered by institutional constraints in the operation and maintenance of assets due to policy gaps, fragmented institutional structure, poor inter-agency coordination and a general shortage of skilled technicians, spare parts and even tools. There is a need for institutional strengthening.
379. The main concerns in the energy sector include safety of the public and technicians due to the lack of a national standardized wiring system and the lack of practical initiatives or measures taken to combat the rising cost of the power bills (at both the household and national economy level) partly brought about by the surge in global oil prices.
B. Objectives
380. The CIGOV objectives are to rationalize management of the energy sector by developing and implementing the Cook Islands Energy Strategic Plan for all islands and to achieve the NSDP targets mentioned above. The NSDP targets directly affecting infrastructure development are summarized in Appendices 9 and 10.
381. 281. The aim in the energy sector under this project is to establish an investment program that will enable the CIGOV to reach its stated objectives through the construction of environmentally sustainable infrastructure and improved efficiency of operation and management of energy assets. As TAU has a detailed capital expenditure program for Rarotonga, the emphasis under this project has been on the outer islands.
C. Existing Status
382. Existing electricity supply assets and their condition on each island and observations made during the field visits under this project are summarized in Appendices 9 and 10. A brief description of the existing status of electricity supply infrastructure on Rarotonga and the outer islands is presented below.
1. Rarotonga and Aitutaki
383. On Rarotonga, electricity generation and supply are operated by TAU. The Rarotonga power station is operating at a peak demand of 4,400 kW, close to the 4,670 kW capacity of its generators16 . The generator sets (gensets) consume 20,000 L of diesel fuel per day and the plant has a 7-day fuel storage capacity. In view of the limited margin between peak demand and existing capacity, TAU plan to embark on the design and construction of a second power station on Rarotonga.
384. On Aitutaki power supply is also operated by a state-owned enterprise, Aitutaki Power Supply (APS), which has its own board of directors, and reports annually to the Board of CIIC on the management and status of assets. The existing genset comprises five units – three 40 kW and two 200 kW units. However, they are obsolete, unserviceable and in need of replacement. At present, as a temporary measure APS is using a hired 800 kW gensets from NZ Generator Hire. It is understood that APS intends to purchase similar units to the hired genset within the current fiscal year.
15 Cook Islands Appropriations Amendment 2005-2006 16 TAU

84
385. Renewable energy use on Rarotonga is mostly in the form of solar energy for hot water supply and it is commonly used by both households and commercial premises. There are proposals to install wind monitoring towers on Rarotonga and Aitutaki and there are plans for a wind power generation project currently managed by the Energy Division of MOW with technical assistance provided by the South Pacific Islands Applied Geoscience Commission (SOPAC). The project has not started as yet.
2. Other Outer Islands
386. The power supply on the Outer Islands is administered by the Island Administrations which are responsible for management, operation and maintenance of the assets. OMIA also plays a part in the maintenance process including the overhaul of gensets and sometimes the coordination of parts procurement, on behalf of the Island Administrations. Diesel fuel for running the generators is purchased through tendering and annual contracts. The cost of the fuel is subsidized by the Government and at present OMIA facilitates the tender process.
387. In the Southern Group the main source of energy is diesel generators. Supply is available 24 hours per day on all islands except on Mitiaro where operations are only 19 hours per day. A wind power generation pilot project is currently being implemented on Mangaia; however, Energy Division advised that there are some technical problems with the pilot facility. Should the pilot be successful, there are plans to install more wind power generators in the southern islands. Solar power is used by some households for hot water services.
388. In the Northern Group a combination of diesel generators and solar energy are used. Diesel generators are also used as the back-up source. Reticulated electricity supply is available 24 hours per day only on Rakahanga. Service is 18 hours per day on Manihiki, Penrhyn and Nassau, and only 12 hours per day on Palmerston.
389. On Pukapuka the government precinct is supplied with reticulated electricity, and households use their own solar panels to meet their in-house needs. The system is way beyond its design life and many of those that were still useable were damaged by the March 2005 cyclones.
390. A small wind power generator is being installed on Rakahanga. All the material is on site and the project is now awaiting delivery of the turbines. The site is located near the coast in a wooded area. There are no wind speed records for the island. The efficiency of such a unit is questionable given the location and the fact that Rakahanga is within 10� latitude of the Equator.
D. Planning Criteria
1. Proposed Level of Service
391. Suggested minimum level of service standards that may be adopted for prioritizing power supply projects over the planning period are:
• All households to have a minimum of 18 hours per day electricity supply • Stand-by generator facilities to be available as back-up supply • 90-day fuel storage capacity to be provided • Power generating facilities to be adequately located and protected from cyclones • Power lines to be located underground to minimize risk from cyclone damage 392. The above criteria were discussed with stakeholders during the workshops and consultation meetings. There was a general concurrence with the criteria.

85
2. Demand Projections
393. The adopted planning criteria for the energy sector are included in Appendices 9 and 10.
3. Institutional and Policy Considerations
394. Institutional and policy considerations are discussed in detail in Part 2 – Institutional Analysis. An essential precursor to major investment is that a National Energy Development Strategy and Policy be in place. Without these, it is difficult to formulate a sustainable sector development plan.
4. Climate Change Adaptation
395. Climate change scenarios and adaptation needs are detailed in Part 3 – Climate Change. The key indications from the modelling are that there will be greater frequency of cyclones and strong winds and more intense rainfall events. The implications of these are primarily for the design of transformer supports structures and generator housings and possibly solar panel banks. The structures should be designed to the updated building codes to account for the greater wind loads predicted by the climate change models.
E. Needs Assessment
1. Asset Rehabilitation
396. A comprehensive rehabilitation and continuous maintenance program of the gensets and reticulation on the outer islands is a priority need. A rehabilitation program could be drawn up as part of an asset management plan for each island.
397. On Pukapuka there is urgent need to replace the solar batteries for the individual households. A study conducted by the UNDP/ENESCO in 2004 highlighted several options for upgrading the power supply in Pukapuka. The study showed upgrading of individual households to be the cheaper option for a 24 hour electricity supply using a photovoltaic system. This, however, places an unfair burden on households as the cost of batteries is expensive and that of electrical appliances which run on DC power is approximately three times the cost of similar units running on conventional AC power. There is also the option to assess the feasibility of having a centralized photovoltaic system for the island. The power generation would be managed by a Government agency.
2. System Operations Efficiency Improvements
398. On Rarotonga, where increasing demand has brought peak demand close to the capacity of the existing power station, the need for a second power station is apparent. TAU are allocating resources to this purpose.
399. Apart from Rarotonga and Aitutaki, there is a need to improve the efficiency of operation of power stations on the other islands. This can be achieved through appropriately upgrading the generation setup, and up-skilling of the staff involved with the management, operation and maintenance of the power station and associated facilities.
400. In view of the low loading rate on Penrhyn there is a need to replace the existing 25 kW and 35 kW gensets with say three 15kW units to improve operational efficiency.
3. Training
401. There are usually one or two technicians/mechanics on some of the outer islands who are responsible for the operation and maintenance of the power supply system. Their skill level, however, is limited to routine maintenance and basic repairs. They are also

86
constrained by the lack of proper tools and spare parts apart from basic items. Consequently, breakdowns require mobilizing technicians from Rarotonga or sending the equipment to Rarotonga for repairs and overhaul. Both alternatives are subject to scheduled shipping transport timetables and can mean delays of weeks or months.
4. Research
402. The Energy Division of MOW is currently facilitating research into the use of renewable energy sources as a means of supplementing the existing systems in place. These energy sources include the well established forms of solar and wind energy. The research should be extended into covering emerging technologies such as energy derived from ocean currents, waves and tides. It is noted with interest that recent trials with ocean current generators indicate electricity yields of up to 2.5 MW per hectare could be achieved. Given the abundance of oceans in the Cook Islands, this form of energy is a very promising alternative to the traditional oil-based energy sources, which have to be imported.
403. To take full advantage of global research by organizations which have greater technical and financial resources than CIGOV, it is suggested that strategic partnerships be formed with leading institutions to carry out joint-research into identifying technically feasible and financially viable alternative energy sources in the Cook Islands, especially those that are based on the ocean as the source of energy.
404. One of the difficulties with the wind generators is the integration of the wind-derived electricity and that of the main grid. Most systems have been designed for scenarios where the wind generator provides a small load into a grid which is much bigger. However, on small systems such as the one in Mangaia, wind gusts could generate a big surge of electricity that is possibly comparable or even bigger than the capacity grid, thus potentially causing shutdowns and damage to equipment. A more effective means of linking the wind generator into small systems needs to be explored.
F. Sector Development Strategy
1. Short Term
405. A recommended list of energy sector projects necessary in the next 5 years is presented in Table 23, together with capital and annual operation expenditure estimates, land requirements and climate change adaptation works. A profile sheet for each identified project is included in Appendices 5 and 6 – Project Profiles and Prioritization Process and a project adaptation brief is included in Part 3 – Climate Change. Attention is drawn to the fact that priority projects planned by TAU, notably the construction of a second power station on Rarotonga, have not been included in the ranking exercise. This is due to the planning approach agreed with the CIGOV, where funding requirements for State Owned Enterprises (such as TAU) are considered separately to those to be funded through CIGOV direct allocation or via aid agency funding. However, the immediate need for the second power station is in no way de-emphasized by its exclusion from the ranking process. The need to increase generation capacity on Rarotonga to maintain an adequate margin of safety above current peak demand is strongly apparent.
406. As can be seen from Table 23, focus in the short-term is on service delivery improvements through repair or optimization of the performance of the power generating capacity on the outer islands and increasing the safety through standardization of the wiring. The major work would involve replacing the generators on Aitutaki and upgrading the distribution system on Atiu.
407. The total CAPEX of the recommended projects is $2.43 million. However, three of the six capital works projects are already committed with commencement pending release of funds from the 2006/07 budget. The committed projects account for $0.98 million out of the

87
total capital works in the sector. The annual OPEX for O&M of the recommended projects has been estimated at $0.18 million. The estimated cost increment for ensuring that the works are adapted to the predicted climate change conditions is of the order of $80,000.
408. In addition to the capital works, two studies are recommended. These are also shown in Table 23. The Pukapuka feasibility study is to ascertain the most economically attractive option to replace the existing dilapidated system. The study should include comparison of central versus on-site systems with consideration of the economic impact for both households and the government. The other study would be to test one of the ocean current generators under local conditions on Rarotonga over a period 12 months. Both studies are prerequisites for further investment in the medium term. The estimated cost of these studies is approximately $1.0 million.
409. Apart from the above capital works, it is recommended that an ongoing program be initiated comprising the projects indicated in Table 24. These projects are essential for sustainable operation and are designed to promote energy conservation by the public, monitor operational performance of the systems, build capacity and enhance the skills of the operators, and to periodically upgrade the national energy development strategy. When annualized, the estimated cost of these projects is equivalent to approximately $1.0 million per annum.
Table 23: Summary of Suggested Projects in the Energy Sector – Short Term Project Cost Estimate ($
million) Land
Required Climate Change
Adaptation
ID1/ Name CAPEX2/ OPEX (per
annum)
(Yes/No) PAB Prepared (Yes/No)
Cost increment ($ million)
Capital Works
Aitutaki electricity generator replacement*
0.90 No No None
Rakahanga stand-by generator repair*
0.03 No No None
Rakahanga wind power generator erection*
0.05 No No None
ENW01PYE Exchange of Penrhyn generators
0.03 No No None
ENW02NAT Outer islands electrical wiring standardization program
0.22 0.01 No No None
ENWO8AIU Atiu electricity supply distribution system upgrade
1.20 0.17 No Yes 0.08
Sub-total Capital Works
2.43 0.18 0.08
Studies
ENS01PZK Pukapuka solar power feasibility study
0.10

88
ENS02RAR Rarotonga ocean current pilot study
0.90
Sub-total Studies 1.00
Total Energy Sector Short Term
Projects
3.43 0.18 0.08
Notes: 1. Projects with ID have project profile sheets included in Appendices 5 and 6 –Project Profiles and Prioritization Process
2. Land costs are not included in CAPEX 3. Projects marked with * already have funding approved and are pending the Fiscal Year 2006/07 budget release 4. A further project of importance in the short term but not included in the ranking process is the design and construction of a second power station on Rarotonga – EW10RAR.
Table 24: Summary of Suggested Ongoing Projects in the Energy Sector
Project ID Name
OPCB04EN National public awareness campaign on electricity use minimization OPCB08EN Periodic skill upgrade and training of electricity supply system operators and
technicians OPPS09EN Periodic update of electricity supply master plan on each island OPPS10EN Periodic update of national energy development strategy (10-year intervals) OPPS11EN Pilot projects on emerging renewable energy sources
2. 2. Medium Term
410. The suggested projects required in the medium-term (the period 5-10 years from present) are summarized in Table 25. The effort during this period should be on improving the power distribution capacity on the outer islands and the construction of a new power station.
411. The CAPEX estimate of the projects is $42.4 million over the 5-year period; of which over 80% for is the new Rarotonga power station. As the investment cost of the new plant would be so large, TAU would be unlikely to be able to raise the funds it needs so that CI Government many need to act as the guarantor. The associated yearly OPEX of the projects is approximately $2.32 million. The estimated cost increment for ensuring that the works are adapted to the predicted climate change conditions is of the order of $400,000.
412. As TAU, APS and the Island Administrations collect tariffs for the delivery of electricity to their consumers there would be at least some, if not full, cost recovery.
413. Infrastructure development and investments on Rarotonga are being managed by TAU. Therefore, such energy projects are not included for funding by Government under the sector master plan, with the exception of the second power station as discussed previously. However, project profile sheets have been prepared for the key projects and are included in Appendices 5 and 6 – Project Profiles and Prioritization Process and a summary of this is presented in Table 26. The CAPEX of the outlined TAU projects is over the next 10 years (i.e. short plus medium term) is $27.11 million. The associated OPEX is $1.28 million which is funded out of TAU’s revenue.
3. Long Term
414. In the long-term, beyond the next 10 years, there will be a need to conduct a national program to replace generators on the outer islands with fuel efficient models. The cost of

89
such a program would be of the order of $1.5 million. The timing for the upgrades of would depend on demand and the condition of the assets.
G. Energy Sector Performance Monitoring
415. Apart from the annual system audits, the following parameters could be measured and recorded on a yearly basis as indicators of the performance of the sector.
416. For islands with public electricity supplies:
• Service area coverage – how many people have access to electricity; • Hours of supply per day • Cost of delivery of service ($/kWh) • Percentage of time power outages occur.
H. Key Recommendations for Institutional Strengthening
417. For sustainable and efficient management of the sector, it is important that institutional structures are put in place with clearly defined responsibilities and functions. This needs to be complemented by capacity building and institutional strengthening within the key agencies and that a culture of ongoing skill upgrade is established in the agencies. A detailed analysis of the energy sector is included in Part 2 – Institutional Analysis. The key points and recommendations are summarized as below.
1. Policies and Goals
418. Government should commission a review of the National Energy Policy immediately after the development of a National Energy Development Strategy. The review should include a cost recovery study that would assess tariffs on Rarotonga and the Outer Islands, identify options on tariff structures, and develop policies on subsidizing electricity supply on the outer islands.
419. Government should adopt a long-term policy or goal to change over to renewable forms of energy and gradually phase out, or at least reduce, the reliance on oil fuel as the primary source of electricity generation. The National Energy Division should be allocated its own annual budget. It should also enter into strategic partnerships with international institutions such as universities to pursue research and piloting of sustainable alternative energy sources from local resources.
420. A technical committee should be established to evaluate and advise on alternative energy options and strategies so as to decrease the reliance on fossil fuels. Representation from the relevant government agencies, the private sector and civil society should be invited to participate on the committee.
2. Institutional Restructuring
421. OMIA‘s role in the energy sector should be changed to one of a coordinating function between the Island Administrations, TAU and the National Energy Department. TAU and OMIA should nominate staff and develop liaison procedures through a memorandum of understanding to be signed by TAU, OMIA (on behalf of IAs) and MFEM.

90
Table 25: Summary of Suggested Projects in the Energy Sector - Medium Term Project Cost Estimate ($ million) Land Required Climate Change Adaptation
ID1/ Name CAPEX2/ OPEX (per annum)
(Yes/No) PAB Prepared (Yes/No)
Cost increment ($ million)
Capital Works
ENW03RAR Pukapuka electricity supply upgrade 2.50 By HH No No None
ENW04RAR Southern islands electricity supply systems rehabilitation program
1.20 0.17 No No None
ENW05RAR Northern islands electricity supply systems rehabilitation program
1.00 0.18 No No None
ENW06RAR Electricity supply system upgrades on Manihiki and Rakahanga
0.80 0.11 No No None
ENW07SGI Mangaia electricity supply system upgrade 0.40 0.06 No No None
ENW09AIT Aitutaki high voltage electricity supply distribution system upgrade
1.50 0.20 No Yes 0.03
EMW10SGI Construction of second Rarotonga power station 35.00 1.60 Yes Yes 0.40
Total Energy Sector Medium Term Projects 42.40 2.32 0.40
Notes: 1. Projects with ID have project profile sheets included in Appendices 5 and 6 –Project Profiles and Prioritization Process 2. Land costs are not included in CAPEX

91
Table 26: Summary of TAU Planned Projects in the Energy Sector - Short to Medium Term Project Cost Estimate ($ million) Land Required Climate Change Adaptation
ID1/ Name CAPEX2/ OPEX3/
(per annum)(Yes/No) PAB Prepared
(Yes/No) Cost increment
($ million) Capital Works under TAU Capital Expenditure Funding ENW11RAR Rarotonga power station site improvements 0.76 0.02 No No None ENW12RAR Rarotonga power station generator engine no. 8
replacement 4.30 0.22 No No None
ENW13RAR Rarotonga power station generator engine no. 9 replacement
4.50 0.22 No No None
ENW14RAR Rarotonga power station generator no. 1 replacement 5.00 0.25 No No None ENW15RAR Rarotonga power station generator no 2 replacement 5.00 0.25 No No None ENW16RAR Rarotonga auxiliary plant upgrade 0.58 0.02 No No None ENW17RAR Rarotonga high voltage system improvements 1.76 0.04 No No None ENW18RAR Inave substation upgrade 0.59 0.01 No No None ENW19RAR Rarotonga electricity system metering works 0.19 0.01 No No None ENW20RAR Rarotonga high voltage equipment diagnostic and
condition assessment 0.24 0.01 No No None
ENW21RAR Rarotonga transformers replacement program 0.68 0.04 No No None ENW22RAR Rarotonga field facilities and vehicle fleet replacement
program 0.64 0.03 No No None
ENW23RAR Rarotonga instrumentation and asset management system upgrade
0.92 0.05 No No None
ENW24RAR Rarotonga electricity distribution mains protection and isolation works
0.16 0.01 No No None
ENW25RAR Rarotonga substation low voltage boards replacement
0.09 0.01 No No None
ENW26RAR Betela and Garnier substations upgrades 0.24 0.01 Yes No None ENW27RAR Rarotonga high voltage cable replacement program 0.73 0.04 No No None ENW28RAR Rarotonga system maintenance works 0.22 0.01 No No None ENW29RAR Rarotonga information technology equipment upgrade 0.41 0.02 No No None ENW30RAR Rarotonga administration system vehicle replacement
program 0.10 0.01 No No None
Total Energy Sector Medium Term Projects 27.11 1.28 - Notes: 1. Projects with ID have project profile sheets included in Appendices 5 and 6 –Project Profiles and Prioritization Process
2. Land costs are not included in CAPEX

92
3. Operational Efficiency Improvements
422. A demand management and safety awareness campaign should be undertaken in both English and Maori languages to educate the public of ways that it could lower the household electricity bill through selection of energy-efficient appliances and making behavioral changes in electricity use. This would have the added benefit of reducing the cost of production and so lower the fuel import bill.
423. As a matter of priority, PDU should commission TAU to conduct a safety audit of all electricity generation and distribution systems on the outer islands, except for Aitutaki, and undertake works necessary to ensure that all such systems meet accepted safety standards.
4. Outsourcing of Work and Private Sector Involvement
424. Funds should be made available on an annual basis for TAU to be contracted to ensure compliance with standards and reliable delivery of electricity on the outer islands on a fee for service basis. Staff from TAU should make at least two visits a year to each island. Where appropriate, TAU should outsource the work to the private sector.
425. The overhauling of outer island electricity generation equipment should be outsourced to the private sector. CIIC should assist OMIA in undertaking a due diligence of the assets of the workshops for leasing or sale.
426. In the short to medium term, it is recommended that a pool of electricians be established who could be called upon at short notice to repair breakdowns on the outer islands. As travel to the outer islands is difficult and subject to flight availability, prepaid tickets could be purchased annually. In the longer term, it is hoped that there will be an electrician available on all of the islands.
5. Capacity Building and Human Resource Development
427. A multi-pronged training program should be introduced to increase the skill level of the staff on the outer islands. This should comprise a combination of on the job training, a twinning or staff exchange program with TAU and/or other utilities in the region, and formal skill upgrade courses conducted on Rarotonga.
428. A long-term strategy should also be adopted to attract students form the outer islands to become electricians through a school star program.
VIII. SANITATION SECTOR
A. Sector Overview
429. There has been a good improvement in sanitation since 1991 and by 2001 about 80% of the households nationwide had access to flush toilets. Lagoon toilets have all but disappeared and even the use of pit latrines has generally declined with both being replaced by more hygienic and environmentally friendly systems. However, as in the water supply sector, there is a disparity between the quality of service on Rarotonga and the Outer Islands 17. Health statistics imply that a lack of hygiene is still significant on the Outer Islands, especially in the Northern Group. More than two thirds of the skin sepsis and a third of the reported diarrhea cases in the Cook Islands are from the Northern Group. The country is expected to reach its Millennium Development Goals of all of the population having access to hygienic sanitation facilities. The more relevant issue is the standard of that service.
17 Cook Islands Millennium Development Goals National Report, June 2005

93
430. The sanitation sector has the noticeable distinction of being the only sector not receiving any funds for capital expenditure in fiscal year 2005/06 either from the general government budget or donors18. This is not to say that all is well and no further developments are needed. Rather, it highlights the low priority allocated to the sector by the government and the lack of demand by the community.
431. The sector suffers from poor understanding of the nature of the health and environmental risks associated with the lack of proper sanitation facilities. At the community level people still see waste as a “throw away product” and they do not make the link between personal hygiene, environmental contamination and inadequate facilities. In turn, at the government level, this lack of appreciation is reflected in the fact that three government agencies have responsibility over the construction of sanitation facilities, yet none have the policy ownership. There is a widespread philosophy that sanitation is primarily a private responsibility and for this reason, government involvement in sanitation is a low priority. Residential and commercial establishments are expected to build their own on-site wastewater treatment systems and conform to poorly enforced public health regulations. In summary, there is a need for an extensive awareness campaign about health and hygiene at all levels which will generate demand for the service and appropriate levels of funding.
B. Objectives
432. The CI Government objectives in the sanitation sector are to provide basic facilities to all households in the Cook Islands which will minimize the health risks associated with poor hygiene and mitigate adverse environmental impacts. The NSDP targets directly affecting infrastructure development are summarized in Appendices 9 and 10.
433. The aim in the sanitation sector under this project is to establish an investment program that will enable the Government to reach its stated objectives through the construction of appropriate infrastructure that will allow the management of wastewater in an environmentally sustainable manner and will raise the public awareness about the need for sanitation and hygiene.
C. Existing Status
434. Existing sanitation assets and their condition on each island and observations made during the field visits under this project are summarized in Appendices 9 and 10. A brief description of the existing status of wastewater management in Rarotonga and the outer islands is presented below.
1. Rarotonga
435. Nearly all households on Rarotonga have septic tanks for the treatment and disposal of their liquid wastes. All wastes are passed through the tanks without any attempt to reduce the load through separation of black (toilet and kitchen) and grey water (bathroom, laundry). Treated effluent is disposed via absorption or soakage beds. Septic sludge (septage) is cleaned out infrequently when households notice that the system is not working either because of blockage, excessive odors or waterlogging of the disposal area – all indicators that the tanks should have been cleaned out a long time ago. Maintenance and de-sludging of the tanks are the responsibilities of the owner, and are not mandatory by regulation. The cost of pump out of septic tanks is borne by the owner.
436. Some of the larger commercial premises such as hotels have small package treatment plants that provide secondary level of treatment of the wastewater before
18 Cook Islands Appropriation Amendment Act 2005-2006

94
discharging into the environment – usually the lagoon. The performance of these on-site systems is not monitored by any of the government agencies.
437. A small pilot sewerage system with a package treatment plant serves about 50 households in Tereora and Tepuka. The plant is in need of some maintenance as neighbors report odors emanating from the plant from time to time. The collection system is some 30 years old and leaking. Discharge of treated effluent is into the storm water drainage system. CIIC has commissioned MOW to prepare a detail design for the rehabilitation of the system.
438. A new septage treatment facility funded under an ADB loan (Waste Management Project) has just been completed. The septage plant or ponds is located just downhill of the new municipal landfill site at the Rarotonga Waste Facility in Arorangi. Reclaimed water from the plant is discharged to the nearby creek. The plant capacity is adequate to treat all septage generated on the island over the next 15 years or so. As part of that project a septage management plan was prepared for Rarotonga in 2004, but to date the plan has not yet been implemented.
439. Public Health Department, the agency taking the initiative with managing domestic sanitation, advised that its health inspectors visit and inspect all properties on a 6 monthly basis, but at this stage they do not check on the performance or condition of the septic tanks and disposal fields.
2. Outer Islands
440. The situation on Aitutaki is similar to that on Rarotonga. A septage plant or ponds, funded under the same ADB loan (Waste Management Project), has been commissioned and is awaiting a vacuum truck to empty septic tanks. As the island also has a thriving tourism industry there are several hotels, each with its own on-site package treatment plant. Residents rely on domestic septic tanks and absorption fields for their wastewater management.
441. Pit latrines are the dominant form of onsite wastewater systems on the other islands of the Southern Group, except on Mitiaro where all but 10% of the households have upgraded to septic tanks. On Mauke some 90% of households still use pit latrines. None of the islands have a septage treatment facility and tanks are only cleaned out once they are full. Cleaning out usually involves emptying the tank and burying the sludge in the ground nearby without any form of treatment or leaching prevention.
442. On the islands of the Northern Group the extensive damage caused by the recent cyclones has been a catalyst for upgrading onsite wastewater management facilities. Today, the majority of households use septic tanks with soakage fields for effluent disposal however pit latrines are also used to a lesser extent. Lagoon toilets are still in usage only on Manihiki, but they too are gradually being replaced by septic tanks. As in the Southern Group, there are no septage treatment facilities (except for Aitutaki) on any of the islands and accumulated septic tank sludge is disposed of in the same manner.
D. Planning Criteria
1. Proposed Level of Service Standards
443. Suggested standards for minimum levels of service that may be adopted for prioritizing sanitation projects over the planning period are:
• All the population has access to hygienic facilities • Facilities do not pollute the water supply sources (particularly in the case of
groundwater being the source of supply) • Septage (septic tank sludge) treatment facilities exist on each island

95
444. The above criteria were discussed with stakeholders during the workshops and consultation meetings. There was a general concurrence with the criteria.
2. Load Projections
445. The adopted planning criteria for the sanitation sector are included in Appendices 9 and 10. For planning purposes, the daily per capita wastewater generation rate is assumed to be 85% of the water demand. Therefore, on Rarotonga 210 L/c.d was assumed and on the outer islands 125 L/c.d was adopted. Based on these assumptions and the population projections in Table 7, the projected wastewater generation rates on each island are presented in Table 27.
3. Institutional and Policy Considerations
446. Institutional and policy considerations are discussed in detail in Part 2 – Institutional Analysis. An essential precursor to major investment is that the institutional arrangements for the sector be defined and put in place. The current situation appears to be based on “who wants it” can do it. If centralized systems are to be put in place on Rarotonga, there will be a need for clearly defined institutional roles for policy and planning, implementation, and regulation/policing. Without such measures it is difficult to formulate a sustainable sector development plan.
4. Climate Adaptation
447. Climate change scenarios and adaptation needs are detailed in Part 3 – Climate Change. The impacts will be similar to that in the water sector. The key indications from the modelling are that more rainfall will occur, however, it will be more intense with longer dry spells. The implications of this are primarily for the design of on-site effluent disposal systems and sewage collection systems. Saturation of effluent absorption beds will cause surface overflows and so pose an increased health risk to the public. Sewerage design will need to include measures to minimize storm water inflows.

96
Table 27: Wastewater Generation Projections
2006 2016 2006 2016
Rarotonga 18,250 23,820 3,833 5002
Southern Group IslandsAitutaki 2,760 3,400 345 425Mangaia 740 740 93 93Atiu 710 760 89 95Mauke 570 630 71 79Mitiaro 230 230 29 29ManuaeSub-total SGI 5,010 5,760 626 720
Northern Group IslandsPalmerston 50 50 6 6Pukapuka 670 670 84 84Nassau 80 80 10 10Manihiki 500 670 63 84Rakahanga 160 160 20 20Penrhyn 360 360 45 45Suwarrow 10 10 1 1Sub-total NGI 1,830 2,000 229 250Total 25,090 31,580 4,688 5,972
Island PopulationWastewater
Generation (m3/d)
E. Needs Assessment
1. Health Risk Reduction
448. The high number of cases of skin sepsis, diarrhea and other water-borne diseases suggests that, together with unsafe water, sanitation and hygiene are still important issues that need addressing in the northern islands. In terms of sanitation, the installation of flush toilets in all households should be made a national target, and regular de-sludging of septic tanks made compulsory and auditable. The de-sludging of tanks should be carried out every two years, or more frequently if the need arises, to ensure proper performance. The practice of shovelling out sludge from septic tanks and burying nearby should also be discouraged as the practice is a health risk to the person carrying out the task.
449. The routine inspection of properties by health inspectors should include a cursory visual check of the septic tank and disposal area for signs of poor performance. The findings should be reported to the owner and responsible agency for follow up actions. The measures above would help to reduce risk to public health from the sanitation systems.
2. Environmental Impact Mitigation
450. Because septic tanks provide only primary treatment (mostly removal of solids and some reduction in biochemical oxygen demand or BOD) and there is little further purification of the septic tank effluent through the coral sand, a lot of the nutrients find their way into the underlying water table and eventually the lagoon. On Rarotonga this, combined with general rainfall runoff from urbanized and agricultural land, has led to a situation where algal blooms are noticeable in the lagoon from time to time. Poisoning from eating fish caught in the

97
lagoon is on the increase as well. These are signs that the absorptive capacity of the lagoon is being exceeded and measures need to be taken to reduce the amount of waste entering the lagoon. The effects of effluent seepage into the lagoons were also noticed in Rakahanga. Therefore, at least in flat coastal areas, the use of absorption beds for the disposal of treated effluent and/or primary treatment alone is considered inappropriate and contributes to environmental degradation.
451. The above problem is also relevant to the islands of the Southern Group where groundwater is used as a primary source of water supply and hence potential contamination of the water table is a concern. While the typical depths to the aquifers are in excess of 10 m, the highly porous coral sand offers little additional treatment for the percolating effluent. This is especially relevant in areas where pit latrines are used as these units do not treat the raw sewage. It is recommended that pit latrines be gradually phased out in favor of septic tanks and absorption or evapo-transpiration beds.
452. The islands of the Northern Group are flat atolls with small land area and low elevations. Consequently, fresh water accumulates as a lens under the atolls at depths typically 2-5 m below the surface. As such, these lenses are susceptible to contamination from land-based activities such as effluent discharge from pit latrines and septic tanks. The highly porous coral sand on the atolls provides negligible additional treatment for the infiltrating effluent. Therefore, as in the coastal areas of Rarotonga, the use of absorption areas for the disposal of treated effluent is considered unsuitable and a potential source of contamination to the water lenses.
453. Alternatives that would be more appropriate to coastal areas and atolls include effluent disposal by evapo-transpiration and improving the quality of the effluent through secondary treatment. Under the former, the absorption trenches could be modified to serve as evapo-transpiration beds relying on evaporation and plant uptake of the effluent rather than absorption into the soil below. The system would still be susceptible to overflows during heavy rainfall periods, but then dilution of the overflow would mitigate the adverse impact. The overall effect on the environment would still be beneficial since in the dry seasons partially treated effluent would not enter the water table or the lagoon. The second option would be to change over the septic tanks to more advanced treatment units which provide nutrient removal and disinfection. This, however, would be costly and would require skilled maintenance technicians who are currently in short supply in the Cook Islands.
454. The use of composting toilets is frequently cited as a potential alternative to septic tanks and pit latrines. While composting toilets offer a definite advantage in terms of reduced volume of liquid waste, the biggest draw back of the system is the high maintenance requirement. Most householders would not be committed to the intensity of maintenance needed. Having said that, the weakness is one of user attitude rather than technology. Therefore, it is recommended that a composting toilet pilot study be conducted to gauge community/user attitude and to ascertain whether lasting habits can be instilled in households. Success in Vanuatu indicates there is potential for the system to work in the Cook Islands as well.
455. There is insufficient data on the impact of wastewater discharges on the groundwater table and the environment. It is suggested that a national program be commenced to periodically check groundwater and lagoon water quality on all of the islands. Annual sampling would be adequate on the outer islands, but due to the higher population and the greater potential threat, the lagoon on Rarotonga could perhaps be checked 6 monthly.
3. Rarotonga Wastewater Management Strategy
456. The population densities of the village areas of Avarua, Arorangi and Muri and their proximity to the lagoon warrant consideration of centralized sewerage systems. A feasibility study is required to establish the extent of service coverage, the most appropriate treatment

98
processes and effluent management, and the economic viability and financial sustainability requirements of such a scheme. The location of the treatment facilities and the mode of treated effluent disposal will be socially sensitive issues which will require extensive community consultation. In fact, it is strongly recommended that community consultation and participation be made a central feature of the project from the outset. Experience from other countries suggests that if the community does not take ownership of the project its attitudes will not be supportive, and there would be a high probability of failure of the scheme.
457. Effluent disposal is a controversial issue, but if it is appreciated that the Cook Islands includes nearly 1.82 million km2 of territory of which only some 240 km2 is land, than it becomes obvious that the scarce resource for habitation is land, not water. Therefore, provided that the wastewater is adequately treated, disposal of the treated effluent to sea beyond the reef, where there are ample depths and ocean currents for dilution and dispersion, is a practical disposal option. Inland disposal would bring up land issues and require pumping. It is also noted that due to the abundance of water on Rarotonga the need for reuse is reduced compared with that on the smaller outer islands.
458. In inland areas away from the coast, use of septic tanks and absorption beds is acceptable and should be continued. However, for the reasons mentioned in the section on Environmental Impact Mitigation, it is suggested that in the coastal areas which are not to be connected to a centralized sewer system, absorption trenches be modified for use as evapo-transpiration beds or the septic tanks be replaced by more advanced treatment units. The latter option would have large capital and O&M cost implications – it would place a large cost on households, especially those who recently invested in upgrading their septic tanks, and would need trained technicians for regular maintenance. The evapo-transpiration bed option is considered as a reasonable interim solution suitable for the short to medium term. The treatment unit upgrade will be better in the medium to long term and should also be mandatory for new developments in the coastal zone as it is cheaper to install as part of an integrated site development than retrofitting an existing developed site.
459. Irrespective of the form of on-site systems adopted, the disposal of effluent should be modified to divert some of the effluent away from the disposal bed to a drip irrigation system thus making beneficial use of the nutrient-rich water. This would comprise small diameter polyethylene pipeline, drip tubes and possibly a small solar powered pump if the topography does not allow gravity operation. The net effect would be a reduction in the amount of effluent discharged to the environment and better plant growth. The system is widely used by hotels which practice a zero-discharge policy by reusing all of the treated effluent for plant watering.
4. Septage Management Plan
460. A National Septage Management Plan by Maunsell Ltd of New Zealand (Design Engineers for the Waste Management Project has been developed in 2004 under the ADB-loan for the Waste Management Project. The plan calls for regulating the periodic pump out of the septic tanks. It is recommended that the plan be put in force as a matter of priority.
5. Biosolids Management Plan
461. There is no residuals (or biosolids) management plan for the sludge from the septage treatment ponds on Rarotonga or Aitutaki. As the septage ponds are not expected to need de-sludging for 5-7 years, there is ample time to develop a biosolids management strategy. In the interim, MOW intends to dispose of the accumulated residuals in the nearby sanitary landfill. There are a number of options that are worthwhile investigating as part of the ultimate strategy including composting of the residuals for reuse: as soil conditioner on Rarotonga and Aitutaki, to make soil supplement for other islands with poor soils and possibly engineering landfill. It is recommended that the feasibility of such reuse be

99
investigated and candidate options trialed. A biosolids management plan needs to be developed and put in place within the next five years.
462. As previously mentioned in the section on Environmental Impact Mitigation, on the outer islands people bury the raw septage in a pit. However, these residuals are a valuable resource that could help to improve the poor soils of the northern islands. The septic tank residuals could be recycled by composting to turn them into a soil supplement which when combined with bark mulch and compost from household food scraps, could potentially produce fertile soil in significant quantities over a few years. The product could be used for the hydroponic plants in the short-term.
6. Sanitation Facilities for Emergency Centers
463. The Emergency Management Centers (EMC) need adequate sanitation facilities in the event that people need to stay there for prolonged periods, say 3-5 days. It is during such events that community diseases, like typhoid, are most likely to break out due to overcrowding, unhygienic environment and lack of sanitary facilities. In order to minimize this risk, the septic tank at the EMC should be made flood proof to prevent it being inundated during intense rainfall or storm surges. The treated effluent could be discharged to a holding pond with capacity equivalent to the expected waste generation from the evacuees for 3-5 days. The pond would require banks of sufficiently height to minimize the risk of inundation and overflows. It may be necessary to use a small stand-by pump for transferring the treated effluent into the pond.
7. Community Awareness Campaign
464. There is an urgent need to increase community awareness of the need for sanitation and personal hygiene. An ongoing public education campaign is required which could comprise information on what kinds of wastes can and cannot be put in septic tanks, the impact on the environment and health risks associated with poorly functioning systems and what the householder can do to maintain the system in good condition. The hygiene awareness program is needed to educate the people about the health benefits of good personal hygiene. The ongoing campaign should be started immediately and repeated periodically
8. Developing Plant Operator and Maintenance Skills
465. With the introduction of new technologies for wastewater management, such as the neighborhood treatment plants in Rarotonga and the more advanced systems for use by households in environmentally sensitive areas, there will be a need for a pool of skilled operators who can audit, maintain and repair such systems. As training of licensed operators takes at least 12 months, the training process should be commenced once the feasibility studies have been approved for implementation.
F. Sector Development Strategy
1. Short Term
466. A recommended list of sanitation sector projects necessary in the next 5 years is presented in Table 28, together with capital and annual operation expenditure estimates, land requirements and climate change adaptation works. A profile sheet for each identified project is included in Appendices 5 and 6 – Project Profiles and Prioritization Process and a project adaptation brief is included in Part 3 – Climate Change.
467. As can be seen from Table 28, the focus in the short-term is on improving the environment in the most densely populated villages on Rarotonga by the installation of centralized wastewater collection, treatment and disposal systems. These projects will

100
alleviate some of the urgent sanitation-related issues on the island, notably the pollution of the lagoon and the Tereora-Tepuka system.
468. The total CAPEX of the two recommended projects is $4.80 million, and the annual OPEX for O&M of is an estimated at $0.27 million. The estimated cost increment for ensuring that the works are adapted to the predicted climate change conditions is of the order of $150,000 or about 3% of the total investment.
469. In addition to the capital works, eight studies are recommended. These are also shown in Table 28. Two are feasibility studies for the recommended village sewerage schemes and as such are prerequisites for commencement of these schemes. The studies should include the feasibility of providing sewerage systems in the identified areas, appropriate treatment technologies, purified effluent disposal, and user charges. In addition, it is recommended that pilot studies be conducted on the effectiveness of evapo-transpiration beds, acceptance of composting toilets and for residuals to soil conversion facilities before any full-scale investment are made in these processes. The other two studies are to develop national planning criteria and a national residuals management plan. The estimated cost of these studies is approximately $1.2 million.
470. Apart from the above capital works, it is recommended that an ongoing program be initiated comprising the projects indicated in Table 29. These projects are essential for sustainable operation and are designed to monitor operational performance of the systems, build capacity and enhance the skills of the operators, and to periodically upgrade the residual, septage and wastewater management plans. When annualized, the estimated cost of these projects is approximately $0.36 million per annum.
Table 28: Summary of Suggested Ongoing Projects in the Sanitation Sector Project Frequency Cost
Estimate
ID Name ($ million)
OPMP06SN Monitor implementation of national septage and biosolids management plans
Annual 0.05
OPMP07SN Annual wastewater systems operation and management performance audits
Annual 0.15
OPCB06SN Periodic skill upgrade and training of wastewater system operators and technicians
Tri-annual 0.06
OPPS06SN Review and update national septage and biosolids management plans
5-yearly 0.10
OPPS07SN Periodic update of wastewater management plans for Rarotonga and Aitutaki
5-yearly 0.60
2. Medium Term
471. The suggested projects required in the medium-term (the period 5-10 years from present) are summarized in Table 30. The focus during this period should be on mitigating environmental impacts on the outer islands by constructing improved wastewater management facilities such as simplified septage ponds, as well as upgrading the sanitation facilities at the EMC on each island to reduce the potential health risks associated with extended stay in crowded area. The projects also include scaling up of the pilot studies should they prove to be effective.
472. The CAPEX estimate of the projects is $5.72 million over the 5-year period, most of which (almost 90%) is for treatment facilities on Rarotonga and Aitutaki. The associated yearly OPEX of the projects is approximately $0.32 million. The estimated cost increment for

101
ensuring that the works are adapted to the predicted climate change conditions is of the order of $280,000.
473. If a user charge of $0.8/m3 is assumed on Rarotonga and Aitutaki, the revenue generated from wastewater charges would be about $0.7 million per annum based on the waste generation in the four villages on Rarotonga (population 10,000) and the two villages on Aitutaki (population 1,000). This would more than offset the annual operating costs. A commercial septic tank emptying service currently exists, who discharge at the Rarotonga Waste Facility for a fee.

102
Table 29: Summary of Suggested Projects in the Sanitation Sector – Short Term Project Cost Estimate ($ million) Land Required Climate Change Adaptation
ID1/ Name CAPEX2/ OPEX (per annum)
(Yes/No) PAB Prepared (Yes/No)
Cost increment ($ million)
Capital Works
SNW01RAR Construction of Rarotonga village sewerage networks – Stage 1
4.50 0.24 Yes Yes 0.15
SNW03RAR Rehabilitation of Tereora-Tepuka neighborhood sewerage system
0.30 0.03 yes No None
Sub-total Capital Works 4.80 0.27 0.15
Studies
SNS01RAR Rarotonga village sewerage schemes feasibility study 0.30
SNS02NAT Development of national sewerage planning criteria and guidelines
0.10
SNS03NAT Development of national biosolids management plan 0.20
SNS04AIT Aitutaki wastewater management feasibility study 0.30
SNS05RAR Rarotonga evapotranspiration bed pilot study 0.15
SNS06MUK Mauke composting toilet pilot study 0.05
SNS07PYE Penrhyn evapotranspiration bed pilot study 0.06
SNS08PZK Pukapuka residuals to soil conversion pilot study 0.04
Sub-total Studies 1.20
Total Sanitation Short Term Projects 6.00 0.27 0.15 Notes: 1. Projects with ID have project profile sheets included in Appendices 5 and 6 –Project Profiles and Prioritization Process
2. Land costs are not included in CAPEX

103
Table 30: Summary of Suggested Projects in the Sanitation Sector – Medium Term Project Cost Estimate ($ million) Land Required Climate Change Adaptation
ID1/ Name CAPEX2/ OPEX (per annum)
(Yes/No) PAB Prepared (Yes/No)
Cost increment ($ million)
Capital Works
SNW02RAR Construction of Rarotonga village sewerage networks – Stage 2
3.50 0.15 Yes Yes 0.10
SNW04RAR Improvement of effluent disposal systems in foreshore areas of Rarotonga
No No None
SNW05AIT Construction of Aitutaki village sewerage networks 1.50 0.08 Yes Yes 0.08
SNW06SGI Review adequacy & upgrade sanitation facilities at EMC on southern islands
0.25 0.02 No Yes 0.03
SNW07SGI Construction of septage treatment facilities on the southern islands
0.12 0.02 Yes Yes 0.02
SNW08NGI Review adequacy & upgrade sanitation facilities at EMC on northern islands
0.20 0.02 No Yes 0.03
SNW09NGI Construction of septage treatment facilities on the northern islands
0.15 0.03 Yes Yes 0.02
Total Sanitation Medium Term Projects 5.72 0.32 0.28 Notes: 1. projects with ID have project profile sheets included in Appendices 5 and 6 –Project Profiles and Prioritization Process
2. Land costs are not included in CAPEX

104
3. Long Term
474. 373. As with the water sector, it is difficult to project sanitation asset needs beyond 10 years, particularly as population projections are also quite uncertain. Notwithstanding, a list of anticipated projects that will likely be required in the long-term are shown in Table 31. The focus on the period 10-20 years from now would be on upgrading and expanding the village sewerage schemes on Rarotonga and Aitutaki. As a general guide, upgrade of sanitation systems is required every 10 years or so to replace mechanical equipment and expand process units. Therefore, the actual need and timing for the upgrade of identified projects would depend on demand and condition of the assets.
475. 374. The estimate capital expenditure required during the 10-year period would be of the order of $8.5 million (in current prices).
Table 31: Summary of Suggested Projects in the Sanitation Sector – Long Term
Project Cost Estimate
ID Name ($ million)
Rarotonga village sewerage scheme expansion 7.00
Aitutaki village sewerage scheme expansion 1.50
Summary Sanitation Long Term Projects 8.50 G. Sanitation Sector Performance Monitoring
476. Apart from the annual sewerage system audits, the following parameters could be measured and recorded on an annual basis as indicators of the performance of the sector:
• Incidence of water-borne diseases; • Service area coverage – in villages with sewerage systems; • Frequency of de-sludging of septic tanks and this regulation being enforced; • Number of households with on-site sanitation systems • Are regulations for mandating the installation of on-site systems in place
H. Key Recommendations for Institutional Strengthening
477. For sustainable and efficient management of the sector, it is important that institutional structures are put in place with clearly defined responsibilities and functions. This needs to be complemented by capacity building and institutional strengthening within the key agencies and that a culture of ongoing skill upgrade is established in the agencies. A detailed analysis of the institutional issues within the Sanitation sector is included in the Municipal Services section of Part 2 – Institutional Analysis. Municipal Services covers the three sectors: Water, Sanitation and Solid Waste Management. The key points and recommendations are summarized as below.
478. Three options have been proposed for the institutional future of municipal services. Firm institutional recommendations are, at this time, highly contentious and beyond the scope of this TA.
479. Until such time as Government develops its National Economic Development Strategy (NEDS) and the relevant Government stakeholders take ownership and display a willingness to undertake responsibility and reduce fragmentation there is little hope of formulating, adopting and implementing a national policy for sanitation management.
480. The preferred option would be for the sector to maintain the status quo and cease policy and regulatory work within the sector until such time as a NEDS is approved. Government would then, on completion of the NEDS, undertake a comprehensive sector

105
wide review with a view to developing consolidated policy and regulations, reduce duplication, consolidate capacity and take note of international experience and lessons learned.
481. The doubtful validity of many of the indicators in business plans for services within the sector and the nature of associated targets and performance indicators are a reflection of ineffective management regimes, no clear ownership of policies and planning or regulation at the national level, the absence of a realistic vision for the future and associated economic and social goals. It is expected that the policy unit at OPM will provide leadership in the development of a consolidated municipal services policy including the sanitation sector. The Policy Unit will then be able to assist in the development of business and action plans with SMART19) indicators, reliable baseline data and realistic targets.
IX. SOLID WASTE MANAGEMENT SECTOR
A. Sector Overview
482. There have been some big improvements in the solid waste management sector in recent years with the commissioning of municipal landfill sites on the two most populous islands of Rarotonga and Aitutaki. Wisely, the CI Government is promoting waste separation and recycling. Despite these big improvements there is still much to be done, especially on the outer islands where solid waste is still either burnt or disposed at open dumps, often just behind the beach. The management of hazardous waste is an emerging problem that will need attention in the coming years. The CI Government set a target of 30% reduction in the waste disposed to landfill by the year 2010 under its Millennium Development Goals20 Overall, the sector is in a manageable state and with some modest investment and a good community awareness campaign, most of the infrastructure problems could be easily reduced.
483. Solid waste management is another sector with low budgets. In fiscal year 2005/06 only $30,000 was allocated for capital expenditure in this sector21. Perhaps it is in the wake of large investments in the sector with the two landfill sites and waste recycling station, and perhaps it also highlights the low priority allocated to addressing the same issues on the outer islands.
484. The performance of the sector as a whole is hampered by limited human resources and skills, a fragmented institutional structure and initiatives that lack inter-agency coordination and dialogue. This is evident in the outer islands where many works are carried out on an ad hoc basis in response to short-term needs rather than within a clear strategy framework. As with the other municipal service sectors, there is a need for institutional strengthening through a comprehensive sector policy review and operational efficiency improvement.
B. Objectives
485. The Cook Islands Government objectives in the sector are to provide communities with sustainable and appropriate waste management practices that will minimize public health risks and adverse environmental impacts. The NSDP targets directly affecting infrastructure development are summarized in Appendices 9 and 10.
486. The aims in the solid waste management sector under this project are to establish an investment program that will enable the CIGOV to reach its stated objectives through the construction of appropriate infrastructure that will allow solid waste to be managed in an 19 Specific, Measurable, Achievable, Relevant, Timely 20 Cook Islands Millennium Development Goals National Report, June 2005 21 Cook Islands Appropriations Amendment 2005-2006

106
environmentally sustainable manner and which will raise public awareness about the need for minimizing waste.
C. Existing Status
487. Existing solid waste management assets and their condition on each island and observations made during the field visits under this project are summarized in Appendices 9 and 10. A brief description of the existing status of solid waste management on Rarotonga, Aitutaki and the other outer islands follows.
1. Rarotonga and Aitutaki
488. New landfill sites on Rarotonga and Aitutaki, funded under an ADB loan, will meet the solid waste management needs of these islands in the medium-term. The sites are well engineered and operate relatively smoothly, although the cover of the Rarotonga site was damaged by the 2005 cyclones, that has now been repaired and reinstated as of the 1st week of November 2006. Refuse is collected from households twice per week on Rarotonga and fortnightly on Aitutaki. On Rarotonga the collection fleet comprises two trucks; one operational and one standby. On Aitutaki there is one truck for refuse collection.
489. There is also an active waste separation and recycling program under which plastic bottles and paper are collected, compressed and bailed for shipment to New Zealand. Scrap metal is collected separately on Rarotonga and shipped to Indonesia for recycling. Most households burn their green waste. It is interesting to note that about 8% of households on both islands separate their rubbish. However, typically it is combined during collection as all the garbage is dumped onto the trucks. On Rarotonga about 11% of the households also practise some form of recycling, but on Aitutaki recycling is only done by 3% of the households22.
490. The Rarotonga Waste Facility (comprising the landfill, septage ponds and recycling center on Rarotonga is the responsibility of MOW which outsources the work under a 12-month contract to the private sector. Both collection and landfill compaction are currently being carried out by the same contractor. On Aitutaki, the landfill and recycling facilities are operated by the NES and collection is contracted out to private sector .
491. The scrap metal collection on Rarotonga is carried out by a civic-duty minded private company largely by self-funding. The same company also operates a paper recycling facility which accepts paper waste from the public and commercial premises.23. This operation too is a private initiative and in fact is a larger operation than the public one at the Rarotonga Waste Facility.
2. Other Outer Islands
492. There are no engineered landfill sites on any of the other islands, except for Aitutaki. On the southern islands, waste is collected by the Solid Waste Section of the Island Administrations and taken to a central municipal dump site. Collection is typically weekly. Some form of waste separation is being introduced on all islands in the Southern Group.
493. In the Northern Group municipal dumps exist only on Manihiki and Rakahanga. On all other islands, households use private pits or burn the rubbish. Medical wastes, including needles, are either burned in 44-gallon drums or dumped at the rubbish tips. Notably, 14% of
22 Cook Islands Census 2001 23 Is operation of this facility more efficient than sending waste paper to New Zealand - especially considering sustainability issues with energy used in transport ? How is the recycled material used on the island?

107
the residents on Rakahanga separate their waste (the highest in the Cook Islands) and 8% practise recycling
D. Planning Criteria
1. Proposed Level of Service Standards
494. Suggested standards for minimum levels of service that may be adopted for prioritizing solid waste projects over the planning period are:
• Sustainable rubbish disposal facilities exist – either as on-island disposal or shipment off-island
• In the case of on-island disposal, waste is not causing health problems for community
• In the case of on-island disposal, waste is not polluting the water supply sources 495. The above criteria were discussed with stakeholders during the workshops and consultation meetings. There was a general concurrence with the criteria.
2. Solid Waste Generation Projections
496. The adopted planning criteria for the solid waste management sector including waste generation rates per type of household and characteristics are compiled in Appendices 9 and 10. For planning purposes the assumed daily domestic per capita waste generation rates were 0.25 kg/c.d on Rarotonga, 0.20 kg/c.d on Aitutaki and 0.15 kg/c.d on the other islands. The visitor waste generation rate on Rarotonga and Aitutaki was assumed to be 0.4 kg/c.d and 0.25 kg/c.d on the other islands. Based on these assumptions and the population projections in Appendices 9 and 10, the projected annual solid waste generated on each island are presented in Table 32. Note that the volume estimates shown in the table are for loose, uncompacted volumes. It is recognized that the projected volumes are slightly on the high side, but they are conservative and considered acceptable for national level master planning purposes.
3. Institutional and Policy Considerations
497. Institutional and policy considerations are discussed in detail in Part 2 – Institutional Analysis. There are two important and somewhat unique aspects to this sector in the Cook Islands. Firstly, the need for greater skill levels and a better understanding of the operation of such facilities. Secondly, in the Cook Islands, the solid waste sector offers a unique opportunity for not only a public-private partnership but also for a public-private and community partnership. The private sector initiatives in tackling the recycling of hazardous waste and now composting of green waste, together with a public willing to participate, offers a golden opportunity to develop a highly efficient sector.
4. Climate Change Adaptation
498. Climate change scenarios and adaptation needs are detailed in Part 3 – Climate Change. The impacts will be relatively minor. The key indications from the modelling are that there will be greater frequency of cyclones and strong winds and more intense rainfall events. The implications of these are primarily for the design of landfill operations. Adequate perimeter embankments and drainage should be provided to keep out lesser floods and sea surges and landfill operations should be covered in advance of any cyclone approaching the island. Above ground structures, such as sheds at baling and packaging facilities, should be designed to the updated building codes to account for the greater wind loads predicted by the climate change models.

108
Table 32: Solid Waste Management Generation Projections
2006 2016 2006 2016 2006 2016 2006 2016
Rarotonga 18,250 23,820 2,490 3,650 18,720 27,440 18,720 230,800
Southern Group Islands 0Aitutaki 2,760 3,400 290 280 2,180 2,110 2,180 21,450Mangaia 740 740 40 50 300 380 300 3,400Atiu 710 760 40 50 300 380 300 3,400Mauke 570 630 40 50 300 380 300 3,400Mitiaro 230 230 10 10 80 80 80 800ManuaeSub-total SGI 5,010 5,760 420 440 3,160 3,330 3,160 32,450
Northern Group IslandsPalmerston 50 50 0 0 0 0 0 0Pukapuka 670 670 40 40 300 300 300 3,000Nassau 80 80 0 10 0 80 0 400Manihiki 600 670 40 50 300 380 300 3,400Rakahanga 160 160 10 10 80 80 80 800Penrhyn 360 360 20 20 150 150 150 1,500Suwarrow 10 10 0 0 0 0 0 0Sub-total NGI 1,930 2,000 110 130 830 990 830 9,100Total 25,190 31,580 3,020 4,220 22,710 31,760 22,710 272,350
Annual Waste Generation (tonnes) Annual Volume (m3)
Cumulative Volume to (m3)Island Population Projections
E. Needs Assessment
1. Rarotonga and Aitutaki Operational Efficiency Improvements
499. The operators on both Rarotonga and Aitutaki complain about the design of their facilities. However, it was observed during the field visits that part of the problem is the mode of operation. On Aitutaki waste volumes are quite small and the site is operated more as a dump rather than a landfill operation. Instead of establishing small work areas for laying and compacting of the waste as intended (and in fact detailed in the operations manual), the waste is spread over a wide area and left uncovered. On Rarotonga the situation is better in that the incoming volumes are greater and a plant is used to compact the dumped refuse. However, the operator is engaged part time on a needs basis rather full time. There is a clear need for additional training of the operators and managers in the operation of the facilities.
500. Another issue with both the waste collection and landfill site operation on Rarotonga is that operation contracts are awarded for only 12 months at a time. This is too short for stable business operation and contractors find it too risky to invest in plant and equipment. A longer period of 3-5 years should be considered for future contracts.
501. There is a need to take a holistic or integrated approach to waste management on Rarotonga by looking at the total waste management cycle. The design life of the existing facilities on both islands is 15 years. While the facility on Aitutaki is likely to be in use beyond that period, mainly because of the lower volume of waste collected, on Rarotonga the existing site may be fully used in less than 15 years based on current rate of waste generation. Therefore, there is a sense of urgency to move into the next phase of waste management on Rarotonga – waste reduction and separation.

109
502. Firstly, a central transfer station should be established where the collected waste could be separated into the various streams for further treatment or disposal. Based on the waste characteristics on Rarotonga, refer Appendices 9 and 10, 33% of the waste is compostable (organic material), 18% is recyclable (metals), and the balance 49% is generally for landfill, although if the glass and ceramics were separated out too, that would reduce the quantity going to landfill to only 30%. This would have the direct benefit of extending the life of the landfill operation.
503. The second step would be to address with the recyclable and compostable wastes. The major impediment to the operation of the hazardous waste recycling facility on Rarotonga is the lack of proper equipment. Given that the facility is run more as a community service rather than a business, the investment in costly and unaffordable. Perhaps a solution would be for government to invest in the plant and equipment and leasing it out to the private sector for use and maintenance. The private sector could continue to provide the collection, packaging and shipping service.
504. 403. Given that 33% of total waste (40% of the domestic waste) is organic and the large scale burning of green waste, a composting facility is needed. The compost product could be used as an import substitute and/or could be shipped to the outer islands where there is an acute shortage of good quality soil.
2. Health Risk Reduction
505. Most of the rubbish dumps are uncovered and attract wandering pigs, flies and other vermin. These are vectors for disease and so pose a community health risk. As none of the sites are lined (except for the new engineered landfill sites), contamination of the groundwater by leachate is a major concern. This in turn affects water quality and so poses another health risk. Periodic cover of the landfill sites with sand would help to reduce the vermin problem.
3. Environmental Impact
506. The municipal dump sites on outer islands are unlined and do not have perimeter cut off drains or site runoff interceptor drains. Consequently, there is an immediate threat of contamination of the local environment from site runoff and leachate. The main concern is with potential contamination of the freshwater lens which provides a back up water source for local communities. Further to this, the contaminants would also eventually reach the lagoons, thus posing a threat to local eco-systems. An environmental monitoring program is needed, comprising annual checks on groundwater quality along the perimeter of the dump sites. For all new landfill sites, liners should be used to contain the leachate.
507. Backyard burying of the rubbish is still widely practised on all islands. Although improved somewhat as a result of the municipal landfills on Rarotonga and Aitutaki, in 2001 about 40% of the households in the Cook Islands buried their waste in their backyards24. The leaching of contaminants from such burials to the shallow water tables is a concern when practised on such a wide scale.
4. Landfill Sites on all Islands
508. New landfill sites are required on all islands. It is recommended that a suitable site be identified on each island immediately with a view to establishing a simplified landfill operation in the next 3-5 years. As a minimum, site development would involve a proper drainage system, liners and environmental monitoring wells. The operation and capacity of all facilities will need to be reviewed periodically.
24 Cook Islands 2001 Census

110
5. Medical Waste Management
509. Medical waste disposal practices are a major health risk at present. During the field visits to the outer islands, hospital staff advised that typically they burn the medical waste along with general rubbish and sharp objects are usually discarded at the municipal dump or in garbage pits. Options for safe disposal of medical wastes need investigation.
6. Hazardous Waste Management
510. One of the major concerns on the Outer Islands is the disposal of old electrical and electronic appliances, batteries, cars and other plant and equipment. For convenience these wastes are termed “hazardous waste” in this report. The hazardous wastes are bulky and difficult to bury, so most are left exposed to rust in the open. It is suggested that the feasibility of removal of such waste from each island be assessed. Removal, say once a year, by a cargo vessel for transport to Rarotonga and further processing at a central facility before shipment to its final destination offshore is proposed. Many of the vessels returning, particularly from the northern islands, are lightly loaded so a container-full of scrap metal hazardous waste could be accommodated opportunistically. Based on discussions with the private facility operator on Rarotonga, there is an interest in extending the service to the outer islands.
7. Outer Island Composting
511. In view of the poor soils especially on the northern islands, composting of degradable waste offers an opportunity to improve naturally occurring soils, in fact to make soil. The biodegradable material could be composted and blended with bark mulch and composted septic tank residuals, to produce fertile soil in significant quantities over a few years. The product could be used for hydroponic plants in the short-term. It is suggested that a pilot plant be set up in the northern group to assess the feasibility of the scheme. A similar research has been conducted in the Marshall Islands. Preliminary indications are that compost can improve the coral sand, however, some additives, such as minerals for enrichment and pH adjustment, may be required to turn the blended product into fertile soils.
8. Community Awareness Campaign
512. There is an urgent need to increase community awareness of the need for proper disposal of garbage. This program should be combined with the proposed sanitation and personal hygiene program. An ongoing public education campaign must be implemented including the “3R campaign” – reduce, recycle and reuse. This is essential if the government’s millennium development goal of 30% reduction in waste disposed at landfill sites is to be achieved.
9. Developing Plant Operator and Maintenance Skills
513. Periodic training needs to be provided for plant operators to enable them to refresh their skills and to learn the latest trends and practices in solid waste management. This is underscored by the situation at the existing landfill operations on Rarotonga and Aitutaki (see above).
F. Sector Development Strategy
1. Short Term
514. A recommended list of sanitation sector projects necessary in the next 5 years is presented in Table 33 together with capital and annual operation expenditure estimates, land requirements and climate change adaptation works. A profile sheet for each identified project is included in Appendices 5 and 6 – Project Profiles and Prioritization Process and a project adaptation brief is included in Part 3 – Climate Change.

111
515. As can be seen from Table 33, the focus in the short-term is on the second stage of waste management on Rarotonga – waste separation and processing of the non-landfill waste streams. The three projects are: construction of a transfer station and waste separation facility to reduce the amount of waste going to the landfill site; procurement of equipment to improve the operation of the hazardous waste recycling plant; and establishment of a central composting plant. As the operation of all of the facilities could be takenover by the private sector, the government investment would be only for capital works.
516. The total CAPEX of the recommended projects is $1.50 million, and the annual OPEX for O&M of is an estimated at $0.13 million. The estimated cost increment for ensuring that the works are adapted to the predicted climate change conditions is of the order of $50,000 or about 3% of the total investment.
517. If a monthly charge of $10/household were introduced on Rarotonga, the revenue generated would be about $0.3 million per annum which would offset the operating cost of facilities and equipment investment. Therefore the introduction of a municipal charge should be considered.
518. In addition to the capital works, five studies are recommended. These are also shown in Table 33. Four of the studies are either feasibility or investigation studies aimed at efficiency improvements in waste management and one is a pilot study to explore the practicality of composting and soil generation on the northern islands. The estimated cost of these studies is approximately $0.6 million.

112
Table 33: Summary of Suggested Projects in the Solid Waste Management Sector – Short Term
Project Cost Estimate ($ million) Land Required Climate Change Adaptation
ID1/ Name CAPEX2/ OPEX (per annum)
(Yes/No) PAB Prepared (Yes/No)
Cost increment ($ million)
Capital Works
SWW01RAR Construction of Rarotonga solid waste transfer station 0.50 0.03 Yes Yes 0.05
SWW02RAR Rarotonga hazardous waste handling facilities upgrade
0.50 0.05 No No None
SWW03RAR Construction Rarotonga compost facilities 0.50 0.05 Yes No None
Sub-total Capital Works 1.50 0.13 0.05
Studies
SWS01RAR Rarotonga waste collection review and transfer station feasibility study
0.10
SWS02NAT National medical waste disposal options study 0.10
SWS03AIT Aitutaki waste collection and separation efficiency improvement study
0.20
SWS04NAT Outer islands hazardous and recyclable waste management study
0.10
SWS05PZK Pukapuka village composting and soil production pilot study
0.10
Sub-total Studies 0.60
Total Solid Waste Short Term Projects 2.10 0.13 0.05 Notes: 1. Projects with ID have project profile sheets included in Appendices 5 and 6 –Project Profiles and Prioritization Process
2. Land costs are not included in CAPEX

113
519. It is further recommended that an ongoing program be initiated comprising the projects indicated in Table 34. These projects are essential for sustainable operation and are designed for creating awareness of the need for waste reduction at source, building capacity and enhancing the skills of the operators, and to periodically upgrade the solid waste management plans. When annualized, the estimated cost of these projects is approximately $0.19 million per annum.
Table 34: Summary of Suggested Ongoing Projects in the Solid Waste Management Sector
Project Frequency Cost Estimate
ID Name ($ million)
OPCB03SW National public awareness campaign to reduce, recycle and reuse waste
Annual 0.05
OPCB07SW Periodic skill upgrade and training of solid waste system operators
Tri-annual 0.06
OPPS08SW Periodic update of solid waste management plans 5-yearly 0.60
2. Medium Term
520. The suggested projects required in the medium-term (the period 5-10 years from present) are summarized in Table 35. The focus during the period should be provision of proper landfill facilities on the outer islands. The total CAPEX estimate of the projects is $1.40 million over the 5-year period and the associated yearly OPEX of the projects is approximately $0.10 million.
Table 35: Summary of Suggested Projects in the Solid Waste Management Sector – Medium Term
Project Cost Estimate ($ million)
Land Required
Climate Change Adaptation
ID1/ Name CAPEX2/ OPEX (per
annum)
(Yes/No) PAB Prepared (Yes/No)
Cost increment ($
million)
Capital Works
SWW04SGI Construction of new landfill sites on southern islands
0.60 0.04 Yes No None
SWW05NGI Construction of new landfill sites on northern islands
0.80 0.06 No No None
Total Solid Waste Medium Term
Projects
1.40 0.10
Notes: 1. projects with ID have project profile sheets included in Appendices 5 and 6 –Project Profiles and Prioritization Process
2. Land costs are not included in CAPEX
3. Long Term
521. The anticipated projects that will likely be required in the long-term are given in Table 36. The focus on the second half of the period 10-20 years from now would be on construction of a new landfill facility on Rarotonga and replacement of plant and equipment

114
for the recycling operations. Similarly, landfill operations on the southern islands may also need to be expanded. It is envisaged that new trucks for garbage collection would be needed on each of the islands during this period. The actual timing for the identified projects would depend on the condition of the assets. The estimate capital expenditure required during the 10-year period would be of the order of $6.3 million.
Table 36: Summary of Suggested Projects in the Solid Waste Management Sector – Long Term
Project Cost Estimate
ID Name ($ million)
Capital Works
Design and construction of new landfill facilities on Rarotonga 4.00
Renewal of plant and equipment for recycling operations on Rarotonga
0.50
Southern islands landfill facilities expansion program 0.60
Procurement of replacement rubbish collection vehicle for outer islands
1.20
Summary Solid Waste Long Term Projects 6.30 G. Solid Waste Management Sector Performance Monitoring
522. Apart from the annual waste management system audits, the following parameters could be measured and recorded on an annual basis as indicators of the performance of the sector.
• Number of proper landfill sites in the Cook Islands; • Number of landfill sites with proper leachate and waterway monitoring facilities; • Number of islands where a public awareness program for waste reduction and
separation is in place H. Key Recommendations for Institutional Strengthening
1. Suggested Institutional Improvements
523. For sustainable and efficient management of the sector, it is important that institutional structures are put in place with clearly defined responsibilities and functions. This needs to be complemented by capacity building and institutional strengthening within the key agencies together with establishment of a culture of ongoing skill upgrade. A detailed analysis of institutional issues within the Solid Waste Management sector is included in the Municipal Services section of Part 2 – Institutional Analysis. Municipal Services covers the three sectors, Water, Sanitation and Solid Waste Management. The key points and recommendations are summarized as below.
524. Three options have been proposed for the institutional future of municipal services. Firm institutional recommendations are, at this time, highly contentious and beyond the scope of this TA.
525. Until such time as Government develops its National Economic Development Strategy (NEDS) and the relevant Government stakeholders take ownership and display a willingness to undertake responsibility and reduce fragmentation there is little hope of formulating, adopting and implementing a national policy for solid waste management.
526. The preferred option would be for the sector to maintain the status quo and cease policy and regulatory work within the sector until such time as a NEDS is approved.

115
Government would then, on completion of the NEDS undertake a comprehensive sector-wide review with a view to developing consolidated policy and regulations, reduce duplication, consolidate capacity and taking note of international experience and lessons learned.
527. The doubtful validity of many of the indicators in business plans for services within the Municipal Services sector and the nature of associated targets and performance indicators are a reflection of ineffective management regimes, no clear ownership of policies and planning or regulation at the national level, the absence of realistic vision for the future and associated economic and social goals. It is expected that the policy unit OPM will provide leadership in the development of a consolidated municipal services policy including the solid waste management sector. The Policy Unit will then be able to assist in the development of business and action plans with SMART25) indicators, reliable baseline data and realistic targets.
X. TELECOMMUNICATIONS
A. Sector Overview
528. Telecom Cook Islands (TCI) is the sole provider of telecommunications in the Cook Islands. It is a privately owned company with Telecom New Zealand (TNZ) holding 60% shares and the Cook Islands Government holding the remaining 40%. TCI provide Internet and, local, national, and international telecommunication services to all islands except Suwarrow, which uses high frequency radio as a means of communications.
529. There has been a steady improvement in overall service coverage and at present 84% of households Rarotonga, Mangaia and Mauke have a telephone connection. On the other islands, service coverage is around 80%. However, the quality of the service is very uneven, being much lower on the northern islands. Government capital expenditure in the sector was $120,000 in fiscal year 2005/0626. TCI has its own capital expenditure program which is generally funded out of revenue or borrowings on the commercial market.
530. While TCI is one of the major income earners for the government, consumers continue to show discontent at its large annual profits. The main constraints in the sector are a lack of national policy or a policy making body for telecommunication and that TCI is providing a monopoly service and so has little incentive for efficiency improvements. Having said that, it is recognized that TCI is a small carrier and therefore has difficulty in getting low-cost satellite access for expansion of its services.
531. The biggest concern in the sector is that the slow internet service is a real hindrance to remote education and lack of improvement is a missed opportunity to keep children on the outer islands a year or so longer at a critical age – mid to senior high school.
B. Objectives
532. The Cook Islands Government objectives in the sector are to bridge the isolation of the islands through an efficient and affordable telecommunication system. It is also seen as the medium for knowledge transfer to all the citizens. The NSDP targets directly affecting infrastructure development are summarized in Appendices 9 and 10.
533. The aims in the telecommunication sector under this project are mostly to review the existing investment program to enable the Government to reach its stated objectives.
25 Specific, Measurable, Achievable, Relevant, Timely 26 Cook Islands Appropriations Amendment 2005-2006

116
C. Existing Status
534. Existing telecommunication assets and their condition on each island and observations made during the field visits under this project are summarized in Appendices 9 and 10. A brief description of the existing status of telecommunication follows.
535. Generally, telecommunication lines are laid underground on all islands so that risk from flying debris caused by strong winds is minimal. On the Outer Islands pillar boxes are generally installed at ground level and so are susceptible to damage by floating debris during inundation by sea surge waters. On Aitutaki there is a need to replace some 12-15 km of cabling as these are old and cracked in many places.
536. Services connections are available to individual households on all islands except for Palmerston and Nassau where only public phones are installed. Both of these two islands have small populations and are remote with few visitors.
537. An inventory of household telecommunication equipment on each island is summarized in Table 37.
Table 37: Private Occupied Dwellings & Communication
Island Telephone Facsimile Cellular Phone
Internet Access
Rarotonga 2,227 314 556 486 Aitutaki 308 36 2 18 Mangaia 159 11 1 1 Atiu 119 7 - 3 Mauke 80 3 - 1 Mitiaro 35 2 2 1 Palmerston 1 - - 1 Pukapuka 62 4 - - Nassau - - - - Manihiki 64 20 - - Rakahanga 26 2 - - Penrhyn 66 10 - 1 Suwarrow - - - - Total 3,147 409 561 512 Source: Cook Islands 2001 Census
538. Mobile phone service is available on only Rarotonga and Aitutaki and international roaming service is not available.
539. A 28 kilobytes per second (kbs) dial up Internet access is available on all islands, but on the outer islands is unreliable and very slow. A 256 kbs Asymmetric Digital Subscriber Line (ADSL) broadband access is also provided on Rarotonga and Aitutaki. Extending the broadband service to the outer islands would necessitate replacing the existing slow capacity exchanges on those islands; a very expensive program. For this reason priority has been on providing such service to schools, hospitals and government agencies.
540. Several of the installations on the outer islands appeared to be run down or not functioning properly. Part of it the problem is lack of tools, but also inadequate training on basic O&M requirements. An attitude of over-reliance on support from the head office does not help the situation.

117
D. Planning Criteria
1. Proposed Level of Service
541. Suggested standards for minimum levels of service that may be adopted for prioritizing telecommunication projects over the planning period are:
• Residents have access to public telephone, facsimile and internet services • Public broadcast can reach all households for emergency warning • Telecommunication lines are located underground to minimize risk from cyclone
damage • Receiver and relay stations (satellite dishes) are protected from the elements to an
agreed level of risk under the expected climate change conditions 542. The above criteria were discussed with stakeholders during the workshops and consultation meetings. There was a general concurrence with the criteria.
2. Demand Projections
543. Since coverage at present is in excess of 80%, there will be little growth in the sector for the fixed line service. The expected demand for service will therefore parallel that of the population growth. However, the demand for mobile network, internet service and satellite television is expected to grow. Projected demands have not been prepared as TCI is currently reviewing its growth forecasts.
3. Institutional and Policy Considerations
544. Institutional and policy considerations are addressed internally by TCI. Therefore, these aspects are not covered in this report. Notwithstanding, it is assumed that a department or agency will be identified in the government which will assume the lead in at least setting directions for national telecommunication policy and act as a regulator for complaints against TCI.
4. Climate Adaptation
545. Climate change scenarios and adaptation needs are detailed in Part 3 – Climate Change. The effects on telecommunication will be relatively minor. The key indications from the modelling are that there will be greater frequency of cyclones and strong winds and more intense rainfall events. The implications of these are primarily for the design of transmitter and relay towers and possibly solar panel banks. These are open lattice structures and are susceptible to damage during strong winds. The structures should be designed to the updated National Building Code to account for the greater wind loads predicted by the climate change models.
E. Needs Assessment
546. With telecommunications available on all populated islands, there is a need to ensure that these facilities are reliable and affordable. On the Outer Islands Internet access has been identified as one of the major shortfalls of this sector with 28kbs dial up Internet access. In most instances however, users have found it very difficult to get connected and find the system very slow. Due to the delay time, connections are terminated and the user has to redial the connection, and is therefore charged again for Internet access.
1. Education
547. In today’s information and communications technology world, there is a need to address the issue of improving Internet services in the outer islands. This will assist with the

118
education system enabling distance learning as a mode of study. On most outer islands, parents send their children to Rarotonga or overseas to further their education which is a large expense to families, with travel costs, living costs (food, clothing, accommodation, daily subsistence allowances), and school fees.
548. Distance or remote education could be used as a mode of study for adults as well as for primary and secondary school levels. A study was conducted in 2002, identifying national training needs for the Cook Islands. With reliable Internet access, it would be possible to increase training of teachers on the outer islands, bringing communities to a level similar to that on Rarotonga.
549. The Ministry of Education has developed an Edu-Net system – a development for distance education. This system has been established to assist the formal education sector to offer a variety of subjects. New servers have been provided and the project is currently under re-evaluation as there are some minor glitches in the system administration. TCI have been involved with assisting the Ministry with the implementation of the project.
2. Health and Other Government Services
550. A Telehealth system has been implemented by the Ministry of Health that allows resident doctors on the outer islands to be able to communicate with doctors in Rarotonga and in New Zealand (Counties Manukau District Health Board) for patient diagnosis and treatment. Again, TCI has assisted the Ministry in implementing this project.
551. An E-Government project jointly funded by the Cook Islands Government & United Nations Development Program (UNDP) project was established in 2005. E-Government is the delivery of services to citizens (G2C), businesses (G2B), and other government agencies (G2G). E-islands will be introduced at a later date to connect the OIs with the E-Government system.
552. An Information Communication & Technology (ICT) Border Control Management System is a new project that is currently under consideration by the CI Government through the Ministry of Foreign Affairs & Immigration, as calls mount to tighten border security in and out of every country in the wake of the September 11th tragedy and the rising threat of terrorism to the region.
553. The above projects are still ongoing, and teething problems are being experienced. More work on the implementation stage needs to be done by the various agencies in conjunction with TCI.
3. Business
554. With the exception of Rarotonga and Aitutaki, there is no mobile coverage on the outer islands. This has a constraining effect on business communication. However, TCI is looking at the feasibility of establishing such services on Manihiki and Atiu. Similarly, a significant number of tourists are business people who need access to their normal business operations through the use of international roaming mobile access. This service is not yet available in the Cook Islands. It is understood that TCI is negotiating with the major tourist-source countries for roaming access on Rarotonga and Aitutaki. The main countries are New Zealand, Australia, Singapore, USA, Germany and Scandinavian countries.
555. A lack of reliable Internet access is hindering business development such as advertising, online shopping and banking. Reliable Internet access could assist business development on the outer islands by enabling the private sector to advertise their goods and services online. This could contribute significantly to economic development on each island. It would also allow purchasing online for consumers and businesses alike.

119
4. Public Radio Broadcasts
556. At present each island has the ability to receive public broadcasts of the AM Radio Station in Rarotonga, which is decoded and used to a feed a FM transmitter configured to provide coverage to the island. This project is a joint effort between the CIGOV and TCI. The rationale behind this project is to supply the outer islands with a good quality national radio broadcast signal to be able to receive reliable news broadcasts, and in times of natural disasters, emergency warnings.
5. System Security and Reliability
557. For security of supply there is a need to install alternative sources of transmission on Palmerston and Nassau as these two islands only have public phone access at present. Similarly, alternate sources of transmission are needed for Mitiaro and Rakahanga as these two islands are dependent on relay from Atiu and Manihiki respectively, and should the relay stations be out of order the receiver islands would also be affected. TCI advised that it is investigating the option of a small satellite earth station for Rakahanga and Mitiaro.
558. A back-up power supply is needed on islands which do not have 24-hour electricity supply. As the current solar charged batteries only last for 4-5 hours of operation. A 24-hour back up supply is desirable,
559. With TCI being a monopoly of telecommunication services, there is a major risk of system failure throughout the Cook Islands. Government needs to explore various options in this sector taking into consideration alternative service providers that can provide reliable and affordable services.
560. Laws are required regarding legality of electronic business transactions and legal framework is needed on privacy, data security and storage. With access to Internet, there is a need to adopt a legal framework encompassing privacy and security of data, legal sanction of new forms of storage and archiving, and laws that accept paperless transactions. With the assistance of TCI, the Australian Department of Information & Communication Technology & Arts has agreed to draft model legislations for small Pacific Island countries which will cover a wide range of information communication and technology topics and issues.
6. Developing Plant Operator and Maintenance Skills
561. A common problem on the outer islands is poor maintenance of the facilities. This is critical especially for the batteries as they are the back-up sources of power supply. Clearly, there is a need for greater diligence by the operators through creating a sense of importance about the need for maintenance. This should be incorporated into ongoing periodic training for operators to refresh their skills.
F. Sector Development Strategy
562. Infrastructure development, capacity building and investments in the sector are being managed by TCI. Therefore, telecommunication projects are not included for funding by CIGOV under the sector master plan. However, project profile sheets have been prepared for the key projects and are included in Appendices 5 and 6 – Project Profiles and Prioritization Process. Five essential projects are needed for sustainable and efficient sector performance and to address the needs identified in Section E above. A summary of these projects is presented in Table 38.
563. The primary need is to improve Internet service to support government operations, education and health services and private sector commercial activities. The most pressing requirement is to provide high-speed Internet service (either broadband, Assymetric Digital Subscriber Line (ADSL) or wireless) to the Island Administrations, hospitals and schools on

120
each island. This should be provided by the government to enable the introduction of high-speed services, following which the private sector may purchase the services it needs from TCI.
564. In the medium to long term, there will be a need for a national program to upgrade facilities from time to time. TCI is also intending to relocate the repeater station towers inland, away from the coast and so provide better cyclone protection to these facilities. This would also be an opportune time to upgrade the design of the towers to account for the greater wind loads predicted by the climate change models.
G. Telecommunications Sector Performance Monitoring
565. The following parameters could be measured and recorded on an annual basis as indicators of the performance of the sector:
• Service area coverage (number of households with connections); • Cost per connection; • Number of households with Internet connection
H. Key Recommendations for Institutional Strengthening
566. As telecommunications services are provided by TCI, no institutional analysis and recommendations are made under this project. It is reported that TCI’s current monopoly agreements with the government are due to expire and that negotiations for extension of the arrangements are underway. Undoubtedly, CIGOV will consider the effects to both consumers and its own budget before deciding between continuing the monopoly or opening the network to other providers.
XI. MAINTENANCE FACILITIES
A. Introduction
567. The lack of proper maintenance facilities and skilled personnel to provide regular maintenance and repairs to infrastructure machineries had caused infrastructure facilities, especially in the Outer Islands, to structurally deteriorate and cannot provide the services they were designed for. At present the only maintenance facilities or mechanical workshops, as they are commonly called, are operated by the Government through the Island Administrations. These are mainly small buildings located on Crown Land with basic equipment to tend to simple mechanical repairs. There are no shelters for heavy machinery and they therefore end up being left out in the open and exposed to severe weather conditions such as rain and sea spray.
568. In the absence of the appropriate tools and equipment, heavy maintenance or overhaul works on machinery such as power generators are carried out at the OMIA workshop on Rarotonga. Some of the major maintenance works are even carried out in New Zealand. This means shipping the equipment or machinery to Rarotonga or from Rarotonga on to New Zealand to be overhauled or repaired and then returning them to the island by sea. It is apparent that there are huge costs involved with these arrangements.
569. The Island Administrations do not normally stock spare parts for their machinery due to limited operating budget appropriations. Therefore, if there are breakdowns to any of the heavy machinery, spare parts are either purchased from Rarotonga or New Zealand.

121
Table 38: Summary of Suggested Projects in the Telecommunication Sector - Short Term
Project Cost Estimate ($ million) Land Required Climate Change Adaptation
ID1/ Name CAPEX2/ OPEX3/ (per annum)
(Yes/No) PAB Prepared (Yes/No)
Cost increment ($ million)
Capital Works under TCI Capital Works Funding
TCW01NAT National high speed internet access installation on all islands
0.13 N/A No No None
TCW02SGI Rarotonga and Aitutaki limited international mobile roaming access service
In progress N/A No No None
TCW03NAT Outer islands mobile phone network service on all islands
2.80 N/A No No None
TCW04NAT Install back up power supply on islands where power is less than 24 hours
0.60 N/A No No None
TCW05NAT Install alternate transmission source for Nassau, Palmerston, Rakahanga, Mitiaro
0.75 N/A No, Rakahanga toconfirmed
No None
Total Telecommunication Short Term Projects 4.28 Notes: 1. Projects with ID have project profile sheets included in Appendices 5 and 6 –Project Profiles and Prioritization Process
2. Land costs are not included in CAPEX 3. OPEX is incorporated into TCI annual operations budget

122
570. Some of the Islands Administrations rely on OMIA to carry out their supplies procurement on their behalf. Most of the time it takes about six weeks for parts to arrive to the islands by boat. In some cases the Island Administrations have resorted to other sources such as the private sector or public service personnel who have the experience in this line of work for assistance to do the procurement for them. These islands are comfortable with the latter arrangement and sometimes considered it more efficient.
571. Apart from the simple asset register operated by the Island Administration as part of its fiscal responsibilities, there are no asset management plans in place. Some Island Administrations had argued that because of the limited budget given to them annually it is very difficult to effectively follow or implement a maintenance plan and to a wider scope, an asset management plan.
572. Only on some islands do they have private sector contractors that are able to carryout maintenance works. The rest of the islands rely heavily on their infrastructure divisions.
573. There is also a lack of skilled personnel on the outer islands to carryout the maintenance work. In the short term, trade training courses have assisted in building capacity but only in terms of filling skill gaps. A further issue for building capacity is the need to enable the gaining of qualifications for the long term.
B. Sector Overview
574. In terms of this Master Plan and within the short term and medium term, the focus will be refurbishing, upgrading and modifying existing facilities, and for those islands that do not have one, then there are proposals to build new facilities.
575. Skilled mechanics are limited on all islands, so there is definitely a need to address this human resource issue. To address this immediate issue it is recommended that a pool of mechanics is created so that these individuals would be available should islands need assistance. Similar to the concept of the “flying dentists” that the Ministry of Health have, there could be the “flying mechanics” that help address this human resource issue. The aim for the long term is to have at least one fully qualified mechanic per island.
C. Needs Assessment
1. Technical
576. In view of the technical aspects of the priority needs for the maintenance facilities it is decided that these are discussed separately, these are detailed below:
• Refurbish, upgrade and modify existing facilities and provide them with the appropriate tools and equipment. For these requirements more details are summarized in Appendix 11.
• Build machinery shelter as part of the existing facilities and as part of the new facilities that will be build.
• For the new proposed facilities that will be built, the structural design parameters will take into account climate change adaptation considerations
• From field assessments it is proposed that there is a need to build a central regional maintenance facility in Tauhunu on Manihiki to accommodate the more complicated maintenance activities for infrastructure machineries in the Northern Group islands.
• Recruit the minimum required number of staff with the relevant skills to operate and maintain each maintenance facility on the respective islands.
577. Table 40 provides a summary of current existing facilities on each island.

123
D. Institutional
578. In order for the maintenance facilities to be operated effectively there is a need to establish the appropriate organizational operation structure on each island to ensure that these facilities are functional and their services sustainable. Capacity building for the local staff in the areas of technical, administration and accounting need to be encouraged through the appropriate training institutions.
579. Because these are Government facilities, the responsibility may lie with CIIC as they are the agency responsible for Government Buildings. However, if this is not the case, then the responsibility will lie with the Island Administration.
580. Part 2 provides more details on the institutional aspects of the facilities.
E. Climate Change Adaptation
581. The primary aim is to provide measures to protect,or mitigate against, inhabitants, properties and infrastructure from climate change impacts.
582. The structural engineering designs for the new buildings have incorporated wind loadings into the design considerations. For other mitigation measures against other climate related impacts such as flooding due to sea surges have also been identified, for example foreshore protection. Hence for the projects in this sector, incremental costs had been estimated where applicable to allow for the climate change conditions. These have also been highlighted in the respective project profiles contained in Appendix 5.
583. Work is under way to update the Country Risk Profile which will provide an indication of the severity of the problem and point to mitigation measures which will be required in future.
584. Work is also under way to update the Cook Islands National Building Code which is expected to identify the need to upgrade building structures, utilities and sanitation standards in response to changing climate conditions.
F. Sector Development Strategy
1. Objectives
585. There is a need to increase and improve the serviceability and prolong the useful life of plant and equipment on the Outer Islands, through safe operation and regular maintenance. In order to achieve this, the Island Administrations require adequate maintenance facilities equipped with the appropriate tools and spare parts.
586. The infrequent shipping and air services to the Northern Group Islands poses a special problem. Equipment has to be transported to Rarotonga for major repairs and parts require weeks or months to arrive by ship or air. There is a need to reduce the waiting time for repairs and spare parts by establishing a centralized maintenance repair shop and stores depot in one of the Northern Islands.
2. Project Prioritization
587. The Maintenance Facilities improvement projects were evaluated and ranked using the multi-criteria evaluation tool described in Appendix 6. The ranking was adjusted to take account of practical implementation considerations, budget limits and projects in any donor pipelines. The results are shown in Table 41 for Short Term (1-5 years) Maintenance Facilities priorities, with Table 42 providing data on the Medium Term (5-10 years) recommended priorities.

124
G. Monitoring
588. The monitoring of the maintenance facilities activities and the building superstructure should be conducted as part of the Island Administrations annual reporting tasks. These monitoring or annual assessments can be carried out by the public sector or can be out-sourced to the private sector.
589. The development of a maintenance plan or an asset management plan can be used as a management tool to monitor and evaluate the performance of the assets, and hence can prepare forward plans for either upgrading or replacing the assets.

125
Table 39: Summary of existing maintenance facilities on each island
Existing Maintenance Facility Island Location
Fuel Storage Machinery shelter
Equipment Storage
Comments
Southern Group Islands
Rarotonga NA
Aitutaki Aratea None None None Currently using agriculture building, existing one too small. Proposal for a new facility
Atiu Ngatiarua none None Too small Existing one structurally deteriorating. Proposal for a new facility
Mangaia Oneroa Yes Too small Too small Propose to refurbish existing facility including machinery shelter
Mauke Makatea None None None Existing one structurally deteriorating. Propose for a new facility
Mitiaro Mangarei None None Too small Propose to refurbish existing facility and add on machinery shelter
Northern Group Islands
Palmerston None None None Proposal for a new facility
Pukapuka None Yes Yes Proposal to refurbish existing facility
Nassau None None None Proposal for a new facility
Tauhunu None None Too small Proposal for new facility which will also serve as a regional facility for the Northern Group Islands
Manihiki
Tukao None None None Can use the facility in Tauhunu. Proposal for a new facility in the long term.
Rakahanga None None None Proposal for a new facility
Penrhyn Omoka Yes Yes Yes Refurbish existing facility as required
Tetautua Can use the facility in Omoka. Proposal for a new facility in the long term.

126
Table 40: Short Term Projects (1 – 5 Years)
Land Required Climate Project ID Name
Capital costs ($m)
Annual operating & maintenance costs ($m)
Y/N PAB Incremental Cost ($m)
MFW05NGI Construct Northern Group regional facility 0.2 0.1 N N 0
MFW03SGI Build new maintenance facilities for AIT, AIU, MUK 0.6 0.2 NA Y 0.02
Table 41: Medium Term Projects (5 0 10 Years) Costs ($m) Land Required Climate Project ID Name
Capital costs ($m)
Annual operating & maintenance costs ($m)
Y/N PAB Incremental Cost ($m)
MFW04NGI Build new maintenance facilities for RAK, PAL, NA 0.5 0.2 NA N 0.02
MFW01SGI Modify, refurbish and upgrade facilities in MGS, MOI 0.3 0.1 NA NA 0
MFW02NGI Modify, refurbish and upgrade facilities in PZK, PYE 0.3 0.1 NA NA 0
Notes:
1. Projects with a Project ID number have a project profile sheet – refer to Appendx 5 2. Land costs included/not included in Capex 3. PAB costs included/not included in Capex 4. Projects with * have already been allocated funds or have been approved for implementation 5. RAK Rakahanga, PAL Palmerston, NAS Nassau, MGS Mangaia, MOI Mitiaro, PZK Pukapuka, PYE Penrhyn

127
XII. EMERGENCY MANAGEMENT CENTERS
A. Introduction
590. Emergency Management Centers (EMC) around the Cook Islands have always been located in schools and local halls on each respective island. (See Table 42 for a summary of existing EMCs). After the five cyclones of 2005, the Ministry of Education has requested that alternative Emergency Management Centers be sought to accommodate people during times of natural disasters.
591. The rationale behind this, is post natural disasters, it is safer to have children attending school so they are out of the way of big machineries used while assisting islands with the clean up exercise.
592. Also, the Ministry of Education is of the view that they are not fully equipped with appropriate facilities to accommodate a large number of people as there are limited kitchen, water, communication and sanitation facilities located in each school, therefore the recommendation to utilize community halls. There is a need to ensure that emergency management centers meet Building Code Standards and have appropriate facilities to accommodate communities during times of natural disasters.
B. Sector Overview
593. In terms of this Master Plan, the focus will be on the center itself, whereby there needs to be an assurance that there is adequate water, sanitation, back up power generation and communication facilities available during times of natural disasters. Less focus will be on the awareness of the Disaster Risk Management Plan, which is Component 1 of this Technical Assistance. However in saying this, both will go hand in hand with ensuring that the communities are aware of where the facilities are located.
594. The Master Plan will look first at repairs and maintenance of current facilities to ensure they meet standards however on some islands there is a need to build new facilities to accommodate the population of the island.
595. Emergency Management Cook Islands (EMCI) which replaces the National Disaster Management Office (NDMO) is Government’s full time emergency and disaster management office. In the Disaster Risk Management Plan (DRMP), there is a component highlighting the emergency management centers however there is no mention of who are responsible for the centers in terms of operations and maintenance.
596. There is a need to combine various agencies (CIIC, MOW, MOH, MOE, Community Leaders) to ensure that each Emergency Management Center meets the standards and has the appropriate facilities available when required.
C. Needs Assessment
1. Technical
597. In view of the technical aspects of the priority needs for the maintenance facilities it is decided that these are discussed separately, these are detailed below:
• Refurbish, upgrade and modify existing EMCs and if not available, install the necessary facilities such as own water supply, sanitation, cooking, bathing/washing, communal and basic sleeping area, communication equipment, storage areas for emergency food and medical supplies. More details are summarized in Appendix 11.

128
• Design and build new EMCs that will have the following facilities; own water supply, sanitation, cooking, bathing/washing, communal and basic sleeping area, communication equipment, storage areas for emergency food and medical supplies.
• For proposed new facilities that will be built, the structural design parameters will need to take into account climate change adaptation considerations
• Adequate operation and maintenance funds need to be allocated annually.

129
Table 42: Summary of existing EMCs
Location No of existing EMCs
Island
Comments
Southern Group Islands Rarotonga Matavera, Ngatangiia, Titikaveka,
Arorangi, Nikao, Avatiu, Takuvaine, Tupapa,
11 Currently using community halls. Refurbish each and equip with required facilities
Aitutaki Amuri, Arutanga, Nikaupara, Tautu, Vaipae 7 Currently using community halls. Refurbish each and equip with required facilities
Atiu Ngatiarua, Areora, Tengatangi, Mapumai 4 Currently using community halls. Refurbish each and equip with required facilities
Mangaia Oneroa, Tamarua, Ivirua, Karanga 6 Currently using community halls. Refurbish each and equip with required facilities
Mauke Oiretumu, Ngatiarua, 3 Currently using community halls. Refurbish each and equip with required facilities
Mitiaro Takaue, Mangarei, Atai/Auta 3 Currently using community halls. Refurbish each and equip with required facilities
Northern Group Islands
Palmerston None Can use the school building. Propose for a new EMC Pukapuka None Currently using community halls. Propose for a new EMC Nassau None Can use school building. Propose for a new EMC
Tauhunu 1 Funding for repair works approved Manihiki Tukao 1 Funding for repair works approved
Rakahanga None Use the CICC hall. Propose for a new facility Omoka None Propose for a new EMC Penrhyn Tetautua None Propose for a new EMC

130
2. Institutional
598. In the Southern Group Islands the buildings that are currently used for EMC purposes are primarily community halls and operated by community or village groups. There is therefore a need to establish the appropriate organizational operation structure on each island to ensure that these centers are functional and their services sustainable.
599. Although the centers are owned and operated by community groups, (generally non-profit generating), there is a need to secure funding annually through the National and local Government to ensure that these centers are adequately maintained.
600. Because there are no inspections as such with regards to the Emergency Management Centers at present, the only agencies involved are Cook Islands Investment Corporation for Government Buildings and the Community or Island Councils for community halls.
601. Cook Islands Investment Corporation is responsible for the repairs of Government Buildings and construction of new buildings. But because community halls are used, the question of who takes responsibility of the repairs and maintenance of these halls are raised. This is something that needs to be addressed at length as this is a Government social responsibility to ensure that these centers are provided for the community.
602. Part 2 provides more details on the institutional aspects of the facilities.
D. Climate Change Adaptation
603. The primary aim is to provide measures to protect inhabitants, properties and infrastructure from climate change impacts.
604. The structural engineering designs for the new buildings have incorporated wind loadings into the design considerations. Other mitigation measures against other climate related impacts, e.g. flooding due to sea surges, have also been identified, e.g. foreshore protection. Hence for the projects in this sector, incremental costs had been estimated where applicable to allow for the climate change conditions. These have also been highlighted in the respective project profiles contained in Appendix 5.
605. Work is under way to update the Country Risk Profile (CRP) which will provide an indication of the severity of the problem and point to mitigation measures which will be required in future.
606. Work is also under way to update the Cook Islands National Building Code which is expected to identify the need to upgrade building structures, utilities and sanitation standards in response to changing climate conditions.
E. Sector Development Strategy
1. Objectives
607. The objective of this section is to reduce the risks imposed by emergencies and natural and non-natural disasters onto people and properties in the Cook Islands. One option identified for achieving this is the provision of appropriate, reliable and affordable Emergency Management Centers (EMC) for the people of the Cook Islands. The immediate focus will be on the Northern Group Islands and subsequently to the islands in the Southern Group in the short term. It is expected that the people residing on these islands will gain economic benefits from the improved infrastructure and hence enhance their confidences in being able to achieve their aspirations for a more secure future.

131
2. Project Prioritization
608. The Emergency Management Centers improvement projects were evaluated and ranked using the multi-criteria evaluation tool described in Appendix 6. The ranking was adjusted to take account of practical implementation considerations, budget limits and projects in any donor pipelines. The results are shown in Table 43 for Short Term (1-5 years), and Table 44 for Medium Term (5-10 years) Emergency Management Center projects.
F. Monitoring
609. Once all refurbishments, repairs works and construction of new EMCs are completed, annual audits should be carried out preferably before the cyclone season in order to assess the suitability of the center in case of emergencies due to cyclones. An audit report should be completed by a public or private contractor (engineer) and submitted to the appropriate Ministry who are funding the Audit.
610. It should be noted that we are dealing with both resident and visitor populations. Hence it would be appropriate to conduct consultations with tourism facilities to assess their plans for emergency evacuations. Nevertheless, this issue is addressed under the DRMP.
611. The Audit report should comprise of estimate costs should the emergency centers require further repairs and maintenance, and give a general report of the condition of the centers and their facilities.
612. This report should be submitted to a committee who may comprise of the following agencies:
• Ministry of Works – Building Control/Water Supply • Ministry of Energy – Power Supply or Energy • Telecom Cook Islands – Communications • Public Health – Sanitation • Cook Islands Investment Corporation – Government Buildings • OMIA – representing Island Administrations/Island Council • Emergency Management Cook Islands – Awareness
613. Once there is an agreement to the repairs and maintenance costs for centers then funding request can be submitted to the appropriate agency holding funds for budget requests whether it be MFEM, CIIC, EMCI or Aid Management for donor agency.

132
Table 43: Short Term Projects (1 - 5 years)
Land required
Climate Project ID Name
Capital costs ($m)
Annual operating & maintenance costs ($m)
Y/N PAB Incremental costs ($m)
EMW04NGI Construct and furbish new EMCs on Northern Group islands 6.1 0.1 N Y 0.3 EMW03MHX Complete repair works on Manihiki EMCs 0.4 0.02 NA N 0
Table 44: Medium Term Projects (5 – 10 Years) Land
required Climate Project ID Name
Capital costs ($m)
Annual operating & maintenance costs ($m)
Y/N PAB Incremental costs ($m)
EMW02SGI Modify and refurbish existing EMCs on Southern Group islands
1.7 0.1 NA NA 0
EMW01RAR Refurbish existing EMCs on Rarotonga 0.9 0.1 NA NA 0
Notes:
6. Projects with a Project ID number have a project profile sheet – refer to Appendix 5 7. Land costs included/not included in Capex 8. PAB costs included/not included in Capex 9. Projects with * have already been allocated funds or have been approved for implementation

133
XIII. INFRASTRUCTURE MASTER PLAN
A. Project Identification and Priorities
614. The Infrastructure Master Plan presents the projects in 10 sectors. Projects have been developed based on an assessment of short and long term needs in Rarotonga, Aitutaki and the remaining Outer Islands.
615. A total of 111 projects are identified of which 86 are civil works projects. The remaining 25 include various policy or feasibility studies, which are recommended for guiding further investment in infrastructure and 20 energy projects to be funded from Te Aponga Uira’s (TAU) capital expenditure budget .
616. Table 45: Summary of All Projects lists all capital works projects. The 86 capital works projects have an estimated capital cost of $237 million. The Cook Islands Government requested that priorities should be assigned to projects with a view to identifying high-priority projects which could be implemented in the next five years with a funding limit of approximately $50 million. Priorities were established in each sector based on:
• the multi-criteria evaluation tool described in Appendix 6 • adjustments to recognize urgent technical needs • projects approved for construction or in donors’ pipelines were given highest priority.
617. The prioritization resulted in 44 projects with an estimated capital cost of $55 million. These include projects funded by NZAID’s Cyclone Recovery and Reconstruction Program and Outer Island Development Program and the inner ring road project assisted by the Peoples’ Republic of China.
Capital and Operating and Maintenance (O&M) costs were estimated for all projects. Costs are expressed in NZ$, 2006 prices, and capital costs include 15% physical contingency and 10% for engineering. Projects and costs are shown in Figure 11, Table 45, Table 46, and Table 47. B. Explanatory Notes
618. Sectors: The Master Plan does not cover all infrastructure in the Cook Islands. It covers the sectors named in the Terms of Reference (TOR) agreed between the ADB and CIGOV which are those which require the greatest investment in infrastructure. These are Transport (air, marine and roads), Water Supply, Sanitation, Solid Waste Management, Energy and Telecommunications. The Master Plan excludes infrastructure for Health, Education, Agriculture, Fisheries, Marine Resources and other sectors. The Cook Islands Government may wish to add supporting infrastructure for these sectors into the master plan at a later date.
619. Maintenance and Evacuation Management Centers: Maintenance Facilities and Evacuation Management Centers were added when it became evident that investment was required in these facilities in order to (1) support maintenance of the infrastructure in the Outer Islands and (2) to achieve one of the key objectives of the Master Plan namely protection against climate change impacts. The Master Plan includes maintenance buildings and workshops in the Outer Islands and test laboratories essential for operation and maintenance of infrastructure. The Master Plan excludes offices for government agencies or state-owned enterprises.
620. Focus on the Outer Islands: The TOR directed that the Master Plan focus on the Outer Islands, and the emphasis in the short term is to repair cyclone damage and correct infrastructure deficiencies in the Outer Islands. The needs of Rarotonga and Aitutaki were also assessed in detail and tend to predominate in the longer term as described below.

134
621. Scope of Projects: The Master Plan includes major repairs, rehabilitation and reconstruction of infrastructure which has been damaged by cyclones, deteriorated from insufficient maintenance or simply reached the end of its design life. The Master Plan generally excludes periodic maintenance and replacement of plant and equipment, although new plant and equipment are included as part of many projects.
622. Climate Change Adaptation: The Master Plan has marked projects which are especially at risk from extreme weather events and identified the type of adaptation measures required. At-risk projects will require additional study (a Project Adaptation Brief) at the feasibility or detailed engineering design stage to determine the appropriate adaptation measures and associated costs. The capital costs shown for the master plan projects represent best international practice but, except for the 15% physical contingency, do not include the cost of climate change adaptation measures.
623. State Owned Enterprises: The Master Plan includes major investments in infrastructure operated by SOEs which will require Cook Islands Government funding assistance. This includes a covered departures building at Rarotonga Airport and a second generator station by TAU. The Master Plan excludes replacement of assets which SOEs such as CIAA, CIPA and TAU will fund from reserves set aside for this purpose. Examples include the ILS and VOR/DME at the airport and new generators for TAU.
624. Telecommunications: was included in the master plan TOR and was reviewed with the other sectors. However, telecommunications are provided by CI Telecom, a private company, therefore investment and O&M costs are excluded from the Master Plan.
625. O&M Costs: The Master Plan estimates the additional O&M requirements and costs associated with each project which will need to be added to the Government’s recurrent expenditure budget. However, the additional O&M costs of SOE infrastructure projects are not included – on the assumption that those costs will be incorporated into SOE operating plans. For example, the O&M cost of the Avatiu Harbor western basin development will be absorbed into CIPA’s budget. The exception is the Outer Island airports taken over by CIAA after improvement. They will require specific O&M budget support from the Government.

135
Table 45: Summary of All Projects Cost Estimates
$ million Time Frame Project ID Project Name Capital O&M AIR TRANSPORT
ATW06PYE Penrhyn Airport Improvement 0.8 0.1 ATW05MHX Manihiki Airport Improvement 0.8 0.1 ATW07PZK Pukapuka Airport Improvement 0.8 0.1 1-5 Years
ATW08RAR Rarotonga Airport Passenger Terminal Improvement 3.5
SHORT TERM TOTAL 5.8 0.2 ATW09RAR Rarotonga Airport Cyclone Protection Works 5.0 ATW01AIU Atiu Airport Improvement 0.8 0.1 ATW03MUK Mauke Airport Improvement 0.8 0.1 ATW04MOI Mitiaro Airport Improvement 0.8 0.1 ATW02MGS Mangaia Airport Development 5.0 0.1
5-20 Years
ATW10AIT Aitutaki Airport Improvement for International Operations 13.0
OVERALL TOTAL 31.0 0.5 MARINE TRANSPORT
MTW01AIU Atiu Harbor Repairs 0.2 0.1 MTW05MHX Manihiki Harbors Reconstruction 2.4 0.1 MTW06NAS Nassau Harbor Development 0.3 0.1 MTW02MGS Mangaia Harbor Reconstruction 2.2 0.1 MTW03MUK Mauke Harbor Reconstruction 1.8 0.1 MTW04MOI Mitiaro Harbor Reconstruction 2.5 0.1 MTW07PYE Penrhyn Harbor Rehabilitation 0.9 0.1
1-5 Years
MTW10RAR Avatiu Harbor Western Basin Development Completion 2.0 0.0
SHORT TERM TOTAL 12.3 0.6 MTW11RAR Avatiu Container Facilities Development 3.5 0.0 MTW14RAR Avarua Waterfront Protection 20.0 0.0 MTW08PZK Pukapuka Jetty Development 0.3 0.1 MTW09RAK Rakahanga Harbor Improvement 0.0 0.1 MTW12RAR Avatiu Harbor Waterfront Development 1.5 0.0 MTW13RAR Avatiu Harbor Expansion 20.0 0.0
5-20 Years
MTW15AIT Aitutaki Harbor Development 5.0 0.0 OVERALL TOTAL 62.6 0.7 ROADS
RTW07RAR Inner Ring Road Improvement Nikao-Takuvaine 2.0 0.0 RTW01RAR Rarotonga Road Safety Program 0.9 0.1 RTW06NAT Outer Islands Road Improvement Program 2.4 0.1 RTW02RAR Rarotonga Traffic Management Improvements 0.3 0.1
1-5 Years
RTW05AIT Aitutaki Road Improvements 3.3 0.2 SHORT TERM TOTAL 8.8 0.4
RTW03RAR Rarotonga Main Ring Road Rehabilitation 30.0 0.3 5-20 Years RTW04RAR Rarotonga Inner Ring Road Development 12.0 0.0 OVERALL TOTAL 50.8 0.8

136
WATER SUPPLY
Replacement of old sections of the distribution sub-main on Rarotonga 3.2
WSW02RAR Installation of distribution system isolation valves on Rarotonga 0.2 0.0
WSW19MUK Mauke water supply distribution system upgrade 1.1 0.0 WSW17MGS Mangaia water supply distribution system upgrade 1.8 0.0
WSW14NGI Northern islands community rainwater catchment & storage refurbishment 0.2 0.0
WSW15NGI Supply and installation of household rainwater systems for northern islands 1.2 0.0
WSW07AIT Aitutaki water supply headworks upgrade 0.4 0.0 WSW18AIU Atiu water supply system upgrade 0.5 0.0
1-5 Years
WSW20MOI Mitiaro water supply system upgrade 0.8 0.0 SHORT TERM TOTAL 9.4 0.1
WSW01RAR Rarotonga distribution network rehabilitation 3.0 0.2
WSW04RAR Supply and installation of property connection meters on Rarotonga 1.2 0.0
WSW03RAR Construction of Rarotonga water treatment facilities 7.0 0.4
WSW11SGI Construction of disinfection facilities on the southern islands 0.2 0.0
WSW09AIT Construction of Aitutaki water treatment plants 1.5 0.2
WSW13NGI Northern islands EMC water storages rehabilitation/construction 0.1 0.0
WSW05RAR Rarotonga water loss reduction program 0.5 0.0
WSW06SGI Southern islands EMC water storages rehabilitation/reconstruction 0.1 0.0
5-20 Years
WSW12SGI Installation of property service meters on the southern islands 0.5 0.0
OVERALL TOTAL 23.5 1.1 ENERGY
Aitutaki electricity generator replacement 0.9 Rakahanga stand-by generator repair 0.0 Rakahanga wind power generator erection 0.1 ENW09AIU Atiu electricity supply distribution system upgrade 1.2 0.2 ENW02PYE Exchange of Penrhyn generators 0.0 ENW03NAT Outer islands electrical wiring standardization
program 0.2 0.0
1-5 Years
ENW04PZK Pukapuka electricity supply upgrade 2.5 SHORT TERM TOTAL 4.9 0.2
ENW16RAR Construction of second Rarotonga power station 35.0 1.5 ENW05SGI Southern islands electricity supply systems
rehabilitation program 1.2 0.2 ENW06NGI Northern islands electricity supply systems
rehabilitation program 1.0 0.2 ENW07NGI Electricity supply system upgrades on Manihiki and
Rakahanga 0.8 0.1 ENW08MGS Mangaia electricity supply system upgrade 0.4 0.1
5-20 Years
ENW32AIT Aitutaki high voltage electricity supply distribution system upgrade 1.5 0.2
OVERALL TOTAL 44.8 2.4

137
SANITATION
SNW01RAR Construction of Rarotonga village sewerage networks – Stage 1 4.5 0.2 1-5 Years
SNW03RAR Rehabilitation of Tereora/Tepuka neighborhood sewerage system 0.3 0.0
SHORT TERM 4.8 0.3
SNW02RAR Construction of Rarotonga village sewerage networks – Stage 2 2.0 0.2
SNW06AIT Construction of Aitutaki village sewerage networks 3.5 0.1
SNW12NGI Construction of septage treatment facilities on the northern islands 0.2 0.0
SNW05RAR Improvement of effluent disposal systems in foreshore areas of Rarotonga 0.0 0.0
SNW08SGI Review adequacy & upgrade sanitation facilities at EMC on southern islands 0.3 0.0
SNW09SGI Construction of septage treatment facilities on the southern islands 0.1 0.0
5-20 Years
SNW10NGI Review adequacy & upgrade sanitation facilities at EMC on northern islands 0.2 0.0
OVERALL TOTAL 11.0 0.6
SOLID WASTE SWW01RAR Construction of Rarotonga solid waste transfer
station 0.5 0.0 1-5 Years SWW02RAR Rarotonga hazardous waste handling facilities upgrade 0.5 0.1
SHORT TERM TOTAL 1.0 0.1 SWW05SGI Construction of new landfill sites on the southern
islands 0.6 0.0 SWW03RAR Construction of Rarotonga compost facilities 0.5 0.1 5-10 Years SWW09NGI Construction of new landfill sites on the northern
islands 0.8 0.1 OVERALL TOTAL 2.9 0.2 MAINTENANCE FACILITIES
MFW05NGI Construct Northern Group regional facility for repair of plant and machinery 0.2 0.1
MFW03SGI Build new facilities and supply tools for Aitutaki, Atiu and Mauke 0.6 0.2
MFW04NGI Build new facilities and supply tools Rakahanga, Palmerston and Nassau 0.5 0.2
MFW01SGI Modify and refurbish facilities and supply tools on Mangaia, and Mitiaro 0.3 0.1
1-5 Years
MFW02NGI Modify and refurbish facilities on Penrhyn and Pukapuka 0.3 0.1
OVERALL TOTAL 1.8 0.6 EVACUATION CENTERS
EMW04NGI Construct and furnish new EMC on northern islands 6.1 0.1 1-5 Years EMW03MHX Complete repair works on Manihiki facilities 0.4 0.0
SHORT TERM TOTAL 6.5 0.1
EMW02SGI Modify and refurbish existing facilities on southern islands 1.7 0.2 5-20 Years
EMW01RAR Refurbish existing facilities on Rarotonga 0.9 0.1 OVERALL TOTAL 9.1 0.3
SHORT TERM TOTAL - ALL SECTORS 55.2 2.6 OVERALL TOTAL - ALL SECTORS 237.5 7.3

138
C. Sector Commentary
626. Table 46 summarizes the capital and O&M costs of projects in the Master Plan by sector. As clearly shown in Figure 11, Marine Transport has the highest capital cost requirement. In the short term the major need is to reconstruct the Outer Island harbors damaged by cyclones. The construction costs are high but the facilities should operate for many decades. In the long term the high capital cost is for improvements to Avatiu Harbor and protection of Rarotonga’s north coast from the airport to Avarua which has been included in the Marine Transport Sector.
627. Roads have the second highest cost requirement because of the high cost of improving the inner ring road in Rarotonga and roads in Aitutaki and Outer Islands in the short term, and the cost of rehabilitating the main ring road in Rarotonga in the long term.
Table 46: Capital and O&M Costs By Sector Short Term 1-5 Years Total 20 Years
Sector No. of Projects
Capital Cost
$ million
% O&M Cost
$ million
Capital Cost
$ million
% O&M Cost
$ million
Air Transport 10 5.8 10.4% 0.23 31.0 13.1% 0.53 Marine Transport 15 12.3 22.3% 0.58 62.6 26.4% 0.73 Roads 7 8.8 16.0% 0.44 50.8 21.4% 0.78 Water Supply 18 9.4 17.0% 0.13 23.5 9.9% 1.07 Sanitation 9 4.8 8.7% 0.27 11.0 4.6% 0.59 Solid Waste Management 5 1.0 1.8% 0.08 2.9 1.2% 0.23 Energy 13 4.9 8.9% 0.18 44.8 18.9% 2.40 Maintenance Facilities 5 1.8 3.2% 0.59 1.8 0.7% 0.59 Evacuation Mgt Centers 4 6.5 11.7% 0.09 9.1 3.8% 0.34
Total 86 55.2 100.0% 2.58 237.5 100.0% 7.25 628. Energy requirements are to rehabilitate power systems in the Outer Islands in the short-term. The high cost in the long-term is created by the need to construct a second power generation plant in Rarotonga which will require government funding. Total Energy sector costs are much higher than shown if TAU’s capital improvement program is included. However, because it will be internally funded it is excluded from the Master Plan.
629. Air Transport priorities are to improve the Northern Group airports for Saab 340 service and provide a separate departures area in Rarotonga Airport. Longer term capital costs are to implement cyclone protective measures at Rarotonga and continue improvements of the Outer Island Airports.
630. Water Supply improvements are needed in all islands and are given a high priority. Capital costs of individual projects tend to be less than the civil works costs associated with harbor or airport improvements. Over the 20 year period O&M costs are proportionately higher.

139
Figure 11: Capital Costs by Sector
0.0
10.0
20.0
30.0
40.0
50.0
60.0
70.0
Maintenan
ce Fac
ilities
Solid W
aste M
anagement
Evacu
ation M
anagem
ent Centr
es
Sanitatio
n
Water Supply
Air Trans
port
Energy
Roads
Marine Transp
ort
Cap
ital C
ost E
stim
ate
$ M
illio
n
Long Term 5-20 Years
Short Term 1-5 Years
631. Sanitation improvements are needed in all islands with highest priority given to treatment plants in Rarotonga. Overall capital costs are not as high as other sectors therefore it should be possible to achieve all targets for the Sanitation sector. The same principle applies to Solid Waste Management.
632. Provision of Evacuation Management Centers in all islands is one of the highest priorities and has the fourth highest capital cost in the short-term. Equally, Maintenance Facilities have to be provided in all Outer Islands in the short-term to improve the Island Administrations’ capacity to maintain all other infrastructure.
D. Island Commentary
633. The distribution of capital costs across the islands is shown in Table 47. In the short term about 60% of costs are for projects in the Outer Islands (excluding Aitutaki) with only 32% in Rarotonga and 8% in Aitutaki. This is to be expected given the Outer Islands’ needs in all sectors and the high capital costs of harbor and airport projects in current programs.
634. In the longer term, projects in Rarotonga represent 67% of total capital cost, Aitutaki 12% and the Outer Islands 21%. After priorities in the Outer Islands are satisfied in the next five years the focus must be redirected to addressing major investments required in nearly all sectors. Several projects such as coastal protection, road rehabilitation and harbor improvements involve high capital costs and will require staging over several years.

140
Table 47: Capital Costs by Island Short Term 1-5 Years Total 20 Years
Island Capital Cost
$ million %
Capital Cost
$ million %
Rarotonga 17.8 32.21% 159.9 67.33% Aitutaki 4.6 8.24% 29.1 12.23% Atiu 1.9 3.38% 2.6 1.10% Mangaia 4.0 7.32% 9.4 3.97% Mauke 2.9 5.29% 3.7 1.55% Mitiaro 3.3 5.98% 4.1 1.71% Manihiki 3.5 6.41% 3.5 1.49% Nassau 0.3 0.60% 0.3 0.14% Penrhyn 1.7 3.08% 1.7 0.72% Pukapuka 3.3 5.89% 3.5 1.48% Rakahanga 0.1 0.14% 0.1 0.05% Outer Islands 2.8 5.11% 2.8 1.19% Southern Group Islands 0.8 1.49% 5.5 2.32% Northern Group Islands 8.2 14.86% 11.3 4.74%
Total 55.2 100.00% 237.5 100.00% Rarotonga 17.8 32.21% 159.9 67.33% Aitutaki 4.6 8.24% 29.1 12.23% Outer Islands 2.8 5.11% 2.8 1.19% Southern Group 12.9 23.45% 25.3 10.65% Northern Group 17.1 30.98% 20.5 8.61%
Outer Islands Subtotal 32.9 59.54% 48.6 20.45% Total 55.2 100.00% 237.5 100.00%

PART 2: INSTITUTIONAL ANALYSIS & PREVENTATIVE CAPACITY DEVELOPMENT

142

143
PART 2: INSTITUTIONAL ANALYSIS & PREVENTATIVE CAPACITY DEVELOPMENT
I. INTRODUCTION
635. The objective of this part of the report is to assess the governance, effectiveness and policy frameworks for the delivery of essential basic services; to assess the management of infrastructure assets and the management and disbursement of disaster recovery funds; and to make recommendations for changes to improve effectiveness and efficiency.
636. The first section will describe the current government structures and identify which agencies are relevant to the current Technical Assistance (TA).
637. The second section will identify, discuss and make recommendations regarding the following issues that cut across all of the infrastructure sectors.
A. A National Economic Development Strategy B. Project Implementation C. Management and Maintenance of Outer Islands Infrastructure D. Private Sector Participation E. Legislation and Regulations F. Land G. Municipal Services H. Monitoring Water Resources I. The Principle of User Pays or Cost Recovery.
638. The third section will undertake a detailed analysis for each sector. Existing policy, legislation and regulations will be assessed. Business plans and the responsibilities and performance of participating stakeholders will be reviewed. The analysis will identify institutional constraints, discuss alternative strategies for addressing these constraints, and make specific recommendations for improved sector efficiency and service delivery.
639. The analysis of crosscutting and sector-specific issues and proposals for institutional changes will be summarized in the final section.
II. SUMMARY OF BUDGET EXPENDITURES 2005-2006
640. Government recurrent and development expenditures extracted from the 2005-2006 Appropriation Amendment are summarized in Table 48 Table 49 and Table 50. Table 48 shows the government’s and island administrations total recurrent gross expenditure of NZ$53.2million and capital expenditure of NZ$5.3 million. The capital expenditure budget is supplemented by further foreign funding of NZ$14.1 million = NZ$19.4 million.

144
Table 48: Budget Estimates for 2005-2006
Gross Expenditure
Trading Revenue
Net Appropriation
Gross Expenditure
Trading Revenue
Net Appropriation
Ministries & Ministerial Support 42,958,894 1,892,200 41,066,694 43,775,918 1,901,100 41,874,818
Outer Islands 9,420,399 2,308,194 7,112,205 9,420,399 2,308,194 7,112,205
Total Recurrent Expenditure 52,379,293 4,200,394 48,178,899 53,196,317 4,209,294 48,987,023 Capital Expenditure 2,706,640 2,706,640 2,894,640 2,894,640
Capital Contingency for Outer Islands 2,400,000 2,400,000
Total Capital Expenditure 2,706,640 - 2,706,640 5,294,640 - 5,294,640 Foreign Funding 14,142,000 14,142,000 14,142,000 14,142,000
Total Development Expenditure 16,848,640 - 16,848,640 19,436,640 - 19,436,640
Total Expenditure 69,227,933 4,200,394 65,027,539 72,632,957 4,209,294 68,423,663
Description
2004-2005 2005-2006 Estimates
Source: Cook Islands Appropriation Amendment 2005-2006 641. The breakdown of capital expenditure and foreign funding by island is shown in Table 49. The exact amount spent in each island is not known because the capital contingency for outer islands in the capital expenditure column (NZ$2.4 million) and the usage of a major portion of foreign funding (NZ$11.682 million) have yet to be determined.
Source: Cook Islands Appropriations Amendment 2005-2006
642. The breakdown of capital expenditure and foreign funding by sector is shown in Table 50 and again the breakdown of the capital contingency for the outer islands and the foreign funding have yet to be determined.
Is la n d
R a ro to n g a
A itu ta k i
A t iu
M a n g a ia
M a u k e
M it ia ro
M a n ih ik i
R a k a h a n g a
P a lm e rs to n
P e n rh yn
P u k a p u k a
N a s s a u C a p ita l C o n tin g e n c y fo r o u te r is la n d s F o re ig n A id
T O T A L
C a p ita l E x p e n d itu re
2 ,8 9 4 ,6 4 0
T o ta l
3 ,5 9 4 ,6 4 0
A id F u n d in g
7 0 0 ,0 0 0
2 ,4 0 0 ,0 0 0
1 7 4 ,0 0 0
2 4 ,0 0 0
5 2 ,0 0 0
2 4 ,0 0 0
1 2 4 ,0 0 0
5 3 4 ,0 0 0
3 5 2 ,0 0 0
3 8 ,0 0 0
3 8 ,0 0 0
4 0 0 ,0 0 0
5 3 4 ,0 0 0
3 5 2 ,0 0 0
5 2 ,0 0 0
-
1 7 4 ,0 0 0
2 4 ,0 0 0
2 4 ,0 0 0
1 2 4 ,0 0 0
3 8 ,0 0 0
3 8 ,0 0 0
4 0 0 ,0 0 0
2 ,4 0 0 ,0 0 0
1 1 ,6 8 2 ,0 0 0
1 9 ,4 3 6 ,6 4 0 5 ,2 9 4 ,6 4 0 1 1 ,6 8 2 ,0 0 0
1 4 ,1 4 2 ,0 0 0
Table 49: Budget Estimate 2005-2006 by Island

145
S e c to r
T ra n s p o rt- ro a d s
T ra n s p o rt- a ir
T ra n s p o rt- p o rts
W a te r
S a n ita tio n
S o lid W a s te
E le c tr ic ity
T e le c o m m u n ic a tio n s
H e a lth
E d u c a tio n
E n v iro n m e n t
O th e r - B u ild in g s O th e r - E q u ip m e n t/M a c h in e ry O u te r Is la n d s
O th e r
T O T A L
5 7 8 ,6 4 0
5 ,2 9 4 ,6 4 0 1 4 ,1 4 2 ,0 0 0 1 9 ,4 3 6 ,6 4 0
2 ,4 0 0 ,0 0 0 2 ,4 0 0 ,0 0 0
1 1 ,6 8 2 ,0 0 0 1 1 ,6 8 2 ,0 0 0
C a p ita l E x p e n d itu re A id F u n d in g T o ta l
5 0 0 ,0 0 0 5 0 0 ,0 0 0
8 5 0 ,0 0 0 8 5 0 ,0 0 0
1 ,1 0 0 ,0 0 0 1 ,1 0 0 ,0 0 0
7 7 5 ,0 0 0 2 1 0 ,0 0 0 9 8 5 ,0 0 0
-
3 0 ,0 0 0 3 0 ,0 0 0
1 2 0 ,0 0 0 1 2 0 ,0 0 0
3 0 0 ,0 0 0 3 0 0 ,0 0 0
6 0 0 ,0 0 0 6 0 0 ,0 0 0
1 4 0 ,0 0 0 1 4 0 ,0 0 0
2 1 ,0 0 0
1 3 0 ,0 0 0 1 3 0 ,0 0 0
5 7 8 ,6 4 0
2 1 ,0 0 0
Source: Cook Islands Appropriations Amendment 2005-2006 643. The amount spent on operations and maintenance of facilities and equipment is not known at present because a part is contained in Recurrent Expenditure, for example staff emoluments and spare parts, and the remainder is contained in Capital Expenditure in the form of repairs and rehabilitation works.
III. CURRENT GOVERNMENT ORGANIZATIONAL STRUCTURE
644. Faced with a financial crisis that included difficulties to meet loan repayments and a treasury struggling to make fortnightly salary payments, the Cook Islands (CI) Government undertook wide-ranging restructure and reform of agencies between 1996 and 1998.
645. The number of government ministries and departments were drastically reduced through rationalization and consolidation. For example, the ministries and departments of Treasury, Taxation, Customs, Inland Revenue and Statistics were merged into a single Ministry of Finance and Economic Management (MFEM). The number of public servants was reduced from over 3,000 to around 1,200. This latter number has increased over time to a current payroll of around 1,600. Figure 12 depicts the existing agencies, presented under the relevant Ministers.
Table 50: Budget Estimate 2005-2006 by Sector

146
Figure 12: Existing Cook Islands Government Agencies

147
646. Part of the restructure of 1996 was the incorporation as State-owned enterprises (SOE) of the further financially sustainable activities (beyond those that were already in existence and financially sustainable at the time) relating to the provision of electricity to Rarotonga and the operation of international airports and harbors for Rarotonga and Aitutaki.
647. Coupled with the restructure and downsizing of the public service was the significant decentralization of functions to Island Governments. Difficulties with capacity soon resulted in the recentralization of both education and health services except for Palmerston and Rakahanga Island which maintain full devolution for all Government Services.
648. Detailed institutional profiles including an analysis of relevant legislation and regulations, albeit with an emphasis on environmental management, have been carried out in 2003 under Asian Development Bank (ADB) TA 4273-COO (Technical Assistance to the Cook Islands for Legal and Institutional Strengthening of Environmental Management) for the majority of the agencies of government. The quality of this work is such that no replication will be carried out. However the institutional profiles will be reviewed with respect to the essential assets considered under the TA scope and included in the sector analysis below.
IV. CROSS-CUTTING ISSUES
649. This section discusses and makes recommendations regarding issues that have been identified to cut across all groups of the infrastructure sectors.
A. A National Economic Development Strategy
650. Since the meltdown of the early 1990s, good financial management and discipline have brought fiscal stability to the economy. This has not been matched with the development of a National Economic Development Strategy (NEDS) based on economic realities and social priorities. While the National Sustainable Development Plan (NSDP) provides a basis for such planning and initiates the establishment of service baseline data, indicators and targets, it is questionable whether these targets are either realistic or reflective of the true economic potential and social priorities of the country.
651. The lack of a realistic economic strategy hampers the development of genuine policy and the translation of that policy into business and action plans with achievable targets. The questionable validity of many of the indicators in business plans, the absence of baseline data, and the unrealistic nature of associated targets are a reflection of the absence of pragmatic vision for future economic and social goals. That the monitoring of these indicators is superficial at best is a logical consequence of this situation.
652. It is recommended that the policy and planning capacity of the Office of the Prime Minister (OPM) be strengthened through the development of a Policy and Planning Unit (PPU). The PPU would provide guidance and leadership in the development of a NEDS and subsequent sector policies. The PPU would then be able to assist public institutions in the development of business and action plans with indicators, baseline data and targets that would be realistic and capable of providing valid information to an ongoing and effective monitoring and evaluation system.
653. A capable PPU would establish a monitoring and evaluation system and monitor sector performance against a suite of valid indicators measuring efficiency and effectiveness. The analytical reports produced would then better inform decision-making and foster productive management. Carefully chosen indicators can also provide a broad

148
measure of the social, environmental and economic impact of an overall infrastructure program. A regular and sustained monitoring program will assist in assessing whether expectations are being met, in the early identification of problems and constraints, and in the development of appropriate and timely interventions.
654. Both the Public Service Commission (PSC) and Public Expenditure Review Committee and Audit (Audit Office) conduct annual evaluations. The former monitors the performance of the contractual obligations of heads of ministries and island secretaries. The latter monitors and evaluates financial performance.
655. Despite a lack of capacity, OPM strives to meet regional and international obligations such as reporting on nationally, regionally and globally agreed targets, e.g. the Millennium Development Goals (MDG) and Pacific Plan.
B. Project Implementation
656. Government is concerned with the inability of its institutions to: manage and disburse disaster recovery funds; develop projects that meet national, international or bilateral donor criteria in a timely fashion; implement a project cycle; and achieve a high rate of project completion.
657. It is stated that the various line ministries are not capable of developing the necessary documentation to initiate projects. Even when project documentation is developed and funds are allocated, line ministries and Island Administrations (IAs) have not been capable of completing projects;
658. The Aid Management Division (AMD) was established as an interim organization to coordinate the implementation of development projects for the Outer Islands (OI) until such time as a permanent and well resourced organization could be established. Initially AMD coordinated OI infrastructure construction and upgrade projects funded under the Development Partnership Agreement (DPA) between the New Zealand Government, the Australian Government and the Cook Islands Government.
659. The DPA established robust and transparent procedures for all aspects of the project cycle. The success of these processes has led to their increased use in the implementation of projects funded under the government’s own capital expenditure (CAPEX) budget. Government has indicated that it is considering using the DPA process (with minor additions to meet loan covenants) for the implementation of all future major projects.
660. Cabinet, as late as mid October 2006, instructed the PSC and the MFEM to put in place a well resourced institutional structure to ensure development projects were developed, implemented and completed in a timely fashion. This TA needed to identify an institutional structure and processes that would provide government with the best possible chance of implementing the infrastructure projects in the master plan.
661. Wide-ranging consultations with government ministries, statutory authorities and Island Governments led to a high-level consultation with central Agencies to discuss options for an institutional structure to undertake the planning, implementation and completion of projects. The consensus was that a short- to medium-term solution was required and that this would best be done by strengthening one section of government within a central agency, preferably within MFEM, for a period of 5 to 6 years. The AMD was identified for immediate expansion. It was noted that the Cook Islands Investment Corporation (CIIC) had successfully implemented several infrastructure projects in recent months.
662. It was proposed that the AMD would be restructured and would be renamed as the Project Development Unit (PDU). The proposed PDU will:
• coordinate the planning of development projects;

149
• facilitate national development investment programs and priorities for consideration by the Project Coordination Committee (PCC), Aid Coordination Committee(ACC) and Cabinet;
• act as an overall ‘Executing Agency’ to ensure that the development projects selected by Cabinet are implemented in a timely manner;
• appoint an ‘Implementing Agent’ for each of the selected projects; • ensure that funds from various sources (government, donors and external loans) are
made available as required; • manage and monitor project implementation to ensure that government and donor
requirements are met; and • report to Cabinet through ACC on the implementation of development projects.
663. The PDU would require both project management and technical capacity with maximum utilization of local capacity through inter-agency transfers. However, if internal transfers would compromise existing ministry performance, external capacity should be utilized to ensure the timely recruitment of staff to all positions.
664. Apart from two full-time technical staff, the unit would have the capacity to engage short-term (1 to 2 years or 3 to 6 months) specialist skills. Project Managers would be contracted from the private sector to assist in the development of projects or to supervise the implementation of turnkey projects. Donors will be approached to attach TAs to the Unit. It was stated that the concept of borrowing personnel from various ministries was fraught with difficulties. The personnel were often not available when required and there were problems with the payment of salaries. It is necessary to recognize the importance of individual champions within small systems. As such it will be necessary to introduce remuneration strategies that ensure manpower stability over the 5 to 6 year period.
665. Figure 13 below depicts the proposed project implementation strategy. While the PDU would be the Executing Agency, the process of project implementation should be flexible enough to allow for a variety of mechanisms., For instance:
• where a line ministry authority (e.g. Cook Islands Airport Authority (CIAA) or Ministry of Works (MOW)) has the technical and managerial capacity, they would be appointed as Implementing Agency for the project;
• if the relevant line ministry does not have the capacity to successfully implement a project, another statutory authority or ministry could take on the role of implementing agency (e.g. CIIC or MOW);
• the Unit itself will at times take on the role of Implementing Agency utilising its own fulltime staff or staff specifically contracted from the private sector.
666. Whichever arrangement, or combination thereof, is chosen it is expected that the Implementing Agencies will need to supplement their capacity by engaging consultants to undertake project management, feasibility studies, engineering designs and cost estimates, tender document preparation, tender evaluation and construction supervision.

150
Figure 13: Proposed Project Implementation Strategy Notes: 1 All SOEs must report to CIIC. CIIC (Manages Crown Property), itself, is also an Implementing Agency. C. Management and Maintenance of Outer Islands Infrastructure
667. The devolution reform of 1996 saw the responsibility for the management, operation and maintenance of all island infrastructure pass into the hands of Island Administrations. A lack of technical capacity, funding and regular maintenance has resulted in deteriorating OI services.
668. The Office of the Minister of Island Administration (OMIA), or more correctly, its predecessor the Ministry for Outer Islands Development (MOID), was established to facilitate the devolution process from the central government to the OIs. It was also intended to provide support and advice to the Island Councils and Island Administrations on governance, financial management and infrastructure development and operations and maintenance.
669. While OMIA has continued to provide the former services, its lack of technical skills has resulted in it no longer being directly involved in infrastructure, other than the overhauling of electrical generators (at its workshop situated in MOW) and the contracting out of the repairs of heavy machinery. MOW and Te Aponga Uira (TAU) have provided technical assistance to the OIs but neither has the resources or budget to officially provide these services and they provide them only an “if able to” basis at present. This is not a satisfactory situation and reports from the OIs reflect this dissatisfaction wrongly laying the blame for slow response on OMIA. On the other hand however, IAs are unanimous in their praise and continued need for the corporate assistance and support provided by OMIA. This is stated to be of particular importance in the areas of corporate planning, communications, financial planning (budgets), monitoring, analysis and reporting.
670. Maintaining the status quo will institutionalize the current constraints and will do little to improve the situation. An option for improvement would be to increase technical expertise within OMIA giving additional capacity to deliver the support services needed by the IAs to operate and maintain their mechanical, energy, water, sanitation, roads and harbor assets.
PCC
AMD
CIIC 1
MOW
PDU
Implementing Agencies
Cabinet
CIAA Cook Islands
Port Authority (CIPA)
Te Aponga
Uira (TAU)
CIIC
Executing Agency
Office of the Minister of
Island Administration
(OMIA)
OPM

151
Given Government’s limited technical capacity, this option would only be viable if funding was provided to hire additional technical staff.
671. Another option is to attempt to improve the utilization of government’s scarce technical resources by providing central support to the IAs using the existing resources in MOW and TAU on a fee-for-service basis. MOW would be responsible for supporting IAs with planning, construction, operations and maintenance for water, sanitation, solid waste, roads and mechanical services. TAU would provide similar services for energy. MOW and TAU may find it necessary to contract out the provision of some of the services to the private sector where feasible. This option would mean that OMIA would no longer need technical staff thereby allowing it to focus on administrative, financial and legal support to the Island Councils (ICs) and IAs. ICs and IAs would develop budgets for infrastructure-related activities in consultation with the respective technical agencies.
672. IAs could deal directly with the assigned liaison staff in each of the technical agencies. However this would be inefficient and a further duplication of scarce resources. A preferred option for IA - technical agency liaison would be to have OMIA act as the expeditor and point of contact between the OIs and the technical agencies. This option would be in keeping with OMIA’s successful corporate services role.
673. IAs will remain responsible, with OMIA assistance, for managing their own technical staff. There would need to be agreements made in advance on the expected work required in each island in order to (1) determine the budgets required; and (2) enable the central agencies to plan their OI support programs. OMIA would coordinate these activities and be initially responsible for the disbursement of the allocated funding. The technical agencies would then be able to organize their staff and financial resources with the knowledge that they would be called upon to provide technical services to OIs and that funding would be available for the provision of these services. The need for additional contracting to the private sector would also be identified.
674. The principle of OIs being responsible, within the constraints of their capacities, for the planning, construction, operation and maintenance of island infrastructure is central to the institutional arrangements recommended above. An ongoing assessment of IA skills and regular capacity building of their technical and administrative staff is therefore paramount. OMIA could, in liaison with IAs, the technical ministries and the Department of National Human Resource Development (DNHRD), undertake skills audits and training needs analysis. The results of these assessments will instruct on-going training of IA Infrastructure staff.
675. While up-skilling courses in Rarotonga and on-island continue to build OI capacity they remain a short-term answer and not a solution to the overall vision of having qualified technical staff on all islands. OMIA will need to liaise with DNHRD and technical agencies to provide OI staff with opportunities to undertake accredited training and gain qualifications. IA and visiting skilled staff also need the tools and facilities with which to operate and provide quality training. Machinery, for example, needs to be protected. The Master Plan includes the provision of tools and refurbishing of existing workshops and the provision of new workshops for islands that do not have such facilities. These resources and facilities would reduce duplication, centralize technical capacity, strengthen management skills, maximize private participation, and through improved efficiency and service quality move closer to a situation where user-pays systems could be introduced for the OIs. The vision is one of an incremental improvement of the OIs ability to develop and manage their planning, budgets, and projects.
D. Private Sector Participation

152
676. Consultations revealed a widely held belief of both government and civil society that maximizing private sector participation in the construction and operation and maintenance of infrastructure will result in increased efficiencies and improved and more sustainable levels of services. Several levels of increased private sector participation were identified by government and other stakeholders in all sectors. Specific options for increased private sector participation will be discussed in detail in each of the sector reviews where recommendations are made for maximizing efficiencies, lowering costs and improving levels of service.
677. At a very basic level, opportunities exist for the engagement of community groups and small contractors to undertake labor-based government equipment supported (LBGES) activities such as the maintenance of roads, harbors and airfields in the OIs. Provided Government already has, or contracts in, the supervisory skills, LBGES activities are cost-effective. Government could utilize such processes for smaller construction activities included in the Master Plan.
678. A second level of private sector participation could be the contracting out of services. Incremental contracting out of project preparation and implementation, and the operation and maintenance of infrastructure is supported by all stakeholders. There is, for example, strong support for contracting out to the private sector all heavy machinery maintenance and operations. This could involve a higher level of private sector involvement in which existing government assets are leased out to the private sector. An example of the successful implementation of this strategy is that of the crusher in Rarotonga that was operated by MOW and is now contracted out to the private sector. All stakeholders agree that the efficiency and productivity of the operation has improved as has the quality of the plant’s maintenance.
679. Because of its relatively small size, the private sector admits it may not possess the full range of skills and competencies required to carry out all of works contained in the Master Plan. However the private sector argues that preference should be given to locally owned companies who have the capacity to leverage the required skills and expertise through partnerships with overseas companies. The institutionalizing of such a preferential system should be undertaken in full cognizance of the inevitable initial increase to project costs. The benefits however of such a strategy will be the development of capacity and the increased capability of the local contracting and consulting industry which will, in time, bring its own efficiencies and economies.
680. Small contractors state that many of them do not have the documentation skills necessary for engaging in the bidding processes. It is recommended that government, in conjunction with the private sector and the Chamber of Commerce, develop and provide specific training opportunities to assist contractors to participate in the Master Plan implementation process. Private sector involvement may include consulting engineers, equipment suppliers and contractors working in the Cook Islands, or with close links with partners in other Pacific states.
681. Another level of private sector participation is that of public-private partnerships (PPPs). Potential future opportunities for PPP involve the development and operation of an environmental and clinical laboratory facility, and operation and management of international harbors and airports. The improved organizational and service efficiencies resulting from PPP arrangements with Maritime Cook Island Ltd is the model for such future enterprises.
682. The highest and most controversial level of private sector participation involves the outright sale of government assets and activities to the private sector. There is widespread concern within the community that such practices could, with regard to essential services, lead to unacceptable monopolies and unacceptable increases in pricing. Landowners argue that land granted to government for the provision of public services should not be sold to individuals or companies for personal profit. Contrary arguments include the entrenchment of safeguards for consumers through, for example, the establishment of arbitration tribunals,

153
service quality standards and price monitoring. This report does not recommend the full privatization of any government infrastructure assets.
683. The private sector believes that greater participation on their part will require Government to develop a more attractive and transparent operating environment with commercially attractive and consistent Government policy. There must also be reduced Government interventions and crowding out of private initiatives as a result of Government agencies providing competing services. Increased private sector investment would require consistency of planning, programming and funding on the part of the Government and donor agencies, and longer-term supply and maintenance contracts.
684. Building on the successful private sector consultations carried out during this TA and the continued interest of the private sector to engage with government, OPM and AMD should organize a workshop/forum with the private sector and its peak bodies to develop strategies to increase participation of the private sector in all aspects of infrastructure maintenance and construction. The workshop/forum should facilitate:
• Development of an understanding by both public and private sectors of each others aspirations, concerns and constraints;
• Taking steps to consolidate and maintain the existing register of all potential private sector participants (including their capacity and pricing);
• Development of mechanisms for regular, transparent and wide-reaching dissemination of opportunities for private sector participation.
E. Legislation and Regulations
685. Outdated and inappropriate legislation and the inability for new legislation and regulations to be developed and approved in a timely fashion are important cross-sector constraints identified by stakeholders.
686. Much of the Cook Islands Act 1915 (a code for the colonial administration of the Islands by the government of New Zealand) remains in force today. This Act established a High Court and a Native Land Court and declared that the laws of New Zealand applied in the Cook Islands except where inconsistent with the Cook Islands Act 1915.
687. At self-government in 1965, a written Constitution was enacted preserving existing laws but declaring that no further enactments of New Zealand would have any effect in the Cook Islands without specific application by the Cook Islands Legislative Assembly. In the early years of self-government, the Cook Islands Legislative Assembly enacted an annual "New Zealand Laws Act" which simply contained a Schedule of the short titles to the New Zealand amending enactments. While providing an effective methodology for keeping up with changes to New Zealand enactments which applied in the Cook Islands, this strategy deprived the Legislative Assembly of any opportunity to debate the amendments. This shortcut arrangement was abandoned in the 1970s but the logistics of keeping up with required amendments has proved too great for both legal draftspersons and the legislature. Many Acts from New Zealand continue to apply in the Cook Islands without the advantage of recent amendments.
688. Today the Cook Islands Parliament is the sole law-making authority for the Cook Islands although New Zealand continues to be a major source of reference for new enactments. Increasingly, CI legislators and draftspersons have looked further afield for policies and precedents considered to be more applicable to Cook Islands conditions.
689. One of the core functions of Crown Law is the drafting of legislation. The following is the official process for all proposed new legislation, amendments and deletions to existing legislation, regulations and codes:
(i) ongoing consultations take place with appropriate Minister;

154
(ii) stakeholders meeting to discuss concerns regarding legislation; (iii) once all concerns of stakeholders are captured, drafting instructions are
prepared: (iv) either private sector legislation draftspersons including local or overseas TA
or Crown Law prepare the first draft; (v) the first draft is circulated to stakeholders for comments; (vi) comments are incorporated and re-presented to a workshop of
stakeholders; (vii) upon consensus, the draft Bill is sent to Crown Law for final preparation; (viii) a Cabinet Submission is prepared and circulated with the Bill to Ministries
and agencies affected by the Bill; (ix) if further changes are required, the process of stakeholder consultation and
redrafting is repeated with incorporated changes; (x) on acceptance, the relevant Minister tables the Bill at Cabinet. If approved
the Bill is sent to the Clerk of Parliament for tabling in Parliament; (xi) if Cabinet raises concerns then the process of stakeholder consultation and
redrafting is repeated, with changes, and resubmitted to Cabinet. 690. Several important issues contribute to the current difficulties in developing and approving new legislation and regulations. There is a critical shortage of legislative drafting skills both within Crown Law and in government. Most recent drafting has been undertaken by overseas experts who are characterized, fairly or unfairly, as not being familiar with, or having sensitivity to, local ways and conditions. Many of the pieces of draft legislation are therefore seen as being imported from other countries and, lacking local input which would sufficiently adapt them to local needs. As a result, many drafts remain unapproved for long periods of time initially being passed from one agency to another for comment and finally sitting on the shelf to gather dust.
691. While there is some legitimacy to the preceding claims it is probably the process of drafting legislation and regulations that contributes mostly to the current situation. TA consultants are contracted for limited periods of time and consult and, as far as possible, work closely with, stakeholders to try to ensure that the draft legislation and regulations meet needs and are appropriate to local conditions. However, limited time and a lack of wide-ranging and timely local comment results in drafts that are usually not fully digested until after the consultant has left. For example, three TA consultants have worked on the legislation and regulations for the CI water and sanitation sector and, to date, there is no cross-ministry buy-in or ownership and no adoption of the new laws. However, as stated later in this section, this may prove to be fortuitous in the long run.
692. TA contracts for the development of legislation and regulations should take the realities of local participation into consideration and allow for sufficient time between the development of drafts and re-drafts for the inevitable slow response from stakeholders.
F. Land
693. Land issues are central to all infrastructure sectors and are identified by government as potentially the most costly constraint. The leases on land on which several government buildings stand are shortly to expire and government reports that landowners have advised that they will not be extended. Improvements and extensions of roads, airports and harbors will be dependent on government reaching mutually agreeable arrangements with landowners. All water sources and reticulated power and water networks are on privately owned land.
694. All land is customary or native land and the Land Court and the Leases Approval Tribunal of the Ministry of Justice and Land Court are the sole adjudicators of any and all acquisition (i.e. establishment of new title or transfer of an existing lease) and resettlement. Custom law and traditional land tenure instruct the formal system on all islands except on

155
Mangaia, Mitiaro and Pukapuka. On these islands, the Land Court has no jurisdiction and all authority lies with the traditional chiefs (also known as Ariki).
695. Legislation important for land matters comprise: Cook Islands Act 1915; Cook Islands Amendment Act 1946,1952 and 1954;Land (Facilitation of Dealing) Act 1970; Leases Restriction Act 1976; Unit Titles Act 2005; and the Land Use Act 1969.
696. All land on Rarotonga, Aitutaki, Atiu, and Mauke has been surveyed. The land on Penrhyn and Manihiki has not been surveyed and therefore customary negotiations and proceedings have to be followed prior to seeking endorsement and approval of the formal system.
697. The Land Court maintains a register of landowners for all surveyed land. Succession of surveyed and registered land from deceased landowners needs to be registered with the Land Court. The Land Registers are not always up-to-date.
698. The Survey and Land Information Service (SLIS) of MOW maintains a Land Register of Cadastral Boundaries. There is no legislation dealing with surveys and the New Zealand system is followed. There are no formal links between the Land Register held at the Land Court and the Land Register of Cadastral Boundaries. There were, until recently, no plans to harmonize the data from the two registers. It was recently reported that staff of CIIC are planning such a harmonization exercise. This activity must be supported. Authenticated copies of cadastral maps from SLIS are essential for the initiation of land dealings of surveyed and registered land. The SLIS does not conduct any surveys. All surveys are prepared by private surveyors and approved by SLIS.
699. The Crown has the right to ‘expropriate’ land by warrant either in perpetuity or for a limited period. The use of this process is anathema to the current custodians of traditional land. The process is however legal though politically not palatable.
700. The accepted process is for negotiation to be undertaken with landowners (the process is made easier if the land is registered and the Registers are up-to-date) or with customary chiefs, leaders and the community in cases where land is not surveyed and registered.
701. Negotiations will include the pacing and marking out of land followed by a detailed survey and a social and economic study identifying all landowners and those with ownership and land usage rights. Agreements to lease are documented and include agreed lease payments for the land and compensation for loss of assets such as houses and production benefits. New surveys are registered with SLIS and included in the Land Register of Cadastral Boundaries.
702. The difficulties, costs and time associated with land acquisition and permission for usage should not be underestimated. As noted earlier, MOW, Ministry of Transport (MOT) and TAU highlighted land issues as a crucial constraint to the development of roads, water, sewage, airports and power transmission. The Ministry of Justice noted that land disputes outnumber all other categories of cases before the courts. Prior and timely identification of land requirements is an essential starting point. Careful planning, well conducted social and economic surveys and broad-based culturally sensitive consultations such as those required for ADB funded projects will contribute to successful outcomes.
G. Municipal Services
703. The protection of water resources (a term used here to include lagoon, surface and ground water) is perhaps the most important economic and social issue facing the Cook Islands. The importance of this sector is highlighted by the results of the application of the project ranking instrument described previously in Part 1. Two independent applications27 of 27 Once by the TA team and once again by a focus group comprising of senior government, civil society and
private sector representatives.

156
the instrument to all projects in the Master Plan ranked projects dealing with water, sanitation and solid waste across the country amongst the highest priority.
704. The water sector is currently fragmented, supply-driven and lacking in coherent policies and strategies. Legislation for the sector requires strengthening in order to pave the way for reforms.
705. Under existing legislation, three government agencies share the major responsibilities for water, sanitation and solid waste (hereafter referred to as the water resources sector). The review undertaken during ADB TA 4273-COO28 identified fragmented institutional arrangements that lacked coordination between the three government agencies involved. The fragmentation results in ineffective management regimes and no clear ownership of policies and planning or regulation at the national level. The lack of ownership and failure to take responsibility is borne out by the failure of government institutions to act on the recommendations of a number of recent studies, legislation and regulations. The fragmentation of responsibility and lack of coordination between ministries of limited capacity are major institutional constraints to the development of policies and strategic plans, the effective operations and maintenance (O&M) of assets, and the monitoring and enforcement of standards. The consequence is a poor quality service evidenced by the reticulation of non-potable water and uncontrolled pollution of lagoons and water tables.
706. Public Health and, more recently, the private sector has shown some leadership but without coordination between the ministries there is doubt about the long-term effectiveness of the strategies proposed between them. Without effective and coordinated management it is difficult to formulate a sustainable development plan. Some options for going forward are outlined below. However there are two important prerequisites for genuine progress in the sector. The first is the already stated requirement for government to urgently develop a realistic NEDS. The second is for government to develop strategies to ensure that all government stakeholders take ownership, reduce fragmentation, and display a willingness to take responsibility for the development and implementation of a national water resources strategy.
707. Considering that the same three government agencies share the major responsibilities for water, sanitation and solid waste, the following summary of the current status of policy and regulation for the sector clearly illustrates the fragmented state of the sector.
• MOW and IAs have responsibility for the operation and maintenance of water supply systems and there is no national policy. Existing regulations currently consist of the Waterworks Ordinance of 1960, which is still in force, and which provides for the charging of an annual levy on the use of water. Three supply driven committees were recently formed as a result of a regional initiative and none of these are functioning. Draft legislation recommends the establishment of a Water Board;
• Despite the inputs of several TAs there is no accepted sanitation policy or regulations and there is ongoing conjecture as to which government institution should take on responsibility. Draft regulations recommend a Sanitation Board.
708. The National Waste Policy and Strategy are in limbo having been prepared and submitted to the National Environment Service (NES) more than 2 years ago. There are plans to form a permanent Solid Waste Committee based on the group formed to monitor the recent ADB Waste Management Project.
28 ADB TA 4273-COO: Technical Assistance to the Cook Islands for Legal and Institutional Strengthening of
Environmental Management. 2003.

157
709. The current state of disarray in the sector could, in fact, be seen as fortuitous if one considers that if the proposals under consideration were, or had been, implemented they may further contribute to the ongoing fragmentation.
710. The following options are suggestions for the future:
(i) continue with the status quo and cease policy and regulatory work in the sector until such time as a NEDS is approved;
(ii) on completion of the NEDS, undertake a comprehensive sector-wide review with a view to developing consolidated policy and regulations, reducing duplication, consolidating capacity and incorporating international experience; (xii) maintain the status quo and move quickly towards the approval and
implementation of existing draft policy and regulations. MOW would maintain responsibility for water and solid waste and the Ministry of Health (MOH) for sanitation. NES would maintain its current responsibilities. This would, however, institutionalize the fragmentation and offers little hope for improvement. The medium to long-term effect of following such an option could be disastrous for the environment, economy and standard of living.
(xiii) transfer responsibility for sanitation to MOW but continue to maintain responsibility for water, sanitation and solid waste under different divisions i.e. Waterworks Division, a new Sanitation Division, and the Waste Management Division. The Waste Management Division is presently responsible for the Rarotonga Waste Facility which comprises the Septage ponds, landfill and the recycling centre.This strategy could begin to address some of the fragmentation issues but would involve duplication and, as experience has shown, even some divisions within the same ministries do not always work in close cooperation. Under this option, MOH would set guidelines and standards which NES would police.
711. The first option provides, in the opinion of this TA, the most potential for addressing the issues faced by the sector. However, making firm institutional recommendations at this time is highly contentious and beyond the scope of this TA. Government needs to develop its NEDS and take firm measures to build consensus between stakeholders. Government stakeholders must take ownership and display a willingness to undertake responsibility and reduce fragmentation. Until such time as these conditions are met there seems little benefit in commissioning more studies and little hope of formulating, adopting and implementing a national policy for the management of water resources.
H. Monitoring Water Resources
712. As stated above, effective care and management of water resources is critical for the economic and social wellbeing of the Cook Islands. Tourism, the major economic activity in the country, is dependent on the health of lagoons. Rarotonga’s reticulated water supply is completely dependent on the streams that flow to the coast from the central volcanic highlands. Apart from rainwater collected in household and community tanks, ground water lenses are the only source of water in all of the islands in the southern group including Aitutaki. The islands of the northern group depend solely on rain water collected in household and community tanks. The technical aspects of water quality are discussed in Part 1. This part of the report will deal specifically with the institutional aspects of the monitoring of water quality.
713. Water resource quality in the Cook Islands is affected by human habitation (septic tanks, sewage treatment systems, refuse dumps and landfills), and agricultural, livestock and industrial activities. The latter activity is the least important in the Cook Islands. The ministries of Agriculture, Works, Marine Resources, Health and the National Environment Service are, or at least should be, involved to some extent in the monitoring of water

158
resources. There is however no consistent monitoring regime and institutional arrangements for the monitoring of water resources are fragmented and lack co-ordination.
714. MOH undertakes some sampling and testing of water. However the program lacks funding and is not consistent. Traditionally the MOH clinical laboratory in Rarotonga hospital has provided the most reliable and accurate analytical services to the water and sanitation sectors. The laboratory is well equipped and staffed by technically competent personnel. The laboratory flies in technical experts from New Zealand to maintain and service equipment. However the laboratory lacks both the funding and the capacity to continue to provide the extensive and regular service required for a comprehensive monitoring regime.
715. MOW and NES conduct some sampling and testing but due to limited resources have not established rigorous or consistent regimes. The testing equipment currently being used by MOW and NES is of sufficient accuracy to identify major variations in the field caused by spills or contamination incidence. However the equipment is unsuitable for providing the consistent and accurate data required for an ongoing monitoring system. The technical staff of MOW reported wide variations between analytical results carried out on samples using their own field testing equipment and those obtained by the sophisticated MOH laboratory. The Ministry of Agriculture (MOA) is currently not conducting any monitoring.
716. The Ministry of Marine Resources (MMR) has the only consistent monitoring program in the Cook Islands. MMR has for the last three years obtained and tested samples from the tourism centers of Rarotonga (14 marine and 8 stream sites) and Aitutaki (15 marine and 4 stream sites) and the pearl production centers of Manihiki (6 marine sites), Rakahanga (2 marine sites) and Penrhyn (4 marine sites). The testing program was established with assistance from the New Zealand Aid Agency for International Development (NZAID). The National Institute for Water and Atmospheric Research (NIWA), a highly respected research organization and New Zealand’s leading provider of environmental research and consulting services, was retained to provide technical services and training.
717. MMR has two basic laboratories in Rarotonga; one to undertake biological testing and the other to prepare samples for air freighting to the NIWA laboratories. Equipment and chemical reagents were initially purchased with the assistance of NZAID. Consumables are purchased through MMR’s recurrent budget. Samples are taken on a regular schedule and tests conducted for a limited number of key indices. These tests provide an indication of general water quality and further tests are undertaken if abnormalities are recorded.
718. MMR owns and operates field testing equipment, similar to equipment used by MOW and NES, but reported limited accuracy when compared with analysis conducted on the same samples by NIWA. The current NZAID-funded program at MMR is aimed at developing MMR’s capacity to undertake future testing and includes capacity building and the purchase of sophisticated equipment for the measuring of suspended solids and chlorophyll. This equipment is still being calibrated in New Zealand. As with the MOH laboratory, MMR will need to have substantial operations and maintenance (O&M) budgets including funds to cover the cost of bringing qualified technicians in from New Zealand to service and maintain this new equipment.
719. Two major issues need to be addressed. The first requires the establishment of a coordinated monitoring regime. Given the limitations of capacity and resources, all stakeholders will need to commit to, and participate in, such a regime undertaking allocated sampling activities, pooling data and establishing a single data base.
720. Part 1 addresses the technical requirements of such a coordinated monitoring regime and Table 51 below briefly outlines what such a system would look like for Rarotonga showing possible locations for regular testing and responsible agencies.

159
Table 51: A Coordinated Water Resources Monitoring Regime Location for Regular Testing Responsible
Agency Hinterland above reticulation headwaters NES Water intakes MOW Land and ground water in agricultural areas MOA Water in reticulation system MOW Land and ground water in residential areas MOH / NES Reticulated water to consumers MOW Land and ground water below landfill and septage NES Lagoons MMR
721. The second and more difficult issue is establishing and ensuring funding of the cost of analysis. As noted above, the purchase of necessary equipment and the operation and maintenance of a testing facility needs substantial and ongoing funding. A recent study into the feasibility of establishing an in-country laboratory for the testing of environmental samples was funded by NZAID.
722. Four alternatives present themselves. The first is to increase the capacity of the existing MOH laboratory and convert it into a fee-for-service instrumentality. On-going funding would need to be allocated to undertake a sustainable monitoring regime. The services of such an expanded facility could be extended to both the medical and environmental private sector. There is however a growing resistance by MOH staff to test environmental samples in what is primarily a hospital-based clinical laboratory.
723. A second and preferred option is the establishment of a central testing facility for all environmental testing in conjunction with, and under the management of, the MOH laboratory. Donor funding would be required to equip such an institution and provide the training for staff. The CI government would need to fund the technical staff and the on-going O&M costs.
724. A third alternative would be to have all environmental testing conducted overseas. This option has been implemented during the Waste Management Project, where 3 sets of samples were taken and tested at MOW’s Waterworks Division, MOH’s laboratory and a New Zealand laboratory respectively for amongst other tasks a comparative analysis. This would be expensive and, as stated by government, could to lead to an unacceptable situation of having no in-country capacity.
725. The fourth option is to establish a central service within one of the government agencies that can undertake a limited range of tests as well as prepare samples for testing overseas. Such an establishment – an expanded version of what is currently operating at MMR – could enter into strategic partnerships with international research institutions to share resources and conduct joint research into environmental issues.
726. All of the alternatives for the establishment of a monitoring system will require guaranteed and on-going government funding. However, given the importance of water resources to the economic and social wellbeing of the Cook Islands, the question is can the government afford not to establish and maintain a monitoring system?
I. The Principle of User Pays or Cost Recovery
727. While people generally accept the principle of paying for electricity and telecommunications, there are historical and cultural constraints in the CI to the charging of fees for municipal services such as water and sewage and solid waste disposal. However, as the projects detailed in the Master Plan illustrate, increased development of infrastructure requires large capital and operational investment. Government must develop strategies for

160
recovery of costs (e.g. interest, charges, depreciation, maintenance, and monitoring). How will this be achieved?
728. Cost recovery is about consumers paying partial or full costs for the services they receive. Its purpose is to generate revenue for future service upgrades and extensions and can be used along with progressive block tariffs to generate subsidies for disadvantaged households. It is also a useful tool for demand management of power or water by penalizing over-users.
729. There are generally two philosophical approaches to cost recovery. The first puts the onus on government to recover all costs through the general tax system and the second is the introduction of user-pay system. These two approaches are briefly discussed below.
730. There is a case to be argued that for a small population such as the CI, municipal services should be paid for out of general taxation. This would require operating agencies to better understand the nature of their operations and to estimate the full cost of these services. There is little evidence of this in the water, sanitation, and solid waste sectors. It is essential that a full review of the municipal services (water, sanitation and solid waste) for Rarotonga and the OIs includes a cost survey. An understanding of the true costs involved may necessitate changes in the tax regime to ensure full cost recovery of all investments, to cover recurring operational costs and to ensure that the systems are not a drain on the national budget. The downsides of having municipal services met through indirect taxation are: there is no incentive for users to conserve and maintain household installation such as fixing leaking taps; the increased tax burden will be inequitably spread and users will not pay for what they actually use; government’s ability to invest in extensions and improvements is limited; and the system institutionalizes the current culture of waste and the disparities between Rarotonga and the OIs.
731. A user pays system would eliminate cross subsidies and may result in a reduction in general taxes which would compensate for the shift of funding responsibility directly to users. Such a system would be more equitable as users would pay for what they actually use. It would encourage conservation, a sense of ownership of assets, and a greater commitment by consumers to demand management and to maintain and repair in-house installations. The disadvantages of such a system would be the perceived increase in household expenditure as a proportion of net incomes and the potential increased cost burden on low income earners. It is essential that the broad social safety nets currently in place are not dropped in the name of fiscal responsibility.
732. Options for cost recovery within each of the municipal sectors are discussed in each of the relevant sections below.
V. SECTOR ANALYSIS
733. This section presents a detailed analysis for each sector. Existing policy, legislation and regulation have been assessed, business and action plans have been evaluated and the responsibilities and performance of participating stakeholders have been reviewed. The analysis identifies institutional constraints, discusses alternative strategies for addressing these constraints and, where appropriate, makes specific recommendations for improved sector efficiency and service delivery.
A. Air Transport
1. Introduction

161
734. Several agencies are involved in the air sector. Figure 14 illustrates current institutional arrangements for the sector. The Ministry of Transport coordinates the audit of civil aviation safety and security with assistance from the Civil Aviation Authority of NZ (CAANZ). The Cook Islands Airport Authority (CIAA) operates and manages the Rarotonga and Aitutaki airports on behalf of the Cook Islands Investment Corporation (CIIC), the (administrator and manager of Crown assets) . Other Islands Administrations (IAs) operate and maintain the airports on their respective islands. There are several different licensing arrangements for Outer Island (OI) airports. Some are licensed to the Island Council (e.g. Mauke), others are licensed to local customary leadership or landowner trusts (e.g. Atiu, Mangaia) and others are unlicensed private airstrips on private land. Air New Zealand and Pacific Blue provide scheduled international services and Air Rarotonga is the sole domestic airline.
2. Assessment
a. Policy and Planning
735. MOT is, in consultation with stakeholders, responsible for the development of policy and the provision of planning services for the transport sector as a whole. The Ministry reports that several aspects of the nation’s overall air transport policy, particularly those aspects relating to the provision of services to the OIs, are in urgent need of review. However the Ministry and stakeholders agree that an overall review of all aspects of transport is required. Piecemeal action would be inefficient and would fail to address the future transport needs of the nation.
736. MOT, like other ministries, is subject to unplanned and unexpected directives from Government. The recent Cabinet decision directing CIAA to take over responsibilities for all other airports is such an example. The intention is to improve air transport services to the OIs. There are, however, no financial arrangements and regulatory frameworks in place for implementation of the decision. This issue is further discussed below.
b. Legislation and Regulations
737. MOT has no formal legislation but provides a scope of services under the Air Services Licensing Act 1984, The Department of Civil Aviation Act 1986/87, the Civil Aviation Act 2002 and the Civil Aviations Regulations for implementing the Act.
738. The Cook Islands Airport Authority was established under the Airport Authority Act 1985. The core function of the Airport Authority is the management of Rarotonga and
Figure 14: Current Institutional Arrangements for Air Transport

162
Aitutaki airports. Under elements of the Civil Aviation Act 2002 and associated Civil Aviations Regulations, the Airports Security Act 1986, and the Aviation Offences Act 1964, CIAA is responsible for airport security, air traffic, fire rescue services, and the maintenance of runways.
739. Some provisions of the older legislation are in conflict with sections of the Civil Aviation Act 2002 and require amendment.
c. Corporate Plans and Performance Indicators
740. Airport standards, maintenance, and operations are regulated under International and adopted New Zealand regulations. The Civil Aviation Authority of NZ audits the international airports of Rarotonga and Aitutaki.
741. Other airports are audited by a CAANZ-trained and licensed local civil engineer. The proposed upgrading of three additional airports to Part 139 under the CAANZ regulations will require the services of additional qualified inspectors and auditors.
742. Table 52 details the institutional outputs of MOT’s civil aviation responsibilities as described in the MOT Strategic and Business Plan. Performance indicators are measurable and reliable data is maintained.
Table 52: MOT’s Civil Aviation Responsibilities and Institutional Outputs
Function Institutional Outputs and Indicators
• Coordinate systematic audits of civil aviation: operations; organizations that support aircraft operations; and infrastructure
• Audit reports produced and referred to stakeholders to take corrective action;
• Corrective action implemented in financial year.
• Implement/adopt new legal and safety measures that enhance efficiency of civil aviation
• Stakeholders consulted on new measures;
• Assessment of implications to operations and ability to comply;
• Implementation / adoption during financial year
• Coordinate bilateral, regional and international initiatives that have bearing on cook island civil aviation.
• Report process on coordination, extent of consultation and outcomes;
• Monitor and inform stakeholders of critical issues affecting the regularity and efficiency of civil aviation
• Report of survey of stakeholders’ satisfaction with information dissemination.
• Financial reporting as required under MFEM Act
• Monthly ministerial briefings
d. Private Sector Involvement
743. Air New Zealand and Pacific Blue provide scheduled international services and Air Rarotonga is the sole domestic airline. Markets are not closed and the present monopoly

163
situations are a function of market size and not a result of regulation. Small populations, large distances, restricted runways, and high capital and fuel costs serve to reduce the possibility of competitive efficiencies, particularly in the domestic market. External regulatory practices, beyond the control of the CIs, provide disincentives for the participation of other regional and international carriers.
744. CIAA and IAs utilize private sector and community-based contractors for grass cutting and drainage maintenance. Retail outlets in Rarotonga and Aitutaki are operated by the private sector. CIAA corporate intent is that of a private sector enterprise. The potential for further gains in efficiency through greater private sector participation in the operation, management and maintenance of Rarotonga and Aitutaki airports would need to be the subject of a review.
e. Financing
745. CIAA operates and manages the Rarotonga and Aitutaki airports as a financially self-sustaining corporate entity on behalf of the CIIC, (administrator and manager of Crown property or Crown assets).
746. IAs operate and maintain the airports on their respective islands. None of these airports are commercially viable and government accepts the cost of their maintenance and operation as a social obligation. Currently, maintenance for each OI airport is funded through non-specific items in the respective IAs budgets.
747. The Island Councils, local customary leadership or landowner trusts that hold the licenses for airstrips, receive the landing fees collected from regular and charter flights to the OIs.
748. The recent Cabinet decision to authorize CIAA to take over all other airports was not accompanied by any framework under which new arrangements will be implemented. The main concern of CIAA is the availability/source of funding for their proposed new responsibilities. Other concerns include the issues of land ownership and insurance. Land ownership issues will be discussed below. These airports are currently not insured but would have to be if they came under CIAA. The question of who would take the risk and who would pay for the insurance remains unanswered.
749. As administrator and manager of all Crown assets, the CIIC controls and manages CIAA. The CIAA reports annually to the Board of CIIC on the management and status of assets. Lease arrangements would need to be in place before CIAA takes on responsibility for other airports.
750. Proposals to upgrade Penrhyn, Manihiki and Atiu airports will pose challenges. CIAA was able to fund the upgrading of the revenue-rich Aitutaki airport from within its own finances, in fact by a commercial loan with the ANZ Bank. However CIAA will not be able to fund the upgrading of the other three airports nor their ongoing operational and maintenance costs. A more in-depth consideration of the alternatives available is discussed below.
3. Consideration of Alternatives
751. The main issues facing the sector are: the proposed upgrade of the Penrhyn, Manihiki and Atiu airports; and the directive by Cabinet for CIAA to take over responsibility for all airports. Three different alternatives have been discussed with stakeholders.
a. Maintain the Status Quo
752. The first option is for Cabinet to be approached to rescind its earlier decision. OI airport licensing would remain with landowners and airport operation and management with IAs.

164
753. CIAA was established to manage airports that were financially self-sustainable and therefore their responsibilities were restricted to Rarotonga and Aitutaki airports. It is unrealistic to assume that other airports will be financially self-sustaining either in the short or long term.
754. The lack of OI capacity would seriously compromise the ability to manage and maintain the upgraded airports to Part 139 standards. This would compromise their ability to pass audits and diminish the return on investment. Maintaining the status quo is an unacceptable option especially for airports being upgraded to Part 139 as they will, as part of the approval process, need to be licensed to CIAA. This option is therefore not recommended.
b. Immediate Transfer of all Airports to CIAA
755. A second option is for CIAA to immediately take over responsibility for all airports. However, the lack of an acceptable framework for implementation of this option (e.g. operations, maintenance, ownership, licensing, and financial arrangements) makes it impractical. Such a move would encourage unrealistic expectations from landowners, IAs and the traveling public and would ultimately, compromise the operations of Rarotonga and Aitutaki airports. This option is therefore not recommended.
c. A Staged Transfer of Responsibility to CIAA
756. The third option is a staged incorporation of airports responsibility to CIAA. This would allow for the development of a framework for the financial arrangements including budgetary allocations, the transfer of funds from IAs to CIAA, revenue sharing and subsidies. A rational program would include the development of a transport policy with training components for staff from MOT, CIAA, IAs and landowners in all aspects of airport operation, management, maintenance and monitoring. Surveys and a public awareness campaign will need to be conducted for all airports beginning with those proposed for upgrading. Once land has been surveyed and marked, the accepted process of land acquisition (identification of owners, negotiations, etc.) can commence with landowners or with customary chiefs. Following are proposed options for: land acquisition and the institutional arrangements for undertaking the upgrading and the financing of the on-going operations and maintenance.
i. Land Acquisition
757. The upgrading of the Penrhyn, Manihiki and Atiu airports will pose unprecedented, though not insurmountable, challenges. As noted earlier, the land for the original airstrips on each of the islands is utilized under a variety of lease arrangements with customary landowners. Upgrading will require the acquisition of additional land for the extension of the existing strips. Land adjacent to the new strip will not need to be acquired but will be subject to height restrictions (obstruction limitation surfaces). Tall trees, some houses, and objects such as lampposts may need to be removed, and future agricultural activities and housing construction restricted. It is unreasonable and inefficient to expect CIAA, a technical agency, to become involved in the delicate negotiations that will be required to formalize leasing and other land arrangements. All land acquisition and compensation arrangements should be formalized prior to the involvement of CIAA.
758. MOT reports longstanding land issues with customary landowners for most of the OIs airports and expects to face difficult negotiations.
759. The land acquisition process will require the following steps:

165
• Consultations will need to be undertaken to ensure community awareness, transparency in communication and availability of information, and a thorough understanding of the processes. Of particular importance is the understanding of the two types of land acquisition required, i.e. the additional land for the expanded strips and the surrounding land on which restrictions of tree and building height will be placed;
• Permission to undertake initial surveying is essential; • Once land has been surveyed and marked, landowners can be identified and
documented; • Negotiations can then commence for lease or grant arrangements for the additional
land for the expanded strips; • Trees, dwellings and other obstructions on restricted land need to be identified and
compensation and relocation negotiations need to be undertaken and implemented. Awareness of the requirements for obstruction limitation surfaces will need to be ensured in order to guarantee both an understanding of the need for the restrictions and to prevent future intrusions into the restricted air space. One estimate by a visiting engineer envisaged the removal of a total of approximately 10,000 trees, 6 houses, about 12 lampposts, and the realignment of roads for the three strips. (It is interesting to note that increases in the height of the obstruction limitation surfaces have been granted to some airports in New Zealand to save existing trees.)
760. The Crown has the right to ‘expropriate’ land by warrant either in perpetuity or for a limited period. The use of this process is anathema to the current custodians of traditional land. However, the process is legal while not politically palatable has been implemented in the Waste sector during the recent Waste Management Project, by consultations, negotiations and consensus..
ii. Institutional Arrangements for Upgrade Works
761. Once all land acquisition processes have been completed and documented, upgrading can commence. Alternatives for the institutional arrangements for undertaking the upgrading include:
• The PDU to take on the role of implementing agent and organize contracts (including the engagement of a project engineer for a turnkey project) which, when completed, will be handed over to CIAA.
• PDU, through CIIC, to appoint CIAA as implementing and employing agent. CIAA would develop and administer contracts and provide project management and supervision from either their own staffing resources or by engaging a project engineer to confirm that construction meets design standards.
• CIIC itself to take on the role of implementing and employing agent for a turnkey project which, when completed, will be handed over to CIAA;
iii. Operation and Management of OI Airports
762. IAs will remain responsible for the maintenance and operation of the airports on their respective islands.
763. CIAA will enter into contractual arrangements with IAs to manage and operate airports that are upgraded to Part 139. Such airports will require a competent airport manager and safety officer and, considering the shortage of skilled persons in the OIs, the Island Secretaries may well have to take on this role. Training and supervision will be

166
provided along with relevant documentation and manuals. The IAs infrastructure staff would also need to be trained in strip maintenance and in appropriate grader and roller operation skills.
764. One suggested alternative is for CIAA to organize training programs using Aitutaki airport as a training center because of the availability of both sealed and unsealed landing surfaces. Further opportunities for training will be available during the construction phase of the upgrade. Manihiki and Penrhyn will also need people trained in the day-to-day maintenance of existing navigation aids. Current arrangements with Telecom will probably remain in place.
iv. Ongoing Financial Arrangements
765. Firstly, Government must accept that airports other than Rarotonga and Aitutaki will not, in the short to medium term, be commercially viable and that their operation and maintenance must be seen as part of government’s social responsibility. Annual estimates of all relevant costs will need to be prepared for inclusion in annual budgets. Transparent and realistic funding will need to be made available through annual budgets to those responsible for operating and maintaining the airports.
766. Funding for the upgrades of airports will need to be sourced by Government. If funds need to be borrowed, Government must maintain responsibility for discharging the loan.
767. It is widely believed that even if CIAA takes over these airports, landowners will not relinquish their rights to collect landing fees. Considering the limited number of flights to each of the OI airports, revenue from landing rights cannot be counted on to offset operation and maintenance costs. One alternative for upgraded airports is the charging of a departure fee at Rarotonga to offset some of the operation and maintenance costs. Procedures for collection of such a fee at Rarotonga are available; the introduction of such a fee at the OIs would, however, be administratively inefficient. The application of such a charge would be restricted to those airports that have been upgraded and not to all airports.
4. Recommendations
(i) Immediately commission a transport policy review;
(xiv) Undertake appropriate amendments to legislation to ensure complementarities;
(xv) CIAA to take over each of the three airports proposed for upgrading after upgrading has taken place and they are certified to Part 139 and financial and administrative agreements have been reached with Government and IAs;
(xvi) Other airports will be taken over only after land leasing and licensing agreements are reached with landowners and financial and administrative arrangements are reached with Government and IAs.
(xvii) Several of the steps in the processes outlined below are only of relevance to the three airports proposed for Part 139 upgrading. Land, licensing, financial and training issues, however, are relevant to all OI airports. The CI government will, through PDU, undertake a process to ensure:
(a) awareness is secured through consultations with landowners; (b) a survey is undertaken of each of the airports and their environs; (c) lease and restricted land requirements are identified and marked;

167
(d) ownership is established and negotiations undertaken to finalize leasing, compensation, relocation, licensing, insurance and revenue sharing arrangements.
(xviii) The implementing and employing agent appointed by PDU to undertake an airport upgrade will utilize its own capacity or engage consultants to:
(a) prepare tender documents, and undertake tender evaluation and selection;
(b) undertake contract administration, construction supervision, commissioning and inspection prior to the lapse of the defects liability period.
(xix) PDU will make institutional arrangements between MOT, CIAA and IAs to: (a) develop an Operations Manual; (b) train IA staff as airport managers and safety officers; (c) c) train IA infrastructure section staff to maintain airstrips; (d) ensure development of annual O&M budgets, with the assistance of
CIAA, and ensure budget allocations for additional operational costs and maintenance of assets, such as fire fighting and rescue vehicles.
(e) MOT will undertake the training of local inspectors for Part 139 certification.
B. Marine Transport
1. Introduction
768. Several agencies are involved in the marine transport sector. Figure 15 illustrates the current institutional arrangements for the sector. The Ministry of Transport is responsible for shipping licences, maritime safety and security and the regulation of freight rates. The Cook Islands Ports Authority (CIPA) operates the Avatiu (Rarotonga) and Aitutaki Ports on behalf of the Cook Islands Investment Corporation (CIIC), (the owner of all Crown assets). IAs operate OI harbors and port facilities on their respective islands. Private sector organizations own and operate vessels for domestic and international cargo and passenger shipping, fishing, local and domestic tourist operations, research and pleasure. Maritime Cook Islands Ltd manages the Shipping Register under a management agreement with MOT

168
Figure 15: Current Institutional Arrangements for Marine Transport

169
2. Assessment
a. Policy and Planning
769. MOT is, in consultation with stakeholders, responsible for the development of policy and planning for the transport sector as a whole, including Marine Transport. Overall transport policy is in urgent need of review, particularly in relation to the provision of services to the OIs.
770. MOT advises Government on the development of policy relating to the licensing of international and domestic shipping operators and for maritime safety and security. The Ministry also provides the executive services for a tribunal that arbitrates and advises on the appropriate levels for freight rates.
771. The Maritime Training Center of MOT is responsible for developing and presenting maritime training programs, including boat-master and sea-safety training.
b. Legislation and Regulations
772. The Shipping Act (as amended in 1998) and associated regulations and ordinances including the Shipping Licensing Ordinance 1963 and the Prevention of Marine Pollution Act 1998 provide authority for the primary functions of MOT. The Admiralty Act (2004) makes provisions for, and outlines the extent of, the admiralty jurisdiction of the High Court of the Cook Islands.
c. Corporate Plans and Performance Indicators
773. MOT has adopted the Maritime standards specified under the International Maritime Organization’s (IMO) code of practice. The Ministry enforces them by leveraging the resources of the Secretariat of the Pacific Community (SPC), Maritime New Zealand and the IMO and by adopting systems that have been tested by these organizations.
774. MOT monitors safety and security through a cycle of annual audits, the provision of information, and the application of legal measures to ensure adherence. However, the onus of compliance is placed on transport providers “to regulate their own performance, by our setting standards and their promise that they will perform and comply with these standards.” 29 Maritime Cook Islands Ltd reports that surveys of some domestic cargo vessels continually identify maintenance requirements. These vessels are however given dispensations to operate because they are the only service to the OIs30.
775. Table 53 details the institutional outputs of the Ministry’s maritime responsibilities as described in the MOT Strategic and Business Plan
29 Strategy and Business Plan. Cook Island Ministry of Transport 30 Consultations with Maritime Cook Islands Ltd

170
Table 53: MOT’s Maritime Responsibilities and Institutional Outputs Function Institutional Outputs and Indicators
• Monitoring and facilitating the orderly administration of the shipping register
• Effectively managed by Maritime Cook Islands Ltd under a management agreement with MOT
• Implementing legislative and policy measures that safeguard maritime transport
• The need for a transport strategic plan
• Adopt and enforce IMO and regional safety standards
• Key challenge is to continue to maintain standards under global transport regimes that demand increased levels of compliance
• Facilitate international, regional and bilateral endeavors in the maritime area
• As above
• Financial reporting as required under MFEM Act
• All financial reports produced in timely fashion
• Monitor and improve internal management
• Well-documented monthly meetings but capacity constrains effective strategic planning and policy review.
• Staff training and skills up-grade • Regular reports produced.
d. Private Sector Involvement
776. Private sector organizations own and operate vessels for domestic and international cargo and passenger shipping, fishing, local and domestic tourist operations, research and pleasure.
777. Reef Shipping (through its local agent Express Cook Islands Line Agency Ltd (EXCIL)) and the Pacific Forum Line (PFL) currently provide international shipping services to and from New Zealand to Rarotonga and Aitutaki. Both international providers operate a service approximately every 3 weeks. Major local importers including Foodland, Cook Islands Trading Corporation (CITC), and General Transport are shareholders in ECIL.
778. The Government holds, through CIIC, shares in the Pacific Forum Line. The South Pacific Forum established PFL in 1977 as a commercial shipping company and as an instrument for regional development at a time when existing shipping services to and from the Pacific were losing money and in danger of being curtailed. PFL initially operated under a mix of commercial and developmental principles but was quickly forced to recognize the fatal conflict between these. PFL served its initial purpose of ensuring continued overseas shipping for the Cook Islands. Subsequently however, the presence of government competing with other legitimate private enterprise activities and the resulting crowding out has come under scrutiny. It is claimed that Government competition was in some way responsible for the recent demise of one of the private sector participants in international shipping. PFL currently provides an alternative service and its absence from the market would result in a monopoly situation.
779. Taio Shipping Ltd operates infrequent services to the OIs with two vessels. Both vessels are at the end of their useful lives and will need to be replaced within two years. OI residents rely on Taio Shipping for passenger services because air services are limited and costly. The vessels lack proper passenger accommodation.
780. Two new players have recently shown interest in the domestic market. The motor sailer Kwai has commenced trading between Honolulu, the northern Group and Rarotonga.

171
The vessel can carry 200 tonnes of pallet cargo, 8 passengers in cabins and 12-16 foresail passengers. The vessel has plans to include freezer space capable of carrying 4-5 tonnes of red snapper to a large market in Honolulu on the condition that blast freezers are available in the northern islands. The master of the locally registered Picton Castle is reported to have purchased two vessels, which are being converted to schooners for carrying 12 high-end tourists and a similar number of budget passengers. The vessels will have limited cargo space of around 30 tonnes. It is planned for one of these vessels to work exclusively in the Cook Islands while the other operates regionally.
781. The viability of commercial domestic shipping is constrained by the fact that Aitutaki, the largest and most profitable OI destination, is serviced by the international services.
782. There are 4-5 fishing vessels working small long-line operations out of Avatiu harbor providing fish for the Rarotonga household and restaurant markets.
783. Pleasure boats include domestic craft used for private purposes and to support the tourist industry (glass bottom boats, dive boats etc), and international cruise liners and visiting yachts.
784. Maritime Cook Islands Ltd., a local entity which manages the shipping register under a management agreement with MOT, is an example of a flourishing PPP which replaced a struggling government organization.
e. Financing
785. CIPA operates Avatiu (Rarotonga) and Aitutaki harbors as a financially self-sustaining corporate entity on behalf of the Cook Islands Investment Corporation (CIIC). CIPA reports that their Aitutaki operations are currently running at a loss and are subsidized by revenue from the Rarotonga facility. It is not envisaged that CIPA will, in the life of this plan, take over responsibilities for any of the other ports or harbors.
786. CIPA conducts all longshoreman activities (cargo handling before/after cargo transfer between ship and shore) in both of its facilities and reports that the revenue from these activities is essential for meeting maintenance costs. Stevedoring (cargo transfer between ship and shore) at Avatiu is undertaken by a private company.
787. IAs operate and maintain the port and harbor facilities on their respective islands. None of these facilities is commercially viable and government accepts the cost of their maintenance and operation as a social obligation. Currently, maintenance for each OI harbor is funded through respective IA budgets.
788. Many of the OI facilities were damaged by recent cyclones and are badly in need of upgrading and maintenance. Several projects for their improvement are being proposed in this Master Plan. PDU will need to appoint implementing and employer agencies to take responsibility for these proposed projects as IAs do not have the necessary capacity. The projects will provide opportunities for training of IA infrastructure staff in their operations. CIPA estimates that, on completion, the OI facilities will in general be maintenance-free for several years.
3. Consideration of Alternatives
789. The main institutional issues facing the sector are those involving the possibility of increased private sector participation in the operations for the Avatiu and Aitutaki harbors and the institutional arrangements for the proposed upgrade of OI harbors. Alternatives derived from stakeholder consultations are presented below.

172
a. Increased Private Sector Participation in Avatiu and Aitutaki Harbors
790. CIPA is responsible for Avatiu and Aitutaki harbors and undertakes all activities except stevedoring, which is performed by the private sector. CIPA’s 15 staff in Rarotonga and 5 full-time and 15 part-time staff in Aitutaki provide all operational, management, administration, longshoremen and security services.
791. One option is for the status quo to remain and for CIPA to continue to maintain, operate and manage all activities for both ports with the private sector continuing to undertake stevedoring activities in Rarotonga. This is CIPA’s preferred option.
792. A second option is for CIPA to continue to operate and maintain the ports and harbor facilities but to contract out or privatize31 the provision of all stevedoring, longshoreman and security activities in both ports. This is consistent with practice in most ports around the world. This would involve the disposal of all cargo handling assets and the leasing out of warehouses and other container and cargo storage facilities. Private sector capacity and willingness to undertake these activities exists in both locations.
793. A third option would be for the government to retain ownership of the infrastructure of the Avatiu and Aitutaki harbors but have CIIC follow the successful international trend of leasing port operations to the private sector. The private sector view the two ports as standout examples of government assets that will gain from PPP arrangements and claim that private sector involvement and investment in Avatiu and Aitutaki harbors would improve facilities at both ports (both have the potential to provide a regional service).
794. Aitutaki port has the potential to become a major focal point for the international yacht circuit and improved services at Avatiu would increase the desirability of that port as a destination for the more than 900 cruise boats estimated to bypass the port annually. Commercial incentives to leaseholders include development of existing Crown land associated with CIPA to provide commercial facilities and stimulate economic growth.
795. It is not recommended that Government consider sale of the two assets, i.e. the ports. Their sale would reduce the potential number of possible participants and increase the likelihood of non-Cook Islands involvement.
b. Institutional Arrangements for Upgrade Works
796. The Master Plan calls for the upgrading and construction of several OI harbors. Neither the CIPA nor the IAs have the capacity to manage the construction of the required works and two options are therefore considered.
797. PDU will be the executing agency for the projects. Land would not be an issue, as the proposed works will be confined to land already in the hands of Government. PDU or CIIC could take on the role of implementing agency and organize contracts, including the engagement of a project engineer for a turnkey project which, when completed, will be handed over to the IA.
798. Careful consideration should be given before considering IAs as implementing agents for even the smallest of the projects. The preferred option for smaller projects would be for PDU, MOW or CIIC to take on the role of implementing agent and contract out the work to the private sector with the proviso that local labor be utilized wherever possible.
31 Allow the private sector to operate longshoreman and stevedoring services to shippers paying a fee to CIPA.

173
4. Recommendations
(i) PDU be the executing agency for the upgrading and commissioning of OI
harbors. As such, PDU would be responsible for prioritization and inclusion of projects in works program and the appointment of the implementing agent for each project. (xx) CIIC to undertake a due diligence study of CIPA to ascertain the true value
of activities and assets of the Avatiu and Aitutaki port facilities with a view to: • contracting longshoreman and security activities to the private sector; • deliberating the case for leasing the operations and management of the ports
to the private sector. C. Road Transport
1. Introduction
799. Figure 16 illustrates the current institutional arrangements for the CI road transport sector. Decentralization of infrastructure functions to the OIs has in theory left MOW responsible for the engineering and maintenance services for roads, drains, bridges and foreshores on the island of Rarotonga. The 15 staff of the Roads Work Division of MOW discharged these functions. Rarotonga Island Councils (also known as Vaka Councils) have limited technical and plant capacity and confine their activities to basic roadside maintenance.
800. On the OIs, the Infrastructure Division of each of the respective IAs is responsible for the engineering and maintenance services for roads, drains, bridges and foreshores. OMIA provides a focus for liaison and contact between IAs and the Roads Division of MOW, aid agencies or private contractors. The Police Department has responsibility for driver licensing, regulation and monitoring of traffic and road safety, including the erection of road signs. MOT is responsible for the regulation and registration of vehicle dealers. The Bank of the Cook Islands (BCI) collects vehicle registration fees and issues licence plates on behalf of Government. The private sector’s participation in the road sector is presently limited to the contracting of plant and equipment on Rarotonga, Aitutaki and Mangaia.
Figure 16: Current Institutional Arrangements for the Road Transport Sector
174
2. Assessment
a. Policy, Planning, Legislation and Regulations
801. Government has not published any specific policy for the road sector. Nonetheless the objective of MOW and IAs is the development and maintenance of safe, effective and sustainable roads, bridges and drainage. In the absence of a national road policy, MOW and IAs plan annual roadwork activities on an ongoing needs basis.
802. The core functions of the Ministry of Works (as addressed in the Supportive Services Act (36 of 1973-74)) include engineering and maintenance services covering general operational civil engineering for: roads, drains, bridges and foreshores. (The latter is defined as a 30 meter wide strip of land extending along and abutting the mean high water mark.) Decentralization of infrastructure functions to the OIs has, in theory, left MOW responsible only for roads on the island of Rarotonga.
803. The Rarotonga Island Council: (Empowering Public Works and Services) Ordinance (4 of 1959) empowers the Rarotonga Island Council (RIC) to maintain, improve and control roads and foreshores on the island. However, their limited technical and plant capacity confines their activities to the cutting of grass on verges and some maintenance of drains.
804. There is currently no legislative framework enabling or authorizing IAs to manage and operate their infrastructure. If the draft Island Government Bill and the Ministry of Islands Development Bill are enacted in their current form, they will confirm the ability of an IA to carry out works and perform its functions by using its own employees or, by arrangement and contract with the Crown, any department of the state, statutory body, enterprise of the crown or any other person or organization. IAs currently function in liaison with OMIA using the provisions of the two Bills as guidelines.
805. Current legislation32 provides that while road formation, maintenance and repair is the responsibility of the Crown, ownership is vested in adjoining owners, in accordance with common law. The implications of this legislation are discussed below.
b. Corporate Plans and Performance Indicators
806. The absence of a national road plan means that MOW and IAs plans for annual roadwork activities are driven by budget allocation and immediate needs. This is illustrated by the following examples of expected results in The Vision, Strategy and Business Plan 2005/6 of MOW:
• Existing bridges around Rarotonga are maintained according to approved funding. • Existing drains are maintained according to approved budget. 807. The performance indicators for roadworks in the Business Plan, similar to those in most other business plans, are not all quantifiable, do not have targets, and are not time-specific. The development of a NEDS and subsequent sector policies will enable the Planning Unit of OPM to assist public institutions in the development of business and action plans with indicators, baseline data and targets that would be realistic and capable of providing valid information to an ongoing and effective monitoring and evaluation system.
32 Section 608 of the Cook Islands Act 1915

175
c. Private Sector Involvement
808. The private sector’s participation in the road sector is presently limited to the contracting of plant and equipment on Rarotonga, Aitutaki and Mangaia. In Rarotonga, the maintenance of rights of way, including vegetation control and drainage, is contracted out.
d. Financing
809. Funding needed by the MOW Road Works Division in 2005-06 is estimated in MOW’s Business Plan as NZ$468,810. The Plan estimates NZ$110,000 to be generated through plant hire and private sealing work carried out by the Road Works Division. The explanation given by MOW for the inclusion of this revenue is that there is no capacity within the private sector to undertake this work. The private sector, on the other hand, argues that Government is crowding out any potential contractors through the provision of low cost services. This issue will be discussed below.
3. Consideration of Alternatives
a. Landowners and Community
810. Section 608 of the Cook Islands Act 1915 states that “although all roads shall be formed, maintained and repaired by the Crown, any road in the Cook Islands shall not vest in the Crown, but shall belong in accordance with common law to the adjoining owners.”
811. In relation to ‘ownership’ of roads, MOW’s advice is that it is their understanding that only the two ring roads around Rarotonga have been acquired by the State. Apart from the small street grid in Avarua, the remaining roads in Rarotonga are short feeder roads which connect to the two ring roads. Most of these are built on the properties of the landowners on either side of the road. This is a problem which is expected to persist indefinitely.
812. Land issues on both Rarotonga and the OIs could prove to be a serious constraint to improving existing roads and constructing new road works. The People’s Republic of China has funded the upgrading of sections of the inner ring road in Rarotonga will provide valuable experience in dealings with landowners and the issues of land acquisition and compensation. MOW is currently working with contractors on the survey of the upgrading. The extent of land acquisition, if any, and the damage to adjoining properties is as yet unclear and the subject of conjecture.
813. Community reaction to widening roads and increasing traffic volume and speed in Rarotonga is unanimously negative. There is a strong commitment to maintaining the ‘country town’ feel of Rarotonga. Rather than widening roads, community consultations unanimously seek the development of footpaths and the introduction of speed bumps.
b. Institutional Arrangements
i. Rarotonga
814. MOW is, despite budget constraints, and contrary to some public sentiment, doing a creditable job in maintaining roads in Rarotonga.
815. While having excellent ability to undertake the existing maintenance and minor new construction, MOW lacks the capacity to develop plans and strategies for the road sector. All other municipal functions suffer from the same constraint. It is essential that the strategic

176
planning capacity of MOW be developed in order to provide that function for both Rarotonga and the OIs.
816. Incremental private sector participation will demand the strengthening of the capacity of MOW in all aspects of transparent contracting, from contract development through selection and supervision to final commissioning.
817. Road planning and traffic management are becoming increasingly important given the growth in traffic on Rarotonga roads. MOW does not have the capacity to undertake these functions. However, the scope of work is too small for full time employment so in the short-term this function should be contracted out to a local or overseas consultant.
818. Road safety is increasingly an important issue as traffic levels increase. Rising youth alcohol and substance abuse is a compounding factor. The Department of Police and MOT should coordinate with the Ministry for Education and civil society organizations to mainstream road safety education and awareness at the secondary school level, provide driver training and raise public awareness.
819. Maintaining the status quo without increasing private sector participation would not contribute to better efficiencies. Without pre-empting the outcomes of the proposed review of the road sector, it is envisioned that MOW would increasingly concentrate on strategic planning for both Rarotonga and contract out all construction and maintenance works to the private sector.
ii. Aitutaki and the Outer Islands
820. IAs in most of the OIs will continue to be responsible for the maintenance of roads on their respective islands. OMIA should continue to act as a liaison point for OIs, engaging MOW and increasingly the private sector to provide assistance.
821. 187. MOW should continue to assist the OIs with strategic planning, the design of proposed works, and building their capacity to manage and supervize contractors.
822. 188. The private sector on Aitutaki, and increasingly on other islands, has the capacity to undertake contracts for road construction and maintenance. Crushers on Aitutaki and other islands are currently operated by the IAs and are out of action or underperforming. The private sector has shown considerable interest in leasing the crushers. Suitable arrangements should be put in place to enable this to happen.
iii. Increased Private Sector Participation
823. . There are several areas in the road sector that could benefit from increased private sector participation. It is recommended that a cost study be commissioned on all aspects of road construction and maintenance.
824. Plant and equipment is hired from the private sector to undertake major capital road works on Rarotonga. MOW reports that the cost of hiring from the private sector is high compared to the charge-out rates of MOW and IAs. One example provided in Rarotonga was the private sector cost of NZ$160 an hour for the hire of a backhoe compared to the MOW charge-out rate of NZ$90 an hour. It is doubtful if the current MOW rates are a reflection of the actual cost to government.
825. MOW should decrease their own plant and machinery inventory and increasingly use the private sector to supply its needs. There is support for increased involvement of the private sector in maintaining MOW’s fleet of vehicles with a view to closing down the present workshop. MOW has also investigated the contracting out of planning and design aspects of

177
its roadwork but states that current charge-out rates for these services are high and would initially require increased budget allocations. Elements within MOW believe that private costs would stabilize in a competitive, free market environment.
826. MOW states that the private sector is not sufficiently developed at the moment to provide competitive options for full privatization of road works. It is reported that there is no contractor on the island currently capable of providing the full range of services required. There is, for example, no contractor with a capacity to undertake bituminous works.
827. Private sector, on the other hand, argues that this situation exists because not only does MOW not contract out road maintenance to the private sector but it also crowds out any potential private sector participation by undertaking private road sealing, often at below cost. The private sector believes that, given the opportunity, competent contractors will invest in equipment and staff training and provide what would in the long term be a more efficient and cost-effective alternative to the present situation. Their main concern is, however, the ability of government to plan for funding activities for periods of more than 12 months. Contractors maintain that for such a large investment they would require guarantees (conditional on performance and cost) of funding for a period of between three to five years.
828. Private sector contractors claim that existing relationships with larger companies in New Zealand and Australia allow them to leverage the technical expertise and equipment necessary to undertake any major road contract in the Cook Islands.
829. A few years ago MOW leased to the private sector, a crusher whose operations had been uneconomical and whose associated maintenance costs were high. The contractor who leased the equipment has maintained and upgraded it and now provides MOW with a reliable service and discounted rate for road aggregates.
4. Recommendations
(i) Government to commission a review of the road sector immediately after the development of a NEDS. The review is to include a cost study on all aspects of road construction and maintenance. The outputs of the review should be a national strategy for road development and maintenance and an analysis of the potential areas of increased private sector participation.
(ii) OPM to assist MOW in the development of the national strategy and business and action plans with indicators, baseline data and targets that are realistic and capable of providing valid information. (xxi) CIIC to assist MOW and IAs to implement increased private sector
participation recommendations arising from a comprehensive cost study. (xxii) The strategic planning capacity of MOW to be developed in order to provide
that function for both Rarotonga and the OIs. (xxiii) Strengthen MOW’s and IAs capacity to develop and manage
contracts, operational efficiency and financial control. (xxiv) The Department of Police and MOT to coordinate with the Ministry for
Education and civil society organisations to mainstream road safety education and awareness at the secondary school level, provide driver training, and raise public awareness.
(xxv) PDU and MOW to develop Terms of Reference (TORs) and tender documents for the engagement of a consultant to provide MOW with a capacity for road planning and traffic management.

178
D. Energy
1. Introduction
830. Several agencies are currently involved in the energy sector as illustrated in Figure 17. MOW’s Energy Division (ED) (the former Ministry of Energy) is responsible for development of national energy policy and energy planning and regulates and monitors standards for safety, quality, quantity and efficiency of electricity generation, transmission and distribution, tariff control and the quality of petroleum and other fuels. CIIC, the owner of all Crown assets, oversees the operations of Te Aponga Uira (TAU) and the Aitutaki Power Supply (APS), which operates and manages the Rarotonga and Aitutaki power supplies respectively.
831. IAs are responsible for their respective power generation, distribution, safety and inspection. OMIA operates a workshop that overhauls OI electricity generation equipment and is responsible for indirect subsidies to the OIs in the form of grants that offset the island’s overall budget deficit.
832. The Cook Islands Electrical Workers Registration Board administers regulation and the registration and licensing of electrical workers. Government and private sector are represented on the Board.
Figure 17: Current Institutional Arrangements for the Energy Sector
2. Assessment
a. Policy and Planning
833. Government adopted a National Energy Policy33 (NEP) in 2003. The policy is a long-term vision for the nation’s energy sector and is complementary to the National Vision of 2005 and the NSDP. The aim of the NEP is “to facilitate reliable, safe, environmentally acceptable, and cost-effective sustainable energy services for the people of the Cook Islands”. Its guiding principles set goals for sustainability, self-sufficiency, efficient service delivery and financial independence.
834. The policy states that over time, cross-subsidies among electricity users are to be eliminated. Those who receive electricity through renewable energy systems are to pay monthly fees sufficient to meet operating and maintenance costs (including the eventual 33 Cook Islands National Energy Policy 2005

179
replacement of the system components). There are broad policies for overall energy planning and management, the power sector, renewable energy, petroleum fuels, transportation, and environmental aspects of energy.
b. Legislation and Regulations
835. The Energy Act 1998 addresses issues of safety standards and licensing. The Cook Islands Electricity Regulations of 200534 were produced as required under the Energy Act 1998 but remain in draft and are yet to be formally adopted. However these regulations are used as guidelines to govern the licensing, technical and safety requirements for power generation, distribution and consumer premise wiring. The regulations specify the qualifications and technical skill requirements for the registration and licensing of various grades of electrical workers. This latter function is administered through the Cook Islands Electrical Workers Registration Board on which MOW, TAU and the private sector are represented.
836. TAU is a State-owned enterprise that generates, transmits and distributes electricity to all of Rarotonga Island under the Te Aponga Uira o- Te Tumutevarovaro Act 1991.
c. Corporate Plans and Performance Indicators
837. The NEP includes a Strategic Plan with specific activities, lead agencies, indicators of success, assumptions and risks, and a time frame for each policy area but no specific budget allocations for implementing any activities or indications of priority among them.
d. Private Sector Involvement
838. Rarotonga’s private sector is well serviced by 25 electricians and 4 electrical mechanics. There is one qualified electrician in each of Aitutaki, Atiu, Mauke, Mitiaro and Manihiki and one electrical mechanic in Aitutaki.
839. TAU contracts the private sector for many of its subsidiary activities, e.g. line and cable laying and overhead obstruction removal. TAU also plans to contract the private sector for additional support services for the major activity of overhauling its generation equipment.
e. Financing
840. The NEP dictates full cost recovery for TAU and OI consumers, while conforming to any loan covenant requirements35. The policy requires that cross-subsidies between business and household consumers in Rarotonga and the OIs be eliminated by 2007. In recognition of the service responsibility of government, the policy requires that lifeline tariffs be introduced so as not to disadvantage low-income earners.
841. TAU has not been able to continue operations on a full cost recovery basis36 however. Despite a recent tariff rise, cross-subsidization of private households by business users remains. TAU management is concerned that continued cross-subsidies could raise business tariffs to a level such that their largest customers may decide that it is more economical to generate their own electricity. Seen in a more positive light, environmentally sound private sector self-generation practices would reduce the demand on TAU and delay the need for major investment in additional generation capacity.
34 Cook Islands Electricity Regulations. Draft. 2005 35 National Energy Policy of 2003 36 Te Aponga Uira. Operating and Capital Budget. July 2005 – June 2006.

180
842. IAs operate their own billing systems reading meters, issuing bills and collecting revenue. Current rates range from 36 to 46 NZ cents per unit. This is less than the tariff in Rarotonga which ranges from a minimum of 55 NZ cents per unit to a maximum of 63 NZ cents per unit. It is essential that Government commission a cost recovery study that will provide advice on tariffs on Rarotonga and the OIs as well as review the development of policies relating to transparent OI cost subsidization.
843. None of the OI power operations fully recovers costs. The Aitutaki Power Supply (APS) is the nearest to achieving this target but controls by Government on tariffs for both householders and commercial customers results in a continued reliance on Government subsidies. When responsibility for electricity generation and supply was decentralized, IAs and Island Councils were pleased to accept responsibility and believed that the activity would be a “cash cow”. Reducing populations, rising high fuel and shipping costs, and low technical capacity has, however, resulted in deteriorating and increasingly dangerous services37 for many of the OIs and the need for Government subsidies (estimated by OMIA to be over 50%).
844. Sustainable tariff regimes that vary from island to island and reflect the true worth of generating energy would need to be put in place to achieve the Government’s cost recovery targets for the OIs. Full cost recovery would, however, place an unacceptable burden on OI consumers. The introduction of a more appropriate sliding scale of rates for OIs would, on the other hand, drive demand management and force people to conserve and look for alternative sources of energy.
845. OMIA tenders for the supply of diesel fuel for OI power supplies on an annual basis. The fuel is provided to IAs on a duty-free basis. OMIA estimates that the current OI tariffs will need to be raised to an equivalent of rates paid by Rarotonga consumers just to cover the cost of the diesel fuel itself. Policies need to be developed that acknowledge the basic principle that OI energy operations will need to be subsidized.
3. Consideration of Alternatives
a. Gaps in Policy
846. There are gaps in the current energy policy, legislation and regulations. The policy does not specify strategies or provide an enabling environment that promotes alternate energy sources and energy conservation. The policy does not address the need to centralize and share limited technical capacity nor are there strategies or a commitment to achieve cost recovery or eliminate cross-subsidies.
847. There is an implicit and realistic acceptance of lower levels of service to the OIs. This, however, is not consistent with policy. There is no long-term plan for capacity building to serve OIs.
848. There is a need for realistic policies regarding electricity service to the OIs. Policies need to be developed that acknowledge the basic principle that OI energy operations will need to be subsidized and could never be self-funding. Current ad hoc funding through IA budgets needs to be replaced with a funding system that will vary from island to island and provide transparent subsidies, specifically for energy.
849. Government should promote the acceptance of realistic levels of service related to the OIs economic development and isolation factors and not related to what can be expected in Rarotonga or New Zealand.
37 Observations for Atiu Power Supply, Office of the Minister for Islands Administration, 10 July 2006

181
b. Institutional Arrangements
i. National
Prior to the reforms of 1996, the Ministry for Energy was responsible for all policy, regulation and strategic planning for power supply in the Cook Islands. At that time the Electricity Power Supply (EPS) was responsible for the generation and distribution of power on all islands and carried out safety inspections. In the 1996 reforms, the former ministry became a division of the Ministry of Works and EPS evolved into Te Aponga Uira (TAU) on Rarotonga with IAs taking on responsibility for power generation, distribution and supply on each of their respective OIs. 850. The National Energy Division (NED) operates under the Energy Act 1998 and is responsible for development of national energy policy, energy planning, regulation and monitoring of standards for safety, quality, quantity and efficiency of electricity generation, transmission and distribution and the quality of petroleum and other fuels. NED monitors electricity tariffs and petroleum usage but has no regulatory power or responsibility; it coordinates research and promotes the use of alternate sources of energy.
851. NED is currently understaffed (a Director and two staff each in planning and inspections) and underfunded. NED does not have its own dedicated budget and is unable to effectively undertake its functions. NED staff provide excellent inspections services in Rarotonga but do not have the capacity or funding to ensure safety in the OIs. Unqualified staff from the IAs are provided with registration so that they are indemnified from prosecution. NED’s effectiveness in policy review and engagement in alternate energy issues is limited by lack of capacity.
852. Ministerial responsibilities for matters related to energy are spread over different ministries whose mandates overlap. The situation contributes to confusion regarding authority, responsibility, accountability, and reporting and hinders the development and implementation of consistent energy policies and their administration.
853. One option that has been suggested is for the Energy Division to be transferred to the Office of the Prime Minister (OPM) where it would join other technological agencies such as Telecom and Information Technology. OPM is high profile and, since it is not an operational agency, there is less likelihood of overspending its budget allocation. The rationale for this suggestion is that both energy and telecommunications are monopolies requiring large investment and are fundamentally different in nature to other municipality services such as roads and water. Both are rapidly developing sectors necessitating frequent technology upgrades. On the other hand, it is argued that the disadvantage of such a move would be the overshadowing of the small energy division by the high profile telecommunications sector.
854. The option preferred by NED (failing the unlikely establishment of its own ministry) is for the Division to remain as part of MOW but to be provided with its own annual budget.
ii. Rarotonga
855. TAU is a State-owned enterprise that generates, transmits and distributes electricity to all of Rarotonga Island under the Te Aponga Uira o-te Tumutevarovaro Act 1991. The enterprise has its own Board and reports annually to CIIC on the management and status of assets. TAU has a total of 41staff (power station – 21, distribution system – 11, Billing – 5, Administration – 4).
856. A Cabinet Memorandum of May 2004 has directed TAU to take over responsibility of the Aitutaki and Atiu power supplies as requested by the Island Councils of the two islands.

182
A lack of procedures and budgetary implications have prevented TAU from assuming this responsibility. The lessons learned from this are particularly relevant when considering other changes in institutional arrangements in the infrastructure sectors including the recent directive by Cabinet for the Airport Authority to take over responsibility for all OI airports, and consideration of TAU taking responsibility for power generation and distribution in the OIs.
iii. Outer Islands
857. Under the provisions of the Energy Act 1998, each of the OI IAs is responsible for its respective power generation, distribution, safety and inspection. OMIA is responsible for indirect subsidies for the OIs in the form of grants that offset the islands’ overall budget deficit. There is no explicit policy or formula for subsidization of OI energy services.
858. The Aitutaki Power Supply (APS) operates under the same structural arrangements as TAU but with no legislative backing. Established with the objective of being a self-sustaining commercial entity, APS is reportedly hampered by continued government interference in staffing and tariff issues and is unable to operate as a truly commercial enterprise.
859. There is an Energy Division in each IA. However OIs lack skilled electrical workers. While the Island Secretary for Mauke is a qualified electrician, only Mangaia has a qualified electrician working in its Energy Division. Because there are no private sector electricians on most of the islands, staff of the Division wire and service household, business and institutional electrical systems.
860. OIs have technicians/mechanics that are responsible for the operation and maintenance of the power supply system. Their skill level however limits their input to routine maintenance and basic repairs. They are also constrained by the lack of proper tools and spare parts. Consequently, breakdowns require mobilizing technicians from Rarotonga or sending the equipment to Rarotonga for repairs and overhaul. Both alternatives are subject to scheduled shipping transport timetables and can mean delays of weeks or months.
861. Several options have been considered during consultations with stakeholders. The first of these is to maintain the status quo. When responsibility for electricity generation and supply was decentralized, IAs and Island Councils were pleased to accept responsibility. Low technical capacity and a lack of maintenance have however resulted in deteriorating and increasingly dangerous services38 for many of the OIs. Providing the necessary capacity to OIs is not an economic or feasible option. While all islands need, at one time or another, the services of technical experts such as engineers and electricians, none of the islands has sufficient work to occupy such experts on a full-time basis. Efficiency is further compromised under the current structure where islands are free to operate different systems at varying levels of efficiency and safety.
862. Given the scarce human resources and the scattered nature of the CIs, it is essential that key resources are centralized and shared. This is a principle that is applicable for all sectors. One option would be to seek a policy decision to centralize all energy supply operations under one organization. However, the transfer of total responsibility to TAU for the generation and supply of electricity on all islands is not a viable option at the present – not without a commitment by Government and MFEM to provide budgetary guarantees and the establishment of guidelines for operational procedures.
863. A more practical option would be for a central organization to take over responsibility for the maintenance of standards and safety of energy generation, distribution and household wiring in the OIs. Centralizing these functions would maximize the efficiency of the scarce resources. The equipment required to fulfill these roles is expensive and would 38 Observations for Atiu Power Supply, Office of the Minister for Islands Administration, 10 July 2006

183
only be required on an irregular basis on each of the islands. TAU is the only agency with the skills and required equipment to undertake this role. Proposed institutional arrangements for the energy sector are illustrated in Figure 18.
Figure 18: Proposed Institutional Arrangements for the Energy Sector
864. Each of the OIs should continue to maintain an Energy Section with responsibility for the day-to-day routine maintenance and operations of the generation and distribution systems. TAU would be contracted to undertake the maintenance of standards and safety of generation, and distribution of electricity in OIs on a fee-for-service basis. TAU is currently not completely staffed to undertake these functions but reports that it would not be difficult to do so if Government guaranteed budgets.
865. There are no inspectors on any of the islands other than Aitutaki. The inspectorate of the NED is understaffed and underfunded and unable to enforce the regulations in the OIs. The Inspectorate provides unqualified IA energy workers with interim registration to enable them to continue to carry out the required functions and receive indemnity from prosecution. Both TAU and OMIA39 highlight serious safety issues related to distribution and consumer systems.
866. The enforcement of safety should be viewed as a social issue, similar to health and education services, rather than an economic one. It is Government’s responsibility to enforce standard safety requirements for OI power distribution and household wiring. Government should ensure that sufficient funds are provided for annual OI inspections.
867. Government should provide funding for the national inspectorate to conduct regular safety inspections on all OIs. That this may not be the reality in the short-term underscores the urgency for having qualified TAU or private sector electricians travel to OIs to undertake technical work and inspect the work that has been undertaken by IA staff. The current system puts lives in danger and immediate action is needed to ensure the safety of OI consumers.
868. Two steps are therefore recommended. The first is for PDU to immediately contract TAU to undertake a safety audit of all OI (other than Aitutaki) electrical generation and distribution systems and undertake works necessary to ensure that all OI generation and distribution systems meet accepted safety standards.
869. The second is for funds to be made available on an annual basis for TAU to be contracted to undertake the maintenance of standards, safety of generation, and distribution of electricity in OIs on a fee-for-service basis. Staff from TAU will need to make at least two
39 Faulty Power Supply Problems in Atiu. OMIA Report. July 2006

184
visits a year to each OI. TAU will, where appropriate, contract the private sector to undertake work on its behalf in the OIs.
iv. OMIA
870. OMIA is currently responsible for the provision of planning, policy and technical assistance to IA energy divisions. OMIA no longer has the capacity to successfully undertake this responsibility.
871. OMIA’s workshop, which reconditions and repairs OI power generators, is well equipped and efficient. Its staff includes an automotive mechanic and two unqualified staff who have several years of field experience and receive hands-on training in the workshop.
872. It is recommended that the overhauling of OI generation equipment be contracted to the private sector and that CIIC assist OMIA in undertaking a due diligence of the assets of the workshop with a view to their possible lease or sale. OMIA’s role in the energy sector will thus be changed to one of a liaison function between IAs, TAU and the national ED.
v. Alternate Energy Sources
873. The National Energy Policy states that Government is committed to the utilization of indigenous energy sources wherever practical and financially feasible. The ED cooperates with non-government organizations (NGOs) and other regional and international agencies to research and trial the use of alternative energy sources as a means of supplementing existing systems. Current and past activities have concentrated on well established solar and wind energy technologies. Research should be extended to cover emerging technologies, e.g. energy derived from ocean currents, waves and tides.
874. Despite the sentiments expressed in the National Energy Policy and the rhetoric from all sides of government, there is however a discernable lack of understanding of renewable energy resource potential and a resulting failure to provide an attractive enabling environment. The lack of financial commitment by Government has resulted in ad hoc activities and a reliance on aid-funded projects. These factors leave the sector exposed to activities that are externally driven.
875. The current ad hoc mechanisms for implementing government policies for renewable energy are ineffective and inefficient. It is recommended that the agency responsible for energy policy planning establish a technical committee, with representation from the relevant government agencies and the private sector, to evaluate, and give advice on, alternative energy options and strategies and decrease the reliance on fossil fuels.
876. NED should take full advantage of global research by organizations that have greater technical and financial resources than the government. NED should form strategic partnerships with international institutions such as universities to pursue research in sustainable local alternative energy sources. The aim of these partnerships would be to carry out joint research into identifying technically feasible and financially viable alternative energy sources in the Cook Islands including those that utilize the ocean as the source of energy.
877. Economic analysis shows that rising oil prices will lead to the favoring of alternative energy sources such as photovoltaic (PV) systems. However, such analyses needs to consider the additional consumer costs such as the need for DC batteries, transducers or high-cost DC appliances.
878. It is recommended that a review of the energy policy and regulations be undertaken to address issues such as the use of alternative energy sources, self generation of power,

185
and the levels and regulation of tariffs on the development centers of Rarotonga and Aitutaki on the one hand, and the other OIs on the other.
879. The regulations should create economic incentives to promote the use of alternative energy equipment and technologies including solar hot water systems, energy conservation (e.g. innovative building technologies) and household appliances. Such incentives should not be viewed as subsidies but rather as investments that serve to mitigate against rising fossil fuel costs and contribute to an environmentally sound future.
vi. Training
880. Strong partnerships between the ED, the Office of Human Resources Development (OHRD) and the private sector have led to a human resource development and registration regime that is a model for other utility sectors. The draft regulations detail skill requirements for registration of a variety of levels of electricity professionals. These skills are reflected in courses offered by OHRD. The sector’s workers can qualify as basic linesmen, electricity workers, electricity mechanics and fully-fledged and internationally recognized electricians. The step-wise recognition of progress and certification allows individuals to practise their trade at a variety of levels and is said to contribute to professional standards as well as encouraging the retention of skilled workers in the country.
881. OHRD, in conjunction with ED, provides basic-skills short courses to IA energy workers as well as school programs to introduce and attract students to the sector.
882. It is accepted that OIs will not in the short to medium-term locate full time qualified electricians on the OIs. However, a long-term goal should be the development of a capacity building program to ensure that every IA has the services of a qualified electrician to supervise the operation and basic maintenance of generation and distribution systems and install and inspect consumer electrical services.
c. . Private Sector Participation
883. A private sector consultation identified TAU as a State owned enterprise (SOE) that could be considered for Public Private Partnership (PPP). This section of the report, dealing with private sector participation, will address the issue of privatization of SOEs and the establishment of private sector monopolies.
884. As discussed previously, the OMIA workshop in Rarotonga currently overhauls all OI generation equipment. There is a capacity within the private sector to undertake this activity. There is potential for private participation in the overhauling of all OI generation equipment. This could be done through the leasing of the current workshop or through complete sale of the assets.
4. Recommendations
(i) Government to commission a review of the NEP immediately after the
development of a NEDS. The review will include a cost recovery study that will inform tariff setting on Rarotonga and the OIs as well as the development of policies relating to OI cost subsidization.
(ii) NED should be allocated its own annual budget and enter into strategic partnerships with international institutions such as universities to pursue research in sustainable local alternative energy sources.

186
(iii) Establish a technical committee with representation from the relevant government agencies and the private sector to evaluate and advise on alternative energy options and strategies and decrease the reliance on fossil fuels.
(iv) Undertake demand management and safety awareness campaigns in both English and Maori
(v) PDU to immediately contract TAU to undertake a safety audit of all OI (other than Aitutaki) electrical generation and distribution systems and undertake works necessary to ensure that all OI generation and distribution systems meet accepted safety standards.
(vi) Funds to be made available on an annual basis for TAU to be contracted to undertake the maintenance of standards and safety of generation and distribution of electricity in OIs on a fee-for-service basis. Staff from TAU to make at least two visits a year to each OI. TAU, where appropriate, to contract the private sector to undertake work on its behalf in the IOs.
(vii) A comprehensive program to develop the capacity of energy staff on the OIs including: continued on-island and Rarotonga based up-skilling programs for IA staff; a long term strategy through the school star program to attract students to the sector and, in the short-term, the engagement of regional low cost electricians.
(viii) OMIA’s role in the energy sector to change to one of a liaison function between IAs, TAU and the national ED. TAU and OMIA to nominate staff and develop liaison procedures. A Memorandum of Understanding (MOU) needs to be developed and signed by TAU, OMIA (on behalf of IAs) and MFEM.
(ix) The overhauling of OI generation equipment to be contracted to the private sector and CIIC to assist OMIA in undertaking due diligence of the assets of the workshop with a view to leasing or sale.
E. The Municipal Services
885. The three sectors of water resources, sanitation and solid waste management will be dealt with in this section. The protection of water resources (a term used here to include lagoon, surface and ground water) is perhaps the most important economic and social issue facing the Cook Islands. Municipal services within the water, sanitation and solid waste sectors are intricately intertwined in their effect on water resources. Under existing legislation, three government agencies share the major responsibilities for the water, sanitation and solid waste sectors. This and previous TAs have identified fragmented institutional arrangements that lacked coordination between the agencies involved. The fragmentation results in ineffective regimes for management and no clear ownership of policies, strategic plans or regulation at the national level. The lack of ownership and failure to take responsibility is borne out by the failure of government institutions to act on the contents and recommendations of a number of recent studies, and to ratify draft legislation and regulations.
886. The results of an analysis of institutional issues related to the provision of municipal services in the Cook Islands has been discussed previously in Section IV CROSS-CUTTING ISSUES of this Part of the report. The conclusions reached in this analysis are germane to all three sectors (water, sanitation and solid waste management) and will be presented at the end of this section.
887. The generic comments made in Section IV relating to Business Plans and recommendations for their improvement made are also of particular relevance to all three sectors. Discussions of Business Plans will not be undertaken for each individual sector. They will instead be presented at the end of this section.

187
1. Water
a. Introduction
888. As illustrated in Figure 19, the Ministries of Works and Health, the National Environment Service, OMIA and the Island Administrations are the main government stakeholders in the water sector. CIIC, as custodian of all government assets including water collection and reticulation systems, is also a stakeholder in the sector. All water intakes on Rarotonga and the OIs are on traditional land, making landowner and communities essential partners in the protection and utilization of the resource. All water is currently provided free of charge through reticulated systems in Rarotonga and the islands of the southern group. The water provided through these systems is not potable.
Figure 19: Current Institutional Arrangements for the Water Sector
b. Assessment
i. Policy, Planning, Legislation and Regulations
889. Government has not adopted any policies relating to the water sector. In the absence of any existing policy it is considered most effective to address all issues relating to regulation and policy in the one section.
890. The Supportive Services Act 1994 and the Rarotonga Waterworks Ordinance (11 of 1960) provides for the MOW to undertake development, operations and maintenance of water supplies, including headworks and networks, in Rarotonga and the OIs. Both pieces of legislation are outdated. At devolution in 1996, MOW maintained responsibility for waterworks in Rarotonga while responsibility for OI waterworks was transferred to the respective IAs.
891. The Public Health Act 2004 provides for the establishment of safety standards through national regulation of the supply of water in reticulated supplies. In the absence of such regulations, standards provided by the World Health Organization and by the New Zealand Ministry of Health’s Drinking Water Standards for New Zealand 2000, are used for microbiological and non-microbiological compliance.

188
892. The Environmental Act 2003 places responsibility for monitoring environmental and sustainability issues related to potable water with NES. There are no nationally adopted regulations addressing environmental and sustainability issues. Draft regulations and processes addressing collaboration and cooperation with landowners to protect and police water catchments have been developed under the International Waters Programme (IWP) for one catchment area in Rarotonga. The regulations and processes developed under the IWP provide a possible model for national application.
893. The draft legislation developed during a recent ADB TA includes provision for the establishment of a Water Board. Regulations developed for the sanitation sector (see below) include provision for the establishment of a Sanitation Board. International experience shows that the establishment of a single authority with responsibilities for water resources brings efficiencies, reduces duplication and better addresses the issues of cost recovery.
ii. Ownership of Resources
894. All water intakes on Rarotonga and the OIs are on traditional land and there is a commonly held view that the water resources belong to the people. Under current arrangements, the Government has reached agreements with landowners and Island Councils (Vakas) or the traditional chiefs (Ariki) and makes annual leasing payments for the use of the land where the intakes are located.
895. Once the leasing arrangements have been settled, there are little or no further discussions between the two groups. Protection of catchments, the changing needs of users and/or increasing exploitation of water resources are not discussed. A pilot project involving landowners in the protection of catchment areas has been discussed above. The concepts of user pays and private sector participation will no doubt see the emergence of landowner issues, both in relation to land and ownership of the resource. This issue is discussed below.
iii. Private Sector Involvement
896. There is currently limited private sector involvement in the water sector. The private sector does, however, believe that it has the capacity for greater participation in the sector including undertaking contract work for the upgrading of networks of reticulation systems and the maintenance, servicing and overhaul of pumps, filters and associated equipment. The private sector states that, given guarantees of longer term contracts (3-5 years), contractors would invest in the training and equipment necessary to establish and maintain a meter installation, calibration and maintenance function. Private sector involvement in the operations and maintenance of reticulated water systems would be contingent on government funding assistance for the necessary mains upgrade to reduce the current unacceptable levels of loss, the introduction of cost recovery mechanisms and the formalization of landowner issues related to water sources and network systems.
iv. Financing
897. All costs associated with the supply of water to residents in Rarotonga and the OIs are currently met by government from taxes and other revenue. Estimates for cost recovery for the reticulation systems of Rarotonga and the islands in the southern group have been calculated on the basis of NZ$1.00 per cubic meter and a daily consumption of 1,500 liters per head of population. The estimated revenue would pay for 100% of the O&M costs of a fully treated system in Rarotonga and about 60% of O&M costs in the other islands.

189
c. Consideration of Alternatives
i. Institutional Arrangements
898. The Water Works Division (WWD) of MOW is responsible for the development, operation and maintenance of the water supply in Rarotonga. The WWD is headed by an engineer supported by one trainee engineer, a certificated water quality technician, 2 certificate-level trainee hydrologists and a field operations team consisting of a supervisor, two foremen and six experienced pipe fitters. The division maintains the island’s water supply system and is sometimes hired out at an uneconomic rate to undertake domestic services.
899. The system is characterized as inefficient and outdated. Public perception is that standards are declining. Issues which contribute to the current situation of confusion and underperformance include: high losses due to corroded pipelines; non-drinkable tap water posing a public health risk due to lack of disinfection; poor management of catchment safety; a lack of detailed knowledge in relation to the quality and extent of water resources; and duplication. The IA for each island of the Southern Group is responsible for the development, operation and maintenance of the water reticulation systems and the maintenance of community water storage tanks on their respective islands. As with the energy sector, the staff of the IAs provide service to householders on a fee paying basis.
900. The infrastructure staff of the IAs in the Northern Group maintain community water tanks that collect water off the roof catchments of public buildings. They also provide technical advice to residents, if requested.
901. MOW staff, when visiting the OIs, assist in the planning, development and works supervision of OI waterworks proposals by providing training to IA infrastructure staff.
902. As with all infrastructure sectors, OMIA’s lack of staff, limited technical capacity, and funding issues are major constraints to its involvement in its designated functions. It is difficult for OMIA to effectively facilitate the maintenance of existing infrastructure in the islands as well as anticipating and planning for additional demands resulting from new developments. OMIA has no civil engineers on staff and is therefore unable to provide technical support and advice to the OIs for all the utility sectors. OMIA should provide a focus for liaison and contact between each of the IAs and the Waterworks Division of MOW or the private sector. MOW staff either work directly with IAs or in partnership with international and regional agencies and private contractors.
903. Options for institutional arrangements for the operation and maintenance of water works in Rarotonga and the southern islands with reticulated systems range from full privatization to maintaining the status quo. Increased private sector participation through PPPs could be possible, in the medium-term, in Rarotonga and perhaps Aitutaki but would be contingent on resolution of issues previously discussed including the high losses currently being suffered in Rarotonga due to old and badly maintained networks, the introduction of cost recovery or user pay mechanisms, and ownership of land and resources. As stated earlier the Government has, through negotiation, leased land to establish intakes. When confronted with the possibility of privatization, landowners state that the land was leased to Government so that a service could be provided to all the people. They therefore question the right of Government, under the current lease arrangements, to pass on these assets to the private sector for companies and individuals to make profits. Resolution of these issues is beyond the scope of this TA.
904. As with all other technical areas, there is a severe shortage of professional and technical skills in the water sector. A discussion of the generic issue relating to limited

190
technical capacity and a consideration of the alternatives has taken place earlier in this part of the report. As with other sectors, it is recommended that resources be centralized to establish a core technical group of water professionals and that OI IA infrastructure staff capacity be developed through an ongoing training program. OMIA should provide a focus for liaison and contact between each of the IAs, the centralized technical pool and the private sector.
905. The IAs in the southern islands should continue to be responsible for the day-to-day management and operation of island waterworks. They suffer from serious skill deficiencies however and their staff require on-going training in the maintenance and operation of the distribution pipe networks. Southern Islands IA staff would also need training in accounting and customer relations if user-pays systems were to be introduced. Increased private sector participation, particularly in Aitutaki, is strongly recommended.
906. IAs should continue to be the responsible agency for water in the northern group. As with their counterparts in the southern islands, staff of the northern islands lack skills and access to training. However, because of the nature of the water systems in the northern group, the primary focus of training should be how to advise and assist households to maximize their water catchment and improve and maintain water quality. In addition, they need skills to maintain community tanks, and install and maintain pipelines piping water from community tanks to households. Responsibility for the maintenance of household water tanks should rest with householders.
ii. Institutional Collaboration
907. Issues related to institutional fragmentation have been discussed and alternatives considered in Section IV of this part of the report.
iii. Monitoring of Water Quality
908. Issues related to the monitoring of water quality have been discussed and alternatives considered in Section IV of this part of the report.
iv. Water Conservation
909. Due to the nature of life on resource-limited islands, a deep respect for the protection of water sources and the efficient use and conservation of water are part of the traditional culture of the people of the OIs. This is especially applicable in the Northern Group where inhabitants have highly developed water conservation and demand management regimes. However, the adoption of western cultural lifestyles and free supply of reticulated water has led, particularly in Rarotonga, to inefficient and wasteful use of water.
910. Community awareness programs, highlighting the finite nature of water resources and presenting the environmental and economic realities, should be initiated to promote water conservation. The programs should build on traditional water conservation practices and attitudes and water conservation should be integrated across all subjects and levels of the school curriculum. However, lessons from overseas show that people do not value what they perceive to be free. Generic issues relating to cost recovery and user-pays systems for municipal services were discussed earlier in this part of the report. Issues and alternatives specific to the water sector are discussed below.
191
d. Cost Recovery
911. Cross-cutting issues relating to user-pays and cost recovery have been discussed in Section IV of this part of the report. Discussions relating to the introduction of a user-pays system for water have been ongoing for several years. The issue is politically sensitive even though all politicians and political parties consulted agree that it is necessary. No tariffs are currently charged for consumers on islands with reticulation systems. It is reported that Rarotonga consumers did pay water tariffs in the past. A legacy of this past system and more recent trials is the fact that some consumers are metered though no readings are being taken. Landowners argue that the water belongs to them; they are not compensated for its use and question why government should charge for water. Consumers question the logic of paying for water that cannot be safely consumed. This line of logic has some credence as far as domestic users are concerned but no relevance for water used for commercial purposes, especially hotels catering for international visitors. It can be argued that the government has the right to recover the large investment in piping the water to consumers and the not inconsiderable cost of operation, maintenance and upgrading of the network.
912. Options for the introduction of a user-pays system for water in Rarotonga and islands where there is a reticulated water distribution system are discussed below.
913. The first option is a do nothing (status quo) option which is based on the understanding that government owns the resource and will continue to use the taxation system to provide free water to all consumers. A performance-based funding system will need to be introduced whereby the annual budget allocated, to MOW for O&M and to the IAs that manage water distribution networks, would depend on performance against efficiency targets including reduction in unaccounted-for water levels. This will improve the efficiency of use of water and will make the operation more sustainable but the disadvantage would be the lack of incentive for consumers to recognize that water is a valuable resource, and conserve it. Because the water is free, they would continue to see repair of leaking taps and cisterns as a cost rather than a saving.
914. The second option would be a variation to the above and involve the introduction of a tariff based on a volumetric charge to commercial premises, with no tariff for domestic households. This would allow some recovery from large users and take into account the community attitude that the water is “theirs”. Water will be free to households, but visitors and commercial users would pay according to use.
915. A third option would be to introduce a full user-pays system, whereby consumers pay for the water they use. The charge to consumers would cover O&M and full cost recovery of assets. Tariff charges would be subject to approval by Cabinet or a tribunal to ensure affordability. Consumers would have an incentive for efficient operation of the system, including the repair of their own in-house leakages. Traditional land owners and/ or Vakas could be paid a raw water payment. Such a system will require the installation of meters and the introduction of accounting and billing systems.
916. The full user-pays system for water is the preferred model overseas and is recommended for all islands with reticulation systems. However, it is strongly suggested that, before its introduction, government should initiate extensive community debate.
917. It is essential that disinfection systems be introduced into all reticulation systems prior to the introduction of a user-pays system. While the full treatment of water is not an essential prerequisite for a user-pays system, it is recommended that this should be progressively introduced into reticulation systems starting with Rarotonga and Aitutaki.
192
918. A detailed discussion of the pros and cons of user-pays systems for municipal utilities has been undertaken elsewhere in this part of the report. Following a detailed study of the water sector and the introduction of disinfection systems, user-pays systems could be introduced for the reticulated waters systems of Rarotonga and Aitutaki. Consideration could then be given to extending the system to the other southern islands with reticulated systems. Capacity development and training associated with the introduction of user-pays water services would include: technical training in meter installation, reading and calibration; the establishment of accounting and billing systems; and the training of administration staff in the operation and maintenance of these systems and in improved customer relations.
919. One option for rate collection that has been discussed in the past and still has credence is the modification of the TAU accounting system to include collection of water charges.
920. Government, through AMD and MOW, should develop strategies for the introduction of user-pays systems in Rarotonga and Aitutaki commencing initially with metered water use and volumetrically varied tariffs for commercial users. As a second step, a variable volumetric tariff for all domestic consumers based on a standard minimal use, levied so as not to disadvantage the economically challenged, should be introduced.
921. Consideration could then be given to extending the system to the other southern islands with reticulated systems. However, the quality of the water provided by some of these systems would need to be vastly improved through treatment prior to considering the levying of tariffs. Landowner and political difficulties should be expected.
2. Sanitation
a. Introduction
922. Figure 20 depicts current institutional arrangements for the CI sanitation sector. Under existing legislation, three government agencies share the major responsibilities in the sanitation sector: MOH, NES and MOW. MOW has the responsibility to develop and include in the Building Code, specifications for the construction of septic tanks. MOH issues permits for the construction of septic systems and is supposed to inspect their construction and monitor their operation. MOH does not have the technical capacity to undertake this latter function and MOW building inspectors undertake inspections of septic facilities as part of the building construction inspections. As part of its responsibility to protect foreshores, inland and Cook Island coastal waters, the NES is responsible for construction site inspections and approving the siting of septic systems and septage processing facilities and monitoring their discharge.
923. The review undertaken through ADB TA 4273-COO40 identified fragmented institutional arrangements and concluded that the fragmentation results in an ineffective regime for managing the pollution caused by poorly placed and constructed or inadequately maintained septic tanks and sewage treatment systems. The ongoing NZAID-funded Cook Island Ministry of Marine Resources Institutional Strengthening Project (CIMMRISP) identifies the unchecked pollution from septic systems as a major threat to ground water and the health of lagoon systems.
40 ADB TA 4273-COO: Technical Assistance to the Cook Islands for Legal and Institutional Strengthening of
Environmental Management. 2003.

193
Figure 20: Current Institutional Arrangements for the Sanitation Sector
b. Assessment
i. Policy and Planning
924. 291. There is currently no national policy addressing sanitation issues. A set of regulations for sanitation was developed by ADB TA 4273-COO41 and has been reviewed and revised by stakeholders. These regulations have not been approved. The regulations update sanitation standards to the equivalent of Australian and New Zealand standards and will form the basis for the development of a national sanitation policy.
ii. Legislation and Regulations
925. The Building Control and Standards Act 1991 and the Building Control and Standards Regulations 1991 require MOW to develop and include specifications for the construction of septic tanks in the Building Code. Stakeholders advise that the current Building Code sanitation requirements are inadequate. The regulations have been developed to acceptable international standards and should be used to instruct the revision of the Building Code. It is instructive to note that private sector members of the newly formed Plumbers and Waster Water Association advise that most major plumbing contractors in Rarotonga already work to the Australian and New Zealand codes.
926. The Public Health Act 2004 provides the authority for MOH to regulate the quality of discharge of devices and facilities, plants and systems that treat sewage and the removal and disposal of liquid waste. There are no specific regulations setting out effluent quality but relevant New Zealand and World Health Organization standards are applied. MOH is also charged with the responsibility to issue permits for the construction of septic systems and is supposed to inspect their construction and monitor their operation.
927. The Environment Act 2004 authorizes the National Environment Service to deal with “Specific Areas of Concern” regarding the protection of foreshores, inland and Cook Island waters including the siting of septic tanks and septage treatment systems and through monitoring, ensure that the effluent standards set by MOH are maintained.
41 ibid

194
928. The Outer Islands Local Government Act 1987 provides for the Island Councils to make by-laws to regulate and control septage collection and disposal but no known by-laws are in place. Stakeholders are unanimous in their recommendation for a single national sanitation standard.
929. All stakeholders are in agreement with the technical aspects of draft regulations. Adoption has been held up because of uncertainty in the institutional arrangements for the application of the regulations.
iii. Private Sector Involvement
930. Private sector plumbing businesses with qualified plumbers operate in Rarotonga and Aitutaki. While there are no organized plumbing businesses on the OIs, individuals with plumbing skills and experience provide their services on a commercial basis. Private sector plumbing services construct septic systems on Rarotonga and Aitutaki while private persons with some skills construct septic systems for customers in the OIs. Private sector contractors provide a septic tank sludge pump-out service to householders on Rarotonga. Householders’ payment for this service includes the cost of transport and dumping the sludge into the septage pond at the Waste Management and Recycling Unit (WMRU).
931. There is currently no septage removal service in the OIs even though there are septage ponds in the new WMRU on Aitutaki. Septic tanks in Aitutaki and the other OIs are currently emptied out manually and the septage dumped in a hole dug near the septic tank. This practice is a serious health hazard and contaminates the surrounding water table.
932. MOW and the (Aitutaki Environment Service) Aitutaki Island Council operates the septage treatment facilities in Rarotonga and Aitutaki respectively. The current rates of return on the operations do not make them attractive to the private sector and operations will need to continue to be subsidized.
iv. Financing
933. The sanitation sector has the notable distinction of being the only sector not receiving any direct funds for capital expenditure in fiscal year 2005/06 either from the general government budget or donors. (Source: Cook Islands Appropriations Amendment 2005-2006). However, according to the Public Health 2006-7 Business Plan, MOH has access to substantial funding including NZ$132,900 from NZAID and $420,000 from the Environmental Protection Fund to conduct the activities detailed above.
934. There are few opportunities for cost recovery within the sector. The Rarotonga WMRU has a basic charge for the dumping of sludge. However, the revenue covers less than 10% of O&M costs and operations will need to continue to be subsidized. The charging of rates for customers of proposed village systems is estimated to raise around 60% of estimated O&M costs.
935. Both NES and MOH charge developer/owners of new constructions a fee of NZ$10 each for site inspections, and a permit to build a septic tank.
v. Current Institutional Arrangements
936. The situation as it stands requires the developer/owner of a new construction to:
• have NES undertake a site inspection to ascertain whether an environmental impact assessment report is required and, if so, to conduct such an assessment and recommend and approve siting of the septic facility;
• obtain a permit from the MOH for the design and construction of the septic facility;

195
• take the two permits issued after the above processes to MOW for the issue of a permit for the construction of the building.
937. Under draft regulations, MOH would have the responsibility for the entire process commencing with applications to build systems through to site inspections, approval to operate, and continued inspections and monitoring. The Secretary for Health would be empowered to appoint persons with the necessary technical qualifications from within government, or fee-charging private sector individuals, as inspectors to undertake site inspections, supervise construction and monitor operations.
938. MOW would maintain the responsibility for the Building Code and for the operation of the Rarotonga Waste Facility the septage ponds in this case .
939. It is reported however that there have been second thoughts as to the effectiveness of such a system based on whether MOH has the technical capacity to provide the necessary policy, planning and technical leadership and support to the OIs. There are neither plumbers nor structural and sanitation engineers currently employed by MOH and the placement of such technical skills in MOH was considered to be an inefficient use of scarce resources.
vi. Draft Sanitation Regulations
940. The draft regulations would set in place robust and up-to-date procedures and standards. They would also establish a Sanitation Board with responsibilities to: establish criteria for the registration of sector professionals; review and approve technology; review and recommend to government on-going revisions to the legislation and regulations; and provide a conduit for government policy directives.
941. Stakeholders argue that the sector should, like the electricity sector, not wait for the formal approval but immediately put into place the institutional and procedural systems required under the draft regulations (including the Sanitation Board) and use the draft regulations as guidelines for operation. International best practice would, however, suggest combining water and sanitation regulation and management. The inclusion of solid waste would, considering the importance of water resources in the Cook Islands, the current fragmentation, and limited capacity further improve efficiency and reduce duplication.
vii. Monitoring
942. There is no effective regime of testing to monitor the effects of septic tanks and sewage treatment systems on ground and lagoon waters. As with the whole of the sanitation sector, the institutional arrangements are fragmented and lack coordination. The issues relating to monitoring of water resources and full consideration of the alternatives have been addressed earlier in this part of the report. It is sufficient to note that the pollution of lagoons and surface and ground water is a critical issue, and government and stakeholders need to work in a collaborative and cooperative fashion to develop and implement a sustainable and effective monitoring system.
viii. Outer Islands
943. Increasing numbers of OI households are installing flush toilets and constructing septic systems. The Outer Islands Local Government Act 1987 provides for the Island Councils to make by-laws to regulate and control septage collection and disposal but no known by-laws are in place. The Aitutaki Island Council is understood to be preparing to enact The Regulations. It is essential that whatever regulations are finally adopted, they are applicable to the whole country.

196
944. The Aitutaki Island Council operates a WMRU similar to that in Rarotonga but the island does not have a vehicle or service to de-sludge septic tanks and transport the sludge to the facility.
945. While an increasing number of OI residents are changing from lagoon and pit toilets to the more hygienic flush toilets and septic systems, none of the outer islands currently have septage treatment facilities. Currently, the health inspector on each OI is responsible for the acceptance of applications to construct septic systems and for supervising their construction. They are also responsible for the inspection and monitoring of existing systems. It is considered that even though OI Health Inspectors have received some training under the ADB/NZAID co-funded Marine Resources project they lack the capacity to effectively discharge their functions. One possible alternative is to have IA infrastructure staff with plumbing and construction skills assist in this function. However, even if these responsibilities are eventually shared with the infrastructure specialists in the IA and/or private sector personnel, ongoing capacity building will be required.
946. There is evidence that the effluent from poorly constructed and maintained septic tanks are polluting ground water in the OIs. This is of particular concern in the islands of the southern group where ground water is utilized for their reticulation systems.
ix. Community Awareness Campaign
947. MOH has both the funding and capacity to provide the education necessary to improve public awareness of the purpose of the proposed regulation. The mainstreaming of sanitation issues within the formal and informal education and vocational training curricula should be an integral part of the awareness and education strategy. Schools should be encouraged to include sanitation as part of their environmental programs from early childhood to senior school student levels.
948. Community awareness is the key to more positive action to implement sanitation strategies. Knowledge and understanding of the implications of unsafe sanitation practices should lead to appropriate action. As a rule, however, changes in behavior are not effected by the simple input of information, and incentives may be required, such as the likelihood of specific negative effects on livelihood and prosperity. Unchanged sanitation practices have the potential to contribute to serious negative economic consequences.
x. Capacity Building
949. There is currently no regulation of professionals in the sector. It is reported that the CIMMRISP has assisted in the development of strong partnerships between government agencies and the private sector that are leading towards a human resource development and registration regime. The Plumbers and Wastewater Association is a result of this development. The Association is driven by the public sector and argues that the sector requires professional regulation to maintain standards.
950. The Association needs to liaise with DNHRD to work cooperatively in the development of in-country courses, access to overseas training opportunities and attachments, and the provision of funding to ensure OI staff attend training courses in Rarotonga and trainers conduct courses in the OIs.
951. IAs, MOW staff, authorized inspectors, master plumbers and construction foremen will need training in approval of designs and limits of designs, construction principles, inspection of systems and accreditation.
952. NES staff require training in legal enforcement and prosecutions to ensure that all aspects of case development including scene investigation, witness statements, collection

197
and safe storage of exhibits, preparation for court appearances, and court procedures are effective.
953. Laboratory staff will require training in sample testing for microbiological, organic and inorganic testing, equipment use, monitoring schedules, data collection, and custodianship and reporting. Field staff will need to be trained in sample taking and management.
954. There is a need for basic and more advanced plumbers, master plumbers and inspectors involved in the installation of septic tanks, filters, and the renovation and rebuilding of tanks.
955. With the introduction of new technologies for wastewater management, such as the neighborhood treatment plants in Rarotonga and the more advanced systems for use by households in environmentally sensitive areas, there will be a need for skilled operators who can audit, maintain and repair such units. A pool of such technicians will be needed. As the course for a licensed operator takes at least 12 months, the training process should be started as soon as the feasibility studies have been approved for implementation.
3. Solid Waste
a. Introduction
956. The Government agencies sharing the responsibilities for solid waste disposal are the same as those in the water and sanitation sectors. As with the water and sanitation sectors, institutional arrangements in the solid waste sector are fragmented, policy and regulation outdated, and management regimes ineffectual. MOW has the legal responsibility to provide the public solid waste disposal facilities. MOH has the authority to issue permits for the construction of waste disposal sites and the responsibility to monitor the collection, treatment and disposal of solid waste. NES is responsible for policy and strategic planning of solid waste disposal and is empowered to deal with issues regarding pollution from waste disposal sites. The private sector and communities have, in more than any other of the relevant sectors, opportunities for important roles in the solid waste sector.
b. Assessment
i. Policy, Planning, Legislation and Regulations
957. The Supportive Services Act 1994 requires that MOW provide the public facilities, including those for solid waste disposal, required for the development of the Cook Islands. The Rarotonga Island Council: (Empowering Public Works and services) Ordinance (4 of 1959) empowers the Councils to provide refuse disposal facilities and to levy such charges as necessary to carry out the works. The Rarotonga Waste Facility (RWF) which comprises the landfill, septage ponds and the recycling centre is operated by the Waste Management Divison of MOW in Rarotonga. The Aitutaki Environment Service operates the Aitutaki Waste Facility behalf of the Island Council. The WMD of MOW and the Environment Service of Atitutaki are responsible for the operation of landfill and recycling facilities designed and constructed under the ADB Waste Management Project.
958. The Public Health Act 2004 provides for the MOH to: issue permits for and oversee the construction and engineering of waste disposal sites; and monitor the collection of waste and its treatment and disposal.
959. NES is responsible for policy and strategic planning of solid waste disposal and is empowered under the Environment Act 2004 to deal with “Specific Areas of Concern” regarding pollution from solid waste disposal sites. The National Waste Policy and Strategy developed more than 12 months ago as part of the landfill project is yet to be approved. NES reports that approval has been delayed because of the absence of strategies for disposal of post-cyclone green and building waste. As a result of stakeholder consultations undertaken

198
under this TA the private sector has agreed to assist in the development of these strategies. The National Waste Policy and Strategy proposals for institutional arrangements are shown in Figure 21.
ii. Private Sector Involvement
960. The private sector is involved in various contracts and self-generated activities in Rarotonga in support of waste management. Private contractors collect household solid waste in both Rarotonga and Aitutaki for delivery to the Rarotonga and Atituaki Waste Facilities . Householders are required to separate organic and recyclable waste for collection. Private contractors are engaged on an as-needed basis to spread and compact solid waste at the two waste disposal facilities. However, contractors state that the current one year contracts do not encourage investment.
961. Other private sector initiatives include a waste oil recovery system, aluminum cut-offs and cans, scrap metal recycling, the crushing and packing of industrial cardboard for export, and recycling of soft drink bottles. It is reported that the once economically viable shipping of glass and plastic to New Zealand is no longer undertaken. This continues to place a strain on the WDC. Private sector elements involved in recycling for export activities leverage shipping space from related businesses and serve the dual purpose of providing funding to cover operational costs and reducing stress on the MOW operated landfill.
iii. Community Involvement
962. The management of waste should be a partnership between government, communities and the private sector. In Rarotonga, there are several community initiatives for the protection of the environment and recycling of solid waste.

199
Figure 21: Proposed Institutional Arrangements for Waste Management
iv. Financing
963. Solid waste management is another sector with low budgets. In fiscal year 2005/06 only NZ$30,000 was allocated for capital expenditure in this sector. (Source: Cook Islands Appropriations Amendment 2005-2006). The apparently low level of funding may be a reflection of large investments in the sector (the two landfill sites and the waste recycling

200
station). It may however highlight the low priority allocated to addressing the same issues on the outer islands.
v. Waste Disposal Centers
964. In Rarotonga, where WMD has responsibility for the RWF,the WMD staff include one engineer and four site workers. The original plan for the WDC was that MOW would manage the site for a year and then contract out or privatize the operations with NES taking over responsibility for monitoring of the site.
965. Full privatization of the center is not a viable option at present as the sum total of operations is uneconomical. MOW believes that a mix of contracting out of operations and management and private participation in the recycling center is a possibility. This operation is currently run at a loss and the private sector does not agree with MOW’s assessment that it is a potentially profitable enterprise. The proposal (see Part 1) for the development of a transfer center where refuse is separated is widely supported by stakeholders.
966. The Aitutaki Waste Facility was constructed on Aitutaki under the same ADB Waste Management Project funded project. The facility has not yet been issued with a completion certificate. The Aitutaki WF is operated by the Enviroment Service and it is intended that the responsibility for the monitoring of the facility will be handed over to NES as soon as the completion certificate is issued.
967. IAs are responsible for policy, planning and implementation of solid waste disposal on each of their islands. All IAs provide free weekly collection of solid waste from households. Landfill dumps are operated away from villages. There is no separation of organic and inorganic waste nor any organized recycling. Vaka Councils in Rarotonga have no formal responsibilities but have taken the initiative to assist in the controlling of roadside waste to assist households to dispose of household waste.
968. IAs have little or no capacity to develop policy and strategic plans or to implement, manage and operate safe solid waste disposal systems. OMIA does not have the capacity to provide the technical advice and support necessary to assist and strengthen the ability of IAs. MOW currently provides a technical advisory service on solid waste disposal to the OIs on request. Assistance is currently provided to Aitutaki, Atiu and Mangaia and MOW would like to extend this service to all OIs and to include technical capacity building and strengthening of IAs capacity to develop policy and strategic planning for the disposal of solid waste.
969. NES has staff in Aitutaki, Atiu and Mitiaro with another four IAs requesting a fulltime presence. MOH has Health Inspectors on all islands. As with all other municipal sectors, the solid waste sector suffers from fragmented institutional arrangements and a lack of coordination between the three government agencies involved. The rhetoric of meetings between the agencies in Rarotonga is not translated into action in the field. The failure to adopt the National Waste Policy and Strategy developed more than 24 months ago and the lack of pollution monitoring at both the Rarotonga and Aitutaki WFs are symptomatic of the lack of coordination at both the policy and operations levels.
vi. Monitoring
970. The Design Engineers (Maunsell Ltd of NZ) who designed and supervised construction of the both sites conducted some training of MOW, MOH, MMR and NES staff on testing procedures. Analysis of the initial tests was undertaken in-house by MOW, at the MOH laboratory at Rarotonga Hospital and in New Zealand.
971. A suggested regime for testing was prepared by the contractors and under current legislation the responsibility for monitoring rests with NES. However, no testing has been

201
conducted since the original testing took place more than a year ago because NES will not take on its responsibility for monitoring the site as no formal handover has taken place. Neither MOW nor NES has the technical capacity to analyze tests. Site testing at both Rarotonga and Aitutaki needs to be included in the comprehensive water resources testing regime proposed earlier in this part of the report.
972. MOH undertakes regular site visits to the Rarotonga and Aitutaki facilities to check for leaks and pests. MOH conducts regular spraying for flies. Health Inspectors on each of the OIs have the responsibility to monitor solid waste disposal though a lack of training and funding mitigates against their effective participation.
vii. Community Awareness Campaign
973. There is an urgent need to increase community awareness about the need for proper disposal of garbage. The program should be combined with education about sanitation and personal hygiene. An ongoing public education campaign must be implemented. The program should also include the “3R campaign” – Reduce, Recycle and Reuse. This is essential if the government’s Millennium Development Goal of 30% reduction in waste disposed at landfill sites is to be achieved.
viii. Cost Recovery
974. The solid waste collection service on Rarotonga and the OIs is provided free of charge to consumers by MOW and IAs respectively. This service is contracted out to the private sector in Rarotonga and Aitutaki and undertaken by IAs in other OIs. In Rarotonga and Aitutaki people taking their own solid waste to the facilities are charged a nominal fee. Current estimates by MOW for the continued cost of operation of the Rarotonga and Aitutaki waste disposal facilities place full cost recovery beyond consumer capacity. Fees could however be charged the solid waste collection service provided in Rarotonga and the OIs and estimates are that if such fees were charged they would cover approximately 80% of O&M costs.
ix. Increased Private Sector Participation
975. Private contractors who collect household solid waste for disposal at the waste disposal facilities complain that the current one year contracts do not encourage investment on their part. MOW, on the other hand, states that one year contracts allow MOW to have better control over contractor performance. Both concerns could be met if contracts were let for longer periods of time and included measurable performance indicators that contractors needed to meet. Independently monitored performance could allow for incentive payments for better than agreed performance and penalties when agreed minimum levels of performance were not achieved.
976. The refuse collected by contractors and taken to the MOW landfill does not undergo separation and a mixture of organic and inorganic waste is currently dumped into the RWF’s landfill. Private sector elements involved in recycling for export have developed their own technical expertise and capacity and estimate that, at the current rate of dumping, the landfill’s life span would be reduced by up to 40%. The current compaction and export of industrial cardboard has resulted in 25 containers already shipped to New Zealand. There is potential for significant landfill space saving if household cardboard is recycled.
977. The solid waste sector provides opportunities for productive public – private – community partnerships. Community participation begins with the separation of waste for collection by private sector contractors. The private sector could be assisted in the development of a transfer station to which refuse collected from households is taken for

202
sorting into recyclable, compostable, and waste to be dumped at the landfill. The benefits would not only be environmentally beneficial but would also enable the life span of the landfill to be extended by reducing volumes dumped.
4. Preferred Options for Municipal Services
978. Until such time as Government develops its NEDS and the relevant Government stakeholders take ownership and display a willingness to undertake responsibility and reduce fragmentation, there is little hope of formulating, adopting and implementing a national policy for the management of water resources. Firm institutional recommendations at this time are therefore highly contentious and beyond the scope of this TA.
979. The preferred option for the institutional future of the municipal services would see the three sectors maintaining the status quo and ceasing policy and regulatory work until such time as a NEDS is approved. Government would undertake a comprehensive, sector wide review with a view to developing consolidated policy and regulations, reducing duplication, consolidating capacity and taking note of international experience and lessons learned.
980. The policy unit of the OPM would provide leadership in the development of a consolidated municipal services policy and assist in the development of business and action plans with SMART42 indicators, reliable baseline data and realistic targets.
981. The preferred option for the provision of chemical and biological analysis would see Government establish a central testing facility for all environmental testing in conjunction with, and under the management of, the existing MOH laboratory. Donor funding would be required to build and equip the laboratory and to provide the training for staff. Government would need to fund the technical staff and the on-going O&M costs.
F. Telecommunications
982. Telecommunications services are provided by a private company and as such no institutional analysis and recommendations will be made by this TA.
983. Agencies involved in the Telecommunications sector are Telecom Cook Islands Ltd (TCI), government ministries, IAs, and the private sector. TCI is the sole provider of telecommunications in the Cook Islands. TCI is a private company owned by Telecom New Zealand (TNZ) Ltd (60%) and the CI Government (40%).
984. TNZ is reported43 to have made an annual profit of around NZ$8 million. This is believed to be a handsome return on TNZ’s equity and the dividends paid to the Government represent a significant proportion of its annual earnings.
985. It is reported that TCI’s current monopoly agreements with government are due to expire and that negotiations for extension of the arrangements are underway. Undoubtedly Government will consider the effects on both consumers and its own budget before deciding between continuing the monopoly or opening the network to other providers.
G. Evacuation Centers
1. Introduction
42 Performance Indicators should be SMART, i.e Specific; Measurable; Achievable; Realistic; Timely 43 Reported on www.tvnz.com.nz,. April 3 2006

203
986. Component One of this project, undertaken by the South Pacific Applied Geoscience Commission (SOPAC) and the Ministry of Civil Defense & Emergency Management (MCDEM) NZ from August 2005 to March 2006, was designed to strengthen the disaster mitigation and preparedness arrangements in CI. The final report resulting from Component One addresses all institutional issues relating to Disaster Management & Mitigation and these findings will not be repeated here. This section will deal exclusively with institutional issues related to Emergency Management Centers (EMCs). EMCs have been renamed Evacuation Centers (EC) and will be referred to as such in this part of the report. References to the overall institutional issues of emergency management will only be mentioned as and when relevant to ECs.
2. Assessment
a. Legislation, Regulations, Policy and Planning
987. The Hurricane Act (1973) is currently the only legislation that addresses disasters. This legislation is out of date and does not satisfactorily address risk reduction or preparedness.
988. The draft Disaster Risk Management (DRM) Plan and supporting legislation in the form of a draft DRM Bill prepared under the first component of this TA is proposed to replace the current National Plan and the existing legislation. The legislation and plan are the result of extensive consultation and are currently with Crown Law. Their preparation and ratification are a critical step in the development of an appropriate organizational structure and arrangements to oversee policy, strategy and programs in disaster risk reduction and disaster management in the Cook Islands.
989. The DRM Plan sets out the machinery to give effect to the Bill. Cabinet has, in the absence of any current framework for multi-agency responses to emergencies, approved the establishment of Emergency Management Cook Islands (EMCI) within the OPM. EMCI reports to the National Disaster Risk Management Council (NDRMC) whose membership includes government, civil society and private sector representatives.
b. Evacuation Centers
990. ECs have always been located in schools and local community centers. After the six cyclones of 2005, the Ministry of Education (MOE) requested that alternative arrangements be made for ECs in the belief that children would be safer attending school and out of the way of falling debris and big machinery during the post natural disaster cleanup exercise.
991. It is also believed that schools do not have the appropriate cooking, water, communication and sanitation facilities appropriate for the accommodation of many people for extended periods of time.
992. The Master Plan includes projects to ensure that, in the event of a disaster, ECs have adequate water, sanitation, back-up power generation, and communication facilities.
c. Financing
993. There is no process in place for annual physical audits and ongoing maintenance of ECs. Such audits are essential to ensure that buildings meet safety requirements as specified under the revised Building Code and that water, sanitation, power and communications facilities meet required standards. At the same time dedicated funding must be available to bring ECs not meeting requirements up to standard.
994. The DRM Plan has provisions for the preparation of individual Island Disaster Risk Management Plans. It also provides for the establishment of a group comprising the Mayor, Police, Island Council, IA and various other community, civil society, and private sector

204
representatives to implement and enforce the plan. However there are no provisions for physical and financial responsibility for the operations and maintenance of ECs.
3. Consideration of Alternatives
995. The agencies currently involved in the maintenance of ECs are CIIC (for Government-owned buildings) and communities or Island Councils (for community halls). While Government does not own community halls, these are nonetheless identified as ECs. Government has a social responsibility to ensure that they are provided with the required facilities.
996. Decisions need to be made as to which government agency or agencies will be responsible for, and appropriately funded, to undertake, annual physical audits and the follow-up repairs and maintenance of ECs prior to the cyclone season.
4. Recommendations
997. The following are generic recommendations regarding activities that should be part of an accepted annual process. The nomination of the specific agencies responsible for the discharge of these activities in Rarotonga and the OI is a not a decision that can be made by this TA.
• A basic minimum set of standards for ECs be developed • Annual funding for audits and EC O&M be an annual appropriation to say MFEM or
CIIC; • Audits similar to those conducted on airstrips to be conducted annually on all ECs; • The Audit be outsourced to public agencies or private contractors; • Audit reports for the ECs to be presented to the Council. • The Council to prepare and approve budget and direct the release of funding to the
responsible agency; • The responsible agency to outsource the approved repairs and maintenance works
to be carried out to public agencies or private contractors; • All annual repairs and maintenance works are to be carried out before the cyclone
season to ensure that ECs meet required standards. •
VI. SUMMARY AND CONCLUSIONS
A. Introduction
998. Government is faced with the constraints of limited resources and technical skills and a small population spread over a wide geographical area.
999. Strategies suggested to address these constraints are based on the following philosophy:
• Well resourced agencies responsible for the functions of: policy and planning; implementation (engineering and construction); operations and maintenance; and monitoring and enforcement;
• The establishment of pools of technical skills in government or technical ministries with funds available to provide fly-in services to the OIs as needed;
• Outsourcing of design, construction, operations and maintenance of works to either government agencies or the private sector;
• Key agencies such as AMD and OMIA having the funds to outsource works to other government agencies or the private sector on a fee-for-service basis;

205
1000. The strategic approach is based on the assumption that Government will:
• Develop and put in place an effective and realistic economic development strategy; • Develop sectoral policies that are instructed by and support the national economic
strategy; • Develop, maintain and enforce an effective system for monitoring and evaluating
performance; • Develop and implement a policy for outsourcing and create a stable enabling
environment for its achievement; • Pursue policies to build up private sector capacity so as to maximize their
involvement in the construction, operation and maintenance of infrastructure; • Invest in capacity building so as to achieve medium and long term targets.
B. A National Economic Development Strategy (NEDS)
1001. Since the meltdown of the early 1990s, good financial management and discipline have brought fiscal stability to the economy. This has not been matched with the development of a National Economic Development Strategy (NEDS) based on economic realities and social priorities. The lack of a realistic economic strategy hampers the development of genuine policy and the translation of that policy into business and action plans with achievable targets. It is recommended that Government develop a capacity to provide guidance and leadership in the development of a NEDS and subsequent sector policies. The approach suggested in the Master Plan is the strengthening of OPM through the development of a Policy and Planning Unit which would then initiate and support the development of a NEDS, support sector policies and establish a monitoring and evaluation process. The structure for the proposed Unit is shown below.
Figure 22: Proposed Structure for a Policy Planning Unit
C. Project Implementation
1002. Government is concerned with the inability of its institutions to: manage and disburse disaster recovery funds; develop projects that meet national, international or bilateral donor criteria in a timely fashion; implement a project cycle; and achieve a high rate of project completion. Cabinet, as late as mid October 2006, instructed PSC and MFEM to put in place a well-resourced institutional structure to ensure development projects were developed, implemented and completed in a timely fashion. The consensus is that a short- to medium-

206
term solution (5-6 years) is required and that this could be achieved by strengthening one section of government within a central agency; preferably within MFEM. AMD has been identified as the most appropriate section for immediate strengthening.
1003. A project development cycle built around the robust and transparent procedures developed for DPA will, (with minor additions to meet loan covenants) be used for the development and implementation of all projects.
1004. Project implementation will be managed through the appointment of capable Government organizations as Implementing Agencies . It is expected that the Implementing Agencies will need to supplement their capacity by engaging consultants to undertake project management, feasibility studies, engineering designs and cost estimates, tender document preparation, tender evaluation and construction supervision.
1005. The structure for the proposed strengthening of AMD is shown below.
Figure 23: Proposed Structure for a strengthened Aid Management Division
D. Management and Maintenance of Outer Islands Infrastructure
1006. OMIA or, more correctly, its predecessor the Ministry for Outer Islands Development (MOID), was established to facilitate the devolution process from the central government to the OIs. It was also intended to provide support and advice to the Island Councils and Island Administrations on governance, financial management and infrastructure development and operations and maintenance. IAs are unanimous in their praise of, and continued need for, the corporate assistance and support provided by OMIA. Its lack of technical skills however has resulted in OMIA no longer being directly involved in infrastructure development and O&M, other than the overhauling of electrical generators. Government should improve the utilization of its scarce technical resources by providing central support to the IAs using the existing resources in MOW and TAU on a fee-for-service basis. In keeping with its successful corporate services role, OMIA would act as the expeditor and contact between the OIs and the technical agencies. IAs will remain responsible, with OMIA assistance, for managing their own technical staff and budgets. MFEM would need to be party to advanced agreements on the expected work and the budgets required by each OI so that central agencies could plan their OI support programs. It is recommended that the overhauling of OI generation equipment be contracted to the private sector and that CIIC assist OMIA in

207
undertaking a due diligence of the assets of the workshop with a view to their lease or sale. A revised structure for OMIA, consistent with its proposed roles, is shown below.
Figure 24: Proposed OMIA Structure
1007. The principle of OIs being responsible, within the constraints of their capacities, for the planning, construction, operation and maintenance of island infrastructure is central to the institutional arrangements recommended. While utilizing the skills of centralized technical staff, OIs must at the same time build their own capacity to manage and maintain infrastructure. While up-skilling courses continue to build OI capacity they remain a short term solution and OI staff need to be provided with opportunities to access accredited training and qualifications. To enable them to operate effectively, IA and visiting skilled staff need adequate, functioning tools and facilities. Machinery, for example, needs to be protected. The Master Plan includes the provision of tools and the refurbishing of existing workshops and construction of new workshops for islands that do not have such facilities. The vision is one of incremental improvement of the OIs ability to develop and manage their planning, budgets, and projects.
E. Private Sector Participation
1008. There is a widely held belief in both government and civil society that maximizing private sector participation in the construction, operation and maintenance of infrastructure will provide increased efficiencies and improved and more sustainable levels of services. Because of its relatively small base, the private sector may not possess the full range of skills and competencies required to carry out all the works contained in the Master Plan. However, locally owned companies have the capacity to leverage the required skills and expertise through partnerships with overseas companies. There is widespread concern within the community that the sale of essential services to the private sector would lead to unacceptable monopolies and increases in pricing. There is a need for commercially attractive and consistent Government policy including longer term supply and maintenance contracts. Government agencies must refrain from providing competing services that crowd out the private sector.

208
F. Legislation and Regulations
1009. Outdated and inappropriate legislation and the inability for new legislation and regulations to be developed and approved in a timely fashion are identified by stakeholders as important cross-sector constraints. Two important issues contribute to the current difficulties.
1010. Firstly there is a critical shortage of legislative drafting skills both within Crown Law and in government. Secondly most recent drafting has been undertaken by overseas experts who are characterized, fairly or unfairly, as not being familiar with, or having sensitivity to, local ways and conditions. Many of the pieces of draft legislation are therefore viewed as being imported from other countries and lacking local input which would insufficiently adapt them to local needs. Most likely however it is the process of drafting legislation and regulations that has contributed most to the current unsatisfactory situation. Limited time and a lack of wide-ranging and timely local comment results in drafts that are usually not fully digested until after the consultant has left. TA contracts for legislative and regulatory development should take the realities of local participation into consideration and allow for sufficient time between the development of drafts and re-drafts for the inevitable lengthy response times of local institutions.
G. Land
1011. Land issues are central to all infrastructure sectors and are identified by government as potentially the most costly constraint. The Crown has the right to ‘expropriate’ land by warrant either in perpetuity or for a limited period. The use of this process is anathema to the current custodians of traditional land. The accepted process is for negotiation to be undertaken with landowners (made easier if the land is registered and the Registers are up-to-date) or with customary chiefs, leaders and the community in cases where land is not surveyed and registered. While the difficulties, costs and time associated with land acquisition and permission for usage should not be underestimated, timely identification of land requirements is an essential starting point. Careful planning, well conducted social and economic surveys and broad-based culturally sensitive consultations such as those required for ADB funded projects will contribute to successful outcomes.
H. Municipal Services
1012. The protection of water resources (a term used here to include lagoon, surface and ground water) is perhaps the most important economic and social issue facing the Cook Islands. The situation today has been likened to sitting on a time bomb, with disastrous consequences that could drive the country into economic and social regression. Yet the water, sanitation and solid waste sectors are fragmented and supply-driven and are lacking in coherent policies, strategies, legislation, regulation and monitoring.
1013. Three options have been proposed for the institutional future of municipal services. One of the options is, in the opinion of this TA, most favorable. However making firm institutional recommendations at this time is likely to be highly contentious and beyond the scope of this TA.
1014. The preferred option would see the three sectors maintaining the status quo and ceasing policy and regulatory work in the sector until such time as a NEDS is approved. Government would then, on completion of the NEDS, undertake a comprehensive sector-

209
wide review with a view to developing consolidated policy and regulations, reducing duplication, consolidating capacity and incorporating international experience.
1015. The doubtful validity of many of the indicators in some of the business plans of the three sectors and the nature of associated targets are a reflection of the ineffective management regimes, lack of clear ownership of policies and planning or regulation at the national level; and the absence of a realistic vision for the future with associated economic and social goals. It is expected that OPM will provide leadership in the development of a consolidated municipal services policy. OPM will then be able to assist in the development of business and action plans with SMART indicators, reliable baseline data and realistic targets.
1016. Until such time as Government develops its NEDS and government stakeholders take ownership and display a willingness to undertake responsibility and reduce fragmentation there is little hope of formulating, adopting and implementing a national policy for the management of water resources.
1017. Laboratory services are integral to the monitoring of water resources. Again several options have been discussed. The preferred option would see Government establish a central testing facility for all environmental testing in conjunction with, and under the management of, the existing MOH laboratory. Donor funding would be required to equip such an institution and provide the training for staff. Government would need to fund the technical staff and the ongoing O&M costs.
I. Air Transport Services
1018. Government will commission a transport policy review immediately after the development of a NEDS. OPM will assist MOT in the development of the transport policy and the monitoring of performance against a suite of valid indicators that measure the sector’s efficiency and effectiveness.
1019. There will be a staged transfer of responsibilities for OI airports to CIAA. On taking over the responsibilities of an OI airport, CIAA will enter into contractual arrangements with IAs to manage and operate the airport. CIAA will train IA staff as airport managers and safety officers. CIAA will also provide training on equipment operation and airstrip maintenance.
1020. CIAA will take over responsibilities for Penrhyn, Manihiki and Atiu airports after upgrading has taken place and they are Part 139 certified, and financial and administrative agreements have been reached with Government and IAs. MOT will undertake the training of local inspectors for Part 139 certification and will develop Operations Manuals for Part 139 airports. Other airports will be taken over only after land leasing and licensing agreements are reached with landowners and financial and administrative arrangements are reached with Government and IAs.
J. Marine Transport Services
1021. Government will commission a transport policy review. OPM will assist MOT in the development of the transport policy and in monitoring performance against a suite of valid indicators that measure the sector’s efficiency and effectiveness.
1022. PDU will be the executing agency for the upgrading and commissioning of OI harbors. As such, PDU would be responsible for the prioritization and inclusion of projects in works program and the appointment of the implementing agent for each project.

210
1023. CIIC to undertake a due diligence study of CIPA to ascertain the true value of activities and assets of the Avatiu and Aitutaki port facilities with a view to:
• contracting longshoreman and security activities to the private sector; • deliberating the case for leasing the operations and management of the ports to the
private sector. K. Roads
1024. Government will commission a review of the road sector immediately after the development of a NEDS. The review will include a cost study on all aspects of road construction and maintenance. The outputs of the review will be a national strategy for road development and maintenance and an analysis of the potential areas of increased private sector participation. OPM will assist MOW in the development of the national strategy and business and action plans with indicators, baseline data and targets that are realistic and capable of providing valid information.
1025. The strategic planning, road planning, traffic management and contract management capacity of MOW will be developed so that MOW will, in turn, assist the OIs with strategic planning and the design of proposed works.
1026. MOWs and IAs capacity to develop and manage contracts and supervise contractors will be strengthened along with operational efficiency and application of financial controls. CIIC will assist MOW and IAs to implement increased private sector participation based on the recommendations of a cost study. OMIA will continue to act as a liaison point for OIs engaging MOW and increasingly the private sector to provide assistance.
1027. The Department of Police and MOT will coordinate with the Ministry for Education and civil society organizations to mainstream road safety education and awareness at the secondary school level, provide driver training and raise public awareness.
1028. PDU and MOW will develop TORs and tender documents for the engagement of a consultant to provide MOW with a capacity for road planning and traffic management.
L. Energy
1029. Government will commission a review of the NEP immediately after the development of a NEDS. The review will include a cost recovery study that will inform tariff setting on Rarotonga and the OIs as well as the development of policies relating to OI cost subsidization
1030. The Energy Division of MOW will be allocated its own annual budget and enter into strategic partnerships with international institutions such as universities to pursue research in sustainable local alternative energy sources.
1031. A technical committee to evaluate and advise on alternative energy options and strategies and decrease the reliance on fossil fuels will be established. Representatives from relevant government agencies, the private sector, and civil society will be invited to participate on the committee.
1032. A demand management and safety awareness campaign will be undertaken in both English and Maori.
1033. PDU will develop an urgent project to contract TAU to undertake a safety audit of all OIs (other than Aitutaki) electrical generation and distribution systems and undertake works necessary to ensure that all OI generation and distribution systems meet accepted safety standards.

211
1034. Funds will be made available on an annual basis for TAU to be contracted to undertake the maintenance of standards and safety of generation and distribution of electricity in OIs on a fee-for-service basis. Staff from TAU will make at least two visits a year to each OI. TAU will, where appropriate, contract the private sector to undertake work on its behalf in the OIs.
1035. The overhauling of OI generation equipment will be contracted to the private sector and CIIC will assist OMIA in undertaking a due diligence of the assets of the workshop with a view to their lease or sale.
1036. A comprehensive program will be introduced to develop the capacity of energy staff on the OIs including: continued on-island and Rarotonga based up-skilling programs for IA staff; a long term strategy through the school star program to attract students to the sector and, in the short-term, the engagement of regional low cost electricians.
1037. OMIA‘s role in the energy sector will change to one of a liaison function between IAs, TAU and the national ED. TAU and OMIA will nominate staff and develop liaison procedures and an MOU will be signed by TAU, OMIA (on behalf of IAs) and MFEM.
M. Telecommunications and Media
1038. Telecommunications services are provided by a private company and as such no institutional analysis and recommendations will be made by this TA. It is reported that TCI’s current monopoly agreements with government are due to expire and that negotiations for extension of the arrangements are underway. Undoubtedly Government will be considering the effects to both consumers and its own budget before deciding between continuing the monopoly or opening the network to other providers.
N. Evacuation Centers
1039. The Master Plan contains several projects to build new ECs and upgrade existing ECs. There is an ad-hoc process in place, which exists between MOW and EMCI that allows MOW’s Building Inspectors inspect the EMCs on Rarotonga & IA on other islands to ensure that the EMCs are suitable for evacuations purposes). There is also provision for the allocation of responsibility or funding to annual physical audits and the ongoing maintenance of ECs. This TA will not make recommendations as to which Government institution or institutions should have responsibility for undertaking annual physical audits and maintenance of ECs. Recommendations are made however for the institution of a generic process to ensure that ECs are maintained to a satisfactory standard. The most important of these recommendations is the annual appropriation of funding to enable the undertaking of physical audits of ECs and for their repair and maintenance.

212

PART 3: CLIMATE CHANGE CONSIDERATIONS

214

215
PART 3: CLIMATE CHANGE CONSIDERATIONS
I. SUMMARY
1040. The world is warming. The effect of a warmer world on low lying island countries, such as the Cook Islands, can be significant. Climate change conditions are envisaged already as those impacts from extreme events such as tropical cyclones, intense periods of rainfall or droughts and extremely high winds, or air temperatures, that have been felt across the country over the past decade. The effect of these impacts across a widely scattered group, such as the Cook Islands, means that normal conditions of climate which comprise a southern and northern group of islands affected by trade winds, medium probability of cyclone activity in the summer season, and generally moist conditions throughout, will change by exceeding the current “normal” extreme event occurrences. These maritime influenced conditions will contribute to an increased development of extreme events both during and outside current climate seasons, such as the cyclone season, affecting already vulnerable areas and sections of society which reside on these islands.
1041. During El Niño events, the South Pacific Convergence Zone (SPCZ) drifts eastwards. Warmer than normal ocean water temperatures fuel cyclonic activity further east than usual, thus affecting the northern group of islands as an area of formation, and the southern group of islands at higher risk than usual due to the shift eastwards of cyclone tracking. A climate change scenario points toward this effect as a more common feature around the Cook Islands with at least a 20% increase in cyclonic activity both within and outside of current cyclone seasons.
1042. Climate scenarios, based upon Global Circulation Models, outline that in this region of the Pacific extreme events will increase along with significant impacts upon the people and their environment.
1043. Within the context of socioeconomic development, climate change thus has a profound impact upon current and future development initiatives. A wide range of scientific, technical, and research oriented initiatives have been undertaken over the past decade to attempt to better define what these effects could be, and to quantify the cost of the impacts.
1044. This Climate Risk Profile ‘Climate Change Consideration’ provides an initial snapshot of how current climate may change and what effect these changes may have on the Cook Islands. Economic development in the Cook Islands is at risk from both current climate conditions as well as changing climate conditions into the future. These risks can be highlighted specifically by identifying how project developments may be affected by current climate parameters, such as rainfall, temperature, high winds, cyclones, and sea-level rise, among others. In other words, how sensitive are the possible projects to a range of climate parameters, and if possible changes do occur to those parameters, what will be the impact and flow-on effect to the project and the surrounding environment.
1045. The profile scopes out the identified projects under the Infrastructure Master Plan (IMP) framework for their climate sensitivity and recommends that those projects most at risk from the identified climate parameters will need to undergo a further assessment once more project information is developed. The required assessment (Project Adaptation Brief) provides for a preliminary detailed assessment of the conditions that could affect the project into the future over and above current normal conditions. Once undertaken and completed, the Brief results in a set of terms of reference for climate experts to undertake detailed feasibility, as part of a project feasibility team on the specific project, with resultant options or solutions available for modifying the proposed project to ensure climate impacts are

216
minimized, reduced, or addressed. Figure 25 illustrates how the Climate Risk Profile will integrate with the IMP.
1046. The Terms of Reference (TOR) and the individuals selected to undertake this assessment are an integral part of the feasibility team and work closely with the key expertise available for the project design, e.g., engineers, financial managers. This resultant work “climate proofs” the project to an acceptable level of risk and least cost design and implementation. The climate proofed project thus paves the way for a least cost design and implementation procedure integrated or mainstreamed into existing planning, design and implementation processes that takes into account increased risk from climate change
Figure 25: Climate Risk Profile Integration with Infrastructure Master Plan
1047. The Cook Islands is a vulnerable country at risk from changes in social, political, economic, and environmental factors. Climate change considerations exacerbate these risks under each of these risk areas. In the context of the Infrastructure Master Plan, the climate risk profile forms the basis for determining the incremental cost of climate change, which is the difference in cost for a project without climate change considerations (sometimes called business-as-usual) and the cost for the project with climate change taken into account.
1048. The acceptance of the amount of climate risk for a specific project under the Infrastructure Master Plan will require prioritization and acceptance by both the Cook Island Government initially, the funding agency/s involved, and other stakeholders. The development of a climate policy in this regard would alleviate a number of impediments to mainstreaming ‘climate proofing’ into the government’s current planning and financial processes.
II. CLIMATE PROOFING PROJECTS UNDER THE INFRASTRUCTURE MASTER
PLAN
1049. The infrastructure master plan provides for a range of identified projects grouped according to key sectors, such as air transport, harbors, solid waste, electricity, water supply, sanitation, cyclone shelters and roads.
Climate Risk Profile, includes preliminary scoping of identified
projects from Infrastructure Master Plan (IMP)
Project Adaptation Brief, concept information, includes Terms of Reference (TOR) for feasibility/assessment
Infrastructure Master Plan (IMP) List of Projects
Project Concepts developed
TOR for feasibilities prepared, work undertaken
How a climate risk profile will integrate with the current Infrastructure Master Plan

217
1050. Many of the identified projects can be budgeted or costed according to current design and engineering practices, whereas determining the incremental cost of climate change is a more complicated process requiring input from a range of knowledge and expertise including, climate experts, planners, and engineers.
1051. A general overview of how each sector may be affected by current climate parameter is provided in Table 54. Any change which exacerbates current risks provides for increased developmental cost, and possibly increased monitoring or maintenance costs. The key is to quantify this cost.
Table 54: How each sector may be affected by current climate parameter.
Sector Key Climate Parameter Key Impacts Airports, mainly protection works Rainfall, wind speed, severe
weather, sea level rise, storm surge Flood damage, erosion, saltwater intrusion or wave surge and overtopping, wind damage
Harbors, mainly wharf area developments
Sea level rise, severe weather, storm surge
Raised sea levels, wave damage and overtopping, wind damage
Solid Waste, mainly landfills Rainfall, drought, severe weather,
wind speed Foundation damage, wind damage, erosion
Sanitation, proposed water treatment facilities
High temperature, rainfall, drought, severe weather
Reduced water quality and availability, foundation damage, wind damage
Water Supply, systems and catchments
High temperature, drought, rainfall, severe weather,
Reduced water quality and availability, wind damage, erosion
Roads, mainly on Rarotonga Rainfall, severe weather, storm
surge Erosion around culverts and bridges, flooding, wave surge
Cyclone Shelters, mainly in the Northern Group, Palmerston
Wind speed, severe weather, storm surge, sea level rise
Wave surge and overtopping, wind damage
Electricity, including power systems Wind speed, severe weather,
rainfall Wind damage, flooding, erosion and foundation damage

218
Figure 26: Topographical Map of the Cook Islands in the Pacific Ocean
Source: Cook Islands Cyclone Recovery Reconstruction Plan, July 2006
1052. Map 2 indicates the location of the Cook Islands and also outlines topographical differences amongst islands, for example the islands of the southern group are mainly high volcanic types, while the northern group islands are low lying atolls and one sand cay.

219
III. INTRODUCTION
A. Situation
1053. The Cook Islands comprises 15 small islands and atolls. The country has a total land area of 244 km² dispersed over an exclusive economic zone of 1.82 million km2 of the South Pacific Ocean. The islands are predominantly coastal entities and because of their size and isolation, and the fragile nature of island ecosystems, the biological diversity is among the most threatened in the world.
1054. The Cook Islands are divided into northern and southern groups, stretching over some 1,000 km of ocean. Islands in the southern group are generally larger and more heavily populated. The total population of the Cook Islands is 18,600 while that of the capital island (Rarotonga) is 13,200) This is the largest island, though only six km wide.
1055. The climate of the Cook Islands is considered to be of a maritime tropical nature, dominated by the easterly trade winds. There is a marked seasonality in the rainfall regime, with a dry season from May to October, which is only a third of the 2000 millimeters (mm) annual rainfall. The other two-thirds fall during the wet season (November to April). The wet season is also the tropical cyclone season, and is associated with the easterly shift of the South Pacific Convergence Zone (SPCZ) over the country.
1056. The monthly average temperatures range between 21°C and 28°C. Extreme temperatures have been recorded in the mid-thirties and mid-teens. The climate of the Cook Islands experiences large inter-annual variability, especially in relation to the El Niño/Southern Oscillation (ENSO).
1057. The occurrence of tropical cyclones tend to be more frequent during an El Niño event, when warmer than normal sea surface temperatures occur between latitudes 10 and 15 degrees South (°S) and there is an eastward migration of the SPCZ in the vicinity of the Cook Islands and French Polynesia. During an El Niño event the southern Cook Islands experience a reduction in rainfall, to as little as 60% of normal, while in the northern Cook Islands rainfall increases to as much as 300% above normal.
1058. Tropical Cyclones Martin and Pam caused extensive damage to property and infrastructure and brought human suffering, including loss of lives, during the 1997/98 ENSO. The Southern Group of islands experienced prolonged drought during the same period. In the southern Cook Islands cyclones are seldom associated with heavy rainfall.
B. Hurricane Season 2005
1059. Cyclone Meena hit the Cook Islands on 4 February 2005 leaving destruction through some of the islands in the Southern group. Nine days later high intensity winds from cyclone Nancy caused flooding to low lying coastal beaches on the main island of Rarotonga and Mangaia with moderate damage to structures on the island of Atiu. Within four days cyclone Olaf struck at category 4. Fortunately Olaf caused only moderate damage to Rarotonga, Aitutaki and Palmerston. Ten days later, cyclone Percy unleashed destructive forces at category 5 in the Northern group islands of Pukapuka, Nassau with intense destruction to infrastructure, residential dwellings and essential public utilities. Nine days after cyclone Percy, cyclone Rae concluded by causing moderate damage to coastal areas on some islands in the Northern and the Southern group.
1060. As well as being a meteorological event of some note, five cyclones in one month caused considerable cumulative damage to the environment, essential public infrastructure and private homes and businesses. Outer islands bore most long-term damage to economic structures and businesses. The community, government and international agencies worked closely under a loosely defined recovery program to provide immediate relief and the basic

220
needs of food, water, clothing and shelter, alleviating suffering associated with the cyclone damages.
1061. Unlike Cyclone Martin in 1997, when 19 people drowned in Manihiki, there were no injuries or loss of lives. Total damage costs to the business community including restorative work in the tourism sector were estimated at $10 million. Recovery program costs covering government and community assets and private residences were estimated at $10.5 million. Most of these costs were met by donor agencies, an ADB loan (CEAL Project) and the private sector. The Cook Islands Government (CIGOV) funded $480,000 in recurrent expenses and $128,000 in capital costs through budgetary allocations in the 2004 – 05 supplementary budgets. CIGOV has since requested a cooperative burden-sharing arrangement including private households, businesses, and Donor Agencies be implemented to meet future cyclone recovery expenditure.

221
IV. COOK ISLANDS VULNERABILITIES
A. Political
1062. The past two years of governance has provided political stability against which socioeconomic programs and projects have been developed. Prior to this time a succession of coalition governments and instability has resulted in uncertainty and confusion for investors and citizens alike. In June 2006, the current Government called for a snap election to be held in September the result of which has enabled the existing government under Prime Minister Jim Marurai to hold power with an additional 4 seats, with a by-election set for January 2007 although a number of results are the subject of petitions. Government stability may now ensue, providing a background of confidence for further investment in socioeconomic projects and infrastructure developments.
1063. Current assistance from development agencies such as Asian Development Bank, NZAID, and AusAid have been targeted toward priority sectors as well as the development of a National Sustainable Development Plan for the period 2006-2010. The plan provides for an “umbrella” or framework for setting out and achieving nine sustainable development goals.
B. Socio - Economic
1064. The Cook Islands economy is fragile and vulnerable to various calamities but was able to achieve its sixth successive year of growth in 2004. Gross Domestic Product (GDP) grew by 4.3% over financial year 2004 but only 0.7% in 2005 having suffered damage to the primary contributor, tourism; including restaurants and accommodation (39.9%) and retail, wholesale and financial services. Agriculture and Fisheries dropped from 16% in 2004 to 13% in 2005, transportation and communication also dropped from 15% to 13.5% while public administration remained at 12.6%. This mostly reflects the impact of the cyclones in reducing economic activity in the March quarter 2005, with some economic recovery afterwards.
1065. Since 1971, the tourism industry has grown dramatically from a few dozen visitors a year to figures in excess of 75,000 since 2000, following the expansion of air links and extensive marketing by Cook Islands Tourism. A huge economic benefit has accrued from development of tourism infrastructure on Rarotonga and Aitutaki and to a lesser extent on other islands in the Southern group.
1066. Recent development in the marine resources sector also contributes to the economy with the increase of fishing boats operating in the country. About 800 tons of tuna worth NZ$5.2 million and fishing treaty rights of NZ$2.4 million per annum are generated from this sector. Cook Islands black pearls are also seen as the country’s leading export, with international markets led by Japan buying 50%; the remainder being sold in Australia, Europe, Hawaii and domestic markets. Agriculture contributes 13.5% to the country’s GDP with subsistence farming increasingly replaced by cash cropping for the dominant tourism sector. Some pawpaw is still exported to New Zealand while minor amounts of maire, a fragrant leaf used in ceremonial garlands, are exported to Hawaii.
C. Population
1067. The indigenous population of the Cook Islands is Maori, closely related to the indigenous population of Tahiti Maohi and New Zealand Maori. In 1990 the population of the Cook Islands was recorded at 18,617 falling to 15,000 in 2000 and falling further in 2005 to 11,800. This steady decline in population since 1990 is a result of heavy migration following economic reform programs of 1995–96. See Figure 27. Cook Islanders are born New Zealand citizens and most choose to live overseas. This is despite the Cook Islands remaining high above most other independent nations in the Pacific region in terms of social indicators such as literacy rates, school enrolments ratio, life expectancy, infant mortality and

222
with good access to safe water and sanitation. Access to social services and secondary level education does vary between the main island of Rarotonga and the outer islands.
Figure 27: Cook Islands Population
Source: ADB CLIMAP TA, 2004
D. Health
1068. There is little or no poverty in the Cook Islands, although overall human health varies with location in the islands. The incidence of vector borne diseases continues to increase, whereas overall human health risks decrease. The Government continues to support health issues actively, but faces increasing constraints, such as lack of financial resources to undertake health research as well as a critical lack of human capacity. Current public health initiatives require continued public support in order to enable the Health Ministry to undertake its work effectively. Longer term public health education that include climate impacts and address the associated health risks also require addressing and further role clarification of the implementing agencies.
E. Environment
1069. The physical geography of the Cook Islands is one of stark contrast where the country is divided amongst two groups of island types, the northern group of islands composed of atolls and one sand cay, and the southern group of islands composed of hilly volcanic islands. Each has its own specific set of environment risks, such as in the northern islands, with low fertility, porous soil, low lying, and scant terrestrial resources, and the southern islands with richer soils, arable land, but with higher population pressures, increasing tourism development, and associated environment problems.
1070. Pressure on the natural environment of the Cook Islands is reaching levels that are likely to adversely impact economic growth. The environment is relatively fragile and is being severely tested by coastal erosion, the impact of development growth, and susceptibility to climate change. Conservation of the natural environment is essential for the sustained development of tourism, and is important for the protection of its marine and other natural resources. The National Environment Service now has a national legal framework and the ability to implement routine environmental impact assessment procedures (on Rarotonga, Aitutaki, and Atiu ), continues to promote public awareness on environmental issues along with other key actors such as, government ministries and departments, e.g., agriculture, works, marine resources, and non-governmental organizations, such as the Cook Islands Chamber of Commerce, Taporoporo Ipukarea Society (Environment NGO), CI Association of NGOs (CIANGO), and the Rarotonga Environmental Awareness Program (REAP).

223
1071. Traditional resource utilization practices and community management regimes are eroding. This has a direct negative impact on the health of the nation’s environment. The deterioration has been exacerbated in more recent times due to the changes from subsistence to a commercial economy (including increased tourism), increasing urbanization and population drift to the main island and overseas, and the focus by outer island authorities on economic development that may not factor in natural resource sustainability.
1072. The November 2003 enactment of the National Environment Act places increased burden upon the National Environment Service as scope of the Act increases to other islands outside of Rarotonga, and as provision of sections of the Act apply, such as Environmental Impact Assessment. ADB and the Cook Island Government have prepared Technical Assistance on Legal and Institutional Strengthening for Environmental Management44 which will support the Environment Service’s capability to undertake its work under the new Act. Additionally, the TA will formulate regulations that enable implementation of a range of provisions under the Act. With regard to climate change, the Cook Islands were selected as one of the two Pacific developing member countries for the implementation of country-level activities under a regional TA.45 One of the case studies identified by the climate project is the “climate-proofing” of regulations under the new Environment Act. Close harmonization will take place between both sets of ADB funded activities.
V. CLIMATE RELATED DISASTERS AND EXTREME EVENTS – AN OVERVIEW
1073. The likelihood (i.e. probability) components of climate-related risks in the Cook Islands can be evaluated for both present day and future conditions. Changes in the future reflect the influence of global warming. The risk events for which current and future likelihoods are evaluated are extreme rainfall events (both hourly and daily), drought, high sea levels, strong winds and extreme high air temperatures. Tropical cyclone frequencies over the past century are also examined. Some climate-related human health and infrastructure risks are also investigated.
1074. Projections of future climate-related risk are based on the output of global climate models, for given emission scenarios and model sensitivity. All the assessed components of climate-related risk show marked increases as a result of global warming.
1075. Formally, risk is the combination of the consequence of an event and the likelihood (i.e. probability) of that event. While the consequence component of a climate-related risk will be site or sector specific, in general the likelihood component of a climate-related risk will be applicable over a larger geographical area, as well as to many sectors. This is due to the spatial scale and pervasive nature of weather and climate. Thus the likelihood of, say, an extreme event or climate anomaly, is often evaluated for a country, state, small island or similar geographical unit. While the likelihood may well vary within a given unit, there is often insufficient information to assess this spatial variability, or the variations are judged to be of low practical significance.
1076. The following climate conditions are considered to be potential sources of risk:
• extreme rainfall events; • drought; • high sea levels and extreme wave heights; • strong winds; and • extreme high air temperatures.
44 ADB TA 4273-COO: Technical Assistance to the Cook Islands for Legal and Institutional Strengthening of
Environmental Management. 2003 45 ADB. TA 6064-REG. Technical Assistance for a Climate Change Adaptation Program for the Pacific. Manila,
Philippines. 2004

224
1077. Table 55 presents the return periods of specified extreme events, for Rarotonga. The information is also presented in terms of the likelihood that the specified event will occur within a time horizon of one year.
Table 55: Rarotonga Specific Extreme Events
Source: ADAB CLIMAP TA 2004
1078. While all the chosen events are relatively rare at the present time, global warming will cause marked increases in the frequency of all these extreme events. An important point to consider is whether these likelihoods (i.e. probabilities) have changed during the recent past. Any such changes might signal the impact global warming has had on climate-related risks, though direct attribution of any changes to global warming would require detailed investigations.
1079. An obvious question arises - are the past changes in the probability component consistent with the changes projected to occur in the future as a result of global warming? The trend of increasing likelihood that was apparent in the historic data for much of last century is projected to continue, in a consistent manner, through the present century.
A. Cyclones Impacts 2005
1080. For the first time in the recorded history of Cook Islands, five damaging cyclones in one month were recorded with wind speeds exceeding 200 – 280kph, see Table 56 below. In severity, four out of the five cyclones reached a maximum rating of category 5. Three of the four cyclones formed from the north west of the Cook Islands close to Samoa and the last two developed beyond Samoa, near Tuvalu, where sea temperatures recorded a high of 32°C.
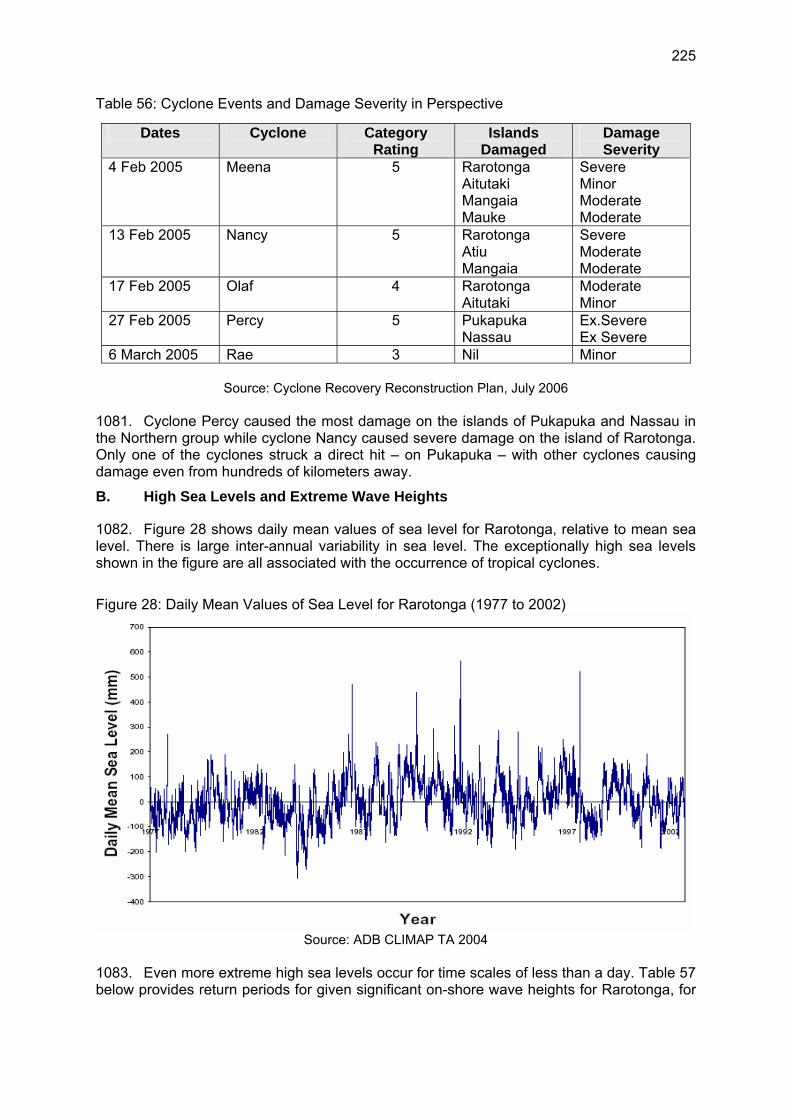
225
Table 56: Cyclone Events and Damage Severity in Perspective
Source: Cyclone Recovery Reconstruction Plan, July 2006
1081. Cyclone Percy caused the most damage on the islands of Pukapuka and Nassau in the Northern group while cyclone Nancy caused severe damage on the island of Rarotonga. Only one of the cyclones struck a direct hit – on Pukapuka – with other cyclones causing damage even from hundreds of kilometers away.
B. High Sea Levels and Extreme Wave Heights
1082. Figure 28 shows daily mean values of sea level for Rarotonga, relative to mean sea level. There is large inter-annual variability in sea level. The exceptionally high sea levels shown in the figure are all associated with the occurrence of tropical cyclones.
Figure 28: Daily Mean Values of Sea Level for Rarotonga (1977 to 2002)
Source: ADB CLIMAP TA 2004
1083. Even more extreme high sea levels occur for time scales of less than a day. Table 57 below provides return periods for given significant on-shore wave heights for Rarotonga, for
Dates Cyclone Category Rating
Islands Damaged
Damage Severity
4 Feb 2005 Meena 5 Rarotonga Aitutaki Mangaia Mauke
Severe Minor Moderate Moderate
13 Feb 2005 Nancy 5 Rarotonga Atiu Mangaia
Severe Moderate Moderate
17 Feb 2005 Olaf 4 Rarotonga Aitutaki
Moderate Minor
27 Feb 2005 Percy 5 Pukapuka Nassau
Ex.Severe Ex Severe
6 March 2005 Rae 3 Nil Minor

226
both the present day and into the future. The latter projections are based on the Canadian Global Climate Model (GCM) 1 GS and the A1B emission scenario.
Table 57: Rarotonga – Sea Level Increases Table
Source: ADB CLIMAP TA 2004
1084. The indicated increases in sea level over the next century are driven by global and regional changes in mean sea level as a consequence of global warming.
1085. A possible consequence of the increased persistence of El Niño conditions in recent decades is the apparent intensification of tropical cyclones. Table 58 below shows a systematic increase in upper ten percentile heights of open water waves associated with tropical cyclones occurring in the vicinity of Rarotonga.
Table 58: Rarotonga - Open Water Wave Height Table
Source: ADB CLIMAP TA 2004
C. Rainfall
1086. The long rainfall record for Rarotonga provides an opportunity to investigate changes in likelihoods over time. Table 59 shows that, between the periods 1929 to 1959 and 1970 to 2003, there was a substantial increase in the likelihood of a daily rainfall of 250 mm or more. This finding is not surprising given that, of the six days since 1929 that had precipitation amounts over 200 mm, all but one was post 1966.
Table 59: Rainfall Return Period Table
Source: ADB CLIMAP TA 2004

227
1087. While the frequency of heavy rainfall events in Rarotonga is clearly increasing, so too is the frequency of low monthly rainfall totals. Figure 29 shows the number of months in each year when the precipitation was below the tenth percentile. It is clear that in the latter part of the last century Rarotonga experienced unprecedented low rainfall conditions. In 1998 alone there were four consecutive months with rainfall below the tenth percentile. In that same year six months had rainfall below the tenth percentile, with three below the fifth percentile. All the low rainfall years, namely 1982/83, 1992/93 and 1997/98, coincided with El Niño events.
D. Droughts
1088. Figure 29 below presents, for Rarotonga, the number of months in each year (1929 to 2003) and each decade for which the observed precipitation was below the tenth percentile. A monthly rainfall below the five percentile is used here as an indicator of drought.
Figure 29: Rarotonga- Number of Low Rainfall Months
Source: ADB CLIMAP TA 2004
1089. Most of the low rainfall months are concentrated in the latter part of the period of observation, indicating that the frequency of drought has increased since the 1930s. The years with a high number of months below the five percentile coincide with El Niño events.
E. Strong Winds
1090. Figure 30 shows the annual maximum wind gust recorded in Rarotonga for the period from 1972 to 1999.

228
Figure 30: Rarotonga - Annual Maximum Wind Gust Records
Source: ADB CLIMAP TA 2004
1091. Table 60 presents the return periods based on an analysis of the observed maximum hourly wind gust data and the adjusted GCM wind speed data.
Table 60: Wind Speed Return Periods Data
Source: ADB CLIMAP TA 2004
1092. The return period estimates of Kirk are for open water conditions. There is strong agreement between these and the return periods based on observed data, suggesting that the Rarotonga anemometer provides extreme gust estimates that are reasonably representative of open water conditions.
1093. Comparison of the return period estimates for the 1961 to 1990 GCM data with the observed data also reveals good agreement, though the GCM data tend to show slightly shorter return periods for lower extreme wind speeds and slightly longer return periods for higher extreme wind speeds.
1094. Arguably the most important finding arising from this analysis is the suggestion that over the coming 50 years or so the return periods for the most extreme wind speeds will reduce significantly, approximately halving by 2050.
F. Extreme High Temperatures
1095. Figure 31 presents the frequency distribution of daily maximum temperature for Rarotonga.
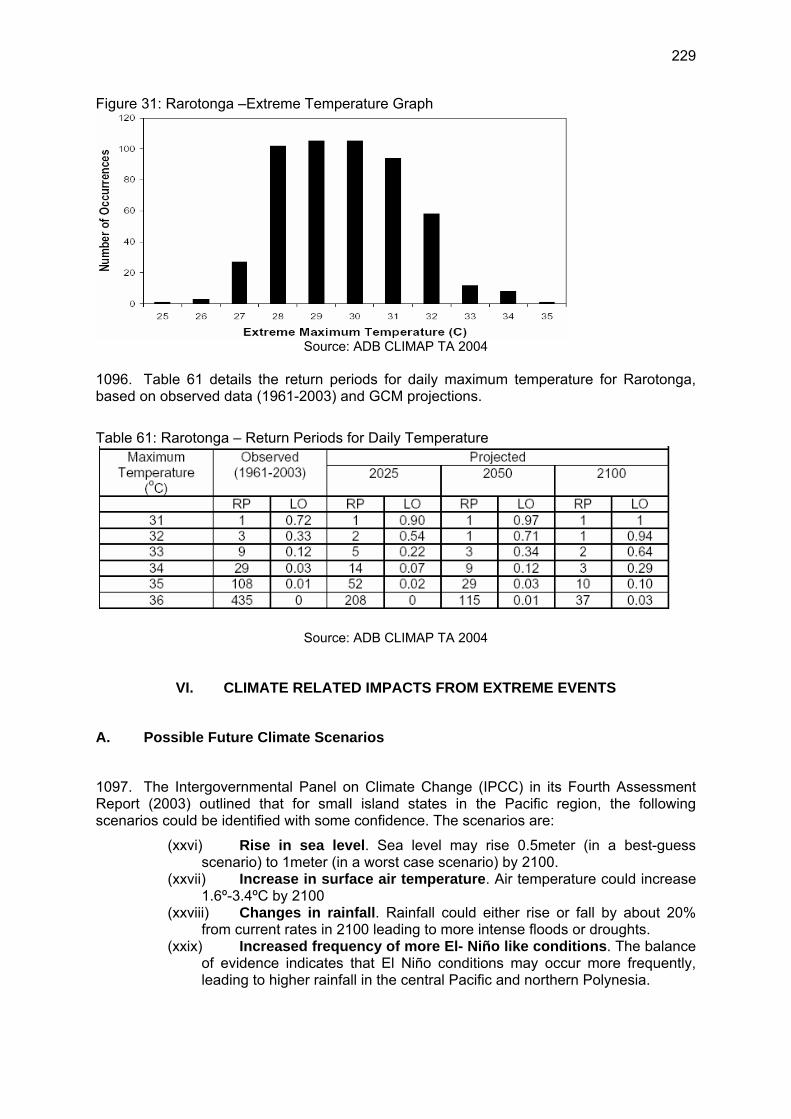
229
Figure 31: Rarotonga –Extreme Temperature Graph
Source: ADB CLIMAP TA 2004
1096. Table 61 details the return periods for daily maximum temperature for Rarotonga, based on observed data (1961-2003) and GCM projections.
Table 61: Rarotonga – Return Periods for Daily Temperature
Source: ADB CLIMAP TA 2004
VI. CLIMATE RELATED IMPACTS FROM EXTREME EVENTS
A. Possible Future Climate Scenarios
1097. The Intergovernmental Panel on Climate Change (IPCC) in its Fourth Assessment Report (2003) outlined that for small island states in the Pacific region, the following scenarios could be identified with some confidence. The scenarios are:
(xxvi) Rise in sea level. Sea level may rise 0.5meter (in a best-guess scenario) to 1meter (in a worst case scenario) by 2100.
(xxvii) Increase in surface air temperature. Air temperature could increase 1.6º-3.4ºC by 2100
(xxviii) Changes in rainfall. Rainfall could either rise or fall by about 20% from current rates in 2100 leading to more intense floods or droughts.
(xxix) Increased frequency of more El- Niño like conditions. The balance of evidence indicates that El Niño conditions may occur more frequently, leading to higher rainfall in the central Pacific and northern Polynesia.

230
(xxx) Increased intensity of cyclones. Cyclones may become more intense in the future, with wind speeds increasing by as much as 20%; it is unknown whether cyclones will become more frequent.
1098. In the Cook Islands, there is an increasing awareness across both the public and private sectors of the implications and potential damages from the impacts of climate change and climate variability. These are often highlighted by the occurrence and extent of weather extremes such as in 1991 when long periods of drought, brought on by El Niño, caused widespread water shortages on Rarotonga and other southern group islands, the frequent cyclones which occur normally during the summer period (Nov-March) but recently have occurred out of season, as well as in the northern group where cyclone formation takes place but often does not develop and damage the atolls.
B. Impacts from Climate Change on Key Sectors
1099. Water Resources. Cook Islands natural water resources stem primarily from precipitation, and any alterations in the patterns or frequency of rainfall will therefore impact on the water availability. Temperature variations can result in changes in plant water use (expressed as evapo-transpiration), soil moisture, and infiltration rates46. Sea-level variations can contribute to varying salt-water intrusion in the groundwater. Cyclone induced debris, storm surge, and salt spray, can overtop, contaminate, and degrade the aquifers, wells, and storage facilities. After heavy rainfall water becomes silty or cloudy, for the first few days after the event, requires boiling prior to domestic use. Drought is a major concern to the people inhabiting atolls such as Aitutaki with impacts on the drinking water supply in particular. The susceptibility of this sector to water shortages due to drought conditions is further compounded by poor rainwater catchment and water resource management.
1100. The implications of increased ENSO episodes or intensity for water resources are both positive and negative. Positive, in that more precipitation may be available for catchment during La Niña, and negative, as more severe droughts, similar to the 1983/84 drought, can be expected. For water resources the impacts of cyclones are negative. Although heavy precipitation may fall, usually damage associated with cyclones on water related infrastructure means that this precipitation is not viable for catchment. Furthermore, erosion in the hillside catchment areas is increased; resulting in the transport of high sediment loads and potential pollutants into the catchments, aquifers, and lagoons rendering them temporarily unusable.
1101. Human Health. The few climate and health studies undertaken in the Cook Islands, particularly for Rarotonga, Aitutaki, Mangaia, and Tongareva, outline common climate related health impacts, such as direct non-communicable diseases respiratory tract infections, but increasingly are identified as vector borne diseases such as dengue fever, and diarrhea. Recently the incidence of these types of case has reduced due to heightened awareness in the community on reducing dengue outbreaks and mosquito control, as well as through community health programs. Water borne disease has been examined as part of previous climate assessments. These assessments concluded that an increase in incidence across a wider spectrum of society occurred with an onset of higher temperature and precipitation. The occurrence of toxic algae blooms, such as ciguatera, would increase, affecting local consumption of reef fish.
1102. There is growing concern about the adverse effects of climate change on human health in remote islands such as Palmerston, Pukapuka, Nassau, and Rakahanga, due to potential changes in disease vectors such as mosquitoes, water-quality, and the ability to respond to climate related ills such as heat stress, seasonal influenza and respiratory
46 IPCC 1996

231
infections. Local doctors are also aware that climate changes could also present an environment for some of these tropical diseases to re-emerge. The El Niño phenomenon has raised awareness in the Cook Islands community of the potential effect of extreme weather variability on health and diseases transmissions. El Niño has been linked to cyclic outbreaks of cholera and other emerging infectious diseases as well as vector-borne diseases . Controlling infections could also become difficult due to increasing antibiotic, drug, and insecticide resistance that decreases effectiveness of control methods.
1103. Fisheries. The Cook Islanders’ dependency upon their fisheries resource is high, and any climate variations which may affect the fishery will cause concern. With a rich fishery resource, particularly in the northern group of islands, climate extremes have affected distribution, catch rates, and lagoon spawning. Though little has been documented from the local perspective, anticipated changes in sea surface temperatures would lead to global changes in wind and ocean circulation patterns. The distribution and availability of nutrients for local migratory and non-migratory fish stocks are dependent on these patterns which have been recognized and used by local fishermen. For example, the fishermen knew when pelagic fish such as tuna and wahoo migrated past the island of Aitutaki, based on the time of the year and the temperature of the water. However this traditional knowledge is becoming less valid as the oceanic climate shifts. In addition, phytoplankton (sea plant) production could also be affected by sea surface temperatures and result in disruption of the deep-sea fish food chain. Warming seas would result in coral bleaching as seen in past El Niño events. Such stressed reef habitats provide opportunities for harmful ciguatera dinoflagellate algae to colonize the coral surfaces making the reef fish that feed on it poisonous for human consumption.
1104. The Cook Island’s lagoons have already experienced sedimentation accumulation from past agriculture run off which threatens native clams and corals. Salinity within the lagoon affects life in the ecosystem, so if precipitation patterns fluctuate then the lagoon could in turn be too salty or too brackish for the animals that are living in it. With climate change, it is likely that the above impacts would be compounded through an increased frequency of storm surges onto reefs and overtopping roads and low lying land areas. In turn coastal erosion would increase particularly in built up areas around Rarotonga and Aitutaki.
1105. Tourism. Tourism still continues to be the major economic driving force in the Cook Islands, and being based upon its physical assets, is at risk from climatic fluctuations in the short term and from climate change over longer timeframes. Climate related impacts upon tourism services, such as water, energy, the marine environment, as well as Cook Island culture, has not been previously quantified. The Cook Island Tourism Master Plan acknowledged the need to integrate environment with tourism development and laid out a framework for tourism development in the Cook Islands in this regard. However, a change in weather and climate conditions would negatively impact upon the development framework without careful consideration. Current tourism development on both main islands, Rarotonga, and Aitutaki, have been focused upon infrastructure and services in coastal margins, this would be significantly impacted by increased storm surge and cyclonic events, resulting in loss in investor confidence and insurance coverage.
1106. More recently the Cook Island Government and the private sector, including representation from the CI Chamber of Commerce, have moved toward outer island tourism development promotion along with associated infrastructure services. A number of southern group islands, such as Atiu, Mauke, and Mitiaro, already cater for an increasing tourism industry and have suitable accommodation facilities available. In the northern group currently only Manihiki and Tongareva have tourism capacity although on atolls such as these, pressure for scant water resources, and energy needs are only just being met. Changes in climate would severely affect the industry development in the context of whole of island capability to meet such changes. There is a clear need for both island and country authorities and private sector, among others, to take a planned and integrative approach to responding to climate change in the context of continued socioeconomic growth.

232
1107. Agriculture. Cook Islands agriculture has gone through a number of changes in recent years, following primarily market based prices in their export markets, such as Australia and New Zealand. Recent market opportunities in SE Asia, including Japan and China, the United States, and Europe, have highlighted additional opportunity to the agricultural sector. Reliance on water resources and current favorable conditions can only be increased with changes to climatic conditions. While Rarotonga’s previous strong agricultural sector continues to decline in the face of increased tourism and residential development, a shift toward focused agricultural development on the southern group of islands outside of Aitutaki and Rarotonga, has taken place. Climate related impacts on water, roads for access and markets, and on crop suitability, have been studied through the Ministry of Agriculture in conjunction with a climate vulnerability assessment (1998, 2000). The study details the need to determine carefully the full impact and cost of such events, and not be seen as determining costs of damages in a rehabilitation context, after, for example a cyclone or flood, but rather a planned preventative and response approach to climate change.
VII. GENERAL COUNTRY VULNERABILITY ANALYSIS
1108. The Cook Islands is a small and relatively isolated group of islands which sources its main export revenues from tourism, black pearl exports, fisheries and agriculture. While its environment is often considered untouched in relative terms, it is under increasing pressure from economic development and subsistence pressures. While a declining population would indicate a lessening of pressure on the environment, the reverse is still apparent. Recent recorded extreme events have outlined the significant impacts to environment and social services, and caused high financial costs, which have been diverted away from sector priority use. In addition, increasing out of season or irregular occurrences of extreme events causes great concern to the population, and advocates an improved and strengthened approach to climate risk planning as part of national and sector development.
1109. The Cooks Islands resilience to current extremes and longer-term change is declining through continued erosion of human capacity. The country’s vulnerabilities are cumulative due to current reaction-driven decision making. The capability to plan and respond to increasing extreme events is constrained by geographic location. Causal factors are the spatial separation of the islands, a lack of skills available nationally and on each island, a tendency for migration away from small remote communities to Rarotonga and beyond, and a lack of financial resources to encourage a progressive build up of an enabling environment on each island. A qualitative analysis of general country vulnerability is found in Table 62.

233
Table 62: Country Vulnerability Analysis
Parameters Favourable developments Unfavourable developments Remarks
Actively contested national, and island elections. Recent election provides ongoing country stability
Political instability created through frequent changes of government may have impact upon development policies
1. Political (Governance, MDG)
Progress towards achieving their MDG goals.
Decision making uncertainties still persist between the capital and outer islands
While overall political stability remains, internal party/political changes create an uncertain climate to economic/social planning and policy implementation
Public sector reform program was implemented through the ADB and others
Government expenditures still high
Priority to outer island development continues
Ongoing reliance on external assistance.
2. Economic (GDP, Growth indicators)
Tourism and fisheries increasingly important earners
Remoteness from international trade markets
Fragile and vulnerable economy.
Limited human resources. 3. Social (HDI, Health Indicators, Poverty Indicators, Population density)
Poverty decreasing
Increasing inequalities between main island and other outer islands
High social vulnerability related to key factors, such as isolation, lack of skilled human resources, health and social services availability, and impacts on

234
Severe lack of skilled labour for service industries
Inequalities being addressed by development partners and Govt
Population decline still occurring
natural environment.
Subsistence dependence on natural resources still high.
Traditional resource management awareness and implementation slowly increasing
Traditional resource utilization practices and community management regimes are eroding
Still requires detailed regulations and associated HRD for implementation, across relevant Ministry or Island
4. Environmental (Biodiversity indices, Land use Change, Policy Framework, Natural Hazards)
Environment Bill enacted 2003 for the Cook Islands, at present only applicable to four islands
Increased occurrence of extreme events High climate risk, from storm surges, cyclones, flooding, and droughts has historically affected population and socioeconomic development
Heavy reliance on natural resource use
Responsibilities for Environment should be shared among all stakeholders under the Act. Increased climate risks will exacerbate current vulnerabilities

235
A. Risks from Climate Change Exacerbate Country Vulnerability
1110. Risk is generally defined as “the probability of an event” multiplied with “the consequences of an event”. Risk can increase both from the increase in the likelihood of the event and from the increase in its magnitude. Climate change is usually both to increase the likelihood of an event (such as a drought) and the magnitude (such as the length of the drought).
B. Climate Proofing Projects, Plans And Programs
1111. Climate proofing projects, plans and programs will increase the Cook Islands’ resilience to current extremes and longer-term change and decrease vulnerability to increasing extreme events.
1112. Projects implement solutions for problems and issues that have been recognized as having priority. Usually the project implementation makes assumption on future developments to cope not only with the existing problem, but also with a potential future aggravation of that problem. When climate change is taken into account, it is called “climate-proofing”. Climate-proofing normally comes with additional costs, which have to be justified. The justification can come from an evaluation that shows that the (damage) cost of the future climate changes are larger than the current additional cost of the climate proofing.
C. Cost Benefit Analysis
1113. The assessment of the costs and benefits of climate proofing is outlined by the following steps. It takes two situations, the original solution and one that is climate proofed and evaluates these for two scenarios, without and with climate change, see Table 63. The process can be summarized as:
(xxxi) Determine the benefits from implementing the solution, assuming no climate change is taking place (the NN-case).
(xxxii) Do the same for when the solution is climate proofed, while assuming that no climate change is taking place. Also track the cost of the climate proofing itself (the PN-case).
(xxxiii) Do the same without the climate proofing implemented, but assuming climate change is taking place, possibly aggravating the problem and thus reducing the effectiveness of the solution and thus its benefits (this is the NC-case).
(xxxiv) Finally determine the costs for the case were both the climate proofed solution is implemented and were climate change takes place (the PC-case).
Table 63: Assessing costs and benefits of climate proofing
no climate change climate change Standard solution (+costs) NN NC Climate proofing (+costs) PN PC
Source: IGCI 2006 1114. In many cases the benefits from a solution are costs prevented, such as damage-costs from flooding that no longer occur due to protective measures.

236
1115. From the information that is generated, the following results can be determined:
• The incremental costs, i.e. the additional cost of implementing the climate proofing (i.e. the difference in costs of the solutions without and with climate proofing).
• The incremental benefits for the scenarios without and with climate change, i.e. the additional benefits resulting from the climate proofing.
VIII. EXAMPLES OF CLIMATE PROOFING
1116. To climate proof a given project, additional data and analysis is necessary: historical climate data (to identify the current climate risks), climate change information (from the models), as well as information on the standard solution and the climate proofed solution. Often at an early stage of the project development, this information is not yet available. To illustrate the process of climate proofing and to show the analysis that is necessary, two examples were selected. The first deals with the breakwater design for the Avatiu Harbor, Rarotonga. Climate change is affecting both sea level and storm-frequency and intensity. The second example related to the climate proofing of rainwater harvesting systems in the northern Cook Islands. Climate change is affecting the rainfall frequency and intensity. The analysis draws on the results of other studies.
A. Example 1: Design of the Breakwater for the Western Basin, Avatiu Harbor, Rarotonga
1117. The domestic tuna industry is becoming a key export earner for the Cook Islands. The number of commercial fishing vessels has increased from three in 2001 to seventeen in 2002 and forty-four in 2003. This and future expansion of the long line fishing industry is constrained by a lack of appropriate infrastructure, and in particular by lack of berth space and other facilities within Avatiu Harbor. The Cook Islands Ports Authority is in the process of developing the Western Basin to accommodate extra vessels, provide sufficient wharf space to minimize delays in offloading fresh fish and to allow the fishing vessels to use the harbor in most sea conditions other than those associated with cyclones.
1118. The Western Basin is adjacent to, and directly west of the existing Avatiu Harbor, on an existing area of reclamation on the reef flat, approximately 100 m wide, see Figure 32. In the 1980s construction of a western breakwater was undertaken, but had not been completed by 1987, when Cyclone Sally occurred. The incomplete breakwater was damaged, in part due to the absence of a planned lining of armored basalt boulders. The internal components of the breakwater were stripped and spread over the reef flat.

237
Figure 32: Western Basin of Avatiu Harbor
Source: ADB CLIMAP TA 2004 1119. The three major components of the current development are excavation of the harbor basin in the tidal reef flat, reconstruction of the western breakwater and development of facilities including wharves, quays and ancillary services. The harbor basin is being formed by blasting and excavating the reef down to a nominal 4 m below mean sea level, and by reconstructing a breakwater approximately 350 m long and 20 m back from and parallel to the reef edge. The Basin is intended to be usable by fishing boats and yachts in all south-easterly trade winds and swell conditions. The Basin is not designed to be operable during cyclone conditions. All small vessels will be hauled ashore and moved inland, and all larger vessels will put to sea.
1120. The design brief for the Western Basin states that the breakwater and quay walls should be designed for a nominal design life of 60 years. Fixtures should be robust enough to withstand a cyclone with a ten year return period, though the brief acknowledges that any fixture which suffers a direct hit by a boulder or coral head is likely to be damaged. When cyclones Val and Sally impacted Rarotonga, seven tonne rocks were picked up by storm waves and became projectiles, causing damage inland. The brief acknowledges that severe damage will be sustained by fixtures in a cyclone with a 50-year recurrence interval. It states that the main quay should be designed to withstand the wave forces associated with a cyclone with a 50-year return period, with only minimal damage. Cyclone wave heights should be based on a 50-year return period, a calculated significant wave height of 10.75 m (ten percentile wave heights of 13.65 m).

238
1121. A solid breakwater such as a rock revetment is considered unsuitable for the Western Basin breakwater because of the likely disruption to long-shore movement, meaning that during a sea surge the previous wave cannot escape, causing an additional set-up to the level of the top of the breakwater, potentially causing serious damage. To ensure this additional set up does not occur; the breakwater must be sufficiently permeable to allow the previous wave to flow away, restoring the water level. More suitable alternatives include a monolithic breakwater with a degree of permeability that allows secondary routes for seawater to escape from the harbor or concrete armor units such as COPEDs or tetrapods.
1122. The Western Basin is being developed in stages, based on demand and commensurate with development of the fishing industry and availability of funding. The first stage, involving an expenditure of $NZ 1 million sourced through a government grant, an overseas aid grant, cash reserves and a loan, was for a wharf facility but with no added protection against storms, over what is provided by an existing breakwater. But this level of protection is considered to be considerably more than that currently provided to boats moored in the Avatiu Harbor.
1123. The design and construction of a permanent breakwater system for the Western Basin follows these steps (see also Figure 33):
• determine design water level and waves (wave height, period, and incident direction), taking into account climate change scenarios, including sea-level rise and the implications for extreme events, including likely changes in their frequency and magnitude;
• calculate wave transformation from offshore (deep water) to the breakwater and harbor;
• determine conditions for wave run-up on the breakwater side and wave over-topping;
• identify design options that will reduce risks (including those to breakwater, vessels and port infrastructure) to acceptable levels, including:
• height and cross section of breakwater; • configurations and weight of amour blocks that will be resistant to wave
forces; and • calculate the costs and benefits for each design option, including incremental
costs and benefits associated with taking into account the climate change scenarios.

239
Figure 33: Risk Characterization of Western Basin Breakwater Risk Characterization and Management Procedures for the Western Basin
Breakwater Study.
Risk Scoping Risk Characterizationand Evaluation ReviewRisk Management
Targets• No significant adverse effectsfrom climate variability and change
Risk Events• Storm surges• High tides• Sea-level rise
Stressors• High sea level• Waves
Receptors• Breakwater• Vessels• Port infrastructure
Damage Functions
Risk Event Scenarios• Sea-level rise• Storm surges• Wind induced waves
Likelihoods of Risk Events• Storm surges• High tides• Strong winds• Sea-level rise
Communication and Consultation
Consequences of Risk Events• Quantify individual and annualized
costs of risk events• economic• social• environmental
• Risk profile
Identify and CostManagement Options
Yes
Existing ManagementPractices Adequate?
Yes
No
No
Redistribute Risk• Insurance• Disaster relief
Reduce Likelihood
Avoid the Risk
Reduce Consequence• Modify breakwater design
Risk Acceptable?
Implement,Monitor &
ReviewCost EffectiveManagement
Strategy
Source: ADB CLIMAP TA 2004 1124. Figure 34 illustrates the linkages between climate change, tropical cyclones, coastal impacts and decision information for risk designs. The white sections refer to the cyclone-generated sea conditions; the blue sections to the components of elevated sea level and run-up that impact coastal areas; the yellow sections to the key parameters of climate change that affect those relationships; and the red sections to the major inputs to risk design for adaptation.

240
Figure 34: Linkages between Climate Change, Tropical Cyclones, Coastal Impacts and Adaption Measures The Linkages Between Climate Change, Tropical Cyclones, Coastal Impacts
and Adaptation Measures. The Main Components are Cyclone-Generated Sea Conditions (White), Elevated Sea Levels and Run-Up that Impact Coastal
Areas (Blue), the Key Parameters of Climate Change that affect those Relationships (Yellow) and the Major Inputs to Risk Design for Adaptation
(Red)
Significant Wave Height
Max. Wind
Atmospheric Pressure
Wind set-up
+
Run-up elevation
+Wave set-up
+Wave run-up
Adaptation measures
Wave energy+
Return Period
Climate Change
Design Risk
Barometric set-up
Mean sea-level +
50-year 10.75m
(current choice)
Tropical cyclone intensity
MSL change 8 to 88 cm
0 to 20%
Source: ADB CLIMAP TA 2004
1125. For the Western Basin breakwater the challenge is to provide assessments of possible future changes in: 1) cyclone intensity, as translated to changes in significant wave height, (HS); and 2) mean sea level, as a component of change in total water elevations during cyclones. As suggested by the above figure, these changes will provide input for “climate proofing” the design of the breakwater. The resulting calculations made use of the substantial resource provided by past engineering reports related to coastal protection in the study area.
1. Changes in Significant Wave Height
1126. The relationship between maximum wind speed and significant wave height for a given return period is determined using past studies of tropical cyclone risks for the study area. The results are shown in Table 64.

241
Table 64: Avatiu Harbor – Relationship between Wind Speed and Significant Wave Height Relationship Between Wind Speed and Significant Wave Height for Given Return Periods for the Avatiu Harbour Area
11.9847.8100
10.7544.950
9.4041.925
8.1038.813
7.3737.510
5.5433.95
2.3428.52
Wave Height, Hs (m)
Wind speed (ms-1)
Cyclone parameters* Return Period(years)
11.9847.8100
10.7544.950
9.4041.925
8.1038.813
7.3737.510
5.5433.95
2.3428.52
Wave Height, Hs (m)
Wind speed (ms-1)
Cyclone parameters* Return Period(years)
Source: from JICA, 1994
1127. In Table 64 the relationship between maximum cyclone wind speed U (in m/s) and return period Y(in years) is based on the work of Kirk (1992), who developed the following relationship:
U1.899 = 1,456.265 + 2,046.05 log Y (with U in knots = 0.5144 m/s)
1128. This relationship is based on the observed record and presumably represents “current” climate. However, as previously noted, the historic record suggests that the frequency and intensity of cyclones in the vicinity of Rarotonga are increasing.
1129. For the present study, consideration was given to the impacts of global warming on changes in cyclone intensity and hence significant wave heights. The literature is equivocal regarding how global warming will affect the frequency and intensity of cyclones. Various methods and studies yield different answers, with some indication that changes in intensity could be region-specific. Nonetheless, a major review undertaken subsequent to the IPCC Second Assessment Report, conducted by a panel of the world’s leading experts on the subject, concluded that tropical cyclone intensities (as measured by maximum cyclone wind speed) are apt to increase as a result of global warming (Henderson-Sellers et al., 1998). This view was confirmed in the most recent IPCC assessment report (Giorgi and Hewitson, 2001).
1130. Two methods can be used to generate time-dependent scenarios of wind speed change. The first relates a change in wind speed to the corresponding degree of global warming, and scales this ratio by the time-dependent projection of global temperature change:
ΔUt-1990 = (ΔU2x / ΔT2x) * Δ Tt-1990
where:
t future year of the scenario ΔU wind speed change (ms-1) ΔT global mean temperature change ΔT2x global temperature change under equivalent doubling of atmospheric CO2 ΔU2x wind speed change under equivalent doubling of atmospheric CO2
In order to generate a maximum cyclone wind speed for some future time t, the observed wind speed is perturbed by this change:

242
Ut = ΔUt * Uobs
where
Uobs is the observed maximum cyclone wind speed
1131. To implement this method a value for ΔU2x / ΔT2x is required. Henderson-Sellers et al. (1998) estimate an increase of 10-20% in cyclone intensity based on maximum potential intensity models, but unfortunately do not provide an indication of the corresponding global temperature change. IPCC (Giorgi and Hewitson, 2001) estimate 5-10%, but again fail to give a corresponding global temperature change. In reviewing the literature, Lal (2002) concludes that cyclone intensities are projected to increase by 10-20% for a 2 to 4 degree increase in sea-surface temperature.
1132. In light of these findings a range of 2.5% to 10% increase in cyclone intensity per degree of warming is used to implement the first of the two methods. This information was incorporated into the SimClim Model, as three options for cyclone intensity change (low, mid and high), as were the relationships between maximum cyclone wind speeds, significant wave height and return periods based on observational data. The options are linked to the SimClim scenario generator. Using SimClim, the following parameter values were selected to create the scenario for the future change in significant wave height:
• Future year: 2065 (in keeping with the specifications that the breakwater should be considered to have a 60-year design life and assuming construction in 2005)
• Cyclone intensity change per degree of global warming: mid-range value • Emission scenario: SRES A2 • Climate sensitivity: mid-range value • Risk design: 50-year return period (in keeping with the given specifications).
1133. The results are presented in Figure 35. Under current climate conditions, the 50-year significant wave height is estimated to be about 10.8 meters. Under the climate projected for the year 2060, the 50-year significant wave height increases to about 12.0 meters.
Figure 35: Results of Significant Wave Height using SimClim Current climate Year 2060
Source: ADB CLIMAP TA 2004
1134. The second method is based on daily maximum wind speed for the GCM grid that includes Rarotonga, as estimated by the Canada Climate Modeling Centre GCM2, using the A2 emission scenario and best judgment of model sensitivity. While these data show changes in the maximum wind speed over time (from 1961 to 2100), spatial smoothing of the data means that the values underestimate the extreme wind speed at a specific location.

243
Consequently the GCM output was scaled such that the maximum speed estimated for the 1972 to 1998 period (16.7 m/s) coincided with the maximum gust observed over the same period at Rarotonga (42.4 m/s). While land based measurements of wind speed will normally underestimate the wind speed in the adjacent open waters, no further adjustment to the data was made due to the fact that the tropical cyclone generating the maximum wind gust of (42.4 m/s) passed directly over Rarotonga. Moreover, the wind gauge that measured this gust is in a very exposed location only a few meters from the coast of the island towards which the cyclone tracked.
1135. Table 65 presents the same information as in the preceding table, but also includes the return periods based on an analysis of the observed maximum hourly wind gust data and the adjusted GCM wind speed data.
Table 65: Estimates of Return Periods for Given Wind Speeds Estimates of Return Periods for Given Wind Speeds
Return Period (yr) GCM Based Maximum Wind Speed Data Wind Speed
(m/sec) Kirk (1992) Observed Data
(1972-1998) 1961-1990 1991-2020 2021-2050 28.5 2 2 1 1 1 33.9 5 5 2 2 2 37.5 10 11 3 4 4 38.8 13 14 5 5 6 41.9 25 29 18 16 14 44.9 50 57 60 45 31 47.8 100 113 120 95 64
Source: ADB CLIMAP TA 2004
1136. There is strong agreement between the return period estimates of Kirk and those based on observed data (even though they are not necessarily cyclone-related), suggesting that the Rarotonga anemometer provides extreme gust estimates that are reasonably representative of open water conditions.
1137. Comparison of the return period estimates for the 1961 to 1990 GCM data with the observed data also reveals good agreement, though the GCM data tend to show slightly shorter return periods for lower extreme wind speeds and slightly longer return periods for higher extreme wind speeds.
1138. Arguably the most important finding arising from this analysis is the suggestion that over the coming 50 years or so the return periods for the most extreme wind speeds will reduce significantly, approximately halving by 2050.
2. Sea Level Change
1139. Regardless of the method used to estimate the current and projected significant wave heights with a 50 year return period, the risk of damage to the breakwater in the future will also be influenced by changes in mean sea level. The following method is used to estimate the change in sea level as a consequence of global warming.
ΔZi,t-1990 = [ΔZg, t-1990 x ΔZr, t-1990 ] + Znc ΔZ2x
ΔZi,t-1990 is the projected sea level change (in cm) at location i, from 1990 to future year t ΔZg, t-1990 is the change in global-mean sea level (in cm) as projected by simpler climate models for a given emission scenario and as reported, for example, in IPCC (2001).

244
ΔZr, t-1990 is the change in regional sea level (in mm) pertaining to location i, as projected by a GCM ΔZ2x is the global mean sea-level change (in mm) for an equivalent doubling of atmospheric carbon dioxide concentration (or, for transient runs of GCMs, the global mean value as averaged over the last several decades of the GCM simulation). Znc, t-1990 is the local, non-climate-related change in sea level, usually due to vertical land movements that affect relative sea level.
1140. The above can be calculated with SimClim. Sample results for Rarotonga are shown in the accompanying figure. The sea level projections include both a regional component based on the Canadian GCM results as well as a local component based on trends in mean sea level as estimated from tide gauge data. After accounting for the climate-related rise, there appears to be a local trend of about 1.7 mm/yr, most likely related to vertical land movement. The resulting projections of sea level rise, based on the SRES A2 scenario, are shown in Figure 36. For this scenario, by the year 2060 mean sea level is projected to be 50 to 80 cm higher than today.
Figure 36: Rarotonga – Projected Values of Sea-level Rise
Source: ADB CLIMAP TA 2004
1141. In summary, when “climate proofing” the design of a breakwater two of the key considerations are how global warming will affect changes in cyclone intensity and frequency (and hence changes in the return periods of design wind speeds and of significant wave heights) and mean sea-level change. An example of the design calculations that are dependent on such estimates is given in Table 66.

245
Table 66: Estimated Wave Run-up Elevation
1142. The brief for the development of the Western Basin indicates that the breakwater should be designed for a nominal design life of 60 years. Given this specified design life, and the preceding projections of return periods for extreme winds and hence significant wave heights, and of sea-level rise, the breakwater design should be based on a significant wave height of at least 12 m and allow for a sea-level rise of at least 0.5 m.
B. Example 2 : Rainwater Harvesting
1143. Climate change proofing of rainwater harvesting is illustrated with the setups in Tauhunu, and Rakahanga. From collected field data (see Table 70 and Table 71 below), the average capacity of the water tanks as well as the Usable Roof Area (URA) from which rainwater is harvested can be estimated as demonstrated in Table 67.
Table 67: Rainwater Harvesting – Calculating Average Water Tank Capacity & Usable Roof Area
Location Water tank capacity (l)
Usable roof area (m2)
Dependent “households”
average WTC(l)
average URA(m2)
Tauhunu 1495000 8181 81 18457 101 Rakahanga 798200 6409 49 16290 131
Source: IGIC 2006
1144. For a set of daily water consumption figures, using a historical rainfall-series (2 January 1914 to 1 September 1996, more than 82 years), the performance results, shown in

246
Table 68, were estimated (the length of a critical period in which there is now water in the tank is defined as at least 10 days):
Table 68: Rainwater Harvesting Performance Results
Tauhunu longest dry period (d)
# critical periods/yr
Rakahanga longest dry period (d)
# critical periods/yr
200 l/d 20 0.061 200 l/d 24 0.049 -1mm 25 0.134 -1mm 28 0.085 300 l/d 39 0.427 300 l/d 39 0.280 -1mm 39 0.939 -1mm 39 0.646 400 l/d 39 0.988 400 l/d 39 0.732 -1mm 39 1.878 -1mm 39 1.439 500 l/d 50 1.354 500 l/d 39 1.122 -1mm 52 2.561 -1mm 40 2.122
Source: Ministry of Outer Island Development, Cook Islands
1145. The parameter “-1mm” indicates a climate change scenario in which the rainfall (when it rains) is 1mm less than current (this equates to roughly 10% of total yearly rainfall less). This scenario is chosen over one that changes the rainfall by a percentage in order to simulate longer droughts.
1146. Thus for Tauhunu, with a daily average use of 300l, the longest dry period in the 82 years was 39 days, while on average a critical period (of longer than 10 days of no water in the tank) occurred every 2 years (0.427 times per year).
1147. When the climate becomes drier, with less rain, the longest period does not change, but a critical period now occurs almost every year (0.939 times per year).
1148. The two different set-ups (in Tauhunu and Rakahanga) allow for comparison of the two design elements: water tank capacity and usable roof area. Though Rakahanga has a smaller average water tank capacity, it has a bigger usable roof area. The table shows that this is more important as it performs better than Tauhunu: even under high water usage (500 l/d) its longest dry period remains 39 days, while the frequency of critical periods is always lower. Climate proofing of the water systems in Tauhunu and Rakahanga therefore should focus on increasing the usable roof area with adequately sized water tanks
1149. To carry out the climate proofing analysis for rainwater harvesting systems in general the information listed in Table 69, will be needed:
Table 69: Data Required for Rainwater Harvesting Systems Characteristics of the system Tank capacity (l)
Usable roof area (m2) Water usage (d/l)
Rainfall time series For a location close to the system Daily data At least 10 years
Climate change scenario Changes in rainfall for the coming years
Source: Ministry of Outer Island Development, Cook Islands

247
1150. The analysis can:
• find the current performance against historical data • find the performance under climate change scenarios • identify the best parameter for the climate proofing (tank capacity vs. roof area) • find the optimal solution given performance requirements
Table 70: Tauhunu Manihiki Rainwater Collection System Details
No. Name Type of
Dwelling Tank
capacity (kL)
Roof area (m2)
Spouting (%)
Contributing roof area
(m2) Rating
1 Kamauta Ioane M/S 20 30 100 30 5 2 Glen Charlie M/S 20 30 100 30 5 3 Marc Ellis M/S 20 30 100 30 5 4a Apii Pio M/S 20 30 70 21 5 4b " " House 35 240 100 240 5 Fairoa Fairfka M/S 20 30 100 30 5 6 Arthur Neil M/S + House 33 30 100 30 5 7a Jean Marie Williams M/S 20 30 100 30 5 7b " " " House 26 650 100 650 5 8 Kero Tepaano M/S 20 30 100 30 5 9 John Koteka M/S 20 30 100 30 5 10 Terepaii Matangaro M/S 20 30 100 30 5 11 Ronald Powell M/S 20 30 100 30 5 12 Munakoa Maea M/S 20 30 100 30 5
13a Papu Vakai M/S 20 30 100 30 5 13b " " 5 100 0 14a Ricaldo P William M/S 20 30 100 30 5 14b " " " 24 100 0 15 Ricaldo William M/S 20 30 100 30 5 16 Ruamanu School 2 625 80 500 5 17 Fare Vai School 90 375 100 375 3 18 School toilet 7 45 100 45 5 19 CMC 40 300 100 300 5 20 John McLeod House 7 150 100 150 4 21 John Ma M/S 20 30 100 30 5 22 Marama Nehimia M/S 20 30 100 30 5 20 Itama Solomona M/S 20 30 100 30 5 24 John Ma House 3 110 50 55 2 25 Itama Solomona House 7 90 50 45 2 26 Matangaro Makita M/S 20 30 100 30 5 27 Terepaii Matangaro House 10 150 100 150 4 28 Petuela Kora House 7 110 80 88 3 29 Simiona Mahia M/S 20 30 100 30 5 30 Ioane Eiisa M/S 20 30 100 30 5 31 Joe Taraeka House 15 190 50 95 3 32 William family Lean to 15 30 100 30 5 33 Clinic welfare 1.2 130 50 65 4 34 Workshop 8 120 50 60 3.5

248
35 Moeroa John Shack 15 120 20 24 1 36 Hospital 5 120 0 0 0 37 Glen Charlie House 0 120 0 0 0 38 Toka Toka House 11 150 60 90 2 39 Tangi Toka M/S 20 30 100 30 5 40 Pupuke Tuteru M/S 20 30 100 30 5 41 Marine resources 4 140 100 140 4 42 Jean Tuare M/S 20 30 100 30 5 43 Tangi Toka House 5 110 40 44 3 44 Papapia House 5 130 75 97.5 4 45 Vaienga lean to 0 190 0 0 0 46 CICC church Church 25 650 50 325 4 47 Fare Ora Metua House 25 400 50 200 3 48 Fare Ariki House 25 240 40 96 3 49 Rota John House 5 180 40 72 3 50 Ravengakore House 5 140 60 84 3 51 Marc Ellis House 9 150 100 150 5 52 Koraka Dan House 5 130 50 65 3 53 Haumata M/S 20 30 100 30 5 54 Munakoa Tepania M/S 20 30 100 30 5 55 Fare Vai 90 280 100 280 2.5 56 Tina Ben M/S 20 30 100 30 5 57 Papa Tuatai M/S 20 30 100 30 5 58 Julia William's Shop Shop 8 90 60 54 3 59 SDA church 0 220 0 0 0 60 Parenga House 14 310 50 155 3 61 Koraka Dan House 8 250 50 125 2 62 Tangi Napara House 35 290 100 290 4.5 63 Vane Ioane House 4 220 20 44 1 64 Mama Helena House 5 190 50 95 2 65 Anna Vaiteru House 10 180 100 180 4
66a Willie Katoa M/S 20 30 100 30 5 66b " " House 2 20 100 20 67 Taromi Solomona House 8 120 85 102 3 68 Konitara Tuteru M/S 20 30 100 30 5 69 Rakaroa Masters M/S 20 30 100 30 5 70 Solomona William House 44 324 60 194.4 4 71 Harry Papae Shack 5 25 100 25 3 72 John Napara House 6 90 50 45 4 73 Papa Ta M/S 20 30 100 30 5
74a Tangiia Tua M/S 20 30 100 30 5 74b " " 5 100 0 75 Kora Kora House 15 400 100 400 4 76 Boy Tangiia House 8 350 50 175 4.5 77 Brian Newnham House 20 290 100 290 4 78 Marie Donnely House 29 400 100 400 4 79 Satu Satu M/S 20 30 100 30 5 80 Tepania Tepania M/S 20 30 100 30 5

249
81 Metua Seta M/S 20 30 100 30 5 TOTAL 1,495 11,414 8,181
Table 71: Rakahanga Rainwater Collection System Details
No. Name Tank
capacity (kL)
Roof area (m2)
Gutters (%)
Contributing roof area
(m2) Rating
1 CARGO SHED 180 810 50 405 4 2 PETER ARATANGA 7 135 50 67.5 2 3 TE MOKU 12 154 0 0 0 4 TIRIJAI TARAU 16 150 0 0 0 5 MARK ROROA 12 130 100 130 2 6 TOKA MAKIRA 15 225 100 225 2.5 7 MAMA TEMUVAINE 6 195 0 0 0 8 GOVERNMENT OFFICE 90 620 100 620 4 9 DAVID GREIG 8 300 40 120 1 10 TERE TENAKI 6 225 40 90 1 11 AROA HALL 30 225 100 225 5 12 MUNUKOA TINI 6 120 0 0 0 13 PIO RUA 1 180 0 0 0 14 TEMU 12 145 80 116 2 15 TEMU HAGAI 7 155 20 31 1 16 TUNU POPO 12 125 20 25 2.5 17 DANNY PIO 8 150 80 120 2.5 18 AMOSA GREIG 6 130 50 65 2.5 19 FARE VAI 90 320 90 288 4 20 PANAPA TAKAI 8 150 40 60 2 21 TIANINI (SPACE) 8 150 40 60 2 22 SDA CHURCH 12 150 50 75 5 23 SDA HALL 1 150 50 75 5 24 TUPUNA 1 150 50 75 2 25 BISHOPS RESIDENCE 1.2 90 100 90 5 26 CATHOLIC CHURCH 1 250 40 100 5 27 TAVIRA TEMU 6 150 35 52.5 1 28 PAPAHU 1 60 100 60 1 29 NETI TARAU 6 100 40 40 2 30 MITA APORO 13 120 40 48 2 31 TOTO SETAPHANO 7 160 30 48 2 32 TEMU HAGAI 6 160 25 40 2 33 POKIPOKI FLYRIVER 6 140 30 42 1 34 TUPO MAIHAI 6 125 40 50 2 35 PEPIO APORO 6 160 30 48 1 36 HOSPITAL 10 200 100 200 4

250
37 TERETIA 11 150 30 45 1 38 NAPA TUPU 8.5 130 20 26 3 39 EAKIMO 6 150 25 37.5 2 40 CICC HALL 31 900 100 900 5 41 FARE ORA METUA 2.5 240 50 120 5 42 CICC CHURCH 35 600 100 600 5 43 TUTERU HAGAI 8 100 100 100 4 44 PUPUKI ROBATI 6 100 25 25 1 45 SIR (TUATI TAMARAMA) 6 190 15 28.5 1 46 TUTAI ROBA 6 150 15 22.5 1 47 TOKA MAKIRA 7 90 15 13.5 1 48 SCHOOL 45 800 90 720 4 49 CLINIC 3 160 50 80 2.5
TOTAL 798.2 10,719 6,409

251
IX. CONSEQUENCES OF INACTION
1151. The step-by-step process for climate proofing projects, plans or programs outlines a climate risk assessment pathway that parallels current project planning and development procedures. In much the same way as an Environmental Impact Assessment (EIA) scoping and assessment process, climate proofing attempts to identify climate risks to a specific project and address these risks through qualitative and more importantly quantitative analysis. The convergence of the process for climate proofing and project design and development occurs during feasibility studies for the project.
1152. The Cook Islands are already at risk from extreme events and vulnerable to political, socioeconomic, and environmental changes. Tourism forms the current backbone of earnings with focus on the country’s environmental and cultural attributes.
1153. The consequences of “doing nothing” has serious implications for the people and environment of the country. Thus as projects that deal with existing problems are designed if climate-proofing is relevant, this will add initial cost to the project, but even with added costs, there are also added benefits. These benefits may include damage averted because of the project, or more so by climate proofing – even if the climate change effect is smaller than expected. The challenge is to assess whether the additional benefits outweigh the additional costs. The real trade-off is not only about the “additional costs” of climate proofing, but also about the costs of not doing this, while climate change is occurring; in other words the climate proofing is an “insurance-investment” to prevent, or substantially reduce, future damage-costs
1154. With scarce available financial and human resources, prioritizing those projects on the basis of maximizing benefits to the wider community is important. Climate risk cuts across all facets of the development of a project and at a number of levels. Taking into account climate change risks is good project development practice, however, it is unfortunate currently that there are no specific templates available to streamline the climate proofing process to facilitate its wider use in project development procedures.
1155. The preparation of this Profile is tempered against what needs to be done by both the Cook Islands Government and by development agencies and multilateral banks, such as the ADB, as they work to assist the Government with attaining their socioeconomic goals. The following suggestions are provided to help assess cost and commitment to take into account climate risks, as they consider the 20 year Infrastructure Master Plan:
1156. At Cook Island Government level:
• Through the appropriate Ministry (Office of the Prime Minister, Ministry of Works, Ministry of Finance and Economic Management, or National Environment Service) seek Cabinet agreement that all project developments are assessed against their sensitivity to climate risks (refer to Table 72, Table 73, Table 74, Table 75 and Appendix 1);
• Those project developments which are assessed as being climate sensitive or are high risk to climate change, should be “climate proofed”, as part of the overall project development process;
• Funding for the climate risk assessment and subsequent climate proofing of the project should be made available as a part of the overall project development and within the context of development agencies/multilateral banks assistance to the Government for the specific project involved.
1157. At the Development Agency/Multilateral Bank level:

252
• As part of the Infrastructure Master Plan framework and in consultation with Cook Islands Government support the climate risk assessment and climate proofing process, including mainstreaming into current project planning and development procedures;
• Identify and engage experts who may assist the agency and Cook Islands Government with the tasks under the climate risk assessment leading to the feasibility stage of project design and development.
1158. To move toward further managing risk and reducing damage associated with climate change and the occurrence of disasters, the next step is to identify areas of vulnerability and to match adaptation strategies to those areas and conditions. This would include cost-effectiveness modeling in order to provide information on the savings to be gained from following adaptation and mitigation strategies for current and future climate change scenarios. The long term benefits of such a modeling package would also serve to forecast cost savings achieved by reduced costs of post disaster damage repair. be seen at the local and regional level, but also at the international level in terms of less foreign aid being required to repair damage after extreme climatic events.
1159. As outlined in Figure 25, adaptation strategies would arise out of a risk assessment on the vulnerability areas and issues most vulnerable given present and future climate change in the Cook Islands.
1160. Key features for adaptation and mitigation strategies for the Cook Islands should pay attention to the coastal areas and coral reefs particularly in the Northern island group with low lying atolls. While this area is sparsely populated, the corals support fish and shellfish as well as protecting the coastline from erosion. Mitigation and adaptation planning is also needed to prevent over-fishing, pollution and the negative effects of economic development for the present and future climate change scenarios. In particular, some of the atolls are looking to increase tourism. Potential negative impacts arise on the coastal erosion and the integrity of coastal ecosystems. This endorses the need to ensure that careful and pragmatic environmental impact analysis, mitigation and monitoring measures are prepared for developments such as hotels and resorts. Consideration of the siting and density of buildings (or bulk and location factors, discussed in section X below) is an important adaptation strategy.
1161. Specific coastal protection initiatives may also be introduced. For example, active encouragement of the growth of indigenous plant species along coastal areas should be considered alongside the building of walls and other artificial banks to combat rises in sea levels. This involves removing exotic weed species, and favouring indigenous species which are in general better adapted for long term survival in this environment. The approach has the added advantage of conservation of flora, which includes coastal species in danger of extinction.
1162. An essential component of disaster reduction and adaptation is awareness raising on issues such as the methods of long protection of homes and assets, means of protecting water and power supplies, and consequences mismanagement of vegetation, all aimed at preventing current and future climate-related damage and risk.
1163. It is important to stress that adaptation measures need to be aimed at the project level with capacity building as one of the major components in order to increase expertise, skills and resourcefulness. This in turn will raise awareness of the need and procedures for timely and cost-effective adaptation that will prevent economic loss and ensure quality of life.
1164. Synergies exist at regional, sub-regional and national level via ongoing or recently completed adaptation programs. It is important that there is an integrated approach covering economic, financial, technical and legal aspects as well as social, environmental and networking dimensions for the Southern and Northern groups, which have intrinsic differences in the magnitude and specificity of their environments requiring a flexible

253
approach to adaptation measures. Long term planning would be served by the use of Geographical Information Systems (GIS) for the assessment of risk areas and the use of databases that assist with analysis, planning and decision-making activities on land use, biodiversity and resource monitoring and management of coastal and inland areas of the Cook islands. These tools would provide reliable background information for risk assessment and adaptation strategy development.
Table 72: Climate Sensitivity Assessment of Projects Identified under the IMP for Years 0 - 2 (Immediate)
PROJECTS IDENTIFIED WITH NO
CLIMATE SENSITIVTY
PROJECTS IDENTIFIED WITH CLIMATE
SENSITIVTY
KEY CLIMATE PARAMETERS WHICH WILL AFFECT THE
PROJECT
IMMEDIATE 0-2YRS IMMEDIATE 0-2YRS On-going replacement of Rarotonga ring main
Improve Northern Group and Atiu airports
Sea-level rise, severe weather, storm surge, rainfall, El Niño
Complete on-going power upgrading project in Aitutaki
Improve Outer Island harbors Severe weather, storm surge, sea-level rise
Provide high-speed internet to Outer Islands
Upgrade inner ring road from Avarua to Pokoniu in Rarotonga
Rainfall, wind speeds, severe weather
Construct reticulation system in Mangaia. Rehabilitate systems in Aitu, Mauke and Mitiaro
Temperature, severe weather, droughts,
Complete community and EMC storage in Northern Group
Temperature, severe weather, drought, wind
Provide power to all HHs in Pukapuka – feasibility study required
Severe weather, wind, storm surge
Implement national septage management plan and trial evapo-transpiration beds in Rarotonga
Temperature, severe weather, rainfall, drought
Install flush toilets and convert pit latrines to septic tanks in all HHs in Southern Group
Severe weather, wind, rainfall
Install flush toilets in all HHs in Northern Group
Storm surge, severe weather, rainfall, drought
Repair damage at Aitutaki landfill site
Severe weather, rainfall
Pilot village composting facilities in Northern Group
Severe weather, storm surge, wind
Rehabilitate or construct maintenance workshops in outer islands
Severe weather, storm surge, wind, rainfall
Construct EMCs in Pukapuka, Palmerston
Severe weather ,storm surge, wind
Provide minimum water storage, standby generator and other emergency equipment at all EMCs
Severe weather, wind, storm surge, rainfall, drought

254
Table 73: Climate Sensitivity Assessment of Projects Identified under the IMP for Years 2 - 5 (Short Term)
PROJECTS IDENTIFIED WITH NO
CLIMATE SENSITIVTY
PROJECTS IDENTIFIED WITH CLIMATE
SENSITIVTY
KEY CLIMATE PARAMETERS WHICH WILL AFFECT THE
PROJECT
SHORT TERM 2-5 YRS
SHORT TERM 2-5 YRS
Improve Rarotonga terminal, replace navaids and lighting. Implement cyclone mitigation measures
Improve Aitutaki terminal and runway
Severe weather, storm surge, wind, rainfall
Meet IPSC security requirements in Rarotonga and Aitutaki
Stage 3 of Avatiu harbor improvement plan
Severe weather, storm surge, wind, sea-level rise
Implement road safety program in Rarotonga and Aitutaki
Improve Aitutaki port facilities Severe weather, storm surge, wind sea-level rise
Implement annual collection of hazardous and recyclable waste from all islands to a central plant
Implement traffic management measures in Avarua area in Rarotonga
Severe weather, wind, rainfall
On-going rehabilitation of Rarotonga system and install metering. Construct water treatment facilities in Rarotonga
Severe weather, rainfall, drought
Upgrade intake structures in Aitutaki. Install metering in Southern Group
Severe weather, rainfall, drought
Provide rain-water tanks to all HHs in Northern Group. Install first flush systems to improve water quality. Pilot water gallery in Palmerston
Severe weather, storm surge, rainfall, wind
Rainfall, drought
Severe weather, storm surge, sea-level rise, drought
National program to repair and rehabilitate generators, switchgear and distribution systems in Outer Islands
Wind, severe weather, rainfall, wind
Rehabilitate distribution system in Atiu
Severe weather, wind, rainfall
Construct sewerage schemes for Avarua, Arorangi and Muri villages in Rarotonga Improve septic tank/ absorption bed systems if trials successful
Rainfall, severe weather, wind
Construct septage ponds in all Outer Islands
Rainfall, wind severe weather
Construct medical waste disposal facilities in Rarotonga. Aitutaki and Outer Islands
Severe weather, rainfall, sea-level rise, storm surge, drought
Construct new sanitary landfill sites in all Outer Islands
Severe weather, rainfall, storm surge,
Construct central workshop and spares depot for the Northern Group
Severe weather, storm surge, wind, sea-level rise
Construct EMCs in Rakahanga and Penrhyn
Severe weather, storm surge, wind, sea-level rise

255
Table 74: Climate Sensitivity Assessment of Projects Identified under the IMP for Years 5 - 10 (Medium Term)
PROJECTS IDENTIFIED WITH NO
CLIMATE SENSITIVTY
PROJECTS IDENTIFIED WITH CLIMATE
SENSITIVTY
KEY CLIMATE PARAMETERS WHICH WILL AFFECT THE
PROJECT
MEDIUM TERM 5-10 YRS
MEDIUM TERM 5-10 YRS
Replace existing generators with fuel efficient models in all islands
New Mangaia airport and Atiu terminal
Severe weather, wind, rainfall
Incremental improvements to Rarotonga facilities
Severe weather, wind, rainfall
Improve outer island harbors to handle container landing barges
Severe weather, wind, storm surge, sea-level rise
Upgrade road capacity in Avarua area in Rarotonga
Rainfall, severe weather, storm surge
Rehabilitate main and inner ring roads in Rarotonga
Severe weather, rainfall, storm surge
Water Supply - On-going implementation of short-term projects
Severe weather, rainfall, temperature, drought
Pilot projects of solar, wind and tidal power generation systems
Severe weather, wind, storm surge
Sanitation - On-going implementation of short-term projects
Severe weather, rainfall, drought, wind
Solid Waste Management – On-going implementation of short-term projects
Severe weather, rainfall,
Table 75: Climate Sensitivity Assessment of Projects Identified under the IMP for Years 10 - 15 (Long Term)
PROJECTS IDENTIFIED WITH NO
CLIMATE SENSITIVTY
PROJECTS IDENTIFIED WITH CLIMATE
SENSITIVTY
KEY CLIMATE PARAMETERS WHICH WILL AFFECT THE
PROJECT
LONG TERM 10-20 YRS
LONG TERM 10-20YRS
New passenger terminals at Manihiki and Penrhyn
Severe weather, storm surge, wind, sea level rise
New Rarotonga international departures building
Severe weather, wind, rainfall
New Aitutaki international passenger terminal
Severe weather, wind, rainfall
Avatiu port and harbor expansion to handle large container and cruise liners
Severe weather, wind, storm surge, rainfall, sea level rise
Complete inner ring road Severe weather, rainfall, storm surge
On-going rehabilitation of distribution system and upgrade water treatment facilities in Rarotonga
Severe weather, wind, rainfall, temperature
On-going rehabilitation of distribution systems in Southern Group
Severe weather, wind, rainfall
Construct distribution system for non-potable use from groundwater sources in Northern Group
Severe weather, drought, sea level rise, storm surge

256
Implement feasible alternative energy systems in staged program
Severe weather, wind, rainfall
Expand village sewerage and treatment facilities in Rarotonga
Severe weather, rainfall, wind
Construct centralized sewerage scheme in developed areas in Aitutaki
Severe weather, rainfall, wind, drought
Renew septic tanks and disposal beds in Outer lslands as required
Severe weather, rainfall, wind storm surge, sea-level rise
Expand landfill sites in Rarotonga and Aitutaki as required
Severe weather, wind, rainfall
Expand landfill sites in all Outer Islands as required
Severe weather, wind, storm surge, rainfall, sea-level rise
X. BUILDING CODE AND REGULATIONS
1165. Existing legislation that governs building standards are provided for in the Building Control and Standards Act, 1991 and the Building Controls Standards Regulations, 1991. This legislation provides for the National Building Code 1990 (NBC) for the Cook Islands. Further regulations, relating to siting and management in special areas of concern including foreshores, fall under the Environment Act of 2003 and the Public Health Act of 2004. Provision also exists for Island Councils to make by-laws for the protection and management of certain areas, under the Outer Islands Local Government Act of 1987. This chapter reviews the status of these regulatory provisions and the scope and means by which they may be updated or enhanced to effect the wider adoption of feasible climate proofing measures in the Cook Islands.Principal Climate Proofing Issues
A. Principal Climate Proofing Issues
1166. The Climate Risk Profile (CRP) prepared for the Cook Islands under this TA has been updated and provided specific scoping for a wide range of projects identified under the TA’s infrastructure master plan. The scoping process is an initial assessment procedure whereby any identified projects that are climate sensitive to changes in specific climate parameters (such as rainfall, sea surge, drought, and cyclones and others) are assigned or “flagged” as requiring further and additional detailed assessment as the project design and development progresses. The CRP examines future scenarios to predict the return periods of extreme climatic events. A number of factors affect the way in which the consequences of these events can be mitigated, and recovery after them can be expedited in a least cost context. Factors relating to design standards, construction specifications and materials choices are covered under the NBC. Equally important are factors relating to bulk and location of buildings which include size, spacing and positioning of buildings, and proximity to the foreshore. These factors can affect the ability of a group of buildings to withstand flood, sea surges, and possibly high wind speed events. Legislative provision for these factors are provided for under the Environment Act or via by-laws enacted by Island Councils.
1167. Design standards that fall within the scope of the Building Code include provisions for wind resistance, flood resistance, strength and integrity of connections to sanitation services or of on site facilities, resistance to erosion around building foundations, and special arrangements for buildings and structures with refuge or post disaster management functions. Each of these design impacts can be addressed and minimized by taking a climate risk reduction approach which offers additional benefits to the wider environment and society.

257
B. The Existing Building Code and the Need for Revisions
1168. The existing NBC is dated 1990, and was last updated in 1992. It draws largely on the Australian Building Code that was in effect at the time, and is based on climatic and other data collected during the 1980s. The ensuing years have seen both an increase in the frequency and intensity of extreme climatic events, as described in the CRP, as well as advances worldwide in the preparation of building codes and associated guidelines. The need and scope for revisions here are considered under the three key areas of wind speed, resistance to flooding, including sea surges and sanitation measures.
1. Wind Speed
1169. The existing code assumes a limit state basic wind speed of 60 m/sec47.This is a design maximum wind speed, higher than the predicted maximum, with an in-built factor of safety against failure. The CRP however envisages potential increases in the intensity of cyclones by up to 20%. However, during 2005, wind speeds measured during the major cyclones exceeded this figure with cyclone Meena peaking at 78 m/sec; cylone Nancy at 67 m/sec; cyclone Olaf at 72 m/sec and cyclone Percy at 59 m/sec48.
1170. The current standard applied to structural design for wind actions in Australia and New Zealand, AS/NZS1170.2:2002, applies zoning by risk category over the region, and defines the ultimate gust wind speed in terms of a return period of 2000 years as 77 m/sec in region C, the tropical cyclone region of Queensland, the Northern Territory and Western Australia, and 99 m/sec in region D, the severe tropical cyclone region of Western Australia. Data in the CRP suggests that the risk scenario in the Cook Islands is at least comparable to region C, meriting a revision of the existing NBC to take account of the higher gust speeds that have been recorded in recent years49
1171. In reality, total peak loads on a building are influenced by site characteristics and the aerodynamic shape factors for different buildings and structures. Successive refinements of AS/NZS 1170.2 reflect growing understanding of the wind loading mechanisms based on these factors, allowing for greater preservation of the building envelope and structure, so that heavy losses can be minimized. This has strong significance as even a modest breach of the building envelope will increase internal pressure, increasing the risk of break-up and allowing subsequent water infiltration, greatly increasing the extent of damage.
1172. The degree of exposure of a site will vary according to factors such as topography, height and the surrounding terrain, and thus buildings situated close to the foreshore, or in elevated locations further inland, or on atolls, will be subject to different wind loads during extreme events. The current version of AS/NZS1170.2 provides for the incorporation of these factors in the design of buildings. The standard also considers categories of buildings and structures in terms of their overall shape. These include enclosed rectangular buildings, storage tanks, and exposed structural members and frames.
1173. Besides the ability of buildings themselves to resist wind damage, much of the damage in strong wind events occurs as a result of windborne debris. A major potential source of damaging debris includes attachments to buildings, such as pieces of roof sheeting, windows, doors and wall coverings, or supplementary features of buildings outside the main building envelope such as porch roofs and car ports which can experience higher than expected wind forces. This issue is also addressed in AS/NZS1170.2.
47 Wind forces used in design generally have a 5% probability of exceedance in 50 years, for the limit state
condition, or in 1 year (for serviceability). There is therefore an expectation that the nominated speed will be exceeded.
48 RRP:COO 39118 June 2005:1 49 Note that loads on buildings vary in proportion to the square of the wind speed - i.e. increasing the limit state basic wind speed by 20% will increase design actions resulting by building element, e.g. cladding, by 44%.

258
1174. Issues associated with applying standards such as AS/NZS1170.2 to the Cook Islands are discussed below. The NBC includes guidline sections that present options that are deemed to comply with the code. These are an effective and appropriate means of translating technical specifications into actual building methods. Expansion and adaptation of these may also cover retro-fitting of existing buildings that do not currently comply with standards, and be a valuable tool to the local building industry.
2. Flood Resistance, including Sea Surge
1175. The key parameter for resistance to flood damage is the minimum floor height, above the mean high water mark. The CRP has identified that sea heights may rise by 0.5m by 2100, under a best guess scenario, or by 1m under a worst case scenario. This is compounded by projected increases in extreme wave heights associated with tropical cyclones, which are predicted to increase in intensity. These phenomena affect both the positioning of the mean high water mark, and the appropriate minimum floor height above this mark. The raising of floor heights may also entail upgrading of stairwells, in order to ensure adequate access for people with disabilities to private or commercial buildings. Key differences occur in how a building may be designed or positioned when considering the topographical context, for example a building near the foreshore on a southern group island which may be affected by high intensity rainfall events, as opposed to a building on an atoll in the northern group which is very close to the foreshore margins.
1176. Further factors that affect the level of damage and danger resulting from flood events include the location of electrical switches and outlets above potential flood levels and means of reducing the risk of severe erosion around building foundations. Again, these issues may be both addressed in the Building Code and in suitable guideline material for designers and builders.
3. Sanitation Measures
1177. The NBC includes specifications for septic tanks, and regulations relating to the siting, construction and operation of septic tanks and sewage treatment systems are currently under review. Part 6 of the Public Health Act 2004 provides for safe storage, collection, transport and treatment of waste. Potential climate proofing measures include, siting, the strength and integrity of the sewage tanks, and the installation of valves that prevent the release of raw sewage in the event that tanks become submerged. While the use of septic tank systems is prevalent in the Cook Islands, there is increasing awareness and pressure upon society to look to alternative forms of sanitation systems, whether they are small enclosed systems or larger commercial systems, or reticulated systems that have been proposed recently for Rarotonga. Each of these systems has a water resource requirement, and during feasibility study stages require careful consideration of system integrity during extreme events such as intense rainfall, extreme storms and high sea surges.
4. Requirements for Updating the Code
1178. Relevant Australian and New Zealand standards clearly provide a valuable source of guidance to substantially reinforce the value of the NBC as a tool to facilitate consistently applied, feasible and effective climate proofing measures throughout the Cook Islands. However, a number of issues present themselves in connection with this task, namely appropriate adaptation of Australian and New Zealand material to reflect conditions in the Cook Islands, benchmarking of data, and legal process.
1179. The Cook Islands, consisting mainly of small volcanic islands in the south and atoll islands in the north, have a much smaller range of building situations, within the natural and built environment, than are encountered in Australia and New Zealand. For this reason, much of the complexity that is necessary for the Australia and New Zealand standards can

259
be dispensed with. In addition, with a much smaller human resource for the implementation of the codes, any review should also reflect the scope that exists within the local institutional structure to apply them.
1180. A benchmarking process needs to be applied to climate data in order to ensure the technical validity of any adaptations to the code. This involves re-evaluating the climate data used for the preparation of the existing NBC provisions in the light of the greater fund of data now available on climate and climate change.
1181. Finally, any amendments to the NBC will be subject to the official process required for new legislation or legislative instruments. This provides for stakeholder consultation over key issues and early drafts, submission to Cabinet and to Parliament.
C. Application and Enforcement of the Building Code
1. Interpretation
1182. As mentioned earlier, the implications of the Building Code compliance need to be readily understood by designers and builders if they are to be effectively applied. Updating or extending the existing “deemed to comply” standards given in the BNC is a key link in this regard. This material may take the form of manuals or guidelines that provide options for building compliant structures, based on materials, equipment and skills resources that are available on the islands.
2. Institutional Issues
1183. As discussed in the Inception Report for this TA, the application of the NBC is currently constrained by a number of factors; not least the availability of approved Building Inspectors for works undertaken on the Outer Islands (the only approved Building Inspectors live on Rarotonga). A further issue is that of enforcing compliance with the Code, even on Rarotonga where building inspectors are available. From discussions that took placed during the TA it appears that difficulties relate to to awareness of the NBC and to legal obligations to comply with it, as well as the availability of qualified inspectors on the outer islands.
1184. With regard to awareness, the issue of the vulnerability to cyclones and other disasters is widely apparent, both from recent memory and from the existence of some buildings that remain unrepaired after the 2005 cyclones. Awareness of the NBC and of its value in ensuring that homes and public buildings can be better climate proofed may be raised by increasing the availability of guideline material, such as explanatory pamphlets and manuals that are based on the “deemed to comply” standards. This also increases the accessibility of the NBC to a wider range of users.
1185. Enhancing the institutional capacity to enforce NBC compliance also deserves examination. However, if building inspections are to take place systematically throughout the islands, there is a significant cost involved either in arranging the necessary site visits, or in training and accrediting building inspectors who are resident on the outer islands. These costs are likely to be significant, and while they can justifiably be borne by developers for situations such as commercial buildings, they represent a considerable burden to members of remote and economically disadvantaged communities. Options for improving institutional capacity to undertake inspections, and for meeting the costs, merit investigation as part of the process of enhancing regulatory provisions for climate proofing.
D. Regulations on Bulk and Location Issues
1186. The wider issues of siting and sizes of buildings, and control of density of development on private or public land in risk prone areas, also have a bearing on climate proofing. Dense developments near the foreshore, for example, increase the impedance and thereby potential damage caused by sea surges. A further issue related to the preservation

260
of human life and recovery from disaster events is the upkeep of designated Emergency or Evacuation Centres which exist on each island and which are needed when homes are under threat or rendered temporarily uninhabitable by extreme events. The present regulatory provisions for these factors are the Public Health Act (2004), in respect of certain areas of potential concern, and provision for Island Councils to make by-laws applicable to the individual outer islands. At present, by-laws relating to the management of specific areas have only been instituted on Rakahanga and Pukapuka islands. A review of these legislative provisions is merited, in order to ensure that bulk and location factors are taken account of as and when development occurs on the islands.
E. Recommendations
1187. In summary, the following recommendations, toward the environmental and economic sustainability of the infrastructure against the weather-related vulnerabilities experienced by the country are made:
• Formal review of the Building Control and Standards Act Regulations of these and the NBC, drawing on the current Australian and New Zealand standards, and adapted to geographic and institutional conditions in the Cook Islands
• Emphasis be given to expanding and updating building manuals that provide achievable and affordable options, based on locally available resources, that are readily understood and meet “deemed to comply” standards
• Review the mandated roles of Building Inspectors, to include an advisory as well as enforcement function to assist with achieving the required standards
• Review of institutional funding and/or cost recovery arrangements to ensure costs of building inspections are met by an appropriate mechanism
• Advisory support to Island Councils for the preparation of appropriate and effective by-laws to ensure that future developments do not increase vulnerability to extreme events.
1188. The following specific tasks are required to achieve these:
1. Recommendations for Revisions to the NBC
(xxxv) 1. Re-evaluate benchmark data used for the NBC on the basis of meteorological records and climate change data now available. These must include the key parameters of the mean high water mark, maximum wave height and maximum wind speed need.
(xxxvi) Provisions within the NBC for wind resistance should to be expanded to take into account measures now covered in the current Australia / New Zealand standard AS/NZS 1170.2.2002. In particular, these should include:
• provisions for incorporating site characteristics (such as elevation, distance from the foreshore and surrounding topography),
• differential requirements according to shapes of buildings (including enclosed rectangular buildings, storage tanks, and exposed structural members and frames)
• requirements for adequate securing of building features outside the main building envelope
(xxxvii) Provisions for flood resistance should also be updated in accordance with the re-evaluated high water mark and extreme wave heights. These should cover minimum floor heights above the high water mark and positioning of electrical switches and outlets. In addition requirements for the siting, strength, and integrity of sewage tanks situated in flood risk areas should be updated.

261
(xxxviii) Corresponding updating should be made to guidelines within the NBC on options that are deemed to comply with the code. These should be options for retro-fitting of existing buildings that do not currently comply with these standards.
2. Recommendations for improved application of the legislation governing buildings
(i) The legislative status of the NBC and of building inspectors should be
reviewed, and consultations undertaken to identify options of ensuring compliance. Consultations should take place with the Ministry of Works, Public Health, National Environment Service (NES) and OMIA, and with private sector builders. Options should consider advisory functions for building inspectors, and special arrangements for inspections on outer islands.
(ii) Options for meeting the costs of building inspections on the outer islands also need to be identified, covering possible cost sharing arrangements. Options should include the introduction of charge categories, based on the ability of applicants to pay for inspections, reducing the cost burden for outer islanders.
(iii) Means of raising awareness of the NBC, its purposes and the responsibilities of builders and developers to adhere to it should be developed. These may include distribution of copies of the NBC and of explanatory leaflets, briefing of Island Councils, and periodical notices in the media.
3. Recommendations for enhanced planning of building and infrastructure
development
(i) In order to assist Island Councils to make effective by-laws (as empowered
under the Outer Islands Local Government Act of 1987) to ensure that future developments do not increase vulnerability to extreme events, training should be provided to representatives from selected islands in respect of planning issues including the siting and sizes of buildings, density of development and special measures for risk prone areas. This should include a seminar on planning and provision of specimen by-laws.

262
Table 76: Review of Individual Sections of the NBC Section Existing Provisions Review Comment Recommendations A: General Provisions
These cover interpretations, definitions, referenced standards , details on suitability of materials, and building classifications.
While further definitions and standards have appeared in the Australian and New Zealand code in recent years, the range of building types, features and materials found in the Cook Islands appear to be covered.
No updating or revisions at this stage
B: Structure General requirements are defined, design loads are described, “deemed to satisfy”
Provisions relating to wind loads are important for withstanding strong winds that are anticipated in the CRP. Advances have been made in understanding of the dynamics of wind loading on buildings. The existing applicable code in Australia and New Zealand, AS/NZS 1170.2:2002. This code is based on zone categories. Data in the CRP suggests that the situation in the Cook Islands is comparable to Australia’s Region C (the tropical cyclone region of Queensland).
As detailed above, expansion of the NBC to reflect increased understanding of the effects of wind.
DC / NC: Fire Resistance
Section DC (dwellings and outbuildings) covers the main requirements for walls, floors and roofs that achieve protection against the spread of fire, allow for escape from burning buildings and reduce risks to neighbouring buildings. Section NC Covers these and further details to allow isolation of fire outbreaks, hazard warning, emergency exit and other details necessary to achieve safety in public buildings.
The existing provisions appear to be cover the main precautionary measures that can be taken to safeguard lives and prevent the spread of fire such as fire rated walls. In Australia and New Zealand the main precautions developed in recent years relate to “active systems” such as suppression, detection and protection systems that require regular maintenance to ensure ongoing functioning, which may be more complex in concept and approach and thus problematic for application in the Cook Islands. Access and Egress provisions (in sections DD and ND
Focus on ensuring that the existing code is effectively applied, updating to reflect recent developments in Australia and New Zealand is not recommended at this stage.

263
DD / ND: Access and Egress
Section DC (dwellings and outbuildings) provide for safe entrances and exits from buildings, specifying appropriate dimensions and configurations for stairways, balustrades, ramps and parapets. Further provisions are provided in section NC for public building situations, allowing for the needs of people with disabilities, children, hospital patients and other special groups.
In view of further development in Australia and New Zealand, further provisions in access and facilities within buildings can be made for people with disabilities
Scope for enhancement of the code to improve provisions for disabilities should be reviewed
DE: Electricity
Reference is made to AS 3000 for the safety of electrical wiring, with special provisions given in relation to the location of plug sockets.
For climate proofing, the location of plug sockets, switch boxes, meters and other devices vulnerable to flooding is significant. These must be located well above potential flood levels.
Add provision for locating electrical outlets switches and meters above flood levels for buildings that are potentially vulnerable to damage by extreme sea surges.
NE: Services and Equipment
Provisions relating to fire fighting equipment, smoke control, lifts (elevators) emergency lighting and signage and electrical safety.
The main issues relating to these appear to be covered.
No updating or revisions at this stage.
DF / NF: Health and Amenity
Provisions relating to site drainage, damp proofing, cooking and sanitary facilities, room sizes, lighting, ventilation, plumbing and roof drainage. Much emphasis is given to on-site sewage treatment systems such as pit latrines digesters and septic tanks. Rainwater storage is also covered.
Details are given for appropriate standards for these items. For climate proofing, provisions are needed where there are potential hazards associated with the release of sewerage from underground on-site systems as a result of flooding. Recent developments in New Zealand have included a substantial focus on the weather-tightness of buildings, however once more these are complex and related more to catering for building efficiencies and architectural refinements.
Add provisions relating to the siting of on-site sewerage systems, and installation of valves to prevent the release of raw sewage in the event that the facilities become submerged.
DG /NG: Ancilliary Provisions
These sections cover swimming pools, aesthetics, animal houses, awnings and shades, fireplaces, chimneys and flues.
Structures such as animal houses, awnings and chimneys can become hazardous sources of windborne debris. The new code AS/NZS 1170.2 (described for section B above)
Provide cross-reference to section B in relation to animal houses and features on buildings and types of cladding that are potential hazards in high wind events. Related “deemed to comply” standards should be revised.

264
NH: Special Use Buildings
This section covers theatres, stages and public halls.
For climate proofing, secure refuges are needed to protect communities during extreme storm events. These need to be sited and constructed so as to be well clear of potential flood levels, to be thoroughly wind firm and to have reliable water supply, sanitation power and communication facilities. Further features of relevance to public buildings, such as fire exits and escapes, are covered in section ND.
Draft special provisions for buildings to be used as refuges during or immediately after extreme storm events.

ASIAN DEVELOPMENT BANK
FINAL REPORT
TA 4605-COO: STRENGTHENING DISASTER MANAGEMENT AND MITIGATION
(COMPONENT 2: PREVENTIVE INFRASTRUCTURE MASTER PLAN)
VOLUME 2: APPENDIXES
MARCH 2007
The MPC Group InternationalM I C R O F I N A N C E • P L A N N I N G • C O M M U N I T YThe Group International
M I C R O F I N A N C E • P L A N N I N G • C O M M U N I T YMPC
In association with


i
CURRENCY EQUIVALENTS (as of 23 March 2007)
Currency Unit – New Zealand Dollar (NZ$) NZ$1.00 = US$0.71 US$1.00 = NZ$1.41
ABBREVIATIONS AADDT Average annual daily traffic AC Asphalt concrete ACC Aid Coordinating Committee ADB Asian Development Bank ADSL Asymmetric Digital Subscriber Line AMD Aid Management Division APS Aitutaki Power Supply AS/NZS Australian Standard/New Zealand Standard ATC Air Traffic Control AusAID Australian Agency for International Development AVG Average AWF Aitutaki Waste Facility BOD Biochemical oxygen demand CAANZ Civil Aviation Authority of New Zealand CAPEX Capital Expenditure CBDAMPIC Community Based Development of Adaptation Measures for Pacific Island Countries CEAL Cyclone Emergency Assistance Loan CI Cook Islands CIAA Cook Islands Airport Authority CIANGO Cook Islands Association of NGO’s CIGOV Cook Islands Government CIIC Cook Islands Investment Corporation CIMMRISP Cook Islands Ministry of Marine Resources Institutional Strengthening Project CIPA Cook Islands Port Authority CISD Cook Islands Statistics Office CITTC Cook Islands Trade Training Center CITV Cook Islands Television CLIMAP ADB Climate Change Adaptation Program for the Pacific COPED Concrete coastal protection device CROP Council of Regional Organizations CRRP Cyclone Recovery and Reconstruction Program CRP Climate Risk Profile DBST Double Bituminous Surface Treatment DME Distance Measuring Equipment DNHRD Department of National Human Resource Development DOH Department of Health DPA Development Partnership Agreement DRM Disaster Risk Management EC Evacuation Center EXCIL Express Cook Islands Line Agency Ltd EIA Environmental Impact Assessment EMC Emergency Management Center EMCI Emergency Management Cook Islands ENSO El Niño/Southern Oscillation FY Financial Year or Fiscal Year

ii
GCM Global Climate Model GDP Gross Domestic Product gensets Generator sets GHD GHD Consultants HRD Human Resource Development IA Island Administration IC Island Council ICAO International Civil Aviation Organization ICT Information, Communications and Technology IEE Initial Environmental Examination IGCI International Global Change Institute ILS Instrument Landing System IMP Infrastructure Master Plan IPCC Intergovernmental Panel on Climate Change JICA Japan International Cooperation Agency LBGES Labor-based Government Equipment Supported LPG Liquefied Petroleum Gas MC Micro Shelter MDG Millennium Development Goals MFEM Ministry of Finance & Economic Management MMR Ministry of Marine Resources MOH Ministry of Health MOT Ministry of Transport MOW Ministry of Works MSL Mean Sea Level NBC National Building Code NDB Non-directional Beacon NDMO National Disaster Management Office NDRMC National Disaster Risk Management Council NDRMP National Disaster Risk Management Plan NED National Energy Division NEDS National Economic Development Strategy NES National Environment Service NGO Non Government Organization NIWA National Institute for Water and Atmospheric Research NSDP National Sustainable Development Plan NWS National Waste Strategy NZ New Zealand NZAID New Zealand Agency for International Development O&M Operations & Maintenance OHRD Office of Human Resources Development OI Outer Islands OICDU Outer Islands Infrastructure Development Unit OIDP Outer Islands Development Program OMIA Office of the Minister of Island Administration OPEX Operating Expenditure OPM Office of the Prime Minister PAB Project Adaptation Brief PCC Project Coordinating Committee PD Police Department PDU Project Development Unit PERCA Public Expenditure Review Committee and Audit PFL Pacific Forum Line PICCAP Pacific Islands Climate Change Assistance Program

iii
PIU Project Implementation Unit PMG Pitt Media Group PPP Public-Private Partnership PPU Policy and Planning Unit PSC Public Service Commission REAP Rarotonga Environmental Awareness Program RIC Rarotonga Island Council ROW Right-of-way SBST Single Bituminous Surface Treatment SLIS Survey and Land Information Service SOE State Owned Enterprises SOPAC South Pacific Islands Applied Geoscience Commission SPC South Pacific Commission SPCZ South Pacific Convergence Zone SRES Special Report on Emissions Scenarios TA Technical Assistance TAU Te Aponga Uira TCI Telecom Cook Islands TEU Twenty foot equivalent unit TNZ Telecom New Zealand TOR Terms of Reference TVNZ Television New Zealand UNDP United Nations Development Program VASIS Visual Approach Slope Indicator System VOR Variable Omni-range WDC Waste Disposal Center WHO World Health Organization WMD Waste Management Division WWD Water Works Division RWF Rarotonga Waste Facility
WEIGHTS AND MEASURES g Gram g/c.d Gram per capita per day (waste generation) Ha Hectares kL Kiloliter Km Kilometre km2 square kilometres L Liters L/c.d Liters per capita per day (water use) Kbs Kilobytes per second kg/c.d Kilogram per capita per day (waste generation) M Meters m2 square meters m3 Cubic meters Mg Milligram mg/L Milligram per liter (concentration) m/s meters per second Mm Millimetres oC degrees centigrade
NOTES: (i) The fiscal year (FY) of the Government of the Cook Islands ends on 30 June.
FY before a calendar year denotes the year in which the fiscal year ends, e.g., FY2006/2007 ends on 30 June 2007.

iv
ABSTRACT Recent studies have shown that the Cook Islands’ social infrastructure has limited preparedness against weather-related vulnerability. The inherent geographical vulnerability of the country to climate change can be ameliorated by initiating integrated infrastructure and social development, including human resources development. Consequently, there is a need for ‘climate proofing’ the country, i.e. to enhance the country’s adaptive capacity and resilience to climate change, both by the construction, operation and maintenance of suitably planned resilient infrastructure and by the development of strengthened capacities for this purpose and for disaster management and mitigation. The TA established a Preventive Master Plan that sets out the path to long term preparedness of the islands to respond to disaster by minimizing the potential harmful effects of future emergencies, and to climate change. Master Plan preparation began with an initial on-site assessment of infrastructure throughout the islands and a review of on-going plans and projects. A long list of infrastructure development needs was identified, which included projects already conceived and either planned or under construction; projects that answer principal needs as identified by the Government and Island Administrations; replacement of critical infrastructure; and, future infrastructure that will be needed to address the requirements arising from economic growth and climate change impacts. The TA used a four-pronged approach to set priorities and conceptualize the master plan, based on a top-down assessment of infrastructure requirements, a bottom-up assessment by islanders, the provision of agreed minimum level of service in each sector, and consideration of means of climate proofing. These were reinforced by means of infrastructure condition surveys, socio-economic development and demand forecasting, development of a climate risk profile, and extensive consultations. A series of workshops and consultations were undertaken throughout the TA to provide stakeholders with a direct input into the Master Planning process. Following project identification, broad cost estimates were applied, covering both capital and ongoing operation and maintenance costs. A multi-criteria analysis was carried out to broadly identify priority projects. An interactive ranking method was then applied to rank projects through dialogue with key stakeholders. Profiles of each project were prepared. Institutional and organizational considerations, for the governance, legal provision and policy frameworks for the delivery of essential basic services were assessed and recommendations developed. In order to address constraints faced by the government, an institutional strengthening strategy was developed that addressed the progressive development of well resourced agencies and pools of technical skills, utilizing, where appropriate, external resources through outsourcing, and special resource allocation to key agencies. Legal and regulatory provisions for climate proofing were also addressed by a review of the building code and legislative provisions governing planning and siting of infrastructure.

v
CONTENTS
Appendix 1: Risk Assessment for All Projects
Appendix 2: Project Profile Narratives & Project Identification
Appendix 3: Tabular Summary of Project Cost Estimates by Sector
Appendix 4: Tabular Summary of Projects by Island
Appendix 5: Project Profiles
Appendix 6: Multicriteria Prioritization Process
Appendix 7: Test Results for Project Prioritization Tool
Appendix 8: Report on Consultations
Appendix 9: Cost Data
Appendix 10: Engineering Data
Appendix 11: Island Inventory
Appendix 12: References


Appendix 1 1
RISK ASSESSMENT NEEDS FOR ALL PROJECTS
Project ID Project Name Climate Risk Assess
Air Transport Capital Works ATW01AIU Atiu Airport Improvement PAB Needed ATW02MGS Mangaia Airport Development PAB Needed ATW03MUK Mauke Airport Improvement PAB Needed ATW04MOI Mitiaro Airport Improvement PAB Needed ATW05MHX Manihiki Airport Improvement PAB Needed ATW06PYE Penrhyn Airport Improvement PAB Needed ATW07PZK Pukapuka Airport Improvement PAB Needed ATW08RAR Rarotonga Airport Passenger Terminal Improvements PAB Needed ATW09RAR Rarotonga Airport Cyclone Protection Works PAB Needed ATW10AIT Aitutaki Airport Improvement for International Operations PAB Needed Studies ATS01NAT National air transport strategy study No PAB Needed Marine Transport Capital Works MTW01AIU Atiu Harbor Repairs PAB Needed MTW02MGS Mangaia Harbor Reconstruction PAB Needed MTW03MUK Mauke Harbor Reconstruction PAB Needed MTW04MOI Mitiaro Harbor Reconstruction PAB Needed MTW05MHX Manihiki Harbors Reconstruction PAB Needed MTW06NAS Nassau Harbor Development PAB Needed MTW07PYE Penrhyn Harbor Rehabilitation PAB Needed MTW08PZK Pukapuka Jetty Development PAB Needed MTW09RAK Rakahanga Harbor Improvement PAB Needed MTW10RAR Avatiu Harbor Western Basin Development Completion PAB Needed MTW11RAR Avatiu Container Facilities Development PAB Needed MTW12RAR Avatiu Harbor Waterfront Development PAB Needed MTW13RAR Avatiu Harbor Expansion PAB Needed MTW14RAR Rarotonga North Coast Protection PAB Needed MTW15AIT Aitutaki Harbor Development PAB Needed Studies MTS01NAT National marine transport strategy study No PAB Needed Roads Capital Works RTW01RAR Rarotonga Road Safety Program No PAB Needed RTW02RAR Rarotonga Traffic Management Improvements No PAB Needed RTW03RAR Rarotonga Main Ring Road Rehabilitation PAB Needed RTW04RAR Rarotonga Inner Ring Road Development PAB Needed RTW05AIT Aitutaki Road Improvements PAB Needed RTW06NAT Outer Islands Road Improvement Program PAB Needed Water Supply Capital Works WSW01RAR Rarotonga distribution network rehabilitation PAB
Needed/Check

2 Appendix 1
Project ID Project Name Climate Risk Assess
WSW02RAR Installation of distribution system water meters on Rarotonga No PAB Needed
WSW03RAR Construction of Rarotonga water treatment facilities PAB Needed
WSW04RAR Supply and installation of property connection meters on Rarotonga No PAB Needed
WSW05RAR Rarotonga water loss reduction program No PAB Needed WSW06SGI Southern islands EMC water storages
rehabilitation/reconstruction PAB Needed WSW07AIT Aitutaki water supply headworks upgrade PAB Needed WSW08SGI Southern islands headworks pumps repair
and upgrade PAB Needed/Check
WSW09AIT Construction of Aitutaki water treatment plants PAB Needed
WSW10SGI Installation of water meters in distribution systems on the southern islands No PAB Needed
WSW11SGI Construction of disinfection facilities on each of the southern islands PAB Needed
WSW12SGI Installation of property service meters on the southern islands No PAB Needed
WSW13NGI Northern islands EMC water storages rehabilitation/construction PAB Needed
WSW14NGI Northern islands community rainwater catchment and storage refurbishment PAB Needed
WSW15NGI Supply and installation of household rainwater systems for the northern islands PAB Needed
WSW17MGS Mangaia water supply distribution system upgrade
PAB Needed/Check
WSW18AIU Atiu water supply system upgrade PAB Needed/Check
WSW19MUK Mauke water supply distribution system upgrade
PAB Needed/Check
WSW20MOI Mitiaro water supply system upgrade PAB Needed/Check
Studies WSS01RAR Rarotonga water loss study No PAB Needed WSS02NAT Development of national water supply
planning criteria and guidelines No PAB Needed WSS03RAR Rarotonga water supply treatment feasibility
study PAB Needed/Check
WSS04AIT Aitutaki water supply treatment feasibility study
PAB Needed/Check
WSS05SGI Southern Islands water supply tariff feasibility study No PAB Needed
WSW16PAL Palmerston water source augmentation pilot study
PAB Needed/Check
Sanitation Capital Works SNW01RAR Construction of Rarotonga village sewerage
networks – Stage 1 PAB Needed SNW02RAR Construction of Rarotonga village sewerage
networks – Stage 2 PAB Needed SNW03RAR Rehabilitation of Tereora/Tepuka
neighborhood sewerage system PAB Needed SNW05RAR Improvement of effluent disposal systems in
foreshore areas of Rarotonga PAB Needed SNW06AIT Construction of Aitutaki village sewerage
networks PAB Needed

Appendix 1 3
Project ID Project Name Climate Risk Assess
SNW08SGI Review adequacy and upgrade sanitation facilities at EMC on southern islands
PAB Needed/Check
SNW09SGI Construction of septage treatment facilities on each of the southern islands PAB Needed
SNW10NGI Review adequacy and upgrade sanitation facilities at EMC on northern islands
PAB Needed/Check
SNW12NGI Construction of septage treatment facilities on each of the northern islands PAB Needed
Studies SNS01RAR Rarotonga village sewerage schemes
feasibility study PAB Needed/Check
SNS02NAT Development of national sewerage planning criteria and guidelines No PAB Needed
SNS03NAT Development of national biosolids management plan No PAB Needed
SNS04AIT Aitutaki wastewater management feasibility study
PAB Needed/Check
SNW04RAR Rarotonga evapo-transpiration bed pilot study PAB Needed/Check
SNW07MUK Mauke composting toilet pilot study No PAB Needed SNW11PYE Penrhyn evapo-transpiration bed pilot study PAB
Needed/Check SNW13PZK Pukapuka residuals to soil conversion pilot
study PAB Needed/Check
Solid Waste Management Capital Works SWW01RAR Construction of Rarotonga solid waste
transfer station PAB Needed SWW02RAR Rarotonga hazardous waste handling
facilities upgrade PAB Needed SWW03RAR Construction of Rarotonga compost facilities PAB Needed SWW04NAT Outer islands hazardous waste collection
service PAB Needed SWW05SGI
Construction of new landfill sites on each of the southern islands PAB Needed
SWW06SGI Construction of compost facilities on southern islands
PAB Needed/Check
SWW08NGI Construction of compost facilities on northern islands
PAB Needed/Check
SWW09NGI Construction of new landfill sites on each of the northern islands PAB Needed
Studies
SWS01RAR Rarotonga waste collection review and transfers station feasibility study
PAB Needed/Check
SWS02NAT National medical waste disposal options study
PAB Needed/Check
SWS03AIT Aitutaki waste collection and separation efficiency improvement study No PAB Needed
SWS04NAT Outer islands hazardous and recyclable waste management study
PAB Needed/Check
SWW07PZK Pukapuka village composting and soil production pilot study No PAB Needed
Energy Capital Works ENW02PYE Exchange of Penrhyn generators No PAB Needed ENW03NAT Outer islands electrical wiring standardization
program No PAB Needed

4 Appendix 1
Project ID Project Name Climate Risk Assess
ENW04PZK Pukapuka electricity supply upgrade PAB Needed ENW05SGI Southern islands electricity supply systems
rehabilitation program PAB Needed/Check
ENW06NGI Northern islands electricity supply systems rehabilitation program
PAB Needed/Check
ENW07NGI Electricity supply system upgrades on Manihiki and Rakahanga
PAB Needed/Check
ENW08MGS Mangaia electricity supply system upgrade PAB Needed/Check
ENW09AIU Atiu electricity supply distribution system upgrade
PAB Needed/Check
ENW32AIT Aitutaki high voltage electricity supply distribution system upgrade
PAB Needed/Check
ENW16RAR Construction of second Rarotonga power station PAB Needed
Studies ENS01PZK Pukapuka solar power feasibility study PAB
Needed/Check Capital Works by TAU ENW10RAR Rarotonga ocean current pilot study PAB
Needed/Check ENW11RAR Rarotonga power station site improvements PAB
Needed/Check ENW12RAR Rarotonga power station generator engine
no. 8 replacement No PAB Needed ENW13RAR Rarotonga power station generator engine
no. 9 replacement No PAB Needed ENW14RAR Rarotonga power station generator no. 1
replacement No PAB Needed ENW15RAR Rarotonga power station generator no 2
replacement No PAB Needed ENW17RAR Rarotonga auxiliary plant upgrade No PAB Needed ENW18RAR Rarotonga high voltage system improvements No PAB Needed ENW19RAR Inave substation upgrade No PAB Needed ENW20RAR Rarotonga electricity system metering works No PAB Needed ENW21RAR Rarotonga high voltage equipment diagnostic
and condition assessment No PAB Needed ENW22RAR Rarotonga transformers replacement program No PAB Needed ENW23RAR Rarotonga field facilities and vehicle fleet
replacement program No PAB Needed ENW24RAR Rarotonga instrumentation and asset
management system upgrade No PAB Needed ENW25RAR Rarotonga electricity distribution mains
protection and isolation works No PAB Needed ENW26RAR Rarotonga substation low voltage boards
replacement No PAB Needed ENW27RAR Betela and Garnier substations upgrades No PAB Needed ENW28RAR Rarotonga high voltage cable replacement
program No PAB Needed ENW29RAR Rarotonga system maintenance works No PAB Needed ENW30RAR Rarotonga information technology equipment
upgrade No PAB Needed ENW31RAR Rarotonga administration system vehicle
replacement program No PAB Needed Telecommunications Capital Works by TCI

Appendix 1 5
Project ID Project Name Climate Risk Assess
TCW01NAT National high speed internet access installation on all islands No PAB Needed
TCW02SGI Rarotonga and Aitutaki limited international mobile roaming access service No PAB Needed
TCW03NAT Outer islands mobile phone network service on all islands No PAB Needed
TCW04NAT Install back up power supply on islands where power is less than 24 hours No PAB Needed
TCW05NAT Install alternate transmission source for Nassau, Palmerston, Rakahanga, Mitiaro No PAB Needed
Maintenance Facilities Capital Works MFW01SGI Modify and refurbish facilities and supply
tools on Mangaia, and Mitiaro PAB Needed/Check
MFW02NGI Modify and refurbish facilities on Penrhyn and Pukapuka
PAB Needed/Check
MFW03SGI Build new facilities and supply tools for Aitutaki, Atiu and Mauke
PAB Needed/Check
MFW04NGI Build new facilities and supply tools Rakahanga, Palmerston and Nassau
PAB Needed/Check
MFW05NGI Construct Northern Group regional facility for repair of plant and machinery
PAB Needed/Check
Emergency Management Centers Capital Works EMW01SGI Refurbish existing facilities on Rarotonga PAB
Needed/Check EMW02NGI Modify and refurbish existing facilities on
southern islands PAB Needed/Check
EMW03SGI Complete repair works on Manihiki facilities PAB Needed/Check
EMW04NGI Construct and furnish new evacuation management centers on northern islands PAB Needed
LEGEND: PAB - Project Adaptation Brief - a detailed climate risk assessment No PAB Needed identifies no detailed assessment required PAB Needed identifies that a detailed assessment should be undertaken


Appendix 2 1
I. PROJECT PROFILE NARRATIVES & PROJECT IDENTIFICATION
1. Once projects have been identified for each sector, a project profile must be created. This profile will provide information to the focal group assessor relating to the scope of the project enabling the assessor to rate the project.
2. It is essential that the profiles provide all relevant information pertaining to the project and, where relevant, should give extra information that may affect the assessor’s decision when prioritizing projects. For example, the fact that Penrhyn Island is a port of entry to the Cook Islands (something which some individuals may not be aware of) should be mentioned on the project profile. A template and narrative providing an example of the content and form of information needed for the Project Profile sheets is given in Table 1.
Table 1: Example Project Profile Template
Project Profile NARRATIVE ONLY Project ID: Sector: Air transport, marine transport, road transport, water supply,
sanitation, solid waste management, energy, telecommunication, government buildings, education, health, agriculture, fisheries, marine resources, police, O&M facilities, evacuation management centres. For initial coding of project ID number see end of document.
Name: Name of project
Island: Name of Island
Location: Name of village
Background/Rationale: Brief description of the rationale for the project and background if necessary. Highlight any prerequisite actions and indicate urgency for project as appropriate. Add reference document for project where applicable.
Objective: What is the aim of the project?
Scope of works: Description of the scope of works of the project outlining key activities
Features: Description of the key attributes and outcomes/benefits of the project to assist with the prioritization of national infrastructure projects. The features should address also the prioritization criteria and note whether some form of revenue generation would be possible if say tariffs were introduced at some stage in the future
Estimated Beneficiaries:
An estimate of the number of people who may benefit from the project.
Environmental Category:
ADB Category: A – Project with significant adverse environmental impact requiring an EIA to be conducted. B – Project has some environmental impact but of lesser degree and/or significance than Cat. A, requiring an initial environmental examination (IEE) in order to determine whether an EIA is needed. If an EIA is not needed then the IEE is the final document. C – Project unlikely to have adverse environmental impact. No EIA or IEE is required, although environmental implications are still reviewed.
Provide brief description of the adverse and beneficial environmental impacts including social effects if any.
Land Requirement: Details of land acquisition needs including size of area, location and ownership

2 Appendix 2
Climate change adaptation needs:
Describe the incremental works, if any, needed for public safety and to provide protection of the infrastructure under projected changes in climatic conditions.
Project cost estimate: Capital Cost Estimate: insert estimated capital cost of project. Add, if applicable, note on end value of estimated incremental cost of climate change adaptation works included in capital cost above. Operating Costs: insert estimate of annual operation and maintenance costs to run the facilities
Implementation options:
What are the options for construction/implementation of the project? Could it be done by the public or/and private sector? What are the options for carrying out the operation and maintenance? Could it be outsourced to the private sector or should it be done internally?
Profile Created: Insert date the project profile was created Current Version: Insert date of the last update
Project Tracking
Last updated: insert date Project Preparation Status Project Identification:
Title and date of inception report or when field inspection was carried out to identify project. If not yet done, state what is required. Include cross reference to AMD project ID.
Stakeholder consultations:
What consultations are required and have any been conducted?
Feasibility study: Title and date of feasibility report or what is expected start date of feasibility study, if known.
Engineering design: Date of detailed engineering design or expected date if known. If design is not needed, details of field inspection requirements
Land acquisition: Status of procurement if land acquisition is required
Environmental assessment:
Status of implementation if an EIA or IEE is required. Date of completion if done.
Procurement: Status of procurement
Construction: Status of construction or supply and installation
Budget allocation for O&M:
Has a budget been allocated for operation and maintenance of the project for the next 12 months?
Project Implementation Status Funding Source: CIGOV national budget or loan, or donor agency
Implementation Arrangements:
Which agency will be primarily responsible for: 1) Coordination/Execution of the project? This is at the highest level 2. Implementation of the project? Signing and administering the contract. Note also whether work is likely to be outsourced by implementing agency.
Contracting Method:
How will project be implemented? – Direct purchase; national or international shopping; national competitive bidding, international competitive bidding. State also contracting method - conventional (separate design, then construction); design and construction (turnkey) or various forms of build own operate. Identify/Nominate agency for contract administration and construction supervision.
O&M Responsibility:
Identify which agency will be responsible for operation and maintenance of the facilities after commissioning?

Appendix 2 3
Risk assessment: Identify potential risks to the project failing during implementation and importantly post commissioning (e.g. lack of adequate O&M budgets)
Implementation schedule:
Start: Date or fiscal year if known Completion: Date or fiscal year if known
Current Status: What is the current status of implementation?
3. Each of the projects has been allocated project identification codes. These are alpha-numeric codes developed for each sector. An example of the 8 digit code is ‘ATW03RAR.’ The rationale behind the composition of each alpha-numeric project codes is explained in Table 2.
Table 2: Composition of Alpha-Numeric Project Code
Fields 1-2: Alpha characters for the sector:
Code Sector Code Sector AG Agriculture MF Maintenance facilities AT Air transport MR Marine resources ED Education MT Marine transport EM Evacuation management
centres PO Police
EN Energy RT Road transport EV Environment SN Sanitation FS Fisheries SW Solid waste GB Government buildings TC Telecommunication HE Health WS Water supply
Field 3: Single alpha character W Capital works S Studies
Fields 4-5: Project number Consecutive numbering within sector Fields 6-8: Island code Code Island Code Island
NAT National level projects RAR Rarotonga NGI Northern Group Islands SGI Southern Group Islands PAL Palmerston AIT Aitutaki PZK Pukapuka MGS Mangaia NAS Nassau AIU Atiu MHX Manihiki MUK Mauke RAK Rakahanga MOI Mitiaro PYE Penrhyn MAN Manuae SUW Suwarrow TAK Takutea


Appendix 3 1
I. TABULAR SUMMARY OF PROJECT COST ESTIMATES BY SECTOR
1. In the table below, all projects and associated estimated costs have been tabulated by sector. Cost estimates have been provided for both capital and operating costs. Note that Table 3 includes capital works projects only. It also includes projects which have been approved for implementation by the Government but for which funding is pending the release of the budget for Fiscal Year 2006/07.
Cost Estimates for Projects by Sector Cost Estimates (NZ$ millions)
Capital Cost Annual
Operating CostProject ID Project Name
$M % $M % AIR TRANSPORT ATW01AIU Atiu Airport Improvement 0.8 2% 0.08 14% ATW02MGS Mangaia Airport Development 5.0 16% 0.08 14% ATW03MUK Mauke Airport Improvement 0.8 2% 0.08 14% ATW04MOI Mitiaro Airport Improvement 0.8 2% 0.08 14% ATW05MHX Manihiki Airport Improvement 0.8 2% 0.08 14% ATW06PYE Penrhyn Airport Improvement 0.8 2% 0.08 14% ATW07PZK Pukapuka Airport Improvement 0.8 2% 0.08 14% ATW08RAR Rarotonga Airport Passenger Terminal Improvement 3.5 11% 0.00 0% ATW09RAR Rarotonga Airport Cyclone Protection Works 5.0 16% 0.00 0% ATW10AIT Aitutaki Airport Improvement for International
Operations 13.0 42% 0.00 0% TOTAL PROJECT COST FOR
AIR TRANSPORT SECTOR 31.0 100% 0.5 100%MARINE TRANSPORT MTW01AIU Atiu Harbour Repairs 0.2 0% 0.08 10% MTW02MGS Mangaia Harbour Reconstruction 2.2 4% 0.08 10% MTW03MUK Mauke Harbour Reconstruction 1.8 3% 0.08 10% MTW04MOI Mitiaro Harbour Reconstruction 2.5 4% 0.08 10% MTW05MHX Manihiki Harbours Reconstruction 2.4 4% 0.13 17% MTW06NAS Nassau Harbour Development 0.3 1% 0.08 10% MTW07PYE Penrhyn Harbour Rehabilitation 0.9 1% 0.08 10% MTW08PZK Pukapuka Jetty Development 0.3 0% 0.08 10% MTW09RAK Rakahanga Harbour Improvement 0.0 0% 0.08 10% MTW10RAR Avatiu Harbour Western Basin Development
Completion 2.0 3% 0.00 0% MTW11RAR Avatiu Container Facilities Development 3.5 6% 0.00 0% MTW12RAR Avatiu Harbour Waterfront Development 1.5 2% 0.00 0% MTW13RAR Avatiu Harbour Expansion 20.0 32% 0.00 0% MTW14RAR Avarua Waterfront Protection 20.0 32% 0.00 0% MTW15AIT Aitutaki Harbour Development 5.0 8% 0.00 0%
TOTAL PROJECT COST FOR MARINE TRANSPORT SECTOR 62.6 100% 0.73 100%
ROAD TRANSPORT RTW01RAR Rarotonga Road Safety Program 0.9 2% 0.08 10% RTW02RAR Rarotonga Traffic Management Improvements 0.3 1% 0.05 6% RTW03RAR Rarotonga Main Ring Road Rehabilitation 30.0 59% 0.31 40% RTW04RAR Rarotonga Inner Ring Road Development 12.0 24% 0.04 4% RTW05AIT Aitutaki Road Improvements 3.3 6% 0.20 25% RTW06NAT Outer Islands Road Improvement Program 2.4 5% 0.10 13% RTW07RAR Inner Ring Road Improvement Nikao-Takuvaine 2.0 4% 0.02 2%
TOTAL PROJECT COST FOR ROAD TRANSPORT SECTOR 50.8 100% 0.78 100%

2 Appendix 3
Cost Estimates (NZ$ millions)
Capital Cost Annual
Operating CostProject ID Project Name
$M % $M % WATER SUPPLY WSW01RAR Rarotonga distribution network rehabilitation 3.0 13% 0.15 14% WSW02RAR Installation of distribution system isolation valves on
Rarotonga 0.2 1% 0.01 1% WSW03RAR Construction of Rarotonga water treatment facilities 7.0 30% 0.40 37% WSW04RAR Supply and installation of property connection meters
on Rarotonga 1.2 5% 0.04 4% WSW05RAR Rarotonga water loss reduction program 0.5 2% 0.04 4% WSW06SGI Southern islands EMC water storages
rehabilitation/reconstruction 0.1 0% 0.02 2% WSW07AIT Aitutaki water supply headworks upgrade 0.4 1% 0.01 1% WSW08AIT Construction of Aitutaki water treatment plants 1.5 6% 0.20 19% WSW09SGI Construction of disinfection facilities on the southern
islands 0.2 1% 0.02 2% WSW10SGI Installation of property service meters on the southern
islands 0.5 2% 0.04 4% WSW11NGI Northern islands EMC water storages
rehabilitation/construction 0.1 0% 0.03 3% WSW12NGI Northern islands community rainwater catchment &
storage refurbishment 0.2 1% 0.01 1% WSW13NGI Supply and installation of household rainwater
systems for northern islands 1.2 5% 0.00 0% WSW14MGS Mangaia water supply distribution system upgrade 1.8 8% 0.04 4% WSW15AIU Atiu water supply system upgrade 0.5 2% 0.02 2% WSW16MUK Mauke water supply distribution system upgrade 1.1 5% 0.02 2% WSW17MOI Mitiaro water supply system upgrade 0.8 3% 0.02 2% ** Replacement of old sections of the distribution sub-
main on Rarotonga 3.2 13% 0% TOTAL PROJECT COST FOR
WATER SUPPLY SECTOR 23.5 100% 1.07 100%SANITATION SNW01RAR Construction of Rarotonga village sewerage networks
– Stage 1 4.5 41% 0.24 41% SNW02RAR Construction of Rarotonga village sewerage networks
– Stage 2 2.0 18% 0.15 25% SNW03RAR Rehabilitation of Tereora/Tepuka neighborhood
sewerage system 0.3 3% 0.03 5% SNW04RAR Improvement of effluent disposal systems in
foreshore areas of Rarotonga 0.0 0% 0.00 0% SNW05AIT Construction of Aitutaki village sewerage networks 3.5 32% 0.08 14% SNW06SGI Review adequacy and upgrade sanitation facilities at
EMC on southern islands 0.3 2% 0.02 3% SNW07SGI Construction of septage treatment facilities on the
southern islands 0.1 1% 0.02 3% SNW08NGI Review adequacy and upgrade sanitation facilities at
EMC on northern islands 0.2 2% 0.02 3% SNW09NGI Construction of septage treatment facilities on the
northern islands 0.2 1% 0.03 5% TOTAL PROJECT COST FOR
SANITATION SECTOR 11.0 1.0 0.59 1.0

Appendix 3 3
Cost Estimates (NZ$ millions)
Capital Cost Annual
Operating CostProject ID Project Name
$M % $M % SOLID WASTE SWW01RAR Construction of Rarotonga solid waste transfer station 0.5 17% 0.03 13% SWW02RAR Rarotonga hazardous waste handling facilities
upgrade 0.5 17% 0.05 22% SWW03RAR Construction of Rarotonga compost facilities 0.5 17% 0.05 22% SWW04SGI Construction of new landfill sites on the southern
islands 0.6 21% 0.04 17% SWW05NGI Construction of new landfill sites on the northern
islands 0.8 28% 0.06 26% TOTAL PROJECT COST FOR
SOLID WASTE SECTOR 2.9 100% 0.2 100%ENERGY ENW01PYE Exchange of Penrhyn generators 0.0 0% 0% ENW02NAT Outer islands electrical wiring standardisation
program 0.2 0% 0.01 0% ENW03PZK Pukapuka electricity supply upgrade 2.5 6% 0% ENW04SGI Southern islands electricity supply systems
rehabilitation program 1.2 3% 0.17 7% ENW05NGI Northern islands electricity supply systems
rehabilitation program 1.0 2% 0.18 8% ENW06NGI Electricity supply system upgrades on Manihiki and
Rakahanga 0.8 2% 0.11 5% ENW07MGS Mangaia electricity supply distribution system
upgrade 0.4 1% 0.06 3% ENW08AIU Atiu electricity supply distribution system upgrade 1.2 3% 0.17 7% ENW09AIT Aitutaki high voltage electricity supply distribution
system upgrade 1.5 3% 0.20 8% ENW10RAR Construction of second Rarotonga power station 35.0 78% 1.50 63% ** Aitutaki electricity generator replacement 0.9 2% 0% ** Rakahanga stand-by generator repair 0.0 0% 0% ** Rakahanga wind power generator erection 0.1 0% 0%
TOTAL PROJECT COST FOR ENERGY SECTOR 44.8 100% 2.40 100%
MAINTENANCE FACILITIES MFW01SGI Modify and refurbish facilities and supply tools on
Mangaia, and Mitiaro 0.3 15% 0.10 17% MFW02NGI Modify and refurbish facilities on Penrhyn and
Pukapuka 0.3 15% 0.10 17% MFW03SGI Build new facilities and supply tools for Aitutaki, Atiu
and Mauke 0.6 32% 0.16 27% MFW04NGI Build new facilities and supply tools Rakahanga,
Palmerston and Nassau 0.5 27% 0.15 25% MFW05NGI Construct Northern Group regional facility for repair of
plant and machinery 0.2 11% 0.08 14% TOTAL PROJECT COST FOR
MAINTENANCE FACILITIES 1.8 100% 0.59 100%EVACUATION MANAGEMENT CENTRES EMW01RAR Refurbish existing facilities on Rarotonga 0.9 10% 0.06 18% EMW02SGI Modify and refurbish existing facilities on southern
islands 1.7 19% 0.19 56% EMW03MHX Complete repair works on Manihiki facilities 0.4 4% 0.02 6% EMW04NGI Construct and furnish new EMC on northern islands 6.1 66% 0.07 21%
TOTAL PROJECT COST FOR EVACUATION MANAGEMENT CENTRES 9.1 100% 0.34 100%
TOTAL ESTIMATED PROJECT COSTS BY SECTOR 237.5 7.25 ** Projects which have already been approved and funding is pending FY2006/07 budget release


Appendix 4 1
I. TABULAR SUMMARY 0F PROJECTS BY ISLAND
1. In the table below, all projects and associated cost estimates have been regrouped by island. Again, cost estimates have been provided for both capital and operating costs.
Cost Estimates for Projects by Island
Cost Estimates (NZ$ millions)
Capital Cost Operating
Cost Project ID Project Name
$M % $M % RAROTONGA ATW08RAR Rarotonga Airport Passenger Terminal Improvement 3.5 2% 0.00 0% ATW09RAR Rarotonga Airport Cyclone Protection Works 5.0 3% 0.00 0%
MTW10RAR Avatiu Harbour Western Basin Development Completion 2.0 1% 0.00 0%
MTW11RAR Avatiu Container Facilities Development 3.5 2% 0.00 0% MTW12RAR Avatiu Harbour Waterfront Development 1.5 1% 0.00 0% MTW13RAR Avatiu Harbour Expansion 20.0 13% 0.00 0% MTW14RAR Avarua Waterfront Protection 20.0 13% 0.00 0% RTW01RAR Rarotonga Road Safety Program 0.9 1% 0.08 2% RTW02RAR Rarotonga Traffic Management Improvements 0.3 0% 0.05 2% RTW03RAR Rarotonga Main Ring Road Rehabilitation 30.0 19% 0.31 10% RTW04RAR Rarotonga Inner Ring Road Development 12.0 8% 0.04 1% RTW07RAR Inner Ring Road Improvement Nikao-Takuvaine 2.0 1% 0.02 0% WSW01RAR Rarotonga distribution network rehabilitation 3.0 2% 0.15 5%
WSW02RAR Installation of distribution system isolation valves on Rarotonga 0.2 0% 0.01 0%
WSW03RAR Construction of Rarotonga water treatment facilities 7.0 4% 0.40 12%
WSW04RAR Supply and installation of property connection meters on Rarotonga 1.2 1% 0.04 1%
WSW05RAR Rarotonga water loss reduction program 0.5 0% 0.04 1%
Replacement of old sections of the distribution sub-main on Rarotonga 3.2 2% 0%
SNW01RAR Construction of Rarotonga village sewerage networks – Stage 1 4.5 3% 0.24 7%
SNW02RAR Construction of Rarotonga village sewerage networks – Stage 2 2.0 1% 0.15 5%
SNW03RAR Rehabilitation of Tereora/Tepuka neighborhood sewerage system 0.3 0% 0.03 1%
SNW05RAR Improvement of effluent disposal systems in foreshore areas of Rarotonga 0.0 0% 0.00 0%
SWW01RAR Construction of Rarotonga solid waste transfer station 0.5 0% 0.03 1% SWW02RAR Rarotonga hazardous waste handling facilities
upgrade 0.5 0% 0.05 2% SWW03RAR Construction of Rarotonga compost facilities 0.5 0% 0.05 2% ENW16RAR Construction of second Rarotonga power station 35.0 22% 1.50 46% EMW01RAR Refurbish existing facilities on Rarotonga 0.9 1% 0.06 2%
TOTAL PROJECT COST FOR RAROTONGA 159.9 100% 3.24 100%

2 Appendix 4
Cost Estimates (NZ$ millions) Capital Cost Operating Cost Project ID Project Name $M % $M %
AITUTAKI
ATW10AIT Aitutaki Airport Improvement for International Operations 13.0 45% 0.00 0%
MTW15AIT Aitutaki Harbour Development 5.0 17% 0.00 0% RTW05AIT Aitutaki Road Improvements 3.3 11% 0.20 29% WSW07AIT Aitutaki water supply headworks upgrade 0.4 1% 0.01 1% WSW09AIT Construction of Aitutaki water treatment plants 1.5 5% 0.20 29% SNW06AIT Construction of Aitutaki village sewerage networks 3.5 12% 0.08 12% ENW32AIT Aitutaki high voltage electricity supply distribution
system upgrade 1.5 5% 0.20 29% Aitutaki electricity generator replacement 0.9 3% 0%
TOTAL PROJECT COST FOR AITUTAKI 29.1 100% 0.69 100%MANGAIA ATW02MGS Mangaia Airport Development 5.0 53% 0.08 30% MTW02MGS Mangaia Harbour Reconstruction 2.2 23% 0.08 30% WSW17MGS Mangaia water supply distribution system upgrade 1.8 19% 0.04 16% ENW08MGS Mangaia electricity supply system upgrade 0.4 4% 0.06 24%
TOTAL PROJECT COST FOR MANGAIA 9.4 100% 0.25 100%ATIU ATW01AIU Atiu Airport Improvement 0.8 29% 0.08 22% MTW01AIU Atiu Harbour Repairs 0.2 6% 0.08 22% WSW18AIU Atiu water supply system upgrade 0.5 19% 0.02 6% ENW09AIU Atiu electricity supply distribution system upgrade 1.2 46% 0.17 50%
TOTAL PROJECT COST FOR ATIU 2.6 100% 0.34 100%MAUKE ATW03MUK Mauke Airport Improvement 0.8 20% 0.08 44% MTW03MUK Mauke Harbour Reconstruction 1.8 49% 0.08 44% WSW19MUK Mauke water supply distribution system upgrade 1.1 31% 0.02 12%
TOTAL PROJECT COST FOR MAUKE 3.7 100% 0.17 100%MITIARO ATW04MOI Mitiaro Airport Improvement 0.8 19% 0.08 44% MTW04MOI Mitiaro Harbour Reconstruction 2.5 62% 0.08 44% WSW20MOI Mitiaro water supply system upgrade 0.8 20% 0.02 12%
TOTAL PROJECT COST FOR MITIARO 4.1 100% 0.17 100%PUKAPUKA ATW07PZK Pukapuka Airport Improvement 0.8 21% 0.08 50% MTW08PZK Pukapuka Jetty Development 0.3 8% 0.08 50% ENW04PZK Pukapuka electricity supply upgrade 2.5 71% 0%
TOTAL PROJECT COST FOR PUKAPUKA 3.5 100% 0.2 100%NASSAU MTW06NAS Nassau Harbour Development 0.3 100% 0.08 100%
TOTAL PROJECT COST FOR NASSAU 0.3 100% 0.1 100%MANIHIKI ATW05MHX Manihiki Airport Improvement 0.8 21% 0.08 34% MTW05MHX Manihiki Harbours Reconstruction 2.4 68% 0.13 57% EMW03MHX Complete repair works on Manihiki facilities 0.4 11% 0.02 9%
TOTAL PROJECT COST FOR MANIHIKI 3.5 100% 0.2 100%RAKAHANGA MTW09RAK Rakahanga Harbour Improvement 0.03 28% 0.08 100% Rakahanga stand-by generator repair 0.03 27% 0% Rakahanga wind power generator erection 0.05 45% 0%
TOTAL PROJECT COST FOR RAKAHANGA 0.11 100% 0.08 100%

Appendix 4 3
Cost Estimates (NZ$ millions) Capital Cost Operating Cost Project ID Project Name $M % $M %
PENRHYN ATW06PYE Penrhyn Airport Improvement 0.8 44% 0.08 50% MTW07PYE Penrhyn Harbour Rehabilitation 0.9 54% 0.08 50% ENW02PYE Exchange of Penrhyn generators 0.0 2% 0%
TOTAL PROJECT COST FOR PENRHYN 1.7 100% 0.15 100%NATIONAL RTW06NAT Outer Islands Road Improvement Program 2.4 92% 0.10 91% ENW03NAT Outer islands electrical wiring standardisation program 0.2 8% 0.01 9%
TOTAL PROJECT COST NATIONAL 2.6 100% 0.11 100%SOUTHERN GROUP ISLANDS
WSW06SGI Southern islands EMC water storages rehabilitation/reconstruction 0.1 2% 0.02 3%
WSW11SGI Construction of disinfection facilities on the southern islands 0.2 4% 0.02 3%
WSW12SGI Installation of property service meters on the southern islands 0.5 9% 0.04 5%
SNW08SGI Review adequacy & upgrade sanitation facilities at EMC on southern islands 0.3 5% 0.02 3%
SNW09SGI Construction of septage treatment facilities on the southern islands 0.1 2% 0.02 3%
SWW05SGI Construction of new landfill sites on the southern islands 0.6 11% 0.04 5%
ENW05SGI Southern islands electricity supply systems rehabilitation program 1.2 22% 0.17 22%
MFW01SGI Modify and refurbish facilities and supply tools on Mangaia, and Mitiaro 0.3 5% 0.10 13%
MFW03SGI Build new facilities and supply tools for Aitutaki, Atiu and Mauke 0.6 10% 0.16 21%
EMW02SGI Modify and refurbish existing facilities on southern islands 1.7 31% 0.19 24%
TOTAL PROJECT COST FOR SOUTHERN
GROUP ISLANDS 5.5 100% 0.78 100%NORTHERN GROUP ISLANDS
WSW13NGI Northern islands EMC water storages rehabilitation/construction 0.1 1% 0.03 4%
WSW14NGI Northern islands community rainwater catchment & storage refurbishment 0.2 2% 0.01 1%
WSW15NGI Supply and installation of household rainwater systems for northern islands 1.2 10% 0.00 0%
SNW10NGI Review adequacy & upgrade sanitation facilities at EMC on northern islands 0.2 2% 0.02 2%
SNW12NGI Construction of septage treatment facilities on the northern islands 0.2 1% 0.03 4%
SWW09NGI Construction of new landfill sites on the northern islands 0.8 7% 0.06 7%
ENW06NGI Northern islands electricity supply systems rehabilitation program 1.0 9% 0.18 21%
ENW07NGI Electricity supply system upgrades on Manihiki and Rakahanga 0.8 7% 0.11 13%
MFW02NGI Modify and refurbish facilities on Penrhyn and Pukapuka 0.3 2% 0.10 12%
MFW04NGI Build new facilities and supply tools Rakahanga, Palmerston and Nassau 0.5 4% 0.15 18%
MFW05NGI Construct Northern Group regional facility for repair of plant and machinery 0.2 2% 0.08 10%
EMW04NGI Construct and furnish new EMC on northern islands 6.1 53% 0.07 8%
TOTAL PROJECT COST FOR NORTHERN
GROUP ISLANDS 11.5 100% 0.84 100%TOTAL ESTIMATED PROJECT COSTS BY ISLAND 237.5 7.25


Appendix 5 1
I. PROJECT PROFILES
1. Project Profiles for 111 projects have been compiled and are included here. They have been compiled on a sector basis and include 82 capital works projects and 5 studies for funding through the Government either from the annual budgets, loans or grants from donor agencies. In addition, profiles have been included for 20 energy projects to be funded from Te Aponga Uira’s (TAU) capital expenditure budget and for 4 projects to be funded from Telecom Cook Island’s (TCI) capital expenditure budgets.

2 Appendix 5
Project Profile
Project ID: ATW01AIU Sector: Air Transport Name: Atiu Airport Improvement Island: Atiu Location: Atiu Airport Background/Rationale: Air Rarotonga serves Atiu from Rarotonga directly and through Aitutaki
with the Banderante aircraft. Atiu is attracting tourism but traffic between Aitutaki and Atiu is constrained by the seating capacity of the Banderante. Air Rarotonga wishes to operate the Saab 340 on this route provided Atiu is improved sufficiently to be certified under Civil Aviation Rules Part 139 governing airports with regular air services by aircraft with 30 seats or more.
Objective: Improve the airport sufficient to obtain certification for Saab 340 scheduled services under Part 139.
Description of Works: Land survey of airport and environs to identify topography, physical features, land ownership and structures. Airport zoning study to determine of obstacle clearance surfaces and identify all obstacles requiring removal. Negotiations with landowners for removal of obstacles. Engineering design of airport improvements and preparation of contract documents. Works are expected to include clearance of obstacles, grading of runway strip, re-profiling and compaction of 1200m coral runway pavement, airfield drainage, runway markings, secure aviation fuel storage, security fencing where required, and supply of rescue and fire fighting equipment.
Features: Saab 340 service will increase passenger and cargo capacity and the increased utilization will reduce unit operating costs. Increased capacity and operating cost savings will increase passenger and cargo traffic, improve opportunities for economic development, reduce isolation and possibly reverse depopulation. Saab 340 service connection with Aitutaki will increase tourism activity in Atiu. Airport improvements will suffice for larger turboprop aircraft such as Bombardier Q400 and ATR42 in future.
Estimated Beneficiaries: Population of Atiu 623 (2001 census) Environmental Category: ADB category C: no significant impacts provided effective engineering
design and construction standards are observed. Land Requirement: Runway strip, end zones and obstacle clearance areas will require
purchase or lease or control of land use and height of structures and trees. Estimated 12 ha involved.
Climate Change Adaptation Needs:
Protection of fuel storage and buildings. Adequate drainage for high rainfall events.
Project Cost Estimate: Capital Cost Estimate: Low estimate $0.75 million excluding land cost using construction management and direct labour. High estimate $2.0 million with land and conventional contracting Annual O&M Cost Estimate: $75,000
Implementation Options: Implementing agency for construction has not been decided. When completed CIAA will take over O&M responsibility.

Appendix 5 3
Project Tracking Project Preparation Status Project Identification: MOT-OMIA-CIAA-Air Rarotonga completed reconnaissance in May
2006 and prepared scope of works and cost estimate. Follow-up reconnaissance by combined AMD-NZAID-GHD Consultants-ADB Master Plan Consultants team in August 2006 confirmed requirement for project.
Stakeholder Consultations:
MOT-OMIA-CIAA-Air Rarotonga team held consultations with Island Council and landowners. AMD-NZAID-GHD-ADB team held consultations with Island Council and Air Rarotonga.
Feasibility Study: Initial inspection completed. Preliminary quantities and cost estimates being prepared by GHD Consultants for AMD and NZAID.
Engineering Design: None Land Acquisition: None Environmental Assessment:
None
Procurement: None Construction: None Budget Allocation for O&M:
None
Project Implementation Status Funding Source: NZAID is considering funding but no commitment or decision has been
made. Implementation Arrangements:
CIAA will take over management of the airport after completion but responsibility for survey, engineering and construction has not been determined.
Contracting Method: Conventional tender through local competitive bidding to MFEM guidelines. Contract administration and construction supervision by implementing agency. Options of construction management with direct labour versus contractor are being considered.
O&M Responsibility: Airport will be handed over to CIAA which will enter into an agreement with Atiu Island Administration for O&M
Risk Assessment: Technical risk associated with engineering design is negligible. Negotiations with landowners could delay start of construction significantly. Risks associated with construction quality, cost and schedule are substantial and effective project management and quality management will be required. Risk of O&M requirements failing to be achieved is high unless effective delivery and inspection systems are put into place. Risk of traffic not materializing, air services being cut back and benefits not realized is low.
Implementation Schedule:
None
Current Status: None Profile Created: 18 October 2006 Current Version: 18 October 2006

4 Appendix 5
Project Profile
Project ID: ATW02MGS Sector: Air Transport Name: Mangaia Airport Development Island: Mangaia Location: Mangaia Airport Background/Rationale: Air Rarotonga provides scheduled service to Mangaia with the
Banderante aircraft. After Aitutaki and Atiu, Mangaia has the most air passenger traffic (5800 arriving and departing passengers in 2005 vs. 6400 for Atiu) and has significant tourism potential. However, the existing 950m runway is too short for the Saab 340 and it cannot be extended due to its position on the Makatea plateau. It is possible to construct a new longer runway at another location on Mangaia.
Objective: Develop a new airport with a 1500m runway under Part 139 to enable regular Saab 340 service and possibly larger turboprop aircraft in future. If infeasible, then rehabilitate existing runway for Banderante service.
Description of Works: Land survey of new airport environs to determine topography, physical features, obstacles, other hazards and land ownership. Engineering design of all airport works and preparation of contract documents. Works are expected to include clearance of runway strip, obstacles, grading of runway strip, construction of coral runway and apron, airfield drainage, runway markings, windsock and obstacle markings and secure aviation fuel storage.
Features: New airport will increase air safety. Improvements will reduce aircraft operating costs and provide Air Rarotonga with incentive to increase Banderante service frequencies and offer more Saab 340 flights. Improvements will facilitate emergency and rescue flights.
Estimated Beneficiaries: Population of Mangaia 744 (2001 census) Environmental Category: ADB category A: Significant impacts requiring a detailed environmental
impact assessment. Land Requirement: Estimate 12-15 ha required for new site plus control of obstacles on
adjoining lands. Climate Change Adaptation Needs:
Protection of fuel storage and buildings. Adequate drainage for high rainfall events.
Project Cost Estimate: Capital Cost Estimate: $5 million Annual O&M Cost Estimate: $ 75,000
Implementation Options: Implementing agency for construction has not been decided. When completed CIAA will take over O&M responsibility.

Appendix 5 5
Project Tracking Project Preparation Status Project Identification: Identified in Mangaia Strategic Plan 2000-2005. Reconnaissance by
GHD Consultants in May 2006. Stakeholder Consultations:
ADB Consultant and GHD held consultations with Air Rarotonga in September 2006.
Feasibility Study: None Engineering Design: None Land Acquisition: None Environmental Assessment:
None
Procurement: None Construction: None Budget Allocation for O&M:
None
Project Implementation Status Funding Source: None Implementation Arrangements:
CIAA will take over management of the airport after completion but responsibility for survey, engineering and construction has not been determined.
Contracting Method: Conventional tender through local competitive bidding to MFEM guidelines. Contract administration and construction supervision by implementing agency. Option of construction management with direct labour for rehabilitating existing runway is possible.
O&M Responsibility: Airport will be handed over to CIAA which will enter into an agreement with Mangaia Island Administration for O&M
Risk Assessment: Technical risk associated with engineering design is negligible. Risks associated with construction quality, cost and schedule are low provided effective project management and quality management are provided. Risk of O&M requirements failing to be achieved is high unless effective delivery and inspection systems are put into place. Risk of traffic not materializing, air services being cut back and benefits not realized is moderate.
Implementation Schedule:
None
Current Status: None
Profile Created: 18 October 2006 Current Version: 18 October 2006

6 Appendix 5
Project Profile
Project ID: ATW03MUK Sector: Air Transport Name: Mauke Airport Improvement Island: Mauke Location: Mauke Airport Background/Rationale: Air Rarotonga provides scheduled service to Mauke with the
Banderante aircraft. Occasionally, Air Rarotonga will operate a charter using the Saab 340.
Objective: Improve the airport sufficient to obtain certification for Saab 340 scheduled services under Part 139.
Description of Works: Land survey of airport to identify runway dimensions, topography, physical features, obstacles, other hazards and land ownership. Engineering design of runway works and other essential improvements and preparation of contract documents. Works are expected to include clearance of obstacles, grading of runway strip, re-profiling and compaction of 1200m coral runway pavement, airfield drainage, runway markings, windsock and obstacle markings and secure aviation fuel storage.
Features: Improvements will increase air safety. Improvements will reduce aircraft operating costs and provide Air Rarotonga with incentive to increase Banderante service frequencies and offer more Saab 340 flights. Improvements will facilitate emergency and rescue flights.
Estimated Beneficiaries: Population of Mauke 470 (2001 census). Environmental Category: ADB category C: no significant impacts provided effective
engineering design and construction standards are observed. Land Requirement: None Climate Change Adaptation Needs:
Protection of fuel storage and buildings. Adequate drainage for high rainfall events.
Project Cost Estimate: Capital Cost Estimate: Low estimate $0.75 million excluding land cost using construction management and direct labour Annual O&M Cost Estimate: $75,000
Implementation Options: Implementing agency for construction has not been decided. When completed CIAA will take over O&M responsibility.

Appendix 5 7
Project Tracking Project Preparation Status Project Identification: Reconnaissance by GHD Consultants in May 2006 confirmed
requirement for project. Stakeholder Consultations:
GHD held consultations with Island Council and Air Rarotonga.
Feasibility Study: Initial inspection completed. Preliminary quantities and cost estimates being prepared by GHD Consultants for AMD and NZAID.
Engineering Design: None Land Acquisition: None Environmental Assessment:
None
Procurement: None Construction: None Budget Allocation for O&M:
None
Project Implementation Status Funding Source: NZAID is considering funding but no commitment or decision has been
made. Implementation Arrangements:
CIAA will take over management of the airport after completion but responsibility for survey, engineering and construction has not been determined.
Contracting Method: Conventional tender through local competitive bidding to MFEM guidelines. Contract administration and construction supervision by implementing agency. Options of construction management with direct labour versus contractor are being considered.
O&M Responsibility: Airport will be handed over to CIAA which will enter into an agreement with Mauke Island Administration for O&M
Risk Assessment: Technical risk associated with engineering design is negligible. Risks associated with construction quality, cost and schedule are low provided effective project management and quality management are provided. Risk of O&M requirements failing to be achieved is high unless effective delivery and inspection systems are put into place. Risk of traffic not materializing, air services being cut back and benefits not realized is high.
Implementation Schedule:
None
Current Status: None Profile Created: 18 October 2006 Current Version: 18 October 2006

8 Appendix 5
Project Profile
Project ID: ATW04MOI Sector: Air Transport Name: Mitiaro Airport Improvement Island: Mitiaro Location: Mitiaro Airport Background/Rationale: Air Rarotonga provides scheduled service to Mitiaro with the
Banderante aircraft. Occasionally Air Rarotonga will operate a charter using the Saab 340.
Objective: Improve the airport sufficient to obtain certification for Saab 340 scheduled services under Part 139.
Description of Works: Land survey of airport to identify runway dimensions, topography, physical features, obstacles, other hazards and land ownership. Engineering design of runway works and other essential improvements and preparation of contract documents. Works are expected to include clearance of obstacles, grading of runway strip, re-profiling and compaction of 1200m coral runway pavement, airfield drainage, runway markings, windsock and obstacle markings and secure aviation fuel storage.
Features: Saab 340 service will increase passenger and cargo capacity and the increased utilization will reduce unit operating costs. Increased capacity and operating cost savings will increase passenger and cargo traffic, improve opportunities for economic development, reduce isolation and possibly reverse depopulation. Airport improvements will suffice for larger turboprop aircraft such as Bombardier Q400 and ATR42 in future.
Estimated Beneficiaries: Population of Mitiaro 230 (2001 census) Environmental Category: ADB category C: no significant impacts provided effective engineering
design and construction standards are observed Land Requirement: Approximately 1800x90m area = 16ha plus control of obstacle
clearance areas Climate Change Adaptation Needs:
Protection of fuel storage and buildings. Adequate drainage for high rainfall events
Project Cost Estimate: Capital Cost Estimate: Low estimate $0.75 million excluding land cost using construction management and direct labour. Annual O&M Cost Estimate: $75,000
Implementation Options: Implementing agency for construction has not been decided. When completed CIAA will take over O&M responsibility.

Appendix 5 9
Project Tracking Project Preparation Status Project Identification: Reconnaissance by GHD Consultants in May 2006 confirmed limitation
of rehabilitating or expanding existing airport. Stakeholder Consultations:
GHD held consultations with Island Council and Air Rarotonga.
Feasibility Study: Initial inspection completed. Preliminary quantities and cost estimates being prepared by GHD Consultants for AMD and NZAID.
Engineering Design: None Land Acquisition: None Environmental Assessment:
None
Procurement: None Construction: None Budget Allocation for O&M:
None
Project Implementation Status Funding Source: None identified. Implementation Arrangements:
CIAA will take over management of the airport after completion but responsibility for survey, engineering and construction has not been determined.
Contracting Method: Conventional tender through local competitive bidding to MFEM guidelines. Contract administration and construction supervision by implementing agency. Options of construction management with direct labour versus contractor are being considered.
O&M Responsibility: Airport will be handed over to CIAA which will enter into an agreement with Mangaia Island Administration for O&M
Risk Assessment: Technical risk associated with engineering design is negligible. Risks associated with construction quality, cost and schedule are low provided effective project management and quality management are provided. Risk of O&M requirements failing to be achieved is high unless effective delivery and inspection systems are put into place. Risk of traffic not materializing, air services being cut back and benefits not realized is high.
Implementation Schedule:
None
Current Status: None Profile Created: 18 October 2006 Current Version: 18 October 2006

10 Appendix 5
Project Profile
Project ID: ATW05MHX Sector: Air Transport Name: Manihiki Airport Improvement Island: Manihiki Location: Tukao Background/Rationale: Air Rarotonga serves the northern group islands with the Banderante
aircraft. The long distances reduce the payload which limits the number of seats which can be filled and makes these services uneconomic, even with the existing high fares. Air Rarotonga wishes to introduce the Saab 340 on the northern routes which will significantly increase the passenger and cargo capacity provided the airports are improved sufficiently to be certified under Civil Aviation Rules Part 139 governing airports with regular air services by aircraft with 30 seats or more
Objective: Improve the airport sufficient to obtain certification for Saab 340 scheduled services under Part 139
Description of Works: Land survey of airport and environs to identify topography, physical features, land ownership and structures. Airport zoning study to determine obstacle clearance surfaces and identify all obstacles requiring removal. Negotiations with landowners for removal of obstacles. Engineering design of airport improvements and preparation of contract documents. Works are expected to include clearance of obstacles, grading of runway strip, re-profiling and compaction of 1200m coral runway pavement, airfield drainage, runway markings, secure aviation fuel storage, security fencing where required, replacement of NDB and standby generator, and supply of rescue and fire fighting equipment.
Features: Saab 340 service will increase passenger and cargo capacity and the increased utilization will reduce unit operating costs. Increased capacity and operating cost savings will increase passenger and cargo traffic, improve opportunities for economic development, reduce isolation and possibly reverse depopulation. Airport improvements will suffice for larger turboprop aircraft such as Bombardier Q400 and ATR42 in future.
Estimated Beneficiaries: Populations of Manihiki and Rakahanga 684 persons (2001 census) Environmental Category: ADB category C: no significant impacts provided effective engineering
design and construction standards are observed Land Requirement: Runway strip, end zones and obstacle clearance areas will require
purchase or lease or control of land use and height of structures and trees. Estimated 20 ha involved.
Climate Change Adaptation Needs:
Protection of fuel storage, NDB and standby generator required as minimum. Foreshore protection or treatment may be required as well.
Project Cost Estimate: Capital Cost Estimate: Low estimate $0.75 million excluding land cost using construction management and direct labour. High estimate $2.0 million with land and conventional contracting. Annual O&M Cost Estimate: $100,000
Implementation Options: Implementing agency for construction has not been decided. When completed CIAA will take over O&M responsibility.

Appendix 5 11
Project Tracking Project Preparation Status Project Identification: MOT-OMIA-CIAA-Air Rarotonga completed reconnaissance in May
2006 and prepared scope of works and cost estimate. Follow-up reconnaissance by combined AMD-NZAID-GHD Consultants-ADB Master Plan Consultants team in August 2006 confirmed requirement for project.
Stakeholder Consultations:
MOT-OMIA-CIAA-Air Rarotonga team held consultations with Island Council and landowners. AMD-NZAID-GHD-ADB team held consultations with Island Council and Air Rarotonga.
Feasibility Study: Initial inspection completed. Preliminary quantities and cost estimates being prepared by GHD Consultants for AMD and NZAID.
Engineering Design: None Land Acquisition: None Environmental Assessment:
None
Procurement: None Construction: None Budget Allocation for O&M:
None
Project Implementation Status Funding Source: NZAID is considering funding but no commitment or decision has been
made. Implementation Arrangements:
CIAA will take over management of the airport after completion but responsibility for survey, engineering and construction has not been determined.
Contracting Method: Conventional tender through local competitive bidding to MFEM guidelines. Contract administration and construction supervision by implementing agency Options of construction management with direct labour versus contractor are being considered.
O&M Responsibility: Airport will be handed over to CIAA which will enter into an agreement with Manihiki Island Administration for O&M
Risk Assessment: Technical risk associated with engineering design is negligible. Negotiations with landowners could delay start of construction significantly. Risks associated with construction quality, cost and schedule are substantial and effective project management and quality management will be required. Risk of O&M requirements failing to be achieved is high unless effective delivery and inspection systems are put into place. Risk of traffic not materializing, air services being cut back and benefits not realized is moderate.
Implementation Schedule:
None
Current Status: None
Profile Created: 18 October 2006 Current Version: 18 October 2006

12 Appendix 5
Project Profile
Project ID: ATW06PYE Sector: Air Transport Name: Penrhyn Airport Improvement Island: Penrhyn Location: Omoka Background/Rationale: Air Rarotonga serves the northern group islands with the Banderante
aircraft. The long distances reduce the payload which limits the number of seats which can be filled and makes these services uneconomic, even with the existing high fares. Air Rarotonga wishes to introduce the Saab 340 on the northern routes which will significantly increase the passenger and cargo capacity provided the airports are improved sufficiently to be certified under Civil Aviation Rules Part 139 governing airports with regular air services by aircraft with 30 seats or more
Objective: Improve the airport sufficient to obtain certification for Saab 340 scheduled services under Part 139
Description of Works: Land survey of airport and environs to identify topography, physical features, land ownership and structures. Airport zoning study to determine obstacle clearance surfaces and identify all obstacles requiring removal. Negotiations with landowners for removal of obstacles. Engineering design of airport improvements and preparation of contract documents. Works are expected to include clearance of obstacles, grading of runway, re-profiling and compaction of 1.2km coral runway pavement, airfield drainage, runway markings, secure aviation fuel storage, security fencing where required, replacement of NDB and standby generator, and supply of rescue and fire fighting equipment.
Features: Saab 340 service will increase passenger and cargo capacity and the increased utilization will reduce unit operating costs. Increased capacity and operating cost savings will increase passenger and cargo traffic, improve opportunities for economic development, reduce isolation and possibly reverse depopulation. Airport will be the main fuel storage location in northern group due to Penrhyn Harbour. It has important potential to be an international point of entry and refuelling point for patrol aircraft from other countries which will provide an important revenue source. Airport improvements will suffice for larger turboprop aircraft such as Bombardier Q400 and ATR42 in future.
Estimated Beneficiaries: Population of Penrhyn 357 persons (2001 census) Environmental Category: ADB category C: no significant impacts provided effective engineering
design and construction standards are observed Land Requirement: Runway strip, end zones and obstacle clearance areas will require
purchase or lease or control of land use and height of structures and trees. Estimated 15 ha involved.
Climate Change Adaptation Needs:
Protection of fuel storage, NDB and standby generator required
Project Cost Estimate: Capital Cost Estimate: Low estimate $0.75 million excluding land cost using construction management and direct labour. High estimate $2.0 million with land and conventional contracting. Annual O&M Cost Estimate: $100,000
Implementation Options: Implementing agency for construction has not been decided. When completed CIAA will take over O&M responsibility.

Appendix 5 13
Project Tracking Project Preparation Status Project Identification: MOT-OMIA-CIAA-Air Rarotonga completed reconnaissance in May
2006 and prepared scope of works and cost estimate. Follow-up reconnaissance by combined AMD-NZAID-GHD Consultants-ADB Master Plan Consultants team in August 2006 confirmed requirement for project.
Stakeholder Consultations:
MOT-OMIA-CIAA-Air Rarotonga team held consultations with Island Council and landowners. AMD-NZAID-GHD-ADB team held consultations with Island Council and Air Rarotonga.
Feasibility Study: Initial inspection completed. Preliminary quantities and cost estimates being prepared by GHD Consultants for AMD and NZAID.
Engineering Design: None Land Acquisition: None Environmental Assessment:
None
Procurement: None Construction: None Budget Allocation for O&M:
None
Project Implementation Status Funding Source: NZAID is considering funding but no commitment or decision has been
made. Implementation Arrangements:
CIAA will take over management of the airport after completion but responsibility for survey, engineering and construction has not been determined.
Contracting Method: Conventional tender through local competitive bidding to MFEM guidelines. Contract administration and construction supervision by implementing agency Options of construction management with direct labour versus contractor are being considered.
O&M Responsibility: Airport will be handed over to CIAA which will enter into an agreement with Manihiki Island Administration for O&M
Risk Assessment: Technical risk associated with engineering design is negligible. Negotiations with landowners could delay start of construction significantly. Risks associated with construction quality, cost and schedule are substantial and effective project management and quality management will be required. Risk of O&M requirements failing to be achieved is high unless effective delivery and inspection systems are put into place. Risk of traffic not materializing, air services being cut back and benefits not realized is moderate.
Implementation Schedule:
None
Current Status: Government has agreed to implement with Cape funds (Cabinet decision 6 July 2006)
Profile Created: 18 October 2006 Current Version: 18 October 2006

14 Appendix 5
Project Profile
Project ID: ATW07PZK Sector: Air Transport Name: Pukapuka Airport Improvement Island: Pukapuka Location: Motu Ko Background/Rationale: Air Rarotonga serves the northern group islands with the Banderante
aircraft. The long distance reduce the payload which limits the number of seats which can be filled and makes these services uneconomic, even with the existing high fares. Air Rarotonga wishes to introduce the Saab 340 on the northern routes which will significantly increase the passenger and cargo capacity provided the airports are improved sufficiently to be certified under Civil Aviation Rules Part 139 governing airports with regular air services by aircraft with 30 seats or more
Objective: Improve the airport sufficient to obtain certification for Saab 340 regular charter or scheduled services under Part 139
Description of Works: Land survey of airport and environs to identify topography, physical features, land ownership and structures. Airport zoning study to determine of obstacle clearance surfaces and identify all obstacles requiring removal. Negotiations with landowners for removal of obstacles. Engineering design of airport improvements and preparation of contract documents. Works are expected to include clearance of obstacles, grading of runway strip, re-profiling and compaction of 1,200 m coral runway pavement, airfield drainage, runway markings, secure aviation fuel storage, security fencing where required, and supply of rescue and fire fighting equipment.
Features: Saab 340 service will increase passenger and cargo capacity and the increased utilization will reduce unit operating costs. Increased capacity and operating cost savings will increase passenger and cargo traffic, improve opportunities for economic development, reduce isolation and possibly reverse depopulation. Airport improvements will suffice for larger turboprop aircraft such as Bombardier Q400 and ATR42 in future.
Estimated Beneficiaries: Population of Pukapuka 664 (2001 census) Environmental Category: ADB category C: no significant impacts provided effective engineering
design and construction standards are observed Land Requirement: Runway strip, end zones and obstacle clearance areas will require
purchase or lease or control of land use and height of structures and trees. Estimated 12 ha involved.
Climate Change Adaptation Needs:
Protection of fuel storage. Foreshore protection or treatment may be required as well.
Project Cost Estimate: Capital Cost Estimate: Low estimate $0.75 million excluding land cost using construction management and direct labour. High estimate $2.0 million with land and conventional contracting. Annual O&M Cost Estimate: $75,000
Implementation Options: Implementing agency for construction has not been decided. When completed CIAA will take over O&M responsibility.

Appendix 5 15
Project Tracking Project Preparation Status Project Identification: MOT-OMIA-CIAA-Air Rarotonga completed reconnaissance in May 2006
and prepared scope of works and cost estimate. Follow-up reconnaissance by combined AMD-NZAID-GHD Consultants-ADB Master Plan Consultants team in August 2006 confirmed requirement for project.
Stakeholder Consultations:
MOT-OMIA-CIAA-Air Rarotonga team held consultations with Island Council and landowners. AMD-NZAID-GHD-ADB team held consultations with Island Council and Air Rarotonga.
Feasibility Study: Initial inspection completed. Preliminary quantities and cost estimates being prepared by GHD Consultants for AMD and NZAID.
Engineering Design: None Land Acquisition: None Environmental Assessment:
None
Procurement: None Construction: None Budget Allocation for O&M:
None
Project Implementation Status Funding Source: NZAID is considering funding but no commitment or decision has been
made. Implementation Arrangements:
CIAA will take over management of the airport after completion but responsibility for survey, engineering and construction has not been determined.
Contracting Method: Conventional tender through local competitive bidding to MFEM guidelines. Contract administration and construction supervision by implementing agency. Options of construction management with direct labour versus contractor are being considered.
O&M Responsibility: Airport will be handed over to CIAA which will enter into an agreement with Pukapuka Island Administration for O&M
Risk Assessment: Technical risk associated with engineering design is negligible. Negotiations with landowners could delay start of construction significantly. Risks associated with construction quality, cost and schedule are substantial and effective project management and quality management will be required. Risk of O&M requirements failing to be achieved is high unless effective delivery and inspection systems are put into place. Risk of traffic not materializing, air services being cut back and benefits not realized is high.
Implementation Schedule:
None
Current Status: None Profile Created: 18 October 2006 Current Version: 18 October 2006

16 Appendix 5
Project Profile
Project ID: ATW08RAR Sector: Air Transport Name: Rarotonga Airport Passenger Terminal Improvement Island: Rarotonga Location: Rarotonga International Airport, Nikao Background/Rationale: CIAA will be required to separate arriving and departing passengers in
compliance with international security requirements. This will require construction of a covered departures area over the existing garden and blocking access to the arrivals hall. Air New Zealand is expected to replace the B767 (264 seats) with the B777 (313 seats) in the near future which will place an additional load on arrivals processing. CIAA has proposed enlarging the arrivals hall, installing a larger baggage carousel and rearranging baggage claim, immigration and customs to cope with larger passenger loads.
Objective: Improve international passenger arrival and departure areas to comply with security requirements and cope with increased peak hour passenger traffic.
Description of Works: Extension of the existing building to provide an enclosed passenger departures area fronting onto the apron. Installation of necessary utilities, public toilets, information system, furnishings and security screening. Construction of a second storey would provide additional space for a restaurant-bar and more shops. Enlargement of the arrivals hall and installation of a new baggage carousel; installation of public toilets; and rearrangement of immigration and customs counters in the arrivals hall.
Features: Improvements are necessary to comply with security requirements and meet the requirements of increased traffic. Cost recovery may be possible through increased areas for shops and restaurant-bar.
Estimated Beneficiaries: Direct beneficiaries are 300,000 arriving and departing passengers. Indirect beneficiaries are Rarotonga population 12,188 (2001 census).
Environmental Category: ADB category C: no significant impacts provided effective engineering design and construction standards are observed.
Land Requirement: None Climate Change Adaptation Needs:
Protection of buildings and facilities from high intensity wind periods, and high rainfall events
Project Cost Estimate: Capital Cost Estimate: $3.5 million Annual O&M Cost Estimate: N/A included in CIAA budget
Implementation Options: CIAA will be implementing agency and will take over O&M responsibility.

Appendix 5 17
Project Tracking Project Preparation Status Project Identification: Identified by CIAA. Stakeholder Consultations:
CIAA has held consultations with Ministry of Transport and Air New Zealand.
Feasibility Study: Various design exercises for a new terminal have been carried out but no detailed feasibility study of the immediate requirement.
Engineering Design: None Land Acquisition: None Environmental Assessment:
None
Procurement: None Construction: None Budget Allocation for O&M:
None
Project Implementation Status Funding Source: None Implementation Arrangements:
CIAA will implement the project using private sector architect-engineering firm for design and supervision and contractor for construction and commissioning. CIAA will operate the facilities during construction and take over O&M following commissioning.
Contracting Method: Conventional tender through local competitive bidding to MFEM guidelines is expected. However, it may be possible to implement using a public-private partnership arrangement because of the revenue potential from shops and a restaurant-bar.
O&M Responsibility: CIAA Risk Assessment: Technical risk associated with engineering design is negligible.
Risks associated with construction quality, cost and schedule are low provided effective project management and quality management are provided. Risk of traffic not materializing, air services being cut back and benefits not realized is low.
Implementation Schedule:
None
Current Status: CIAA is investigating options for funding and implementation. Profile Created: 18 October 2006 Current Version: 18 October 2006

18 Appendix 5
Project Profile
Project ID: ATW09RAR Sector: Air Transport Name: Rarotonga Airport Cyclone Protection Works Island: Rarotonga Location: Rarotonga International Airport, Nikao Background/Rationale: The airport is vulnerable to sea surges and sustained minor damage to
the v-drain from Cyclone Olaf in 2005. The Meteorological Office, power controls, standby generator and ATC tower are at risk from cyclone damage which would close airport both for rescue efforts and for restoring normal economic activities following the cyclone. The airfield lighting system is now more 30 years old and requires replacement. There is an opportunity for a combined project to relocate the critical meteorological station, ATC, power controls and standby generator to the south side of the runway and replace the airfield lighting.
Objective: Relocate to a less vulnerable location and replace airport installations which are critical to maintaining operations, especially immediately after a cyclone.
Description of Works: Engineering survey of existing facilities and feasibility study and risk assessment to evaluate requirements and options. Possible scope of works may include armouring of western threshold area, relocation of meteorological office and VOR/DME, relocation of ATC tower, power house and standby generator to the south side of the runway.
Features: The affected facilities are reaching the end of their useful life and will need to be rehabilitated or replaced in the next 5 years. The incremental cost of relocating critical airport facilities to a safer location may be shown to be small in comparison to the risks and economic cost of airport closure and suspension of international scheduled services.
Estimated Beneficiaries: Rarotonga population 12,188 (2001 census). Environmental Category: ADB category C: no significant impacts provided effective engineering
design and construction standards are observed Land Requirement: Extension of airport boundary to the edge of the inner ring road and
possibly land south of the road. Climate Change Adaptation Needs:
Requires detailed climate risk assessment as part of feasibility, impacted by increased cyclone events, high wind speeds, and sea surges.
Project Cost Estimate: Capital Cost Estimate: $5-10 million depending on scope. Annual O&M Cost Estimate: N/A included in CIAA budget
Implementation Options: CIAA will be implementing agency and will take over O&M responsibility.

Appendix 5 19
Project Tracking Project Preparation Status Project Identification: Identified by CIAA. Stakeholder Consultations:
CIAA has held consultations with Ministry of Transport and Air New Zealand.
Feasibility Study: Various design exercises for a new terminal have been carried out but no detailed feasibility study of the immediate requirement.
Engineering Design: None Land Acquisition: None Environmental Assessment:
None
Procurement: None Construction: None Budget Allocation for O&M:
None
Project Implementation Status Funding Source: Unknown Implementation Arrangements:
CIAA will implement the project using private sector architect-engineering firm for design and supervision and contractor for construction and commissioning. CIAA will operate the facilities during construction and take over O&M following commissioning.
Contracting Method: Conventional tender through local competitive bidding to MFEM guidelines is expected. However, it may be possible to implement using a public-private partnership arrangement because of the revenue potential from shops and a restaurant-bar.
O&M Responsibility: CIAA Risk Assessment: Technical risk associated with engineering design is negligible.
Risks associated with construction quality, cost and schedule are low provided effective project management and quality management are provided.
Implementation Schedule:
None
Current Status: CIAA is investigating options for funding and implementation. Profile Created: 18 October 2006 Current Version: 18 October 2006

20 Appendix 5
Project Profile
Project ID: ATW10AIT Sector: Air Transport Name: Aitutaki Airport Improvement for International Operations Island: Aitutaki Location: Aitutaki Airport Background/Rationale: Aitutaki handled approximately 60,000 arriving and departing passengers
in 2005 on domestic Saab 340 and Banderante flights from Rarotonga. The airport’s runway, aircraft handling facilities and passenger terminal are sufficient for these aircraft. There has been the occasional ATR72 charter from Tahiti which required temporary immigration and customs processing. If direct services from New Zealand or Tahiti were to develop then the passenger and aircraft facilities would need to be enlarged and the runway strengthened.
Objective: Develop the airport to handle international air services within the region. Design aircraft would be Airbus A320 or Bombardier Q400/ATR72.
Description of Works: Extend passenger terminal to provide separate arriving and departing passenger processing including immigration and customs for international flights. Expand water, power and sanitation services to meet demands of the larger building. Extend the apron to handle the design aircraft. Conduct pavement assessment to determine if strengthening is required which may require asphaltic concrete overlay. Provision of fuel storage and increased rescue and fire fighting capacity.
Features: These improvements are required only if there is demand generated by firm commitments by air carriers to provide regional international service to Aitutaki. International services would provide additional revenues to CIAA from landing fees and terminal space rental.
Estimated Beneficiaries: Aitutaki population 1,946 (2001 census). Environmental Category: ADB category B: expansion occurs with a developed site but the airport is
located near to sensitive lagoon environment which could be negatively impacted during the construction stage (fuel, bitumen spills) and during operation (waste water) unless strict mitigation measures are incorporated into the design, construction and O&M of the facilities.
Land Requirement: None Climate Change Adaptation Needs:
Buildings are vulnerable to sea surge and should be designed appropriately.
Project Cost Estimate: Capital Cost Estimate: $12 million Annual O&M Estimate: N/A included in CIAA budget
Implementation Options: CIAA will be implementing agency and will take over O&M responsibility.

Appendix 5 21
Project Tracking Project Preparation Status Project Identification: Identified by CIAA Stakeholder Consultations:
None
Feasibility Study: None Engineering Design: None Land Acquisition: None Environmental Assessment:
None
Procurement: None Construction: None Budget Allocation for O&M:
None
Project Implementation Status Funding Source: Unknown Implementation Arrangements:
CIAA will implement the project using private sector architect-engineering firm for design and supervision and contractor for construction and commissioning. CIAA will operate the facilities during construction and take over O&M following commissioning.
Contracting Method: Conventional tender through local competitive bidding to MFEM guidelines is expected.
O&M Responsibility: CIAA Risk Assessment: Technical risk associated with engineering design is negligible.
Risks associated with construction quality, cost and schedule are low provided effective project management and quality management are provided. Risk of O&M requirements failing to be achieved is low given CIAA capacity. Risk of insufficient traffic materializing to recoup financial cost or economic benefits is high.
Implementation Schedule:
None
Current Status: Not active project until air carriers express interest Profile Created: 18 October 2006 Current Version: 18 October 2006

22 Appendix 5
Project Profile
Project ID: ATS01NAT Sector: Air and Marine Transport Name: National Transport Policy Study Island: All islands Location: Rarotonga Background/Rationale: Air and marine transport are vital for sustaining the economic
development and social well-being of the islands. Air service is dependent on inter-island shipping for supplying aviation fuel to the outer islands. At present, the government does not have an air and marine transport policy to define national objectives for the sectors and lay out a strategy and supporting policies, regulatory actions and other measures for achieving those objectives. The outer islands depend on private sector air and shipping services which do not receive any financial assistance from the government. Given the low populations, low traffic, long distances and high operating costs the level of both air and marine transport service is extremely low, especially in the Northern Group. The low level of service has significant negative impacts, which contribute directly to the downward economic spiral, isolation and depopulation in the outer islands. Government is intervening by upgrading the airports and repairing the harbours in the outer islands which promise to improve reliability and reduce the carriers’ operating costs but these measures alone are not sufficient. It is unreasonable to rely totally on the private sector in the circumstances faced by the outer islands and some form of government intervention is required to improve levels of service and reverse this negative spiral. A comprehensive transport policy study is required to inform decisions on further investments in transport infrastructure and define feasible interventions to improve levels of service and reduce user costs.
Objective: Provide a comprehensive description of the current air and marine transport situation in the Outer Islands including level of service, traffic, operating costs and financial performance. Develop options for improving services through improvements in infrastructure, alternative transport technologies and alternative forms of government interventions. Define objectives for transport services to the Outer Islands building on the goals of the NSDP. Recommend policies and options for interventions by government to achieve these objectives.
Description of Works: Review of transport services, traffic, operating costs and financial performance of the carriers. Review of current transport improvement plans. Stakeholder consultations with carriers, shippers, business community and Island Administrations. Review of other countries’ experience with alternative air and marine transport technologies in terms of performance, capital and investment costs. Evaluation of optional modalities for achieving target levels of air and shipping services through direct financial assistance, contracting for service, etc.
Features: The study will identify practical, affordable and sustainable scheme possibilities for improving services to the outer islands.
Estimated Beneficiaries: Populations of all outer islands Environmental Category: Not applicable Land Requirement: Not applicable Climate Change Adaptation Needs:
A climate risk assessment as part of the study should be undertaken to identify areas of risk
Project Cost Estimate: Capital Cost Estimate: $0.25 Annual O&M Estimate: Not applicable.
Implementation Options: Ministry of Transport is appropriate agency to manage the study. Implementation is expected to be shared by MOT, MFEM and CIAA.

Appendix 5 23
Project Tracking Project Preparation Status Project Identification: Identified by TA 4605-COO Infrastructure Master Plan and MOT Stakeholder Consultations:
None
Feasibility Study: None Engineering Design: None Land Acquisition: None Environmental Assessment:
None
Procurement: None Construction: None Budget Allocation for O&M:
None
Project Implementation Status Funding Source: None Implementation Arrangements:
MOT should draw Terms of Reference and detailed cost estimate and submit to government as the next step.
Contracting Method: The study should be conducted by a consulting firm with experience in air and marine transport engineering, transport policy and feasibility studies.
O&M Responsibility: MOT Risk Assessment: Low risk of conducting the study. Higher risk that government would fail to
adopt the recommendations or carry through with a sustained intervention programme.
Implementation Schedule:
None
Current Status: None Profile Created: 30 October 2006 Current Version: 30 October 2006

24 Appendix 5
Project Profile
Project ID: MTW01AIU Sector: Marine Transport Name: Atiu Harbour Repairs Island: Atiu Location: Taunganui Background/Rationale: Atiu Harbour sustained damage to the barge launching ramp from the
2005 cyclones. Bollards are corroded and the quay wall needs new fendering.
Objective: Repair the harbour to provide greater safety and protection for existing lighter and cargoes.
Description of Works: Repair western ramp and construct grooved concrete slab. Install new bollards and fendering to quay wall. Install additional beacon light and reflector channel markers on ends of seawall.
Features: Immediate improvement in safety and reliability of inter-island cargo supply.
Estimated Beneficiaries: Population of Atiu 623 (2001 census) Environmental Category: ADB category C: No significant impacts as the project involves
improving the existing facilities Land Requirement: None Climate Change Adaptation Needs:
The breakwater walls will be exposed to sea surges. Increased cyclone events, high wind speeds, and wave overtopping add significant impact to the harbour and facilities including buildings.
Project Cost Estimate: Capital Cost Estimate: $0.16 million Annual Operating Cost Estimate: $50,000 Annual Maintenance Cost Estimate: $15,000
Implementation Options: Implementing agency for construction has not been decided. Construction by contractor. When completed Island Administration will continue responsibility for O&M.

Appendix 5 25
Project Tracking Project Preparation Status Project Identification: CI Cyclone Recovery Reconstruction Plan 2006-2009 Project 2.3 (2.31). Stakeholder Consultations:
Consultations with Island Council completed during island visit in May 2006.
Feasibility Study: Atiu Harbour, Condition Assessment of Existing Harbour, GHD Consultants, July 2006.
Engineering Design: None Land Acquisition: None Environmental Assessment:
None
Procurement: None Construction: None
Project Implementation Status Funding Source: CIGOV national budget and NZAID CRRP Implementation Arrangements:
Feasibility study and funding under AMD. Implementation responsibility yet to be determined.
Contracting Method: Conventional tender through local competitive bidding to MFEM guidelines. Contract administration and construction supervision by implementing agency.
O&M Responsibility: Island Administration Risk Assessment: Construction program to consider cyclone season
Risks associated with construction quality, costs and schedule delays are substantial and a suitably qualified and experienced contractor is required Maintenance not done properly due to funds shortage – ensure adequate provisions allocated under annual budgets
Implementation Schedule:
2007
Current Status: Project is included in the NZAID CRRP for implementation in FY 2006/2007
Profile Created: 18 October 2006 Current Version: 18 October 2006

26 Appendix 5
Project Profile
Project ID: MTW02MGS Sector: Marine Transport Name: Mangaia Harbour Reconstruction Island: Mangaia Location: Mangaia Harbour Background/Rationale: Mangaia Harbour was damaged by Cyclone Heta in 2004 and again by
Cyclones Meena and Olaf in 2005. Pre-feasibility studies carried out by AC Consultants and further investigations were carried out by GHD Consultants funded by NZAID in 2006. There is considerable deterioration of existing sheet pile walls, complete loss of concrete hardstand areas and minor damage to outer breakwater.
Objective: Repair and improve the harbour to provide greater safety and protection for existing lighter and cargoes.
Description of Works: Remove encroaching reef and improve channel to uniform 3m depth. Enlarge basin to south and construct new 25m quay and small boat ramp closer to shoreline Makatea to improve basin protection. Construct new south breakwater to protect channel. Install new bollards and fendering to quay wall. Install additional beacon light and reflector channel markers on ends of seawall. Demolish existing quay and construct concrete landing ramp to enable future loading barge access (possible stage 2 works).
Features: Immediate improvement in safety and reliability of inter-island cargo supply. Rehabilitation plan allows for future expansion to handle larger landing barge operation.
Estimated Beneficiaries: Population of Mangaia 744 (2001 census) Environmental Category: ADB category C: No significant impacts as the project involves
improving the existing facilities. Land Requirement: None Climate Change Adaptation Needs:
The breakwater walls will be exposed to sea surges. Increased cyclone events, high wind speeds, and wave overtopping add significant impact to the harbour and facilities including buildings.
Project Cost Estimate: Capital Cost Estimate: $2.2 million Annual Operating Cost Estimate: $50,000 Annual Maintenance Cost Estimate: $15,000
Implementation Options: Implementing agency for construction has not been decided. Construction by contractor. When completed Island Administration will continue responsibility for O&M.

Appendix 5 27
Project Tracking Project Preparation Status Project Identification: CI Cyclone Recovery Reconstruction Plan 2006-2009 Project 1.3 (1.31). Stakeholder Consultations:
Consultations with Island Council completed during island visit in May 2006.
Feasibility Study: Mangaia Harbour, Peer Review of Proposed Harbour Upgrade, GHD Consultants, July 2006
Engineering Design: None Land Acquisition: None Environmental Assessment:
None
Procurement: None Construction: None
Project Implementation Status Funding Source: CIGOV national budget and NZAID CRRP Implementation Arrangements:
Feasibility study and funding under AMD. Implementation responsibility yet to be determined.
Contracting Method: Conventional tender through local competitive bidding to MFEM guidelines. Contract administration and construction supervision by implementing agency.
O&M Responsibility: Island Administration Risk Assessment: Construction program to consider cyclone season
Risks associated with construction quality, costs and schedule delays are substantial and a suitably qualified and experienced contractor is required Maintenance not done properly due to funds shortage – ensure adequate provisions allocated under annual budgets
Implementation Schedule:
2007
Current Status: Project is included in the NZAID CRRP for implementation in FY 2006/2007.
Profile Created: 18 October 2006 Current Version: 18 October 2006

28 Appendix 5
Project Profile
Project ID: MTW03MUK Sector: Marine Transport Name: Mauke Harbour Reconstruction Island: Mauke Location: Taunganiu Background/Rationale: Mauke Harbour was damaged by Cyclone Heta in 2004 and again by
Cyclones Meena and Olaf in 2005. Pre-feasibility studies carried out by AC Consultants and further investigations were carried out by GHD Consultants funded by NZAID in 2006. There is considerable deterioration of existing sheet pile walls, complete loss of concrete hardstand areas and minor damage to outer breakwater.
Objective: Repair and improve the harbour to provide greater safety and protection for existing lighter and cargoes.
Description of Works: Remove encroaching reef and improve channel to uniform 3m depth. Enlarge basin to south and construct new 25m quay and small boat ramp closer to shoreline Makatea to improve basin protection. Construct new south breakwater to protect channel. Install new bollards and fendering to quay wall. Install additional beacon light and reflector channel markers on ends of seawall. Demolish existing quay and construct concrete landing ramp to enable future loading barge access (possible stage 2 works).
Features: Immediate improvement in safety and reliability of inter-island cargo supply. Rehabilitation plan allows for future expansion to handle larger landing barge operation.
Estimated Beneficiaries: Population of Mauke 470 (2001 census) Environmental Category: ADB category C: No significant impacts as the project involves
improving the existing facilities Land Requirement: None Climate Change Adaptation needs:
The breakwater walls will be exposed to sea surges. Increased cyclone events, high wind speeds, and wave overtopping add significant impact to the harbour and facilities including buildings.
Project Cost Estimate: Capital Cost Estimate: $1.80 million Annual Operating Cost: $50,000 Annual Maintenance Cost: $15,000
Implementation Options: Implementing agency for construction has not been decided. Construction by contractor. When completed Island Administration will continue responsibility for O&M.

Appendix 5 29
Project Tracking Project Preparation Status Project Identification: CI Cyclone Recovery Reconstruction Plan 2006-2009 Project 1.3 (1.32). Stakeholder Consultations:
Consultations with Island Council completed during island visit in May 2006.
Feasibility Study: Mauke Harbour, Peer Review of Proposed Harbour Upgrade, GHD Consultants, July 2006
Engineering Design: None Land Acquisition: None Environmental Assessment:
None
Procurement: None Construction: None
Project Implementation Status Funding Source: CIGOV national budget and NZAID CRRP Implementation Arrangements:
Feasibility study and funding under AMD. Implementation responsibility yet to be determined.
Contracting Method: Conventional tender through local competitive bidding to MFEM guidelines. Contract administration and construction supervision by implementing agency.
O&M Responsibility: Island Administration Risk Assessment: Construction program to consider cyclone season.
Risks associated with construction quality, costs and schedule delays are substantial and a suitably qualified and experienced contractor is required. Maintenance not done properly due to funds shortage – ensure adequate provisions allocated under annual budgets.
Implementation Schedule:
2007
Current Status: Project is included in the NZAID CRRP for implementation in FY 2006/2007
Profile Created: 18 October 2006 Current Version: 18 October 2006
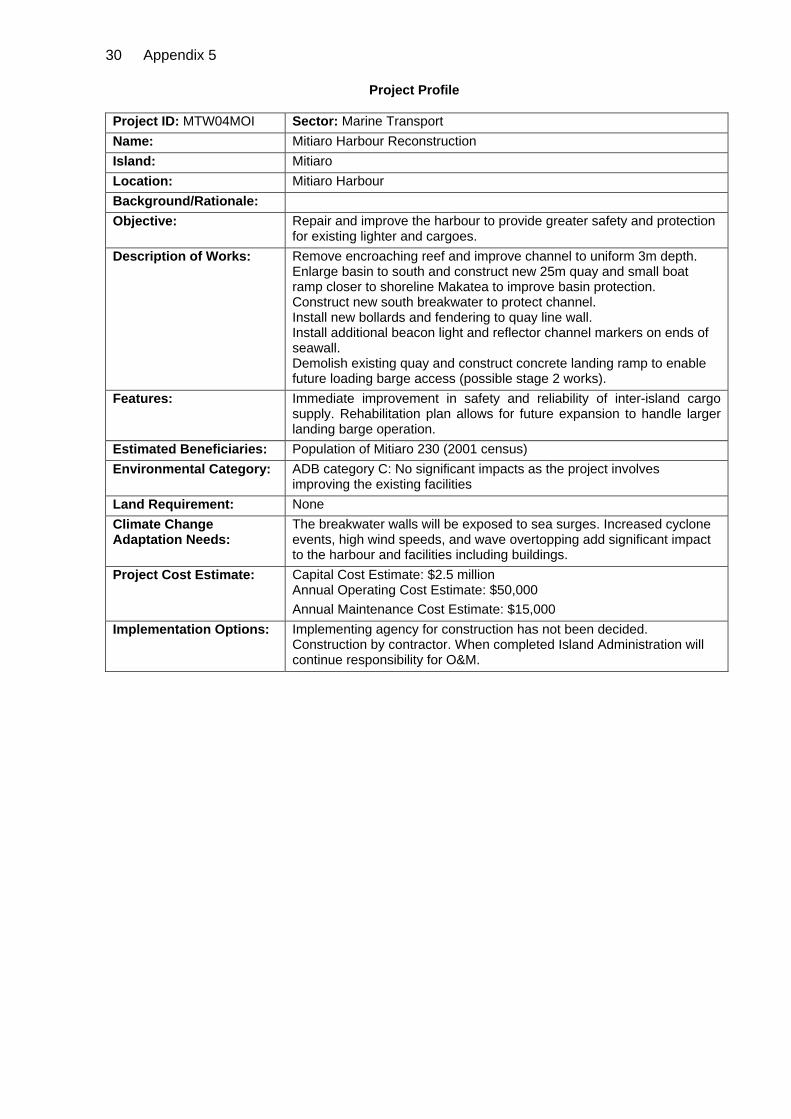
30 Appendix 5
Project Profile
Project ID: MTW04MOI Sector: Marine Transport Name: Mitiaro Harbour Reconstruction Island: Mitiaro Location: Mitiaro Harbour Background/Rationale: Objective: Repair and improve the harbour to provide greater safety and protection
for existing lighter and cargoes. Description of Works: Remove encroaching reef and improve channel to uniform 3m depth.
Enlarge basin to south and construct new 25m quay and small boat ramp closer to shoreline Makatea to improve basin protection. Construct new south breakwater to protect channel. Install new bollards and fendering to quay line wall. Install additional beacon light and reflector channel markers on ends of seawall. Demolish existing quay and construct concrete landing ramp to enable future loading barge access (possible stage 2 works).
Features: Immediate improvement in safety and reliability of inter-island cargo supply. Rehabilitation plan allows for future expansion to handle larger landing barge operation.
Estimated Beneficiaries: Population of Mitiaro 230 (2001 census) Environmental Category: ADB category C: No significant impacts as the project involves
improving the existing facilities Land Requirement: None Climate Change Adaptation Needs:
The breakwater walls will be exposed to sea surges. Increased cyclone events, high wind speeds, and wave overtopping add significant impact to the harbour and facilities including buildings.
Project Cost Estimate: Capital Cost Estimate: $2.5 million Annual Operating Cost Estimate: $50,000 Annual Maintenance Cost Estimate: $15,000
Implementation Options: Implementing agency for construction has not been decided. Construction by contractor. When completed Island Administration will continue responsibility for O&M.

Appendix 5 31
Project Tracking Project Preparation Status Project Identification: GHD Consultants inspection of harbours, May 2006 Stakeholder Consultations:
Consultations with Island Council completed during island visit in May 2006.
Feasibility Study: Mitiaro Harbour, Design Concept for Proposed Harbour Upgrade, GHD Consultants, July 2006.
Engineering Design: None Land Acquisition: None Environmental Assessment:
None
Procurement: None Construction: None
Project Implementation Status Funding Source: Being considered for funding by NZAID Outer Islands Development
fund. Implementation Arrangements:
Feasibility study and funding under AMD. Implementation responsibility yet to be determined.
Contracting Method: Conventional tender through local competitive bidding to MFEM guidelines. Contract administration and construction supervision by implementing agency.
O&M Responsibility: Island Administration Risk assessment: Construction program to consider cyclone season.
Risks associated with construction quality, costs and schedule delays are substantial and a suitably qualified and experienced contractor is required. Maintenance not done properly due to funds shortage – ensure adequate provisions allocated under annual budgets.
Implementation Schedule:
None
Current Status: Under review by CIGOV and NZAID. Profile Created: 1 October 2006 Current Version: 1 October 2006

32 Appendix 5
Project Profile
Project ID: MTW05MHX Sector: Marine Transport Name: Manihiki Harbours Reconstruction Island: Manihiki Location: Tukao and Tauhunu Background/Rationale: Tauhunu Harbour was severely damaged by Cyclone Martin in 1997.
Both Tauhunu and Tukao Harbours are unprotected and the quays are in bad condition creating conditions of poor safety, delays in unloading lighters and damage to vessels and cargoes. Inter-island services from Rarotonga are infrequent (once every 2 months) and both harbours also serve boats operating to Rakahanga. It is impractical to open the lagoon to inter-island ships or to develop a larger harbour for Manihiki. The harbours are the lifeline for both Manihiki and Rakahanga and the immediate need, and for the foreseeable future, is to repair both harbours, provide better protection for boats and improve the quays to increase efficiency of loading and unloading operations.
Objective: Repair and improve both harbours to provide a greater degree of safety and protection for existing lighters and cargoes and to make provision for landing barge operations in future.
Description of Works: Tauhunu Harbour: Remove encroaching reef and improve channel to uniform 3m depth; enlarge basin to south and construct new 25m quay at south end either parallel or perpendicular to shoreline. Demolish existing jetty and replace with a concrete boat ramp; construct new north and south breakwaters to protect channel and basin; install bollards and fendering to new quay line wall; install additional beacon light and reflector channel markers on ends of seawall; and enlarge boat ramp to enable future loading barge access (possible stage 2 works). Takao Harbour: Remove encroaching reef and improve channel to uniform 3m depth and enlarge basin; repair existing quay and install new bollards and fendering; construct new north and south breakwaters to protect channel and basin; and install additional beacon light and reflector channel markers on ends of seawalls.
Features: Maximum use of existing infrastructure. Widening of entrance channel and widening of boat ramp at Tauhunu is possible to enable loading barge operations in future.
Estimated Beneficiaries: Populations of Manihiki and Rakahanga 684 persons (2001 census) Environmental Category: ADB category C: no significant impacts provided effective engineering
design and construction standards are observed Land Requirement: None Climate Change Adaptation Needs:
The breakwater walls will be exposed to sea surges. Increased cyclone events, high wind speeds, and wave overtopping add significant impact to the harbour and facilities including buildings.
Project Cost Estimate: Capital Cost Estimate: $2.4 million ($1.4 million for Tauhunu and $1.0 million for repairs to Tukao) Annual Operating Cost Estimate: $75,000 Annual Maintenance Cost Estimate: $30,000
Implementation Options: Implementing agency for construction has not been decided. When completed Island Council will continue responsibility for O&M.

Appendix 5 33
Project Tracking Project Preparation Status Project Identification: Reconnaissance by combined AMD-NZAID-GHD Consultants-ADB
Master Plan Consultants team in August 2006 identified scope of works required.
Stakeholder Consultations:
AMD-NZAID-GHD-ADB team held consultations with Island Council to agree on scope of project in August 2006.
Feasibility Study: Initial inspection completed. Preliminary quantities and cost estimates being prepared by GHD Consultants for AMD and NZAID.
Engineering Design: None Land Acquisition: None Environmental Assessment:
None
Procurement: None Construction: None None
Project Implementation Status Funding Source: Being considered for funding by NZAID Outer Islands Development fund. Implementation Arrangements:
Feasibility study and funding under AMD. Implementation responsibility yet to be determined.
Contracting Method: Conventional tender through local competitive bidding to MFEM guidelines.
O&M Responsibility: Manihiki Island Council Risk Assessment: Technical risk associated with engineering design is negligible.
Risks associated with construction quality, cost and schedule are substantial and effective project management and quality management will be required. Risk of O&M requirements failing to be achieved is low.
Implementation Schedule:
None
Current Status: Under review by CIGOV and NZAID. Profile Created: 18 October 2006 Current Version: 18 October 2006

34 Appendix 5
Project Profile
Project ID: MTW06NAS Sector: Marine Transport Name: Nassau Harbour Development Island: Nassau Location: Background/Rationale: Nassau has no harbour and cargoes are ferried by boat to reef edge and
trucked across the reef flat at low tide. Nassau has a barge which is unused. A minimum harbour development is proposed to enable the barge and small boats to cross the reef flat and unload at a small quay or jetty
Objective: Develop a small harbour for use by small boats and the barge transferring cargo from the inter-island shipping.
Description of Works: Excavation of a channel across the reef flat and a small turning basin. Construction of concrete quay or jetty on the foreshore (5 x 20 m). Installation of channel markers, bollards and fendering. Reconstruction and widening of the concrete causeway connecting the quay with the beach ridge.
Features: The harbour will be a minimum-cost development providing significant benefits in the form of increased safety, reduced ship unloading times and costs, and reduced cargo losses and damage to vessels.
Estimated Beneficiaries: Population of Nassau 72 (2001 census) Environmental Category: ADB category C: no significant impacts provided effective engineering
design and construction standards are observed Land Requirement: None Climate Change Adaptation Needs:
None provided. Breakwater to protect the channel from rough seas is not cost-effective.
Project Cost Estimate: Capital Cost Estimate: $0.33 million Annual Operating Cost Estimate: $25,000 Annual Maintenance Cost Estimate: $5,000
Implementation Options: Implementing agency for construction has not been decided. When completed Island Council will continue responsibility for O&M.

Appendix 5 35
Project Tracking Project Preparation Status Project Identification: Aerial reconnaissance by combined AMD-NZAID-GHD Consultants-ADB
Master Plan Consultants team in August 2006 identified scope of works required.
Stakeholder Consultations:
AMD-NZAID-GHD-ADB team held consultations with Pukapuka Island Council to agree on scope of project in August 2006.
Feasibility Study: Preliminary quantities and cost estimates being prepared by GHD Consultants for AMD and NZAID.
Engineering Design: None Land Acquisition: None Environmental Assessment:
None
Procurement: None Construction: None Budget Allocation for O&M:
None
Project Implementation Status Funding Source: Being considered for funding by NZAID Outer Islands Development fund. Implementation Arrangements:
Not determined
Contracting Method: Conventional tender through local competitive bidding to MFEM guidelines.
O&M Responsibility: Nassau Island Council Risk Assessment: Technical risk associated with engineering design is negligible.
Risks associated with construction quality, cost and schedule are substantial and effective project management and quality management will be required. Risk of O&M requirements failing to be achieved is low.
Implementation Schedule:
None
Current status: Under review by CIGOV and NZAID. Profile Created: 18 October 2006 Current Version: 18 October 2006

36 Appendix 5
Project Profile
Project ID: MTW07PYE Sector: Marine Transport Name: Penrhyn Harbour Rehabilitation Island: Penrhyn Location: Omoka Background/Rationale: Penrhyn Harbour was constructed in WWII and is the only outer island
harbour where inter-island ships can berth and unload directly onto the wharf. It contains fuel storage for the CI patrol boat Te Kukupa. In future it will be used to unload aviation fuel to support Air Rarotonga’s expanded Saab 340 services. The quay facility has deteriorated significantly due to corrosion, wave action and ship impact. Rehabilitation is urgently needed to prevent collapse of the sheet pile quay walls. This is essential to support continued inter-island shipping service and protect the patrol boat fuel facility.
Objective: Rehabilitation of the quay to permit continued inter-island shipping services and protect the patrol boat fuel storage facility. In addition provide cargo handling facilities for increased aviation fuel supplies and possible container services in future.
Description of Works: Replace entire sheet piling with concrete wall anchored by geotextile mesh. Construct gabion walls to protect harbour walls north and south of the main quays. Repair or replace quay pavements. Replace bollards and install new fendering. Provide navigation markers in main shipping channel. Dredging berth area and shipping channel.
Features: The immediate requirement is rehabilitation of existing facilities to support inter-island shipping and patrol activities, and improved air services. In the longer term the harbour could become an important port of entry for international services with expanded facilities to provide storage and trans-shipment of containers to other northern group islands. Harbour has revenue potential from yacht and patrol boat traffic and refuelling services.
Estimated Beneficiaries: Population of Penrhyn 357 persons (2001 census) Environmental Category: ADB category C: no significant impacts provided effective engineering
design and construction standards are observed Land Requirement: None Climate Change Adaptation Needs:
The breakwater walls (gabions) will be exposed to sea surges. Increased cyclone events, high wind speeds, and wave overtopping add significant impact to the harbour and facilities including buildings.
Project Cost Estimate: Capital Cost Estimate: $0.92 million Annual Operating Cost Estimate: $50,000 Annual Maintenance Cost Estimate: $25,000
Implementation Options: Implementing agency for construction has not been decided. When completed Island Administration will continue responsibility for O&M.

Appendix 5 37
Project Tracking
Project Preparation Status Project Identification: Wharf Facility Shore Protection, Penhryn Island, 19th Chief Engineer
Works, Royal Australian Army Engineers, June 2002. Reconnaissance by combined AMD-NZAID-GHD Consultants-ADB Master Plan Consultants team in August 2006 confirmed previous findings and identified scope of works required.
Stakeholder Consultations:
AMD-NZAID-GHD-ADB team held consultations with Island Council to agree on scope of project in August 2006.
Feasibility Study: Initial inspection completed. Preliminary quantities and cost estimates being prepared by GHD Consultants for AMD and NZAID.
Engineering Design: None Land Acquisition: None Environmental Assessment:
None
Procurement: None Construction: None Budget Allocation for O&M:
None
Project Implementation Status Funding Source: Being considered for funding by NZAID Implementation Arrangements:
None
Contracting Method: Conventional tender through local competitive bidding to MFEM guidelines.
O&M Responsibility: Penrhyn Island Administration Risk Assessment: Technical risk associated with engineering design is negligible.
Risks associated with construction quality, cost and schedule are substantial and effective project management and quality management will be required. Risk of O&M requirements failing to be achieved is low.
Implementation Schedule:
None
Current Status: Under review by CIGOV and NZAID. Profile Created: 18 October 2006 Current Version: 18 October 2006

38 Appendix 5
Project Profile
Project ID: MTW08PZK Sector: Marine Transport Name: Pukapuka Jetty Development Island: Pukapuka Location: Yato and Motu Ko Background/Rationale: Pukapuka has a shallow boat passage into the inner lagoon and a small
quay at Roto village which is not suitable for unloading cargoes. The Island Council operates two small barges (which can be tied together for larger cargoes) and normally beaches them at Yato where pallets can be unloaded and stored in the copra shed. Construction of a small jetty in front of the copra shed will facilitate loading and unloading, reduce damage and shorten ship waiting times. Similarly a small jetty is needed at Motu Ko for transferring passengers, cargo and fuel to the airport.
Objective: Construct jetties at Yato and Motu Ko for loading/unloading cargoes. Description of Works: Construct a concrete jetty on piles, concrete boat ramp alongside and
hardstand behind the jetty at Yato. Dredge in front of the jetty. Improve the boat passage by removing encroaching reef, deepening the channel and install channel markers with reflective signs. Construct a small concrete jetty at Motu Ko.
Features: The harbour will be a minimum-cost development providing benefits in the form of increased safety, reduced ship unloading times and costs, and reduced cargo losses and damage to vessels.
Estimated Beneficiaries: Population of Pukapuka 664 persons (2001 census) Environmental Category: ADB category C: no significant impacts provided effective engineering
design and construction standards are observed Land Requirement: Small parcel of beachfront will be required in Yato and Motu Ko Climate Change Adaptation Needs:
Impacts from increased cyclone events, high wind speeds, and wave overtopping need to be assessed
Project Cost Estimate: Capital Cost Estimate: $.27 million Annual Operating Cost Estimate: $50,000 Annual Maintenance Cost Estimate: $10,000
Implementation Options: Implementing agency for construction has not been decided. When completed Island Council will continue responsibility for O&M.

Appendix 5 39
Project Tracking
Project Preparation Status Project Identification: Reconnaissance by combined AMD-NZAID-GHD Consultants-ADB
Master Plan Consultants team in August 2006 identified scope of works required.
Stakeholder Consultations:
AMD-NZAID-GHD-ADB team held consultations with Island Council to agree on scope of project in August 2006.
Feasibility Study: Initial inspection completed. Preliminary quantities and cost estimates being prepared by GHD Consultants for AMD and NZAID.
Engineering Design: None Land Acquisition: None Environmental Assessment:
None
Procurement: None Construction: None Budget Allocation for O&M:
None
Project Implementation Status Funding Source: Being considered for funding by NZAID. Implementation Arrangements:
None
Contracting Method: Conventional tender through local competitive bidding to MFEM guidelines.
O&M Responsibility: Pukapuka Island Administration Risk Assessment: Technical risk associated with engineering design is negligible.
Risks associated with construction quality, cost and schedule are substantial and effective project management and quality management will be required. Risk of O&M requirements failing to be achieved is low.
Implementation Schedule:
None
Current Status: Under review by CIGOV and NZAID. Profile Created: 18 October 2006 Current Version: 18 October 2006

40 Appendix 5
Project Profile
Project ID: MTW09RAK Sector: Marine Transport Name: Rakahanga Harbour Improvement Island: Rakahanga Location: Rakahanga Harbour Background/Rationale: Repairs were carried out on the harbour recently and further major works
are not required. However, low-cost safety improvements being provided in other harbours should be extended to Rakahanga as well.
Objective: Provide basic facilities to raise the harbour to operational standard being provided in other outer island harbours.
Description of Works: Install bollards and fendering to quay wall. Install additional beacon light and reflector channel markers on ends of seawall. Enlarge boat ramp to enable future loading barge access (possible stage 2 works).
Features: These low-cost items will improve safety and reduce damage to vessels. Estimated Beneficiaries: Population of Rakahanga 169 (2001 census) Environmental Category: ADB category C: no significant impacts provided effective engineering
design and construction standards are observed, Land Requirement: None Climate Change Adaptation Needs:
Impacts from increased cyclone events, high wind speeds, and wave overtopping need to be assessed
Project Cost Estimate: Capital Cost Estimate: $30,000 Annual Operating Cost Estimate: $25,000 Annual Maintenance Cost Estimate: $15,000
Implementation Options: Implementing agency for construction has not been decided. When completed Island Council will continue responsibility for O&M.

Appendix 5 41
Project Tracking
Project Preparation Status Project Identification: Reconnaissance by combined AMD-NZAID-GHD Consultants-ADB
Master Plan Consultants team in August 2006 identified scope of works required.
Stakeholder Consultations:
AMD-NZAID-GHD-ADB team held consultations with Island Council to agree on scope of project in August 2006.
Feasibility Study: Initial inspection completed. Preliminary quantities and cost estimates being prepared by GHD Consultants for AMD and NZAID.
Engineering Design: None Land Acquisition: None Environmental Assessment:
None
Procurement: None Construction: None Budget Allocation for O&M:
None
Project Implementation Status Funding Source: Being considered for funding by NZAID. Implementation Arrangements:
None
Contracting Method: Conventional tender through local competitive bidding to MFEM guidelines.
O&M Responsibility: Manihiki Island Council Risk Assessment: Technical risk associated with engineering design is negligible.
Risks associated with construction quality, cost and schedule are substantial and effective project management and quality management will be required. Risk of O&M requirements failing to be achieved is low.
Implementation Schedule:
None
Current Status: Under review by CIGOV and NZAID. Profile Created: 18 October 2006 Current Version: 18 October 2006

42 Appendix 5
Project Profile
Project ID: MTW10RAR Sector: Marine Transport Name: Avatiu Harbour Western Basin Development Completion Island: Rarotonga Location: Avatiu Background/Rationale: Western Basin Development Stages 2A, 2B and 2C include construction
of a new quay, reconstruction of the western breakwater and construction of southern and northern breakwater returns and enlarging and deepening the basin to accommodate vessels up to 33m length. These works will be completed by late 2006. Stages 2D, 2E and 2F include a slipway and boat launching ramp, installation of utilities, construction of roads and hardstand areas. A further Stage 3 envisages rock protection for all basin faces not sheet piled, constructing another quay on the north side of the basin and providing further public amenities, and reconstruction of the Western Breakwater.
Objective: Provide berth space for the increasing numbers of small commercial and pleasure vessels visiting or based in Avatiu and provide a ramp of small boat surveying and maintenance.
Description of Works: The remaining works include construction of a slipway and boat launching ramp at the western end of the new quay. Install water supply, electricity and lighting. Construct access roads and hardstand area adjacent to the new quay. Further development includes construction of a quay along the north face of the basin and a hardstand area between this quay and the western breakwater.
Features: The development will provide significant economic benefits in terms of reduced congestion and delays in the main harbour, reduced wear and tear on vessels, increased visitor vessels and increased revenues to CIPA.
Estimated Beneficiaries: CIPA and resident boat owners are the chief beneficiaries. Visiting yachts and fishing boats (650 arrivals/departures per year) will benefit directly. Businesses in Rarotonga will benefit indirectly from increased yacht and small boat activity.
Environmental Category: Full EIA was carried out for the initial development which stressed the need for high standards of construction. ADB category C for completing the works: no significant further impacts provided effective engineering design and construction standards are observed
Land Requirement: None Climate Change Adaptation Needs:
The Western Breakwater as now reconstructed will not protect the basin from major sea surges. The construction cost of a stronger breakwater will be extremely high compared to harbour assets being protected. A detailed feasibility study is required.
Project Cost Estimate: Capital Cost Estimate: $3 million Annual O&M Cost: N/A in CIPA budget
Implementation Options: CIPA will be responsible for implementation and O&M.

Appendix 5 43
Project Tracking
Project Preparation Status Project Identification: Completed Stakeholder Consultations:
Completed
Feasibility Study: Completed Engineering Design: Concept Design Report by AC Consulting Group Limited NZ, August
2004, for Stage 2A, 2B, 2C. Detailed engineering required for completion works.
Land Acquisition: Not required Environmental Assessment:
EIA Report by Miro Consultants, September 2002
Procurement: None Construction: None Budget Allocation for O&M:
None
Project Implementation Status Funding Source: None Implementation Arrangements:
CIPA will recruit consultants for detailed design and quality management during construction, and will handle procurement of contractors and suppliers.
Contracting Method: Conventional tender through local competitive bidding to MFEM guidelines.
O&M Responsibility: CIPA Risk Assessment: Technical risk associated with engineering design is negligible.
Risks associated with construction quality, cost and schedule are substantial and effective project management and quality management will be required. Risk of O&M requirements failing to be achieved is low.
Implementation Schedule:
None
Current Status: Under review by CIPA and CIGOV. Profile Created: 12 October 2006 Current Version: 12 October 2006

44 Appendix 5
Project Profile
Project ID: MTW11RAR Sector: Marine Transport Name: Avatiu Container Facilities Development Island: Rarotonga Location: Avatiu Background/Rationale: Cargo traffic has been increasing at more than 6% p.a. and annual
tonnage now exceeds 100,000 t. The port has storage area for about 150 containers and is being forced to triple stack units. The 1992 JICA port master plan study of port facilities estimated that additional container storage would be required by 2010 based on a forecast of only 53,000 t. Additional storage area will be required if traffic continues to increase. Options include removal of the Cook Islands Gas LPG tanks to another location off site or development of an “inland port” at another location.
Objective: To provide additional space for efficient handling of containers. Description of Works: Subject to a feasibility study and environmental assessment the works
could include: Development of an alternative LPG site (0.25ha required), clearing and rearrangement of port facilities, and construction of concrete pavement, drainage, lighting and power for an enlarged container handling and storage area. Alternatively, an inland port will require development of 2-3ha site with good truck access from the port.
Features: LPG tanks represent a safety hazard and it is desirable to remove them to a more isolated location. Removal will free an area of approximately 2500 m2 and enable CIPA to rearrange its container handling and storage areas to provide more efficient and quicker cargo handling which will reduce operating costs.
Estimated Beneficiaries: CIPA and shippers will benefit directly. All Rarotonga will benefit indirectly.
Environmental Category: ADB category A: significant potential impacts if an inland container port is developed. Fewer impacts with relocating the LPG tanks provided effective engineering design and construction standards are observed
Land Requirement: 2-3 ha for an inland port and <0.5ha for relocating the LPG tanks. Climate Change Adaptation Needs:
Impacts on the facility will come from increased cyclone events, high wind speeds and sea surges. Assessment required for adequate facility design to take into account these impacts
Project Cost Estimate: Capital Cost Estimate: $3.5 million Annual O&M Cost: N/A in CIPA budget
Implementation Options: CIPA will be responsible for implementation and O&M of container facilities. Cook Islands Gas will be responsible for relocating its LPG tanks.

Appendix 5 45
Project Tracking
Project Preparation Status Project Identification: JICA Study on Coastal Protection and Port Improvement in the Cook
Islands, August 1992 and JICA Additional Study, March 1994 Stakeholder Consultations:
Internal discussion with CIPA, October 2006
Feasibility Study: None Engineering Design: None Land Acquisition: None Environmental Assessment:
None
Procurement: None Construction: None Budget Allocation for O&M:
None
Project Implementation Status Funding Source: None Implementation Arrangements:
None
Contracting Method: Conventional tender through local competitive bidding to MFEM guidelines.
O&M Responsibility: CIPA Risk Assessment: Technical risk associated with engineering design is negligible.
Risks associated with construction quality, cost and schedule are substantial and effective project management and quality management will be required. Risk of O&M requirements failing to be achieved is low.
Implementation Schedule:
None
Current Status: None Profile Created: 18 October 2006 Current Version: 18 October 2006

46 Appendix 5
Project Profile
Project ID: MTW12RAR Sector: Marine Transport Name: Avatiu Harbour Waterfront Development Island: Rarotonga Location: Avatiu Background/Rationale: The port lands between the CIPA office on the east and the new Western
Basin have significant commercial development potential. Plans have been mooted for developing shops, restaurant-bar, offices and residential apartments overlooking the harbour. As well the slipway is damaged and disused and the boat ramp will no longer be essential when the new ramp is completed in the Western Basin. The waterfront could be reconstructed to provide additional quay length for small vessels.
Objective: To develop under-utilized port lands for commercial purposes and to expand berthing space for small vessels.
Description of Works: Works could include demolition of the Licence Office and other buildings east of the CIPA office, demolition of the slipway and possibly the boat ramp, preparation and construction of a new quay. Development of a commercial complex overlooking the harbour with access and parking on the landside.
Features: Opportunity to enhance the waterfront and provide new business and tourism facilities.
Estimated Beneficiaries: CIPA and commercial developers. Environmental Category: ADB category C: no significant impacts provided effective engineering
design and construction standards are observed Land Requirement: None Climate Change Adaptation Needs:
Buildings are located in the path of sea surges and therefore require appropriate design such as elevated structures with vehicle parking at ground level. Adequate wind speed protection also required
Project Cost Estimate: Capital Cost Estimate: $1.5 million Annual O&M Cost Estimate: N/A included in CIPA budget
Implementation Options: CIPA would be implementing agency for the harbour works. Private sector or public-private partnership would develop the commercial complex.

Appendix 5 47
Project Tracking
Project Preparation Status Project Identification: CIPA has identified project. Stakeholder Consultations:
Internal discussions with CIPA, October 2006
Feasibility Study: None Engineering Design: None Land Acquisition: None Environmental Assessment:
None
Procurement: None Construction: None Budget Allocation for O&M:
None
Project Implementation Status Funding Source: None Implementation Arrangements:
None
Contracting Method: Harbour works with conventional tender through local competitive bidding to MFEM guidelines. Commercial facilities will contracted privately by the developer.
O&M Responsibility: CIPA for harbour facilities and developer for commercial complex Risk Assessment: None Implementation Schedule:
None
Current Status: None Profile Created: 18 October 2006 Current Version: 18 October 2006

48 Appendix 5
Project Profile
Project ID: MTW13RAR Sector: Marine Transport Name: Avatiu Harbour Expansion Island: Rarotonga Location: Avatiu Background/Rationale: The existing quay and basin dimensions and configuration restrict
ships to approximately 33m length. Reef Shipping’s service from NZ to Rarotonga and Aitutaki carries 100-150 containers and is restricted by the Avatiu port. It would like to operate a larger vessel capable of handling 250+ containers and extend the service to other countries. The harbour also has the potential to attract more cruise ships if they could berth at the quay. In order to accommodate larger vessels, the quay line would need to be realigned and extended toward the reef and the channel and basin widened and deepened. The eastern breakwater would need to be relocated.
Objective: To expand the harbour to enable vessels up to 60-75m in length to berth at the quay.
Description of Works: Significant preparatory work is required: feasibility study, environmental assessment, engineering investigations to determine the optimal harbour, quay and breakwater requirements. Works would include demolition of the part of the existing quay, excavations, widening and deepening of the channel and basin, relocation and extension of the breakwater, construction of a new quay and hardstand area.
Features: The cost of the project will be very high but it will bring very significant benefits in the form of lower container transport charges, lower fuel delivery charges and increased cruise vessel visitors.
Estimated Beneficiaries: CIPA and ship operators will benefit directly. All Rarotonga will benefit indirectly.
Environmental Category: ADB category A: Potentially significant impacts which will require detailed environmental assessment.
Land Requirement: Area between the eastern breakwater and the reef will be required. Climate Change Adaptation Needs:
Such a large investment will require protective measures against storm surges. Extent and cost are unknown and are under study.
Project Cost Estimate: Capital Cost Estimate: Unknown but probably in the range of $20+ million. Annual O&M Cost Estimate: N/A included in CIPA budget
Implementation Options: CIPA would be implementing agency for the harbour works.

Appendix 5 49
Project Tracking
Project Preparation Status Project Identification: JICA Study on Coastal Protection and Port Improvement in the Cook
Islands, August 1992 and JICA Additional Study, March 1994 Stakeholder Consultations:
Internal discussions with CIPA, October 2006
Feasibility Study: None Engineering Design: None Land Acquisition: None Environmental Assessment:
None
Procurement: None Construction: None Budget Allocation for O&M:
None
Project Implementation Status Funding Source: None Implementation Arrangements:
None
Contracting Method: Harbour works with conventional tender through local competitive bidding to MFEM guidelines. Commercial facilities will contracted privately by the developer.
O&M Responsibility: CIPA for harbour facilities and developer for commercial complex Risk Assessment: None Implementation Schedule:
None
Current Status: None Profile Created: 18 October 2006 Current Version: 18 October 2006

50 Appendix 5
Project Profile
Project ID: MTW14RAR Sector: Marine Transport Name: Rarotonga North Coast Protection Island: Rarotonga Location: International Airport-Avatiu-Avarua Background/Rationale: Following Cyclone Sally in 1987 several studies and actions were taken
to improve protection of infrastructure between Avarua and the international airport. The Avarua Harbour breakwater was disassembled and used to armour the Avarua foreshore revetment. JICA undertook two studies of constructing breakwaters on the reef flat, armoured revetments and concrete parapets on the foreshore. The associated costs were extremely high (>200 million at 1992 prices) and the JICA analysis showed the scheme to be uneconomic. Recommendations were made to (1) reconsider selective protection of strategic infrastructure units including the runway end and Avatiu Harbour, (2) relocate strategic assets such as the fuel depots inland and (3) continue with computer analysis and scale model testing of alternative protective schemes. Four areas where protective schemes are required are: runway end, the fuel storage depots, Avatiu Harbour West Breakwater, and Avarua foreshore.
Objective: To provide selective protection against strategic infrastructure essential for the economic survival of the Cook Islands
Description of Works: Detailed coastal engineering studies, scale model testing, feasibility studies and risk assessment required to define feasible solutions. Four sub-projects are envisaged: Construction of offshore breakwater to protect runway end Relocation or construction of offshore breakwater and sea wall for the TPP fuel depot Construction of Avatiu Western Breakwater Construction of Avarua marina or alternative scheme
Features: The protective measures being considered are extremely costly and the scientific and engineering aspects and economic benefits are subject to a high degree of uncertainty. Notwithstanding, sustained effort to define and implement appropriate measures is a national priority.
Estimated Beneficiaries: All Rarotonga. Environmental Category: ADB Category A: significant environmental impacts will require detailed
environmental assessment. Land Requirement: Area between the eastern breakwater and the reef will be required. Climate Change Adaptation Needs:
A detailed climate risk assessment required in tandem with other feasibilities, as impacts from increased climate effects are significant
Project Cost Estimate: Capital Cost Estimates: JICA estimated airport runway, fuel depot, Avatiu west breakwater and Avarua marine would cost $135 million (1992 prices). Lower cost solutions need to be found. Annual O&M Cost Estimate: N/A
Implementation Options: None determined at this stage.

Appendix 5 51
Project Tracking Project Preparation Status Project Identification: JICA Study on Coastal Protection and Port Improvement in the Cook
Islands, August 1992 and JICA Additional Study, March 1994 Stakeholder Consultations:
Internal discussions with CIPA, October 2006
Feasibility Study: Following the JICA Additional Study, March 1994 several separate studies have been started with no firm findings.
Engineering Design: None Land Acquisition: None Environmental Assessment:
None
Procurement: None Construction: None Budget Allocation for O&M:
None
Project Implementation Status Funding Source: None Implementation Arrangements:
None
Contracting Method: Harbour works with conventional tender through local competitive bidding to MFEM guidelines. Commercial facilities will contracted privately by the developer.
O&M Responsibility: CIPA for harbour facilities and developer for commercial complex Risk Assessment: None Implementation Schedule:
None
Current Status: None Profile Created: 18 October 2006 Current Version: 18 October 2006

52 Appendix 5
Project Profile
Project ID: MTW15AIT Sector: Marine Transport Name: Aitutaki Harbour Development Island: Aitutaki Location: Arutanga Background/Rationale: CIPA is carrying out needed repairs to the quay walls and hardstand
area, and has ordered a new 22m barge capable of carrying two TEUs and a new 25t fork lift. This will provide sufficient cargo handling capacity for the foreseeable future. CIPA proposes to develop the harbour in stages progressively deepening the Arutanga Channel and enlarging the basin. Stage 1 involves dredging the channel and basin to clear loose sediment (-3m MSL) and permit entry to yachts. Environmental studies indicate that Stage 1 is expected to have a negligible effect on the lagoon. Later Stages 2 and 3 involve deepening and widening the channel and basin to allow container ships to berth at the quay. Further detailed study is required before any decision could be made on enlarging the channel and basin beyond Stage 1.
Objective: Stage 1 only: dredge the Arutanga Channel and basin and develop harbour facilities for yachts only.
Description of Works: Dredging the Arutanga Channel and existing boat turning and yacht basins to -3m MSL. Construction of sheet piled quay wall and concrete apron. Water, electricity and lighting could be provided additionally.
Features: Aitutaki has potential to attract visiting yachts which will provide additional tourism revenue. Facilities and control of waste disposal will be essential to protect the lagoon environment.
Estimated Beneficiaries: CIPA and yacht owners will be the chief beneficiaries. Population of Aitutaki will benefit indirectly.
Environmental Category: ADB category A: potential of significant impacts will require detailed environmental assessment and effective engineering design and construction standards.
Land Requirement: None Climate Change Adaptation Needs:
None
Project Cost Estimate: Capital Cost Estimate: $5.0 million Stage 1 only Annual O&M Cost Estimate: N/A included in CIPA and marina operator budgets
Implementation Options: CIPA will implement the project. Services to yachts could be developed by the private sector.

Appendix 5 53
Project Tracking Project Preparation Status Project Identification: Joint MOT-CIPA project proposal November 2003 Stakeholder Consultations:
Unknown
Feasibility Study: Preliminary quantities and cost estimates prepared by MOT. Engineering Design: None Land Acquisition: None Environmental Assessment:
Preliminary Assessment, Auckland Uniservices Ltd. (University of Auckland) April 2004
Procurement: None Construction: None Budget Allocation for O&M:
None
Project Implementation Status Funding Source: None Implementation Arrangements:
None
Contracting Method: Conventional tender through local competitive bidding to MFEM guidelines.
O&M Responsibility: CIPA Risk Assessment: Technical risk associated with engineering design is negligible.
Significant risk to the Aitutaki lagoon environment requires a detailed environmental impact assessment. Risks associated with construction quality, cost and schedule are substantial and effective project management and quality management will be required. Risk of O&M requirements failing to be achieved is low.
Implementation Schedule:
None
Current Status: None Profile Created: 18 October 2006 Current Version: 18 October 2006

54 Appendix 5
Project Profile
Project ID: RTW01RAR Sector: Roads Name: Rarotonga Road Safety Program Island: Rarotonga Location: Entire island Background/Rationale: Growth in vehicle registrations over the past five years has been 17%
p.a. for cars and 25% p.a. for motorcycles. Large numbers of tourists hire cars and motorcycles (in the latter case without proper testing and compulsory helmets). Road surfaces are generally acceptable but the narrow ROW, restricted sightlines and absence of footpaths, signage, reflectors or barriers at potential collision points create road safety hazards around the island. Until now accidents, serious injuries and deaths have been infrequent, due to the low traffic levels, but traffic conditions are changing rapidly particularly the mix of motorcycles and cars. A comprehensive road safety program addressing the four Es is needed: engineering, education, enforcement and emergency response.
Objective: To reduce the number of road accidents, serious injuries and deaths through a combination of initiatives to improve road engineering, public awareness, law enforcement and emergency response.
Description of Works: Road safety audit of all roads in Rarotonga combined with accident blackspot analysis to identify hazards. Design and implementation of a multi-year hazard elimination program. High-cost remedial actions may be delayed and incorporated into the road rehabilitation works. Review and strengthening of school and public awareness programs on road safety. Review and revisions of road legislation and rules where necessary including introduction of compulsory motorcycle helmets, seat belt usage and stronger drinking-driving rules. Strengthening police capacity for enforcement of road rules. Review and strengthen emergency reporting and ambulance service where needed.
Features: Road safety programs in other countries have demonstrated significant benefits in the form of savings in lives, lost incomes and property damage. Education, enforcement and most engineering measures are highly cost-effective. Cost recovery is possible through modest increases in road user fees.
Estimated Beneficiaries: Population of Rarotonga and visitors Environmental Category: ADB category C: No significant impacts as the project involves
improving the existing facilities Land Requirement: None Climate Change Adaptation Needs:
None
Project Cost Estimate: Capital Cost Estimate: $0.85 million over three years Annual O&M Cost Estimate: $75,000
Implementation Options: Task force comprising MOW, Police, Education and Health Ministries.

Appendix 5 55
Project Tracking Project Preparation Status Project Identification: Identified in ADB TA 4605-COO Infrastructure Master Plan Stakeholder Consultations:
Consultations with MOW
Feasibility Study: None Engineering Design: None Land Acquisition: None Environmental Assessment:
None
Procurement: None Construction: None
Project Implementation Status Funding Source: None Implementation Arrangements:
MOW to lead an inter-ministerial task force. Requires specialist consultant assistance.
Contracting Method: Most program components will be provided with in-house resources including minor engineering works. Conventional tender for services through local competitive bidding to MFEM guidelines will be used for major construction works. Contract administration and construction supervision by implementing agency.
O&M Responsibility: Primarily MOW and Police Department Risk Assessment: Failure of government to pass and enforce unpopular rules concerning
helmets, seat belts and drinking drivers. Failure to implement engineering measures due to land acquisition issues or disputes with landowners over obstacles. Failure to implement engineering measures due to capital budget constraints. Insufficient maintenance due to recurrent funds shortage
Implementation Schedule:
None
Current Status: None Profile Created: 18 October 2006 Current Version: 18 October 2006

56 Appendix 5
Project Profile
Project ID: RTW02RAR Sector: Roads Name: Rarotonga Traffic Management Improvements Island: Rarotonga Location: Avarua Background/Rationale: Growth in vehicle registrations over the past five years has been 17%
p.a. for cars and 25% p.a. for motorcycles. Avarua is experiencing a moderate level of traffic and parking congestion at peak periods. Lack of a parking plan and controls has already resulted in one business being closed to provide off-street parking in the waterfront area. Continued growth in the number of cars is a threat to the Avarua-Avatiu waterfront environment. Cost-effective traffic management measures have the potential to improve traffic flows, improve road safety and mitigate against adverse environmental impacts.
Objective: Develop a traffic management plan for the Avarua area which can be implemented in stages.
Description of Works: Traffic management study to inventory road and parking facilities, measure traffic and parking activities, forecast future traffic and examine options for improving traffic flows and provide needed parking capacity. Public consultations to gain community acceptance of measures being proposed. Measures are expected to include different forms of control over on-street parking, designation of long-term parking areas, installation of traffic signals, minor widening and turning lanes and pedestrian walkways. Program will involve strengthening MOW and Police Department traffic planning, regulations and enforcement procedures.
Features: The program has significant benefits in terms of enhancing the Avarua environment, reducing road user costs and improving road safety. Measures are low cost and can be implemented through a multi-year program.
Estimated Beneficiaries: Business merchants along the waterfront and Rarotonga population as a whole and visitors.
Environmental Category: ADB category C: No significant impacts as the project involves improving the existing facilities.
Land Requirement: Land areas may be required for minor road widening and provision of pedestrian walkways.
Climate Change Adaptation Needs:
Road geometry changes will provide an opportunity to improve drainage.
Project Cost Estimate: Capital Cost Estimate: $.28 million Annual O&M Cost Estimate: $50,000
Implementation Options: MOW will be implementing agency for the traffic study and introduction of improvements. Police Department will be responsible for enforcement.

Appendix 5 57
Project Tracking Project Preparation Status Project Identification: Identified in ADB TA 4605-COO Infrastructure Master Plan Stakeholder Consultations:
Consultations with MOW
Feasibility Study: None Engineering Design: None Land Acquisition: None Environmental Assessment:
None
Procurement: None Construction: None
Project Implementation Status Funding Source: None Implementation Arrangements:
MOW to lead an inter-ministerial task force. Requires specialist consultant assistance.
Contracting Method: Most program components will be provided with in-house resources including minor engineering works. For major engineering works conventional tender for services through local competitive bidding to MFEM guidelines will be used. Contract administration and construction supervision by implementing agency.
O&M Responsibility: Primarily MOW and Police Department Risk assessment: Failure to achieve community consensus on proposed measures
(‘tragedy of the commons’) Failure to implement engineering measures due to land acquisition issues or disputes with landowners over obstacles. Failure to implement engineering measures due to capital budget constraints. Insufficient maintenance due to recurrent funds shortage
Implementation Schedule:
None
Current Status: None Profile Created: 18 October 2006 Current Version: 18 October 2006

58 Appendix 5
Project Profile
Project ID: RTW03RAR Sector: Roads Name: Rarotonga Main Ring Road Rehabilitation Island: Rarotonga Location: Entire island Background/Rationale: The road has been widened and the pavement resealed progressively
over many years. The pavement is deteriorating continuously as a result of surface course aging, increasing heavy vehicles, installation of utility lines, insufficient maintenance budget to repair shoulders and drainage. Sections of the road close to the shoreline are under threat from storm surges (as evidenced in 2005). A road safety audit (Project RTW01RAR) will undoubtedly identify various road safety hazards which should be eliminated and the need for additional pedestrian walkways. The road will need rehabilitation in the next 5-10 years which will also provide the opportunity to improve road safety and provide better protection against climate change impacts.
Objective: Rehabilitate the inner ring road to renew surface condition, improve drainage, eliminate safety hazards and reduce risk of closures from severe weather events.
Description of Works: Topographic and geotechnical surveys, feasibility study, environmental assessment, detailed engineering design. Works are expected to include removal and recycling of DBST surfacing, spot repairs or reconstruction of road base, raising of embankment in low areas and resurfacing with an asphalt concrete or DBST pavement, replacement or widening of culverts and bridges as required, minor realignment to eliminate road hazards, construction of pedestrian walkways, signage and road markings.
Features: The project is expected to provide significant economic benefits in terms of reducing road user costs and improving road safety. The project may be implemented in stages over several years. A key constraint will be the availability of asphalt concrete plant and paving equipment which may affect staging and choice of surfacing.
Estimated Beneficiaries: Rarotonga population and visitors Environmental Category: ADB category B: Changes in alignment and drainage will require
careful study. Construction activities have potential for significant environmental damage and will need to be strictly controlled.
Land Requirement: Some minor land acquisition may be required. Climate Change Adaptation Needs:
Sections of road close to the foreshore or in low-lying areas may require adaptation measures such as foreshore armouring, raising of the road embankment and providing increased cross-drainage.
Project Cost Estimate: Capital Cost Estimate: $30 million in multi-year program Annual O&M Cost Estimate: $0.31 million per year
Implementation Options: MOW will be the implementing agency. Engineering and construction by private sector consulting engineers and contractors.

Appendix 5 59
Project Tracking Project Preparation Status Project Identification: Identified in ADB TA 4605-COO Infrastructure Master Plan Stakeholder Consultations:
Consultations with MOW
Feasibility Study: None Engineering Design: None Land Acquisition: None Environmental Assessment:
None
Procurement: None Construction: None
Project Implementation Status Funding Source: None Implementation Arrangements:
Feasibility study and environmental assessment will be first action required.
Contracting Method: Conventional tender through local competitive bidding to MFEM guidelines. Contract administration and construction supervision by implementing agency.
O&M Responsibility: MOW Risk assessment: Risks associated with construction quality, costs and schedule delays
are substantial and a suitably qualified and experienced contractor is required Maintenance not done properly due to funds shortage – ensure adequate provisions allocated under annual budgets
Implementation schedule: None Current Status: None
Profile Created: 18 October 2006 Current Version: 18 October 2006

60 Appendix 5
Project Profile
Project ID: RTW04RAR Sector: Roads Name: Rarotonga Inner Ring Road Development Island: Rarotonga Location: Entire island Background/Rationale: A 5.5 km section between Avarua and Pokoinu Road is being upgraded
with assistance from China. The remaining 15 km length is a winding, single-lane or narrow two-lane road with a DBST or SBST surface. The road is in fair condition for most of its length and traffic is light therefore routine and periodic maintenance will suffice for the foreseeable future. MOW would like to complete the three missing sections of the inner ring road to provide an integral alternative road around the island in the event the main ring road was cut as occurred in 2005. The missing section in Rutaki may be viable to provide an alternative route behind the Sheraton Hotel development. The remaining sections in Titikaveka and Muri require acquisition of a ROW across private lands which are forested, residential or used for market gardening.
Objective: Complete missing sections of the inner ring road to provide an alternative road route around the island.
Description of Works: Topographic and geotechnical surveys, feasibility study, environmental assessment, detailed engineering design, community consultations and land acquisition. Works are expected to include vegetation clearing, construction of road foundation and pavement with DBST surfacing, cross-drainage structures, signage and road markings.
Features: A feasibility study is needed to determine if the economic benefits are sufficient to justify the cost and significant management effort which will be required to implement this project successfully.
Estimated Beneficiaries: Population of south coast villages Environmental Category: ADB category A: Loss of agricultural and forest land may have
significant adverse environmental impacts. Construction activities have potential for environmental damage and will need to be strictly controlled.
Land Requirement: Estimated requirement is approximately 15ha (12km x 12m ROW) Climate Change Adaptation Needs:
Provision of adequate cross-drainage.
Project Cost Estimate: Capital Cost Estimate: $12 million Annual O&M Cost Estimate: $35,000
Implementation Options: MOW will be the implementing agency. Engineering and construction by private sector consulting engineers and contractors.

Appendix 5 61
Project Tracking Project Preparation Status Project Identification: MOW has identified the project for many years Stakeholder Consultations:
Consultations with MOW
Feasibility Study: None Engineering Design: None Land Acquisition: None Environmental Assessment:
None
Procurement: None Construction: None
Project Implementation Status Funding Source: None Implementation Arrangements:
Feasibility study and environmental assessment will be first action required.
Contracting Method: Conventional tender through local competitive bidding to MFEM guidelines. Contract administration and construction supervision by implementing agency.
O&M Responsibility: MOW Risk Assessment: Risks associated with construction quality, costs and schedule delays
are substantial and a suitably qualified and experienced contractor is required Maintenance not done properly due to funds shortage – ensure adequate provisions allocated under annual budgets
Implementation Schedule:
None
Current Status: None Profile Created: 18 October 2006 Current Version: 18 October 2006

62 Appendix 5
Project Profile
Project ID: RTW05AIT Sector: Roads Name: Aitutaki Road Improvements Island: Aitutaki Location: Entire island Background/rationale: Aitutaki has approximately 60 km of road with crushed coral base of
which 16 km were sealed with a Single Bituminous Surface Treatment (SBST) by MOW several years ago. This SBST will require an additional seal in the coming years which could be combined with other sealing work. The Island Administration has been extending the road network by constructing a crushed coral road base along the south and east shore. The Island Administration would like provide improve the cross-drainage on this road and seal it and unsealed sections of other roads.
Objective: To implement repairs and improvements in order to preserve the road assets
Description of Works: Topographic and geotechnical surveys, feasibility study, environmental assessment, detailed engineering design, community consultations and possibly minor land acquisition. Works are expected to construction of cross-drainage, raising of embankment where needed, SBST seal and resealing of existing SBST where needed, signage and road markings.
Features: A feasibility study is needed to determine if the scope of work. Estimated Beneficiaries: Population and visitors to Aitutaki Environmental Category: ADB category C: no significant impacts provided effective engineering
design and construction standards are observed Land Requirement: Minor land for drainage structures may be required. Climate Change Adaptation Needs:
Raising of road embankment and provision of adequate cross-drainage in low-lying areas.
Project Cost Estimate: Capital Cost Estimate: $3.3 million Annual O&M Cost Estimate: $ 0.2 million
Implementation Options: Implementing agency for construction has not been decided. When completed Island Administration will continue responsibility for O&M.

Appendix 5 63
Project Tracking Project Preparation Status Project Identification: Aitutaki Strategic Plan 2000-2005 Stakeholder Consultations:
Consultations with Island Council completed during island visit in October 2006.
Feasibility Study: None Engineering Design: None Land Acquisition: None Environmental Assessment:
None
Procurement: None Construction: None
Project Implementation Status Funding Source: None Implementation Arrangements:
Feasibility study and funding under AMD. Implementation responsibility yet to be determined.
Contracting Method: Conventional tender through local competitive bidding to MFEM guidelines. Contract administration and construction supervision by implementing agency.
O&M Responsibility: Island Administration Risk Assessment: Risks associated with construction quality, costs and schedule delays
are substantial and a suitably qualified and experienced contractor is required Maintenance not done properly due to funds shortage – ensure adequate provisions allocated under annual budgets
Implementation Schedule:
None
Current Status: None
Profile Created: 18 October 2006 Current Version: 18 October 2006

64 Appendix 5
Project Profile
Project ID: RTW06NAT Sector: Roads Name: Outer Islands Road Improvement Program Island: All except Aitutaki (separate project RTW05AIT) Location: Entire islands Background/rationale: The roads on the outer islands are mainly non-engineered crushed coral
pavements, except for small lengths of sealed road in the villages in Atiu and Mangaia. Traffic levels are very low, mainly trucks and motorbikes. Road surfaces can be maintained in good condition with adequate routine maintenance programs well within the capacity of the island administrations. All the road networks have some sections which require repairs or improvements outside of routine maintenance to ensure that they are passable in all but severe weather events. The focus should be on main roads connecting villages, emergency management centers, telecommunications, health, school, harbor and airport facilities.
Objective: Repair and improve the main roads on each island to ensure they are passable in all weather conditions.
Scope of Works: Topographical survey, hydrology study and basic engineering, specification and quantities estimates. Typical works will include spot reconstruction of pavements, raising the level of road foundations, installing or replacing culverts and reconstruction of retaining walls.
Features: Low-cost works to ensure accessibility to key facilities in all weather conditions. Works can be programmed for implementation by Island Administrations or can be appended to construction contracts for other civil works such as harbour, airport or water supply improvements.
Estimated Beneficiaries: Populations on all islands will benefit. Environmental Category: ADB category C: no significant impacts provided effective engineering
design and construction standards are observed Land Requirement: None Climate Change Adaptation Needs:
Raising of embankment and provision of adequate cross-drainage in low-lying areas.
Project Cost Estimate: Capital Cost Estimate: $2.4 million Annual O&M Cost Estimate: $0.1 million
Implementation Options: Most works can be implemented by the Island Administrations. Any major works could be appended to construction contracts for other civil works such as harbour, airport or water supply improvements.

Appendix 5 65
Project Tracking Project Preparation Status Project Identification: Outer Island Strategic Plans 2000-2005 Stakeholder Consultations:
Consultations with Island Councils completed during island visits in August and October 2006.
Feasibility Study: None Engineering Design: None Land Acquisition: None Environmental Assessment:
None
Procurement: None Construction: None
Project Implementation Status Funding Source: None Implementation Arrangements:
None
Contracting Method: None O&M Responsibility: Island Administration Risk Assessment: Risks associated with construction quality, costs and schedule delays
are substantial and a suitably qualified and experienced contractor is required Maintenance not done properly due to funds shortage – ensure adequate provisions allocated under annual budgets
Implementation Schedule:
None
Current Status: None
Profile Created: 12 October 2006 Current Version: 12 October 2006

66 Appendix 5
Project Profile
Project ID: RTW07RAR Sector: Roads Name: Inner Ring Road Improvement Nikao - Takuvaine Island: Rarotonga Location: Avarua Background/rationale: In 2005 a section of the main ring road west of the airport v-drain outfall
was damaged by Cyclone Olaf. Traffic was able to bypass the damage section using the inner ring road and Pokoinu Road. Although MOW was able to repair the main ring road very quickly, the incident demonstrated the importance of the inner ring road as an alternative route. The 5.5 km section of the inner ring road between Pokoinu Road and the Takuvaine roundabout is a narrow, windy two-lane road (5-6m carriageway) which is not suitable for carrying high volumes of traffic or heavy trucks. The pavement has deteriorated and presently requires continual repair. China is providing technical and financial assistance to improve this road by constructing an 8m roadway with a 6-7m two-lane carriageway within a 10m ROW. The horizontal alignment will be improved to provide a 40km/hr design speed which will require some land acquisition. Implementation will involve land acquisition for the ROW, relocation of utilities to the edge of the ROW and outside the new road foundation, construction of the new road and drainage structures. The agreement with China calls for CIGOV to be responsible for provision of the ROW and relocation of utilities before the Chinese contractor is mobilized to carry out the road construction works.
Objective: Provide an alternative route to carry traffic around the Avarua – Avatiu waterfront area in the event of cyclone damage to the main ring road, and to provide additional road capacity and increased road safety on the heavily trafficked existing inner ring road section between Avarua and Nikao.
Scope of Works: Topographical survey, hydrology study, engineering design, specification and quantities estimates. Cadastral survey to determine additional land required for the realigned ROW. Consultations with landowners and acquisition of lands required. No removal of houses is foreseen. Environmental impact assessment. Relocation of water, power and telecom lines to the edge of the ROW. Road construction works will include clearing of trees and hedges, removal of bituminous surfacing, reconstruction of the road foundation on the new alignment, provision of drainage, and resurfacing with DBST or asphalt cement pavement. Road signage, markings, lighting and barriers where needed.
Features: The project has high potential economic benefits given the likelihood that the main road will be closed again by cyclone activity. Conversely, the project requires land acquisition for the ROW and runs through environmentally sensitive areas in terms of homes, schools and mature forest. A very high level of quality management is needed to ensure the project achieves its objective without doing irreparable environmental damage.
Estimated Beneficiaries: All Rarotonga except residents along the route. Environmental Category: ADB category A: significant potential negative impacts. A full EIA is
required. Land Requirement: Slices of private property are required for the realigned ROW.
Climate Change Adaptation Needs:
The project is a direct climate change adaptation. Careful hydrology study is required to ensure adequate embankment height and cross drainage is provided.
Project Cost Estimate: Capital Cost Estimate:

Appendix 5 67
CIGOV contribution for utilities relocation $2.0 million CIGOV contribution for land acquisition is not known at this stage China contribution for construction is $5.0 million Annual O&M Cost Estimate: $15,000
Implementation Options: MOW is the implementation agency for the project and responsible for the utilities relocation, land acquisition and contract administration of the Chinese contractor. NES will be involved in the EIA.
Project Tracking
Project Preparation Status Project Identification: Completed Stakeholder Consultations:
Consultations with landowners over land acquisition and public consultations on environmental impacts have not taken place.
Feasibility Study: Nikao – Takuvaine Backroad Upgrading Project, Field Study Report, China Highway Planning & Design Institute (HPDI) Consultants Inc. August 2006
Engineering Design: Under way in China Land Acquisition: Not started Environmental Assessment:
Not started
Procurement: None Construction: None
Project Implementation Status Funding Source: CIGOV CAPEX and China Implementation Arrangements:
MOW is the implementing agency.
Contracting Method: For relocation of utilities conventional tender through local competitive bidding to MFEM guidelines. China will contract with a Chinese contractor for construction. Contract administration and construction supervision by China.
O&M Responsibility: MOW Risk Assessment: Risks associated with construction quality, costs and schedule delays
are substantial and a suitably qualified and experienced contractor is required Maintenance not done properly due to funds shortage – ensure adequate provisions allocated under annual budgets
Implementation Schedule:
2006-2008
Current Status: Field inspections, topographic survey and preliminary alignment design have been completed and land requirements determined. Next step will be consultations and land acquisition and EIA.
Profile Created: 12 October 2006 Current Version: 12 October 2006

68 Appendix 5
Project Profile
Project ID: WSW01RAR Sector: Water Supply Name: Rarotonga distribution mains network rehabilitation Island: Rarotonga Location: Entire island Background/Rationale: The Rarotonga distribution mains network is up to 40 years old in parts,
MOW has an ongoing program to replace old pipes. This is essential in order to reduce the high system losses and to eliminate infiltration of contaminants at the pipe joints. To date sections of the primary main have been replaced. Under this project the remainder of the network is rehabilitated.
Objective: To improve the delivery service to consumers and to reduce water losses.
Description of works: Replacement of old pipelines including relocation where required. Features: Project will improve service delivery to consumers
Reduced water loss through physical leakages in the system could lead to saving on a vital resource
Water quality will improve as new pipes replace the old corroded ones and less contaminants will infiltrate the distribution network
Will address some of the community concerns about the poor quality of water and the negative public perception of MOW
Would provide revenue if tariffs were to be put in place Estimated Beneficiaries: Some 14,000 people will benefit from a better water supply Environmental Category: ADB category C:
Project will have overall beneficial impact on existing sources. Project is essentially an asset replacement program, requiring only a review of environmental implications primarily during construction.
Land Requirement: None Climate change adaptation needs:
Erosion to piping from high intensity rainfall events
Project cost estimate: Capital cost estimate: $3.0 million O&M cost estimate: $150,000 per annum
Implementation options: Work should be outsourced to private sector O&M could be done by MOW or outsourced to private sector
Profile Created: 10 October 2006 Current Version: 10 October 2006

Appendix 5 69
Project Tracking
Last updated: 10 October 2006 Project Preparation Status Project Identification: Project is part of ongoing program by MOW. Stakeholder consultations:
Public announcements are needed to provide information of affected areas during construction.
Feasibility study: Not required Engineering design: Have been started Land acquisition: Not required Environmental assessment:
Identification of environmental implications during construction not yet started
Procurement: Not started Construction: Not started Budget allocation for O&M:
Not started
Project Implementation Status Funding Source: CIGOV national budget or loan Implementation Arrangements:
Primary responsibility for coordination/execution PDU* Implementation responsibility by MOW. Works should be done by outsourcing to private sector or possibly done in-house by MOW
Contracting Method: Conventional tender through international competitive bidding to MFEM/lending agency guidelines. Contract administration and construction supervision by implementing agency which in turn could do it in-house or outsource task.
O&M Responsibility: MOW or outsourced to private sector Risk assessment: Inefficient system operation – ensure efficient operation through:
o adequate training and periodic skill upgrade for operators and technicians;
o formalising need for annual performance audits to be done by independent (external) specialist
Maintenance not done properly due to shortage of funds – ensure adequate provisions allocated under annual budgets; consider introduction of tariffs
Implementation schedule:
Fiscal Year: To be determined through prioritisation and programming
Current Status: Need project prioritisation and approval *New PDU yet to be established. Presently such work is carried out by AMD.

70 Appendix 5
Project Profile
Project ID: WSW02RAR Sector: Water Supply Name: Installation of distribution system water meters on Rarotonga Island: Rarotonga Location: Entire island Background/Rationale: Given the very limited knowledge of the available yield of water sources,
water supplied, consumer demand and water losses, there is an acute need for improving the operational efficiency of the system. Meters should be installed at all water intakes, isolating valves should be installed in the distribution system to enable the tracking and quantifying of water losses and consumption by at least villages/ zones if not individual households. The data is also essential for planning and design purposes and for calculating tariffs and charges should they be introduced in the future
Objective: To improve the operational efficiency of the Rarotonga water supply system
Description of works: Procurement and installation of water meters or flow measuring devices at all intakes, isolation valves in the distribution system and bulk meters at inlets to zones/villages
Features: Project will improve operational efficiency and so reduce the cost of operation
Project will provide savings in capital expenditure on future upgrades because of the greater understanding of consumer demand, water use patterns and system performance
Will potentially improve the image of MOW as a service provider due to the better service delivery
Will yield data on water use and system operating costs to allow cost recovery tariffs to be calculated
Would provide revenue if tariffs were to be put in place Estimated Beneficiaries: The main beneficiary will be the operator. Indirectly all consumers will
benefit through improved service delivery Environmental Category: ADB category C:
Project will have overall beneficial impact on existing sources. Project is essentially an asset replacement program, requiring only a review of environmental implications primarily during construction.
Land Requirement: None Climate change adaptation needs:
None
Project cost estimate: Capital cost estimate: $0.20 million. O&M cost estimate: $10,000 per annum
Implementation options: Work should be outsourced to private sector O&M could be done by MOW or outsourced to private sector
Profile Created: 10 October 2006 Current Version: 10 October 2006

Appendix 5 71
Project Tracking
Last updated: 10 October 2006 Project Preparation Status Project Identification: Project is part of ongoing program by MOW. Stakeholder consultations:
Public announcements are needed to provide information of affected areas during construction.
Feasibility study: Not required Engineering design: Has been started Land acquisition: Not required Environmental assessment:
Identification of environmental implications during construction not yet started
Procurement: Not started Construction: Not started Budget allocation for O&M:
Not started
Project Implementation Status Funding Source: CIGOV national budget or loan Implementation Arrangements:
Primary responsibility for coordination/execution PDU* Implementation responsibility by MOW. Works should be done by outsourcing to private sector or possibly done in-house by MOW
Contracting Method: Conventional tender through national competitive bidding to MFEM/lending agency guidelines. Contract administration and construction supervision by implementing agency which in turn could do it in-house or outsource task.
O&M Responsibility: MOW or outsourced to private sector Risk assessment: Inefficient system operation – ensure efficient operation through:
o adequate training and periodic skill upgrade for operators and technicians;
o formalising need for annual performance audits to be done by independent (external) specialist
Maintenance not done properly due to shortage of funds – ensure adequate provisions allocated under annual budgets; consider introduction of tariffs
Implementation schedule:
Fiscal Year: To be determined through prioritisation and programming
Current Status: Need project prioritisation and approval *New PDU yet to be established. Presently such work is carried out by AMD.

72 Appendix 5
Project Profile
Project ID: WSW03RAR Sector: Water Supply Name: Construction of Rarotonga water treatment facilities Island: Rarotonga Location: To be determined Background/Rationale: Existing water supplies are not disinfected so that consumers either boil
the tap water or buy bottled water for potable use. Water-borne diseases are noticeable on the island. Intakes on the streams are only fitted with basic rock filters to take out coarse sediments consequently piped water is highly turbid during heavy rainfall periods. If a fee for service is to be introduced in the future, consumers will expect that the tap water be suitable for drinking purposes. As a public water supply provider, MOW is at risk of litigation in case of users becoming ill from drinking non-potable tap water. Therefore, it is essential; that Rarotonga water supply be treated to enable year around delivery of potable standard water. Prerequisite for this project: Rarotonga water supply treatment feasibility study (Project ID WSS03RAR).
Objective: Provide potable water to all consumers on the island Description of works: Design and construction of a number of water treatment plants including
sedimentation, filtration and disinfection units, clear water storages, instrumentation and chemical dosing facilities.
Features: Access to drinking water on tap will provide savings to consumers as they will not have to buy bottled water or boil the tap water
Project will enhance Rarotonga as a tourist destination through a better quality lifestyle as access to drinking water is perceived as a sign of a more developed society
Water quality will be monitored frequently thus ensuring minimal risk to public health
Community will have an opportunity to participate and support the project through providing equity in the form of land transfer
Would provide revenue if tariffs were to be put in place Operation could be outsourced to private sector
Estimated Beneficiaries: 14,000 people including tourists will benefit from a better water supply Environmental Category: ADB category C: Project will have overall beneficial impact on existing
sources. Need to address disposal of sludge from treatment plants Land Requirement: New site is required for water treatment facilities Climate change adaptation needs:
Protection of water treatment plants and storage systems from cyclone damage and flooding. If any sited close to the foreshore then storm surges will be an impact.
Project cost estimate: Capital cost estimate: $7.0 million. Note: estimate of incremental cost of climate change adaptation works included in capital cost above is $100,000.
O&M cost estimate: $400,000 per annum Implementation options: Work should be outsourced to private sector.
O&M could be outsourced to private sector or done by MOW. Profile Created: 10 October 2006 Current Version: 10 October 2006

Appendix 5 73
Project Tracking
Last updated: 10 October 2006 Project Preparation Status Project Identification: Project has been identified through the ADB preventive infrastructure
master planning study. (ADB TA4605) Stakeholder consultations:
Community consultation will be required for location of the treatment plants. The local community should be kept informed of the planned works to ensure its support.
Feasibility study: Will be required and is a prerequisite for proceeding Engineering design: Not yet started – completion of feasibility study Is a prerequisite Land acquisition: Sites yet to be identified Environmental assessment:
Not yet started
Procurement: Not started Construction: Not started Budget allocation for O&M:
Not started
Project Implementation Status Funding Source: CIGOV national budget or loan Implementation Arrangements:
Primary responsibility for coordination/execution PDU* Implementation responsibility by MOW. Works should be done by outsourcing to private sector or possibly done in-house by MOW
Contracting Method: Conventional tender through international competitive bidding to MFEM/lending agency guidelines. Contract administration and construction supervision by implementing agency which in turn could do it in-house or outsource task
O&M Responsibility: MOW or outsourced to private sector Risk assessment: Community will not provide land for treatment plants – ensure
community participation throughout the project Inefficient system operation – ensure efficient operation through:
o engaging international operator during first year to run the system and train the local operators before handing over;
o conduct periodic skill upgrade for operators and technicians; o formalising need for annual performance audits to be done by
independent (external) specialist Water quality fails to meet the WHO guidelines or Cook Islands
standards for drinking water – o provide adequate training for operators to reduce risk; o operator to keep log of water quality tests and provide annual
report on water quality and non compliance records; o empower MOH to enforce compliance with standards including
imposition of penalties for non-compliance; Maintenance not done properly due to shortage of funds – ensure
adequate provisions allocated under annual budgets; consider introduction of tariffs
Implementation schedule:
Fiscal Year: To be determined through prioritisation and programming
Current Status: Need project prioritisation and go ahead for feasibility study *New PDU yet to be established. Presently such work is carried out by AMD.

74 Appendix 5
Project Profile
Project ID: WSW04RAR Sector: Water Supply Name: Supply and installation of property connection meters on Rarotonga Island: Rarotonga Location: Entire island Background/Rationale: Currently water is supplied to properties unmetered and at no cost to the
consumer. This is inefficient and wasteful use of a finite resource. As further efficiency improvement, property service meters are to be installed. This will not only help in refining planning and design criteria, but will create awareness in consumers for the need to use the water wisely. The data will also form the basis for calculating tariffs and charges should they be introduced in the future Legislation for cost recovery and the Rarotonga water supply treatment feasibility study (Project ID WSS03RAR) are prerequisites for this project.
Objective: To improve the operational efficiency of the Rarotonga water supply system
Description of works: Procurement and installation of property service meters for all consumers (approx 2,600). The works will involve the water meter, isolating valve, non-return valve, connecting service pipe and meter box.
Features: Project will improve operational efficiency and so reduce cost of operation
Project will provide savings in capital expenditure on future upgrades because of the greater understanding of consumer demand and water use patterns
Will yield data on water use and allow cost recovery tariffs to be calculated
Will provide revenue once tariffs are put in place Estimated Beneficiaries: The main beneficiary will be the operator. Indirectly all consumers will
benefit through improved service delivery Environmental Category: ADB category C:
Project will have no environmental impact except for temporary disruptions during construction. A review of environmental implications will suffice.
Land Requirement: None Climate change adaptation needs:
None
Project cost estimate: Capital cost estimate: $1.20 million. O&M cost estimate: $40,000 per annum
Implementation options: Work should be outsourced to private sector O&M could be done by MOW or outsourced to private sector
Profile Created: 10 October 2006 Current Version: 10 October 2006

Appendix 5 75
Project Tracking
Last updated: 10 October 2006 Project Preparation Status Project Identification: Project has been identified through the ADB preventive infrastructure
master planning study. (ADB TA4605) Stakeholder consultations:
Public consultation is needed to explain the reason for introducing the property service meters. Public announcements are needed to provide information of affected areas during construction.
Feasibility study: Not required. However a tariff study (part of the Rarotonga water supply treatment feasibility study, project ID WSS03RAR) should be completed prior to commencement of meter installation program
Engineering design: Not started Land acquisition: Not required Environmental assessment:
Identification of environmental implications during construction not yet started
Procurement: Not started Construction: Not started Budget allocation for O&M:
Not started
Project Implementation Status Funding Source: CIGOV national budget or loan Implementation Arrangements:
Primary responsibility for coordination/execution PDU* Implementation responsibility by MOW. Works should be done by outsourcing to private sector or possibly done in-house by MOW
Contracting Method: Conventional tender through national competitive bidding to MFEM/lending agency guidelines. Contract administration and construction supervision by implementing agency which in turn could do it in-house or outsource task.
O&M Responsibility: MOW or outsourced to private sector Risk assessment: Consumers reject the idea of metering and tariffs – ensure extensive
community consultation prior to project commencement Incorrect meter readings can lead to revenue shortfalls and mistrust by
consumers if they suspect errors – ensure efficient operation through: o adequate training and periodic skill upgrade for readers
technicians; o periodically check accuracy of meters (conduct a 5-year meter
replacement program) Maintenance not done properly due to shortage of funds – ensure
adequate provisions allocated under annual budgets; Implementation schedule:
Fiscal Year: To be determined through prioritisation and programming
Current Status: Need project prioritization and findings of the tariff study for commencement. Legislation on cost recovery must also be in place.
*New PDU yet to be established. Presently such work is carried out by AMD.

76 Appendix 5
Project Profile
Project ID: WSW05RAR Sector: Water Supply Name: Rarotonga water loss reduction program Island: Rarotonga Location: Entire island Background/Rationale: Based on verbal advice water loss from the Rarotonga water supply
system is up to 70%. This is not sustainable and needs priority action. Although a large percentage of the losses will be eliminated under the mains pipeline rehabilitation program (Project ID WSW01RAR), significant losses are expected in the tertiary pipe system (small diameter and property connecting pipelines). A systematic water loss program is required to eliminate these through location of the losses and replacement of pipes and meters. Rarotonga water loss study (Project ID WSS01RAR) is a prerequisite.
Objective: To reduce water losses to 15% of production Description of works: The project will comprise purchase of loss detection equipment,
replacement of pipes and fittings and monitoring of the performance in each zone or village to achieve target reduction in losses.
Features: Project will result in significant savings in water for Rarotonga Project will enable cost savings for MOW resulting in more efficient
system operation Savings could be passed onto consumers in the form of lower tariffs (if
they were introduced) Estimated Beneficiaries: Mainly the operator, MOW. However. 1,500 households would also
benefit indirectly through lower tariffs. Environmental Category: ADB category C:
Project will have no environmental impact except for temporary disruptions during construction. A review of environmental implications will suffice.
Land Requirement: None required Climate change adaptation needs:
Protection of the system and piping from storm surge erosion and high intensity rainfall events
Project cost estimate: Capital cost estimate: $0.50 million. O&M cost estimate: $440,000 per annum
Implementation options: Work should be outsourced to private sector O&M could be done by MOW or outsourced to private sector
Profile Created: 10 October 2006 Current Version: 10 October 2006

Appendix 5 77
Project Tracking
Last updated: 10 October 2006 Project Preparation Status Project Identification: Project has been identified through the ADB preventive infrastructure
master planning study. (ADB TA4605) Stakeholder consultations:
Public announcements will be required to provide information of affected areas during operation. The publicity will also help to build the image of the MOW
Feasibility study: The Rarotonga water loss reduction study (Project ID WSS01RAR) is a prerequisite for proceeding with the program
Engineering design: Not required Land acquisition: Not required. Environmental assessment:
Identification of environmental implications during construction not yet started
Procurement: Not yet started Construction: Not yet started Budget allocation for O&M:
Not yet started
Project Implementation Status Funding Source: CIGOV national budget or loan Implementation Arrangements:
Primary responsibility for coordination/execution PDU* Implementation responsibility by MOW. Works should be done by outsourcing to private sector or possibly done in-house by MOW
Contracting Method: Conventional tender through international competitive bidding to MFEM/lending agency guidelines. Contract administration and construction supervision by implementing agency which in turn could do it in-house or outsource task.
O&M Responsibility: MOW or outsourced to private sector Risk assessment: Poor construction resulting in not achieving loss reduction targets –
ensure good standard in workmanship Water loss reduction stays above target despite loss reduction
program – could be due to other forms of non revenue water such as illegal or unknown connections to the system or incorrect water meter readings. o Check system from time to time for illegal connections; o Randomly audit water meter readings taken by readers
Maintenance not done properly due to shortage of funds – ensure adequate provisions allocated under annual budgets;
Implementation schedule:
Fiscal Year: To be determined through prioritisation and programming
Current Status: Need project prioritisation and findings of loss reduction study for approval
*New PDU yet to be established. Presently such work is carried out by AMD.

78 Appendix 5
Project Profile
Project ID: WSW06SGI Sector: Water Supply Name: Southern islands EMC water storages rehabilitation reconstruction Island: Aitutaki, Mangaia, Atiu, Mauke and Mitiaro Location: On all of the habited islands in the Southern Group Background/Rationale: The lessons learned from the cyclones in 2005 are that the sources of
supply, particularly on islands which depend on stored rainwater, need greater protection as contamination by seawater could severely reduce the available supplies of potable water at a time when replenishment by shipping is hampered by rough seas. The current initiative to install underground storages under micro-shelters and strengthen community tanks at the evacuation management centres (EMC) has merit and should be extended to all islands.
Objective: To improve water supply facilities at the EMC on all islands in the southern group including climate change adaptation measures.
Description of works: Install covers to all community tanks and ensure that they are “spray proof”. Structural design of the tanks will be suitable for predicted climate adaptation needs identified in the updated building.
Features: Project will provide safe drinking water to residents taking shelter in the EMC.
Estimated Beneficiaries: Some 4,000 people on the southern islands Environmental Category: ADB category C:
Project will have no environmental impact except for temporary disruptions during construction. A review of environmental implications will suffice.
Land Requirement: All existing sites, no new acquisitions required Climate change adaptation needs:
Adequate sizing of tanks during drought conditions, foundation erosion during high intensity rainfall events, as well as structural strengthening and spray protection measures
Project cost estimate: Capital cost estimate: $0.10 million (total 5 islands) Note: estimate of incremental cost of climate change adaptation works included in capital cost above is $10,000.
O&M cost estimate: $20,000 per annum (total 5 islands) Implementation options: Work should be outsourced to private sector or done by Island
Administrations O&M could be done by Island Administrations or outsourced to the private sector
Profile Created: 10 October 2006 Current Version: 10 October 2006

Appendix 5 79
Project Tracking
Last updated: 10 October 2006 Project Preparation Status Project Identification: Project has been identified through the ADB preventive infrastructure
master planning study. (ADB TA4605) Stakeholder consultations:
Not required
Feasibility study: Not required Engineering design: Not yet started Land acquisition: Not required Environmental assessment:
Not required
Procurement: Not started Construction: Not started Budget allocation for O&M:
Not started
Project Implementation Status Funding Source: CIGOV national budget or loan Implementation Arrangements:
Primary responsibility for coordination/execution PDU* Implementation responsibility by OMIA. Works should be done by outsourcing to private sector or possibly done by Island Administrations
Contracting Method: Conventional tender through national competitive bidding to MFEM guidelines. Contract administration and construction supervision by implementing agency which in turn could do it in-house or outsource task.
O&M Responsibility: Island Administrations or outsourced to private sector Risk assessment: Maintenance not done properly due to shortage of funds –
o ensure adequate provisions allocated under annual budgets o provide adequate training for operators to reduce risk; o formalize need for checking of facilities as part of the annual EMC
preparedness audits to be done by EMCI Implementation schedule:
Fiscal Year: To be determined through prioritisation and programming
Current Status: Need project prioritisation and approval *New PDU yet to be established. Presently such work is carried out by AMD.

80 Appendix 5
Project Profile
Project ID: WSW07AIT Sector: Water Supply Name: Aitutaki water supply headworks upgrade Island: Aitutaki Location: Vaipeka, Tautu, Vaipae bore and pump stations Background/Rationale: All of Aitutaki’s water supply is derived from groundwater sources. Some
of the pumps are in need of repair because they are nearing the end of their useful life and due to the heavy usage and the corrosive environment. The operation of the entire system needs to be optimized as several storages are often empty or not in use and supplies to entire zones are often turned off for a couple of days without prior notice to consumers. This is a cause of numerous complaints. Existing sources are nearing their safe yields and others are already over-pumped. Therefore, new sources will need to be developed. Refer also to Aitutaki water investigation reports by Tony Falkland.
Objective: To provide adequate water supply to consumers and improve the reliability of the by optimizing the system operation
Description of works: The works will comprise overhaul/replacement of pumps at Vaipeka No 2 and Tautu pump stations, reconfiguring the Vaipae storages to make use of the lower tank for supplying the nearby areas and repairing or replacing all inoperable water meters. In addition, a system operation optimization study will be undertaken to improve the operational efficiency of the pumps and storage. A new source will be developed to augment the existing bores.
Features: The project will result in the provision of more reliable service to consumers and adequate volumes of water supply
Improved delivery of water service to consumers (meet minimum level of service) and address of community complaints about the irregular and disrupted service
Provides some savings to users as they will not have to buy additional water to meet household demand
Improved living standards – don’t have to spend time carting water Provides an opportunity for private sector involvement Would provide revenue if tariffs were to be introduced
Estimated Beneficiaries: Some 2,000 people including tourists on the island Environmental Category: ADB category B:
Project will involve the development of a new water source and therefore an IEE will be required to determine if a full EIA is needed
Land Requirement: Land will be required for the new headworks – pump station and bore. Climate change adaptation needs:
Storages and structures need to be designed to take into account expected climate change impacts
Project cost estimate: Capital cost estimate: $0.35 million Note: estimate of incremental cost of climate change adaptation works included in capital cost above is $10,000.
O&M cost estimate: $10,000 Implementation options: Work should be outsourced to private sector
O&M could be done by Island Administration or outsourced to private sector
Profile Created: 10 October 2006 Current Version: 10 October 2006
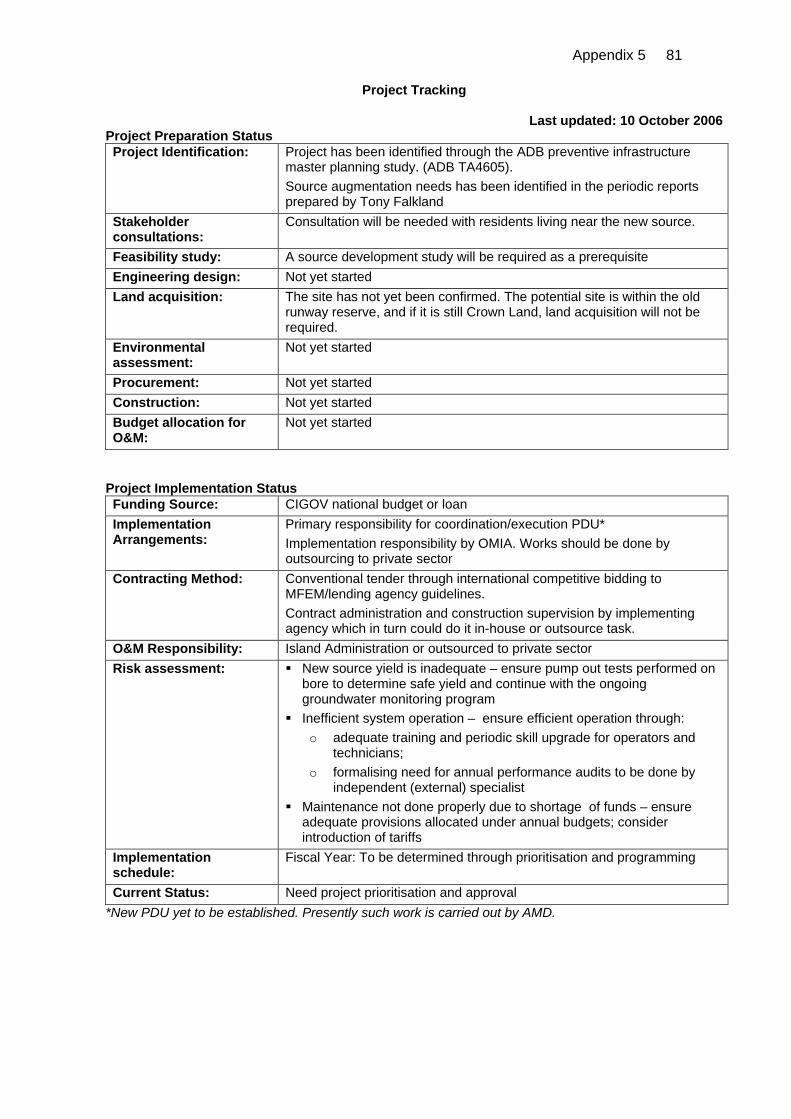
Appendix 5 81
Project Tracking
Last updated: 10 October 2006 Project Preparation Status Project Identification: Project has been identified through the ADB preventive infrastructure
master planning study. (ADB TA4605). Source augmentation needs has been identified in the periodic reports prepared by Tony Falkland
Stakeholder consultations:
Consultation will be needed with residents living near the new source.
Feasibility study: A source development study will be required as a prerequisite Engineering design: Not yet started Land acquisition: The site has not yet been confirmed. The potential site is within the old
runway reserve, and if it is still Crown Land, land acquisition will not be required.
Environmental assessment:
Not yet started
Procurement: Not yet started Construction: Not yet started Budget allocation for O&M:
Not yet started
Project Implementation Status Funding Source: CIGOV national budget or loan Implementation Arrangements:
Primary responsibility for coordination/execution PDU* Implementation responsibility by OMIA. Works should be done by outsourcing to private sector
Contracting Method: Conventional tender through international competitive bidding to MFEM/lending agency guidelines. Contract administration and construction supervision by implementing agency which in turn could do it in-house or outsource task.
O&M Responsibility: Island Administration or outsourced to private sector Risk assessment: New source yield is inadequate – ensure pump out tests performed on
bore to determine safe yield and continue with the ongoing groundwater monitoring program
Inefficient system operation – ensure efficient operation through: o adequate training and periodic skill upgrade for operators and
technicians; o formalising need for annual performance audits to be done by
independent (external) specialist Maintenance not done properly due to shortage of funds – ensure
adequate provisions allocated under annual budgets; consider introduction of tariffs
Implementation schedule:
Fiscal Year: To be determined through prioritisation and programming
Current Status: Need project prioritisation and approval *New PDU yet to be established. Presently such work is carried out by AMD.

82 Appendix 5
Project Profile
Project ID: WSW08AIT Sector: Water Supply Name: Construction of Aitutaki water treatment plants Island: Aitutaki Location: To be determined Background/Rationale: Existing water supplies are not disinfected so consumers either boil the
tap water or buy bottled water for potable use. Water-borne diseases are noticeable on the island. The quality of the groundwater is moderately hard and salinity levels vary from passable to almost brackish depending on the source. Consequently, most people use the piped water for only non-potable purposes. Tourist places have to rely on their own water treatment systems to cater for tourists. If a fee for service is to be introduced in the future, consumers will expect that the tap water be suitable for drinking purposes. As the second most important island economy in the country, it is essential that Aitutaki water supply be treated to enable year around delivery of potable standard water. Prerequisite for this project: Aitutaki water supply treatment feasibility study (Project ID WSS04AIT).
Objective: To provide potable water to all consumers on the island Description of works: Design and construction of a number of water treatment plants including
process and disinfection units, clear water storages, instrumentation and chemical dosing facilities.
Features: Access to drinking water on tap will provide savings to consumers as they will not have to buy bottled water or boil the tap water
Project will enhance Aitutaki as a tourist destination through a better quality lifestyle as access to drinking water is perceived as a sign of a more developed society
Water quality will be monitored to ensure minimal risk to public health Community will have an opportunity to participate and support the
project through providing equity in the form of land transfer Would provide revenue if tariffs were to be put in place Operation could be outsourced to private sector
Estimated Beneficiaries: Some 2,000 people including tourists will benefit from a better water supply
Environmental Category: ADB category C: Project will have overall beneficial impact on existing sources. Need to address disposal of sludge from treatment plants
Land Requirement: New site is required for water treatment facilities Climate change adaptation needs:
Ensure water treatment plants and storages are protected from high winds, cyclone damage, and flooding due to intense rainfall.
Project cost estimate: Capital cost estimate: $1.5 million. Note: estimate of incremental cost of climate change adaptation works included in capital cost above is $30,000
O&M cost estimate: $200,000 per annum Implementation options: Work should be outsourced to private sector
Operation and maintenance could be outsourced to private sector or done by Island Administration
Profile Created: 10 October 2006 Current Version: 10 October 2006

Appendix 5 83
Project Tracking
Last updated: 10 October 2006 Project Preparation Status Project Identification: Project has been identified through the ADB preventive infrastructure
master planning study. (ADB TA4605) Stakeholder consultations:
Community consultation will be required to ascertain willingness to pay for such a facility and for location of the treatment plants.
Feasibility study: Will be required and is a prerequisite for proceeding Engineering design: Not yet started – completion of feasibility study Is a prerequisite Land acquisition: Sites yet to be identified Environmental assessment:
Not yet started
Procurement: Not started Construction: Not started Budget allocation for O&M:
Not started
Project Implementation Status Funding Source: CIGOV national budget or loan Implementation Arrangements:
Primary responsibility for coordination/execution PDU* Implementation responsibility by OMIA. Works should be done by outsourcing to private sector
Contracting Method: Conventional tender through international competitive bidding to MFEM/lending agency guidelines. Contract administration and construction supervision by implementing agency which in turn could outsource task
O&M Responsibility: Island Administration or outsourced to private sector Risk assessment: Community will not provide land for treatment plants – ensure
community participation throughout the project Inefficient system operation – ensure efficient operation through:
o engaging international operator during first year to run the system and train the local operators before handing over;
o conduct periodic skill upgrade for operators and technicians; o formalising need for annual performance audits to be done by
independent (external) specialist Water quality fails to meet the WHO guidelines or Cook Islands
standards for drinking water – o provide adequate training for operators to reduce risk; o operator to keep log of water quality tests and provide annual
report on water quality and non compliance records; o empower MOH to enforce compliance with standards including
imposition of penalties for non-compliance/ Maintenance not done properly due to shortage of funds – ensure
provisions allocated under annual budgets; must introduce tariffs Implementation schedule:
Fiscal Year: To be determined through prioritisation and programming
Current Status: Need project prioritisation and go ahead for feasibility study *New PDU yet to be established. Presently such work is carried out by AMD.

84 Appendix 5
Project Profile
Project ID: WSW09SGI Sector: Water Supply Name: Construction of disinfection facilities on the southern islands Island: Mangaia, Atiu, Mauke and Mitiaro Location: At sites to be determined on islands in the project Background/Rationale: Existing water supplies are not disinfected so consumers either boil the
tap water or buy bottled water for potable use. The quality of the groundwater is moderately hard and salinity levels vary from passable to brackish depending on the source and island. Consequently, most people use the piped water primarily for non-potable purposes. If a fee for service were to be introduced in the future, consumers will expect that the tap water be suitable for drinking purposes. Full treatment is unrealistic in the foreseeable future however disinfection would enable the water to be utilized for potable use provided that salinity is acceptable.
Objective: Provide potable quality water to all consumers on the island Description of works: Design and install disinfection facilities at the downstream end of the
headworks in each system. Typically, groundwater is used on most of the southern islands and so turbidity levels are very low. The low turbidity and small areal coverage of the distribution system is well suited to the use of simple to operate UV radiation tubes for disinfection. Other items will comprise a small shed, spare tubes, basic instrumentation and record keeping facilities.
Features: Access to drinkable water on tap will provide savings to consumers as they will not have to boil the water
Would provide revenue if tariffs were to be put in place O&M of the system could be outsourced to private sector
Estimated Beneficiaries: 2,100 people will benefit from a better water supply Environmental Category: ADB category C:
Project will have overall beneficial impact on existing sources Land Requirement: None required. Disinfection units could be accommodated on existing
storage sites Climate change adaptation needs:
Ensure adequate protection from high winds and increased high intensity rainfall.
Project cost estimate: Capital cost estimate: $0.20 million (total for 4 islands). Note: estimate of incremental cost of climate change adaptation works included in capital cost above is $10,000.
O&M cost estimate: $20,000 per annum (total for 4 islands) Implementation options: Work should be outsourced to private sector
Operation and maintenance could be done by the Island Administrations of outsourced to private sector
Profile Created: 10 October 2006 Current Version: 10 October 2006

Appendix 5 85
Project Tracking
Last updated: 10 October 2006 Project Preparation Status Project Identification: Project has been identified through the ADB preventive infrastructure
master planning study. (ADB TA4605) Stakeholder consultations:
Community consultation will be required to ascertain willingness to pay for such a facility
Feasibility study: Will including willingness to pay will required and is a prerequisite for proceeding
Engineering design: Not yet started – completion of feasibility study Is a prerequisite Land acquisition: Sites yet to be identified Environmental assessment:
Not yet started
Procurement: Not started Construction: Not started Budget allocation for O&M:
Not started
Project Implementation Status Funding Source: CIGOV national budget or loan Implementation Arrangements:
Primary responsibility for coordination/execution PDU* Implementation responsibility by OMIA. Works should be done by outsourcing to private sector
Contracting Method: Conventional tender through international competitive bidding to MFEM/lending agency guidelines. Contract administration and construction supervision by implementing agency which in turn could outsource task
O&M Responsibility: Island Administration or outsourced to private sector Risk assessment: Community will not support the project– ensure community
participation throughout the project Inefficient system operation – ensure efficient operation through:
o conduct periodic skill upgrade for operators and technicians; o formalising need for annual performance audits to be done by
independent (external) specialist Water quality fails to meet the WHO guidelines for drinking water –
o provide adequate training for operators to reduce risk; o operator to keep log of water quality tests and provide annual
report on water quality and non compliance records; o empower MOH to enforce compliance with standards including
imposition of penalties for non-compliance; Maintenance not done properly due to shortage of funds – ensure
adequate provisions allocated under annual budgets; must introduce tariffs
Implementation schedule:
Fiscal Year: To be determined through prioritisation and programming
Current Status: Need project prioritisation and go ahead for feasibility study *New PDU yet to be established. Presently such work is carried out by AMD.

86 Appendix 5
Project Profile
Project ID: WSW10SGI Sector: Water Supply Name: Installation of property service meters on the southern islands Island: Aitutaki, Mangaia, Atiu, Mauke and Mitiaro Location: entire island on each island of the Southern Group Background/Rationale: Currently water supplied to properties is not metered and is provided at
no cost to the consumer. This is an inefficient and wasteful use of a finite resource. The installation of property service meters is proposed as an efficiency improvement and to promote water conservation. This will not only help in refining planning and design criteria, but will create awareness in consumers for the need to use the water wisely. The data will also form the basis for calculating tariffs and charges should they be introduced in the future Legislation for cost recovery and a feasibility study on tariffs for the southern islands (Project ID WSS05SGI) are prerequisites for this project.
Objective: To improve the operational efficiency of the water supply systems in the southern islands
Description of works: Procurement and installation of property service meters for all consumers (approx 1,000). The works will involve the water meter, isolating valve, non-return valve, connecting service pipe and meter box.
Features: Project will improve operational efficiency and so reduce cost of operation
Project will provide savings in capital expenditure on future upgrades because of the greater understanding of consumer demand and water use patterns
Will yield data on water use and allow cost recovery tariffs to be calculated
Will provide revenue once tariffs are put in place Estimated Beneficiaries: The main beneficiary will be the operator. Indirectly all consumers will
benefit through improved service delivery. Environmental Category: ADB category C:
Project will have no environmental impact except for temporary disruptions during construction. A review of environmental implications will suffice.
Land Requirement: None Climate change adaptation needs:
None
Project cost estimate: Capital cost estimate: $0.50 million. O&M cost estimate: $40,000 per annum
Implementation options: Work should be outsourced to private sector O&M could be done by MOW or outsourced to private sector
Profile Created: 10 October 2006 Current Version: 10 October 2006

Appendix 5 87
Project Tracking
Last updated: 10 October 2006 Project Preparation Status Project Identification: Project has been identified through the ADB preventive infrastructure
master planning study. (ADB TA4605) Stakeholder consultations:
Public consultation is needed to explain the reason for introducing the property service meters. Public announcements are needed to provide information of affected areas during construction.
Feasibility study: Not required. However a tariff study (project ID WSS05SGI) should be completed prior to commencement of meter installation program
Engineering design: Not started Land acquisition: Not required Environmental assessment:
Identification of environmental implications during construction not yet started
Procurement: Not started Construction: Not started Budget allocation for O&M:
Not started
Project Implementation Status Funding Source: CIGOV national budget or loan Implementation Arrangements:
Primary responsibility for coordination/execution PDU* Implementation responsibility by OMIA. Works should be done by outsourcing to private sector or possibly done by Island Administrations
Contracting Method: Conventional tender through national competitive bidding to MFEM/lending agency guidelines. Contract administration and construction supervision by implementing agency which in turn could do it in-house or outsource task.
O&M Responsibility: Island Administrations or outsourced to private sector Risk assessment: Consumers reject the idea of metering and tariffs – ensure extensive
community consultation prior to project commencement Incorrect meter readings can lead to revenue shortfalls and mistrust by
consumers if they suspect errors – ensure efficient operation through: o adequate training and periodic skill upgrade for readers
technicians; o periodically check accuracy of meters (conduct a 5-year meter
replacement program) Maintenance not done properly due to shortage of funds – ensure
adequate provisions allocated under annual budgets; Implementation schedule:
Fiscal Year: To be determined through prioritisation and programming
Current Status: Need project prioritization and findings of the tariff study for commencement. Legislation on cost recovery must also be in place.
*New PDU yet to be established. Presently such work is carried out by AMD.

88 Appendix 5
Project Profile
Project ID: WSW11NGI Sector: Water Supply Name: Northern islands EMC water storages rehabilitation or construction Island: Palmerston, Pukapuka, Nassau, Manihiki, Rakahanga and Penrhyn Location: Several locations over island on each island of the Northern Group Background/Rationale: The lessons learned from the cyclones in 2005 are that the sources of
supply, particularly on islands which depend on stored rainwater, need greater protection as contamination by seawater could severely reduce the available supplies of potable water at a time when replenishment by shipping is hampered by rough seas. The current initiative to install underground storages under micro-shelters and strengthen community tanks at the evacuation management centres (EMC) has merit and should be extended to all islands.
Objective: Improve water supply facilities at the EMC on all islands in the southern group including climate change adaptation measures.
Description of works: Install covers to all community tanks and ensure that they are “spray proof”. Structural design of the tanks will be suitable for predicted climate adaptation needs identified in the updated building.
Features: Project will provide safe drinking water to residents taking shelter in the EMC.
Estimated Beneficiaries: Some 1,800 people on the northern islands Environmental Category: ADB category C:
Project will have no environmental impact except for temporary disruptions during construction. A review of environmental implications will suffice.
Land Requirement: All existing sites, no new acquisitions required Climate change adaptation needs:
Adequate tank sizing for during periods of droughts. Siting of tanks may be at risk from storm surge. Structural strengthening and spray protection measures needed
Project cost estimate: Capital cost estimate: $0.10 million (total 6 islands) Note: estimate of incremental cost of climate change adaptation works included in capital cost above is $10,000.
O&M cost estimate: $30,000 per annum (total 6 islands) Implementation options: Work should be outsourced to private sector or done by Island
Administrations O&M could be done by Island Administrations or outsourced to the private sector
Profile Created: 10 October 2006 Current Version: 10 October 2006

Appendix 5 89
Project Tracking
Last updated: 10 October 2006 Project Preparation Status Project Identification: Project has been identified through the ADB preventive infrastructure
master planning study. (ADB TA4605) Stakeholder consultations:
Not required
Feasibility study: Not required Engineering design: Not yet started Land acquisition: Not required Environmental assessment:
Not required
Procurement: Not started Construction: Not started Budget allocation for O&M:
Not started
Project Implementation Status Funding Source: CIGOV national budget or loan Implementation Arrangements:
Primary responsibility for coordination/execution PDU* Implementation responsibility by OMIA. Works should be done by outsourcing to private sector or possibly done by Island Administrations
Contracting Method: Conventional tender through national competitive bidding to MFEM guidelines. Contract administration and construction supervision by implementing agency which in turn could do it in-house or outsource task.
O&M Responsibility: Island Administrations or outsourced to private sector Risk assessment: Maintenance not done properly due to shortage of funds –
o ensure adequate provisions allocated under annual budgets o provide adequate training for operators to reduce risk; o formalize need for checking of facilities as part of the annual EMC
preparedness audits to be done by EMCI Implementation schedule:
Fiscal Year: To be determined through prioritisation and programming
Current Status: Need project prioritisation and approval *New PDU yet to be established. Presently such work is carried out by AMD.

90 Appendix 5
Project Profile
Project ID: WSW12NGI Sector: Water Supply Name: Northern islands community rainwater catchment and storage
refurbishment Island: Palmerston, Pukapuka, Nassau, Manihiki, Rakahanga and Penrhyn Location: Several locations on each island in the Northern Group Background/Rationale: On the northern islands rain water is the primary source of water supply.
The community catchments and storages form a vital back up supply to individual households. However many of these were damaged by the cyclones of 2005. Also, many of the tanks are old, leaking and in need of some rehabilitation. If they are to form an integral part of the islands’ water supply they need refurbishment.
Objective: To re-establish the security of water supply to the northern islands by refurbishing the community rainwater catchments.
Description of works: Repair and refurbishment works will include: for the catchments the replacement of corroded corrugated iron roofs, guttering and spouting and installation of first-flush diversion devices to improve water quality. Where required, the tanks will be fitted with internal plastic liners to stop the leakage, concrete walls will be strengthened and external reinforcement steel bands will be replaced and a sealed roof will be installed where needed.
Features: Low-cost solution to improving the security of water supply for the northern island communities
Meet minimum level of service Provides some savings to users as they will not have to buy additional
bottled water to meet household demand Improves the living condition of households are water rationing will be
needed less often Estimated Beneficiaries: About 1,800 people will benefit from the project Environmental Category: ADB category C:
Project will have no environmental impact except for temporary disruptions during construction. A review of environmental implications will suffice.
Land Requirement: None Climate change adaptation needs:
Tank sizing and location critical in terms of risk from storm surge ad periods of drought. Structural strengthening and spray protection measures are needed and are incorporated into the project
Project cost estimate: Capital cost estimate: $0.20 million (total for 6 islands Note: estimate of incremental cost of climate change adaptation works included in capital cost above is $20,000.
O&M cost estimate: $10,000 (total for 6 islands) Implementation options: Work should be outsourced to private sector or done by the Island
Administrations O&M could be done by the Island Administrations or outsourced to private sector
Profile Created: 10 October 2006 Current Version: 10 October 2006

Appendix 5 91
Project Tracking
Last updated: 10 October 2006 Project Preparation Status Project Identification: Project has been identified through the ADB preventive infrastructure
master planning study. (ADB TA4605) and also in the Tony Falkland field investigation reports
Stakeholder consultations:
Not required
Feasibility study: Not required Engineering design: Filed inspection required to confirm details of refurbishment needs Land acquisition: Not required Environmental assessment:
Not required as impact monitoring and assessment are parts of the study
Procurement: Not yet started Construction: Not yet started Budget allocation for O&M:
Not yet started
Project Implementation Status Funding Source: CIGOV national budget Implementation Arrangements:
Primary responsibility for coordination/execution PDU* Implementation responsibility by OMIA. Works should be done by outsourcing to private sector or possibly done by Island Administrations
Contracting Method: Conventional tender through local competitive bidding to MFEM guidelines. Contract administration and construction supervision by implementing agency
O&M Responsibility: Island Administration on each island or outsourced to private sector Risk assessment: Maintenance not carried out properly such as not cleaning out first
flush devices or gutters or leaving roofs off rainwater tanks – provide training to reduce risk
Maintenance not done properly due to shortage of funds – ensure adequate provisions allocated under annual budgets
Implementation schedule:
Fiscal Year: To be determined through prioritisation and programming
Current Status: Need project prioritisation and approval *New PDU yet to be established. Presently such work is carried out by AMD.

92 Appendix 5
Project Profile
Project ID: WSW13NGI Sector: Water Supply Name: Supply and installation of household rainwater systems for the
northern islands Island: Palmerston, Pukapuka, Nassau, Manihiki, Rakahanga and Penrhyn Location: Entire island on each habited island of the Northern Group Background/Rationale: On the northern islands there are no reticulated water supply systems
and so there is a priority need for the supply of rainwater tanks to ensure that all households have at least some onsite storage. Many of the tanks were damaged during by the cyclones of 2005 and to date have not been replaced. Given lower income level of households on the northern islands in general, many households cannot afford to replace their tanks which are too old and beyond repair. Reticulated water supply systems are funded by the government, but on islands without such systems, the onus is on households to secure their own water supply and government only provides the community storages for use as the back up source. Through this project the government is addressing the imbalance by funding the supply of a rainwater tank for each household.
Objective: To provide adequate water supply storage to all residents of the northern islands.
Description of works: Provision of one 6,000 L rainwater tank with cover to each household. The works will also include replacement of corroded gutters and spoutings and extension of the guttering to ensure all roof runoff is captured, and installation of first-flush diversion devices to improve water quality.
Features: Low-cost solution to a supply issue Addresses a social imbalance and facilitates economic activity growth
on the islands Meets minimum level of service Better water quality will contribute to improved public health Provides some savings to users as they will not have to buy additional
bottled water or cart water to meet household demand O&M costs are borne by household not the government
Estimated Beneficiaries: About 1,800 people on the northern islands Environmental Category: ADB category C:
Project will have no environmental impact except for temporary disruptions during construction. A review of environmental implications will suffice.
Land Requirement: None Climate change adaptation needs:
Tank sizing and location critical for storm surge events and periods of drought. Spray protection also needed
Project cost estimate: Capital cost estimate: $1.2 million (total for 6 islands) O&M cost estimate: none to government, onus is on households
Implementation options: Work should be outsourced to private sector or done by the Island Administrations O&M to be done by the individual households
Profile Created: 10 October 2006 Current Version: 10 October 2006

Appendix 5 93
Project Tracking
Last updated: 10 October 2006 Project Preparation Status Project Identification: Project has been identified through the ADB preventive infrastructure
master planning study. (ADB TA4605) and also in some form in the Tony Falkland field investigation reports.
Stakeholder consultations:
The local communities should be informed and the project should be publicized
Feasibility study: Not required Engineering design: Field inspection required to confirm extent of works Land acquisition: Not required Environmental assessment:
Not required
Procurement: Not yet started Construction: Not yet started Budget allocation for O&M:
Not required
Project Implementation Status Funding Source: CIGOV national budget or donor agency Implementation Arrangements:
Primary responsibility for coordination/execution PDU* Implementation responsibility by OMIA. Works should be done by outsourcing to private sector
Contracting Method: Conventional tender through international competitive bidding to MFEM/donor agency guidelines. Contract administration and construction supervision by implementing agency
O&M Responsibility: Households Risk assessment: Maintenance not carried out properly such as not cleaning out first
flush devices or gutters or leaving roofs off rainwater tanks – conduct community education and awareness program
Implementation schedule:
Fiscal Year: To be determined through prioritisation and programming
Current Status: Need project prioritisation and approval *New PDU yet to be established. Presently such work is carried out by AMD.

94 Appendix 5
Project Profile
Project ID: WSW14MGS Sector: Water Supply Name: Mangaia water supply distribution system upgrade Island: Mangaia Location: Entire island Background/Rationale: The water supply systems in all 3 villages are in poor condition and
current sources of supply are insufficient during extended drought periods. The system is operated only 1-3 hours per day in Oneroa, due to insufficient pumping capacity and poorly located storages. Water losses are in excess of 60% and most of the PVC pipes in the distribution system need replacement. The system is operated inefficiently due to lack of air and control valves and limited operator skills. The service to consumers is considered below minimum standards. Ref: AusAID, Mangaia, Cook Is. report on water investigations, Aug 2000.
Objective: To improve the delivery service to consumers and to reduce water losses.
Description of works: The works will include rehabilitation of intakes, construction of new storages, replacement of pumps and the distribution systems, installation of air and isolating valves and other control equipment
Features: Project will improve service delivery to consumers and so achieve minimum level of service standard
Project will reduce the high water losses and save water Water quality will improve as the old pipes will be replaced and so
infiltration of contaminated water at leaky joints will be eliminated Will provide operation cost savings as less water will need to be
pumped Will address some of the community concerns about the poor quality
and insufficient quantity of water Will provide opportunities for private sector involvement Would provide revenue if tariffs were introduced
Estimated Beneficiaries: Some 750 people will benefit from a better water supply Environmental Category: ADB category C:
Project will have overall beneficial impact on existing sources. Project is essentially an asset replacement program, requiring only a review of environmental implications primarily during construction.
Land Requirement: None Climate change adaptation needs:
The above ground storages need structural strengthening to allow for the expected increase in wind loadings. System design needs to account for increased periods of drought and high intensity rainfall events, and possible erosion.
Project cost estimate: Capital cost estimate: $1.8 million Note: estimate of incremental cost of climate change adaptation works included in capital cost above is $90,000
O&M cost estimate: $40,000 per annum Implementation options: Work should be outsourced to private sector
O&M could be done by the Island Administration or outsourced to private sector
Profile Created: 10 October 2006 Current Version: 10 October 2006

Appendix 5 95
Project Tracking
Last updated: 10 October 2006 Project Preparation Status Project Identification: Project has been identified in The Tony Falkland investigation reports
conducted under AusAID funding. Ref: AusAID, Mangaia, Cook Islands report on water investigations, Aug 2000
Stakeholder consultations:
Public announcements are needed to provide information of affected areas during construction.
Feasibility study: Project design document completed by GHD under AusAID funding Ref: AusAID, Upgrading of Mangaia water supply, Aug 2004
Engineering design: Not yet started Land acquisition: Site for new groundwater gallery at Te Roto to be confirmed Environmental assessment:
Identification of environmental implications during construction not yet started
Procurement: Not started Construction: Not started Budget allocation for O&M:
Not started
Project Implementation Status Funding Source: CIGOV national budget, loan or donor agency Implementation Arrangements:
Primary responsibility for coordination/execution PDU* Implementation responsibility by OMIA with support from MOW. Works should be done by outsourcing to private sector or possibly the Island Administration
Contracting Method: Conventional tender through international competitive bidding to MFEM/donor agency guidelines. Contract administration and construction supervision by implementing agency which in turn could do it in-house or outsource task.
O&M Responsibility: Island Administration or outsourced to private sector Risk assessment: Inefficient system operation – ensure efficient operation through:
o adequate training and periodic skill upgrade for operators and technicians;
o formalising need for annual performance audits to be done by independent (external) specialist
Breakdown due to improper maintenance of equipment – provide training to reduce risk
Lengthy downtime in case of failure – ensure supply of key spare parts included in this contract to maintain operability
Maintenance not done properly due to shortage of funds – ensure adequate provisions allocated under annual budgets; consider introduction of tariffs
Implementation schedule:
Fiscal Year: To be determined through prioritisation and programming
Current Status: Project design document completed; need project prioritisation *New PDU yet to be established. Presently such work is carried out by AMD.

96 Appendix 5
Project Profile
Project ID: WSW15AIU Sector: Water Supply Name: Atiu water supply system upgrade Island: Atiu Location: Entire island Background/Rationale: Only one of the six pump stations is operational at present. The pumps in
the others have not been in use for several years as they are long past their useful life or were damaged by recent cyclones. The headworks need extensive rehabilitation. Consequently, some of the storages cannot be used either as water cannot be pumped into them. Similarly the reticulation system is deteriorating due to lack of use and need rehabilitation. People must rely on household water tanks for their water supply.
Objective: To improve the delivery service to consumers to meet minimum levels of service and to reduce water losses
Description of works: The works will include replacement of pumps and accessories, interlinking of storages for more efficient operation and establishing two supply zones for better pressure distribution, repairing of storages and repairs to the wind power generators at the Te Kapi and Ukaveu pump stations, as well as development of new groundwater intake galleries, construction of new elevated storages, and replacement of parts of the distribution network
Features: Project will improve service delivery to consumers and so achieve minimum level of service standard
Solve a long-standing supply constraint Project will reduce the high water losses, save water and enable more
sustainable extractions from the main supply source Will provide cost savings through operational efficiency improvements Will address some of the community concerns about the poor quality
and insufficient quantity of water Will provide opportunities for private sector involvement Would provide revenue if tariffs were to be put in place
Estimated Beneficiaries: Some 620 people will benefit from a better water supply Environmental Category: ADB category B: Project will involve the development of a new water
source and therefore an IEE will be required to determine if a full EIA is needed
Land Requirement: New groundwater infiltration gallery at Te Roto Climate change adaptation needs:
The above-ground storages need structural strengthening to allow for the expected increase in wind loadings. System design needs to account for increased periods of drought and high intensity rainfall events, and possible erosion.
Project cost estimate: Capital cost estimate: $0.5 million Note: estimate of incremental cost of climate change adaptation works included in capital cost above is $20,000
O&M cost estimate: $20,000 per annum Implementation options: Work should be outsourced to private sector
O&M could be done by the Island Administration or outsourced to private sector
Profile Created: 10 October 2006 Current Version: 10 October 2006

Appendix 5 97
Project Tracking Last updated: 10 October 2006
Project Preparation Status Project Identification: Project has been identified in The Tony Falkland and MOW investigation
reports. References: 1) Tony Falkland, preliminary report on water investigations Mar 2005 2) MOW, Atiu water supply upgrading 2003
Stakeholder consultations:
Public announcements are needed to provide information of affected areas during construction.
Feasibility study: Engineering feasibility report yet to be started Engineering design: Not yet started Land acquisition: Site for new groundwater gallery at Te Roto to be confirmed Environmental assessment:
Identification of environmental implications during construction not yet started
Procurement: Not started Construction: Not started Budget allocation for O&M:
Not started
Project Implementation Status Funding Source: CIGOV national budget, loan or donor agency Implementation Arrangements:
Primary responsibility for coordination/execution PDU* Implementation responsibility by OMIA with support from MOW. Works should be done by outsourcing to private sector or possibly the Island Administration
Contracting Method: Conventional tender through international competitive bidding to MFEM/donor agency guidelines. Contract administration and construction supervision by implementing agency which in turn could do it in-house or outsource task.
O&M Responsibility: Island Administration or outsourced to private sector Risk assessment: Inefficient system operation – ensure efficient operation through:
o adequate training and periodic skill upgrade for operators and technicians;
o formalising need for annual performance audits to be done by independent (external) specialist
Breakdown due to improper maintenance of equipment – provide training to reduce risk
Lengthy downtime in case of failure – ensure supply of key spare parts included in this contract to maintain operability
Maintenance not done properly due to shortage of funds – ensure adequate provisions allocated under annual budgets; consider introduction of tariffs
Implementation schedule:
Fiscal Year: To be determined through prioritisation and programming
Current Status: Project identification study completed; need project prioritisation *New PDU yet to be established. Presently such work is carried out by AMD.
Project Profile
Project ID: WSW16MUK Sector: Water Supply Name: Mauke water supply distribution system upgrade Island: Mauke Location: Entire island

98 Appendix 5
Background/Rationale: The network is in an advanced stare of deterioration, water losses are high. Due to the age and aggressive ground and climatic conditions, the much of the distribution network needs replacement.
Objective: To improve the delivery service to consumers to meet minimum levels of service and to reduce water losses
Description of works: The works will include replacement of some old pipelines and extension to areas currently not serviced. About 12 km of pipeline will be constructed and distribution storages will be rehabilitated
Features: Project will improve service delivery to consumers and so achieve minimum level of service standard
Project will reduce the high water losses, save water and enable more sustainable extractions from various sources
Water quality will improve as the old corroded pipes are replaced and more sources are utilised
Will provide operation cost savings as less water will need to be pumped (due to lower losses)
Will address some of the community concerns about the poor quality and insufficient quantity of water
Provides opportunities for private sector involvement Would provide revenue if tariffs were introduced
Estimated Beneficiaries: Some 750 people will benefit from a better water supply Environmental Category: ADB category C:
Project will have overall beneficial impact on existing sources. Project is essentially an asset replacement program, requiring only a review of environmental implications primarily during construction.
Land Requirement: None Climate change adaptation needs:
Some of the above ground storage need structural strengthening to allow for the expected increase in wind loadings. System design needs to account for increased periods of drought and high intensity rainfall events, as well as possible erosion.
Project cost estimate: Capital cost estimate: $1.1 million Note: estimate of incremental cost of climate change adaptation works included in capital cost above is $80,000
O&M cost estimate: $20,000 per annum Implementation options: Work should be outsourced to private sector
O&M could be done by the Island Administration or outsourced to private sector
Profile Created: 10 October 2006 Current Version: 10 October 2006

Appendix 5 99
Project Tracking Last updated: 10 October 2006
Project Preparation Status Project Identification: Project has been identified in the Tony Falkland field investigation reports
and a MOW submission to AMD. References: 1) AusAid, Mauke, Cook Islands report on water investigations, Feb 2004 (Tony Falkland report) 2) MOW, Mauke Island pipeline network upgrading (submission)
Stakeholder consultations:
Public announcements are needed to provide information of affected areas during construction.
Feasibility study: Engineering feasibility reportedly completed by MOW.
Engineering design: Completed Land acquisition: Not required Environmental assessment:
Identification of environmental implications during construction not yet started
Procurement: Not started Construction: Not started Budget allocation for O&M:
Not started
Project Implementation Status Funding Source: CIGOV national budget or donor agency Implementation Arrangements:
Primary responsibility for coordination/execution PDU* Implementation responsibility by OMIA with support from MOW. Works should be done by outsourcing to private sector or possibly the Island Admin
Contracting Method: Conventional tender through international competitive bidding to MFEM/donor agency guidelines. Contract administration and construction supervision by implementing agency which in turn could do it in-house or outsource task.
O&M Responsibility: Island Administration or outsourced to private sector Risk assessment: Inefficient system operation – ensure efficient operation through:
o adequate training and periodic skill upgrade for operators; o formalising need for annual performance audits to be done by
independent (external) specialist Breakdown due to improper maintenance of equipment – provide
training to reduce risk Lengthy downtime in case of failure – ensure supply of key spare parts
included in this contract to maintain operability Maintenance not done properly due to shortage of funds – ensure
adequate provisions allocated under annual budgets; consider introduction of tariffs
Implementation schedule:
Fiscal Year: To be determined through prioritisation and programming
Current Status: Detailed design report completed and request for funding has been submitted to AMD; project needs prioritisation
*New PDU yet to be established. Presently such work is carried out by AMD.

100 Appendix 5
Project Profile
Project ID: WSW17MOI Sector: Water Supply Name: Mitiaro water supply system upgrade Island: Mitiaro Location: Entire island Background/Rationale: The salinity of the existing groundwater source is high leading to frequent
complaints from resident. Most sources are mildly to moderately brackish. Water losses and/or wastage from the system are very high. Given that the groundwater is pumped to the storages, the inefficient operation is also incurring significant costs in wasted power usage. Therefore there is an urgent need for headworks improvements Similarly the reticulation system is deteriorating due to lack of use and need rehabilitation. People must rely on household water tanks for their water supply.
Objective: To improve the delivery service to consumers to meet minimum levels of service and to reduce water losses
Description of works: The headworks will include replacement of pumps and accessories, interlinking of storages for more efficient operation repairs of storages and installation of valves for better control. The distribution system works will comprise repair or replacement of pipelines and extension into areas currently not serviced.
Features: Project will improve service delivery to consumers and so achieve minimum level of service standard and address some of the community concerns
Project will reduce the high water losses, save water and enable more sustainable extractions from the main supply source
Water quality will improve as the old corroded pipes are replaced and more sources are utilised
Will provide operation cost savings as less water will need to be pumped (reduced losses)
Will provide opportunities for private sector involvement Would provide revenue if tariffs were introduced
Estimated Beneficiaries: Some 230 people will benefit from a better water supply Environmental Category: ADB category C:
Project will have overall beneficial impact on existing sources. Project is essentially an asset replacement program, requiring only a review of environmental implications primarily during construction.
Land Requirement: None Climate change adaptation needs:
Some of the above-ground storage need structural strengthening to allow for the expected increase in wind loadings. System design needs to take into account for increased periods of drought and high intensity rainfall events, and possible erosion.
Project cost estimate: Capital cost estimate: $0.8 million Note: estimate of incremental cost of climate change adaptation works included in capital cost above is $50,000
O&M cost estimate: $20,000 per annum Implementation options: Work should be outsourced to private sector
O&M could be done by the Island Admin or outsourced to private sector Profile Created: 10 October 2006 Current Version: 10 October 2006

Appendix 5 101
Project Tracking Last updated: 10 October 2006
Project Preparation Status Project Identification: Project has been identified in the Tony Falkland field investigation reports.
Ref: AusAid, Mitiaro, Cook Islands report on water investigations, Dec 2003
Stakeholder consultations:
Public announcements are needed to provide information of affected areas during construction.
Feasibility study: Engineering feasibility study yet to be started Engineering design: Not yet started Land acquisition: Not required Environmental assessment:
Identification of environmental implications during construction not yet started
Procurement: Not started Construction: Not started Budget allocation for O&M:
Not started
Project Implementation Status Funding Source: CIGOV national budget or donor agency Implementation Arrangements:
Primary responsibility for coordination/execution PDU* Implementation responsibility by OMIA with support from MOW. Works should be done by outsourcing to private sector or possibly the Island Administration
Contracting Method: Conventional tender through international competitive bidding to MFEM/donor agency guidelines. Contract administration and construction supervision by implementing agency which in turn could do it in-house or outsource task.
O&M Responsibility: Island Administration or outsourced to private sector Risk assessment: Inefficient system operation – ensure efficient operation through:
o adequate training and periodic skill upgrade for operators; o formalising need for annual performance audits to be done by
independent (external) specialist Breakdown due to improper maintenance of equipment – provide
training to reduce risk Lengthy downtime in case of failure – ensure supply of key spare parts
included in this contract to maintain operability Maintenance not done properly due to shortage of funds – ensure
adequate provisions allocated under annual budgets; consider introduction of tariffs
Implementation schedule:
Fiscal Year: To be determined through prioritisation and programming
Current Status: Project identification study completed; project needs prioritisation *New PDU yet to be established. Presently such work is carried out by AMD.

102 Appendix 5
Project Profile
Project ID: SNW01RAR Sector: Sanitation Name: Rarotonga village sewerage schemes – Stage 1 Island: Rarotonga Location: Avarua, and Muri Background/Rationale: The lagoons near these villages are increasingly stressed due to raw or
poorly treated sewage discharges entering into the lagoons. The incidence of fish poisoning is on the rise. The lagoons are also a key attraction to tourists which is the main income generating sector of the national economy. The population densities in these areas warrant installation of centralised sewerage systems. Feasibility study (Project ID SNS01RAR) is a prerequisite.
Objective: Improve lagoon water quality and urban environment, and reduce community health risks through proper treatment of wastewater in two villages with some of the highest population densities on the island.
Description of works: Design and construction of wastewater collection, treatment and disposal systems for each village. Works will include laying of pipelines, pump stations, treatment plants, sludge handling facilities and treated effluent disposal system.
Features: Project will improve environment in foreshore areas in the two most populated villages
Elimination of sewage discharges to the lagoon will lead to improved water quality and ecosystem, and reduction in fish poisoning incidents
Project will enhance Rarotonga as a tourist destination through a cleaner environment
Will address community concerns about sewage overflows and degradation of lagoon, but will require community consensus and contribution to equity
Will provide some savings to users as they will not have to operate own site septic systems. The land values are likely to increase due to sites being served by centralized sewerage facilities.
Would provide revenue if wastewater charges were to be put in place Estimated Beneficiaries: Some 6,000 residents in the villages and visitors indirectly who use the
lagoons Environmental Category: ADB category A: Project will have beneficial impact on lagoons and
urban environment. However, location of treatment plants and mode of treated effluent disposal will be very sensitive community issues needing extensive consultation; Land acquisition/ resettlement of people will be required.
Land Requirement: 1 site for treatment plant and 1 for pump station in each village Climate change adaptation needs:
Protection of the treatment plant and sites from flooding, sea surge if applicable, and high wind speeds.
Project cost estimate: Capital cost estimate: $3.0 million Note: estimate of incremental cost of climate change adaptation works included in capital cost above is $150,000.
O&M cost estimate: $160,000 per annum (total 2 villages) Implementation options: Work should be outsourced to private sector
O&M could be outsourced to private sector or done by MOW Profile Created: 10 October 2006 Current Version: 10 October 2006

Appendix 5 103
Project Tracking
Last updated: 10 October 2006 Project Preparation Status Project Identification: Project has been identified through the ADB preventive infrastructure
master planning study. (ADB TA4605) Stakeholder consultations:
Extensive consultations will be needed with residents.
Feasibility study: Will be required and is a prerequisite for proceeding Engineering design: Not yet started – completion of feasibility study is a prerequisite Land acquisition: Sites yet to be identified Environmental assessment:
Not yet started
Procurement: Not started Construction: Not started Budget allocation for O&M:
Not started
Project Implementation Status Funding Source: CIGOV national budget or loan Implementation Arrangements:
Primary responsibility for coordination/execution PDU* Implementation responsibility by MOW. Works should be done by outsourcing to private sector or possibly done in-house by MOW
Contracting Method: Conventional tender through international competitive bidding to MFEM/lending agency guidelines. Contract administration and construction supervision by implementing agency which in turn could do it in-house or outsource task.
O&M Responsibility: MOW or outsourced to private sector Risk assessment: Community may reject the project especially location of treatment
facilities and/or effluent disposal mode – ensure community participation throughout the project
Environmental spills due to improper operation practices – o provide adequate training for operators to reduce risk; o request periodic self-monitoring and reporting on effluent quality; o ensure random checks carried out by NES o empower NES to enforce compliance with discharge conditions
including imposition of penalties for non-compliance; o formalize need for annual performance audits to be done by
external specialist Maintenance not done properly due to shortage of funds – ensure
adequate provisions allocated under annual budgets; consider introduction of tariffs
Implementation schedule:
Fiscal Year: To be determined through prioritisation and programming
Current Status: Need project prioritisation and go ahead for feasibility study *New PDU yet to be established. Presently such work is carried out by AMD.

104 Appendix 5
Project Profile
Project ID: SNW02RAR Sector: Sanitation Name: Rarotonga village sewerage schemes – Stage 2 Island: Rarotonga Location: Arorangi and Titikaveka Background/Rationale: The lagoons near these villages are increasingly stressed due to raw or
poorly treated sewage discharges entering into the lagoons. The incidence of fish poisoning is on the rise. The lagoons are also a key attraction to tourists which is the main income generating sector of the national economy. The population densities in these areas warrant installation of centralised sewerage systems. Feasibility study (Project ID SNS01RAR) is a prerequisite.
Objective: Improve lagoon water quality, improve urban environment and reduce community health risks through proper treatment of wastewater in the two villages with the highest urban population densities on the island.
Description of works: Design and construction of wastewater collection, treatment and disposal systems for each village. Works will include laying of pipelines, pump stations, treatment plants, sludge handling facilities and treated effluent disposal system
Features: Project will improve environment in foreshore areas in two densely populated villages
Elimination of sewage discharges to the lagoon will lead to improved water quality and ecosystem, and reduction in fish poisoning incidents
Project will enhance Rarotonga as a tourist destination through a cleaner environment
Will address community concerns about sewage overflows and degradation of lagoon, but will require community consensus and contribution to equity
Will provide some savings to users as they will not have to operate own site septic systems. The land values are likely to increase due to sites being served by centralized sewerage facilities.
Would provide revenue if wastewater charges were to be put in place Estimated Beneficiaries: Some 3,800 residents in the villages and visitors indirectly who use the
lagoons Environmental Category: ADB category A: Project will have beneficial impact on lagoons and urban
environment. However, location of treatment plants and mode of treated effluent disposal will be very sensitive community issues needing extensive consultation; Land acquisition/ resettlement of people will be required.
Land Requirement: 1 site for treatment plant and 1 for pump station in each village Climate change adaptation needs:
Protection of the treatment plant and sites from flooding, sea surge if applicable, and high wind speeds.
Project cost estimate: Capital cost estimate: $2.0 million. Note: estimate of incremental cost of climate change adaptation works included in capital cost above is $100,000.
O&M cost estimate: $90,000 per annum (total 2 villages) Implementation options: Work should be outsourced to private sector
O&M could be outsourced to private sector or done by MOW Profile Created: 10 October 2006 Current Version: 10 October 2006

Appendix 5 105
Project Tracking
Last updated: 10 October 2006 Project Preparation Status Project Identification: Project has been identified through the ADB preventive infrastructure
master planning study. (ADB TA4605) Stakeholder consultations:
Extensive consultations will be needed with villagers.
Feasibility study: Will be required and a prerequisite for proceeding Engineering design: Not yet started – completion of feasibility study is a prerequisite Land acquisition: Sites yet to be identified Environmental assessment:
Not yet started
Procurement: Not started Construction: Not started Budget allocation for O&M:
Not started
Project Implementation Status Funding Source: CIGOV national budget or loan Implementation Arrangements:
Primary responsibility for coordination/execution PDU* Implementation responsibility by MOW. Works should be done by outsourcing to private sector or possibly done in-house by MOW
Contracting Method: Conventional tender through international competitive bidding to MFEM/lending agency guidelines. Contract administration and construction supervision by implementing agency which in turn could do it in-house or outsource task.
O&M Responsibility: MOW or outsourced to private sector Risk assessment: Community will reject the project especially location of treatment
facilities and/or effluent disposal mode – ensure community participation throughout the project
Environmental spills due to improper operation practices – o provide adequate training for operators to reduce risk; o request periodic self-monitoring and reporting on effluent quality; o ensure random checks carried out by NES o empower NES to enforce compliance with discharge conditions
including imposition of penalties for non-compliance; o formalize need for annual performance audits to be done by
external specialist Maintenance not done properly due to shortage of funds – ensure
adequate provisions allocated under annual budgets; consider introduction of tariffs
Implementation schedule:
Fiscal Year: To be determined through prioritisation and programming
Current Status: Need project prioritisation and go ahead for feasibility study *New PDU yet to be established. Presently such work is carried out by AMD.

106 Appendix 5
Project Profile
Project ID: SNW03RAR Sector: Sanitation Name: Rehabilitation of Tereora/Tepuka neighborhood sewerage system Island: Rarotonga Location: Tereora and Tepuka Background/Rationale: The existing collection system is old with parts of it having been built in
the 1960’s. Stormwater inflows to the sewers during heavy rainfall periods lead to raw sewage overflows at the pump station and some of the manholes which pose a public health and environmental risks. The pumps cannot cope with the excess flow. The treatment plant is in need of rehabilitation and operation optimization. Community complaints about odors emanating from the system are common. The system is in need of rehabilitation. MOW currently preparing detailed design
Objective: Rehabilitate the system and so reduce community nuisance and raw sewage overflows
Description of works: Rehabilitation of wastewater collection system and treatment plant processes. Works will include replacing of pipelines, relocating pump station, optimization of treatment plant operation and desludging of plant
Features: Elimination of raw sewage overflows will improve the nearby environment and reduce a community health hazard
Project will address community concerns about the sewage overflows and malodours, but will require community consensus on relocating the pump station
Better system performance will improve the public perception of package treatment plants and so will result in easier community acceptance of such facilities in other parts of the island
Regular effluent discharge and water quality monitoring and reporting will be included in system operation procedures
Would provide revenue if tariffs were to be put in place Operation could be outsourced to private sector to build up capacity
for operation of other such facilities once they are built on Rarotonga Estimated Beneficiaries: Some 300 people served by system and public passing through area will
not be subject to odours emanating from the system Environmental Category: ADB category B:
Project will provide overall beneficial to the surrounding urban environment. As the pump station will be relocated, an IEE will be necessary including community consultation; Land acquisition and resettlement of people will be required.
Land Requirement: New site is required for relocating the pump station Climate change adaptation needs:
Protection of the treatment plant and site from flooding and high wind speeds.
Project cost estimate: Capital cost estimate: $0.30 million. O&M cost estimate: $30,000 per annum
Implementation options: Work should be outsourced to private sector O&M could be outsourced to private sector or done by MOW
Profile Created: 10 October 2006 Current Version: 10 October 2006

Appendix 5 107
Project Tracking
Last updated: 10 October 2006 Project Preparation Status Project Identification: MOW completed initial assessment and survey Stakeholder consultations:
Community consultation will be required if the pump station is to be relocated. In any case, the local community should be kept informed of the planned works to ensure its support.
Feasibility study: Not required Engineering design: MOW is currently preparing detailed design. However, in-house capacity
for improving the plant processes is uncertain. Land acquisition: MOW is considering relocating the pump station. If that is confirmed, a
new site will be required. Identification process is in progress. Environmental assessment:
Not yet started
Procurement: Not started Construction: Not started Budget allocation for O&M:
Not started
Project Implementation Status Funding Source: CIGOV national budget Implementation Arrangements:
Primary responsibility for coordination/execution PDU* Implementation responsibility by MOW. Works should be done by outsourcing to private sector or possibly done in-house by MOW
Contracting Method: Conventional tender through national competitive bidding to MFEM guidelines. Contract administration and construction supervision by implementing agency which in turn could do it in-house or outsource task
O&M Responsibility: MOW or outsourced to private sector Risk assessment: Community will reject the location of new pump station – ensure
community participation throughout the project Environmental spills due to improper operation practices –
o provide adequate training for operators to reduce risk; o request periodic self-monitoring and reporting on effluent quality
and incidence reporting on overflows; o ensure random checks carried out by NES o empower NES to enforce compliance with discharge conditions
including imposition of penalties for non-compliance; o formalize need for annual performance audits to be done by
external specialist Maintenance not done properly due to shortage of funds – ensure
adequate provisions allocated under annual budgets; consider introduction of tariffs
Implementation schedule:
Fiscal Year 207/08
Current Status: Detail design is in progress *New PDU yet to be established. Presently such work is carried out by AMD.

108 Appendix 5
Project Profile
Project ID: SNW04RAR Sector: Sanitation Name: Improvement of effluent disposal systems in foreshore areas of
Rarotonga Island: Rarotonga Location: Foreshore area Background/Rationale: Currently septic effluent is disposed via soakage pits or absorption areas.
Since the coral sand in the foreshore areas is highly porous, there is very little additional treatment as the nutrient-rich effluent percolates through the soil to the underlying groundwater table. Consequently, the effluent from foreshore areas is a major source of nutrients into the lagoon, Disposal of septic tank effluent via evapo-transpiration is a cost effective improvement. The scheme will run for a 3-year period. New regulations would make the installation of evapo-transpiration beds compulsory for new households (without a rebate) in the foreshore areas. Pilot study (Project ID SNS05RAR) is a prerequisite.
Objective: Encourage households to convert their soakage pits/absorption areas to evapo-transpiration beds
Description of works: The scheme will include providing a rebate or subsidy to households in the foreshore areas which convert their existing absorption areas to evapo-transpiration beds. Standard designs and a rebate will be provided to participating households. The systems will comprise PE liners, agricultural drain pipes and PE drip irrigation lines with solar pumps.
Features: Project will reduce the nutrient load to the water table and lagoon and so have a beneficial environmental impact
Significant environmental and economic benefit for a modest investment - funding will by households with government providing a rebate or subsidy to promote conversion
Estimated Beneficiaries: Up to 500 households in the foreshore area of Rarotonga, except the villages of Avarua. Muri, Arorangi and Titikaveka which are expected to be provided with centralised sewerage services
Environmental Category: ADB category C: Project would only replace existing affluent disposal method and would have beneficial environmental effects
Land Requirement: None required Climate change adaptation needs:
Protection of the systems from cyclones and storm surge including high intensity rainfall events
Project cost estimate: Capital cost estimate: None for government Rebate to households: To be determined
Implementation options: To be carried out by households with technical advice and inspection and approval of the built system
Profile Created: 10 October 2006 Current Version: 10 October 2006

Appendix 5 109
Project Tracking
Last updated: 10 October 2006 Project Preparation Status Project Identification: Project has been identified through the ADB preventive infrastructure
master planning study. (ADB TA4605) Stakeholder consultations:
Publicizing of the project will required to generate willingness to make the conversion
Feasibility study: The pilot study under Project ID SNS05RAR is a prerequisite for proceeding with the scheme
Engineering design: MOW will develop standard design during pilot study Land acquisition: Not required. Environmental assessment:
Not required
Procurement: Not required Construction: Not required – will provide rebate to households on completion of
installation of new septic effluent disposal system Budget allocation for O&M:
Not required. Extent of rebate to be determined and approved by CIGOV
Project Implementation Status Funding Source: Rebate to be provided to participating households from CIGOV national
budget Implementation Arrangements:
Primary responsibility for coordination/execution MOW or MOH Implementation responsibility by households
Contracting Method: Not required, to be done by households. Government agency to provide technical advice and inspection/approval of built systems
O&M Responsibility: Households Risk assessment: Overflows due to improper operation practices – MOH inspectors to
make visual check during routine health inspection of properties Maintenance not done properly – ensure regular desludging of septic
tanks is enforced under national septage management plan Implementation schedule:
Fiscal Year To be determined through prioritisation and programming
Current Status: Need project prioritisation and go ahead subject to successful results from pilot study (Project ID SNW04RAR)

110 Appendix 5
Project Profile
Project ID: SNW05AIT Sector: Sanitation Name: Construction of Aitutaki village sewerage networks Island: Aitutaki Location: Amuri and Vaipae villages Background/Rationale: The lagoons near these villages are increasingly stressed due to raw or
poorly treated sewage discharges entering into the lagoon. The lagoon is a major attraction to tourists which is the main income generating sector for the island. The population densities in these areas warrant installation of centralised sewerage systems. Feasibility study (Project ID SNS04AIT) is a prerequisite.
Objective: Improve lagoon water quality and urban environment, and reduce community health risks through proper treatment of wastewater in the villages with the highest population densities on the island.
Description of works: Design and construction of wastewater collection, treatment and disposal systems for each village. Works will include laying of pipelines, pump stations, treatment plants, sludge handling facilities and treated effluent disposal system
Features: Project will improve environment in foreshore areas in the villages Elimination of sewage discharges to the lagoon will lead to improved
water quality which in turn will improve ecosystem Project will enhance Aitutaki as a tourist destination through a cleaner
environment Will address community concerns about sewage overflows and
degradation of the lagoon, but will require community consensus and contribution in the form of land transfer for the treatment facilities
Will provide some savings to users as they will not have to operate their own site septic systems. The land values are likely to increase due to sites being served by centralized sewerage facilities.
Would provide revenue if tariffs were to be put in place Estimated Beneficiaries: Some 1,200 people will benefit from better wastewater management in
the villages Environmental Category: ADB category A:
Project will have overall beneficial impact on lagoons and urban environment. However, location of treatment plants and mode of treated effluent disposal will be very sensitive community issues needing extensive consultation; Land acquisition/ resettlement of people will be required.
Land Requirement: 1 site for treatment plant and 1 for pump station in each village Climate change adaptation needs:
Treatment plant sites need protection from high wind speeds, sea surges and flooding.
Project cost estimate: Capital cost estimate: $1.5 million Note: estimate of incremental cost of climate change adaptation works included in capital cost above is $80,000.
O&M cost estimate: $80,000 per annum (total 2 villages) Implementation options: Work should be outsourced to private sector
O&M could be outsourced to private sector or done by MOW Profile Created: 10 October 2006 Current Version: 10 October 2006

Appendix 5 111
Project Tracking
Last updated: 10 October 2006 Project Preparation Status Project Identification: Project has been identified through the ADB preventive infrastructure
master planning study. (ADB TA4605) Stakeholder consultations:
Extensive consultations will be needed with villagers.
Feasibility study: Will be required and is a prerequisite for proceeding Engineering design: Not yet started – completion of feasibility study Is a prerequisite Land acquisition: Sites yet to be identified Environmental assessment:
Not yet started
Procurement: Not started Construction: Not started Budget allocation for O&M:
Not started
Project Implementation Status Funding Source: CIGOV national budget or loan Implementation Arrangements:
Primary responsibility for coordination/execution PDU* Implementation responsibility by OMIA. Works should be done by outsourcing to private sector
Contracting Method: Conventional tender through international competitive bidding to MFEM/lending agency guidelines. Contract administration and construction supervision by implementing agency which in turn could do it in-house or outsource task.
O&M Responsibility: Island Administration or outsourced to private sector Risk assessment: Community will reject the project especially location of treatment
facilities and/or effluent disposal mode – ensure community participation throughout the project
Environmental spills due to improper operation practices – o provide adequate training for operators to reduce risk; o request periodic self-monitoring and reporting on effluent quality; o ensure random checks carried out by NES o empower NES to enforce compliance with discharge conditions
including imposition of penalties for non-compliance; o formalize need for annual performance audits to be done by
external specialist Maintenance not done properly due to shortage of funds – ensure
adequate provisions allocated under annual budgets; consider introduction of tariffs
Implementation schedule:
Fiscal Year: To be determined through prioritisation and programming
Current Status: Need project prioritisation and go ahead for feasibility study *New PDU yet to be established. Presently such work is carried out by AMD.

112 Appendix 5
Project Profile
Project ID: SNW06SGI Sector: Sanitation Name: Review of adequacy and upgrade of sanitation facilities at EMC on
southern islands Island: Aitutaki, Mangaia, Atiu, Mauke and Mitiaro Location: Entire island on each island of the Southern Group Background/Rationale: The EMC need adequate sanitation facilities in the case that people need
to stay there for prolonged periods. It is during such events that community diseases, like typhoid, are most likely to break out due to overcrowding, unhygienic environment and lack of sanitary facilities. To avert such incidence, the sanitation facilities at all EMC should have adequate capacity for treating/holding wastewater and should be protected from being inundated during intense rainfall events.
Objective: Improve the sanitation facilities at the EMC on all islands in the southern group and reduce the risk of disease due to flooded conditions during emergencies
Description of works: Upgrade of wastewater treatment and disposal facilities including construction of effluent holding tanks, installation of pump to transfer effluent to the tank and increasing height of bunds around the tanks.
Features: Project will lower the health risk from community diseases during periods when the centres are overcrowded due to the emergency situation
Project will reduce sewage overflows to the environment Estimated Beneficiaries: Some 4,000 people on the southern islands Environmental Category: ADB category C:
Project will have overall beneficial impact by eliminating a public health risk during emergency periods. Only review of environmental factors required
Land Requirement: No additional land required Climate change adaptation needs:
Septic tank and effluent storage need flood and sea surge protection, as well as from high wind speeds during storms.
Project cost estimate: Capital cost estimate: $0.25 million. Note: estimate of incremental cost of climate change adaptation works included in capital cost above is $30,000.
O&M cost estimate: $20,000 per annum (all 5 islands) Implementation options: Work should be outsourced to private sector or done by Island
Administrations O&M could be done by Island Administrations or outsourced to the private sector
Profile Created: 10 October 2006 Current Version: 10 October 2006

Appendix 5 113
Project Tracking
Last updated: 10 October 2006 Project Preparation Status Project Identification: Project has been identified through the ADB preventive infrastructure
master planning study. (ADB TA4605) Stakeholder consultations:
Not required.
Feasibility study: Not required Engineering design: Not yet started Land acquisition: Not required Environmental assessment:
Not yet started
Procurement: Not started Construction: Not started Budget allocation for O&M:
Not started
Project Implementation Status Funding Source: CIGOV national budget or loan Implementation Arrangements:
Primary responsibility for coordination/execution PDU* Implementation responsibility by OMIA. Works should be done by outsourcing to private sector or possibly done by Island Administrations
Contracting Method: Conventional tender through national competitive bidding to MFEM guidelines. Contract administration and construction supervision by implementing agency which in turn could do it in-house or outsource task.
O&M Responsibility: Island Administrations or outsourced to private sector Risk assessment: Environmental spills due to improper operation practices –
o provide adequate training for operators to reduce risk; o formalize need for checking of facilities as part of the annual EMC
preparedness audits to be done by EMCI Maintenance not done properly due to shortage of funds – ensure
adequate provisions allocated under annual budgets Implementation schedule:
Fiscal Year: To be determined through prioritisation and programming
Current Status: Need project prioritisation and approval *New PDU yet to be established. Presently such work is carried out by AMD.

114 Appendix 5
Project Profile
Project ID: SNW07SGI Sector: Sanitation Name: Construction of septage treatment facilities on the southern islands Island: Mangaia, Atiu, Mauke and Mitiaro Location: At sites to be determined on each island Background/Rationale: There are no septage treatment facilities on any of the southern islands
except Aitutaki. Septic tanks are either not desludged (the overwhelming case) or are done so by manual shoveling out of the accumulated sludge and burying it nearby the septic tank. In either case, the sludge poses an environmental risk, especially to the shallow water table, and a personal health risk during desludging of the tank. A simple centralized septage pond will provide effective treatment of the septic sludge and reduce the risk of contamination of the water supply source
Objective: Provide proper septage treatment and disposal facilities to all southern islands
Description of works: Construction of septage treatment pond, residuals drying bed and drip irrigation system for polished liquid disposal. Elements will include a solar pump, pipework and geomembrane liner.
Features: Elimination of environmental and health hazards resulting from the dumping of raw septage into unlined shallow holes.
Higher quality of treated effluent resulting from regular desludging of the septic tanks, thus less loads on the effluent disposal fields
Would provide revenue if charges were to be put in place Operation of the facility could be outsourced to private sector
Estimated Beneficiaries: Some 2,000 people on the southern islands will benefit from better septage management
Environmental Category: ADB category A: Project will have overall beneficial impact on the environment. However, location of septage plants will be a sensitive community issue needing consultation; Land acquisition will be required.
Land Requirement: New site is required for the facilities Climate change adaptation needs:
Treatment plant sites need flood protection from high intensity rainfall events as well as high wind speeds during storms.
Project cost estimate: Capital cost estimate: $0.12 million Note: estimate of incremental cost of climate change adaptation works included in capital cost above is $15,000.
O&M cost estimate: $20,000 per annum (total 4 islands) Implementation options: Work should be outsourced to private sector
Operation and maintenance could be outsourced to private sector or done by the Island Administrations
Profile Created: 10 October 2006 Current Version: 10 October 2006

Appendix 5 115
Project Tracking
Last updated: 10 October 2006 Project Preparation Status Project Identification: Project has been identified through the ADB preventive infrastructure
master planning study. (ADB TA4605) Stakeholder consultations:
Extensive consultations will be needed with villagers.
Feasibility study: Will be required and is a prerequisite for proceeding Engineering design: Not yet started – completion of feasibility study Is a prerequisite Land acquisition: Sites yet to be identified Environmental assessment:
Not yet started
Procurement: Not started Construction: Not started Budget allocation for O&M:
Not started
Project Implementation Status Funding Source: CIGOV national budget or loan Implementation Arrangements:
Primary responsibility for coordination/execution PDU* Implementation responsibility by OMIA. Works should be done by outsourcing to private sector or possibly done Island Administrations
Contracting Method: Conventional tender through national competitive bidding to MFEM guidelines. Contract administration and construction supervision by implementing agency or Island Administration which in turn could or outsource task to the private sector
O&M Responsibility: Island Administrations or outsourced to private sector Risk assessment: Community will reject the project especially location of treatment
facilities – ensure community participation throughout the project Environmental spills due to improper operation practices –
o provide adequate training for operators to reduce risk; o request periodic self-monitoring and reporting on effluent quality; o ensure random checks carried out by NES o empower NES to enforce compliance with discharge conditions
including imposition of penalties for non-compliance; o formalize need for annual performance audits to be done by
external specialist Maintenance not done properly due to shortage of funds – ensure
adequate provisions allocated under annual budgets; consider introduction of desludging charges
Implementation schedule:
Fiscal Year: To be determined through prioritisation and programming
Current Status: Need project prioritisation and go ahead for feasibility study *New PDU yet to be established. Presently such work is carried out by AMD.

116 Appendix 5
Project Profile
Project ID: SNW08NGI Sector: Sanitation Name: Review of adequacy and upgrade of sanitation facilities at EMC on
northern islands Island: Palmerston, Pukapuka, Nassau, Manihiki, Rakahanga and Penrhyn Location: Entire island on each island in the Northern Group Background/Rationale: The EMC need adequate sanitation facilities in the case that people need
to stay there for prolonged periods. It is during such events that community diseases, like typhoid, are most likely to break out due to overcrowding, unhygienic environment and lack of sanitary facilities. To avert such incidence, the sanitation facilities at all EMC should have adequate capacity for treating/holding wastewater and should be protected from being inundated during intense rainfall or storm surge events.
Objective: Improve the sanitation facilities at the EMC on all islands in the northern group and reduce the risk of disease due to flooded conditions during emergencies
Description of works: Upgrade of wastewater treatment and disposal facilities including construction of effluent holding tanks, installation of pump to transfer effluent to the tank and increasing height of bunds around the tanks.
Features: Project will lower the health risk from community diseases during periods when the centres are overcrowded due to the emergency situation
Project will reduce sewage overflows to the environment Estimated Beneficiaries: Some 1,800 people on the northern islands Environmental Category: ADB category C:
Project will have overall beneficial impact by eliminating a public health risk during emergency periods. Only review of environmental factors required
Land Requirement: No additional land required Climate change adaptation needs:
Location of septic tank and effluent storage systems need to account for sea surges, high wind speeds, and storms.
Project cost estimate: Capital cost estimate: $0.20 million. Note: estimate of incremental cost of climate change adaptation works included in capital cost above is $30,000.
O&M cost estimate: $25,000 per annum (all 6 islands) Implementation options: Work should be outsourced to private sector or done by Island
Administrations O&M could be done by Island Administrations or outsourced to the private sector
Profile Created: 10 October 2006 Current Version: 10 October 2006

Appendix 5 117
Project Tracking
Last updated: 10 October 2006 Project Preparation Status Project Identification: Project has been identified through the ADB preventive infrastructure
master planning study. (ADB TA4605) Stakeholder consultations:
Not required.
Feasibility study: Not required Engineering design: Not yet started Land acquisition: Not required Environmental assessment:
Not yet started
Procurement: Not started Construction: Not started Budget allocation for O&M:
Not started
Project Implementation Status Funding Source: CIGOV national budget or loan Implementation Arrangements:
Primary responsibility for coordination/execution PDU* Implementation responsibility by OMIA. Works should be done by outsourcing to private sector or possibly done by Island Administrations
Contracting Method: Conventional tender through national competitive bidding to MFEM guidelines. Contract administration and construction supervision by implementing agency which in turn could do it in-house or outsource task.
O&M Responsibility: Island Administrations or outsourced to private sector Risk assessment: Environmental spills due to improper operation practices –
o provide adequate training for operators to reduce risk; o formalize need for checking of facilities as part of the annual EMC
preparedness audits to be done by EMCI Maintenance not done properly due to shortage of funds – ensure
adequate provisions allocated under annual budgets Implementation schedule:
Fiscal Year: To be determined through prioritisation and programming
Current Status: Need project prioritisation and approval *New PDU yet to be established. Presently such work is carried out by AMD.

118 Appendix 5
Project Profile
Project ID: SNW09NGI Sector: Sanitation Name: Construction of septage treatment facilities on the northern islands Island: Palmerston, Pukapuka, Nassau, Manihiki, Rakahanga and Penrhyn Location: At sites to be determined on each island Background/Rationale: There are no septage treatment facilities on any of the northern islands.
Septic tanks are either not desludged (the overwhelming case) or are done so by manual shovelling out of the accumulated sludge and burying it nearby the septic tank. In either case, the sludge poses an environmental risk, especially to the shallow water table, and a personal health risk during desludging of the tank. A simple centralized septage pond will provide effective treatment of the septic sludge and reduce the risk of contamination of the water supply source
Objective: Provide proper septage treatment and disposal facilities to all northern islands
Description of works: Construction of septage treatment pond, residuals drying bed and drip irrigation system for polished liquid disposal. Elements will include a solar pump, pipework and geomembrane liner.
Features: Elimination of environmental and health hazards resulting from the dumping of raw septage into unlined shallow holes.
Higher quality of treated effluent resulting from regular desludging of the septic tanks, thus less loads on the effluent disposal fields
Would provide revenue if charges were to be put in place Operation of the facility could be outsourced to private sector
Estimated Beneficiaries: Some 1,800 people on the 6 northern islands will benefit from better septage management
Environmental Category: ADB category A: Project will have overall beneficial impact on the environment. However, location of septage plants will be a sensitive community issue needing consultation; Land acquisition will be required.
Land Requirement: New site is required for the facilities Climate change adaptation needs:
Treatment plant sites need protection from sea surges and high wind speeds.
Project cost estimate: Capital cost estimate: $0.15 million Note: estimate of incremental cost of climate change adaptation works included in capital cost above is $20,000.
O&M cost estimate: $30,000 per annum (total 6 islands) Implementation options: Work should be outsourced to private sector
Operation and maintenance could be outsourced to private sector or done by the Island Administrations
Profile Created: 10 October 2006 Current Version: 10 October 2006

Appendix 5 119
Project Tracking
Last updated: 10 October 2006 Project Preparation Status Project Identification: Project has been identified through the ADB preventive infrastructure
master planning study. (ADB TA4605) Stakeholder consultations:
Extensive consultations will be needed with villagers.
Feasibility study: Will be required and is a prerequisite for proceeding Engineering design: Not yet started – completion of feasibility study Is a prerequisite Land acquisition: Sites yet to be identified Environmental assessment:
Not yet started
Procurement: Not started Construction: Not started Budget allocation for O&M:
Not started
Project Implementation Status Funding Source: CIGOV national budget or loan Implementation Arrangements:
Primary responsibility for coordination/execution PDU* Implementation responsibility by OMIA. Works should be done by outsourcing to private sector or possibly done Island Administrations
Contracting Method: Conventional tender through national competitive bidding to MFEM/lending agency guidelines. Contract administration and construction supervision by implementing agency or Island Administration which in turn could or outsource task to the private sector
O&M Responsibility: Island Administrations or outsourced to private sector Risk assessment: Community will reject the project especially location of treatment
facilities – ensure community participation throughout the project Environmental spills due to improper operation practices –
o provide adequate training for operators to reduce risk; o request periodic self-monitoring and reporting on effluent quality; o ensure random checks carried out by NES o empower NES to enforce compliance with discharge conditions
including imposition of penalties for non-compliance; o formalize need for annual performance audits to be done by
external specialist Maintenance not done properly due to shortage of funds – ensure
adequate provisions allocated under annual budgets; consider introduction of desludging charges
Implementation schedule:
Fiscal Year: To be determined through prioritisation and programming
Current Status: Need project prioritisation and go ahead for feasibility study *New PDU yet to be established. Presently such work is carried out by AMD.

120 Appendix 5
Project Profile
Project ID: SNS05RAR Sector: Sanitation Name: Rarotonga evapo-transpiration bed pilot study Island: Rarotonga Location: Foreshore area Background/Rationale: Currently septic effluent is disposed via soakage pits or absorption areas.
Since the coral sand in the foreshore areas is highly porous, there is very little additional treatment as the nutrient-rich effluent percolates through the soil to the underlying groundwater table. Consequently, the effluent from foreshore areas is a major source of nutrients into the lagoon, affecting not only water quality but also the marine ecosystem. Replacement of all septic tanks by more advanced treatment systems would impose high costs on households. Disposal via evapotranspiration is a potentially a cost effective improvement. As its effectiveness under Rarotonga climate is untested, it needs piloting prior to large-scale conversions are to take place.
Objective: Trial the effectiveness of an effluent disposal system primarily based on evapotranspiration thus reducing the amount of nutrients entering the water table and lagoon
Description of works: The pilot will include evapotranspiration beds in 3 locations and 2 absorption beds for control. The existing absorption areas will be converted to evapotranspiration beds with added drip irrigation systems to ensure effluent is either evaporated or taken up by plants. The systems will comprise PE liners, agricultural drain pipes, solar pumps, and sampling wells in 4 locations around each bed. The program will be run for 12 months and involve weekly sampling and monitoring.
Features: The pilot study will provide a low cost assessment of the suitability of evapotranspiration beds on Rarotonga
If proven successful, the pilot could be scaled up to all the foreshore households on Rarotonga
If successful, project will reduce the nutrient load to the water table and lagoon
Regular effluent discharge and water quality monitoring included in the study
Estimated Beneficiaries: None during the pilot phase. If the pilot system were successful, residents in foreshore areas that convert to the system would benefit
Environmental Category: ADB category C: Project is a pilot study and includes monitoring and assessment of environmental effects
Land Requirement: None required Climate change adaptation needs:
Protection of the project from high intensity rainfall events, and storms, including high wind speeds
Project cost estimate: Capital cost estimate: $0.030 million O&M cost estimate: $20,000 for the 1-year duration of study
Implementation options: Study should be carried out by MOW or alternatively MOH as the latter is the current agency taking the lead on sanitation and on-site septic tank systems
Profile Created: 10 October 2006 Current Version: 10 October 2006

Appendix 5 121
Project Tracking
Last updated: 10 October 2006 Project Preparation Status Project Identification: Project has been identified through the ADB preventive infrastructure
master planning study. (ADB TA4605) Stakeholder consultations:
None required, but publicizing of the project will be a useful precursor to wide scale implementation after the study
Feasibility study: Not required Engineering design: Not yet started Land acquisition: Not required Environmental assessment:
Not required as impact monitoring and assessment are parts of the study
Procurement: Not yet started Construction: Not yet started Budget allocation for O&M:
Not yet started
Project Implementation Status Funding Source: CIGOV national budget Implementation Arrangements:
Primary responsibility for coordination/execution MOW or MOH Implementation responsibility by MOW or MOH
Contracting Method: Not required if done in-house. If contract out construction use local competitive bidding with contract administration and supervision by implementing agency
O&M Responsibility: Implementing agency Risk assessment: Overflows due to improper operation practices – should be minimized
as weekly sampling will be carried out Maintenance not done properly – ensure regular desludging of septic
tanks is enforced under national septage management plan Implementation schedule:
Fiscal Year: To be determined through prioritisation and programming
Current Status: Need project prioritisation and approval

122 Appendix 5
Project Profile
Project ID: SNS06MUK Sector: Sanitation Name: Mauke composting toilet pilot study Island: Mauke Location: To be determined Background/Rationale: Composting toilets are highly effective in reducing the amount
wastewater generated and so minimize the impact on the underlying shallow water table. However, these systems require extensive routine maintenance. Therefore, their practicality and acceptance by the community needs to be ascertained prior to wholesale introduction into a community. Acceptance of the system largely depends on community education and working together with the coordinators to instil a permanent culture change into the households
Objective: Trial the effectiveness and acceptance of composting toilets thus reducing the amount of wastewater generated and discharged to the water table.
Description of works: The pilot will include construction of composting toilets into a number of households in one village on the island. The systems will comprise a new composting toilet unit and shed and groundwater monitoring wells. The program will be run for 12 months and involve regular contact with the households to ensure proper operation procedures are practiced and to ensure that the maintenance habits become part of the household routine.
Features: The pilot study will provide a low cost assessment of the suitability of composting toilets
If proven successful, the pilot could be scaled up to all the outer islands with priority on the southern group where groundwater is the primary source of reticulated water supply
If successful, project will reduce the nutrient load to the water tables and lagoons
Regular effluent discharge and groundwater quality monitoring included in the study
Estimated Beneficiaries: None during the pilot phase. If the pilot system were successful, residents that convert to the system would benefit
Environmental Category: ADB category C: Project is a pilot study and includes monitoring and assessment of environmental effects
Land Requirement: None required Climate change adaptation needs:
None
Project cost estimate: Capital cost estimate: $0.05 million O&M cost estimate: $20,000 for the 1-year duration of study
Implementation options: Study should be carried out by MOW or alternatively MOH as the latter is the current agency taking the lead on sanitation and on-site septic tank systems
Profile Created: 10 October 2006 Current Version: 10 October 2006

Appendix 5 123
Project Tracking
Last updated: 10 October 2006 Project Preparation Status Project Identification: Project has been identified through the ADB preventive infrastructure
master planning study. (ADB TA4605) Stakeholder consultations:
Need to identify willing residents. Publicizing of the project will be a useful precursor to wide scale implementation after the study
Feasibility study: Not required Engineering design: Not yet started Land acquisition: Not required Environmental assessment:
Not required as impact monitoring and assessment are parts of the study
Procurement: Not yet started Construction: Not yet started Budget allocation for O&M:
Not yet started
Project Implementation Status Funding Source: CIGOV national budget Implementation Arrangements:
Primary responsibility for coordination/execution MOW or MOH Implementation responsibility by MOW or MOH
Contracting Method: Not required if done in-house. If contract out construction use local competitive bidding with contract administration and supervision by implementing agency
O&M Responsibility: Household with guidance by the implementing agency Risk assessment: Overflows due to improper operation practices – should be minimized as
weekly sampling will be carried out Maintenance not done properly – ensure regular monitoring and
operation as per manufacturer’s instructions Implementation schedule:
Fiscal Year: To be determined through prioritisation and programming
Current Status: Need project prioritisation and approval

124 Appendix 5
Project Profile
Project ID: SNS07PYE Sector: Sanitation Name: Penrhyn evapotranspiration bed pilot study Island: Penrhyn Location: At a site to be determined Background/Rationale: Currently septic effluent is disposed via soakage pits or absorption areas.
Since the coral sand is highly porous, there is very little additional treatment as the nutrient-rich effluent percolates through the soil to the underlying groundwater table. Consequently, the effluent from is a major source of nutrients into freshwater lens which is a potential source of water supply. Replacement of all septic tanks by more advanced treatment systems would impose high costs on households. Disposal via evapotranspiration is a potentially a cost- effective improvement. As its effectiveness under Penrhyn climatic conditions is untested, it needs piloting prior to large-scale conversions taking place.
Objective: Trial the effectiveness of an effluent disposal system primarily based on evapotranspiration thus reducing the amount of nutrients entering the water table
Description of works: The pilot will include evapotranspiration beds in 3 locations and 2 absorption beds for control. The existing absorption areas will be converted to evapotranspiration beds with added drip irrigation systems to ensure effluent is either evaporated or taken up by plants. The systems will comprise PE liners, agricultural drain pipes, PE drip irrigation pipes, solar pumps, and sampling wells in 4 locations around each bed. The program will be run for 12 months and involve periodic sampling and monitoring.
Features: The pilot study will provide a low cost assessment of the suitability of evapotranspiration beds on Penrhyn
If proven successful, the pilot could be scaled up to all islands in the northern group
If successful, project will reduce the nutrient load to the water tables and lagoons
Regular effluent discharge and water quality monitoring included in the study
Estimated Beneficiaries: None during the pilot phase. If the pilot system were successful, residents in foreshore areas that convert to the system would benefit
Environmental Category: ADB category C: Project is a pilot study and includes monitoring and assessment of environmental effects
Land Requirement: None required Climate change adaptation needs:
Protection of the beds from sea surge, saltwater intrusion, and flooding require consideration
Project cost estimate: Capital cost estimate: $0.06 million. O&M cost estimate: $30,000 per annum
Implementation options: Study should be carried out by MOH as the current agency taking the lead on sanitation and on-site septic tank systems
Profile Created: 10 October 2006 Current Version: 10 October 2006

Appendix 5 125
Project Preparation Status Project Identification: Project has been identified through the ADB preventive infrastructure
master planning study. (ADB TA4605) Stakeholder consultations:
Need to identify willing residents. Publicizing of the project will be a useful precursor to wide scale implementation after the study
Feasibility study: Not required Engineering design: Not yet started Land acquisition: Not required Environmental assessment:
Not required as impact monitoring and assessment are parts of the study
Procurement: Not yet started Construction: Not yet started Budget allocation for O&M:
Not yet started
Project Implementation Status Funding Source: CIGOV national budget Implementation Arrangements:
Primary responsibility for coordination/execution MOH Implementation responsibility by Island Administration
Contracting Method: Not required if done in-house. If contract out construction use local competitive bidding with contract administration and supervision by implementing agency
O&M Responsibility: Household with guidance by the implementing agency Risk assessment: Overflows due to improper operation practices – should be minimized as
weekly sampling will be carried out Maintenance not done properly – ensure regular monitoring and
operation as per manufacturer’s instructions Implementation schedule:
Fiscal Year: To be determined through prioritisation and programming
Current Status: Need project prioritisation and approval

126 Appendix 5
Project Profile
Project ID: SNS08PZK Sector: Sanitation Name: Pukapuka residuals to soil conversion pilot study Island: Pukapuka Location: At a site to be determined Background/Rationale: The soils on the northern islands are poor and unsuitable for growing of
vegetables. Residuals from the septage ponds together with green waste can be composted and turned into soil conditioners. The soil conditioner may be suitable for hydroponic plants. Before making any large-scale investment, it is prudent to establish the feasibility of such reuse through a small test project. Acceptance by the community also needs to be ascertained. This project is a pilot study to establish the practicality of such an operation and the likely yields of soil supplement that could be achieved and the suitability for vegetable cultivation.
Objective: Establish the feasibility of converting residuals to soil conditioner. Description of works: The pilot will include construction of composting facilities and the
monitoring of the results. The facilities will comprise site works to set up a composting area, placement of liners, drainage pipes and a collecting tank for leachate and drainage water and hire of a backhoe for periodic turning of the compost pile. The program will be run for 12 months.
Features: The pilot study will provide a low cost assessment of the practicality of composting residuals and their conversion to soil conditioners
The soil conditioner should enhance vegetable production on the outer islands and thus providing opportunities for health improvements
If proven successful, the pilot could be scaled up to full scale operation all the outer islands with priority on the northern group where soils are poor and not suitable for agriculture
If successful, project will provide an opportunity to reuse a waste by-product and at the same reduce the impact on the environment
Periodic groundwater quality monitoring is included in the study Estimated Beneficiaries: None during the pilot phase. If the pilot study was successful, some
1,800 people if the process was adopted for all the northern group islands
Environmental Category: ADB category C: Project is a pilot study and includes monitoring and assessment of environmental effects
Land Requirement: Site required, but preference is for government-owned land Climate change adaptation needs:
High rainfall events and impacts from cyclones need to be taken into account for the feasibility
Project cost estimate: Capital cost estimate: $0.03 million O&M cost estimate: $20,000 for the 1-year duration of study
Implementation options: Study should be carried out by MOH as the current agency taking the lead on sanitation and on-site septic tank systems, with advice from the Ministry of Agriculture
Profile Created: 10 October 2006 Current Version: 10 October 2006

Appendix 5 127
Project Tracking
Last updated: 10 October 2006 Project Preparation Status Project Identification: Project has been identified through the ADB preventive infrastructure
master planning study. (ADB TA4605) Stakeholder consultations:
Need to identify willing residents. Publicizing of the project will be a useful precursor to wide scale implementation after the study
Feasibility study: Not required Engineering design: Not yet started Land acquisition: Not required Environmental assessment:
Not required as impact monitoring and assessment are parts of the study
Procurement: Not yet started Construction: Not yet started Budget allocation for O&M:
Not yet started
Project Implementation Status Funding Source: CIGOV national budget Implementation Arrangements:
Primary responsibility for coordination/execution MOH Implementation responsibility by MOH
Contracting Method: Not required if done in-house. If contract out construction use local competitive bidding with contract administration and supervision by implementing agency or Island Administration
O&M Responsibility: Island Administration with guidance by the implementing agency Risk assessment: Health risks – ensure proper training of operators and protective
measures are put in place Maintenance not done properly – ensure regular monitoring and
operation as per manufacturer’s instructions Implementation schedule:
Fiscal Year: To be determined through prioritisation and programming
Current Status: Need project prioritisation and approval

128 Appendix 5
Project Profile
Project ID: SWW01RAR Sector: Solid Waste Management Name: Construction of Rarotonga solid waste transfer station Island: Rarotonga Location: At a site to be determined Background/Rationale: Currently nearly all waste generated on Rarotonga is collected as part of
the routine domestic garbage collection with minor separation of waste streams. Residents can take their recyclables to the central facility A separate private company collects hazardous waste (metals, batteries, electronic equipment etc) for packaging and shipment offshore. Without reduction in the amount of waste going to landfill, the recently built landfill site will be filled in less than 15 years – its design life. Therefore, there is a priority need to establish a central transfer station to separate waste into degradable, hazardous and non degradable streams to ensure that only non-degradable waste is being transferred to the landfill site. Feasibility study (Project ID SWS01RAR) is a prerequisite.
Objective: To reduce waste going to the landfill site so as to extend the life of the existing facility and to improve the efficiency of waste management on the island.
Description of works: Design and construction of waste transfer station including a stream separation area; siteworks, stockpiling area, sheds and front end loader
Features: Project will minimise waste going to landfill and so extend the life of the waste management centre to at least its design life thus deferring the need for a new site
Operation cost savings from more efficient management of waste Will improve the operation of the landfill site as compostable and
hazardous waste will be minimized – this will have benefits when the site is reused in the future
Provide opportunity for private sector involvement Would provide revenue if tariffs were to be put in place
Estimated Beneficiaries: About 10,000 residents of Rarotonga will benefit from better waste management in the area
Environmental Category: ADB category B: Project will involve the development of a site for waste storage. Therefore an IEE will be required to determine if a full EIA is needed
Land Requirement: Needed for the transfer station Climate change adaptation needs:
Site selection and layout design should take into account of projected increased cyclone events, high wind speeds, flooding and if applicable, sea surge protection.
Project cost estimate: Capital cost estimate: $0.5 million Note: estimate of incremental cost of climate change adaptation works included in capital cost above is $50,000.
O&M cost estimate: $30,000 per annum Implementation options: Design and construction should be outsourced to private sector
O&M could be outsourced to private sector or done by MOW Profile Created: 10 October 2006 Current Version: 10 October 2006

Appendix 5 129
Project Tracking
Last updated: 10 October 2006 Project Preparation Status Project Identification: Project has been identified through the ADB preventive infrastructure
master planning study. (ADB TA4605). Stakeholder consultations:
Extensive consultations will be needed with residents near the transfer station site
Feasibility study: Will be required and is a prerequisite for proceeding Engineering design: Not yet started – completion of feasibility study Is a prerequisite Land acquisition: Site yet to be identified Environmental assessment:
Not yet started
Procurement: Not started Construction: Not started Budget allocation for O&M:
Not started
Project Implementation Status Funding Source: CIGOV national budget or loan Implementation Arrangements:
Primary responsibility for coordination/execution PDU* Implementation responsibility by MOW. Works should be done by outsourcing to private sector or possibly done in-house by MOW
Contracting Method: Conventional tender through national competitive bidding to MFEM/lending agency guidelines. Contract administration and construction supervision by implementing agency which in turn could do it in-house or outsource task.
O&M Responsibility: MOW or outsourced to private sector Risk assessment: Community will reject the project especially location of the facilities –
ensure community participation throughout the project Environmental spills due to improper operation practices –
o Include adequate provision in design for safe handling and contained storage
o provide adequate training for operators to reduce risk; o ensure random checks carried out by NES o empower NES to enforce compliance with discharge conditions
including imposition of penalties for non-compliance; o formalize need for annual performance audits to be done by
external specialist Maintenance not done properly due to shortage of funds – ensure
adequate provisions allocated under annual budgets; consider introduction of waste collection charges
Implementation schedule:
Fiscal Year: To be determined through prioritisation and programming
Current Status: Need project prioritisation and go ahead for feasibility study *New PDU yet to be established. Presently such work is carried out by AMD.

130 Appendix 5
Project Profile
Project ID: SWW02RAR Sector: Solid Waste Management Name: Rarotonga hazardous waste handling facilities upgrade Island: Rarotonga Location: Existing site near Avarua Background/Rationale: The existing facility for recycling white goods, vehicles, batteries,
electronic equipment and other metallic waste (collectively hazardous waste), is carried out by a private company. While it is a valuable service, capital investment in plant and equipment is needed even though the running cost of the facility is met by the operator. Due to the small scale, and thus limited returns from the operation, compounded by shipping expenses, capital investment requires support from the Government. Under the project the government would invest in plant and equipment and leases it to the private sector for use and maintenance. The facility would also handle hazardous waste from the outer islands subject to the findings of a feasibility study (Project ID SWS04NAT)
Objective: To establish a sustainable national hazardous waste handling facility. Description of works: Procurement of compactors, metal cutting equipment and front end
loader for processing the hazardous waste. Features: Create a sustainable hazardous waste management facility
Provide opportunity for private sector involvement in a public/ private partnership arrangement
Improve the environment as hazardous waste is removed Contribute towards extending the life of the landfill facilities.
Estimated Beneficiaries: About 10,000 residents of Rarotonga will benefit from better the proper control of risks associated with hazardous waste contamination of land or water.
Environmental Category: ADB category B: The operation of the site will generate noise and management of oil and other chemical spills on site may impact on the environment. Therefore an IEE will be required to determine if a full EIA is needed.
Land Requirement: The operation is to be leased to a private sector operator and therefore land acquisition will not required However, there may be land selection issues.
Climate change adaptation needs:
Site selection and layout design should take account of increased predicted cyclone events, high wind speeds, flooding and if applicable, protection from sea surges.
Project cost estimate: Capital cost estimate: $0.5 million. O&M cost estimate: $50,000 per annum
Implementation options: Design and construction should be outsourced to the private sector O&M should be outsourced to the private sector
Profile Created: 10 October 2006 Current Version: 10 October 2006

Appendix 5 131
Project Tracking
Last updated: 10 October 2006 Project Preparation Status Project Identification: Project has been identified through the ADB preventive infrastructure
master planning study. (ADB TA4605). Stakeholder consultations:
Consultations will be needed with residents near the waste handling site
Feasibility study: Required for extending the service coverage to the outer islands refer Project ID SWS04NAT
Engineering design: Not required Land acquisition: Not required Environmental assessment:
Not yet started
Procurement: Not started Construction: Not required Budget allocation for O&M:
Not required
Project Implementation Status Funding Source: CIGOV national budget or loan Implementation Arrangements:
Primary responsibility for coordination/execution PDU* Implementation responsibility by MOW. Works should be done by outsourcing to private sector
Contracting Method: Conventional tender through national competitive bidding to MFEM/lending agency guidelines. Contract administration and construction supervision by implementing agency.
O&M Responsibility: private sector operator Risk assessment: Community will reject the location of the facilities – ensure community
participation throughout the project and provision of guidelines on siting for private sector operators
Environmental spills due to improper operation practices – o ensure adequate design of hazardous waste containment
facilities o provide adequate training for operators to reduce risk; o ensure random checks carried out by NES o empower NES to enforce compliance with discharge conditions
including imposition of penalties for non-compliance; o formalize need for annual performance audits to be done by
external specialist Implementation schedule:
Fiscal Year: To be determined through prioritisation and programming
Current Status: Need project prioritisation *New PDU yet to be established. Presently such work is carried out by AMD.

132 Appendix 5
Project Profile
Project ID: SWW03RAR Sector: Solid Waste Management Name: Construction of Rarotonga compost facilities Island: Rarotonga Location: To be determined Background/Rationale: There are no large-scale composting facilities on Rarotonga. Most
households either bury or burn the green waste. Some of the waste also ends up at the municipal landfill site. The widespread practice has potential health and environmental implications. The green waste, if composted, would be a valuable resource and an import-replacement product (most of the fertilizers and soil conditioners are imported at present). Under the project the government invests in plant and equipment and leases it to the private sector for use and maintenance.
Objective: To establish a sustainable central composting operation on Rarotonga Description of works: Establish a composting site, procurement of mobile wood chippers, dump
truck and backhoe. Features: Create a sustainable composting and soil conditioner facility
Provide opportunity for private sector involvement in a public/ private partnership arrangement
Improve the environment through reduction if open burning of green waste
End product could be sold as a soil conditioner Contribute towards extending the life of the landfill facilities Foster greater awareness on solid waste issues and encourage
source separation of waste Estimated Beneficiaries: About 10,000 residents of Rarotonga will benefit from better waste
management on the island Environmental Category: ADB category B:
Overall operations will have beneficial impact on the environment. But the operation of the site may entail public nuisance from odour and excessive noise generation. Therefore an IEE will be required to determine if a full EIA is needed.
Land Requirement: Needed for the composting facility Climate change adaptation needs:
Site selection and layout design should take account of projected increase in cyclone events, high wind speeds, flooding and if applicable, sea surge protection.
Project cost estimate: Capital cost estimate: $0.50 million. O&M cost estimate: $50,000 per annum
Implementation options: Design and construction should be outsourced to private sector Operation and maintenance could be outsourced to private sector
Profile Created: 10 October 2006 Current Version: 10 October 2006

Appendix 5 133
Project Tracking
Last updated: 10 October 2006 Project Preparation Status Project Identification: Project has been identified through the ADB preventive infrastructure
master planning study. (ADB TA4605). Stakeholder consultations:
Consultations will be needed with residents near the waste handling site
Feasibility study: Required for extending the service coverage to the outer islands refer Project ID SWS03NAT
Engineering design: Not required Land acquisition: Not required Environmental assessment:
Not yet started
Procurement: Not started Construction: Not required Budget allocation for O&M:
Not required
Project Implementation Status Funding Source: CIGOV national budget or loan Implementation Arrangements:
Primary responsibility for coordination/execution PDU* Implementation responsibility by MOW. Works should be done by outsourcing to private sector
Contracting Method: Conventional tender through national competitive bidding to MFEM/lending agency guidelines. Contract administration and construction supervision by implementing agency.
O&M Responsibility: private sector operator Risk assessment: Community will reject the location of the facilities – ensure community
participation throughout the project and guidance to private sector operator on siting and site management
Environmental spills due to improper operation practices – o provide adequate training for operators to reduce risk; o ensure random checks carried out by NES o empower NES to enforce compliance with discharge conditions
including imposition of penalties for non-compliance; o formalize need for annual performance audits to be done by
external specialist Implementation schedule:
Fiscal Year: To be determined through prioritisation and programming
Current Status: Need project prioritisation *New PDU yet to be established. Presently such work is carried out by AMD.

134 Appendix 5
Project Profile
Project ID: SWW04SGI Sector: Solid Waste Management Name: Construction of new landfill sites on southern islands Island: Mangaia, Atiu, Mauke and Mitiaro Location: Site locations to be determined on each island Background/Rationale: Currently garbage is either buried in community pits or disposed at open
dump sites. The practice poses a health hazard from vermin and other disease vectors and potential contamination of the water table which is a source of water supply to the communities. There is a need for a simple landfill on each island to reduce these risks.
Objective: To meet minimum level of standard by providing a safe solid waste disposal facility to all communities
Description of works: Construction of a simple landfill site with plastic liner and equipment for operation. A waste separation area and composting facility is to be included to reduce the buried waste. Hazardous waste is to be stockpiled for periodic shipment to Rarotonga
Features: Lower the risk of groundwater contamination and reduce wind-blown rubbish thus improving the aesthetics of the site.
Reduction in total volumes of waste consigned to pits Potential elimination of practice of burning rubbish Reduce contamination risks to groundwater sources Generation of compost which could be used for agricultural use Could involve private sector
Estimated Beneficiaries: About 2,000 people Environmental Category: ADB category B:
Overall operations will have beneficial impact on the environment. An IEE will be required to assess environmental impacts and to see if EIA is required
Land Requirement: 1 site required on each island Climate change adaptation needs:
Site selection and layout design should take account of predicted increase in cyclone events, high wind speeds, flooding and if applicable, sea surge protection.
Project cost estimate: Capital cost estimate: $0.60 million (total for 4 islands) O&M cost estimate: $40,000 per annum (total for 4 islands)
Implementation options: Design and construction should be outsourced to private sector Operation and maintenance could be outsourced to private sector
Profile Created: 10 October 2006 Current Version: 10 October 2006

Appendix 5 135
Project Tracking
Last updated: 10 October 2006 Project Preparation Status Project Identification: Project has been identified through the ADB preventive infrastructure
master planning study. (ADB TA4605) Stakeholder consultations:
Consultation will be required with residents
Feasibility study: Required to identify site Engineering design: Not yet started Land acquisition: Not yet started. Environmental assessment:
Not yet started
Procurement: Not yet started Construction: Not yet started Budget allocation for O&M:
Not yet started
Project Implementation Status Funding Source: CIGOV national budget or loan Implementation Arrangements:
Primary responsibility for coordination/execution PDU* Implementation responsibility by OMIA. Works should be done by outsourcing to private sector or could be done by Island Administrations.
Contracting Method: Conventional tender through national competitive bidding to MFEM/lending agency guidelines. Contract administration and construction supervision by implementing agency.
O&M Responsibility: Island Administrations or private sector operator Risk assessment: Community will reject the location of the facilities – ensure community
participation throughout the project Environmental spills due to improper operation practices –
o provide adequate training for operators to reduce risk; o ensure random checks carried out by NES o empower NES to enforce compliance with discharge conditions
including imposition of penalties for non-compliance; o formalize need for technical back-up and annual performance
audits to be done by external specialist Implementation schedule:
Fiscal Year: To be determined through prioritisation and programming
Current Status: Need project prioritisation *New PDU yet to be established. Presently such work is carried out by AMD.

136 Appendix 5
Project Profile
Project ID: SWW05NGI Sector: Solid Waste Management Name: Construction of new landfill sites on each of the northern islands Island: Palmerston, Pukapuka, Nassau, Manihiki, Rakahanga and Penrhyn Location: Site locations to be determined on each island Background/Rationale: Currently garbage is either buried in community pits or disposed at open
dump sites. The practice poses a health hazard from vermin and other disease vectors and potential contamination of the water table which is a source of water supply to the communities. There is a need for a simple landfill on each island to reduce these risks.
Objective: To meet minimum level of standard by providing a safe solid waste disposal facility to all communities
Description of works: Construction of a simple landfill site with plastic liner and equipment for operation. A waste separation area and composting facility is to be included to reduce the buried waste. Hazardous waste is to be stockpiled for periodic shipment to Rarotonga
Features: Lower the risk of groundwater contamination and reduction of wind-blown rubbish thus improving the aesthetics of the site.
Reduction in total volumes of waste consigned to pits Potential elimination of practice of burning rubbish Generation of compost which could be used for agricultural use Could involve private sector
Estimated Beneficiaries: About 1,800 people Environmental Category: ADB category B:
Overall operations will have beneficial impact on the environment. An IEE will be required to assess environmental impacts and to see if EIA is required
Land Requirement: 1 site required on each island Climate change adaptation needs:
Site selection and layout design should take account of projected increase in cyclone events, high wind speeds, flooding and sea surge protection.
Project cost estimate: Capital cost estimate: $0.80 million (total for 6 islands) O&M cost estimate: $60,000 per annum (total for 6 islands)
Implementation options: Design and construction should be outsourced to private sector Operation and maintenance could be outsourced to private sector
Profile Created: 10 October 2006 Current Version: 10 October 2006

Appendix 5 137
Project Tracking
Last updated: 10 October 2006 Project Preparation Status Project Identification: Project has been identified through the ADB preventive infrastructure
master planning study. (ADB TA4605) Stakeholder consultations:
Consultation will be required with residents
Feasibility study: Required to identify site Engineering design: Not yet started Land acquisition: Not yet started. Environmental assessment:
Not yet started
Procurement: Not yet started Construction: Not yet started Budget allocation for O&M:
Not yet started
Project Implementation Status Funding Source: CIGOV national budget or loan Implementation Arrangements:
Primary responsibility for coordination/execution PDU* Implementation responsibility by OMIA. Works should be done by outsourcing to private sector or could be done by Island Administrations.
Contracting Method: Conventional tender through national competitive bidding to MFEM/lending agency guidelines. Contract administration and construction supervision by implementing agency.
O&M Responsibility: Island Administrations or private sector operator Risk assessment: Community will reject the location of the facilities – ensure community
participation throughout the project Environmental spills due to improper operation practices –
o provide adequate training for operators to reduce risk; o ensure random checks carried out by NES o empower NES to enforce compliance with discharge conditions
including imposition of penalties for non-compliance; o formalize need for technical back-up and annual performance
audits to be done by external specialist Implementation schedule:
Fiscal Year: To be determined through prioritisation and programming
Current Status: Need project prioritisation *New PDU yet to be established. Presently such work is carried out by AMD.

138 Appendix 5
Project Profile
Project ID: ENW01PYE Sector: Energy Name: Exchange Generators Island: Penrhyn Location: Omoka Background/Rationale: There are currently insufficient loads to efficiently operate the power
station in Omoka, Penrhyn. It is planned to exchange the 65 kVA generator set on Penrhyn with two 15 kVA units from one of the southern islands power stations where load requirements are higher. Both units will need to be checked and if required undergo repair works before being sent to the respective islands.
Objective: To improve performance efficiency of electricity generation on Penrhyn Description of Works: Identify the island where the replacement genset can be obtained
Repair the replacement units and ship to Penrhyn for installation Overhaul the Penrhyn genset and ship to the respective island where
the replacement unit was obtained Features: Project will reduce operating costs
Improve system performance and quality of supply to consumers Save fuel and operating cost for the Island Administration
Estimated Beneficiaries: Overall some 300 people will receive improved and reliable power supply
Environmental Category: ADB category C: No significant impacts as the project is to improve existing facilities
Land Requirement: Not required Climate change adaptation needs:
Not required.
Project Cost Estimate: Capital cost estimate: $0.03 million O&M costs will be absorbed in the Island Administration operations
Implementation options: Work can be done by public or private sector Profile Created: 1 October 2006 Current Version: 1 October 2006

Appendix 5 139
Project Tracking
Last updated: 10 October 2006 Project Preparation Status Project Identification: Project has been identified by the TA 4605-COO team visit in August
2006. Stakeholder Consultations:
Initial discussions completed with Island Council.
Feasibility Study: Not required Engineering Design: Not required Land Acquisition: Not required Environmental Assessment:
Not required
Procurement: Not started Construction: Not started
Project Implementation Status Funding Source: CIGOV national budget Implementation Arrangements:
OMIA in collaboration with the respective Island Administrations
Contracting Method: Not required O&M Responsibility: Island Administration Risk assessment: Delays due to shipping schedule – ensure that the generator sets are
sent on the first available boat Operation and maintenance constraints due to funds shortage –
ensure adequate provisions allocated under annual budgets Implementation schedule: Fiscal Year 2007/08 Current Status: Awaiting decision by government

140 Appendix 5
Project Profile
Project ID: ENW02NAT Sector: Energy Name: Outer Islands electrical wiring standardisation program Island: Aitutaki, Atiu, Mangaia, Mauke, Mitiaro, Manihiki, Nassau, Palmerston,
Penrhyn, Pukapuka, Rakahanga Location: Throughout all of the outer islands Background/Rationale: There is a need to standardise the installation of electrical wiring on
buildings in the outer islands to maximise safety to both consumers and service technicians. The program would also provide an opportunity to make climate change adaptation modifications such as raising of switches and junction boxes above potential high water levels where practical.
Objective: To ensure the safe operation of electrical power supply in the Outer Islands.
Description of Works: TAU to establish program Island visits and inspections by technicians
Features: Project will ensure safety to all consumers for the use of electricity Improve delivery of power service to consumers (meet minimum level of
service) Improve living standards Make climate change adaptation modifications
Estimated Beneficiaries: Approximately 5,000 people will benefit form improvements in safety of their reliable power supply and connections.
Environmental Category: ADB category C: No significant impacts as the project is to improve existing facilities
Land Requirement: Not required Climate change adaptation needs:
Climate change adaptation measures such as relocation of switches and junction boxes can be incorporated into program
Project Cost Estimate: Capital cost estimate: $0.22 million O&M cost estimate: $10,000 per annum
Implementation options: Work can be done by TAU or private sector under TAU or Energy Division supervision
Profile Created: 1 October 2006 Current Version: 1 October 2006

Appendix 5 141
Project Tracking
Last updated: 10 October 2006 Project Preparation Status Project Identification: Project has been identified by the ADB TA 4605-COO team in consultation
with TAU and Energy Division. Stakeholder Consultations:
Need further consultation with the respective stakeholders
Feasibility Study: Not required Engineering Design: Not required Land Acquisition: Not required Environmental Assessment:
Not required
Procurement: Not started Construction: Not started
Project Implementation Status Funding Source: CIGOV national budget Implementation Arrangements:
Primary responsibility for coordination/execution PDU* Implementation responsibility by OMIA in coordination with TAU. Works should be done by outsourcing to private sector or could be done by Island Administrations – in both cases under the supervision of TAU.
Contracting Method: Not required if work is to be carried out by Island Administration or outsourced to TAU. Standard MFEM tendering procedures if outsourced to the private sector.
O&M Responsibility: Island Administration or may be outsourced to private sector Risk assessment: Confusion over precise standards to be complied with – provide clear
guidelines on standards to be adopted; TAU or Energy Division inspectors to carry out random checks for compliance
Operation and maintenance constraints due to funds shortage – ensure adequate provisions allocated under annual budgets
Implementation schedule: Fiscal Year 2007/08 Current Status: Awaiting decision by government
*New PDU yet to be established. Presently such work is carried out by AMD.

142 Appendix 5
Project Profile
Project ID: ENW03PZK Sector: Energy Name: Pukapuka Electricity Power Supply Upgrade Island: Pukapuka Location: Roto, Yato and Nake villages Background/Rationale: There is a need to upgrade the power supply on the island of Pukapuka.
The existing household solar panels and batteries are long past their useful life and many have been badly damaged by the cyclones in 2005. Although a brief desk top study under UNESCO/ENESCO funding in 2004 found upgrading of individual households to be preferred option, it did not look at the full economic costs of alternatives. The option places an unfair burden on households as the cost of batteries is expensive and that of electrical appliances which run on DC power is about three times the cost of similar units running on conventional AC power. A central electricity generation and distribution system will provide the same level of service to residents on Pukapuka as on other islands in the Cook Islands. The form of power generation is subject to a feasibility study. Prerequisite: Pukapuka solar power feasibility study (Project ID ENS01PZK)
Objective: To provide a reliable minimum 18-hour electricity supply to the resident Description of Works: Design and construction of electricity generation and distribution system
for the three villages on Pukapuka. Works will include laying of underground wires, electrical pillar boxes and transformers.
Features: Project will ensure a minimum level of electricity supply to residents Provide savings to households as they will not have to buy expensive
appliances that run on DC power. The land values are likely to increase due to sites being served by centralized power supply
Will improve living standards as reliable and affordable power will provide opportunity to purchase commercial electrical appliances such as blast freezers and so improve residents’ earning potential
Will address community concerns and desires, but will probably require equity contribution in the form of land transfer
Will provide revenue to offset O&M costs if tariffs were introduced Estimated Beneficiaries: Some 600 people will receive improved and reliable power supply Environmental Category: ADB category B: Project will involve developing a new site for a power
station. Therefore, an IEE will be required to assess environmental impacts and to see if EIA is required
Land Requirement: May be required for new power station if existing site is insufficient Climate change adaptation needs:
Design to take into account predicted climate change adaptation needs such as structural strengthening of building and transformer, buying of power limes below ground raising pillar boxes above storm surge levels.
Project Cost Estimate: Capital cost estimate: $2.5 million Note: estimate of incremental cost of climate change adaptation works included in capital cost above is $200,000.
O&M cost estimate: $100,000 per annum Implementation options: Design and construction should be outsourced to the private sector
O&M should be by the Island Admin or outsourced to the private sector Profile Created: 1 October 2006 Current Version: 10 November 2006

Appendix 5 143
Project Tracking
Last updated: 10 October 2006 Project Preparation Status Project Identification: Project has been identified by the ADB TA 4605-COO team in 2006.
Desk top study under taken by Bruce Clay under UNDP/UNESCO technical assistance in 2004 Ref: UNDP/UNESCO, Pukapuka, Power Sector/Feasibility Report, 2004
Stakeholder Consultations:
Initial consultation was conducted under ADB TA 4605-COO with Island Council and informal discussion with some residents. Need follow up consultation with all respective stakeholders
Feasibility Study: Not yet commenced Engineering Design: Not started, subject to feasibility study findings Land Acquisition: Site, or need for it, has not yet been identified. Environmental Assessment:
IEE not yet started.
Procurement: Not yet started Construction: Not yet started
Project Implementation Status Funding Source: CIGOV national budget or loan Implementation Arrangements:
Primary responsibility for coordination/execution PDU* Implementation responsibility by OMIA in support from TAU. Works should be done by outsourcing to private sector or could be done by Island Administration – in both cases under the supervision of TAU.
Contracting Method: Conventional tender through international competitive bidding to MFEM/lending agency guidelines. Contract administration and construction supervision by implementing agency which in turn could outsource task
O&M Responsibility: TAU or outsourced to private sector or Island Administration Risk assessment: Community will not provide land for power plant – ensure community
participation throughout the project Inefficient system operation – ensure efficient operation through:
o engaging international operator during first year to run the system and train the local operators before handing over;
o conduct periodic skill upgrade for operators and technicians; o formalising need for annual performance audits to be done by
independent (external) specialist Maintenance not done properly due to shortage of funds – ensure
adequate provisions allocated under annual budgets; introduce and collect tariffs
Implementation schedule: Fiscal Year: To be determined through prioritisation and programming Current Status: Need project prioritisation and go ahead for feasibility study
*New PDU yet to be established. Presently such work is carried out by AMD.

144 Appendix 5
Project Profile
Project ID: ENW04SGI Sector: Energy Name: Southern islands electricity supply systems rehabilitation program Island: Atiu, Mauke and Mitiaro Location: Villages on each of the islands Background/Rationale: There is a need to upgrade the power supply on these islands Objective: To provide reliable electricity power supply to the people on these islands. Description of Works: Procurement of capital items such as new cabling, transformers and
structural supports. Replacement of cabling and rehabilitation or structural elements.
Features: Reduction in operation and maintenance costs Improve delivery of power service to consumers (meet minimum level of
service) Increase public safety Improve living standards
Estimated Beneficiaries: Approximately 2,000 people will receive improved and reliable power supply
Environmental Category: ADB category C Project will have overall beneficial impact on existing sources. Project is essentially an asset replacement program, requiring only a review of environmental implications primarily during construction.
Land Requirement: Not required Climate change adaptation needs:
Generally not required, although power distribution system, such as overhead lines and above-ground structures, may need protection from predicted climate change effects
Project Cost Estimate: Capital cost estimate: $1.2 million O&M cost estimate: $170,000 (Total 3 islands)
Implementation options: Work should be outsourced to the private sector or could be done by the Island Administrations O&M could be done by Island Administrations or outsourced to the private sector
Profile Created: 1 October 2006 Current Version: 1 October 2006

Appendix 5 145
Project Tracking
Last updated: 10 October 2006 Project Preparation Status Project Identification: Project has been identified through the ADB preventive infrastructure
master planning study. (ADB TA4605) and the Bruce Clay reports: Ref: UNDP/UNESCO Power Sector/Feasibility Studies, 2004
Stakeholder Consultations:
Need to conduct follow up consultation with the relevant stakeholders
Feasibility Study: A prerequisite for this project Engineering Design: Not started Land Acquisition: Not required Environmental Assessment:
Identification of environmental implications during construction not yet started.
Procurement: Not started Construction: Not started
Project Implementation Status Funding Source: CIGOV national budget or loan and aid donor agencies Implementation Arrangements:
Primary responsibility for coordination/execution PDU* Implementation responsibility by OMIA with support from TAU. Works should be done by outsourcing to private sector or possibly TAU
Contracting Method: Conventional tender through local competitive bidding to MFEM/lending agency guidelines. Contract administration and construction supervision by implementing agency which in turn could do it in-house or outsource the task
O&M Responsibility: Island Administrations or outsourced to private sector Risk assessment: Inclement weather – construction program to consider cyclone
season Construction delays – employ suitably qualified and experienced
contractors Implementation of standards – ensure appropriate and thorough
guideline material available on siting, installation and placing of transmission lines
Operation and maintenance funds constraints – ensure adequate annual budget appropriation; ensure cost recovery via tariffs
Implementation schedule: Fiscal Year: To be determined through prioritisation and programming Current Status: Awaiting decision by government and donor agency
*New PDU yet to be established. Presently such work is carried out by AMD.

146 Appendix 5
Project Profile
Project ID: ENW05NGI Sector: Energy Name: Northern islands electricity supply systems rehabilitation program Island: Manihiki, Palmerston, Nassau, Rakahanga Location: Villages on each of the islands Background/Rationale: There is a need to rehabilitate the power supply on the Northern Group
islands to meet existing and projected load requirements. Objective: To provide reliable electricity power supply to the residents on these
islands. Description of Works: Procurement of capital items such as new cabling, transformers and
structural supports. Replacement of cabling and renewing or strengthening of structural elements.
Features: Reduction in operation and maintenance costs Improve delivery of power service to consumers (meet minimum level
of service) Greater reliability for emergency services Increase public safety Improve living standards
Estimated Beneficiaries: Approximately 1,300 people will receive improved and reliable power supply
Environmental Category: ADB category C Project will have overall beneficial impact on existing sources. Project is essentially an asset replacement program, requiring only a review of environmental implications primarily during construction.
Land Requirement: Not required Climate change adaptation needs:
Generally not required, although power distribution system, such as overhead lines and above-ground structures, may need protection from predicted climate change effects
Project Cost Estimate: Capital cost estimate: $1.0 million O&M cost estimate: $180,000 (Total 4 islands)
Implementation options: Work should be outsourced to the private sector or could be done by the Island Administrations O&M could be carried out by Island Administrations or outsourced to the private sector
Profile Created: 1 October 2006 Current Version: 1 October 2006

Appendix 5 147
Project Tracking
Last updated: 10 October 2006 Project Preparation Status Project Identification: Project has been identified through the ADB preventive infrastructure
master planning study. (ADB TA4605) and the Bruce Clay reports: Ref: UNDP/UNESCO Power Sector/Feasibility Studies, 2004
Stakeholder Consultations:
Need to conduct follow up consultation with the relevant stakeholders
Feasibility Study: A prerequisite for this project Engineering Design: Not started Land Acquisition: Not required Environmental Assessment:
Identification of environmental implications during construction not yet started
Procurement: Not started Construction: Not started
Project Implementation Status Funding Source: CIGOV national budget or loan and aid donor agencies Implementation Arrangements:
Primary responsibility for coordination/execution PDU* Implementation responsibility by OMIA with support from TAU. Works should be done by outsourcing to private sector or possibly TAU
Contracting Method: Conventional tender through local competitive bidding to MFEM/lending agency guidelines. Contract administration and construction supervision by implementing agency which in turn could do it in-house or outsource the task
O&M Responsibility: Island Administrations or outsourced to private sector Risk assessment: Inclement weather – construction program to consider cyclone
season Construction delays – employ suitably qualified and experienced
contractors Implementation of standards – ensure appropriate and thorough
guideline material available on siting, installation and placing of transmission lines
Operation and maintenance funds constraints – ensure adequate annual budget appropriation; ensure cost recovery via tariffs
Implementation schedule: Fiscal Year: To be determined through prioritisation and programming Current Status: Awaiting decision by government and donor agency
*New PDU yet to be established. Presently such work is carried out by AMD.

148 Appendix 5
Project Profile
Project ID: ENW06NGI Sector: Energy Name: Electricity supply system upgrades on Manihiki and Rakahanga Island: Manihiki and Rakahanga Location: Villages on each island Background/Rationale: The continuous power outages had caused the need to upgrade the
power supply systems on these islands Objective: To provide reliable electricity power supply to the residents on these
islands. Description of Works: Procurement of capital items such as new cabling, transformers and
structural supports. Replacement of electricity cabling and renewal or strengthening of structural elements.
Features: Reduction in operation and maintenance costs Improve delivery of power service to consumers (meet minimum level
of service) Provide greater reliability for emergency services Increase public safety Improve living standards
Estimated Beneficiaries: Approximately 680 people will receive improved and reliable power supply
Environmental Category: ADB category C Project will have overall beneficial impact on existing sources. Project is essentially an asset replacement program, requiring only a review of environmental implications primarily during construction.
Land Requirement: Not required Climate change adaptation needs:
Generally not required, although power distribution system, such as overhead lines and above-ground structures, may need protection from predicted climate change effects
Project Cost Estimate: Capital cost estimate: $0.80 million O&M cost estimate: $110,000 (Total 2 islands)
Implementation options: Work should be outsourced to the private sector or could be done by the Island Administrations O&M could be carried out by Island Administrations or outsourced to the private sector
Profile Created: 1 October 2006 Current Version: 1 October 2006

Appendix 5 149
Project Tracking
Last updated: 10 October 2006 Project Preparation Status Project Identification: Project has been identified through the ADB preventive infrastructure
master planning study. (ADB TA4605) and the Bruce Clay reports: Ref: UNDP/UNESCO Power Sector/Feasibility Studies, 2004
Stakeholder Consultations:
Need to conduct follow up consultation with the relevant stakeholders
Feasibility Study: A prerequisite for this project Engineering Design: Not started Land Acquisition: Not required Environmental Assessment:
Identification of environmental implications during construction not yet started
Procurement: Not started Construction: Not started
Project Implementation Status Funding Source: CIGOV national budget or loan and aid donor agencies Implementation Arrangements:
Primary responsibility for coordination/execution PDU* Implementation responsibility by OMIA with support from TAU. Works should be done by outsourcing to private sector or possibly TAU
Contracting Method: Conventional tender through local competitive bidding to MFEM/lending agency guidelines. Contract administration and construction supervision by implementing agency which in turn could do it in-house or outsource the task
O&M Responsibility: Island Administrations or outsourced to private sector Risk assessment: Inclement weather – construction program to consider cyclone
season Construction delays – employ suitably qualified and experienced
contractors Implementation of standards – ensure appropriate and thorough
guideline material available on siting, installation and placing of transmission lines
Operation and maintenance funds constraints – ensure adequate annual budget appropriation; ensure cost recovery via tariffs
Implementation schedule: Fiscal Year: To be determined through prioritisation and programming Current Status: Awaiting decision by government and donor agency
*New PDU yet to be established. Presently such work is carried out by AMD.

150 Appendix 5
Project Profile
Project ID: ENW07MGS Sector: Energy Name: Mangaia electricity supply distribution system upgrade Island: Mangaia Location: Villages on the island Background/Rationale: The continuous power outages are causes for much community
complaints and pose an operational hazard to the local hospital. There is a need to upgrade the power supply systems on the island.
Objective: To provide reliable electricity power supply to the residents of Mangaia. Description of Works: Procurement of capital items such as new electrical cables, transformers
and structural supports. Replacement of low voltage electrical cables and renewal or strengthening of structural elements.
Features: Reduction in operation and maintenance costs Improve delivery of power service to consumers (meet minimum level
of service) Provide greater reliability for emergency and vital community services Improve living standards
Estimated Beneficiaries: Some 740 people will receive improved and reliable power supply Environmental Category: ADB category C:
Project will have overall beneficial impact on existing sources. Project is essentially an asset replacement program, requiring only a review of environmental implications primarily during construction.
Land Requirement: Not required Climate change adaptation needs:
Generally not required, although power distribution system, such as overhead lines and above-ground structures, may need protection from predicted climate change effects
Project Cost Estimate: Capital cost estimate: $0.40 million O&M cost estimates: $60,000 Maintenance: $25,000
Implementation options: Work should be outsourced to the private sector or could be done by the Island Administration O&M could be carried out by Island Administration or outsourced to the private sector
Profile Created: 1 October 2006 Current Version: 1 October 2006

Appendix 5 151
Project Tracking
Last updated: 10 October 2006 Project Preparation Status Project Identification: Project has been identified through the ADB preventive infrastructure
master planning study. (ADB TA4605) and the Bruce Clay reports: Ref: UNDP/UNESCO Mangaia power sector/feasibility study, 2004
Stakeholder Consultations:
Need to conduct follow up consultation with the relevant stakeholders
Feasibility Study: A prerequisite for this project Engineering Design: Not started Land Acquisition: Not required Environmental Assessment:
Identification of environmental implications during construction not yet started
Procurement: Not started Construction: Not started
Project Implementation Status Funding Source: CIGOV national budget or loan Implementation Arrangements:
Primary responsibility for coordination/execution PDU* Implementation responsibility by OMIA with support from TAU. Works should be done by outsourcing to private sector or possibly TAU
Contracting Method: Conventional tender through local competitive bidding to MFEM/lending agency guidelines. Contract administration and construction supervision by implementing agency which in turn could do it in-house or outsource the task
O&M Responsibility: Island Administrations or outsourced to private sector Risk assessment: Inclement weather – construction program to consider cyclone
season Construction quality, costs and delays – employ suitably qualified and
experienced contractors Implementation of standards – ensure appropriate and thorough
guideline material available on siting, installation and placing of transmission lines
Operation and maintenance funds constraints – ensure adequate annual budget appropriation; ensure cost recovery via tariffs
Implementation schedule: Fiscal Year: To be determined through prioritisation and programming Current Status: Awaiting decision by government
*New PDU yet to be established. Presently such work is carried out by AMD.

152 Appendix 5
Project Profile
Project ID: ENW08AIU Sector: Energy Name: Atiu electricity supply distribution system upgrade Island: Atiu Location: Villages on the island Background/Rationale: There is a power supply constraint on Atiu due to the poor condition of
the distribution system. They liens are old and beyond their design life and in need of replacement. Both high and low voltage cables need upgrading.
Objective: To ensure provision of reliable power supply Description of Works: Replacement of high and low voltage cables, transformers and power
poles. The work will also include renewal or recalibration of property electricity meters and re
Features: Eliminate a supply constraint Improve delivery of power service to consumers and so improve living
standards Increase revenue through greater sales and so contribute to the
national economy A large part of the work could be outsourced to the private sector
Estimated Beneficiaries: Around 600 people will receive improved and more reliable power supplyEnvironmental Category: ADB category C:
Project will have overall beneficial impact on existing sources. Project is essentially an asset replacement program, requiring only a review of environmental implications primarily during construction.
Land Requirement: None Climate change adaptation needs:
Not required, although overhead lines and above-ground structures, may need protection from predicted climate change effects
Project Cost Estimate: Capital cost estimate: $1.2 million Note: estimate of incremental cost of climate change adaptation works included in capital cost above is $80,000.
O&M cost estimates: $170,000 per annum Implementation options: Work should be outsourced to private sector or done by Island
Administration Operation and maintenance could be outsourced to private sector or done by Island Administration
Profile Created: 1 October 2006 Current Version: 1 October 2006

Appendix 5 153
Project Tracking
Last updated: 10 October 2006 Project Preparation Status Project Identification: Project has been identified through the ADB preventive infrastructure
master planning study. (ADB TA4605) and the Bruce Clay reports: Ref: UNDP/UNESCO Atiu power sector/feasibility study, 2004
Stakeholder Consultations:
Initial discussions completed with Island Council.
Feasibility Study: Initial assessment completed. Preliminary cost estimates prepared by UNDP/UNESCO funded TA for the Energy Department of MOW (see above)
Engineering Design: Not started Land Acquisition: Not needed Environmental Assessment:
Identification of environmental implications during construction not yet started
Procurement: Not started Construction: Not started
Project Implementation Status Funding Source: CIGOV national budget or loan Implementation Arrangements:
Primary responsibility for coordination/execution PDU* Implementation responsibility by OMIA with support from TAU. Works should be done by outsourcing to private sector or possibly TAU
Contracting Method: Conventional tender through local competitive bidding to MFEM/lending agency guidelines. Contract administration and construction supervision by implementing agency which in turn should outsource the task
O&M Responsibility: APS or outsourced to private sector Risk assessment: Inclement weather – construction program to consider cyclone
season Construction quality, costs and delays – employ suitably qualified and
experienced contractors Implementation of standards – ensure appropriate and thorough
guideline material available on siting, installation and placing of transmission lines
Operation and maintenance funds constraints – ensure adequate annual budget appropriation; ensure cost recovery through tariffs
Implementation schedule: Fiscal Year: To be determined through prioritisation and programming Current Status: Awaiting decision by government
*New PDU yet to be established. Presently such work is carried out by AMD.

154 Appendix 5
Project Profile
Project ID: ENW09AIT Sector: Energy Name: Aitutaki electricity supply distribution system upgrade Island: Aitutaki Location: Entire island Background/Rationale: The existing high and low voltage cables are mostly above-ground and
exposed to the elements. They are old and cracked in many places, causing frequent power outages and so complaints from residents. Large sections of the cables are beyond their design life and so need to be replaced. As Aitutaki is heavily dependent on tourism, a reliable supply of electricity is demanded by both tourist and the hotels.
Objective: To ensure provision of reliable power supply for Aitutaki Description of Works: A systematic program to replace high and low voltage cables,
transformers and power poles. The work will also include renewal or recalibration of property electricity meters
Features: Eliminate a supply constraint Improve delivery of power service to consumers and so improve living
standards Improve operating costs for tourism sector with a trickle down effect to
other sectors of the economy on Aitutaki Increase revenue through greater sales and so contribute to the
national economy A large part of the work could be outsourced to the private sector
Estimated Beneficiaries: Overall nearly 2,000 people will receive improved and more reliable power supply
Environmental Category: ADB category C: Project will have overall beneficial impact on existing sources. Project is essentially an asset replacement program, requiring only a review of environmental implications primarily during construction.
Land Requirement: None Climate change adaptation needs:
Not required, although overhead lines and above-ground structures may need protection from predicted climate change effects
Project Cost Estimate: Capital cost estimate: $1.5 million Note: estimate of incremental cost of climate change adaptation works included in capital cost above is $30,000.
O&M cost estimates: $200,000 per annum Implementation options: Work should be outsourced to private sector or done by APS
Operation and maintenance could be outsourced to private sector or done by APS
Profile Created: 1 October 2006 Current Version: 1 October 2006

Appendix 5 155
Project Tracking
Last updated: 10 October 2006 Project Preparation Status Project Identification: Project has been identified through the ADB preventive infrastructure
master planning study. (ADB TA4605) and the Bruce Clay reports: Ref: UNDP/UNESCO Aitutaki power sector/feasibility study, 2004
Stakeholder Consultations:
Initial discussions completed with Island Council.
Feasibility Study: Initial assessment completed. Preliminary cost estimates prepared by UNDP/UNESCO funded TA for the Energy Department of MOW (see above)
Engineering Design: Not started Land Acquisition: Not needed Environmental Assessment:
Preliminary assessment carried out by Environmental Consultants Fiji. Ref: CIGOV, Environmental review of current operations and preliminary environmental assessment of proposed upgrade, June 2005
Procurement: Not started Construction: Not started
Project Implementation Status Funding Source: CIGOV national budget or loan Implementation Arrangements:
Primary responsibility for coordination/execution PDU* Implementation responsibility by APS with support from TAU. Works should be done by outsourcing to private sector or possibly APS
Contracting Method: Conventional tender through local competitive bidding to MFEM/lending agency guidelines. Contract administration and construction supervision by implementing agency which in turn could do it in-house or outsource the task
O&M Responsibility: APS or outsourced to private sector Risk assessment: Inclement weather – construction program to consider cyclone
season Construction quality, costs and delays – employ suitably qualified and
experienced contractors Implementation of standards – ensure appropriate and thorough
guideline material available on siting, installation and placing of transmission lines
Operation and maintenance funds constraints – ensure adequate annual budget appropriation; ensure cost recovery via tariffs
Implementation schedule: Fiscal Year: To be determined through prioritisation and programming Current Status: Awaiting decision by government
*New PDU yet to be established. Presently such work is carried out by AMD.

156 Appendix 5
Project Profile
Project ID: EN10RAR Sector: Energy Name: Construction of second Rarotonga Second Power Station Island: Rarotonga Location: Existing site in Avatiu or to be determined if new site is required Background/Rationale: The existing power station is nearing its design capacity and therefore a
new power station will be required to increase the capacity of power.
Objective: To increase the capacity of power on Rarotonga
Description of works: Design and construct a second power station on Rarotonga, including civil site works, buildings and other structures, supply & installation of generator sets, transformers stations and environment protection measures.
Features: Provide a more reliable service to consumers. Reduce power outages The community will have an opportunity to participate and support the
project through providing equity in the form of land transfer if a new site is required
Improve operating costs for tourism sector with a trickle down effect to other sectors of the economy on Rarotonga
Provide revenue through tariffs and contribute to the national economy A large part of the work will be sourced out to the private sector
Estimated Beneficiaries: 14,000 people including tourists will benefit from the project. Environmental Category: ADB category B:
Project will have some environmental impact and may require land acquisition and therefore an IEE will be required to determine whether a full EIA is required. The Project’s likely adverse impacts during operations such as noise, oil spills from oil depot and waste oil.
Land Requirement: Additional land will be required if the existing site in Avatiu is insufficient Climate change adaptation needs:
Site location, station layout, and building/facility design needs to be developed to take into account increased cyclone events, high wind speeds, high air temperatures, high intensity rainfall events, and flooding.
Project cost estimate: Capital cost estimate: $35 million Note: estimate of incremental cost of climate change adaptation works included in capital cost above is $400,000.
O&M cost estimate: $1.6million per annum Implementation options: Works should be outsourced to private sector
O&M could be outsourced to private sector or done by TAU Given the large size of the project, it will require loan financing with Government Guarantee.
Profile Created: 10 October 2006 Current Version: 10 October 2006

Appendix 5 157
Project Tracking
Last updated: 10 October 2006 Project Preparation Status Project Identification: Project has been identified through TAU’s 10 Year Infrastructure Capital
Expenditure Plan Stakeholder consultations:
Extensive consultations will be required with residents near proposed site
Feasibility study: Will a pre-requisite Engineering design: Not yet started – completion of feasibility study a pre-requisite Land acquisition: Site to be confirmed/identified Environmental assessment:
Not yet started
Procurement: Not started Construction: Not started Budget allocation for O&M:
Not started
Project Implementation Status Funding Source: TAU’s Capital Expenditure Budget and Loan with CIGOV guarantee Implementation Arrangements:
Primary responsibility for coordination/execution TAU Implementation responsibility by TAU. Works should be done by outsourcing to private sector or possibly done in-house by TAU
Contracting Method: Conventional tender through International/competitive bidding to TAU/lending agency guidelines. Contract administration and construction supervision by TAU.
O&M Responsibility: TAU or outsourced to private sector Risk assessment: Community may reject the project especially facility location.
Therefore, the project requires extensive community consultations. Environmental spills due to improper operation practices –
o provide adequate training for operators to reduce risk; o ensure random checks carried out by NES o empower NES to enforce compliance with applicable standards
including imposition of penalties for non-compliance; o extended down time of generators due to lack of spare parts-
ensure sufficient spare parts are stocked Maintenance not done properly due to shortage of funds – ensure
adequate provisions allocated under annual budgets; ensure tariff adequate to meet at least O&M costs
Implementation schedule:
Fiscal Year: 2008/09 to 2011
Current Status: Need project prioritization & proceed with feasibility study for implementation

158 Appendix 5
Project Profile
TAU FUNDED CAPITAL WORKS – NOT FOR RANKING
Project ID: ENW11RAR Sector: Energy Name: Rarotonga power station site improvements Island: Rarotonga Location: Avatiu Background/Rationale: Upgrade Avatiu power station to improve operational performance. Objective: Provide an effective and efficient power station that is environmentally
friendly which in turn will improve operational performance Description of works: Procurement and installation of waste containment facilities such as
incinerator, oil septic, water pump to creek, and storages for spare parts Features: Project will improve the disposal of waste at the power station so it is
not discharged into the surrounding environment. Elimination of waste oil discharges into the Avatiu stream, lead to
improved water quality which in turn will improve ecosystem and reduce incidence of fish poisonings
Could provide opportunity for private sector involvement Will address community concerns about discharge of waste oil and
sewage overflows and degradation of Avatiu stream, but will require community consensus
Estimated Beneficiaries: Some 200 people will benefit from better waste oil management in the area, including workers at the power station
Environmental Category: ADB category B: An IEE will be necessary to review the selected oil treatment and disposal and determine if a full EIA is necessary
Land Requirement: None required – use of existing site Climate change adaptation needs:
Buildings and facilities should be designed with cyclone events, high wind speeds and flooding taken into account
Project cost estimate: Capital cost estimate: $.76 million O&M cost estimate: $20,000 per annum
Implementation options: Work should be outsourced to private sector O&M could be outsourced to private sector or done by TAU
Profile Created: 10 October 2006 Current Version: 10 October 2006

Appendix 5 159
Project Tracking
Last updated: 10 October 2006 Project Preparation Status Project Identification: Project has been identified through TAU’s 10 Year Infrastructure Capital
Expenditure Plan Stakeholder consultations:
Notify residents within proximity of power station
Feasibility study: Will not be required Engineering design: Not yet started Land acquisition: None Environmental assessment:
Not yet started
Procurement: Not started Construction: Not started Budget allocation for O&M:
Not started
Project Implementation Status Funding Source: TAU’s Capital Expenditure Budget Implementation Arrangements:
Primary responsibility for coordination/execution TAU Implementation responsibility by TAU. Works should be done by outsourcing to private sector or possibly done in-house by TAU
Contracting Method: Conventional tender to TAU procurement and MFEM guidelines Contract administration and construction supervision by TAU.
O&M Responsibility: TAU or outsourced to private sector Risk assessment: Environmental spills due to improper operation practices –
o provide adequate training for operators to reduce risk; o ensure random checks carried out by NES o empower NES to enforce compliance with applicable standards
including imposition of penalties for non-compliance; Maintenance not done properly due to shortage of funds – ensure
adequate provisions allocated under annual budgets; Implementation schedule:
Fiscal Year: 2007/08 to 2010
Current Status: Program for implementation

160 Appendix 5
Project Profile
TAU FUNDED CAPITAL WORKS – NOT FOR RANKING
Project ID: ENW12RAR Sector: Energy Name: Rarotonga power generator engine no 8 replacement Island: Rarotonga Location: Avatiu power station Background/Rationale: Engine No 8 needs to be replaced as part of the ongoing upgrade Avatiu
power station. Objective: Provide an effective and efficient power station that is environmentally
acceptable which in turn will improve operational performance. Description of works: Supply, delivery and instalment of new replacement engine Features: Improve the operational efficiency of the power station
Reduce operating costs Provide opportunity for private sector involvement
Estimated Beneficiaries: Some 6,000 private and public sector people will benefit from improvements to the power station.
Environmental Category: ADB category C: Replacement of a component of an existing facility. Impacts limited to temporary disruptions during replacement. A review of environmental implications will be adequate.
Land Requirement: None required – use of existing site Climate change adaptation needs:
None.
Project cost estimate: Capital cost estimate: $4.3 million O&M cost estimate: $220,000 per annum
Implementation options: Work should be outsourced to private sector O&M could be done by TAU or outsourced to private sector
Profile Created: 10 October 2006 Current Version: 10 October 2006

Appendix 5 161
Project Tracking
Last updated: 10 October 2006 Project Preparation Status Project Identification: Project has been identified through TAU’s 10 Year Infrastructure Capital
Expenditure Plan Stakeholder consultations:
Notify residents within proximity of power station
Feasibility study: Been undertaken by TAU Engineering design: Not yet started – Land acquisition: None Environmental assessment:
Identification of environmental implications during replacement
Procurement: Not started Construction: Not started Budget allocation for O&M:
Not started
Project Implementation Status Funding Source: TAU’s Capital Expenditure Budget Implementation Arrangements:
Primary responsibility for coordination/execution TAU Implementation responsibility by TAU. Works should be done by outsourcing to private sector or possibly done in-house by TAU
Contracting Method: Conventional tender to TAU procurement and MFEM guidelines Contract administration and construction supervision by TAU.
O&M Responsibility: TAU or outsourced to private sector Risk assessment: Environmental spills due to improper operation practices –
o provide adequate training for operators to reduce risk; o ensure random checks carried out by NES o empower NES to enforce compliance with applicable standards
including imposition of penalties for non-compliance; Maintenance not done properly due to shortage of funds – ensure
adequate provisions allocated under annual budgets Implementation schedule:
Fiscal Year: 2007/08 to 2008/09
Current Status: Program for implementation

162 Appendix 5
Project Profile
TAU FUNDED CAPITAL WORKS – NOT FOR RANKING
Project ID: ENW13RAR Sector: Energy Name: Rarotonga power station generator no 9 replacement Island: Rarotonga Location: Avatiu power station Background/Rationale: Engine No 9 needs to be replaced as part of the ongoing upgrade Avatiu
power station. Objective: Provide an effective and efficient power station that is environmentally
acceptable which in turn will improve operational performance. Description of works: Supply, delivery and instalment of new replacement engine Features: Improve the operational efficiency of the power station
Reduce operating costs Provide opportunity for private sector involvement
Estimated Beneficiaries: Some 12,000 people – all residents of Rarotonga Environmental Category: ADB category C:
Replacement of a component of an existing facility. Impacts limited to temporary disruptions during replacement. A review of environmental implications will be adequate.
Land Requirement: None required – use of existing site Climate change adaptation needs:
None.
Project cost estimate: Capital cost estimate: $4.5 million O&M cost estimate: $220,000 per annum
Implementation options: Work should be outsourced to private sector O&M could be done by TAU or outsourced to private sector
Profile Created: 10 October 2006 Current Version: 10 October 2006

Appendix 5 163
Project Tracking
Last updated: 10 October 2006 Project Preparation Status Project Identification: Project has been identified through TAU’s 10 Year Infrastructure Capital
Expenditure Plan Stakeholder consultations:
Notify residents within proximity of power station
Feasibility study: Will not be required Engineering design: Not yet started – Land acquisition: None Environmental assessment:
Identification of environmental implications during construction
Procurement: Not started Construction: Not started Budget allocation for O&M:
Not started
Project Implementation Status Funding Source: TAU’s Capital Expenditure Budget Implementation Arrangements:
Primary responsibility for coordination/execution TAU Implementation responsibility by TAU. Works should be done by outsourcing to private sector or possibly done in-house by TAU
Contracting Method: Conventional tender to TAU procurement and MFEM guidelines Contract administration and construction supervision by TAU.
O&M Responsibility: TAU or outsourced to private sector Risk assessment: Environmental spills due to improper operation practices –
o provide adequate training for operators to reduce risk; o ensure random checks carried out by NES o empower NES to enforce compliance with applicable standards
including imposition of penalties for non-compliance; Maintenance not done properly due to shortage of funds – ensure
adequate provisions allocated under annual budgets Implementation schedule:
Fiscal Year: 2009/10 to 2010/2011
Current Status: Program for implementation

164 Appendix 5
Project Profile
TAU FUNDED CAPITAL WORKS – NOT FOR RANKING
Project ID: ENW14RAR Sector: Energy Name: Rarotonga power station generator no 1 replacement Island: Rarotonga Location: Avatiu power station Background/Rationale: Upgrade Avatiu power station to improve operational performance. Objective: Provide an effective and efficient power station that is environmentally
friendly which in turn will improve operational performance Description of works: Supply, delivery and installation of replacement generator Features: Project will improve the reliability of electricity supply
Improve the operational efficiency of the power station Reduce operating costs through more fuel efficient generators Provide opportunity for private sector involvement
Estimated Beneficiaries: Some 6,000 people Environmental Category: ADB category C:
Replacement of a component of an existing facility. Impacts limited to temporary disruptions during replacement. A review of environmental implications will be adequate.
Land Requirement: None required – use of existing site Climate change adaptation needs:
None
Project cost estimate: Capital cost estimate: $5.0 million O&M cost estimate: $250,000 per annum
Implementation options: Work should be outsourced to private sector O&M could be outsourced to private sector or done by TAU
Profile Created: 10 October 2006 Current Version: 10 October 2006

Appendix 5 165
Project Tracking
Last updated: 10 October 2006 Project Preparation Status Project Identification: Project has been identified through TAU’s 10 Year Infrastructure Capital
Expenditure Plan Stakeholder consultations:
Notify residents within proximity of power station
Feasibility study: Will not be required Engineering design: Not yet started – Land acquisition: None Environmental assessment:
Identification of environmental implications during construction
Procurement: Not started Construction: Not started Budget allocation for O&M:
Not started
Project Implementation Status Funding Source: TAU’s Capital Expenditure Budget Implementation Arrangements:
Primary responsibility for coordination/execution TAU Implementation responsibility by TAU. Works should be done by outsourcing to private sector or possibly done in-house by TAU
Contracting Method: Conventional tender to TAU procurement and MFEM guidelines Contract administration and construction supervision by TAU.
O&M Responsibility: TAU or outsourced to private sector Risk assessment: Environmental spills due to improper operation practices –
o provide adequate training for operators to reduce risk; o ensure random checks carried out by NES o empower NES to enforce compliance with applicable standards
including imposition of penalties for non-compliance; Maintenance not done properly due to shortage of funds – ensure
adequate provisions allocated under annual budgets Implementation schedule:
Fiscal Year: 2012/13 to 2013/2014
Current Status: Program for implementation

166 Appendix 5
Project Profile
TAU FUNDED CAPITAL WORKS – NOT FOR RANKING
Project ID: ENW15RAR Sector: Energy Name: Rarotonga power station generator no 2 replacement Island: Rarotonga Location: Avatiu power station Background/Rationale: Upgrade Avatiu power station to improve operational performance. Objective: Provide an effective and efficient power station that is environmentally
friendly which in turn will improve operational performance Description of works: Supply, delivery and installation of replacement generator Features: Project will improve the reliability of electricity supply
Improve the operational efficiency of the power station Reduce operating costs through more fuel efficient generators Provide opportunity for private sector involvement
Estimated Beneficiaries: Some 6,000 people Environmental Category: ADB category C:
Replacement of a component of an existing facility. Impacts limited to temporary disruptions during replacement. A review of environmental implications will be adequate.
Land Requirement: None required – use of existing site Climate change adaptation needs:
None.
Project cost estimate: Capital cost estimate: $5.0 million O&M cost estimate: $250,000 per annum
Implementation options: Work should be outsourced to private sector O&M could be outsourced to private sector or done by TAU
Profile Created: 10 October 2006 Current Version: 10 October 2006

Appendix 5 167
Project Tracking
Last updated: 10 October 2006 Project Preparation Status Project Identification: Project has been identified through TAU’s 10 Year Infrastructure Capital
Expenditure Plan Stakeholder consultations:
Notify residents within proximity of power station
Feasibility study: Will not be required Engineering design: Not yet started Land acquisition: None Environmental assessment:
Identification of environmental implications during construction
Procurement: Not started Construction: Not started Budget allocation for O&M:
Not started
Project Implementation Status Funding Source: TAU’s Capital Expenditure Budget Implementation Arrangements:
Primary responsibility for coordination/execution TAU Implementation responsibility by TAU. Works should be done by outsourcing to private sector or possibly done in-house by TAU
Contracting Method: Conventional tender to TAU procurement and MFEM guidelines Contract administration and construction supervision by TAU.
O&M Responsibility: TAU or outsourced to private sector Risk assessment: Environmental spills due to improper operation practices –
o provide adequate training for operators to reduce risk; o ensure random checks carried out by NES o empower NES to enforce compliance with applicable standards
including imposition of penalties for non-compliance; Maintenance not done properly due to shortage of funds – ensure
adequate provisions allocated under annual budgets Implementation schedule:
Fiscal Year: 2012/13 to 2013/2014
Current Status: Program for implementation

168 Appendix 5
Project Profile
TAU FUNDED CAPITAL WORKS – NOT FOR RANKING
Project ID: ENW16RAR Sector: Energy Name: Rarotonga auxiliary plant upgrade Island: Rarotonga Location: Avatiu Background/Rationale: A breakdown in the power source if the engine is not upgraded, could
lead to a power outage. Also there is a continual need to improve the operational performance of the power station.
Objective: To provide regular supply and maintain capacity of power on Rarotonga Description of works: Design and construction of upgrading works involving painting of floor of
the power station with oil-free paint, Overhaul/strengthening of the power station roof and improvement of staff facilities.
Features: Provide an improved and reliable service to consumers. Reduce power outages The community will have an opportunity to participate and support the
project through providing equity in the form of land transfer Provide revenue through tariffs and contribute to the national economy Improve operating cost for tourism and other sectors Provide an opportunity for private sector involvement
Estimated Beneficiaries: Some 14,000 people will benefit from the project including the staff of TAU
Environmental Category: ADB category B: Project will have some environmental impact and may require land acquisition and therefore an IEE will be required to determine whether a full EIA is required.
Land Requirement: None required if work is on existing poles, unless new poles are required Climate change adaptation needs:
There may be a requirement for climate change adaptation needs particularly if poles are near the foreshore, would require climate change adaptation needs
Project cost estimate: Capital cost estimate: $0.58 million O&M cost estimate: $20,000 per annum
Implementation options: Work should be outsourced to private sector O&M could be outsourced to private sector or done by TAU
Profile Created: 10 October 2006 Current Version: 10 October 2006

Appendix 5 169
Project Tracking
Last updated: 10 October 2006 Project Preparation Status Project Identification: Project has been identified through TAU’s 10 Year Infrastructure Capital
Expenditure Plan Stakeholder consultations:
Notify residents within proximity of power station
Feasibility study: Will be required Engineering design: Not yet started Land acquisition: None, but to be confirmed Environmental assessment:
Started - identification of environmental implications
Procurement: Not started Construction: Not started Budget allocation for O&M:
Not started
Project Implementation Status Funding Source: TAU’s Capital Expenditure Budget Implementation Arrangements:
Primary responsibility for coordination/execution TAU Implementation responsibility by TAU. Works should be done by outsourcing to private sector or possibly done in-house by TAU
Contracting Method: Conventional tender to TAU procurement and MFEM guidelines Contract administration and construction supervision by TAU.
O&M Responsibility: TAU or outsourced to private sector Risk assessment: Community may reject the project especially location therefore the
project will require extensive community consultations. Environmental spills due to improper operation practices –
o provide adequate training for operators to reduce risk; o ensure random checks carried out by NES o empower NES to enforce compliance with applicable standards
including imposition of penalties for non-compliance; extended down time of generators due to lack of spare parts- ensure sufficient spare parts are stocked
Implementation schedule:
Fiscal Year: 2007/08, 2008/09, 2011/12
Current Status: Underway for implementation

170 Appendix 5
Project Profile
TAU FUNDED CAPITAL WORKS – NOT FOR RANKING
Project ID: ENW17RAR Sector: Energy Name: Rarotonga High Voltage System Improvements Island: Rarotonga Location: Entire island Background/Rationale: Improve high voltage systems to strengthen and protect overhead power
lines and avoid loss of service Objective: To maintain and increase regular supply and capacity of power on
Rarotonga Description of works: Design and improve high voltage systems on Rarotonga, including civil
site works, repairing existing structures and perhaps build new structures to supply and install high voltage lines, transformers stations. Specific elements include: Sectionalisation of high voltage feeders; Avarua high voltage feeder - Power House /Sub/101 High voltage conduits – Power House/Sub 105 Airport high voltage feeder extension – Sub 109/Sub303 /Sub302 Feeder upgrade 1.7km High voltage conduits Sub 110/315 High voltage conduits – Sub 315/Sub 304
Features: Provide an improved and reliable service to consumers. Reduce power outages The community will have an opportunity to participate and support the
project through providing equity in the form of land transfer if required Provide revenue through tariffs and contribute to the national economy Introduce climate proofing measures relating to siting, construction
and protection of structures Provide an opportunity for private sector involvement
Estimated Beneficiaries: Some 14,000 people will benefit Environmental Category: ADB category B:
Project will have some environmental impact and may require land acquisition and therefore an IEE will be required to determine whether a full EIA is required.
Land Requirement: None required – if upgrading existing structures Climate change adaptation needs:
Need to protect the system from cyclone events, high intensity rainfall, high air temperatures, and sea surges if near the foreshore
Project cost estimate: Capital cost estimate: $1.76 million O&M cost estimate: $40,000 per annum
Implementation options: Work to be outsourced to private sector or by TAU O&M could be outsourced to private sector or done by TAU
Profile Created: 10 October 2006 Current Version: 10 October 2006

Appendix 5 171
Project Tracking
Last updated: 10 October 2006 Project Preparation Status Project Identification: Project has been identified through TAU’s 10 Year Infrastructure Capital
Expenditure Plan Stakeholder consultations:
Conduct television and new media awareness campaign, notify residents within proximity of power lines and sub-stations
Feasibility study: May be required Engineering design: Not yet started Land acquisition: None Environmental assessment:
Identification of environmental implications during upgrade
Procurement: Started Construction: Started Budget allocation for O&M:
Not started
Project Implementation Status Funding Source: TAU’s Capital Expenditure Budget Implementation Arrangements:
Primary responsibility for coordination/execution TAU Implementation responsibility by TAU. Works should be done by outsourcing to private sector or possibly done in-house by TAU
Contracting Method: Conventional tender to TAU procurement and MFEM guidelines Contract administration and construction supervision by TAU.
O&M Responsibility: TAU or outsourced to private sector Risk assessment: Community may object to land for new substations
Environmental spills due to improper operation practices – o provide adequate training for operators to reduce risk; o ensure random checks carried out by NES o empower NES to enforce compliance with applicable standards
including imposition of penalties for non-compliance; Maintenance not done properly due to shortage of funds – ensure
adequate provisions allocated under annual budgets; Implementation schedule:
Fiscal Year: 2007/08
Current Status: Program for implementation

172 Appendix 5
Project Profile
TAU FUNDED CAPITAL WORKS – NOT FOR RANKING
Project ID: ENW18RAR Sector: Energy Name: Inave substation upgrade Island: Rarotonga Location: Inave Background/Rationale: Tourism development in the area of Inave is increasing and therefore
there is a need to install a substation to cater for new development and increasing residential homes.
Objective: To expand the service area coverage and to cater for new developments. Description of works: Acquire site if there is no existing site, design works, construct and install
substation Features: The project will provide operational efficiency
Improve the level of supply Allow more consumers to connect to the grid Greater reliability of service to consumers Reduce power outages The community will have an opportunity to participate and support the
project through providing equity in the form of land transfer Improve operating costs for tourism and other industry Provide revenue through tariffs and contribute to the national economy Provide an opportunity to improve adaptation to predicted climate
change scenarios Provide an opportunity for private sector involvement
Estimated Beneficiaries: Some 1,000 or more people will benefit from improved power supplies and benefits to industry that will result from this project, including less pressure on the existing supply line
Environmental Category: ADB category C: Project will have no environmental impact except for temporary disruptions during construction. A review of environmental implications will be adequate.
Land Requirement: None required – if there is an existing site Climate change adaptation needs:
None, but needs to be located in a site with minimal risk from climate events such cyclones, storm surges and flooding
Project cost estimate: Capital cost estimate: $.519million O&M cost estimate: $10,363.50 per annum
Implementation options: Work should be outsourced to private sector or executed by TAU O&M could be outsourced to private sector or done by TAU
Profile Created: 10 October 2006 Current Version: 10 October 2006

Appendix 5 173
Project Tracking
Last updated: 10 October 2006 Project Preparation Status Project Identification: Project has been identified through TAU’s 10 Year Infrastructure Capital
Expenditure Plan Stakeholder consultations:
Notify residents within proximity of proposed sub-station
Feasibility study: Has been undertaken Engineering design: Has commenced Land acquisition: None Environmental assessment:
Identification of environmental implications during construction
Procurement: Not yet started Construction: Not yet started Budget allocation for O&M:
Not started
Project Implementation Status Funding Source: TAU’s Capital Expenditure Budget Implementation Arrangements:
Primary responsibility for coordination/execution TAU Implementation responsibility by TAU. Works should be done by outsourcing to private sector or possibly done in-house by TAU
Contracting Method: Conventional tender to TAU procurement and MFEM guidelines Contract administration and construction supervision by TAU.
O&M Responsibility: TAU or outsourced to private sector Risk assessment: Community may reject the project especially if substation is located on
their land – ensure dialogue with, and involvement of, community throughout project
Maintenance not done properly due to shortage of funds – ensure adequate provisions allocated under annual budgets;
Implementation schedule:
Fiscal Year: 2007/08, 2008/09, 2009/10
Current Status: Program for implementation

174 Appendix 5
Project Profile
TAU FUNDED CAPITAL WORKS – NOT FOR RANKING
Project ID: ENW19RAR Sector: Energy Name: Rarotonga electricity metering works Island: Rarotonga Location: Island Wide Background/Rationale: Some of the electricity meters require calibration or replacement as part
of the ongoing routine programme, which includes property meters and electricity production meters.
Objective: To improve operation and financial efficiency of TAU by ensuring greater accuracy of meter readings
Description of works: Replacement or calibration of property service meters Features: The project will improve operational efficiency and reduce the cost of
operation The project will provide savings in capital expenditure on future
upgrade because of more reliable meters reducing risks of lost revenue
Will provide information on electricity consumption and fine tuning of tariffs
Will provide revenue Estimated Beneficiaries: The main beneficiary will be the operator. Indirectly all consumers will
benefit through improved service delivery Environmental Category: ADB category C:
Project will have no environmental impact.
Land Requirement: None required Climate change adaptation needs:
None
Project cost estimate: Capital cost estimate: $0.19 million O&M cost estimate: $10,000 per annum
Implementation options: Work should be outsourced to private sector O&M could be outsourced to private sector or done by TAU
Profile Created: 10 October 2006 Current Version: 10 October 2006

Appendix 5 175
Project Tracking
Last updated: 10 October 2006 Project Preparation Status Project Identification: Project has been identified through TAU’s 10 Year Infrastructure Capital
Expenditure Plan Stakeholder consultations:
Conduct television and new media awareness campaign, notify residents who will be affected
Feasibility study: Completed Engineering design: Started Land acquisition: None Environmental assessment:
Identification of environmental implications during construction
Procurement: Not started Construction: Not started Budget allocation for O&M:
Not started
Project Implementation Status Funding Source: TAU’s Capital Expenditure Budget Implementation Arrangements:
Primary responsibility for coordination/execution TAU Implementation responsibility by TAU. Works should be done by outsourcing to private sector or possibly done in-house by TAU
Contracting Method: Conventional tender to TAU procurement and MFEM guidelines Contract administration and construction supervision by TAU.
O&M Responsibility: TAU or outsourced to private sector Risk assessment: No significant risks Implementation schedule:
Fiscal Year: 2007/08 to 2016
Current Status: Program for implementation

176 Appendix 5
Project Profile
TAU FUNDED CAPITAL WORKS – NOT FOR RANKING
Project ID: ENW20RAR Sector: Energy Name: Rarotonga high voltage equipment diagnostic and condition assessment Island: Rarotonga Location: Entire island Background/Rationale: Some of the high voltage equipment require diagnostic and condition
assessment that is, the calibration or replacement as part of the ongoing routine programme.
Objective: Improve operational efficiency of Rarotonga Electricity supply system Description of works: Diagnose and assess high voltage equipment and their condition.
Features: The Project will improve operational efficiency and reduce the cost of
operations The Project will provide savings in capital expenditure on future
upgrade because of more reliable equipment Will provide information on condition of high voltage equipment Will provide revenue
Estimated Beneficiaries: Some 14,000 people (including tourists)will benefit from this project Environmental Category: ADB category C:
Project will have no environmental impact. Land Requirement: None required Climate change adaptation needs:
None.
Project cost estimate: Capital cost estimate: $0.24 million O&M cost estimate: $10,000 per annum
Implementation options: Work should be outsourced to private sector or TAU O&M could be outsourced to private sector or done by TAU
Profile Created: 10 October 2006 Current Version: 10 October 2006

Appendix 5 177
Project Tracking
Last updated: 10 October 2006 Project Preparation Status Project Identification: Project has been identified through TAU’s 10 Year Infrastructure Capital
Expenditure Plan Stakeholder consultations:
Public awareness by newsprint & television; Notify consumers who will be affected.
Feasibility study: Not started Engineering design: Not Started Land acquisition: None? Environmental assessment:
Identification of environmental implications during construction
Procurement: Not Started Construction: Not started Budget allocation for O&M:
Not started
Project Implementation Status Funding Source: TAU’s Capital Expenditure Budget Implementation Arrangements:
Primary responsibility for coordination/execution TAU Implementation responsibility by TAU. Works should be done by outsourcing to private sector or possibly done in-house by TAU
Contracting Method: Conventional tender to TAU procurement and MFEM guidelines Contract administration and construction supervision by TAU.
O&M Responsibility: TAU or outsourced to private sector Risk assessment: Equipment may not function
Maintenance not done properly due to shortage of funds – ensure adequate provisions allocated under annual budgets;
Implementation schedule:
Fiscal Year: 2007/08, 2010/11, 2013/14
Current Status: Program for implementation

178 Appendix 5
Project Profile
Project Profile
TAU FUNDED CAPITAL WORKS – NOT FOR RANKING
Project ID: ENW21RAR Sector: Energy Name: Rarotonga transformers replacement programme Island: Rarotonga Location: Island Wide Background/Rationale: To obtain continuous optimum performance and provide efficient supply
of energy, transformers need to be replaced through fair wear and tear as part of the ongoing maintenance programme.
Objective: Improve operational efficiency of Rarotonga’s Electricity supply system Description of works: From the periodic diagnostic check of equipment including transformers,
able to assess condition and plan replacement of 3 transformers. Features: The Project will improve operational efficiency and reduce the cost of
operations The Project will provide savings in capital expenditure on future
upgrade because of more reliable equipment Will provide information on condition of high voltage equipment Will provide revenue
Estimated Beneficiaries: Some 14,000 people (including tourists)will benefit from this project Environmental Category: ADB category C:
Project will have no environmental impact. Land Requirement: None required Climate change adaptation needs:
None.
Project cost estimate: Capital cost estimate: $0.68 million O&M cost estimate: $40,000 per annum
Implementation options: Work should be outsourced to private sector or TAU O&M could be outsourced to private sector or done by TAU
Profile Created: 10 October 2006 Current Version: 10 October 2006

Appendix 5 179
Project Tracking
Last updated: 10 October 2006 Project Preparation Status Project Identification: Project has been identified through TAU’s 10 Year Infrastructure Capital
Expenditure Plan Stakeholder consultations:
Public awareness by newsprint & television; Notify consumers who will be affected.
Feasibility study: Started Engineering design: Started Land acquisition: None? Environmental assessment:
Identification of environmental implications during construction
Procurement: Not started Construction: Not started Budget allocation for O&M:
Not started
Project Implementation Status Funding Source: TAU’s Capital Expenditure Budget Implementation Arrangements:
Primary responsibility for coordination/execution TAU Implementation responsibility by TAU. Works should be done by outsourcing to private sector or possibly done in-house by TAU
Contracting Method: Conventional tender to TAU procurement and MFEM guidelines Contract administration and construction supervision by TAU.
O&M Responsibility: TAU or outsourced to private sector Risk assessment: Equipment may not function
Maintenance not done properly due to shortage of funds – ensure adequate provisions allocated under annual budgets;
Implementation schedule:
Fiscal Year: 2007/08 to 2015/16
Current Status: Program for implementation

180 Appendix 5
Project Profile
TAU FUNDED CAPITAL WORKS – NOT FOR RANKING
Project ID: ENW22RAR Sector: Energy Name: Rarotonga field activities and vehicle fleet replacement programme Island: Rarotonga Location: Avatiu Background/Rationale: In order to undertake field activities effectively, a fleet of vehicles is
currently in use and to ensure ongoing service, the fleet will require replacement through fair wear and tear.
Objective: Improve operational efficiency of Rarotonga Electricity supply system Description of works: Undertake field activities by using the fleet of vehicles currently available,
procure replacement of those vehicles by network vehicles & mini kiosk upgrade.
Features: The Project will improve operational efficiency and reduce the cost of operations
The Project will provide savings in capital expenditure on future upgrade because of more reliable equipment
Will provide information on condition of high voltage equipment Will provide revenue
Estimated Beneficiaries: Some 14,000 people (including tourists)will benefit from this project Environmental Category: ADB category C:
Project will have no environmental impact. Land Requirement: None required Climate change adaptation needs:
None, although fleet emissions can be high, may need to investigate hybrid vehicles to reduce fossil fuel needs
Project cost estimate: Capital cost estimate: $0.64 million O&M cost estimate: $30,000 per annum
Implementation options: Work should be outsourced to private sector or TAU O&M could be outsourced to private sector or done by TAU
Profile Created: 10 October 2006 Current Version: 10 October 2006
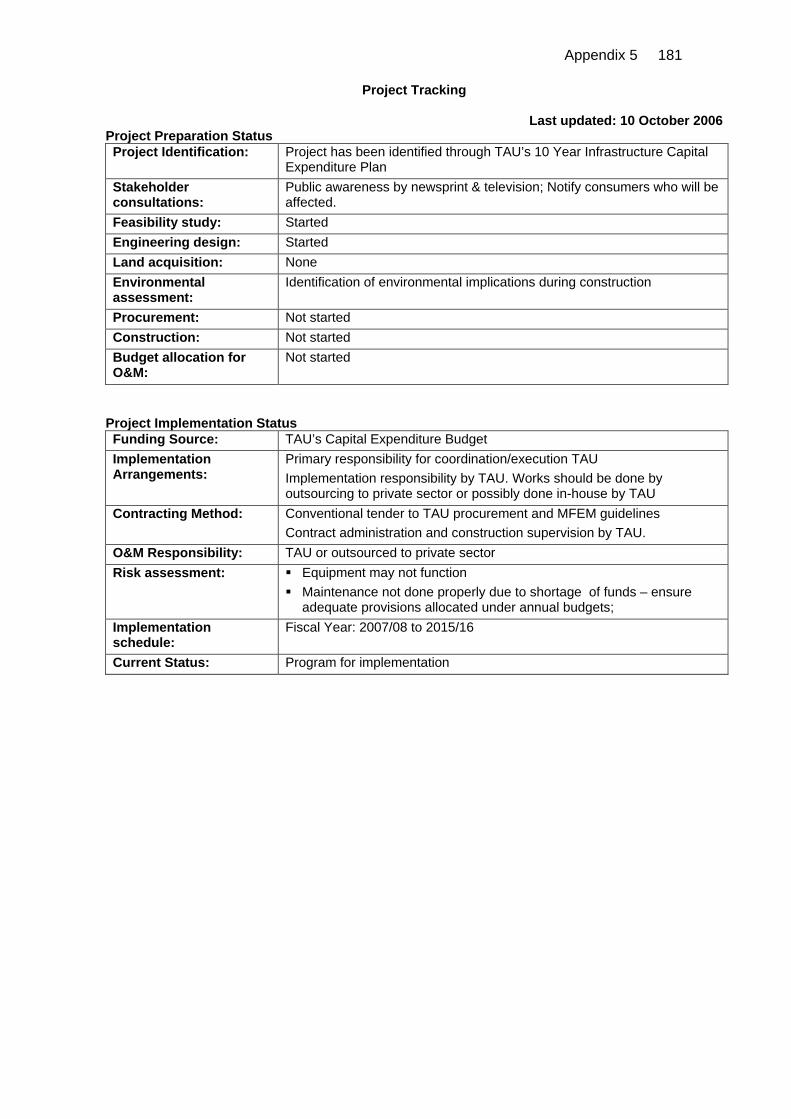
Appendix 5 181
Project Tracking
Last updated: 10 October 2006 Project Preparation Status Project Identification: Project has been identified through TAU’s 10 Year Infrastructure Capital
Expenditure Plan Stakeholder consultations:
Public awareness by newsprint & television; Notify consumers who will be affected.
Feasibility study: Started Engineering design: Started Land acquisition: None Environmental assessment:
Identification of environmental implications during construction
Procurement: Not started Construction: Not started Budget allocation for O&M:
Not started
Project Implementation Status Funding Source: TAU’s Capital Expenditure Budget Implementation Arrangements:
Primary responsibility for coordination/execution TAU Implementation responsibility by TAU. Works should be done by outsourcing to private sector or possibly done in-house by TAU
Contracting Method: Conventional tender to TAU procurement and MFEM guidelines Contract administration and construction supervision by TAU.
O&M Responsibility: TAU or outsourced to private sector Risk assessment: Equipment may not function
Maintenance not done properly due to shortage of funds – ensure adequate provisions allocated under annual budgets;
Implementation schedule:
Fiscal Year: 2007/08 to 2015/16
Current Status: Program for implementation

182 Appendix 5
Project Profile
TAU FUNDED CAPITAL WORKS – NOT FOR RANKING
Project ID: ENW23RAR Sector: Energy Name: Rarotonga instrumentation and asset management system upgrade Island: Rarotonga Location: Island Wide Background/Rationale: TAU has developed a large asset base over time and in order to provide
an efficient and effective service it needs to manage its assets. Objective: Improve operational efficiency of Rarotonga Electricity supply system Description of works: Prepare or develop a Register of Assets to monitor and control its assets,
replace test instruments and equipment and SCADA Features: The Project will maintain a improve operational efficiency and reduce the
cost of operations The Project will provide savings in capital expenditure on future
upgrade because of more reliable equipment Will provide information on equipment, assets it owns Will provide revenue
Estimated Beneficiaries: Some 14,000 people (including tourists)will benefit from this project Environmental Category: ADB category C:
Project will have no environmental impact. Land Requirement: None required Climate change adaptation needs:
None.
Project cost estimate: Capital cost estimate: $0.92 million O&M cost estimate: $50,000 per annum
Implementation options: Work should be outsourced to private sector or TAU O&M could be outsourced to private sector or done by TAU
Profile Created: 10 October 2006 Current Version: 10 October 2006

Appendix 5 183
Project Tracking
Last updated: 10 October 2006 Project Preparation Status Project Identification: Project has been identified through TAU’s 10 Year Infrastructure Capital
Expenditure Plan Stakeholder consultations:
Public awareness by newsprint & television; Notify consumers who will be affected.
Feasibility study: Started Engineering design: Not applicable? Started Land acquisition: None? Environmental assessment:
Identification of environmental implications during construction
Procurement: Not started Construction: Not started Budget allocation for O&M:
Not started
Project Implementation Status Funding Source: TAU’s Capital Expenditure Budget Implementation Arrangements:
Primary responsibility for coordination/execution TAU Implementation responsibility by TAU. Works should be done by outsourcing to private sector or possibly done in-house by TAU
Contracting Method: Conventional tender to TAU procurement and MFEM guidelines Contract administration and construction supervision by TAU.
O&M Responsibility: TAU or outsourced to private sector Risk assessment: Not developing or managing its assets could well have adverse effects
Equipment may not function Maintenance not done properly due to shortage of funds – ensure
adequate provisions allocated under annual budgets; Implementation schedule:
Fiscal Year: 2007/08 to 2015/16
Current Status: Program for implementation

184 Appendix 5
Project Profile
TAU FUNDED CAPITAL WORKS – NOT FOR RANKING
Project ID: ENW24RAR Sector: Energy Name: Rarotonga electricity distribution mains protection and isolation works Island: Rarotonga Location: Entire island Background/Rationale: Ongoing need for replacement of distribution and isolation points Objective: Improve operational efficiency of Rarotonga Electricity supply system Description of works: Undertake a physical survey of each single distribution & isolation point
to ensure that it is operable. Features: The Project will improve operational efficiency and reduce the cost of
operations The Project will provide savings in capital expenditure on future
upgrade because of more reliable equipment Will provide information on equipment, assets it owns Will provide revenue
Estimated Beneficiaries: Some 14,000 people (including tourists)will benefit from this project Environmental Category: ADB category C:
Project will have no environmental impact. Land Requirement: None required Climate change adaptation needs:
None, although the system may be impacted by high winds (e.g., overhead lines) or sea surges if applicable
Project cost estimate: Capital cost estimate: $0.16 million O&M cost estimate: $10,000 per annum
Implementation options: Work should be outsourced to private sector or TAU O&M could be outsourced to private sector or done by TAU
Profile Created: 10 October 2006 Current Version: 10 October 2006

Appendix 5 185
Project Tracking
Last updated: 10 October 2006 Project Preparation Status Project Identification: Project has been identified through TAU’s 10 Year Infrastructure Capital
Expenditure Plan Stakeholder consultations:
Public awareness by newsprint & television; Notify consumers who will be affected.
Feasibility study: Started Engineering design: Not applicable? Started Land acquisition: None? Environmental assessment:
Identification of environmental implications during construction
Procurement: Started Construction: Not Started Budget allocation for O&M:
Not started
Project Implementation Status Funding Source: TAU’s Capital Expenditure Budget Implementation Arrangements:
Primary responsibility for coordination/execution TAU Implementation responsibility by TAU. Works should be done by outsourcing to private sector or possibly done in-house by TAU
Contracting Method: Conventional tender to TAU procurement and MFEM guidelines Contract administration and construction supervision by TAU.
O&M Responsibility: TAU or outsourced to private sector Risk assessment: Failure to undertake this activity could result in failure of supply or
accidents if the lines are not isolated and protected. Equipment may not function Maintenance not done properly due to shortage of funds – ensure
adequate provisions allocated under annual budgets; Implementation schedule:
Fiscal Year: 2007/08 to 2015/16
Current Status: Program for implementation

186 Appendix 5
Project Profile
TAU FUNDED CAPITAL WORKS – NOT FOR RANKING
Project ID: ENW25RAR Sector: Energy Name: Rarotonga substation low voltage boards replacement Island: Rarotonga Location: Island Wide Background/Rationale: Ongoing need for replacement of 2 substation’s low voltage boards Objective: Improve operational efficiency of 2 substation and Rarotonga’s Electricity
supply system Description of works: Undertake a physical survey of each single substation and determine need
for replacement of board Features: The Project will improve operational efficiency and reduce the cost of
operations The Project will provide savings in capital expenditure on future upgrade
because of more reliable equipment Will provide information on equipment, assets it owns Will provide revenue
Estimated Beneficiaries: Some 14,000 people (including tourists)will benefit from this project Environmental Category: ADB category C:
Project will have no environmental impact. Land Requirement: None required Climate change adaptation needs:
None.
Project cost estimate: Capital cost estimate: $0.09 million O&M cost estimate: $10,000 per annum
Implementation options: Work should be outsourced to private sector or TAU O&M could be outsourced to private sector or done by TAU
Profile Created: 10 October 2006 Current Version: 10 October 2006

Appendix 5 187
Project Tracking
Last updated: 10 October 2006 Project Preparation Status Project Identification: Project has been identified through TAU’s 10 Year Infrastructure Capital
Expenditure Plan Stakeholder consultations:
Public awareness by newsprint & television; Notify consumers who will be affected.
Feasibility study: Started Engineering design: Started Land acquisition: None Environmental assessment:
Identification of environmental implications during construction
Procurement: Not started Construction: Not started Budget allocation for O&M:
Not started
Project Implementation Status Funding Source: TAU’s Capital Expenditure Budget Implementation Arrangements:
Primary responsibility for coordination/execution TAU Implementation responsibility by TAU. Works should be done by outsourcing to private sector or possibly done in-house by TAU
Contracting Method: Conventional tender to TAU procurement and MFEM guidelines Contract administration and construction supervision by TAU.
O&M Responsibility: TAU or outsourced to private sector Risk assessment: Areas serviced by substation could suffer from power outage due to
substation failure if substations are not replaced. Equipment may not function Maintenance not done properly due to shortage of funds – ensure
adequate provisions allocated under annual budgets; Implementation schedule:
Fiscal Year: 2007/08 to 2015/16
Current Status: Program for implementation

188 Appendix 5
Project Profile
TAU FUNDED CAPITAL WORKS – NOT FOR RANKING
Project ID: ENW26RAR Sector: Energy Name: Betela and Garnier substation upgrades Island: Rarotonga Location: Betela & Garnier Background/Rationale: Ongoing need for upgrading of two substation’s Objective: Improve operational efficiency of 2 substation and Rarotonga’s Electricity
supply system Description of works: Acquire and relocate Garnier substation and Betela Substation. Features: The Project will improve operational efficiency and reduce the cost of
operations The Project will provide savings in capital expenditure on future
upgrade because of more reliable equipment Will provide information on equipment, assets it owns Will provide revenue
Estimated Beneficiaries: Some 1,000 people will benefit from this project Environmental Category: ADB category B:
Project may have some minor environmental impact and may require land acquisition, and therefore an IEE will be required to determine whether a full EIA is necessary
Land Requirement: Land acquisition required and possibly relocation Climate change adaptation needs:
None, although site location may be impacted by cyclones, high rainfall events, and if applicable sea surge
Project cost estimate: Capital cost estimate: $0.24 million O&M cost estimate: $10,000 per annum
Implementation options: Work should be outsourced to private sector or TAU O&M could be outsourced to private sector or done by TAU
Profile Created: 10 October 2006 Current Version: 10 October 2006
Project Tracking
Last updated: 10 October 2006 Project Preparation Status Project Identification: Project has been identified through TAU’s 10 Year Infrastructure Capital
Expenditure Plan Stakeholder consultations:
Public awareness by newsprint & television; Notify consumers who will be affected.
Feasibility study: Started Engineering design: Not yet started Land acquisition: Yes Environmental assessment:
Not yet started
Procurement: Not Started Construction: Not Started Budget allocation for O&M:
Not started
Project Implementation Status

Appendix 5 189
Funding Source: TAU’s Capital Expenditure Budget Implementation Arrangements:
Primary responsibility for coordination/execution TAU Implementation responsibility by TAU. Works should be done by outsourcing to private sector or possibly done in-house by TAU
Contracting Method: Conventional tender to TAU procurement and MFEM guidelines Contract administration and construction supervision by TAU.
O&M Responsibility: TAU or outsourced to private sector Risk assessment: Landowners may decline to part with possession of their land, creating
difficulty to secure site. Substations may not function Maintenance not done properly due to shortage of funds – ensure
adequate provisions allocated under annual budgets; Implementation schedule:
Fiscal Year: 2007/08
Current Status: Program for implementation

190 Appendix 5
Project Profile
TAU FUNDED CAPITAL WORKS – NOT FOR RANKING
Project ID: ENW27RAR Sector: Energy Name: Rarotonga high voltage cable replacement program Island: Rarotonga Location: Entire island Background/Rationale: Ongoing need for replacing high voltage cable to ensure effective supply
of energy Objective: Improve operational efficiency of Rarotonga’s electricity supply system: Description of works: Replace HV cable & HV Conduits at Sub206/Sub 211;
Replace HV cable & HV Conduits at Sub 110/Sub 315; Replace HV cable & HV Conduits at Sub 205/Sub 206 Replace HV cable & HV conduits at Sub 101/Sub 102
Features: The Project will improve operational efficiency and reduce the cost of operations
The Project will provide savings in capital expenditure on future upgrade because of more reliable equipment
Will provide information on equipment, assets it owns Will provide revenue
Estimated Beneficiaries: Some 1000 or more people (including tourists)will benefit from this project
Environmental Category: ADB category C: Project will have no environmental impact.
Land Requirement: Not required Climate change adaptation needs:
None, although may be impacted by flooding, sea surge, and erosion
Project cost estimate: Capital cost estimate: $0.73 million O&M cost estimate: $40,000 per annum
Implementation options: Work should be outsourced to private sector or TAU O&M could be outsourced to private sector or done by TAU
Profile Created: 10 October 2006 Current Version: 10 October 2006

Appendix 5 191
Project Tracking
Last updated: 10 October 2006 Project Preparation Status Project Identification: Project has been identified through TAU’s 10 Year Infrastructure Capital
Expenditure Plan Stakeholder consultations:
Public awareness by newsprint & television; Notify consumers who will be affected.
Feasibility study: Not Started Engineering design: Not Started Land acquisition: Not required Environmental assessment:
Identification of environmental implications during construction
Procurement: Not Started Construction: Not Started Budget allocation for O&M:
Not started
Project Implementation Status Funding Source: TAU’s Capital Expenditure Budget Implementation Arrangements:
Primary responsibility for coordination/execution TAU Implementation responsibility by TAU. Works should be done by outsourcing to private sector or possibly done in-house by TAU
Contracting Method: Conventional tender to TAU procurement and MFEM guidelines Contract administration and construction supervision by TAU.
O&M Responsibility: TAU or outsourced to private sector Risk assessment: Failure to replace cables could result in power outage and breakdown
of the electrical system. Cables may not function adequately Maintenance not done properly due to shortage of funds – ensure
adequate provisions allocated under annual budgets; Implementation schedule:
Fiscal Year: 2007/08
Current Status: Program for implementation
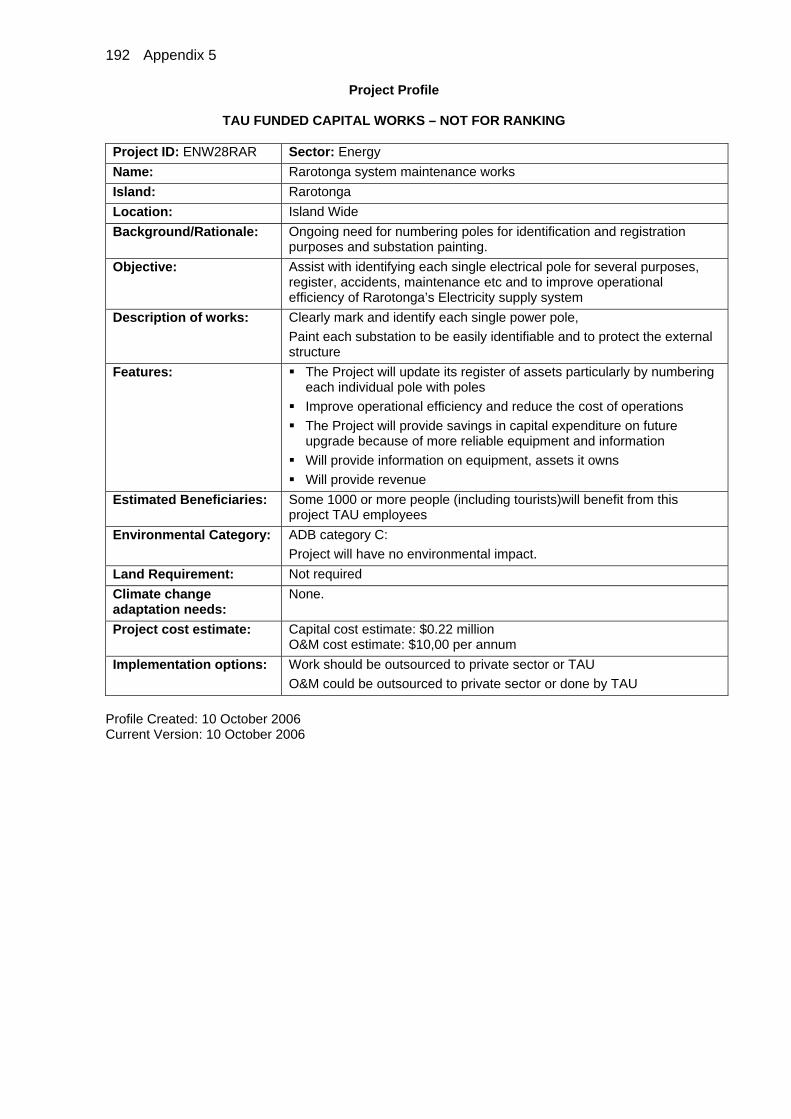
192 Appendix 5
Project Profile
TAU FUNDED CAPITAL WORKS – NOT FOR RANKING
Project ID: ENW28RAR Sector: Energy Name: Rarotonga system maintenance works Island: Rarotonga Location: Island Wide Background/Rationale: Ongoing need for numbering poles for identification and registration
purposes and substation painting. Objective: Assist with identifying each single electrical pole for several purposes,
register, accidents, maintenance etc and to improve operational efficiency of Rarotonga’s Electricity supply system
Description of works: Clearly mark and identify each single power pole, Paint each substation to be easily identifiable and to protect the external structure
Features: The Project will update its register of assets particularly by numbering each individual pole with poles
Improve operational efficiency and reduce the cost of operations The Project will provide savings in capital expenditure on future
upgrade because of more reliable equipment and information Will provide information on equipment, assets it owns Will provide revenue
Estimated Beneficiaries: Some 1000 or more people (including tourists)will benefit from this project TAU employees
Environmental Category: ADB category C: Project will have no environmental impact.
Land Requirement: Not required Climate change adaptation needs:
None.
Project cost estimate: Capital cost estimate: $0.22 million O&M cost estimate: $10,00 per annum
Implementation options: Work should be outsourced to private sector or TAU O&M could be outsourced to private sector or done by TAU
Profile Created: 10 October 2006 Current Version: 10 October 2006

Appendix 5 193
Project Tracking
Last updated: 10 October 2006 Project Preparation Status Project Identification: Project has been identified through TAU’s 10 Year Infrastructure Capital
Expenditure Plan Stakeholder consultations:
Public awareness by newsprint & television; Notify consumers who will be affected. May not require consultation.
Feasibility study: Started Engineering design: Not Started Land acquisition: Not required Environmental assessment:
Identification of environmental implications during construction
Procurement: Not started Construction: Not Required Budget allocation for O&M:
Not started
Project Implementation Status Funding Source: TAU’s Capital Expenditure Budget Implementation Arrangements:
Primary responsibility for coordination/execution TAU Implementation responsibility by TAU. Works should be done by outsourcing to private sector or possibly done in-house by TAU
Contracting Method: Conventional tender to TAU procurement and MFEM guidelines Contract administration and construction supervision by TAU.
O&M Responsibility: TAU or outsourced to private sector Risk assessment: Gap in Asset management if work is not undertaken;
Maintenance not done properly due to shortage of funds – ensure adequate provisions allocated under annual budgets
Implementation schedule:
Fiscal Year: 2007/08
Current Status: Program for implementation

194 Appendix 5
Project Profile
TAU FUNDED CAPITAL WORKS – NOT FOR RANKING
Project ID: ENW29RAR Sector: Energy Name: Rarotonga information technology equipment upgrade Island: Rarotonga Location: Tutakimoa Background/Rationale: Ongoing need for upgrading information technology to keep abreast with
development globally and for developing the service. Objective: Replace equipment that is obsolete. Replacement equipment to assist
with planning, designing, auditing and to improve operational efficiency of Rarotonga’s electricity supply system:
Description of works: Identify and procure office equipment required to deliver the tasks at hand
Features: The Project will provide 6 print servers Computer system upgrade and audit review 6 PCs to improve operational efficiency and reduce the cost of
operations The Project will provide savings in capital expenditure on future
upgrade because of more reliable equipment and information Will provide information on equipment, assets it owns Will provide revenue
Estimated Beneficiaries: Some 14,000 or more people (including tourists)will benefit from this project TAU employees
Environmental Category: ADB category C: Project will have no environmental impact.
Land Requirement: Not required Climate change adaptation needs:
None.
Project cost estimate: Capital cost estimate: $.41 million O&M cost estimate: $20,000 per annum
Implementation options: Work should be outsourced to private sector or TAU O&M could be outsourced to private sector or done by TAU
Profile Created: 10 October 2006 Current Version: 10 October 2006

Appendix 5 195
Project Tracking
Last updated: 10 October 2006 Project Preparation Status Project Identification: Project has been identified through TAU’s 10 Year Infrastructure Capital
Expenditure Plan Stakeholder consultations:
Not required.
Feasibility study: Started Engineering design: Not Required Land acquisition: Not required Environmental assessment:
Not required
Procurement: Not started Construction: Not Required Budget allocation for O&M:
Not started
Project Implementation Status Funding Source: TAU’s Capital Expenditure Budget Implementation Arrangements:
Primary responsibility for coordination/execution TAU Implementation responsibility by TAU. Works should be done by outsourcing to private sector or possibly done in-house by TAU
Contracting Method: Conventional tender to TAU procurement and MFEM guidelines Contract administration and installment by TAU.
O&M Responsibility: TAU or outsourced to private sector Risk assessment: Equipment may not operate as expected
Maintenance not done properly due to shortage of funds – ensure adequate provisions allocated under annual budgets;
Implementation schedule:
Fiscal Year: 2007/08 to 2016
Current Status: Program for implementation

196 Appendix 5
Project Profile
TAU FUNDED CAPITAL WORKS – NOT FOR RANKING Project ID: ENW30RAR Sector: Energy Name: Rarotonga administration system vehicle replacement program Island: Rarotonga Location: Tutakimoa Background/Rationale: Ongoing need for replacing metre reader bikes & administration vehicle
to discharge responsibilities effectively. Objective: Replace motor cycles and administration motor vehicle to ensure that the
tasks are implemented without difficulty. Description of works: Identify and procure motor cycles and administration vehicle Features: The Project will provide a number of motor cycles
Administration Motor vehicle The Project will provide savings in capital expenditure on future
upgrade because of more reliable equipment and information Will provide information on equipment, assets it owns Will provide revenue
Estimated Beneficiaries: Some 14,000 or more people will benefit from this project TAU employees
Environmental Category: ADB category C: Project will have no environmental impact.
Land Requirement: Not required Climate change adaptation needs:
None, although if a fleet purchase is considered, hybrid type vehicles should be evaluated
Project cost estimate: Capital cost estimate: $.10 million O&M cost estimate: $10,000 per annum
Implementation options: Work should be outsourced to private sector or TAU O&M could be outsourced to private sector or done by TAU
Profile Created: 10 October 2006 Current Version: 10 October 2006

Appendix 5 197
Project Tracking
Last updated: 10 October 2006 Project Preparation Status Project Identification: Project has been identified through TAU’s 10 Year Infrastructure Capital
Expenditure Plan Stakeholder consultations:
No consultation required
Feasibility study: Started Engineering design: Not Required Land acquisition: Not required Environmental assessment:
Not required
Procurement: Not Started Construction: Not Required Budget allocation for O&M:
Not started
Project Implementation Status Funding Source: TAU’s Capital Expenditure Budget Implementation Arrangements:
Primary responsibility for coordination/execution TAU Implementation responsibility by TAU. Works should be done by outsourcing to private sector or possibly done in-house by TAU
Contracting Method: TAU procurement guidelines. Contract administration and installment supervision by TAU.
O&M Responsibility: TAU or outsourced to private sector Risk assessment: Equipment may not operate as expected
Maintenance not done properly due to shortage of funds – ensure adequate provisions allocated under annual budgets
Implementation schedule:
Fiscal Year: 2007/08, 2008/09, 2010/11, 2011/12
Current Status: Program for implementation

198 Appendix 5
Project Profile
TCI FUNDED CAPITAL WORKS – NOT FOR RANKING Project ID: TCW01NAT Sector: Telecommunications Name: National high speed internet access installation on all islands Island: National Location: All islands Background/Rationale: With internet access being widely used around the world, there is a need
for the Cook Islands to be able to offer the similar services to all users. This will not only address local users, but also for visitors to the island. There is the introduction of broadband on Rarotonga to increase speed, as well as to be economical for users, however further work needs to be carried out by Telecom Cook Islands to ensure the satisfaction of all users.
Objective: Improve internet access for all users in the Cook Islands Scope of works: Work to be carried out by Telecom Cook Islands according to their
infrastructure plans. Features: High speed access to the internet on all islands
Reduced user costs for internet access due to a new and improved system
The ability for all islands to use the internet as a means for distance education
The ability for the private sector to use the internet as a means of promoting their businesses
Estimated Beneficiaries: Total resident and visitor populations Environmental Category: ADB category C:
No significant impacts as only improving existing facilities; Land Requirement: None Climate change adaptation needs:
Not required.
Project cost estimate: Capital Cost Estimate: $130, 000 (Total 7 islands). Operating and maintenance costs: Incorporated into TCI operations
Implementation options: Work to be carried out by Telecom Cook Islands Profile Created: 24 October 2006 Current Version: 24 October 2006

Appendix 5 199
Project Tracking
Last updated: 24 October 2006 Project Preparation Status Project Identification: Project has been identified by Telecom Cook Islands. Stakeholder consultations:
Not applicable
Feasibility study: Not required Engineering design: To be carried out by Telecom Cook Islands Land acquisition: Not needed Environmental assessment:
Not needed
Procurement: Not started Construction: Not started Budget allocation for O&M:
Not started
Project Implementation Status Funding Source: Telecom Cook Islands Implementation Arrangements:
Telecom Cook Islands
Contracting Method: Telecom Cook Islands O&M Responsibility: Telecom Cook Islands Risk assessment: Breakdown due to improper maintenance of equipment – provide
training to reduce risk Lengthy downtime in case of failure – ensure supply of key spare parts
included in this contract to maintain operability Maintenance not done properly due to shortage of funds – ensure
adequate provisions allocated under annual budgets Implementation schedule:
Fiscal Year 2007/08
Current Status: Awaiting decision by Telecom Cook Islands

200 Appendix 5
Project Profile
TCI FUNDED CAPITAL WORKS – NOT FOR RANKING
Project ID: TCW03NAT Sector: Telecommunications Name: Outer islands mobile phone network service on all islands Island: Outer Islands Location: Background/Rationale: Mobile services are currently only been offered to customers in
Rarotonga & Aitutaki. With the increased use by existing customers, it is envisaged that the service be offered to all other outer islands as an alternative or and extra means of communication. This allows the outer islands to be able to call mobiles in the Cook Islands at the normal mobile user rates, rather than using normal national dialing charges, and also the ability to send SMS messages to other mobile users.
Objective: Provide mobile phone network services to outer islands customers Scope of works: Work to be carried out by Telecom Cook Islands according to their
infrastructure plans. Features: Ability to offer mobile services to users on the outer islands Estimated Beneficiaries: Users on all islands excluding Rarotonga and Aitutaki who are currently
offered this service. Environmental Category: ADB category C:
No significant impacts as only improving existing facilities; Land Requirement: None Climate change adaptation needs:
All microwave towers should be protected against impacts from increased cyclone events, high intensity rainfall, and sea surges
Project cost estimate: Capital Cost Estimate: $2.8 million (Total islands) Operating and maintenance costs: Incorporated into the TCI operations
Implementation options: Work to be carried out by Telecom Cook Islands Profile Created: 24 October 2006 Current Version: 24 October 2006

Appendix 5 201
Project Tracking
Last updated: 24 October 2006 Project Preparation Status Project Identification: Project has been identified by Telecom Cook Islands. Stakeholder consultations:
Not applicable
Feasibility study: Not required Engineering design: To be carried out by Telecom Cook Islands Land acquisition: Not needed Environmental assessment:
Not needed
Procurement: Not started Construction: Not started Budget allocation for O&M:
Not started
Project Implementation Status Funding Source: Telecom Cook Islands Implementation Arrangements:
Telecom Cook Islands
Contracting Method: Telecom Cook Islands O&M Responsibility: Telecom Cook Islands Risk assessment: Breakdown due to improper maintenance of equipment – provide
training to reduce risk Implementation schedule:
Fiscal Year 2007/08
Current Status: Awaiting decision by Telecom Cook Islands

202 Appendix 5
Project Profile
TCI FUNDED CAPITAL WORKS – NOT FOR RANKING
Project ID: TCW04NAT Sector: Telecommunications Name: Install back up power supply on islands where power is less than 24
hours Island: Outer Islands Location: Background/Rationale: The lack of regular maintenance of battery banks for TCI facilities had led
to the power supply to deteriorate faster than normal. It is essential for back up power supply to be installed for all telecommunications systems on all islands, especially for those islands, which do not operate 24 hours power supply. However, it is essential that this backup system is in place in case of shortage of fuel to the islands, or in times of natural disasters. Telecom should not rely totally on the island power supply in case of the above two scenarios, and having this back up system will ensure that all communications with all the islands are maintained.
Objective: Install back up power supply on all islands for telecommunications networks
Scope of works: Replace battery banks. Work to be carried out by Telecom Cook Islands according to their infrastructure plans.
Features: Installation of back up power supply for telecommunications networks on all islands
The system can be operated continuously for 24 hours per day Estimated Beneficiaries: All telecommunications users on all islands Environmental Category: ADB category C:
No significant impacts as only improving existing facilities; Land Requirement: None Climate change adaptation needs:
Not required, if a transportable system
Project cost estimate: Capital Cost Estimate: $600,000 (Total 8 islands). Operating Costs: Incorporated into the TCI operations
Implementation options: Work to be carried out by Telecom Cook Islands Profile Created: 24 October 2006 Current Version: 24 October 2006

Appendix 5 203
Project Tracking
Last updated: 24 October 2006 Project Preparation Status Project Identification: Project has been identified by Telecom Cook Islands. Stakeholder consultations:
Not applicable
Feasibility study: Not required Engineering design: To be carried out by Telecom Cook Islands Land acquisition: Not needed Environmental assessment:
Not needed
Procurement: Not started Construction: Not started Budget allocation for O&M:
Not started
Project Implementation Status Funding Source: Telecom Cook Islands Implementation Arrangements:
Telecom Cook Islands
Contracting Method: Telecom Cook Islands O&M Responsibility: Telecom Cook Islands Risk assessment: Breakdown due to improper maintenance of equipment – provide training
to reduce risk Implementation schedule:
Fiscal Year 2007/08
Current Status: Awaiting decision by Telecom Cook Islands

204 Appendix 5
Project Profile
TCI FUNDED CAPITAL WORKS – NOT FOR RANKING
Project ID: TCW05NAT Sector: Telecommunications Name: Install Alternate Transmission Source Island: Mitiaro, Rakahanga Location: Background/Rationale: The two islands are currently receiving transmissions via a primary
source, Mitiaro via Atiu and Rakahanga via Manihiki. To improve reliability and efficiency of the telecommunication services it is planned to install satellite earth stations on both these islands.
Objective: To install satellite earth station on Mitiaro and Rakahanga Scope of works: Procurement of capital items
Construction and installation Features: High speed access to the internet on all islands
Reduced user costs for internet access due to a new and improved system
The ability for the private sector to use the internet as a means of promoting their businesses
Estimated Beneficiaries: Total residents and visitor populations Environmental Category: ADB category C:
No significant impacts Land Requirement: Rakahanga – to be confirmed Climate change adaptation needs:
Protection of the system from the impacts of increased cyclones, and sea surges
Project cost estimate: Capital Cost Estimate: $750,000 Operating and maintenance costs: $150,000 per annum (total 2 islands)
Implementation options: Work can be done by public or private sector Operation and maintenance could be outsourced to private sector or done by Island Administrations
Profile Created: 24 October 2006 Current Version: 24 October 2006

Appendix 5 205
Project Tracking
Last updated: 24 October 2006 Project Preparation Status Project Identification: Project has been identified by Telecom Cook Islands. Stakeholder consultations:
Not applicable
Feasibility study: Not required Engineering design: To be carried out by Telecom Cook Islands Land acquisition: Not needed Environmental assessment:
Not needed
Procurement: Not started Construction: Not started Budget allocation for O&M:
Not started
Project Implementation Status Funding Source: Telecom Cook Islands Implementation Arrangements:
Telecom Cook Islands
Contracting Method: Telecom Cook Islands O&M Responsibility: Telecom Cook Islands Risk assessment: Breakdown due to improper maintenance of equipment – provide
training to reduce risk Lengthy downtime in case of failure – ensure supply of key spare parts
included in this contract to maintain operability Maintenance not done properly due to shortage of funds – ensure
adequate provisions allocated under annual budgets Implementation schedule:
Fiscal Year 2007/08
Current Status: Awaiting decision by Telecom Cook Islands

206 Appendix 5
Project Profile
Project ID: MFW01SGI Sector: Maintenance Facilities Name: Operation and maintenance facilities refurbishment Island: Mangaia, Mitiaro Location: Kaumata, Mangarei Background/Rationale: There is a lack of proper maintenance facilities and equipment for
repairing and maintaining machineries to sustain the operations of infrastructure facilities.
Objective: To improve and prolong the serviceability life of heavy machineries on these islands so that infrastructure facilities can be maintained regularly
Scope of Works: Refurbish and upgrade existing facilities Building occupancy to include: mechanical workshop, spare parts
storage, machinery shelter, office, convenience Equip building with appropriate tools, equipment and spare parts Recruit staffs with relevant skills
Features: Sustainable operation of infrastructure facilities Prolong serviceability life of machineries Accessibility by sea and air services will be improved Improvement in economic development Project will reduce operating and maintenance costs
Estimated Beneficiaries: The people of Mangaia and Mitiaro through functioning infrastructure facilities
Local communities through improved accessibility to sea and air services
Road users through the regularly maintained roads Environmental Category: ADB category C:
No significant impacts Land Requirement: Not required Climate change adaptation needs:
Not required, unless building construction is advocated. These need to be protected from increased cyclone events, flooding and high intensity rainfall.
Project Cost Estimate: Capital cost: $255,000. Climate change adaptation works costs: $0. Operating Costs: $90,000 per annum (total 2 islands) Maintenance Costs: $8,000 per annum (total 2 islands)
Implementation options: Construction works can be done by public or private sector Operation and maintenance by Island Administrations
Profile Created: 9 October 2006 Current Version: 9 October 2006

Appendix 5 207
Project Tracking
Last updated: 09 October 2006 Project Preparation Status Project Identification: Project has been identified through field visit in 2006. During the mid-
term workshop in September the Financial Secretary highlighted the issues of machineries being left out in the open, exposed to severe environmental conditions causing rapid deterioration.
Stakeholder Consultations:
Discussions needed with Island Councils and Island Administrations to confirm project.
Feasibility Study: Required to confirm project scope Engineering Design: Field inspection required to confirm design parameters Land Acquisition: Not needed Environmental Assessment:
Not needed
Procurement: Not started Construction: Not started
Project Implementation Status Funding Source: CIGOV national budget and other funding agencies Implementation Arrangements:
Not yet determined but primary responsibility for coordination / execution may be given to the PDU*
Contracting Method: Conventional tender through local competitive bidding according to MFEM Policy guidelines. Contract administration and construction supervision by implementing agency
O&M Responsibility: Island Administration on each island or outsourced to private sector Risk assessment: Inclement weather – construction program to consider cyclone
season Construction delays – employ suitably qualified and experienced
contractors Operation and maintenance constraints due to funds shortage –
ensure adequate provisions allocated under annual budgets Implementation schedule: Fiscal Year 2007/08 to 2008/2009 Current Status: Awaiting decision by Government and other potential funding agencies
*New PDU yet to be established. Presently such work is carried out by AMD.

208 Appendix 5
Project Profile
Project ID: MFW02NGI Sector: Maintenance Facilities Name: Operation and maintenance facilities refurbishment Island: Pukapuka, Penrhyn Location: Ngake, Omoka Background/Rationale: There is a lack of proper maintenance facilities for repairing and
maintaining machineries to sustain the operations of infrastructure facilities. There are also limited appropriately qualified staffs to carry out the maintenance and repair works.
Objective: To improve and prolong the serviceability life of heavy machineries on the island so that infrastructure facilities can be maintained regularly
Scope of Works: Refurbish and upgrade (Penrhyn – requires concrete floor, walls and workshop)
Building occupancy to include: mechanical workshop, spare parts storage, machinery shelter, office, convenience
Equip building with appropriate tools, equipment and spare parts Recruit staffs with relevant skills
Features: Sustainable operation of infrastructure facilities Prolong serviceability life of machineries Accessibility by sea and air services will be improved Improvement in economic development Project will reduce operating and maintenance costs of infrastructure
machineries Reduced maintenance costs on vehicular road traffic
Estimated Beneficiaries: The people on these Pukapuka through functioning infrastructure facilities
Local communities through improved accessibility to sea and air services
Road users through the regularly maintained roads Environmental Category: ADB category C:
No significant impacts Land Requirement: Not required Climate change adaptation needs:
Not required, unless building construction is advocated. These need to be protected from increased cyclone events, and sea surges.
Project Cost Estimate: Capital cost: $255,000. Climate change adaptation works costs: $0. Operating Costs: $90,000 per annum (total 2 islands) Maintenance Costs: $6,000 per annum (total 2 islands)
Implementation options: Construction works can be done by public or private sector Operation and maintenance by Island Administrations
Profile Created: 9 October 2006 Current Version: 9 October 2006

Appendix 5 209
Project Tracking
Last updated: 09 October 2006 Project Preparation Status Project Identification: During the mid-term workshop in September the Financial Secretary
highlighted the issues of machineries being left out in the open, exposed to severe environmental conditions causing rapid deterioration. Project has also been identified through field visit in 2006 by the TA4605-COO team.
Stakeholder Consultations:
Discussions needed with Island Councils and Island Administrations to confirm project.
Feasibility Study: Required to confirm project scope Engineering Design: Field inspection required to confirm design parameters Land Acquisition: Not needed Environmental Assessment:
Not needed
Procurement: Not started Construction: Not started
Project Implementation Status Funding Source: CIGOV national budget and other funding agencies Implementation Arrangements:
Not yet determined but primary responsibility for coordination / execution may be given to the PDU*
Contracting Method: Conventional tender through local competitive bidding according to MFEM Policy guidelines. Contract administration and construction supervision by implementing agency
O&M Responsibility: Island Administration on each island or outsourced to private sector Risk assessment: Inclement weather – construction program to consider cyclone
season Construction delays – employ suitably qualified and experienced
contractors Operation and maintenance constraints due to funds shortage –
ensure adequate provisions allocated under annual budgets Implementation schedule: Fiscal Year 2007/08 to 2008/2009 Current Status: Awaiting decision by Government and other potential funding agencies
*New PCU yet to be established. Presently such work is carried out by AMD.

210 Appendix 5
Project Profile
Project ID: MFW03SGI Sector: Maintenance Facilities Name: New operation and maintenance facilities Island: Aitutaki, Atiu, Mauke Location: Vaipae, Areora, Makatea Background/Rationale: To improve and prolong the serviceability life of heavy machineries on
these islands so that infrastructure facilities can be maintained regularly. There is a lack of proper maintenance facilities for repairing and maintaining machineries to sustain the operations of infrastructure facilities.
Objective: To provide facilities so that infrastructure machineries can be maintained and sheltered.
Scope of Works: Build new maintenance facilities Building occupancy to include: mechanical workshop, spare parts
storage, machinery shelter, office, convenience Equip building with appropriate tools, equipment and spare parts Recruit staffs with relevant skills
Features: Sustainable operation of infrastructure facilities Prolong useful life of machineries Accessibility by sea and air services will be improved Improvement in economic development Project will reduce operating and maintenance costs on machineries Reduced maintenance costs on vehicular road traffic
Estimated Beneficiaries: The people on these islands through the functioning infrastructure facilities
Local communities through improved accessibility to sea and air services
Road users through the regularly maintained roads Environmental Category: ADB category C:
No significant impacts Land Requirement: None – facilities will be built at existing sites on Crown land Climate change adaptation needs:
Not required, unless building construction is advocated. These need to be protected from increased cyclone events, flooding and high intensity rainfall.
Project Cost Estimate: Capital cost: $560,000. Climate change adaptation works costs: $20,000 (included in capital cost) Operating Costs: $150,000 per annum (total 3 islands) Maintenance Costs: $12,000 per annum (total 3 islands)
Implementation options: Construction works can be done by public or private sector Operation and maintenance by Island Administrations
Profile Created: 9 October 2006 Current Version: 9 October 2006

Appendix 5 211
Project Tracking
Last updated: 09 October 2006 Project Preparation Status Project Identification: Project has been identified through field visit in 2006. During the mid-term
workshop in September the Financial Secretary highlighted the issues of machineries being left out in the open, exposed to severe environmental conditions causing rapid deterioration. Project has been identified through field visit in 2006 by the TA4605-COO team.
Stakeholder Consultations:
Follow up discussions needed with Island Councils and Island Administrations to confirm project.
Feasibility Study: Required to confirm project scope Engineering Design: Not started - feasibility study required to confirm viability and design
parameters Land Acquisition: Not needed Environmental Assessment:
Not needed
Procurement: Not started Construction: Not started Budget allocation for O&M:
Not started
Project Implementation Status Funding Source: CIGOV national budget and other funding agencies Implementation Arrangements:
Implementation responsibility not yet determined. Primary responsibility for coordination/execution may be given to the PDU*
Contracting Method: Conventional tender through local competitive bidding according to MFEM Policy guidelines. Contract administration and construction supervision by implementing agency
O&M Responsibility: Island Administration on each island or outsourced to private sector Risk assessment: Inclement weather – construction program to consider cyclone season
Construction delays – employ suitably qualified and experienced contractors
Operation constraints due to funds shortage – ensure adequate provisions allocated under annual budgets
Maintenance not done properly due to funds shortage – ensure adequate provisions allocated under annual budgets
Implementation schedule: Fiscal Year 2007/08 to 2008/2009 Current Status: Awaiting decision by Government and NZAID as possible funding source
*New PDU yet to be established. Presently such work is carried out by AMD.

212 Appendix 5
Project Profile
Project ID: MFW04NGI Sector: Maintenance Facilities Name: New operation and maintenance facilities Island: Rakahanga, Palmerston, Nassau Location: Background/Rationale: There is a lack of proper maintenance facilities for repairing and
maintaining machineries to sustain the operations of infrastructure facilities. There are also limited appropriately qualified staffs to carry out the maintenance and repair works.
Objective: To improve and prolong the serviceability life of heavy machineries on the island so that infrastructure facilities can be maintained regularly
Scope of Works: Build new maintenance facilities Building occupancy to include: mechanical workshop, spare parts
storage, machinery shelter, office, convenience Equip building with appropriate tools, equipment and spare parts Recruit staffs with relevant skills
Features: Sustainable operation of infrastructure facilities Prolong serviceability life of machineries Accessibility by sea and air services will be improved Improvement in economic development Project will reduce operating and maintenance costs of infrastructure
machineries Reduced maintenance costs on vehicular road traffic
Estimated Beneficiaries: The people on these Pukapuka through functioning infrastructure facilities
Local communities through improved accessibility to sea and air services
Road users through the regularly maintained roads Environmental Category: ADB category C:
No significant impacts Land Requirement: To be confirmed Climate change adaptation needs:
Not required, unless building construction is advocated. These need to be protected from increased cyclone events, and sea surges.
Project Cost Estimate: Capital cost: $470,000. Climate change adaptation works costs: $20,000. Operating Costs: $140,000 per annum (total 3 islands) Maintenance Costs: $12,000 per annum (total 3 islands)
Implementation options: Construction works can be done by public or private sector Operation and maintenance by Island Administrations
Profile Created: 9 October 2006 Current Version: 9 October 2006

Appendix 5 213
Project Tracking
Last updated: 09 October 2006 Project Preparation Status Project Identification: During the mid-term workshop in September the Financial Secretary
highlighted the issues of machineries being left out in the open and exposed to severe environmental conditions causing rapid deterioration. Project has also been identified through field visit in 2006 by the TA4605-COO team.
Stakeholder Consultations:
Discussions needed with Island Councils and Island Administrations to confirm project.
Feasibility Study: Required to confirm project scope and land acquisition Engineering Design: Field inspection required to confirm design parameters Land Acquisition: To be confirmed by feasibility study Environmental Assessment:
To be confirmed by feasibility study
Procurement: Not started Construction: Not started
Project Implementation Status Funding Source: CIGOV national budget and other funding agencies Implementation Arrangements:
Not yet determined but primary responsibility for coordination / execution may be given to the PDU*
Contracting Method: Conventional tender through local competitive bidding according to MFEM Policy guidelines. Contract administration and construction supervision by implementing agency
O&M Responsibility: Island Administration on each island or outsourced to private sector Risk assessment: Inclement weather – construction program to consider cyclone
season Construction delays – employ suitably qualified and experienced
contractors Operation and maintenance constraints due to funds shortage –
ensure adequate provisions allocated under annual budgets Implementation schedule: Fiscal Year 2007/08 to 2009/2010 Current Status: Awaiting decision by Government and other potential funding agencies
*New PDU yet to be established. Presently such work is carried out by AMD.

214 Appendix 5
Project Profile
Project ID: MFW05NGI Sector: Maintenance Facilities Name: Centralised operation and maintenance facilities for Northern Group Island: Manihiki Location: Tauhunu Background/Rationale: The remoteness of the Northern Group islands from Rarotonga and the
weight limitation of airfreight cargo make it difficult to complete maintenance activities on time and according to a maintenance plan. There is therefore a need to address the remoteness issues through a centralized maintenance facility in Tauhunu on Manihiki.
Objective: To improve and prolong the serviceability life of heavy machineries by building proper maintenance facilities and shelter
Scope of Works: Build new central maintenance facilities for the Northern Group islands
Building occupancy to include: mechanical workshop, spare parts storage, machinery shelter, office, convenience
Equip building with appropriate tools, equipment and spare parts Recruit staffs with relevant skills
Features: Sustainable operation of infrastructure facilities Prolong useful life of machineries Accessibility by sea and air services will be improved Improvement in economic development Project will reduce operating and maintenance costs on infrastructure
machineries Reduced maintenance costs on vehicular road traffic
Estimated Beneficiaries: The people in the Northern Group islands will benefit from the functioning infrastructure facilities
Local communities through improved accessibility to sea and air services
Road users through the regularly maintained roads Environmental Category: ADB category C:
No significant impacts Land Requirement: None – facilities will be built at existing site on Crown land Climate change adaptation needs:
Not required, unless building construction is advocated. These need to be protected from increased cyclone events, sea surges, high wind speeds.
Project Cost Estimate: Capital cost: $200,000. Climate change adaptation works costs: $0. Operating Costs: $70,000 per annum Maintenance Costs: $5,000 per annum
Implementation options: Construction works can be done by private sector Operation and maintenance by Island Administrations
Profile Created: 9 October 2006 Current Version: 9 October 2006

Appendix 5 215
Project Tracking
Last updated: 09 October 2006 Project Preparation Status Project Identification: During the mid-term workshop for this project in September the Financial
Secretary highlighted the issues of machineries being left out in the open and exposed to severe environmental conditions causing rapid deterioration. Project has also been identified through field visit in 2006 by the TA46050-COO team.
Stakeholder Consultations:
Discussions needed with Island Councils and Island Administrations to confirm project.
Feasibility Study: Required to confirm scope of project Engineering Design: Feasibility study to confirm design parameters Land Acquisition: Not needed Environmental Assessment:
Not needed
Procurement: Not started Construction: Not started
Project Implementation Status Funding Source: CIGOV national budget and other funding agencies Implementation Arrangements:
Not yet determined but primary responsibility for coordination / execution may be given to the PDU*
Contracting Method: Conventional tender through local competitive bidding according to MFEM Policy guidelines. Contract administration and construction supervision by implementing agency
O&M Responsibility: Island Administration or outsourced to private sector Risk assessment: Inclement weather – construction program to consider cyclone
season Construction delays – employ suitably qualified and experienced
contractors Operation constraints due to funds shortage – ensure adequate
provisions allocated under annual budgets Maintenance not done properly due to funds shortage – ensure
adequate provisions allocated under annual budgets Implementation schedule: Fiscal Year 2007/08 to 2009/2010 Current Status: Awaiting decision by Government and other funding agencies
*New PDU yet to be established. Presently such work is carried out by AMD.

216 Appendix 5
Project Profile
Project ID: EMW01RAR Sector: Emergency Management Name: Evacuation Management centres Island: Rarotonga Location: Background/Rationale: There is need to refurbish the existing EMCs to provide shelter for
evacuees during disaster related emergencies. There is also need to furnish the EMCs with the relevant facilities and equipment necessary for emergency purposes.
Objective: To refurbish the existing EMCs and equip with the relevant facilities and equipment
Scope of Works: Conduct field assessment of buildings to confirm project scope Refurbish buildings Supply relevant equipment and facilities such as; standby power
supply, own water supply, sanitation facilities, communal and basic accommodation, communication equipment, storage for emergency food and medical supplies.
Features: Low cost solution for relocating people during disaster related emergencies
Project will reduce operating and maintenance costs Provision of improved shelter for people during disasters (meet
minimum level of service) Provide some savings as there will be no need to build new EMCs on
the island Prevent the loss of lives EMC can be used for other community functions
Estimated Beneficiaries: Overall some 10,000 people will receive shelter if required to be relocated during emergencies
Environmental Category: ADB category C: No significant impacts as the project is to improve existing facilities;
Land Requirement: None Climate change adaptation needs:
EMC need to be adequate protection against high wind gusts during cyclone events, high intensity rainfall, and flooding
Project Cost Estimate: Capital Cost Estimate: $940,000. Note: estimate of incremental cost of climate change adaptation works included in capital cost above is $0)
Operating Costs: $55,000 per annum (total 11 EMCs) Maintenance costs: $40,000 (total 11 EMCs)
Implementation options: Work can be done by public or private sector Profile Created: 1 October 2006 Current Version: 1 October 2006

Appendix 5 217
Project Tracking
Last updated: 10 October 2006 Project Preparation Status Project Identification: Project has been identified through consultations by the TA4605-COO
team with the National Disaster Management Office (NDMO) in 2006. Stakeholder Consultations:
Discussions needed with the respective village or community organisation and NDMO to confirm project.
Feasibility Study: Required to confirm project scope Engineering Design: Feasibility study will confirm design parameters Land Acquisition: Not needed Environmental Assessment:
Not needed
Procurement: Not started Construction: Not started
Project Implementation Status Funding Source: CIGOV national budget and aid donor agencies Implementation Arrangements:
Not determined yet but may be primary responsibility for coordination/execution may be given to the PDU*
Contracting Method: Conventional tender through local competitive bidding to MFEM guidelines. Contract administration and construction supervision by implementing agency
O&M Responsibility: Local community or organisation Risk assessment: Inclement weather – construction program to consider cyclone season
Construction delays – employ suitably qualified and experienced contractors
Operation and maintenance not done properly due to funds shortage – ensure adequate provisions allocated under annual budgets
Implementation schedule: Fiscal Year 2007/2008 to 2009/2010 Current Status: Awaiting decision by government and aid donors
*New PDU yet to be established. Presently such work is carried out by AMD.

218 Appendix 5
Project Profile
Project ID: EMW02SGI Sector: Emergency Management Name: Evacuation management centres Island: Aitutaki, Atiu, Mangaia, Mauke, Mitiaro Location: Background/Rationale: There is need to refurbish the existing EMCs to provide shelter for
evacuees during disaster related emergencies. There is also need to furnish the EMCs with the relevant facilities and equipment necessary for emergency purposes.
Objective: To refurbish the existing EMCs and equip with the relevant facilities and equipment
Scope of Works: Conduct field assessment of buildings to confirm project scope Refurbish buildings Supply relevant equipment or facilities such as; standby power supply,
own water supply, sanitation facilities, communal and basic accommodation, communication equipment, storage for emergency food and medical supplies.
Features: Low cost solution for relocating people during disaster related emergencies
Project will reduce operating and maintenance costs Provision of improved shelter for people during disasters (meet
minimum level of service) Provide some savings as there will be no need to build new EMCs on
the island Prevent the loss of lives EMC can be used for other community functions
Estimated Beneficiaries: Overall some 4,000 people will receive shelter if required to be relocated during emergencies
Local communities can use EMCs for other purposes Environmental Category: ADB category C:
No significant impacts as the project is to improve existing facilities; Land Requirement: None Climate change adaptation needs:
EMC need to be adequate protection against high wind gusts during cyclone events, high intensity rainfall, and flooding
Project Cost Estimate: Capital Cost Estimate: $1,725,000. Note: estimate of incremental cost of climate change adaptation works included in capital cost above is $0)
Operating Costs: $115,000 per annum (total 23 EMCs) Maintenance costs: $70,000 (total 23 EMCs)
Implementation options: Work can be done by public or private sector Profile Created: 1 October 2006 Current Version: 1 October 2006

Appendix 5 219
Project Tracking
Last updated: 10 October 2006 Project Preparation Status Project Identification: Project has been identified through project field visits in 2006 and
consultations with NDMO Stakeholder Consultations:
Discussions needed with Island Councils and NDMO to confirm project.
Feasibility Study: Required to confirm project scope Engineering Design: Feasibility study will confirm design parameters Land Acquisition: Not needed Environmental Assessment:
Not needed
Procurement: Not started Construction: Not started
Project Implementation Status Funding Source: CIGOV national budget and aid donor agencies Implementation Arrangements:
Not determined yet but primary responsibility for coordination / execution may be given to the PDU*
Contracting Method: Conventional tender through local competitive bidding to MFEM guidelines. Contract administration and construction supervision by implementing agency
O&M Responsibility: Local community Risk assessment: Inclement weather – construction program to consider cyclone
season Construction delays – employ suitably qualified and experienced
contractors Operation and maintenance not done properly due to funds shortage
– ensure adequate provisions allocated under annual budgets Implementation schedule: Fiscal Year 2007/2008 to 2009/2010 Current Status: Awaiting decision by government and aid donors
*New PDU yet to be established. Presently such work is carried out by AMD.

220 Appendix 5
Project Profile
Project ID: EMW03MHX Sector: Emergency Management Name: Evacuation management centres Island: Manihiki Location: Tukao, Tauhunu Background/Rationale: Two community cyclone centres were constructed in 1997 following
cyclone Martin in Tauhunu and Tukao. An investigation report by MWH in 2004 found that the CMCs were in generally good condition but there had been significant deterioration of some components. It became apparent that design faults had led to disrepair and resulted in restrictions on the use of the CMCs. Other factors were deterioration due to harsh the marine environment and limited maintenance done on the buildings. The MWH report which recommended various repair and refurbishment works.
Objective: To repair the two EMCs and equip them with the relevant facilities and equipment
Scope of Works: Carry out repair works Supply and equip the EMCs with the relevant facilities and equipment
Features: Low cost solution for relocating people during disaster related emergencies
Project will reduce operating and maintenance costs Provision of improved shelter for people during disasters (meet
minimum level of service) Provide some savings as there will be no need to build new EMCs on
the island Prevent the loss of lives Provide support to the local communities
Estimated Beneficiaries: Overall some 200 people will receive shelter if required to be relocated during emergencies
Environmental Category: ADB category C: No significant impacts as the project is to improve existing facilities;
Land Requirement: None Climate change adaptation needs:
EMC need to be adequate protection against high wind gusts during cyclone events, high intensity rainfall, and sea surges
Project Cost Estimate: Capital Cost Estimate: $390,000. Note: estimate of incremental cost of climate change adaptation works included in capital cost above is $0)
Operating Costs: $10,000 per annum (total 2 EMCs) Maintenance costs: $8,000 (total 2 EMCs)
Implementation options: Work can be done by public or private sector Operation and maintenance could be outsourced to private sector or done Island Administration
Profile Created: 1 October 2006 Current Version: 1 October 2006

Appendix 5 221
Project Tracking
Last updated: 10 October 2006 Project Preparation Status Project Identification: Project was identified by the MWH assessment team in 2004. Stakeholder Consultations:
Completed during site visit in 2004
Feasibility Study: Not required Engineering Design: Completed by MWH Land Acquisition: Not needed Environmental Assessment:
Not needed
Procurement: Not started Construction: Not started
Project Implementation Status Funding Source: NZAID Implementation Arrangements:
Not determined yet but primary responsibility for coordination / execution may be given to the PDU*
Contracting Method: Conventional tender through local competitive bidding to MFEM guidelines. Contract administration and construction supervision by implementing agency
O&M Responsibility: Island Council Risk assessment: Inclement weather – construction program to consider cyclone
season Construction delays – employ suitably qualified and experienced
contractors Operation and maintenance not done properly due to funds shortage
– ensure adequate provisions allocated under annual budgets Implementation schedule: Fiscal Year 2006/2007 Current Status: Awaiting decision by Government and NZAID
*New PDU yet to be established. Presently such work is carried out by AMD.

222 Appendix 5
Project Profile
Project ID: EMW04NGI Sector: Emergency Management Name: Evacuation management centres Island: Pukapuka, Penrhyn, Rakahanga, Nassau, Palmerston Location: Background/Rationale: There is a need to build evacuation management centres on these
islands to provide shelter for evacuees during emergency caused by disaster. There are currently no appropriate facilities on these islands.
Objective: To provide shelters for people during periods of emergency evacuations Scope of Works: Design and construction of EMCs on these islands. Each EMC will have
standby power supply, own water supply, sanitation facilities, communal and basic accommodation, communication equipment, storage for emergency food and medical supplies.
Features: Provide shelter for relocating people during disaster related emergencies (meet minimum level of service)
Project will reduce operating and maintenance costs Prevent the loss of lives Provide support to the local communities – building can be used for
multiple purposes Estimated Beneficiaries: Overall some 1,300 people will receive shelter if required to be relocated Environmental Category: ADB category C:
To be confirmed by the feasibility study Land Requirement: To be confirmed Climate change adaptation needs:
EMC need to be adequate protection against high wind gusts during cyclone events, high intensity rainfall, and sea surges
Project Cost Estimate: Capital Cost Estimate: $6,070,000. Note: estimate of incremental cost of climate change adaptation works included in capital cost above is $290,000)
Operating Costs: $25,000 per annum (total 5 EMCs) Maintenance costs: $40,000 (total 5 EMCs)
Implementation options: Work can be done by public or private sector Operation and maintenance could be outsourced to private sector or done by Island Administrations
Profile Created: 1 October 2006 Current Version: 1 October 2006

Appendix 5 223
Project Tracking
Last updated: 10 October 2006 Project Preparation Status Project Identification: Project was identified during island visit in 2006 and consultations with
NDMO Stakeholder Consultations:
Consultation with Island Council required to confirm project
Feasibility Study: Required to confirm scope of project Engineering Design: Feasibility study will confirm design parameters Land Acquisition: To be sourced Environmental Assessment:
To be confirmed by feasibility study
Procurement: Not started Construction: Not started
Project Implementation Status Funding Source: CIGov and aid donor agencies Implementation Arrangements:
Not yet determined but may be primary responsibility for coordination/execution may be given to the PDU*
Contracting Method: Conventional tender through local competitive bidding to MFEM guidelines. Contract administration and construction supervision by implementing agency
O&M Responsibility: Island Council Risk assessment: Inclement weather – construction program to consider cyclone
season Construction delays – employ suitably qualified and experienced
contractors Operation constraints due to funds shortage – ensure adequate
provisions allocated under annual budgets Maintenance not done properly due to funds shortage – ensure
adequate provisions allocated under annual budgets Implementation schedule: Fiscal Year 2007/2008 to 2009/2010 Current Status: Awaiting decision by Government and potential aid donors
*New PDU yet to be established. Presently such work is carried out by AMD.


Appendix 6 1
I. MULTI CRITERIA PRIORITIZATION PROCESS
1. The multi criteria prioritization process is a tool that can be used to rank projects within sectors. The objective of this tool is “to enable quick prioritization of projects in the “absence” of a detailed national economic policy being in place.” However in saying this, it is not a substitute for objective assessment, and it is not a project feasibility evaluation tool.
2. A narrative for the project prioritization tool has been developed to assist with scoring and ranking of projects within each sector. This must accompany the scoring sheets and project profiles for ease of understanding. The narrative is detailed below.
A. Project Prioritization Tool – Scoring and Ranking Methodology
1. Sub-criterion Scoring 3. The sub-criterion score is assigned by each member of the focal group. Except for Criterion 1 for which each sub-criterion is assigned a 1 or 0 (yes or no), each sub-criterion is to be given a score of 1 to 4 as follows:
1 Low score as project does not contribute to satisfying the criterion 2 Below average contribution to meeting the criteria 3 Above average contribution to meeting the criteria 4 High score as project makes a strong contribution to satisfying the criteria
2. Criterion Aggregate Score1
4. The criterion aggregate score is calculated automatically in the spreadsheet. A criterion aggregate score is derived based on the sum of the scores for each sub-criterion. The process is as follows:
1 Low score if the sum of the sub-criteria scores is in the bottom third of
possible total score for the criterion 2 Average score if the sum of the sub-criteria scores is in the middle third of
possible total score for the criterion 3 High score if the sum of the sub-criteria scores is in the top third of
possible total score for the criterion
3. Policy Factor
5. This is a factor to be set by Cabinet-level decision makers who assign priorities based on national policies. The factor can change the aggregate score of a project and, therefore, its relative priority against other projects, through assigning a different policy 1 The derived values from 2 to 5 would not be made visible to the focal group members during the project evaluation and scoring process. However, at completion of the task, the results of the scoring will be generated by the spreadsheet and will be made available to all members of the focal group to confirm final rankings

2 Appendix 6
factor for each criterion depending on the relative priority of economic, social, environmental and private sector involvement policies that the government seeks to achieve. As such, the factor is not intended for use by public officials. As the default, all of the policy factors are set at a value of 1.0, meaning equal weighting.
4. Project Rating
6. The project priority rating is derived as the sum of the criteria aggregate score times the policy factor. This value is calculated automatically in the spreadsheet.
5. Priority Rank
7. Once the project priority score has been calculated, the projects are sorted according to their priority ratings and assigned a priority rank. This value is calculated automatically in the spreadsheet.
6. Special Conditions Adjustment Factor
8. A factor has been included to enable the ranking of a project to be changed due to special conditions such as immediate priority for national disaster response works. The effect of the factor is to re-rank the projects. The factor is set at 0 and is intended for use only on the instructions of the Cabinet.
7. National Project Prioritization Tool Criteria For Ranking Projects
9. Another narrative for the national project prioritization tool has also been developed for this Master Plan. The factors identified as critical to the national interest include:
National Interest Factors
Assessment considered in terms of contribution to
I Economic national economic growth
II Social social harmony
III Environmental protecting or improving the environment
IV Private sector private sector development
V General meeting the NSDP
10. Seven questions have been adopted to assist with the evaluation of projects from a ‘national interest’ point of view. These are detailed in Table A6 1.
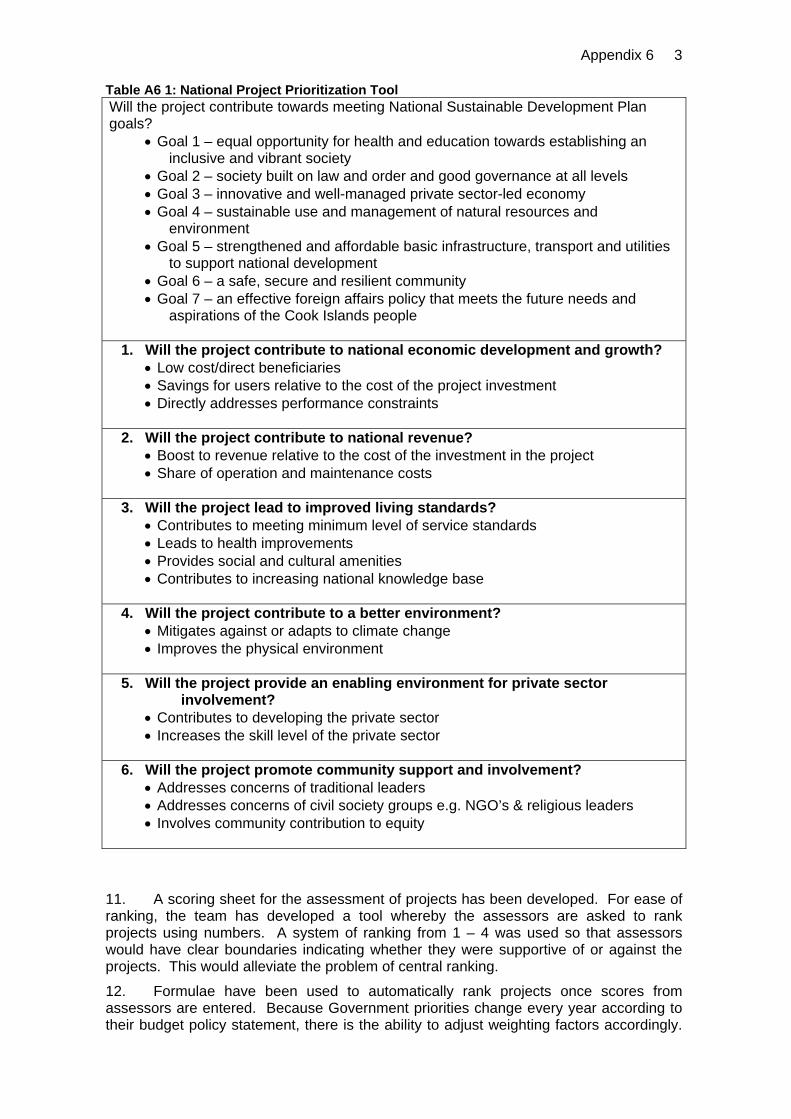
Appendix 6 3
Table A6 1: National Project Prioritization Tool Will the project contribute towards meeting National Sustainable Development Plan goals?
• Goal 1 – equal opportunity for health and education towards establishing an inclusive and vibrant society
• Goal 2 – society built on law and order and good governance at all levels • Goal 3 – innovative and well-managed private sector-led economy • Goal 4 – sustainable use and management of natural resources and
environment • Goal 5 – strengthened and affordable basic infrastructure, transport and utilities
to support national development • Goal 6 – a safe, secure and resilient community • Goal 7 – an effective foreign affairs policy that meets the future needs and
aspirations of the Cook Islands people
1. Will the project contribute to national economic development and growth? • Low cost/direct beneficiaries • Savings for users relative to the cost of the project investment • Directly addresses performance constraints
2. Will the project contribute to national revenue?
• Boost to revenue relative to the cost of the investment in the project • Share of operation and maintenance costs
3. Will the project lead to improved living standards?
• Contributes to meeting minimum level of service standards • Leads to health improvements • Provides social and cultural amenities • Contributes to increasing national knowledge base
4. Will the project contribute to a better environment?
• Mitigates against or adapts to climate change • Improves the physical environment
5. Will the project provide an enabling environment for private sector
involvement? • Contributes to developing the private sector • Increases the skill level of the private sector
6. Will the project promote community support and involvement?
• Addresses concerns of traditional leaders • Addresses concerns of civil society groups e.g. NGO’s & religious leaders • Involves community contribution to equity
11. A scoring sheet for the assessment of projects has been developed. For ease of ranking, the team has developed a tool whereby the assessors are asked to rank projects using numbers. A system of ranking from 1 – 4 was used so that assessors would have clear boundaries indicating whether they were supportive of or against the projects. This would alleviate the problem of central ranking.
12. Formulae have been used to automatically rank projects once scores from assessors are entered. Because Government priorities change every year according to their budget policy statement, there is the ability to adjust weighting factors accordingly.

4 Appendix 6
Should Government wish to focus on social or economic factors, the policy factor within the criterion can be increased to show that it is of high priority. There is also a special adjustment factor that alters the ranking of a project due to unforeseen circumstances, e.g. cyclones. The scoring form used for this process is shown in Table A6 2.

Appendix 6 5
Table A6 2: Score Sheet for National Project Prioritization Tool
NATIONAL PROJECT PRIORITIZATION TOOL PROJECT PRIORITIZATION PERIOD: FY2007/08 TO FY 2014/15
Project Name: Project Cost Estimate:
Criterion (sub-criterion) Assigned Score
Criterion Aggregate
Score
Policy Factor
Project Rating
Project Priority Rank
(1-4) (1, 2 or 3)
1 Will the project contribute towards meeting NSDP goals?
Yes/No write 1 or 0
1 1.0 1.0
Goal 1 - equal health and education opportunities
Goal 2 - promotes good governance, law and order
Goal 3 - promotes private-led economy Goal 4 - sustainable use of natural
resources, environment
Goal 5 - strengthened and affordable infrastructure
Goal 6 - safe, secure and resilient community
Goal 7 - effective foreign affairs policy Subtotal assigned score 0
2 Will the project contribute to national economic development and growth?
give score 1 to 4
1 1.0 1.0
low cost/direct beneficiaries savings for users/ project investment directly addresses performance
constraints
Subtotal assigned score 0
3 Will the project contribute to national revenue?
1 1.0 1.0
boost to revenue/project capital investment
share of O&M costs Subtotal assigned score 0
4 Will the project lead to improved living standards?
1 1.0 1.0
contributes to meeting minimum level of service
leads to health improvements provides social and cultural amenities contributes to national knowledge base Subtotal assigned score 0
5 Will the project contribute to a better environment?
1 1.0 1.0
mitigates against or adapts to climate change

6 Appendix 6
NATIONAL PROJECT PRIORITIZATION TOOL PROJECT PRIORITIZATION PERIOD: FY2007/08 TO FY 2014/15
Project Name: Project Cost Estimate:
Criterion (sub-criterion) Assigned Score
Criterion Aggregate
Score
Policy Factor
Project Rating
Project Priority Rank
(1-4) (1, 2 or 3)
improves the physical environment Subtotal assigned score 0
6 Will the project provide an enabling environment for private sector involvement?
1 1.0 1.0
contributes to developing the private sector
increases the skill level of the private sector
Subtotal assigned score 0
7 Will the project promote community support and involvement?
1 1.0 1.0
addresses concerns of traditional leaders addresses concerns of civil society
groups
involves community contribution to equity Subtotal assigned score 0 Special conditions adjustment factor OVERALL PROJECT SCORE 7.0 1

Appendix 7 1
I. TEST RESULTS FOR PROJECT PRIORITIZATION TOOL
A. Testing of Project Prioritization Tool by ADB Infrastructure Master Plan Team
1. The multi-criteria prioritization process was first tested in-house by the ADB Infrastructure Master Plan team. This was to determine whether there were any flaws in the ranking tool and, before giving them to the focal group, whether assessors would be able to understand the scoring sheets. The results are summarized in Table A7 1.
B. Testing of Project Prioritization Tool by Focal Group
2. A focal group was then chosen to carry out a similar exercise to that of the ADB Infrastructure Master Plan team, but was limited to looking only at projects in the time frame of 1 to 5 years. (It is noted that the Master Plan also includes projects for which donor funds have been committed but which have not been implemented. These projects were not ranked by the focal group.) It is imperative that the focal group represents a cross section of stakeholders within the sectors. This group should be of a high level and include individuals that have the ability to make decisions within their sector. The focal group should also consist of individuals from within both the private sector and the wider community to provide a social balance within the group. Results are summarized in Table A7 1.

2 Appendix 7
Table A7 1: Results of test of Project Prioritization Process Tool by ADB Infrastructure Master Plan Team
Project Name Est. Cost Collective Results Total AVG Rate Rank Rate Rank Rate Rank Rate Rank Rate Rank Rate Rank Rate Rank Rate Rank
1
SNW01RAR Construction of Rarotonga village sewerage networks – Stage 1
3,000,000 15 1 15 2 7 1 17 1 16 1 14 6 15 1 14.1 1
2
SNW02RAR Rarotonga village sewerage schemes – Stage 2
2,000,000 11 19 15 2 7 1 17 1 16 1 14 6 15 1 13.6 2
3
SNW06AIT Construction of Aitutaki village sewerage networks
1,500,000 14 2 9 51 7 1 16 7 15 3 14 6 15 1 12.9 3
4
WSW01RAR Rarotonga distribution network rehabilitation
3,000,000 13 6 15 2 7 1 16 7 10 60 13 11 15 1 12.7 4
5
SNW12NGI Construction of septage treatment facilities on each of the northern islands
170,000 11 19 12 28 7 1 17 1 15 3 14 6 12 21 12.6 5
6
WSW04RAR Supply and installation of property connection meters on Rarotonga
1,200,000 14 2 16 1 7 1 15 11 14 7 7 58 14 8 12.4 6

Appendix 7 3
Project Name Est. Cost Collective Results Total AVG Rate Rank Rate Rank Rate Rank Rate Rank Rate Rank Rate Rank Rate Rank Rate Rank
7
SNW03RAR Rehabilitation of Tereora/Tepuka neighborhood sewerage system
300,000 11 19 7 52 7 1 15 11 14 7 16 2 15 1 12.1 7
8
SNW05RAR Improvement of effluent disposal systems in foreshore areas of Rarotonga
- 11 19 12 28 7 1 17 1 14 7 11 30 13 13 12.1 7
9
EMW04NGI - Construct and furnish new evacuation management centres on northern islands
6,070,000 9 38 14 10 7 1 13 21 15 3 12 19 14 8 12.0 9
10
RTW06NAT Outer Islands Road Improvement Program
2,400,000 14 2 15 2 7 1 13 21 12 30 11 30 11 32 11.9 10
11
RTW01RAR Rarotonga Road Safety Program
850,000 11 19 15 2 7 1 10 56 13 17 11 30 14 8 11.6 11
12
SNW08SGI Review adequacy and upgrade sanitation facilities at EMC on southern islands
250,000 13 6 11 41 7 1 13 21 14 7 12 19 11 32 11.6 11
13
ENW09AIU Atiu electricity supply distribution system upgrade
- 13 6 13 17 7 1 13 21 11 49 13 11 9 52 11.3 13

4 Appendix 7
Project Name Est. Cost Collective Results Total AVG Rate Rank Rate Rank Rate Rank Rate Rank Rate Rank Rate Rank Rate Rank Rate Rank
14
MFW05NGI - Construct Northern Group regional facility for repair of plant and machinery
200,000 7 42 14 10 7 1 12 35 13 17 16 2 10 41 11.3 13
15
EMW02SGI - Modify and refurbish existing facilities on southern islands
1,725,000 11 19 14 10 7 1 12 35 13 17 12 19 10 41 11.3 13
16
EMW03MHX - Complete repair works on Manihiki facilities
390,000 11 19 13 17 7 1 12 35 13 17 12 19 10 41 11.1 16
17 ATW01AIU Atiu Airport Improvement
750,000 11 19 12 28 7 1 12 35 13 17 11 30 11 32 11.0 17
18 ATW05MHX Manihiki Airport Improvement
750,000 10 31 14 10 7 1 7 64 14 7 10 40 15 1 11.0 17
19
WSW03RAR Construction of Rarotonga water treatment facilities
7,100,000 7 42 15 2 7 1 14 13 14 7 13 11 7 57 11.0 17
20 ATW04MOI Mitiaro Airport Improvement
750,000 11 19 12 28 7 1 13 21 11 49 10 40 12 21 10.9 20
21 MTW01AIU Atiu Harbour Repairs
160,000 10 31 13 17 7 1 13 21 10 60 11 30 12 21 10.9 20
22
MTW03MUK Mauke Harbour Reconstruction
1,800,000 12 9 13 17 7 1 11 45 11 49 10 40 12 21 10.9 20
23
MTW10RAR Avatiu Harbour Western Basin Development Completion
3,000,000 14 2 13 17 7 1 10 56 10 60 8 55 14 8 10.9 20

Appendix 7 5
Project Name Est. Cost Collective Results Total AVG Rate Rank Rate Rank Rate Rank Rate Rank Rate Rank Rate Rank Rate Rank Rate Rank
24 ATW02MGS Mangaia Airport Improvement
5,000,000 12 9 12 28 7 1 11 45 13 17 7 58 13 13 10.7 24
25
ATW09RAR Rarotonga Airport Cyclone Protection Works
5,000,000 7 42 12 28 7 1 12 35 12 30 12 19 13 13 10.7 24
26
SNW09SGI Construction of septage treatment facilities on each of the southern islands
135,000 12 9 7 52 7 1 17 1 7 70 13 11 12 21 10.7 24
27
ATW07PZK Pukapuka Airport Improvement
750,000 11 19 14 10 7 1 12 35 11 49 10 40 9 52 10.6 27
28
ATW08RAR Rarotonga Airport Passenger Terminal Improvement
3,500,000 9 38 12 28 7 1 11 45 13 17 10 40 12 21 10.6 27
29
MTW08PZK Pukapuka Jetty Development
270,000 7 42 11 41 7 1 13 21 10 60 17 1 9 52 10.6 27
30
WSW08SGI Southern Islands water supply headworks pumps refurbishment
150,000 12 9 15 2 7 1 13 21 10 60 7 58 10 41 10.6 27
31
ATW10AIT Aitutaki Airport Improvement for International Operations
12,000,000 12 9 11 41 7 1 11 45 13 17 8 55 11 32 10.4 31
32
MTW04MOI Mitiaro Harbour Reconstruction
2,500,000 7 42 13 17 7 1 12 35 10 60 12 19 12 21 10.4 31

6 Appendix 7
Project Name Est. Cost Collective Results Total AVG Rate Rank Rate Rank Rate Rank Rate Rank Rate Rank Rate Rank Rate Rank Rate Rank
33
MTW09RAK Rakahanga Harbour Improvement
30,000 11 19 14 10 7 1 9 61 15 3 7 58 10 41 10.4 31
34
MTW12RAR Avatiu Harbour Waterfront Development
1,500,000 10 31 12 28 7 1 11 45 13 17 10 40 10 41 10.4 31
35 MTW15AIT Aitutaki Harbour Development
5,000,000 8 40 11 41 7 1 12 35 12 30 10 40 13 13 10.4 31
36
MFW03SGI - Build new facilities and supply tools for Aitutaki, Atiu and Mauke
560,000 12 9 11 41 7 1 11 45 12 30 12 19 8 55 10.4 31
37
MFW04NGI - Build new facilities and supply tools Rakahanga, Palmerston and Nassau
490,000 11 19 11 41 7 1 10 56 12 30 12 19 10 41 10.4 31
38
EMW01RAR - Refurbish existing facilities on Rarotonga
940,000 7 42 12 28 7 1 13 21 12 30 12 19 10 41 10.4 31
39
MTW02MGS Mangaia Harbour Reconstruction
2,200,000 10 31 13 17 7 1 13 21 7 70 9 51 13 13 10.3 39
40
MTW07PYE Penrhyn Harbour Rehabilitation
920,000 7 42 15 2 7 1 7 64 13 17 11 30 12 21 10.3 39
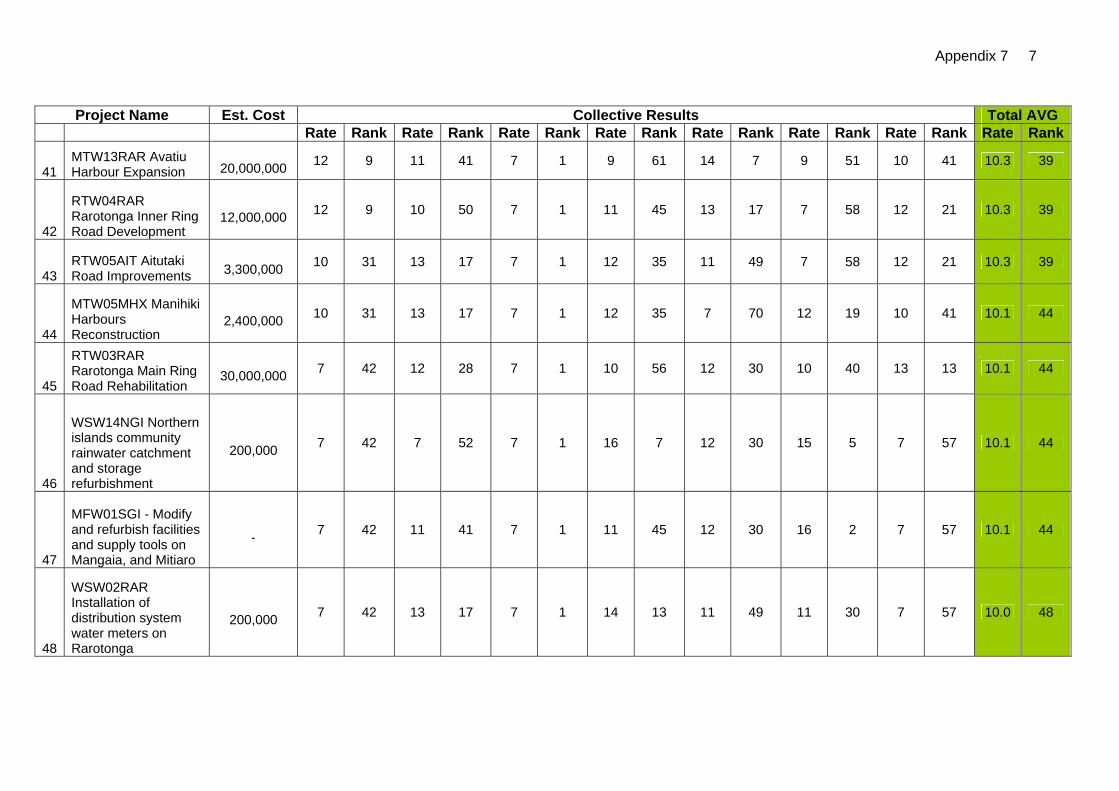
Appendix 7 7
Project Name Est. Cost Collective Results Total AVG Rate Rank Rate Rank Rate Rank Rate Rank Rate Rank Rate Rank Rate Rank Rate Rank
41 MTW13RAR Avatiu Harbour Expansion
20,000,000 12 9 11 41 7 1 9 61 14 7 9 51 10 41 10.3 39
42
RTW04RAR Rarotonga Inner Ring Road Development
12,000,000 12 9 10 50 7 1 11 45 13 17 7 58 12 21 10.3 39
43 RTW05AIT Aitutaki Road Improvements
3,300,000 10 31 13 17 7 1 12 35 11 49 7 58 12 21 10.3 39
44
MTW05MHX Manihiki Harbours Reconstruction
2,400,000 10 31 13 17 7 1 12 35 7 70 12 19 10 41 10.1 44
45
RTW03RAR Rarotonga Main Ring Road Rehabilitation
30,000,000 7 42 12 28 7 1 10 56 12 30 10 40 13 13 10.1 44
46
WSW14NGI Northern islands community rainwater catchment and storage refurbishment
200,000 7 42 7 52 7 1 16 7 12 30 15 5 7 57 10.1 44
47
MFW01SGI - Modify and refurbish facilities and supply tools on Mangaia, and Mitiaro
- 7 42 11 41 7 1 11 45 12 30 16 2 7 57 10.1 44
48
WSW02RAR Installation of distribution system water meters on Rarotonga
200,000 7 42 13 17 7 1 14 13 11 49 11 30 7 57 10.0 48

8 Appendix 7
Project Name Est. Cost Collective Results Total AVG Rate Rank Rate Rank Rate Rank Rate Rank Rate Rank Rate Rank Rate Rank Rate Rank
49
SNW10NGI Review adequacy and upgrade sanitation facilities at EMC on northern islands
230,000 10 31 7 52 7 1 14 13 7 70 14 6 11 32 10.0 48
50
MTW11RAR Avatiu Container Facilities Development
3,500,000 7 42 13 17 7 1 10 56 11 49 8 55 12 21 9.7 50
51
WSW11SGI Construction of disinfection facilities on the southern islands
200,000 7 42 7 52 7 1 14 13 13 17 13 11 7 57 9.7 50
52
ENW16RAR Construction of second Rarotonga power station
- 7 42 14 10 7 1 13 21 7 70 13 11 7 57 9.7 50
53
MTW14RAR Rarotonga North Coast Protection
135,000,000 7 42 12 28 7 1 13 21 10 60 11 30 7 57 9.6 53
54
RTW02RAR Rarotonga Traffic Management Improvements
280,000 8 40 12 28 7 1 9 61 11 49 9 51 11 32 9.6 53
55
WSW09AIT Construction of Aitutaki water treatment plants
1,500,000 7 42 7 52 7 1 14 13 12 30 13 11 7 57 9.6 53
56
WSW15NGI Supply and installation of household rainwater systems for the northern islands
1,200,000 7 42 7 52 7 1 14 13 12 30 13 11 7 57 9.6 53

Appendix 7 9
Project Name Est. Cost Collective Results Total AVG Rate Rank Rate Rank Rate Rank Rate Rank Rate Rank Rate Rank Rate Rank Rate Rank
57 ATW03MUK Mauke Airport Improvement
750,000 12 9 12 28 7 1 7 64 11 49 7 58 10 41 9.4 57
58
WSW13NGI Northern islands EMC water storages rehabilitation or construction
100,000 7 42 7 52 7 1 16 7 11 49 11 30 7 57 9.4 57
59
MFW02NGI - Modify and refurbish facilities on Penrhyn and Pukapuka
255,000 7 42 11 41 7 1 11 45 12 30 10 40 8 55 9.4 57
60
WSW05RAR Rarotonga water loss reduction program
500,000 7 42 7 52 7 1 17 1 10 60 9 51 7 57 9.1 60
61
WSW06SGI Southern islands EMC water storages rehabilitation reconstruction
100,000 7 42 7 52 7 1 14 13 10 60 12 19 7 57 9.1 60
62
WSW10SGI Installation of water meters in distribution systems on the southern islands
100,000 7 42 7 52 7 1 14 13 12 30 10 40 7 57 9.1 60
63 ATW06PYE Penrhyn Airport Improvement
750,000 7 42 7 52 7 1 11 45 13 17 7 58 11 32 9.0 64
64
WSW07AIT Aitutaki water supply headworks upgrade
350,000 7 42 7 52 7 1 13 21 11 49 11 30 7 57 9.0 64

10 Appendix 7
Project Name Est. Cost Collective Results Total AVG Rate Rank Rate Rank Rate Rank Rate Rank Rate Rank Rate Rank Rate Rank Rate Rank
65 MTW06NAS Nassau Harbour Development
330,000 12 9 7 52 7 1 11 45 7 70 7 58 11 32 8.9 67
66
WSW12SGI Installation of property service meters on the southern islands
500,000 7 42 7 52 7 1 13 21 10 60 10 40 7 57 8.7 68
67
WSW17MGS Mangaia water supply distribution system upgrade
- 7 42 7 52 7 1 7 64 12 30 7 58 7 57 7.7 72
68
WSW18AIU Atiu water supply system upgrade
- 7 42 7 52 7 1 7 64 12 30 7 58 7 57 7.7 72
69
WSW19MUK Mauke water supply distribution system upgrade
- 7 42 7 52 7 1 7 64 12 30 7 58 7 57 7.7 72
70
WSW20MOI Mitiaro water supply system upgrade
- 7 42 7 52 7 1 7 64 12 30 7 58 7 57 7.7 72
71
SWW01RAR Construction of Rarotonga solid waste transfer station
500,000 7 42 7 52 7 1 7 64 14 7 7 58 15 1 9.1 60
72
SWW02RAR Rarotonga hazardous waste handling facilities upgrade
500,000 7 42 7 52 7 1 7 64 14 7 7 58 14 8 9.0 64

Appendix 7 11
Project Name Est. Cost Collective Results Total AVG Rate Rank Rate Rank Rate Rank Rate Rank Rate Rank Rate Rank Rate Rank Rate Rank
73
SWW03RAR Construction of Rarotonga compost facilities
500,000 7 42 7 52 7 1 7 64 14 7 7 58 11 32 8.6 69
74
SWW04NAT Outer islands hazardous waste collection service
- 7 42 7 52 7 1 7 64 7 70 7 58 7 57 7.0 76
75
SWW05SGI Construction of new landfill sites on each of the southern islands
600,000 7 42 7 52 7 1 7 64 12 30 7 58 13 13 8.6 69
76
SWW06SGI Construction of compost facilities on southern islands
- 7 42 7 52 7 1 7 64 7 70 7 58 7 57 7.0 76
77
SWW08NGI Construction of compost facilities on northern islands
- 7 42 7 52 7 1 7 64 7 70 7 58 7 57 7.0 76
78
SWW09NGI Construction of new landfill sites on each of the northern islands
800,000 7 42 7 52 7 1 7 64 12 30 7 58 13 13 8.6 69
79
ENW02PYE Exchange of Penrhyn generators
- 7 42 7 52 7 1 7 64 7 70 7 58 7 57 7.0 76

12 Appendix 7
Project Name Est. Cost Collective Results Total AVG Rate Rank Rate Rank Rate Rank Rate Rank Rate Rank Rate Rank Rate Rank Rate Rank
80
ENW03NAT Outer islands electrical wiring standardisation program
- 7 42 7 52 7 1 7 64 7 70 7 58 7 57 7.0 76
81
ENW04PZK Pukapuka electricity supply upgrade
- 7 42 7 52 7 1 7 64 7 70 7 58 7 57 7.0 76
82
ENW05SGI Southern islands electricity supply systems rehabilitation program
- 7 42 7 52 7 1 7 64 7 70 7 58 7 57 7.0 76
83
ENW06NGI Northern islands electricity supply systems rehabilitation program
- 7 42 7 52 7 1 7 64 7 70 7 58 7 57 7.0 76
84
ENW07NGI Electricity supply system upgrades on Manihiki and Rakahanga
- 7 42 7 52 7 1 7 64 7 70 7 58 7 57 7.0 76
85
ENW08MGS Mangaia electricity supply system upgrade
- 7 42 7 52 7 1 7 64 7 70 7 58 7 57 7.0 76
86
ENW32AIT Aitutaki high voltage electricity supply distribution system upgrade
- 7 42 7 52 7 1 7 64 7 70 7 58 7 57 7.0 76

Appendix 7 13
Table A7 2: Results of test of Project Prioritization Process Tool by Focal Group
Collective Results Total AVG Project Name Est.
Cost
Rate Rank Rate Rank Rate Rank Rate Rank Rate Rank Rate Rank Rate Rank
1 SWW02RAR Rarotonga hazardous waste handling facilities upgrade
500,000 14 6 14 1 16 1 13 3 13 1 15 1 14.2 1
2 SWW01RAR Construction of Rarotonga solid waste transfer station
550,000 14 6 14 1 16 1 12 9 13 1 15 1 14.0 2
3 SNW01RAR Construction of Rarotonga village sewerage networks – Stage 1
3,000,000 16 1 12 4 15 5 13 3 11 4 15 1 13.7 3
4 SNW03RAR Rehabilitation of Tereora/Tepuka neighborhood sewerage system
300,000 16 1 12 4 16 1 13 3 9 13 14 9 13.3 4
5 RTW01RAR Rarotonga Road Safety Program
850,000 12 17 11 9 15 5 15 1 9 13 15 1 12.8 5
6 MTW07PYE Penrhyn Harbour Rehabilitation
920,000 13 10 13 3 11 16 13 3 10 9 15 1 12.5 6
7 EMW04NGI - Construct and furnish new evacuation management centres on northern islands
6,070,000 15 3 11 9 13 8 12 9 9 13 15 1 12.5 6
8 MTW10RAR Avatiu Harbour Western Basin Development Completion
3,000,000 12 17 12 4 13 8 11 15 12 3 14 9 12.3 8

14 Appendix 7
Collective Results Total AVG Project Name Est.
Cost
Rate Rank Rate Rank Rate Rank Rate Rank Rate Rank Rate Rank Rate Rank
9 EMW03MHX - Complete repair works on Manihiki facilities
390,000 13 10 11 9 13 8 12 9 9 13 15 1 12.2 9
10 RTW02RAR Rarotonga Traffic Management Improvements
280,000 12 17 8 15 13 8 14 2 10 9 15 1 12.0 10
11 WSW02RAR Installation of distribution system water meters on Rarotonga
200,000 11 23 10 12 13 8 13 3 11 4 13 18 11.8 11
12 WSW17MGS Mangaia water supply distribution system upgrade
1,890,000 15 3 7 22 13 8 12 9 9 13 14 9 11.7 12
13 WSW19MUK Mauke water supply distribution system upgrade
1,180,000 15 3 7 22 13 8 12 9 9 13 14 9 11.7 12
14 ENW03NAT Outer islands electrical wiring standardisation program
50,000 12 17 10 12 13 8 10 24 11 4 14 9 11.7 12
15 ENW04PZK Pukapuka electricity supply upgrade
2,500,000 14 6 7 22 16 1 11 15 11 4 11 23 11.7 12
16 ENW09AIU Atiu electricity supply distribution system upgrade
750,000 14 6 7 22 15 5 11 15 10 9 11 23 11.3 16
17 ATW08RAR Rarotonga Airport Passenger Terminal Improvement
3,500,000 12 17 8 15 11 16 13 3 10 9 13 18 11.2 17

Appendix 7 15
Collective Results Total AVG Project Name Est.
Cost
Rate Rank Rate Rank Rate Rank Rate Rank Rate Rank Rate Rank Rate Rank
18 ENW02PYE Exchange of Penrhyn generators
30,000 10 24 9 14 10 18 12 9 11 4 13 18 10.8 18
19 RTW06NAT Outer Islands Road Improvement Program
2,400,000 12 17 12 4 9 24 11 15 8 20 12 22 10.7 19
20 MFW01SGI - Modify and refurbish facilities and supply tools on Mangaia, and Mitiaro
255,000 13 10 8 15 10 18 11 15 8 20 14 9 10.7 19
21 MFW02NGI - Modify and refurbish facilities on Penrhyn and Pukapuka
255,000 13 10 8 15 10 18 11 15 8 20 14 9 10.7 19
22 MFW03SGI - Build new facilities and supply tools for Aitutaki, Atiu and Mauke
560,000 13 10 8 15 10 18 11 15 8 20 14 9 10.7 19
23 MFW05NGI - Construct Northern Group regional facility for repair of plant and machinery
200,000 13 10 8 15 10 18 11 15 8 20 14 9 10.7 19
24 MFW04NGI - Build new facilities and supply tools Rakahanga, Palmerston and Nassau
490,000 13 10 8 15 10 18 11 15 8 20 13 18 10.5 24
25 RTW05AIT Aitutaki Road Improvements 3,300,000 10 24 12 4 7 25 10 24 9 13 10 25 9.7 25

16 Appendix 7
II. SIGNIFICANCE OF RESULTS
3. It is obvious from the results of both the team and the focal group ranking exercises that the sectors of sanitation, water and solid waste were of high priority. It shows that the environment is vital to the development of the Cook Islands, as well as the basic necessity of ensuring a reliable and clean water supply.
4. During their discussions, the focal group commented that they thought the upgrade of the Rarotonga airport would have also been of high priority, considering tourism is the major economic activity of the Cook Islands. This is where the policy factors within the criterions could be adjusted to reflect these circumstances by, for example, altering the economic criterion policy factor.
5. There is a need for an ‘overview’ check on the prioritization process to ensure that the tool is robust enough to withstand all conditions. There is also a need to qualify the results to ensure that the ranking of projects are, in actual fact, reflective of the priorities of Government and the people of the Cook Islands and are in accordance with national policies.
III. CONCLUSION
6. Although only ten sectors have been identified in this Master Plan report, there is room to incorporate other areas, e.g. Government Buildings, Agriculture, Health and Education. The Terms of Reference for this project did not consider other sectors within this Master Plan but the team has ensured that these sectors and others could be included in the future as a part of overall infrastructure planning for the Cook Islands.
7. Again emphasis must be put on the development of the project profiles. They must be simple, clear, concise and easy to understand. If this is achieved, those assessing the projects will be able to rank the projects without any problems.

Appendix 8 1
I. INTRODUCTION
1. This appendix includes listings of stakeholders consulted throughout the duration of the project along with various summaries and reports of stakeholder meetings held by the team with various sector groups in Rarotonga and the Outer Islands. Information relevant to the development of the Master Plan was collated through these consultation summaries and a comprehensive review of existing literature. This process allowed for a holistic view of each sector to be obtained and helped to ensure that, as far as possible, the master plan encompasses all information received.
II. INITIAL CONSULTATIONS
2. Initial consultations were carried out with various stakeholders. Government Ministers and Members of Parliament were included at this stage to gain acceptance of the Master Plan from the beginning of the project.
3. A list of the stakeholders met at the initial consultation is included in Summary No. 1.
III. STAKEHOLDER WORKSHOPS & SECTOR MEETINGS
4. Three workshops were held for stakeholders. The first was to present the Project’s Inception report; the second to present the Mid-term report; and the final presentation was to deliver the Project Priority List. Workshop participants included a cross-section of stakeholders from various sectors and community groups. 5. In conjunction with these workshops, consultants from within the Master Plan team held individual meetings with various key people in agencies & ministries to collect information for the Master Plan. 6. There was great participation by stakeholders at all three workshops and at sector meetings. Lists of participants at the three workshops are included in summary No. 2.
IV. PRIVATE SECTOR CONSULTATION
7. The private sector plays a major role in the Cook Islands. Meetings were therefore held with various business people and the Chamber of Commerce to seek opinions on which infrastructure services could be best delivered by the private sector enabling Government to focus their attention on other areas, e.g. Health and Education. 8. There have been suggestions that some sectors could be privatized. However, there is a need to explore this option before Government makes a final decision on the issue. In this instance, a feasibility study would need to be carried out. 9. The team met with individuals in the private sector, and an overall meeting was held with the Chamber of Commerce to seek their views with regards to the Master Plan. Summary No. 3 provides a summary of this meeting.

2 Appendix 8
IV. OUTER ISLANDS VISITS & CONSULTATION 10. Major emphasis was placed on including the Outer Islands within the scope of the project. Visits were therefore made to all islands except for Palmerston and Nassau (due to transportation problems). 11. However, for Palmerston, the team was able to hold discussions with the Island Secretary and other residents who were visiting the main island of Rarotonga. This enabled the team to capture the relevant information for Palmerston Island to be included into the Master Plan. The Island Secretary of Pukapuka is also responsible for Nassau Island. Relevant information was therefore able to be collected during the consultants visit to the Northern Group Islands in August 2006. 12. A list of people consulted on all islands is found in summary No. 4. Field visit reports are attached as summary No. 5.
V. COMMUNITY CONSULTATION 13. Community consultations were carried out both on Rarotonga and in the Outer Islands. The public were invited to come and express their views with regards to the infrastructure of the Cook Islands. These proved very useful and helped to build public acceptance of the document by ensuring that community members felt they had been included in the process of development of this Master Plan.
14. Non-Government Organisations were also consulted contributing to a broad spectrum of stakeholder opinions canvassed during the Master Plan’s development. In particular, the Red Cross Society showed interest in relation to road safety and evacuation management centres.
VI. CONCLUSION 15. A table of Proposed Minimum Levels of Service is included as summary No. 6. 16. With the Cook Islands being such a small country in terms of population, the team has consulted with a large number of stakeholders and it is hoped this is reflected within the detailed Master Plan presented. 17. Many thanks go out to all the many Cook Islanders who have contributed to this Master Plan. Their willingness to spend time meeting with, and talking to, Master Plan team members during the course of the project were invaluable in shaping the content and recommendations of the Master Plan and have helped to produce a document developed by, and for, the people of the Cook Islands.

Appendix 9 1
COST DATA
I.
COST ESTIMATE CONSIDERATIONS
Capital Costs - Base-cost is based on 2006 commercial rates - Engineering design, contract administration and supervision is
10.0%
- Contingencies 15.0% Assumptions: - Engineering fees and contingencies are not compounded
- Costs are rounded to the nearest $10,000
- VAT is included in the costs
Running Costs
Assumptions: - The following estimates are based on good practice procedures and regular servicing being carried out as per the supplier recommendations
Maintenance - Civil and structural
0.5% (Yr1, Yr2, thereafter annual increment of 0.5% up to maximum of 2% in Yr5
- Mechanical 7.0% (Percentage of item in initial year)
-
Electrical 5.0% (Percentage of item in initial
year)
- Field
vehicles 10.0%
Operations
- Power for electrical equipment annual cost is based on power rating of equipment, hour of operation and
the following full recovery (FCR) tariffs
Island Tariff ($/kWh)
FCR CR Mangaia 0.60 Atiu 1.10 0.62 Mauke 1.19 0.58 Mitiaro 1.72 0.58 Note: FCR tariffs extracted from the "Power Sector/Feasibility Report
by Bruce Clay/Herbert
reports adjusted by 4% per annum since 2004 to convert to 2006 constant prices
- Diesel fuel Assume $3.00/litre for the outer islands, $2.50/litre for
Rarotonga

2 Appendix 9
Capital Cost Estimates for Harbour Works
MPC / Fraser Thomas Estimate for Northern Group Data produced by GHD Pty Ltd R AUS ARMY MOW-CIPA
NZD NZD NZD AUD Pukapuka Nassau Manihiki Manihiki Rakahanga Mangaia Mauke Mitiaro Penrhyn Avatiu Aitutaki Mobilisation, demobilisation, preliminaries 50,000 50,000 150,000 150,000 10,000 172,000 144,000 168,000 45,000 50,000 Dredging channel 100,000 100,000 100,000 177,000 177,000 106,000 50,000 Drilling blasting reef 50,000 50,000 50,000 310,000 52,000 37,000 25,000 Demolition 20,000 20,000 15,000 0 6,500 Seawall 500,000 500,000 519,600 501,000 1,005,000 11,400 Wharf wall 50,000 80,000 169,000 76,000 81,000 294,000 Hardstand and ramp 50,000 100,000 200,000 273,000 205,000 183,500 21,200 Blasting headland 0 158,000 292,000 Bollards, fenders and navigation items 15,000 15,000 15,000 15,000 15,000 14,000 13,500 18,100 54,000 Avatiu container facilities 3,100,000 Aitutaki Improvement 3,900,000 Subtotal Harbour Works 165,000 215,000 965,000 665,000 15,000 1,482,600 1,197,500 1,722,600 462,100 3,150,000 3,900,000 Subtotal Mobilisation and Harbour Works 215,000 265,000 1,115,000 815,000 25,000 1,654,600 1,341,500 1,890,600 507,100 3,150,000 3,900,000 Contingency 15% *(20%) 32,250 39,750 167,250 122,250 3,750 *330,920 *268,300 *378,120 *101,420 Incl. Incl. Engineering and management 10% 21,500 26,500 111,500 81,500 2,500 198,552 160,980 226,872 60,852 315,000 390,000 Subtotal 268,750 331,250 1,393,750 1,018,750 31,250 2,184,072 1,770,780 2,495,592 669,372 3,465,000 4,290,000 GST Total 268,750 331,250 1,393,750 1,018,750 31,250 2,184,072 1,770,780 2,495,592 756,390 3,465,000 4,290,000 Inflation (5%, 41, 32 years) 919,3971 4,966,2112 Transfer to master sheet $million 0.27 0.33 1.40 1.00 0.03 2.20 1.80 2.50 0.92 3.5 5.00

Appendix 9 3
A. Individual Project Data
Project ID: ATW01AIU Project Name: Atiu airport upgrade to Pt 139 standards
Item Description Qty Units Rate Amount 1 Capital Civil works 1 nos 1,425,000 1,425,000 Climate change adaptation 1 nos 100,000 100,000 Design and management 1 nos 190,000 190,000 Contingencies 1 nos 285,000 285,000 Subtotal: 2,000,000 2 Operation and maintenance Staffing, consumables, fuel, civil works 1 nos 75,000 75,000 Subtotal: 75,000 TOTAL: 2,075,000
Project ID: ATW02MGS Project Name: Mangaia airport development
Item Description Qty Units Rate Amount 1 Capital Civil works 1 nos 3,562,500 3,562,500 Climate change adaptation 1 nos 250,000 250,000 Design and management 1 nos 475,000 475,000 Contingencies 1 nos 712,500 712,500 Subtotal: 5,000,000 2 Operation and maintenance Staffing, consumables, fuel, civil works 1 nos 75,000 75,000 Subtotal: 75,000 TOTAL: 5,075,000
Project ID: ATW03MUK Project Name: Mauke airport development
Item Description Qty Units Rate Amount 1 Capital Civil works 1 nos 547,500 547,500 Climate change adaptation 1 nos 20,000 20,000 Design and management 1 nos 73,000 73,000 Contingencies 1 nos 109,500 109,500 Subtotal: 750,000 2 Operation and maintenance Staffing, consumables, fuel, civil works 1 nos 75,000 75,000 Subtotal: 75,000 TOTAL: 825,000

4 Appendix 9
Project ID: ATW04MOI Project Name: Mitiaro airport development
Item Description Qty Units Rate Amount 1 Capital Civil works 1 nos 547,500 547,500 Climate change adaptation 1 nos 20,000 20,000 Design and management 1 nos 73,000 73,000 Contingencies 1 nos 109,500 109,500 Subtotal: 750,000 2 Operation and maintenance Staffing, consumables, fuel, civil works 1 nos 75,000 75,000 Subtotal: 75,000 TOTAL: 825,000
Project ID: ATW05MHX Project Name: Manihiki airport improvement
Item Description Qty Units Rate Amount 1 Capital Civil works 1 nos 1,425,000 1,425,000 Climate change adaptation 1 nos 100,000 100,000 Design and management 1 nos 190,000 190,000 Contingencies 1 nos 285,000 285,000 Subtotal: 2,000,000 2 Operation and maintenance Staffing, consumables, fuel, civil works 1 nos 75,000 75,000 Subtotal: 75,000 TOTAL: 2,075,000
Project ID: ATW06PYE Project Name: Penrhyn airport improvement
Item Description Qty Units Rate Amount 1 Capital Civil works 1 nos 1,425,000 1,425,000 Climate change adaptation 1 nos 100,000 100,000 Design and management 1 nos 190,000 190,000 Contingencies 1 nos 285,000 285,000 Subtotal: 2,000,000 2 Operation and maintenance Staffing, consumables, fuel, civil works 1 nos 100,000 100,000 Subtotal: 100,000 TOTAL: 2,100,000

Appendix 9 5
Project ID: ATW07PZK Project Name: Pukapuka airport improvement
Item Description Qty Units Rate Amount 1 Capital Civil works 1 nos 1,425,000 1,425,000 Climate change adaptation 1 nos 100,000 100,000 Design and management 1 nos 190,000 190,000 Contingencies 1 nos 285,000 285,000 Subtotal: 2,000,000 2 Operation and maintenance Staffing, consumables, fuel, civil works 1 nos 75,000 75,000 Subtotal: 75,000 TOTAL: 2,075,000
Project ID: ATW08RAR Project Name: Rarotonga airport passenger terminal improvement
Item Description Qty Units Rate Amount 1 Capital Civil works 1 nos 2,550,000 2,550,000 Climate change adaptation 1 nos 100,000 100,000 Design and management 1 nos 340,000 340,000 Contingencies 1 nos 510,000 510,000 Subtotal: 3,500,000 2 Operation and maintenance Operation and maintenance in CIAA budget 1 nos 0 0 Subtotal: 0 TOTAL: 3,500,000
Project ID: ATW09RAR Project Name: Rarotonga airport cyclone protection works
Item Description Qty Units Rate Amount 1 Capital Civil works 1 nos 7,312,500 7,312,500 Climate change adaptation 1 nos 250,000 250,000 Design and management 1 nos 975,000 975,000 Contingencies 1 nos 1,462,500 1,462,500 Subtotal: 10,000,000 2 Operation and maintenance Operation and maintenance in CIAA budget 1 nos 0 0 Subtotal: 0 TOTAL: 10,000,000

6 Appendix 9
Project ID: ATW10AIT Project Name: Aitutaki airport improvement for international operations
Item Description Qty Units Rate Amount 1 Capital Civil works 1 nos 8,812,500 8,812,500 Climate change adaptation 1 nos 250,000 250,000 Design and management 1 nos 1,175,000 1,175,000 Contingencies 1 nos 1,762,500 1,762,500 Subtotal: 12,000,000 2 Operation and maintenance Operation and maintenance in CIAA budget 1 nos 0 0 Subtotal: 0 TOTAL: 12,000,000
Project ID: MTW01AIU Project Name: Atiu harbour repairs
Item Description Qty Units Rate Amount 1 Capital Civil works 1 nos 120,000 120,000 Climate change adaptation 1 nos 0 0 Design and management 1 nos 16,000 16,000 Contingencies 1 nos 24,000 24,000 Subtotal: 160,000 2 Operation and maintenance Staffing, consumables, fuel, civil works 1 nos 65,000 65,000 Subtotal: 65,000 TOTAL: 225,000
Project ID: MTW02MGS Project Name: Mangaia harbour reconstruction
Item Description Qty Units Rate Amount 1 Capital Civil works 1 nos 1,575,000 1,575,000 Climate change adaptation 1 nos 100,000 100,000 Design and management 1 nos 210,000 210,000 Contingencies 1 nos 315,000 315,000 Subtotal: 2,200,000 2 Operation and maintenance Staffing, consumables, fuel, civil works 1 nos 65,000 65,000 Subtotal: 65,000 TOTAL: 2,265,000

Appendix 9 7
Project ID: MTW03MUK Project Name: Mauke harbour reconstruction
Item Description Qty Units Rate Amount 1 Capital Civil works 1 nos 1,275,000 1,275,000 Climate change adaptation 1 nos 100,000 100,000 Design and management 1 nos 170,000 170,000 Contingencies 1 nos 255,000 255,000 Subtotal: 1,800,000 2 Operation and maintenance Staffing, consumables, fuel, civil works 1 nos 65,000 65,000 Subtotal: 65,000 TOTAL: 1,865,000
Project ID: MTW04MOI Project Name: Mitiaro harbour reconstruction
Item Description Qty Units Rate Amount 1 Capital Civil works 1 nos 1,800,000 1,800,000 Climate change adaptation 1 nos 100,000 100,000 Design and management 1 nos 240,000 240,000 Contingencies 1 nos 360,000 360,000 Subtotal: 2,500,000 2 Operation and maintenance Staffing, consumables, fuel, civil works 1 nos 65,000 65,000 Subtotal: 65,000 TOTAL: 2,565,000
Project ID: MTW05MHX Project Name: Manihiki harbours reconstruction
Item Description Qty Units Rate Amount 1 Capital Civil works 1 nos 1,725,000 1,725,000 Climate change adaptation 1 nos 100,000 100,000 Design and management 1 nos 230,000 230,000 Contingencies 1 nos 345,000 345,000 Subtotal: 2,400,000 2 Operation and maintenance Staffing, consumables, fuel, civil works 1 nos 105,000 105,000 Subtotal: 105,000 TOTAL: 2,505,000

8 Appendix 9
Project ID: MTW06NAS Project Name: Nassau harbour development
Item Description Qty Units Rate Amount 1 Capital Civil works 1 nos 191,250 191,250 Climate change adaptation 1 nos 75,000 75,000 Design and management 1 nos 25,500 25,500 Contingencies 1 nos 38,250 38,250 Subtotal: 330,000 2 Operation and maintenance Staffing, consumables, fuel, civil works 1 nos 30,000 30,000 Subtotal: 30,000 TOTAL: 360,000
Project ID: MTW07PYE Project Name: Penrhyn harbour rehabilitation
Item Description Qty Units Rate Amount 1 Capital Civil works 1 nos 633,750 633,750 Climate change adaptation 1 nos 75,000 75,000 Design and management 1 nos 84,500 84,500 Contingencies 1 nos 126,750 126,750 Subtotal: 920,000 2 Operation and maintenance Staffing, consumables, fuel, civil works 1 nos 75,000 75,000 Subtotal: 75,000 TOTAL: 995,000
Project ID: MTW08PZK Project Name: Pukapuka jetty development
Item Description Qty Units Rate Amount 1 Capital Civil works 1 nos 146,250 146,250 Climate change adaptation 1 nos 75,000 75,000 Design and management 1 nos 19,500 19,500 Contingencies 1 nos 29,250 29,250 Subtotal: 270,000 2 Operation and maintenance Staffing, consumables, fuel, civil works 1 nos 60,000 60,000 Subtotal: 60,000 TOTAL: 330,000

Appendix 9 9
Project ID: MTW09RAK Project Name: Rakahanga harbour improvement
Item Description Qty Units Rate Amount 1 Capital Civil works 1 nos 22,500 22,500 Climate change adaptation 1 nos 0 0 Design and management 1 nos 3,000 3,000 Contingencies 1 nos 4,500 4,500 Subtotal: 30,000 2 Operation and maintenance Staffing, consumables, fuel, civil works 1 nos 40,000 40,000 Subtotal: 40,000 TOTAL: 70,000
Project ID: MTW10RAR Project Name: Avatiu western basin development completion
Item Description Qty Units Rate Amount 1 Capital Civil works 1 nos 2,062,500 2,062,500 Climate change adaptation 1 nos 250,000 250,000 Design and management 1 nos 275,000 275,000 Contingencies 1 nos 412,500 412,500 Subtotal: 3,000,000 2 Operation and maintenance Operation and maintenance included in CIPA budget 1 nos 0 0 Subtotal: 0 TOTAL: 3,000,000
Project ID: MTW11RAR Project Name: Avatiu container facilities development
Item Description Qty Units Rate Amount 1 Capital Civil works 1 nos 2,550,000 2,550,000 Climate change adaptation 1 nos 100,000 100,000 Design and management 1 nos 340,000 340,000 Contingencies 1 nos 510,000 510,000 Subtotal: 3,500,000 2 Operation and maintenance Operation and maintenance included in CIPA budget 1 nos 0 0 Subtotal: 0 TOTAL: 3,500,000

10 Appendix 9
Project ID: MTW12RAR Project Name: Avatiu harbour waterfront development
Item Description Qty Units Rate Amount 1 Capital Civil works 1 nos 1,050,000 1,050,000 Climate change adaptation 1 nos 100,000 100,000 Design and management 1 nos 140,000 140,000 Contingencies 1 nos 210,000 210,000 Subtotal: 1,500,000 2 Operation and maintenance Operation and maintenance included in CIPA budget 1 nos 0 0 Subtotal: 0 TOTAL: 1,500,000
Project ID: MTW13RAR Project Name: Avatiu harbour expansion
Item Description Qty Units Rate Amount 1 Capital Civil works 1 nos 14,850,000 14,850,000 Climate change adaptation 1 nos 200,000 200,000 Design and management 1 nos 1,980,000 1,980,000 Contingencies 1 nos 2,970,000 2,970,000 Subtotal: 20,000,000 2 Operation and maintenance Operation and maintenance included in CIPA budget 1 nos 0 0 Subtotal: 0 TOTAL: 20,000,000
Project ID: MTW14RAR Project Name: Rarotonga north coast protection
Item Description Qty Units Rate Amount 1 Capital Civil works 1 nos 96,750,000 96,750,000 Climate change adaptation 1 nos 6,000,000 6,000,000 Design and management 1 nos 12,900,000 12,900,000 Contingencies 1 nos 19,350,000 19,350,000 Subtotal: 135,000,000 2 Operation and maintenance Operation and maintenance included in CIPA budget 1 nos 0 0 Subtotal: 0 TOTAL: 135,000,000

Appendix 9 11
Project ID: MTW15AIT Project Name: Aitutaki harbour development
Item Description Qty Units Rate Amount 1 Capital Civil works 1 nos 3,525,000 3,525,000 Climate change adaptation 1 nos 300,000 300,000 Design and management 1 nos 470,000 470,000 Contingencies 1 nos 705,000 705,000 Subtotal: 5,000,000 2 Operation and maintenance Operation and maintenance included in CIPA budget 1 nos 0 0 Subtotal: 0 TOTAL: 5,000,000
Project ID: RT01RAR Project Name: Rarotonga road safety program
Item Description Qty Units Rate Amount 1 Capital Civil works 1 nos 637,500 637,500 Climate change adaptation 1 nos 0 0 Design and management 1 nos 85,000 85,000 Contingencies 1 nos 127,500 127,500 Subtotal: 850,000 2 Operation and maintenance Staffing, consumables, fuel, civil works 1 nos 75,000 75,000 Subtotal: 75,000 TOTAL: 925,000
Project ID: RT02RAR Project Name: Rarotonga traffic management improvements
Item Description Qty Units Rate Amount 1 Capital Civil works 1 nos 210,000 210,000 Climate change adaptation 1 nos 0 0 Design and management 1 nos 28,000 28,000 Contingencies 1 nos 42,000 42,000 Subtotal: 280,000 2 Operation and maintenance Staffing, consumables, fuel, civil works 1 nos 50,000 50,000 Subtotal: 50,000 TOTAL: 330,000

12 Appendix 9
Project ID: RT03RAR Project Name: Rarotonga main ring road rehabilitation
Item Description Qty Units Rate Amount 1 Capital Civil works 1 nos 22,312,500 22,312,500 Climate change adaptation 1 nos 250,000 250,000 Design and management 1 nos 2,975,000 2,975,000 Contingencies 1 nos 4,462,500 4,462,500 Subtotal: 30,000,000 2 Operation and maintenance Staffing, consumables, fuel, civil works 1 nos 310,000 310,000 Subtotal: 310,000 TOTAL: 30,310,000
Project ID: RT04RAR Project Name: Rarotonga inner ring road development
Item Description Qty Units Rate Amount 1 Capital Civil works 1 nos 8,850,000 8,850,000 Climate change adaptation 1 nos 200,000 200,000 Design and management 1 nos 1,180,000 1,180,000 Contingencies 1 nos 1,770,000 1,770,000 Subtotal: 12,000,000 2 Operation and maintenance Staffing, consumables, fuel, civil works 1 nos 35,000 35,000 Subtotal: 35,000 TOTAL: 12,035,000
Project ID: RT05AIT Project Name: Aitutaki road improvements
Item Description Qty Units Rate Amount 1 Capital Civil works 1 nos 2,325,000 2,325,000 Climate change adaptation 1 nos 200,000 200,000 Design and management 1 nos 310,000 310,000 Contingencies 1 nos 465,000 465,000 Subtotal: 3,300,000 2 Operation and maintenance Staffing, consumables, fuel, civil works 1 nos 200,000 200,000 Subtotal: 200,000 TOTAL: 3,500,000

Appendix 9 13
Project ID: RT06NAT Project Name: Outer islands road improvement program
Item Description Qty Units Rate Amount 1 Capital Civil works 1 nos 1,687,500 1,687,500 Climate change adaptation 1 nos 150,000 150,000 Design and management 1 nos 225,000 225,000 Contingencies 1 nos 337,500 337,500 Subtotal: 2,400,000 2 Operation and maintenance Staffing, consumables, fuel, civil works 1 nos 100,000 100,000 Subtotal: 100,000 TOTAL: 2,500,000
Project ID: RT07RAR Project Name: Inner ring road improvement Nikao to Takuvaine
Item Description Qty Units Rate Amount 1 Capital Civil works 1 nos 5,025,000 5,025,000 Climate change adaptation 1 nos 300,000 300,000 Design and management 1 nos 670,000 670,000 Contingencies 1 nos 1,005,000 1,005,000 Subtotal: 7,000,000 2 Operation and maintenance Staffing, consumables, fuel, civil works 1 nos 15,000 15,000 Subtotal: 15,000 TOTAL: 7,015,000
Project ID: WSW01RAR Project Name: Rarotonga distribution mains network rehab
Item Description Qty Units Rate Amount 1 Capital Civil works 1 nos 750,000 750,000 Design and management 1 nos 5,000 5,000 Contingencies 1 nos 37,500 37,500 Subtotal: 3,000,000 2 Operation and maintenace Staffing, consumables, capital items 1 nos 150,000 150,000 Subtotal: 150,000 TOTAL: 3,150,000

14 Appendix 9
Project ID: WSW02RAR Project Name: Installation of distribution system water meters on Rarotonga
Item Description Qty Units Rate Amount 1 Capital Capital items 1 nos 170,000 170,000 Contingencies 1 nos 30,000 30,000 Subtotal: 200,000 2 Operation and maintenace Staffing, consumables, capital items 1 nos 10,000 10,000 Subtotal: 10,000 TOTAL: 210,000
Project ID: WSW03RAR Project Name: Construction of Rarotonga water treatment facilities
Item Description Qty Units Rate Amount 1 Capital Civil works 1 nos 5,175,000 5,175,000 Climate change adaptation 1 nos 100,000 100,000 Design and management 1 nos 690,000 690,000 Contingencies 1 nos 1,035,000 1,035,000 Subtotal: 7,000,000 2 Operation and maintenance Staffing, consumables, capital items 1 nos 400,000 400,000 Subtotal: 400,000 TOTAL: 7,400,000
Project ID: WSW04RAR Project Name: Supply and installation of property connection meters on Rarotonga
Item Description Qty Units Rate Amount 1 Capital Capital items 1 nos 1,020,000 1,020,000 Contingencies 1 nos 180,000 180,000 Subtotal: 1,200,000 2 Operation and maintenance Staffing, consumables, capital items 1 nos 40,000 40,000 Subtotal: 40,000 TOTAL: 1,240,000

Appendix 9 15
Project ID: WSW05RAR Project Name: Rarotonga water loss reduction program
Item Description Qty Units Rate Amount 1 Capital Capital items 1 nos 425,000 425,000 Contingencies 1 nos 75,000 75,000 Subtotal: 500,000 2 Operation and maintenance Staffing, consumables, capital items 1 nos 40,000 40,000 Subtotal: 40,000 TOTAL: 540,000
Project ID: WSW06SGI Project Name: Southern Islands EMC water storages rehabilitation
Item Description Qty Units Rate Amount 1 Capital Civil works 1 nos 67,500 67,500 Climate change adaptation 1 nos 10,000 10,000 Design and management 1 nos 9,000 9,000 Contingencies 1 nos 13,500 13,500 Subtotal: 100,000 2 Operation and maintenance Staffing, consumables, fuel, civil works 1 nos 20,000 20,000 Subtotal: 20,000 TOTAL: 120,000
Project ID: WSW07AIT Project Name: Aitutaki water supply headworks upgrade
Item Description Qty Units Rate Amount 1 Capital Civil works 1 nos 255,000 255,000 Climate change adaptation 1 nos 10,000 10,000 Design and management 1 nos 34,000 34,000 Contingencies 1 nos 51,000 51,000 Subtotal: 350,000 2 Operation and maintenance Staffing, consumables, fuel, civil works 1 nos 10,000 10,000 Subtotal: 10,000 TOTAL: 360,000

16 Appendix 9
Project ID: WSW08AIT Project Name: Construction of Aitutaki water treatment plants
Item Description Qty Units Rate Amount 1 Capital Civil works 1 nos 1,102,500 1,102,500 Climate change adaptation 1 nos 30,000 30,000 Design and management 1 nos 147,000 147,000 Contingencies 1 nos 220,500 220,500 Subtotal: 1,500,000 2 Operation and maintenance Staffing, consumables, fuel, civil works 1 nos 200,000 200,000 Subtotal: 200,000 TOTAL: 1,700,000
Project ID: WSW09SGI Project Name: Construction of disinfection facilities on the Southern islands
Item Description Qty Units Rate Amount 1 Capital Civil works 1 nos 142,500 142,500 Climate change adaptation 1 nos 10,000 10,000 Design and management 1 nos 19,000 19,000 Contingencies 1 nos 28,500 28,500 Subtotal: 200,000 2 Operation and maintenance Staffing, consumables, fuel, civil works 1 nos 20,000 20,000 Subtotal: 20,000 TOTAL: 220,000
Project ID: WSW10SGI Project Name: Installation of water meters in distribution systems on the Southern islands
Item Description Qty Units Rate Amount 1 Capital Capital items 1 nos 425,000 425,000 Contingencies 1 nos 75,000 75,000 Subtotal: 500,000 2 Operation and maintenace Staffing, consumables, capital items 1 nos 40,000 40,000 Subtotal: 40,000 TOTAL: 540,000

Appendix 9 17
Project ID: WSW11NGI Project Name: Northern islands EMC water storages rehabilitation or construction
Item Description Qty Units Rate Amount 1 Capital Civil works 1 nos 67,500 67,500 Climate change adaptation 1 nos 10,000 10,000 Design and management 1 nos 9,000 9,000 Contingencies 1 nos 13,500 13,500 Subtotal: 100,000 2 Operation and maintenance Staffing, consumables, fuel, civil works 1 nos 30,000 30,000 Subtotal: 30,000 TOTAL: 130,000
Project ID: WSW12NGI Project Name: Northern islands community rainwater catchments and storage refurbishment
Item Description Qty Units Rate Amount 1 Capital Civil works 1 nos 135,000 135,000 Climate change adaptation 1 nos 20,000 20,000 Design and management 1 nos 18,000 18,000 Contingencies 1 nos 27,000 27,000 Subtotal: 200,000 2 Operation and maintenance Staffing, consumables, fuel, civil works 1 nos 10,000 10,000 Subtotal: 10,000 TOTAL: 210,000
Project ID: WSW13NGI Project Name: Supply and installation of household rainwater systems for the Northern islands
Item Description Qty Units Rate Amount 1 Capital Civil works 1 nos 900,000 900,000 Climate change adaptation 1 nos 0 0 Design and management 1 nos 120,000 120,000 Contingencies 1 nos 178,500 178,500 Subtotal: 1,198,500 2 Operation and maintenance Onus is on households 1 nos 0 0 Subtotal: 0 TOTAL: 1,198,500

18 Appendix 9
Project ID: WSW14MGS Project Name: Mangaia water supply system upgrade
Item Description Qty Units Rate Amount 1 Capital Civil works 1 nos 1,282,500 1,282,500 Climate change adaptation 1 nos 90,000 90,000 Design and management 1 nos 171,000 171,000 Contingencies 1 nos 256,500 256,500 Subtotal: 1,800,000 2 Operation and maintenance Staffing, consumables, fuel, civil works 1 nos 40,000 40,000 Subtotal: 40,000 TOTAL: 1,840,000
Project ID: WSW15AIU Project Name: Atiu water supply distribution system upgrade
Item Description Qty Units Rate Amount 1 Capital Civil works 1 nos 360,000 360,000 Climate change adaptation 1 nos 20,000 20,000 Design and management 1 nos 48,000 48,000 Contingencies 1 nos 72,000 72,000 Subtotal: 500,000 2 Operation and maintenance Staffing, consumables, fuel, civil works 1 nos 20,000 20,000 Subtotal: 20,000 TOTAL: 520,000
Project ID: WSW16MUK Project Name: Mauke water supply distribution system upgrade
Item Description Qty Units Rate Amount 1 Capital Civil works 1 nos 765,000 765,000 Climate change adaptation 1 nos 80,000 80,000 Design and management 1 nos 102,000 102,000 Contingencies 1 nos 153,000 153,000 Subtotal: 1,100,000 2 Operation and maintenance Staffing, consumables, fuel, civil works 1 nos 20,000 20,000 Subtotal: 20,000 TOTAL: 1,120,000

Appendix 9 19
Project ID: WSW17MOI Project Name: Mitiaro water supply system upgrade
Item Description Qty Units Rate Amount 1 Capital Civil works 1 nos 562,500 562,500 Climate change adaptation 1 nos 50,000 50,000 Design and management 1 nos 75,000 75,000 Contingencies 1 nos 112,500 112,500 Subtotal: 800,000 2 Operation and maintenance Staffing, consumables, fuel, civil works 1 nos 20,000 20,000 Subtotal: 20,000 TOTAL: 820,000
Project ID: SNW01RAR Project Name: Rarotonga village sewerage schemes - Stage 1
Item Description Qty Units Rate Amount 1 Capital Civil works 1 nos 2,137,500 2,137,500 Climate change adaptation 1 nos 150,000 150,000 Design and management 1 nos 285,000 285,000 Contingencies 1 nos 427,500 427,500 Subtotal: 3,000,000 2 Operation and maintenance Staffing, consumables, fuel, civil works 1 nos 160,000 160,000 Subtotal: 160,000 TOTAL: 3,160,000
Project ID: SNW02RAR Project Name: Rarotonga village sewerage schemes - Stage 2
Item Description Qty Units Rate Amount 1 Capital Civil works 1 nos 1,425,000 1,425,000 Climate change adaptation 1 nos 100,000 100,000 Design and management 1 nos 190,000 190,000 Contingencies 1 nos 285,000 285,000 Subtotal: 2,000,000 2 Operation and maintenance Staffing, consumables, fuel, civil works 1 nos 90,000 90,000 Subtotal: 90,000 TOTAL: 2,090,000

20 Appendix 9
Project ID: SNW03RAR Project Name: Rehabilitation of Tereora/Tepuka neighbourhood sewerage system
Item Description Qty Units Rate Amount 1 Capital Civil works 1 nos 225,000 225,000 Design and management 1 nos 30,000 30,000 Contingencies 1 nos 45,000 45,000 Subtotal: 300,000 2 Operation and maintenance Staffing, consumables, fuel, civil works 1 nos 30,000 30,000 Subtotal: 30,000 TOTAL: 330,000
Project ID: SNW06AIT Project Name: Construction of Aitutaki village sewerage networks
Item Description Qty Units Rate Amount 1 Capital Civil works 1 nos 1,065,000 1,065,000 Climate change adaptation 1 nos 80,000 80,000 Design and management 1 nos 142,000 142,000 Contingencies 1 nos 213,000 213,000 Subtotal: 1,500,000 2 Operation and maintenance Staffing, consumables, fuel, civil works 1 nos 80,000 80,000 Subtotal: 80,000 TOTAL: 1,580,000
Project ID: SNW08SGI Project Name: Review of adequacy and upgrade of sanitation facilities at EMCs for SGI
Item Description Qty Units Rate Amount 1 Capital Civil works 1 nos 165,000 165,000 Climate change adaptation 1 nos 30,000 30,000 Design and management 1 nos 22,000 22,000 Contingencies 1 nos 33,000 33,000 Subtotal: 250,000 2 Operation and maintenance Staffing, consumables, fuel, civil works 1 nos 20,000 20,000 Subtotal: 20,000 TOTAL: 270,000

Appendix 9 21
Project ID: SNW09SGI Project Name: Construction of septage treatment facilities on the southern islands
Item Description Qty Units Rate Amount 1 Capital Civil works 1 nos 78,750 78,750 Climate change adaptation 1 nos 15,000 15,000 Design and management 1 nos 10,500 10,500 Contingencies 1 nos 15,750 15,750 Subtotal: 120,000 2 Operation and maintenance Staffing, consumables, fuel, civil works 1 nos 20,000 20,000 Subtotal: 20,000 TOTAL: 140,000
Project ID: SNW12NGI Project Name: Construction of septage treatment facilities on the northern islands
Item Description Qty Units Rate Amount 1 Capital Civil works 1 nos 97,500 97,500 Climate change adaptation 1 nos 20,000 20,000 Design and management 1 nos 13,000 13,000 Contingencies 1 nos 19,500 19,500 Subtotal: 150,000 2 Operation and maintenance Staffing, consumables, fuel, civil works 1 nos 30,000 30,000 Subtotal: 30,000 TOTAL: 180,000
Project ID: SNW01RAR Project Name: Rarotonga village sewerage schemes - Stage 1
Item Description Qty Units Rate Amount 1 Capital Civil works 1 nos 2,137,500 2,137,500 Climate change adaptation 1 nos 150,000 150,000 Design and management 1 nos 285,000 285,000 Contingencies 1 nos 427,500 427,500 Subtotal: 3,000,000 2 Operation and maintenance Staffing, consumables, fuel, civil works 1 nos 160,000 160,000 Subtotal: 160,000 TOTAL: 3,160,000

22 Appendix 9
Project ID: SNW02RAR Project Name: Rarotonga village sewerage schemes - Stage 2
Item Description Qty Units Rate Amount 1 Capital Civil works 1 nos 1,425,000 1,425,000 Climate change adaptation 1 nos 100,000 100,000 Design and management 1 nos 190,000 190,000 Contingencies 1 nos 285,000 285,000 Subtotal: 2,000,000 2 Operation and maintenance Staffing, consumables, fuel, civil works 1 nos 90,000 90,000 Subtotal: 90,000 TOTAL: 2,090,000
Project ID: SNW03RAR Project Name: Rehabilitation of Tereora/Tepuka neighbourhood sewerage system
Item Description Qty Units Rate Amount 1 Capital Civil works 1 nos 225,000 225,000 Design and management 1 nos 30,000 30,000 Contingencies 1 nos 45,000 45,000 Subtotal: 300,000 2 Operation and maintenance Staffing, consumables, fuel, civil works 1 nos 30,000 30,000 Subtotal: 30,000 TOTAL: 330,000
Project ID: SNW06AIT Project Name: Construction of Aitutaki village sewerage networks
Item Description Qty Units Rate Amount 1 Capital Civil works 1 nos 1,065,000 1,065,000 Climate change adaptation 1 nos 80,000 80,000 Design and management 1 nos 142,000 142,000 Contingencies 1 nos 213,000 213,000 Subtotal: 1,500,000 2 Operation and maintenance Staffing, consumables, fuel, civil works 1 nos 80,000 80,000 Subtotal: 80,000 TOTAL: 1,580,000

Appendix 9 23
Project ID: SNW08SGI Project Name: Review of adequacy and upgrade of sanitiation facilities at EMCs for SGI
Item Description Qty Units Rate Amount 1 Capital Civil works 1 nos 165,000 165,000 Climate change adaptation 1 nos 30,000 30,000 Design and management 1 nos 22,000 22,000 Contingencies 1 nos 33,000 33,000 Subtotal: 250,000 2 Operation and maintenance Staffing, consumables, fuel, civil works 1 nos 20,000 20,000 Subtotal: 20,000 TOTAL: 270,000
Project ID: SNW09SGI Project Name: Construction of septage treatment facilities on the southern islands
Item Description Qty Units Rate Amount 1 Capital Civil works 1 nos 78,750 78,750 Climate change adaptation 1 nos 15,000 15,000 Design and management 1 nos 10,500 10,500 Contingencies 1 nos 15,750 15,750 Subtotal: 120,000 2 Operation and maintenance Staffing, consumables, fuel, civil works 1 nos 20,000 20,000 Subtotal: 20,000 TOTAL: 140,000
Project ID: SNW12NGI Project Name: Construction of septage treatment facilities on the northern islands
Item Description Qty Units Rate Amount 1 Capital Civil works 1 nos 97,500 97,500 Climate change adaptation 1 nos 20,000 20,000 Design and management 1 nos 13,000 13,000 Contingencies 1 nos 19,500 19,500 Subtotal: 150,000 2 Operation and maintenance Staffing, consumables, fuel, civil works 1 nos 30,000 30,000 Subtotal: 30,000 TOTAL: 180,000

24 Appendix 9
Project ID: SWW01RAR Project Name: Construction of Rarotonga solid waste transfer station
Item Description Qty Units Rate Amount 1 Capital Civil works 1 nos 337,500 337,500 Climate change adaptation 1 nos 50,000 50,000 Design and management 1 nos 45,000 45,000 Contingencies 1 nos 67,500 67,500 Subtotal: 500,000 2 Operation and maintenance Staffing, consumables, fuel, civil works 1 nos 30,000 30,000 Subtotal: 30,000 TOTAL: 530,000
Project ID: SWW02RAR Project Name: Rarotonga hazardous waste handling facilities upgrade
Item Description Qty Units Rate Amount 1 Capital Civil works 1 nos 375,000 375,000 Design and management 1 nos 50,000 50,000 Contingencies 1 nos 75,000 75,000 Subtotal: 500,000 2 Operation and maintenance Staffing, consumables, fuel, civil works 1 nos 50,000 50,000 Subtotal: 50,000 TOTAL: 550,000
Project ID: SWW03RAR Project Name: Construction of Rarotonga compost facilities
Item Description Qty Units Rate Amount 1 Capital Civil works 1 nos 375,000 375,000 Design and management 1 nos 50,000 50,000 Contingencies 1 nos 75,000 75,000 Subtotal: 500,000 2 Operation and maintenance Staffing, consumables, fuel, civil works 1 nos 50,000 50,000 Subtotal: 50,000 TOTAL: 550,000

Appendix 9 25
Project ID: SWW05SGI Project Name: Construction of new landfill sites on the Southern Group islands
Item Description Qty Units Rate Amount 1 Capital Civil works 1 nos 450,000 450,000 Design and management 1 nos 60,000 60,000 Contingencies 1 nos 90,000 90,000 Subtotal: 600,000 2 Operation and maintenance Staffing, consumables, fuel, civil works 1 nos 40,000 40,000 Subtotal: 40,000 TOTAL: 640,000
Project ID: SWW09NGI Project Name: Construction of new landfill sites on the Northern Group islands
Item Description Qty Units Rate Amount 1 Capital Civil works 1 nos 600,000 600,000 Design and management 1 nos 80,000 80,000 Contingencies 1 nos 120,000 120,000 Subtotal: 800,000 2 Operation and maintenance Staffing, consumables, fuel, civil works 1 nos 60,000 60,000 Subtotal: 60,000 TOTAL: 860,000
Project ID: ENW01RAK Project Name: Repair standby genset
Item Description Qty Units Rate Amount 1 Capital Parts and repair works 1 set 25,000 25,000 Subtotal: 25,000 TOTAL: 25,000
Project ID: ENW02PYE Project Name: Replace Penrhyn Gensets
Item Description Qty Units Rate Amount 1 Capital Acquire replacement genset and repair if required 1 nos 30,000 30,000 Also repair Penrhyn genset if required Subtotal: 30,000 TOTAL: 30,000

26 Appendix 9
Project ID: ENW03NAT Project Name: Outer Islands electrical wiring standardisation program
Item Description Qty Units Rate Amount 1 Capital Procurement of materials 1 nos 50,000 50,000 Subtotal: 50,000 TOTAL: 50,000
Project ID: ENW04PZK Project Name: Pukapuka electricity power supply upgrade
Item Description Qty Units Rate Amount 1 Capital Civil works 1 nos 1,875,000 1,875,000 Design and management 1 nos 250,000 250,000 Contingencies 1 nos 375,000 375,000 Subtotal: 2,500,000 2 Operation and maintenance Operation and maintenance costs by households 1 nos 0 0 Subtotal: 0 TOTAL: 2,500,000
Project ID: ENW05SGI Project Name: Southern islands power supply rehabilitation
Item Description Qty Units Rate Amount 1 Capital Civil works 1 nos 900,000 900,000 Design and management 1 nos 120,000 120,000 Contingencies 1 nos 180,000 180,000 Subtotal: 1,200,000 2 Operation and maintenance Staffing, consumables, fuel, civil works 1 nos 165,000 165,000 Subtotal: 165,000 TOTAL: 1,365,000
Project ID: ENW06NGI Project Name: Northern islands power supply rehabilitation
Item Description Qty Units Rate Amount 1 Capital Civil works 1 nos 750,000 750,000 Design and management 1 nos 100,000 100,000 Contingencies 1 nos 150,000 150,000 Subtotal: 1,000,000 2 Operation and maintenance Staffing, consumables, fuel, civil works 1 nos 180,000 180,000 Subtotal: 180,000 TOTAL: 1,180,000

Appendix 9 27
Project ID: ENW07NGI Project Name: Electricity power supply system upgrade on Manihiki and Rakahanga
Item Description Qty Units Rate Amount 1 Capital Civil works 1 nos 600,000 600,000 Design and management 1 nos 80,000 80,000 Contingencies 1 nos 120,000 120,000 Subtotal: 800,000 2 Operation and maintenance Staffing, consumables, fuel, civil works 1 nos 110,000 110,000 Subtotal: 110,000 TOTAL: 910,000
Project ID: ENW08MGS Project Name: Electricity power supply system upgrade on Mangaia
Item Description Qty Units Rate Amount 1 Capital Civil works 1 nos 300,000 300,000 Design and management 1 nos 40,000 40,000 Contingencies 1 nos 60,000 60,000 Subtotal: 400,000 2 Operation and maintenance Staffing, consumables, fuel, civil works 1 nos 55,000 55,000 Subtotal: 55,000 TOTAL: 455,000
Project ID: ENW09AIU Project Name: Atiu power distribution upgrade
Item Description Qty Units Rate Amount 1 Capital Civil works 1 nos 562,500 562,500 Design and management 1 nos 75,000 75,000 Contingencies 1 nos 112,500 112,500 Subtotal: 750,000 2 Operation and maintenance Staffing, consumables, fuel, civil works 1 nos 150,000 150,000 Subtotal: 150,000 TOTAL: 900,000

28 Appendix 9
Project ID: ENW16RAR Project Name: Construction of Rarotonga second power station
Item Description Qty Units Rate Amount 1 Capital Civil works 1 nos 24,937,500 24,937,500 Climate change adaptation 1 nos 1,750,000 1,750,000 Design and management 1 nos 3,325,000 3,325,000 Contingencies 1 nos 4,987,500 4,987,500 Subtotal: 35,000,000 2 Operation and maintenance Staffing, consumables, fuel, civil works 1 nos 1,600,000 1,600,000 Subtotal: 1,600,000 TOTAL: 36,600,000
Project ID: MFW01SGI Project Name: Modify and refurbish facilities and supply tools on Mangaia, Mitiaro
Item Description Qty Units Rate Amount 1 Capital Workshop 192 sqm 400 76,800 Shelter 192 sqm 250 48,000 Water catchment/storage 2 set 3,000 6,000 Tools and equipment 2 set 45,000 90,000 Design and management 2 set 13,080 26,160 Contingencies 2 set 19,620 39,240 Subtotal: 286,200 2 Operation and Maintenance Staffing 2 set 42,000 84,000 Consumables 2 set 6,240 12,480 Building 2 set 624 1,248 Tools and equipment 2 set 3,150 6,300 Subtotal: 104,028 TOTAL: 390,228

Appendix 9 29
Project ID: MFW02NGI Project Name: Modify and refurbish facilities and supply tools on Pukapuka, Penrhyn
Item Description Qty Units Rate Amount 1 Capital Workshop 192 sqm 400 76,800 Shelter 192 sqm 250 48,000 Water catchment/storage 2 set 3,000 6,000 Tools and equipment 2 set 45,000 90,000 Design and management 2 set 13,080 26,160 Contingencies 2 set 19,620 39,240 Subtotal: 286,200 3 Operation and Maintenance Staffing 2 set 42,000 84,000 Consumables 2 set 6,240 12,480 Building 2 set 624 1,248 Tools and equipment 2 set 3,150 6,300 Subtotal: 104,028 TOTAL: 390,228
Project ID: MFW03SGI Project Name: Build new facilities and supply tools on Aitutaki, Atiu, Mauke
Item Description Qty Units Rate Amount 1 Capital Workshop 318 sqm 650 206,700 Shelter 318 sqm 250 79,500 Water catchment/storage 3 set 3,000 9,000 Tools and equipment 3 set 45,000 135,000 Design and management (10%) 3 set 29,520 88,560 Contingencies (15%) 3 set 44,280 132,840 Subtotal: 651,600 2 Operation and Maintenance Staffing 3 set 42,000 126,000 Consumables (5%) 3 set 14,310 42,930 Building (0.5 to 5%) 3 set 1,431 4,293 Tools and equipment (7%) 3 set 3,150 9,450 Subtotal: 182,673 TOTAL: 834,000

30 Appendix 9
Project ID: MFW04NGI Project Name: Build new facilities and supply tools on Rakahanga, Palmerston, Nassau
Item Description Qty Units Rate Amount 1 Capital Workshop 288 sqm 650 187,200 Shelter 192 sqm 250 48,000 Water catchment/storage 3 set 3,000 9,000 Tools and equipment 3 set 45,000 135,000 Design and management (10%) 3 set 24,420 73,260 Contingencies (15%) 3 set 36,630 109,890 Subtotal: 562,350 2 Operation and Maintenance Staffing 3 set 42,000 126,000 Consumables (5%) 3 set 11,760 35,280 Building (0.5 to 5%) 3 set 1,176 3,528 Tools and equipment (7%) 3 set 3,150 9,450 Subtotal: 174,258 TOTAL: 737,000
Project ID: MFW05NGI Project Name: Construct Northern Group regional facility for repair of machineries
Item Description Qty Units Rate Amount 1 Capital Workshop 130 sqm 650 84,500 Shelter 106 sqm 250 26,500 Water catchment/storage 1 set 3,000 3,000 Tools and equipment 1 set 60,000 60,000 Design and management (10%) 1 set 11,400 11,400 Contingencies (15%) 1 set 17,100 17,100 Subtotal: 202,500 2 Operation and maintenance Staffing 1 set 60,000 60,000 Consumables (5%) 1 set 5,550 5,550 Building (0.5 to 5%) 1 set 555 555 Tools and equipment (7%) 1 set 4,200 4,200 Subtotal: 70,305 TOTAL: 273,000

Appendix 9 31
Project ID: EMW01RAR Project Name: Refurbish 11 EMCs on Rarotonga
Item Description Qty Units Rate Amount 1 Capital Building 160 sqm 250 40,000 Water catchment/storage 1 set 3,000 3,000 Equipment 1 set 30,000 30,000 Design and management 1 set 4,300 4,300 Contingencies 1 set 6,450 6,450 Subtotal: 83,750 Total for 11 EMCs 920,000
2 Operation and maintenance Operation and maintenance by community 11 set 10,000 110,000 Subtotal: 110,000 TOTAL: 1,030,000
Project ID: EMW02SGI Project Name: Modify and refurbish 23 EMCs on Southern Group Islands
Item Description Qty Units Rate Amount 1 Capital Building 160 sqm 250 40,000 Water catchment/storage 1 set 3,000 3,000 Equipment 1 set 30,000 30,000 Design and management 1 set 4,300 4,300 Contingencies 1 set 6,450 6,450 Subtotal: 83,750 Total capital costs for 23 EMCs 1,926,250
2 Operation and maintenance Operation and maintenance by community 23 set 10,000 230,000 Subtotal: 230,000 TOTAL: 2,156,250
Project ID: EMW03MHX Project Name: Complete repair works on Manihiki EMCs
Item Description Qty Units Rate Amount 1 Capital Building 291,000 291,000 Equipment 30,000 30,000 Contractor administration 29,100 29,100 Contingencies 43,650 43,650 Subtotal: 393,750 2 Operation and maintenance Operation and maintenance by community 2 set 10,000 20,000 Subtotal: 20,000 TOTAL: 413,750

32 Appendix 9
Project ID: EMW04NGI Project Name: Construct and furnish 5 new EMCs on Northern Group Islands
Item Description Qty Units Rate Amount 1 Capital Building 600 sqm 1,500 900,000 Equipment 1 set 30,000 30,000 Design and management 1 set 90,000 90,000 Contingencies 1 set 135,000 135,000 Subtotal: 1,155,000 Total capital for 5 EMCs 5,775,000 3 Operation and maintenance Operation and maintenance by community 5 set 10,000 50,000 Subtotal: 50,000 TOTAL: 5,825,000

Appendix 10 1
ENGINEERING DATA A. DEMOGRAPHICS
Island 2006 2011 2016 2021 2026Residential Visitor Total Residential Visitor Total Residential Visitor Total Residential Visitor Total Residential Visitor Total
Rarotonga 9,460 8,790 18,250 9,460 12,790 22,250 9,460 14,360 23,820 9,460 15,230 24,690 9,460 15,920 25,380
Southern Group 3,790 1,220 5,010 3,790 1,770 5,560 3,790 1,970 5,760 3,790 2,090 5,880 3,790 2,190 5,980Aitutaki 1,750 1,010 2,760 1,750 1,470 3,220 1,750 1,650 3,400 1,750 1,750 3,500 1,750 1,830 3,580Mangaia 740 740 740 740 740 740 740 740 740 740Atiu 600 110 710 600 150 750 600 160 760 600 170 770 600 180 780Mauke 470 100 570 470 150 620 470 160 630 470 170 640 470 180 650Mitiaro 230 230 230 230 230 230 230 230 230 230ManuaeTakutea
Northern Group 1,830 100 1,930 1,830 140 1,970 1,830 170 2,000 1,830 180 2,010 1,830 190 2,020Palmerston 50 50 50 50 50 50 50 50 50 50Pukapuka 670 670 670 670 670 670 670 670 670 670Nassau 80 80 80 80 80 80 80 80 80 80Manihiki 500 100 600 500 140 640 500 170 670 500 180 680 500 190 690Rakahanga 160 160 160 160 160 160 160 160 160 160Penrhyn 360 360 360 360 360 360 360 360 360 360Suwarrow 10 10 10 10 10 10 10 10 10 10
Total Cook Islands 15,080 10,110 25,190 15,080 14,700 29,780 15,080 16,500 31,580 15,080 17,500 32,580 15,080 18,300 33,380

2 Appendix 10
Table: Visitor Growth Rate Forecasts
Growth since Annual Year Average for Year 1996 2000 Increase
1991 0 1996 851 2000 1,125 7.2% 2001 1,900 17.4% 69% 69% 2002 3,150 24.4% 67% 66% 2003 4,450 26.7% 58% 41% 2004 6,050 27.8% 52% 36% 2005 8,175 28.6% 49% 35% 2006 10,100 28.1% 44% 24% 2007 11,400 26.6% 39% 13% 2008 12,300 24.9% 35% 8% 2009 13,200 23.5% 31% 7% 2010 14,000 22.1% 29% 6% 2011 14,700 20.9% 26% 5% 2012 15,300 19.8% 24% 4% 2013 15,800 18.7% 23% 3% 2014 16,100 17.7% 21% 2% 2015 16,300 16.8% 20% 1% 2016 16,500 16.0% 18% 1% 2017 16,700 15.2% 17% 1% 2018 16,900 14.6% 16% 1% 2019 17,100 13.9% 15% 1% 2020 17,300 13.4% 15% 1% 2021 17,500 12.9% 14% 1% 2022 17,700 12.4% 13% 1% 2023 17,900 11.9% 13% 1% 2024 18,100 11.5% 12% 1% 2025 18,300 11.2% 12% 1% 2026 18,300 10.8% 11% 1%

Appendix 10 3
Table: Population by Census Years 1976 - 2001
Population by Census Years Islands Area km2
1976 1981 1986 1991 1996 2001
Rarotonga 67.1
9,802
9,530
9,826
10,886
11,225 12,188
Aitutaki 18.3 2,423 2,335 2,390 2,357 2,389 1,946 Mangaia 51.8 1,530 1,364 1,229 1,214 1,108 744 Atiu 26.9 1,312 1,225 957 1,006 956 623 Mauke 18.4 710 681 692 639 652 470 Mitiaro 22.3 305 256 273 247 319 230
Manuae 6.2 -
-
-
-
- 0
Manihiki 5.4 266 405 508 663 668 515 Penrhyn 9.8 531 608 497 503 606 357 Rakahanga 4.1 283 269 282 262 249 169 Pukapuka 1.3 785 797 761 670 779 664 Nassau 1.3 123 137 119 102 99 72 Palmerston 2.1 56 51 66 49 49 48
Suwarrow 0.4 - 6 4 10 4 1
Total 236.7 18,126 17,664 17,604 18,608 19,103 18,027 Source: Cook Islands Statistics Office

10
Table: Number and Size of Households
Table: Seasonal Variation in Population
Island1991 1996 2001 1991 1996 2001
Rarotonga 2,222 2,569 2,531 4.9 4.0 3.7
Southern Group 1,035 1,127 965 5.3 24 3.9Aitutaki 440 496 435 5.4 4.6 4.0Mangaia 228 237 197 5.3 4.6 3.8Atiu 192 197 161 5.2 4.8 3.7Mauke 120 133 110 5.3 4.8 4.3Mitiaro 55 64 62 4.5 5.0 3.6ManuaeTakutea
Northern Group 420 457 384 5.4 5.3 4.7Palmerston 10 11 12 4.9 4.5 4.0Pukapuka 112 120 124 6.0 6.5 5.3Nassau 18 21 15 5.7 4.7 4.8Manihiki 134 149 117 4.9 4.4 4.2Rakahanga 44 42 32 6.0 5.9 4.9Penrhyn 101 113 83 5.0 5.3 4.2Suwarrow 1 1 1 10.0 4.0 1.0
Total Cook Islands 3,677 4,153 3,880 5.1 4.4 3.9
Households Households Size
QuarterTotal Resident Visitor
2000Mar 15,100 14,000 1,100Jun 14,600 14,000 600Sep 15,400 14,000 1,400Dec 14,800 13,400 1,400
2001Mar 15,000 13,500 1,500Jun 14,600 13,300 1,300Sep 15,400 13,400 2,000Dec 17,800 15,000 2,800
2002Mar 17,700 15,000 2,700Jun 17,200 14,600 2,600Sep 18,300 14,600 3,700Dec 17,700 14,100 3,600
2003Mar 17,700 13,800 3,900Jun 17,200 13,300 3,900Sep 18,500 13,600 4,900Dec 18,600 13,500 5,100
2004Mar 18,600 13,500 5,100Jun 18,600 13,100 5,500Sep 20,100 13,100 7,000Dec 19,500 12,900 6,600
2005Mar 19,200 12,500 6,700Jun 18,900 12,100 6,800Sep 20,500 12,100 8,400Dec 18,300 12,000 6,300
Population
4 Appendix

Appendix 10 5
B. PLANNING CRIETERIA
WATER Assumptions:1.Per capita daily consumption 250 L/c.d on Rarotonga and 150 L/c.d on outer islands.2. Including water loss allowance of 70% for existing piped systems, 20% in year 2016 on outer islands, 15% on Rarotong3. No reticulated system in the Northern Group Islands at present4. Resident population estimated for 2016 is static at 1996 census figures5. Production capacity data from Water Investigation Reports by Tony Falkland
Table: Water Demand Projections
Existing Production
Capacity (L/s)2006 2016 2006 2016 2006 2016
Rarotonga 18,250 23,820 4,563 5,955 132 81 150
Southern Group IslandsAitutaki 2,760 3,400 414 510 16.0 7.4 10.4Mangaia 740 740 111 111 4.3 1.6 3.3Atiu 710 760 107 114 4.1 1.6 1.7Mauke 570 630 86 95 3.3 1.4 1.7Mitiaro 230 230 35 35 1.3 0.5 1.2ManuaeSub-total SGI 5,010 5,760 752 864 29.0 12.5 18.3
Northern Group Islands N/A*Palmerston 50 50 8 8 0.1Pukapuka 670 670 101 101 1.5Nassau 80 80 12 12 0.2Manihiki 500 670 75 101 1.5Rakahanga 160 160 24 24 0.3Penrhyn 360 360 54 54 0.8Suwarrow 10 10 2 2 0.0Sub-total NGI 1,830 2,000 275 300 4.3Total 25,090 31,580 5,589 7,119 161.0 97.9 168.3* Note no reticulated systems on the Northern Islands at present
Production Needs (L/s)Island Population
Wastewater Generation (m3/d)
250L / c.d150L / c.d
10L / c.d
70%
15%20%
Outer Islands
New SystemsRarotonga Outer Islands
Adapted per capita demandRarotonga
Most existing systems
WaterDemand
Minimum needed for portable use
Water Losses - Reticulated Distribution System
Source: Outer Islands Water Investigation Reports 1999-2004, By T Falkland

6 Appendix 10
SANITATION
Island Hot water system Water Filter Kitchen
SinkBath/
Shower Flush Toilet Pour Flush Pit Latrines Lagoon
Rarotonga 1,303 817 2,417 2,469 2,450 86 14 Aitutaki 40 13 298 379 278 55 176 - Mangaia 5 5 87 114 77 70 89 - Atiu 10 6 72 118 58 52 100 - Mauke 2 1 51 99 58 5 87 - Mitiaro 1 2 20 21 23 36 7 - Palmerston 1 - 10 11 11 5 5 - Pukapuka - - 26 54 10 114 4 - Nassau - - 14 8 1 9 6 - Manihiki 3 7 78 93 80 25 2 12 Rakahanga - 1 8 7 12 20 - - Penrhyn 1 1 56 56 44 29 - 14 Suwarrow - - - - 1
Total 1,366 853 3,137 3,429 3,102 506 490 27
Source: Cook Islands 2001 Census of Population & Dwelling, Main Report, Statistics Office
Household Amenities
85%60g/c.d
Note: Assumptions based on standard 67g/c.d in New Zealand factored for local lifestyle
Waste Water / Water Supply RatioDaily per capita BOD Generation
AssumptionsSanitation

Appendix 10 7
SOLID WASTE Table: Total Waste Composition, Rarotonga, 1999
Total Combined Waste Composition
% of Total Residential
Waste
% of Total Waste - Residential
plus all Commercial
% of Total Commercial
Waste
% of Total Waste - Residential
plus all Commercial
Combined Residential and Commercial Waste
Composition (%)
Organic material 40.6 25.2 21.3 8.1 33.3Plastic 8.1 5 13.6 5.2 10.2Wood Trace Trace Trace Trace TracePaper/cardboard 20.3 12.6 16 6.1 18.7Textile/rubber 0.7 0.4 Trace Trace 0.4Glass/ceramics 17.7 11 21.9 8.3 19.3Ferrous Metals 9.9 6.1 24.3 9.2 15.3Non-ferrous metals 2.7 1.7 2.9 1.1 2.8
Total 100 62 100 38 100
Source: TA3085-COO Cook Islands Urban Infrastructure Project Preparatory Technical Assistance, 1999
Residential Commercial
Waste Component
Table: Waste Generation Rates for Rarotonga & Aitutaki, 1999
Daily per-capita Rate
(kg)
Annual Waste
(tonnes)
Nightly per-Tourist
Rate (kg)
Annual Waste
(tonnes)
Daily per-Establishment
Rate (kg)
Annual Waste
(tonnes)
Rarotonga 0.25 910 0.4 144 2.07 409 1,463
Aitutaki 0.20 158 0.4 14 1.35 22 194
Source: TA3085-COO Cook Islands Urban Infrastructure Project Preparatory Technical Assistance, 1999
Commercial waste Annual Waste
Generation – 1999
(tonnes)
Island
Residential waste Tourist hotel waste
Assumptions:
Waste Stream Rarotonga Aitutaki Other IslandsCompostable 33% 29% 20%Hazardous Waste 18% 24% 20%Landfill 49% 47% 60%

8 Appendix 10
Assumptions:
1 Outer Islands Daily Per Capita Waste Generation Rate 0.152 Outer Islands Commercial Waste:Domestic Waste Ratio 5%3 Annual Growth in Waste Generation (res & comm) 1%
Table: Projected Waste Generation
Annual Volume (m3) Population Projections
Annual Waste Generation (tonnes)
Island
2006 2016 2006 2016 2006 2016 Rarotonga 19,430 34,390 1,117 1,977 29.9 52.9Aitutaki 3,320 5,040 191 290 5.1 7.8Mangaia 1,090 1,090 63 63 1.7 1.7Atiu 1,060 1,230 61 71 1.6 1.9Mauke 750 920 43 53 1.2 1.4Mitiaro 320 320 18 18 0.5 0.5Manuae 0 0 0 0 0.0 0.0Manihiki 50 50 3 3 0.1 0.1Penrhyn 780 780 45 45 1.2 1.2Rakahanga 100 100 6 6 0.2 0.2Pukapuka 760 940 44 54 1.2 1.4Nassau 250 250 14 14 0.4 0.4Palmerston 610 610 35 35 0.9 0.9Suwarrow 10 10 1 1 0.0 0.0
Total 28,530
45,730
1,640 2,629
44
70

Appendix 10 9
ENERGY
Rarotonga 22,292,000 24 1,465,775 86,590 Aitutaki 2,410,000 24 158,466 58,631 Mangaia 361,000 24 23,737 22,971 Atiu 353,000 24 23,211 26,825 Mauke 196,000 24 12,888 19,743 Mitiaro 82,000 19 4,268 10,578 Manuae - - - - Manihiki 26,000 18 1,282 1,344 Penrhyn 78,000 18 3,847 5,818 Rakahanga 36,000 24 2,367 10,085 Pukapuka - - - - Nassau - - - - Palmerston 3,000 12 99 740 Suwarrow - - -
Source: Cook Islands Statistics Office, 2001Source: Outer Islands Power Feasibility Reports 2004, By B Clay
Usage per capitakWh per hour
Energy Generated
(kWh)
Typical Power Usage
Hours of operationIslands
Domestic Commercial Full Cost Recovery
Rarotonga 0.44 0.55Aitutaki 0.45 0.60Mangaia 0.4 0.60Atiu 0.4 0.62 1.11Mauke 0.36 0.58 1.19Mitiaro 0.4 0.60 1.72Manuae - - - Manihiki 0.36 0.58Penrhyn 0.36 0.58Rakahanga 0.36 0.58Pukapuka 0.36 0.58Nassau 0.36 0.58Palmerston 0.36 0.58Suwarrow - - -
Source: Office of Island Administrations, 2006Source: Outer Islands Power Feasibility Reports 2004,
IslandsTariffs ($ per kwh)
Energy Rates for all Islands

10 Appendix 10
C. Climate Change Adaptation
Climate Change Adaptation Accepted Level of Risk: Suggested (assumed) acceptable level of risk of major damage to various structures
Infrastructure Annual Recurents Interval (yrs)
Annual Exceedance Probability (%)
Hospitals 50 2% Emergency Centres 50 2% Roads - Strategic 20 5% Roads - General 2 50% Airports 10 10% Harbours 20 5% Water Supply 10 10% Power Generators 10 10% Telecom Stations 10 10% Public Buildings 20 5% Landfill 10 10%

Appendix 10 11
RAINFALL STATISTICS Island Jan Feb Mar Apr May Jun Jul Aug Sep Oct Nov Dec TotalRarotonga
Rainfall (1) 0Evaporation (2) 0Net Evaporation (3) = (2) - (1) 0 0 0 0 0 0 0 0 0 0 0 0 0
AitutakiRainfall (1) 0Evaporation (2) 0Net Evaporation (3) = (2) - (1) 0 0 0 0 0 0 0 0 0 0 0 0 0
MangaiaRainfall (1) 238.3 217.5 195.3 231.8 156.6 100.2 121 104.2 99.2 113.1 138 187.2 1,904Evaporation (2) 0Net Evaporation (3) = (2) - (1) -238.3 -217.5 -195.3 -231.8 -156.6 -100.2 -121 -104.2 -99.2 -113.1 -138 -187.2 -1904
AtiuRainfall (1) 0Evaporation (2) 0Net Evaporation (3) = (2) - (1) 0 0 0 0 0 0 0 0 0 0 0 0 0
MaukeRainfall (1) 210 225 196 151 152 82 83 101 92 111 159 209 1,873Evaporation (2) 160 135 135 115 95 86 90 108 126 146 150 158 1504Net Evaporation (3) = (2) - (1) -50 -90 -61 -36 -57 -9 -51 -369 4 7 7 34 35
MitiaroRainfall (1) 0Evaporation (2) 0Net Evaporation (3) = (2) - (1) 0 0 0 0 0 0 0 0 0 0 0 0 0
PalmerstonRainfall (1) 0Evaporation (2) 0Net Evaporation (3) = (2) - (1) 0 0 0 0 0 0 0 0 0 0 0 0 0
PukapukaRainfall (1) 0Evaporation (2) 0Net Evaporation (3) = (2) - (1) 0 0 0 0 0 0 0 0 0 0 0 0 0
NassauRainfall (1) 0Evaporation (2) 0Net Evaporation (3) = (2) - (1) 0 0 0 0 0 0 0 0 0 0 0 0 0
RakahangaRainfall (1) 0Evaporation (2) 0Net Evaporation (3) = (2) - (1) 0 0 0 0 0 0 0 0 0 0 0 0 0
PenrhynRainfall (1) 234 257 250 169 155 154 147 161 129 156 190 234 2257Evaporation (2) 0Net Evaporation (3) = (2) - (1) -234 -257 -250 -169 -155 -154 -147 -161 -129 -156 -190 -234 -2257


Appendix 11 1
ISLAND INVENTORY
I. ISLAND PROFILES
ISLAND FACTS SHEET – AITUTAKI
Physical features Area: 18.3 km 2
Elevation: <121 m above MSL Island type: Low volcanic atoll situated on a “near” atoll Proximity: 277km from Rarotonga 210 km from nearest island (Atiu) Settlements: 8 villages divided into 4 districts Tautu, Vaipae-Avanui, Amuri-Ureia, Arutanga,
Demographics • Population 1743 (2001); declining • 452 households (approx 4 people/household) • Dependency ratio 94% • > 2002; 5 schools; 44% secondary; 49% primary; 7% pre-school large
unskilled labour force; however tertiary and vocational training available. Environment • flat topped terraces; fertile planting areas; extensive areas of coral
• lagoon 66 sq km; average depth of 5m; no deep water passage into lagoon. • Raui (traditional conservation method) system in place at given times to re-
establish native clam population as well as reef fish • Islets are also breeding grounds for lorikeet
Health • 50 bed hospital; 2 full time doctors; senior reg. nurses; public health inspector; public health nurse; nurse aides; dentist; dental technician; pharmacist; hospital currently being renovated.
• 5 child welfare clinics around the island; serves as a focal point for mother & child health & immunization.
• Influenza & acute respiratory infections are problems; diarrhoea, conjunctivitis; fish poisoning and asthma cases are also a concern. Also an increase in NCD’s.
Local economy • Public Service (22%) Private (54%) Ad hoc (7%) Overseas Orgn (15%) Religious Orgn (2%) Self employed (1%)
• Tourism driven. • Subsistence farming and fishing widely practiced
Air transport • 2 air strips of 1.8km and 1.4km long; • 3 flights/day, 6 days a week, & 1 flight on Sunday night
Sea transport • 4 weekly service • Loading/unloading via small boat or barges
Road transport • 16km sealed road • Unsealed road length – 45km
Water supply • Source: 433 households connected to public water main; brackish water; 43 communal tanks.
• 470km of public water mains; water pumped from intake galleries and reservoirs • although there has been upgrades, all major new commercial users are required
to install rain water collection tanks, or desalination systems and HH encouraged to private water tanks.
Sanitation • All households have septic tanks to avoid negative effects on galleries
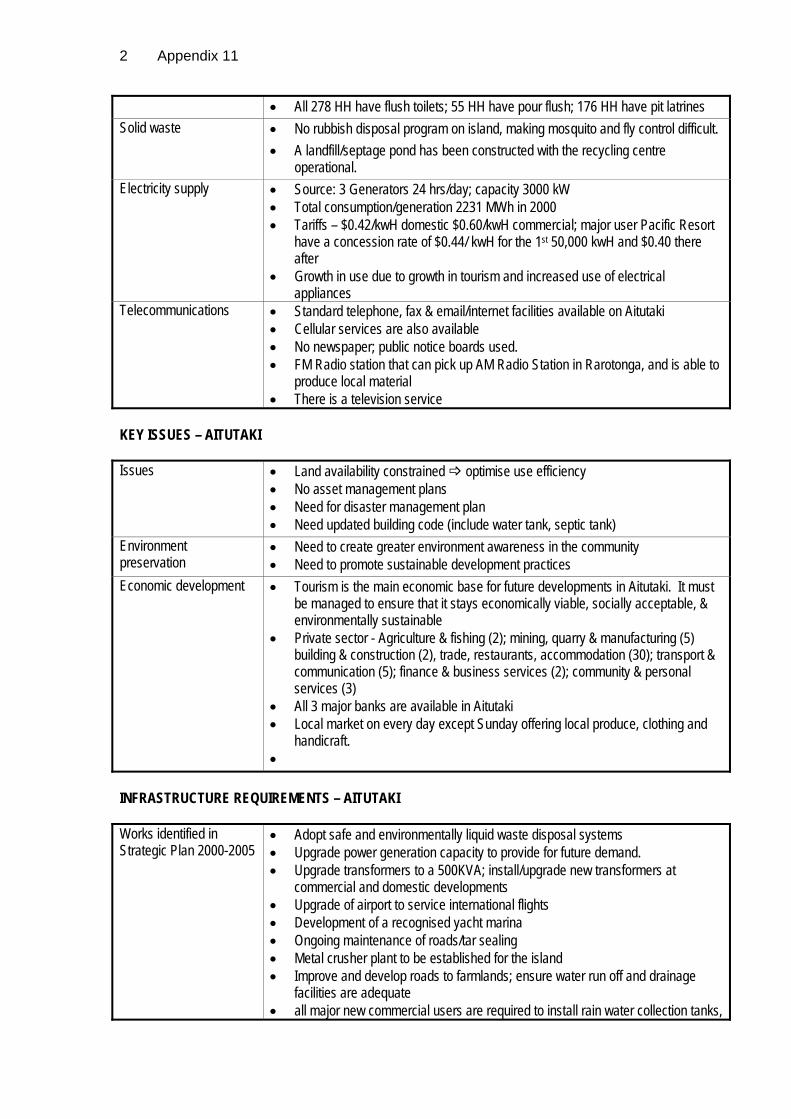
2 Appendix 11
• All 278 HH have flush toilets; 55 HH have pour flush; 176 HH have pit latrines Solid waste • No rubbish disposal program on island, making mosquito and fly control difficult.
• A landfill/septage pond has been constructed with the recycling centre operational.
Electricity supply • Source: 3 Generators 24 hrs/day; capacity 3000 kW • Total consumption/generation 2231 MWh in 2000 • Tariffs – $0.42/kwH domestic $0.60/kwH commercial; major user Pacific Resort
have a concession rate of $0.44/ kwH for the 1st 50,000 kwH and $0.40 there after
• Growth in use due to growth in tourism and increased use of electrical appliances
Telecommunications • Standard telephone, fax & email/internet facilities available on Aitutaki • Cellular services are also available • No newspaper; public notice boards used. • FM Radio station that can pick up AM Radio Station in Rarotonga, and is able to
produce local material • There is a television service
KEY ISSUES – AITUTAKI Issues • Land availability constrained optimise use efficiency
• No asset management plans • Need for disaster management plan • Need updated building code (include water tank, septic tank)
Environment preservation
• Need to create greater environment awareness in the community • Need to promote sustainable development practices
Economic development • Tourism is the main economic base for future developments in Aitutaki. It must be managed to ensure that it stays economically viable, socially acceptable, & environmentally sustainable
• Private sector - Agriculture & fishing (2); mining, quarry & manufacturing (5) building & construction (2), trade, restaurants, accommodation (30); transport & communication (5); finance & business services (2); community & personal services (3)
• All 3 major banks are available in Aitutaki • Local market on every day except Sunday offering local produce, clothing and
handicraft. •
INFRASTRUCTURE REQUIREMENTS – AITUTAKI Works identified in Strategic Plan 2000-2005
• Adopt safe and environmentally liquid waste disposal systems • Upgrade power generation capacity to provide for future demand. • Upgrade transformers to a 500KVA; install/upgrade new transformers at
commercial and domestic developments • Upgrade of airport to service international flights • Development of a recognised yacht marina • Ongoing maintenance of roads/tar sealing • Metal crusher plant to be established for the island • Improve and develop roads to farmlands; ensure water run off and drainage
facilities are adequate • all major new commercial users are required to install rain water collection tanks,

Appendix 11 3
or desalination systems and HH encouraged to private water tanks. • Proposed new public toilets • Proposed new public administration centre • Proposed new fisherman’s mooring facilities • Alternative sources of water/power for efficiency and effectiveness purposes
Works identified in Annual Business Plan 2006 - 2007
• Maintenance and monitoring of 30km water reticulation system • Six main water pumps are monitored and maintained • Maintenance and monitoring of six main storage water tanks on island • Maintenance and monitoring of the seven boreholes (water galleries) • Construction of 82,000 Water Tank in Takapora est $20,000. • Liaison with the land owners and carry out feasibility study to construct a water
gallery and drainage system in Vaimaru est at $20,000 • 15 drainage systems constructed by June 2007 est $20,000 • Excavation of lagoon mud to pave 15km of inland and coastal unsealed roads
est $20,000. • Road marking of 26km of roads with cat’s eyes for sealed roads est $20,000 • Development of Aitutaki Manea Games facilities for 2008 est at $1m • 3 new public utilities for Orongo, Ootu & Te Koutu est 20,000 • Water catchments Building – Piraki est $20,000.
Additional works since SP 2000-2005

4 Appendix 11
ISLAND FACTS SHEET – MANGAIA
Physical features Area: 26.9 km 2
Elevation: <169 m above MSL Island type: volcanic island surrounded by sharp coral line makatea cliffs. Proximity: 215km from Rarotonga 50 km from nearest island (Mitiaro) Settlements: 3 villages; Oneroa, Tamarua, Ivirua
Demographics • Population 739 (2001); declining • 237 households (approx 4 people/household) • Dependency ratio 101% • > 3 schools; 2001; 43% secondary; 43% primary; remainder pre-school large
unskilled labour force; tertiary and vocational training available. Environment • red volcanic inland soils; heavily wooded with rolling hills
• swamps used for taro production • Subsistence farming and fishing widely practiced
Health • Main hospital with doctor, reg. nurses; dental services available. • Influenza & acute respiratory infections are problems; diarrhoea, conjunctivitis;
fish poisoning and asthma cases are also a concern. Also an increase in NCD’s.
Local economy • Public Service (58%) Private (11%) Ad hoc (6%) Overseas Orgn (22%) Religious Orgn (3%) Self employed (0%)
• Subsistence farming and fishing widely practiced Air transport • airport constructed of makatea soil; 1.06km long
• 1 flight/day, 6 days a week, Sea transport • 4 weekly service
• 120 m channel • Loading/unloading via small boat or barges
Road transport • 2-3km sealed road • Unsealed road length – 55km
Water supply • Source: 234 HH connected to public water main; 27 HH have private water tanks; 61 public water tanks;
• HH water piped outside to dwelling; HH water pied inside; HH cart water. •
Sanitation • All households have septic tanks to avoid negative effects on galleries • 77 HH , 48 community & public toilets, 10 Govt buildings & 10 commercial
establishments have flush toilets; 70 HH have pour flush; 89 HH have pit latrines; 114 HH have bath/shower
Solid waste • rubbish collection program on island; disposal in managed dumps • Waste management project to construct a land fill. A recycling centre is also
operational Electricity supply • Source: 4 Deutz & 1 Lister generators 24 hrs/day; capacity kW;
• Total consumption/generation 363 MWh in 2000 • Tariffs – $0. /kwH domestic $0. /kwH commercial; • Growth in use due to growth in tourism and increased use of electrical
appliances Telecommunications • Standard telephone, fax & email/internet facilities available on Aitutaki
• No formal newspaper; public notice boards used.

Appendix 11 5
• FM Radio station that can pick up AM Radio Station in Rarotonga, and is able to produce local material
• Email and internet facilities available through dial up modem. • Television station operates for $5/mth
KEY ISSUES – MANGAIA Issues • Land availability constrained optimise use efficiency
• No asset management plans • Need updated building code (include water tank, septic tank) • Machinery on island is unable to support major developments. • Crusher too small to cater for major roadwork • Lack of water storage facilities • Waste disposal is a problem
Environment preservation
• Need to create greater environment awareness in the community • Need to promote sustainable development practices • Lack of the development of a proper program to stop degradation has resulted in
careless dumping of waste. Economic development • Agriculture is backbone of the island. Wandering animals are an issue.
• 25 private businesses on Mangaia. (11) retail stores; (4) tourist accommodation; (2) bars/taverns; (2) restaurants; (1) handicraft outlet; (1) transport service; (2) banking service; (2) communication services; (1) mechanical service
INFRASTRUCTURE REQUIREMENTS – MANGAIA Works identified in Strategic Plan 2000-2005
• Redesign, deepen, widen and repair harbour and cargo shed. • Tar seal roads and on going maintenance • Investigate alternative sources of water & energy • Upgrade and improve airport run way and facilities • Improve energy sources (wind power) • Replace barge & other essential machineries • Maintenance of buildings and machineries on island • Upgrade water supply • Concrete water intakes; alternative sources • Airport realignment and extension • Slipway reconstruction • Treatment plant for forestry • New 100Kw turbo diesel engine • 50Kw engine to offset with wind power • 100KVA transformer and switch gear • High voltage cables; 3 phase 70m cables for low voltage • Replace old machineries and equipments
Works identified in Annual Business Plan 2006 - 2007
• Procure equipment for thinning and pruning of timber production sites with 14 hectares complete by June 2007
• Clearance of roads and firebreaks. • Ongoing maintenance of 4 water catchments • Reconstruction of pump station at Keia • Maintenance of coastal and inland roads including drainage system • Maintenance and tar sealing of 12km of sealed roads • Complete harbour reconstruction feasibility study by Dec 2006

6 Appendix 11
• Procure crusher and implements for quarry operations - CIGOV • Construct a tar seal road from the airport to Oneroa and to the hospital, Mangaia
school and power station (8km) • Procure the controlling unit for pilot wind power project – SOPAC/CIGOV • Purchase 2 x Electric pumps est $40,000 • Replace old damaged power cables 1000metres est $30,000 • Purchase tar sealing machine est $15,000 • Purchase new HIAB Truck est $150,000 • Purchase of tools and equipment for infrastructure unit est $70,000 • Purchase parts for machineries est $25,000 • Purchase Kubota slasher for road clearing est $35,000 • Replace circuit breakers for power supply est $4,000 •
Additional works since SP 2000-2005

Appendix 11 7
ISLAND FACTS SHEET – ATIU Physical features Area: 26.9 km 2
Elevation: <72 m above MSL Island type: Raised volcanic island surrounded by steep makatea Proximity: 215km from Rarotonga 50 km from nearest island (Mitiaro) Settlements: 5 villages; Teenui, Ngatiarua; Areora; Tengatangi; Mapumai; Takutea is considered part of Atiu lying 21km off the coast; 122ha island.
Demographics • Population 623 (2001); declining • 161 households (approx 4 people/household) • Dependency ratio 106% • > 1 schools; 2001; 28% secondary; 61% primary; 10% pre-school large
unskilled labour force Environment • red volcanic inland soils; heavily wooded with rolling hills
• settlements located on plateau surrounded by swamps & small lake • narrow fringing reef drops steeply to ocean floor 4,500 m below. • Subsistence farming and fishing widely practiced
Health • Main hospital with doctor, reg. nurses; dental services available. • Influenza & acute respiratory infections are problems; diarrhoea, conjunctivitis;
fish poisoning and asthma cases are also a concern. Also an increase in NCD’s.
Local economy • Public Service (55%) Private (27%) Ad hoc (2%) Overseas Orgn (15%) Religious Orgn (2%) Self employed (0%)
• Subsistence farming and fishing widely practiced Air transport • airport constructed of makatea soil; 1.7km long
• Airport strip upgraded 2001/2002 and suitable for small crafts & Saab aeroplane • 1 flight/day, 6 days a week,
Sea transport • 4 weekly service • Loading/unloading via small boat or barges
Road transport • 8.9km sealed road • Unsealed road length – n/a
Water supply • Source: 171km of public water main; 20 public or communal water tanks; 111 private water tanks
• Water main fed through 4 elevated tanks filled by pumping from water boreholes.
• HH water piped outside to dwelling; HH water pied inside; HH cart water. •
Sanitation • All households have septic tanks to avoid negative effects on galleries • 58 HH have flush toilets; 52 HH have pour flush; 100 HH have pit latrines; 118
HH have bath/shower Solid waste • rubbish collection program on island; disposal is via dumps
• Waste management project to construct a land fill. A recycling centre is also operational
Electricity supply • Source: 2 Lister generators 24 hrs/day; capacity 84 kW; 1 Hino generator 96kW • Total consumption/generation 359 MWh in 2000 • Tariffs – $0. /kwH domestic $0. /kwH commercial; • Growth in use due to growth in tourism and increased use of electrical
appliances

8 Appendix 11
Telecommunications • Standard telephone, fax & email/internet facilities available on Aitutaki • No formal newspaper; public notice boards used. • Radio Atiu is run by the school for 3hrs on Sunday • FM Radio station that can pick up AM Radio Station in Rarotonga, and is able to
produce local material • Council contracts the programming and running of Atiu TV operating 4 nights/wk
for 4.5 hrs/night. $5/mth to access TV. KEY ISSUES – ATIU Issues • Land availability constrained optimise use efficiency
• No asset management plans • Need updated building code (include water tank, septic tank) • 8.9km main road serving the airport and villages require maintenance • no proper village and agriculture feeder roads to main road. Roads earmarked
by ADB phase 2 program in 1989 but never completed. • Machinery on island is unable to support major developments. • Crusher too small to cater for major roadwork • Wharf fills with sand bars; requires maintenance. • Wharf shed requires maintenance. • Shortage of water because of lack of maintenance. • Lack of water storage facilities • Waste disposal is a problem • Lack of market outlet, processing & storage facilities
Environment preservation
• Need to create greater environment awareness in the community • Need to promote sustainable development practices • Lack of a proper program to stop degradation has resulted in careless dumping
of waste. Economic development • Agriculture is backbone of the island. Wandering animals are an issue.
• Tourism is the main economic base for future developments in Atiu must be managed to ensure that it stays economically viable, socially acceptable, & environmentally sustainable
• 17 private businesses on Atiu. (1) commercial farmer/fishing operation; (6) mining, quarrying, manufacturing sector; (10) in trade, restaurants, accommodation.
• 2 banking services offered. •
INFRASTRUCTURE REQUIREMENTS – ATIU Works identified in Strategic Plan 2000-2005
• Upgrade wharf facilities for storage and shipping • Harbour launching areas needs dredging and upgrading. • Improve water wells in the valley to increase water supply for irrigation • Upgrade airport runway and facilities • Upgrade static crane • Replace untreated wooden power poles • Complete reticulation of power supply including installation of substation • Improve adequate street lighting

Appendix 11 9
• Established dump site • Develop a Marine VHF telecommunications safety centre • Establish a new nursery to support seedlings and propagation of economic
plants • Relocate one windmill to pump water for residents • Identify water wells in valleys and develop to support existing water supply. • Need for 5 ton tip truck for essential services on island. • Maintenance of buildings and machineries on island • Alternative water & energy sources
Works identified in Annual Business Plan 2006 - 2007
• Continue to develop Atiu Stadium for possible use in 2009 Mini Games • Maintenance and upgrade of roads and drainage system • Maintenance of water wells, community water tanks and water pumps • Reactivate water reticulation system • The need to redesign and rebuild power house • Install new fuel holding tanks • Purchase one 5-8 ton crane truck • Purchase one D4 Bulldozer • Purchase one land cruiser for fire fighting on Atiu • Purchase six manual water sprayers • Purchase one tip truck • Purchase one tractor town roller with 7-9 tonnes capacity • Purchase one forklift • Purchase two outboards engines for barge operations • Purchase two heavy duty chainsaws & two light duty chainsaws •
Additional works since SP 2000-2005

10 Appendix 11
ISLAND FACTS SHEET – MAUKE Physical features Area: 18.4km 2
Elevation: <29 m above MSL Island type: volcanic reef island surrounded by makatea to 20m. Proximity: 278km from Rarotonga 59 km from nearest island Settlements: 3 villages; Kimiangatau, Ngatiarua, Areora/Makatea
Demographics • Population 469 (2001); declining • 110 households (approx 4 people/household) • Dependency ratio 96% • > 2 schools; 2002; 7% pre school; 17% primary; 76% secondary large
unskilled labour force Environment • 6.4km long, 4.0km wide; central plateau is low lying and flat with numerous
swamps, making access to sea difficult • environment of caves, swamplands and makatea wildlife • Subsistence farming and fishing widely practiced
Health • New hospital relocated and completed in 2004; resident doctor, reg. nurses; no dental services available. Use of mobile dentist unit.
• Influenza & acute respiratory infections are problems; diarrhoea, conjunctivitis; fish poisoning and asthma cases are also a concern. Also an increase in NCD’s.
Local economy • Public Service (70%) Private (11%) Ad hoc (4%) Overseas Orgn (10%) Religious Orgn (7%) Self employed (0%)
• Subsistence farming and fishing widely practiced Air transport • airport constructed of makatea soil; upgraded in 2001/2002; now suitable for
smaller aircrafts and the Saab. 1.06km long • 3 flight/week
Sea transport • 4 weekly service • 120 m channel • Loading/unloading via small boat or barges
Road transport • no sealed road • Unsealed road length – 40km
Water supply • Source: 109 HH connected to public water main; 1HH accessed a public water catchment; 31HH have private rainwater tanks; public water tanks;
• 49HH water piped outside to dwelling; 61HH water pied inside; HH cart water. • Pumped from underground bores by one old windmill pump and a diesel pump. • The diesel engine pump supplies 4 10,000L holding tanks which gravity feeds
the reticulation system; windmill pump requires repairs. • 2 communal water tanks that require repairs. Large water reservoir dam
constructed in the 1980’s to maintain water table. Sanitation • All households have septic tanks to avoid negative effects on galleries
• 58HH have flush toilets; 5 HH have pour flush; 100HH have pit latrines; implying some dwellings had more than one type of facility.
Solid waste • rubbish collection program on island is fortnightly; disposal in managed dumps Electricity supply • Source: 3 Lister generators 19 hrs/day; capacity 3000kW;
• Total consumption/generation 189 MWh in 2000 • Tariffs – $0.36 /kwH domestic $058. /kwH commercial; • Growth due to the increased use of electrical appliances

Appendix 11 11
Telecommunications • Standard telephone, fax & email/internet facilities available on Mauke • No formal newspaper; public notice boards used. • FM Radio station that can pick up AM Radio Station in Rarotonga, and is able to
produce local material • Email and internet facilities available through dial up modem. • Television services available.
KEY ISSUES – MAUKE Issues • Land availability constrained optimise use efficiency
• No asset management plans • Need updated building code (include water tank, septic tank) • Machinery on island is unable to support major developments. • Lack of water storage facilities; water supply is high priority • Waste disposal is a problem
Environment preservation
• Need to create greater environment awareness in the community • Need to promote sustainable development practices
Economic development • Agriculture along with tourism is the backbone of the island. Wandering animals are an issue.
• 12 private businesses on Mauke. (4) retail stores; (1) tourist accommodation – 9 beds; (1) bar/tavern; (1) transport service; (1) banking service
• Local market day selling local produce. • Potential Fruit processing plant to process fruits • Potential Abbatoir • Potential to increase tourism accommodation
INFRASTRUCTURE REQUIREMENTS – MAUKE Works identified in Strategic Plan 2000-2005
• rebuild and repair public water tank catchments and encourage HH to install private tanks.
• Review & upgrade existing water reticulation & pumping systems • Renovate the windmill pumps • Upgrade and maintain power supply & network to provide 24hr power/day;
provide new diesel generator LT1 • Maintain and repair airport runway and terminal facility • Further dredging of the harbour; purchase a dredging machine, 7ton tip truck,
bulldozer, pickup vehicle • Ongoing maintenance of roads/tar seal roads • Construct loading/unloading area at wharf
Works identified in Annual Business Plan 2006 - 2007
• Road maintenance (10km) • Regular airport maintenance • Airport seawall reconstruction (Angataura Landing) est $6,800 • Power reticulation maintenance • Upgrade high voltage system to Ngatiarua est $9,396 • Airport fencing est $10,820 • Purchase Tractor 4wd Daedong est $80,000 • Purchase two new 4WD Utility pickup for Energy and Infrastructure unit est
$80,000($40,000 each) • Purchase Hiab 6 ton lifting capacity est $80,000
Additional works since SP 2000-2005

12 Appendix 11
ISLAND FACTS SHEET – MITIARO Physical features Area: 22.3km 2
Elevation: <12 m above MSL Island type: volcanic reef island surrounded by makatea to 20m. Proximity: 278km from Rarotonga 59 km from nearest island Settlements: 4 villages; Atai, Auta, Mangarei, Takaue
Demographics • Population 226 (2001); declining • 62 households (approx 4 people/household) • Dependency ratio 96% • > large unskilled labour force
Environment • 6.5km long, 4.5km wide; little fertile soil; central volcanic mass comprise of 4 low lying basalt islands in an area of swampland and lake.
• There are 2 lakes rotonui & totoiti that farm mitiaro eel (itiki) • Limestone caves, large peat reserves and considerable makatea and swamp
life. • Subsistence farming and fishing widely practiced
Health • New hospital relocated and completed in 2004; resident doctor, reg. nurses; no dental services available. Use of mobile dentist unit.
• Influenza & acute respiratory infections are problems; diarrhoea, conjunctivitis; fish poisoning and asthma cases are also a concern. Also an increase in NCD’s.
Local economy • Public Service (78%) Private (4%) Ad hoc (8%) Overseas Orgn (8%) Religious Orgn (3%) Self employed (0%)
• Subsistence farming and fishing widely practiced • In some instances communal sharing of fish is carried out on island.
Air transport • airport constructed of makatea soil; upgraded in 2001/2002; now suitable for smaller aircrafts and the Saab. 1.6km long
• air strip constructed of crushed and compacted coral and rubble. • 3 flight/week
Sea transport • Shipping services are infrequent; 4 weekly service • Loading/unloading via small boat or barges
Road transport • no sealed road • Unsealed road length – 21km
Water supply • Source: 56 HH connected to public water main; 15HH accessed a public water catchment; 45HH have private rainwater tanks; public water tanks;
• 35HH water piped outside the dwelling; 20HH water piped inside; 7 HH cart water.
• Rain water is principal source of drinking water. A public reticulation system of 56km provides brackish water used for non drinking uses.
Sanitation • Sanitation effective and well designed • 23HH have flush toilets; 36 HH have pour flush; 7HH have pit latrines;
Solid waste • rubbish collection program on island; disposal in managed dumps; bottles are banned on island. A recycling program is in place to raise funds for the school.
Electricity supply • Source: 3 Lister generators 19 hrs/day; capacity kW; • Total consumption/generation 83 MWh in 2000 • Tariffs – $0.36 /kwH domestic $058. /kwH commercial; • Growth due to the increased use of electrical appliances

Appendix 11 13
Telecommunications • Standard telephone, fax & email/internet facilities available on Mitiaro • No formal newspaper; public notice boards used. • FM Radio station that can pick up AM Radio Station in Rarotonga, and is able to
produce local material • Email and internet facilities available through dial up modem. • Television services available to HH at $3/mth.40HH using this service.
KEY ISSUES – MITIARO Issues • Land availability constrained optimise use efficiency
• No asset management plans • Need updated building code (include water tank, septic tank) • Machinery on island is unable to support major developments. • Lack of water storage facilities; water supply is high priority • Waste disposal is a problem
Environment preservation
• Need to create greater environment awareness in the community • Need to promote sustainable development practices
Economic development • Agriculture along with tourism is the backbone of the island. Wandering animals are an issue.
• 6 private businesses on Mitiaro. (2) retail stores; (1) tourist accommodation – 3 beds; (1) carver; (1) women’s handicraft centre; (1) banking service
• ability to produce noni fruit/juice • Expand maire export initiative • Revive interest in handicraft cottage industry • Tourism promotion of natural and unique Mitiaro environment
INFRASTRUCTURE REQUIREMENTS – MITIARO Works identified in Strategic Plan 2000-2005
• Improve community and private water tank reservoirs • Extend water reticulation network to service new households • Install new water bores to support existing water bores • Upgrade Airport runway and purchase of roller. • Continue with upgrading of the harbour; upgrade harbour landing (Omutu) to
improve transporting of cargo. • Transfer from low voltage cables to high voltage cables • Installation of a new generator • Investigate other sources of water/power
Works identified in Annual Business Plan 2006 - 2007
• Purchase grader • Purchase pick up truck
Additional works since SP 2000-2005

14 Appendix 11
ISLAND FACTS SHEET – PALMERSTON Physical features Area: 2.1km 2
Elevation: <4 m above MSL Island type: atoll comprising 6 islets Proximity: 500 km from Rarotonga 367 km from nearest island (Aitutaki) Settlements: 1 village (Horne Islet) Reef comprises 6 islets
Demographics • Population 48 (2001); static • 12 household dwellings (approx 4 people/household) • Dependency ratio 123% • 90% primary school only unskilled labour force
Environment • Reef is infertile; people use “planting pits” for planting vegetables and crops • Indigenous trees on islets • Extensive fishing of parrot fish for Rarotonga market • Major nesting site for green turtle and rare sea birds
Health • High prevalence of diarrhoea, and respiratory infections due to lack of safe water supply
Local economy • Public service (75%); commercial (25%) • Parrot fishing for Rarotonga market • Subsistence farming and fishing widely practiced
Air transport • None at present Sea Transport • Quarterly service
• Access for canoes and light boats is limited to several reef passages to north of village
Road transport • 2km island perimeter unsealed road Water Supply • Source: rainfall capture is the only source
• 11 HH use own rainwater tanks; 5 HH use public water catchments • 8 HH has in-house plumbing; 2 HH have it piped outside dwelling; 2 HH have to
cart. Sanitation • All on-site systems
• 11 HH flush toilets; 5 HH pour-flush toilet; 5 HH pit latrine. In some instances some HH have more than one facility.
Solid Waste • No collection. HH use landfill holes for waste. Electricity Supply • Source: diesel generators; supply is 12 hrs/day; single genset
• 18-hour supply trialed in 2003 • Tariffs – $0.36/kwH domestic
Telecommunications • Telecom provides phone and fax service • No newspaper; public notice boards used. • FM Radio station that can pick up AM Radio Station in Rarotonga, and is able to
produce local material. • E-mail & internet facilities accessible using dial up modems.

Appendix 11 15
KEY ISSUES AND PLANNED INFRASTRUCTURE WORKS – PALMERSTON Issues • Land availability constrained optimise use efficiency
• Unloading of cargo during inclement weather is dangerous • Infrequent shipping and freight services is affecting growth • Unreliable power supply is hampering freezer operations for fishing industry • Water supply improvements – water catchments to be repaired; water tank
repairs; re-establish groundwater wells; fix pumping equipment; formulate community water use policy document
• Transport improvements – airport construction; upgrade access passage • Power supply improvements – repair building for generator, purchase a stand-by
generator, provide 18 hour power supply to community. • Waste management – improve • Improve Human Resource Development on the island • Develop an asset resource management plan.
Environment preservation
• Over use of reef and near-shore environment • High risk of over population of shells risk to lagoon ecology • Risk from over-fishing parrot fish, clam and crayfish stocks in lagoon • Need regular monitoring of lagoon water quality • No Environment Act to protect island • Need to create greater environment awareness in the community • Need to promote sustainable development practices
Economic development • Develop the fishing industry, pearl farm industry, seaweed farming, trochus farming
• Would like to see some tourism development, promote tourism potential of island
• Lack of equipment to utilize coconut resources (copra, wood production) • Encourage private sector development • No hotel facilities on island for visitors. Home stay accommodation • Council to prepare economic development strategy plan for island
INFRASTRUCTURE REQUIREMENTS – PALMERSTON Works identified in Strategic Plan 2000-2005
• Develop island infrastructure – electricity, water, sea access • Airport Construction • Administration Centre/Cyclone Management Centre • Reef and lagoon passage improvement • Revise disaster management plan for Palmerston • FM Radio station that can pick up AM Radio Station in Rarotonga, and is able to
produce local material. • E-mail & internet facilities accessible using dial up modems.
Additional works since SP 2000-2005
•

16 Appendix 11
ISLAND FACTS SHEET – PUKAPUKA Physical features Area: 5 km 2
Elevation: <5 m above MSL Island type: atoll comprising 3 islets Proximity: 1,324 km from Rarotonga 89 km from nearest island (Nassau) Settlements: 3 villages (Roto, Yato, Nake); 3 alternate sites Motu Ko, Motu
Kotawa and Motu Rotu Demographics • Population 662 (2001); declining
• 124 households (approx 5.3 people/household) • Dependency ratio 119% • >70% primary school only large unskilled labour force
Environment • Island is vulnerable to cyclones • Significant ancient taro and puraka swamps • Atoll is nesting site for green and hawksbill turtles and sea birds • Land infertile; Indigenous trees grow on islets
Health • High prevalence of scabies, skin sepsis and ringworm suggesting poor hygiene and lack of safe water supply
Local economy • Public sector (87%) • Small-scale cottage industry for pre-ordered products • Subsistence farming and fishing widely practiced; • 39% unemployment
Air transport • 1,500 m long landing strip • Air service infrequent by charter
Sea transport • No access passage into lagoon; flats between islets are shallow • Ex harbour facilities need upgrading
Road transport • 9 km of unsealed road of acceptable standard • Yato-Walepia Causeway unfinished
Water supply • Source: rainfall capture for potable use; shallow wells for washing • 58 HH use rainwater tanks; 81 HH use public water catchments; • 60 HH cart water to house; 68 HH pipe to front of house
Sanitation • All on-site systems or none at all • 10 HH flush toilets; 114 pour flush; 4 pit latrine
Solid waste • Regular rubbish collection in place – done when drums are full • No rubbish dump, but garbage is composted and reused • Households burn paper and plastics
Electricity supply • For HH and street lights - solar cells, but near end of useful life; • For public buildings use a 21 kW genset provides power from 9am-3pm. • Tariffs – $20/month to trust fund for upgrade works
Telecommunications • No newspaper; public notice boards used. • FM Radio station that can pick up AM Radio Station in Rarotonga, and is able to
produce local material. • E-mail & internet facilities accessible using dial up modems. • Telecom CI provides phone/fax services • Peacesat station used between Pukapuka, Nassau and Rarotonga

Appendix 11 17
KEY ISSUES FROM STAKEHOLDER CONSULTATIONS – PUKAPUKA Issues • The public health and hygiene are a critical issue that needs addressing;
• Land availability constrained optimise use efficiency • Need upgrade of airport for larger planes from Rarotonga • No asset management plans • Need resource management plan for lagoon • Need updated building code (include water tank, septic tank)
Environment preservation
• Over use of reef and near-shore environment • High risk of over population of shells risk to lagoon ecology • Risk from over-development of foreshore areas • Need regular monitoring of lagoon water quality • No Environment Act to protect island • Need to create greater environment awareness in the community • Need to promote sustainable development practices
Economic development • Economic development seen as no. 1 priority alongside I/S • Council wants to promote island as holiday resort – especially eco-tourism, but
need to community attitude survey • People want small cottage industry based development • Promote tourism potential of island • No hotel facilities on island for visitors/home stay available • Council to prepare economic development strategy plan for island
INFRASTRUCTURE REQUIREMENTS – PUKAPUKA Works identified in Strategic Plan 2000-2005
• Improve harbour facilities • Construct cyclone shelters • Maintain and improve existing roads • Provide HH with 9,000 L tanks; build more public tanks • Study groundwater lens quality and adequacy • Procure diesel generator upgrade electricity distribution
Additional works since SP 2000-2005
•

18 Appendix 11
ISLAND FACTS SHEET – NASSAU Physical features Area: 1.3 km 2
Elevation: <4 m above MSL Island type: sandy cay Proximity: 1,204 km from Rarotonga 44 km from nearest island (Pukapuka) Settlements: 1 village
Demographics • Population 72 (2001); declining • 15 households (approx 4.8 people/household) • Dependency ratio 148% • >70% primary school only large unskilled labour force
Environment • Dense vegetation • Lagoon is a crucial marine resource • Extensive sea bird nesting on isolated islets • Land not suitable for annual or tree crops • Potential risk to lagoon ecology is from aquaculture activities
Health • High prevalence of diarrhoea, and respiratory infections due to lack of safe water supply
Local economy • Subsistence farming and fishing widely practiced • Some fish sold for cash;
Air transport • 1,300 m long landing strip; • Air service only when flight is full both ways and/or chartered • Fuel storage facility – 200L drums of aviation fuel
Sea transport • 6 weekly service • Loading/unloading via small boat or barges
Road transport • No sealed road • Unsealed road length – n/a
Water supply • Source: rainfall capture is the only source • 103 HH use rainwater tanks; 28 HH use public water catchments;
Sanitation • All on-site systems or none at all. • 1 HH flush toilet; 9 pour flush; 6 pit latrine;
Solid waste • no collection; rubbish disposal are problems; wandering pigs, flies a problem Electricity supply • Source: diesel generators; supply is 12 hrs/day; capacity 76 kW
• Total consumption/generation 18 MWh in 2000 Telecommunications • No newspaper; public notice boards used.
• FM Radio station that can pick up AM Radio Station in Rarotonga, and is able to produce local material
KEY ISSUES AND PLANNED INFRASTRUCTURE WORKS – NASSAU Issues • Land availability constrained optimise use efficiency
• Need upgrade of airport for larger planes from Rarotonga • No asset management plans • Need updated building code (include water tank, septic tank)
Environment preservation
• Over use of reef and near-shore environment • High risk of over population of shells risk to lagoon ecology • Risk from over-development of foreshore areas • Need regular monitoring of lagoon water quality

Appendix 11 19
• No Environment Act to protect island • Need to create greater environment awareness in the community • Need to promote sustainable development practices
Economic development • Economic development seen as no. 1 priority alongside I/S • Council wants to promote island as holiday resort – especially eco-tourism, but
need to community attitude survey • People want small cottage industry based development • Promote tourism potential of island • No hotel facilities on island for visitors/home stay available • Council to prepare economic development strategy plan for island
INFRASTRUCTURE REQUIREMENTS – NASSAU Works identified in Strategic Plan 2000-2005
• ongoing maintenance of roads • widen cause way • Construct cyclone shelter • build more water tanks and catchments
Additional works since SP 2000-2005
•

20 Appendix 11
ISLAND FACTS SHEET – MANIHIKI Physical features Area: 5.4 km 2
Elevation: <4 m above MSL Island type: atoll Proximity: 1,204 km from Rarotonga 44 km from nearest island (Rakahanga) Settlements: 2 villages (Tauhunu, Tukao)
Demographics • Population 498 (2001); declining • 118 households (approx 4.2 people/household) • Dependency ratio 38% • >70% primary school only large unskilled labour force
Environment • 41 km2 lagoon area surrounding island • Lagoon is a crucial marine resource • Extensive sea bird nesting on isolated islets • Land not suitable for annual or tree crops • Potential risk to lagoon ecology is from aquaculture activities
Health • Health clinic in Tukao completed 2004; reg nurse; Hospital in Tauhunu still under construction; doctor operates from child welfare clinic; nurse practitioner;
• High prevalence of diarrhoea, and respiratory infections due to lack of safe water supply
Local economy • Black pearl aquaculture main employer (70%) • Public service (20%); cottage industries (7%); commercial (3%) • Subsistence farming and fishing widely practiced
Air transport • 1,300 m long landing strip • Air service 1 flight/week • Fuel storage facility – 200L Drums of aircraft fuel in an open roofed storage
facility Sea transport • Monthly service
• Loading/unloading via small boat or barges Road transport • No sealed roads
• Unsealed road length – n/a • Number of vehicles: trucks, autos, motorbikes
Water supply • Source: rainfall capture is the only source • 103 HH use rainwater tanks; 28 HH use public water catchments
Sanitation • All on-site systems or none at all • 80 HH flush toilets; 25 pour flush; 2 pit latrine; 12 lagoon toilets
Solid waste • Tukao – have regular collection; large landfill hole used as community dump • Tauhunu – no rubbish collection; rubbish and pearl shell disposal are problems;
wandering pigs a problem Electricity supply • Source: diesel generators; supply is 18 hrs/day; capacity 76 kW.
• Total consumption/generation 18 MWh in 2000 • Tariffs – $0.58/kWh commercial; $0.36/kwH domestic
Telecommunications • No newspaper; public notice boards used. • FM Radio station that can pick up AM Radio Station in Rarotonga, and is able to
produce local material. • Have 4-channel satellite TV • E-mail & internet facilities accessible using dial up modems.

Appendix 11 21
Cyclone shelters • One cyclone shelter in each village Maintenance facilities • One workshop in Tauhunu that stores machinery but right next to the lagoon;
none in Tukao. Current facility is in water tank shelters. • Construction equipment
KEY ISSUES – MANIHIKI Issues • Land availability constrained optimise use efficiency
• Need upgrade of airport for larger aircraft from Rarotonga • No asset management plans • Need resource management plan for lagoon • Need for Environment Protection Plan • Need for a Waste Management Plan • Need updated building code (include water tank, septic tank)
Environment preservation
• Over-use of reef and near-shore environment • High risk of over-population of shells risk to lagoon ecology • Risk from over-development of foreshore areas • Control fuel spills and storage on land and kaoa • Need regular monitoring of lagoon water quality • No Environment Act to protect island • Need to create greater environment awareness in the community • Need to promote sustainable development practices
Economic development • Economic development seen as no. 1 priority alongside Infrastructure • Council wants to promote island as holiday resort – especially eco-tourism, but
need a community attitude survey • People want small cottage industry based development • Promote tourism potential of island • One motel/hotel facility (2 self contained bungalows) in Tauhunu & a Guest
House in Tukao for visitors • Council to prepare economic development strategy plan for island
INFRASTRUCTURE REQUIREMENTS – MANIHIKI Works identified in Strategic Plan 2000-2005
• airport runway upgrade; airport terminal • maintenance workshops • ongoing maintenance of roads • water tanks and catchments • harbour, port and marina upgrade • new rubbish tip for Tauhunu & Tukao • marina and lagoon jetty • foreshore and coastal reforestation
Works identified in Annual Business Plan 2006 - 2007
• Upgrade and maintain all roads in Manihiki • Maintenance and upgrade airport runway and clearance • Complete construction of airport terminal • Complete Tauhunu Harbour project • • Cyclone Management Centre Upgrade & Maintenance • Construction of Administration Building in Tukao Village • Renovate Administration Building in Tauhunu Village
Additional works since SP 2000-2005
•

22 Appendix 11
ISLAND FACTS SHEET – RAKAHANGA Physical features Area: 4.1 km 2
Elevation: <5 m above MSL Island type: raised coral atoll Proximity: 1248km from Rarotonga 44 km from nearest island (Manihiki) Settlements: 1 village at the southwest end of the atoll
Demographics • Population 169 (2001); declining • 32 households (approx 5 people/household) • Dependency ratio 93% • >2001; 1 school; 18% pre school; 65% primary; 18% secondary large
unskilled labour force; vocational training available. Environment • Poor atoll soil
• Green turtle nesting site • Lagoon is a crucial marine resource • Extensive sea bird nesting on isolated islets • Land not suitable for annual or tree crops • Potential risk to lagoon ecology is from aquaculture activities
Health • Health clinic served by a Nurse Practitioner. In cases of emergency, Doctor from Manihiki travels to Rakahanga or patient is referred to Manihiki, and then on to Rarotonga
• Dental Technician also on island to service dental care • High prevalence of diarrhoea, and respiratory infections due to lack of safe water
supply Local economy • Public Service (88%) Private (3%) Ad hoc (3%) Overseas Orgn (3%) Religious
Orgn (3%) • Only two pearl farms one for the community & one owned by the church. No
private farms. Approx (90%) of population operate a farm in Manihiki • Subsistence farming and fishing widely practiced • Production of tuna jerky for sale to Rarotonga Markets
Air transport • 1.7km airstrip long landing strip not in use; • Those travelling to Rakahanga, fly into Manihiki and go by boat to Rakahanga
Sea transport • 6-8 weekly service • Loading/unloading via small boat or barges
Road transport • No sealed road • Unsealed road length – 2km
Water supply • Source: rainfall capture is the only source • 26 HH use rainwater tanks; 6 HH use public water catchments; • 16 HH had water piped outside the dwelling; 8 HH had piped inside; 8 HH had to
cart water. Sanitation • All on-site systems or none at all.
• 12 HH flush toilet; 20 pour flush; no pit or lagoon toilets in use; Solid waste • there is rubbish collection; community rubbish dump is in the form of a landfill
hole; wandering pigs, flies a problem Electricity supply • Source: hybrid system supplies 24 hrs/day; capacity 76 kW
• Total consumption/generation 18 MWh in 2000 • Tariffs – $0.40/kwH domestic $0.62/kwH commercial • Plan is to expand into wind turbine

Appendix 11 23
Telecommunications • No newspaper; public notice boards used. • Telecom provides telephone and fax services. • Email and internet facilities are accessible by dial up modem • FM Radio station that can pick up AM Radio Station in Rarotonga, and is able to
produce local material KEY ISSUES – RAKAHANGA Issues • Land availability constrained optimise use efficiency
• No airport on Rakahanga. Air transport is accessed through Manihiki • No asset management plans • Need updated building code (include water tank, septic tank)
Environment preservation
• Over use of reef and near-shore environment • High risk of over population of shells risk to lagoon ecology • Need regular monitoring of lagoon water quality • No Environment Act to protect island • Need to create greater environment awareness in the community • Need to promote sustainable development practices
Economic development • Economic development seen as no. 1 priority alongside I/S • Council wants to promote island as holiday resort – especially eco-tourism, but
need to community attitude survey • Development of handicraft and find markets. • People want small cottage industry based development • No hotel facilities on island for visitors/home stay available • Council to prepare economic development strategy plan for island
INFRASTRUCTURE REQUIREMENTS – RAKAHANGA Works identified in Strategic Plan 2000-2005
• construct a cargo shed and construct maintenance workshop • repair cause way • research alternative possible energy sources • ongoing maintenance of roads • Upgrade water catchments; build more water tanks and catchments • Develop maintenance plans for harbour • Construct cyclone shelter • basic infrastructure to support commercial fishing industry
Works identified in Annual Business Plan 2006 - 2007
• Upgrade all roads and community water tanks on Rakahanga • Construct a storage shed for hydroponics materials • Maintenance of all machineries on Rakahanga • Purchase new excavator est $135,000 • Building extension of TV Station est $18,000 • Complete renovation of Rakahanga Hospital est $15,000 • Complete renovation of Government Representaive’s Residence est $19,000 • Construct a fish processing plant est $16,000
Additional works since SP 2000-2005
• Explore alternative water sources

24 Appendix 11
ISLAND FACTS SHEET – PENRHYN Physical features Area: 9.84 km 2
Elevation: <4 m above MSL Island type: raised coral atoll Proximity: 1365km from Rarotonga 354 km from nearest island (Rakahanga) Settlements: 2 villages Omoka & Tetautua separated by 10.5km of lagoon.
Demographics • Population 351 (2001); declining • 84 households (approx 4 people/household) • Dependency ratio 96% • >2002; 2 Schools. 12% pre school; 52% primary; 35% secondary large
unskilled labour force Environment • Poor atoll soil
• Green turtle nesting site • Lagoon is a crucial marine resource • Extensive sea bird nesting on isolated islets • Land not suitable for annual or tree crops • Potential risk to lagoon ecology is from aquaculture activities
Health • Hospital on Omoka is where the doctor is based. A nurse practitioner operates the clinic in Tetautua, and emergency cases from Tetautua are referred to Omoka, or on to Rarotonga
• No dental services on island • High prevalence of diarrhoea, and respiratory infections due to lack of safe water
supply Local economy • Public Service (47%) Private (28%) Ad hoc (9%) Overseas Orgn (14%)
Religious Orgn (2%) • Fishing and Pearl farming are the mainstays of the island. • Private sector consists of the bank and 6 retail outlets of grocery items • Subsistence farming and fishing widely practiced • Attractive location from which to operate long lining for tuna.
Air transport • 1.6km airstrip long landing; • 1 flight/week
Sea transport • 6-8 weekly service • Omoka wharf built during the American occupation and has the capability of
berthing medium to large vessels. • Penrhyn also a port of entry and has a fuel depot at the wharf constructed by
AUS Government. • Loading/unloading via small boat or barges
Road transport • No sealed road • Unsealed road length – 2km
Water supply • Source: rainfall capture is the only source • 26 HH use rainwater tanks; 6 HH use public water catchments; • 16 HH had water piped outside the dwelling; 8 HH had piped inside; 8 HH had to
cart water. Sanitation • All on-site systems or none at all.
• 44 HH flush toilet; 29 pour flush; 14 lagoon toilets. • Water shortages can cause problems for all flush toilets
Solid waste • there is no rubbish collection but there is a community rubbish dump in the form

Appendix 11 25
of a landfill hole; wandering pigs, flies a problem Electricity supply • Source: Generator 24 hrs/day; capacity 76 kW
• Total consumption/generation 87 MWh in 2000 • Tariffs – $0.48/kwH domestic $0.48/kwH commercial • New generator & substation funded under AusAid completed in 2000
Telecommunications • No newspaper; public notice boards used. • Telecom provides telephone and fax services. • Email and internet facilities are accessible by dial up modem • FM Radio station that can pick up AM Radio Station in Rarotonga, and is able to
produce local material • There is a television station
KEY ISSUES – PENRHYN Issues • Land availability constrained optimise use efficiency
• No asset management plans • Need for disaster management plan • Need updated building code (include water tank, septic tank)
Environment preservation
• Over use of reef and near-shore environment • Only 1/16th of lagoon being used for farming. A hatchery operates to produce
spats for farmers. • Need regular monitoring of lagoon water quality • Need for Lagoon Management Plan • Production and maintenance Strategy for Hatchery & Laboratory facility • No Environment Act to protect island • Need to create greater environment awareness in the community • Need to promote sustainable development practices
Economic development • Economic development seen as no. 1 priority alongside I/S • Handicraft is a major cottage industry in Penrhyn utilising rito (bleached coconut
leaves) fully supported by Council. An established market has been set with Rarotonga outlets & agents
• Carving on pearl shells could also be a potential economic activity however limited tools & promotion hinder this activity.
• No hotel facilities on island for visitors/home stay available • Community has expressed interest establishing a small scale operation for nono
processing. • Tourism not considered a priority due to the distance factor & lack of
accommodation facilities, regular air services, & the inability to provide support services.
INFRASTRUCTURE REQUIREMENTS – PENRHYN Works identified in Strategic Plan 2000-2005
• Airport upgrade • Harbour upgrade • Port upgrade as a possibility of using Penrhyn as a “port of call” • Maintenance of hatchery & laboratory • Improve waste management systems • Improve water catchments; possibility of desalinator unit • Ongoing maintenance of public amenities & facilities • ongoing maintenance of roads • Construct maintenance workshop

26 Appendix 11
• Develop maintenance plans for harbour • Construct cyclone shelter • basic infrastructure to support commercial fishing industry
Works identified in Annual Business Plan 2006 - 2007
• Maintenance of community water reservoirs • Maintenance of roads and drainage systems • Maintenance and upgrade of airport runway and terminal • Maintenance of all Government buildings
Additional works since SP 2000-2005

Appendix 11 27
II. STATUS OF UTILITY SERVICES
Overview of Existing Water Supply Services – Southern Islands Group Item Rarotonga Aitutaki Mangaia Atiu Mauke Mitiaro Manuae Takutea Source 12 streams Groundwater via 8
bores 3 streams; rainwater; groundwater
Groundwater via 2 wells
Groundwater via 5 boreholes
1 spring; rainwater
Distribution Gravity pipe network
Pumped pipe network
Pumped pipe network to houses, public standpipes; domestic water tanks
Pumped pipe network coverage 86%; 14% rely on water carts and rainwater
Pumped pipe network to all houses
Pumped pipe network to houses, public standpipes; community water tanks
These two islands are uninhabited, so no permanent infrastructure present
Coverage Over 97% Over 97% Over 97% Over 97% Over 97% Over 97% Adequacy Adequate quantity
for now; however, water quality is not potable as there is no disinfection of the supply
Inadequate as need to apply rationing from time to time. Water quality does not meet micro-biological standards
Adequate for now where supplemented with rainwater; inadequate in areas where supply is augmented with groundwater due to frequent pump failure
Adequate for now, supplemented by rainwater
Adequate for now
Adequate for now with rainwater as supplementary source
Issues Finite resources; large seasonal flow variation; supply not disinfected; no metering; high losses; corroded pipes; significant in-house losses; water also used for agriculture; no metering
Groundwater depletion a concern; need continuous supply as island is a tourist destination; supply not disinfected; no metering; no incentive to conserve water
Contamination of streams by animals; turbid after rain; water also used for agriculture; no metering; high leakage and wastage losses; no incentive for conservation
Groundwater depletion a concern; supply inadequate in prolonged dry periods; water also used for agriculture; high losses due to leakage and wastage; no metering
Groundwater depletion a concern; pump failures frequent; water also used for agriculture; high losses due to leakage and wastage; no metering
Groundwater brackish; not enough storage for prolonged dry periods; pumping failures; water also used for agriculture; no metering; high losses due to leaks, wastage

28 Appendix 11
Overview of Existing Water Supply Services – Northern Islands Group Item Palmerston Pukapuka Nassau Manihiki Rakahanga Penrhyn Suwarrow Source Rainwater
harvesting Rainwater harvesting
Rainwater harvesting
Rainwater harvesting
Rainwater harvesting
Rainwater harvesting
Distribution Community and household tanks
Community and household tanks; piped to government buildings
Community and household tanks
Community and household tanks
Community and household tanks
Community and household tanks
Island uninhabited, so no permanent infrastructure present
Coverage Over 97% Over 97% Over 97% Over 97% Over 97% Over 97% Adequacy Adequate for
now; inadequate in prolonged dry (no rainfall) periods
Adequate for now; inadequate in prolonged dry (no rainfall) periods
Adequate for now; inadequate in prolonged dry (no rainfall) periods
Adequate for now; inadequate in prolonged dry (no rainfall) periods
Adequate for now; inadequate in prolonged dry (no rainfall) periods
Adequate for now; inadequate in prolonged dry (no rainfall) periods
Issues Limited supply during drought; not enough storage for prolonged dry periods; supply not disinfected so need boiling
Limited supply during drought; not enough storage for prolonged dry periods; supply not disinfected so need boiling
Limited supply during drought; not enough storage for prolonged dry periods; supply not disinfected so need boiling
Limited supply during drought; not enough storage for prolonged dry periods; supply not disinfected so need boiling
Limited supply during drought; not enough storage for prolonged dry periods; supply not disinfected so need boiling
Limited supply during drought; not enough storage for prolonged dry periods; supply not disinfected so need boiling

Appendix 11 29
Overview of Existing Wastewater Management Services – Southern Islands Group Item Rarotonga Aitutaki Mangaia Atiu Mauke Mitiaro Manuae Takutea Type of treatment Septage treatment
pond; package treatment plant for neighbourhood scheme; on-site systems
Septage treatment pond; On-site systems; big hotels have onsite package treatment plants;
On-site systems, pit latrines still being used
On-site systems; pit latrines still being used
On-site systems; pit latrines still being used
On-site systems; pit latrines still being used
These two islands are uninhabited, so no permanent infrastructure present
Coverage Onsite system covers 99%; neighbourhood scheme covers 30 households
Onsite system covers 98%;
On-site system coverage 98%; pit latrine usage 45%
On-site system coverage 98%; pit latrine usage 60%
On-site system coverage 98%; pit latrine usage 90%
On-site system coverage 98%; pit latrine usage 10%
Adequacy Ok for now; Ok for now Ok for now Ok for now Ok for now Ok for now Issues Effluent
management is an emerging problem; algal blooms in lagoon; frequent fish poisoning; should review draft national sewage regulations
Risk of groundwater contamination; desludging of septic tanks not regular; nutrients in lagoon; water-borne diseases common; national sewage regulations
Risk of contaminating groundwater supply source; risk of polluting lagoon; no septic tank desludging program; no septage treatment facilities
Risk of contaminating groundwater supply source; risk of polluting lagoon; no septic tank desludging program; no septage treatment facilities
Risk of contaminating groundwater supply source; risk of polluting lagoon; no septic tank desludging program; no septage treatment facilities
No desludging program for septic tanks, groundwater contamination

30 Appendix 11
Overview of Existing Wastewater Management Services – Northern Islands Group Item Palmerston Pukapuka Nassau Manihiki Rakahanga Penrhyn Suwarrow Type of treatment
On-site systems, pit latrines
On-site systems, pit latrines, lagoon Practice
On-site systems, pit latrines
On-site systems, pit latrines; lagoon toilets
On-site systems, pit latrines
On-site systems, pit latrines
Coverage Onsite systems 100%; plus 50% still have put latrines
Onsite systems coverage 98%; pit latrines 4%
Onsite systems coverage 98%; pit latrines 40%
On site system coverage 90%; pit latrines 2%; lagoon toilet 10%
On site system coverage 98%; pit latrines 12%;
98%
Island uninhabited, so no permanent infrastructure present
Adequacy Ok for now Ok for now Ok for now Ok for now Ok for now Ok for now Issues Contamination of
freshwater lens beneath atoll is an emerging problem; risk of polluting lagoon; no septic tank desludging program; no septage treatment facilities
Contamination of freshwater lens beneath atoll is an emerging problem; risk of polluting lagoon; no septic tank desludging program; no septage treatment facilities
Contamination of freshwater lens beneath island is an emerging problem; risk of polluting lagoon; no septic tank desludging program; no septage treatment facilities
Risk of Contaminating groundwater; Risk of polluting lagoon; significant waterborne diseases on island; no septic tank desludging program; no septage treatment facilities
Contamination of freshwater lens beneath atoll is an emerging problem; risk of polluting lagoon; no septic tank desludging program; no septage treatment facilities
Contamination of freshwater lens beneath atoll is an emerging problem; risk of polluting lagoon; no septic tank desludging program; no septage treatment facilities

Appendix 11 31
Overview of Existing Solid Waste Management Services – Southern Islands Group Item Rarotonga Aitutaki Mangaia Atiu Mauke Mitiaro Manuae Takutea Type of treatment and disposal
Municipal landfill; recycling centres
Municipal landfill
Municipal dumps; recycling centre
Municipal dumps;
Municipal dumps
Municipal dumps
Collection Domestic collection 1-2 times per week; commercial at own cost as requested; separation at source practiced; recyclables shipped to NZ; metals collected separately and shipped to north east Asia
Fortnightly collection; otherwise as for Rarotonga
Weekly collection by Island Council; separation and recycling being practiced
Weekly collection by Island Council; recycling and separation slowly being introduced and practiced
Fortnightly collection by Island Council; recycling and separation slowly being introduced and practiced
Weekly collection by Island Council; bottles are banned; recycling and separation introduced and practiced; recycling programs used to raise funds for schools
These two islands are uninhabited, so no permanent infrastructure present
Adequacy Adequate Adequate Adequate for now
Adequate for now
Adequate for now
Adequate for now
Issues separation at source needs improvement through more public awareness;
Contamination of aquifers if leachate not managed properly; as for Rarotonga
Groundwater contamination risks; separation at source needs improvement through more public awareness; no fees collected
Groundwater contamination risks; need to raise public awareness for improving separation at source; no fees collected; disposal of old appliances
Groundwater contamination risks; need to raise public awareness for improving separation at source; disposal of old appliances
Contamination of groundwater risks; need to raise public awareness for improving separation at source; disposal of old appliances

32 Appendix 11
Overview of Existing Solid Waste Management Services – Northern Islands Group Item Palmerston Pukapuka Nassau Manihiki Rakahanga Penrhyn Suwarrow Type of treatment and disposal
Rubbish is buried on site or communal pits
No municipal dump; have municipal compost site; composted material reused; households burn plastics, paper
Private pits Private and municipal dumps
Private and municipal pits
Private and municipal pits
Collection No collection; disposal by households
Regular collection by Island Council when household drums are full;
No collection; disposal by households
Weekly collection by Island Council in Tukao only; elsewhere disposal by households
Weekly collection by Island Council; disposal by households in communal pits is widely practiced
No collection; disposal by households
Island uninhabited, so no permanent infrastructure present
Adequacy Adequate for now Adequate for now Adequate for now Inadequate; new dump site needed
Adequate for now Adequate for now
Issues Groundwater contamination risks; disposal of old appliances and hazardous material
Groundwater contamination; potential health hazard from to households from burning plastics; customary land issues for landfill; disposal of old appliances and hazardous material
Groundwater contamination risks; wandering pigs and flies a problem with open rubbish dump sites; composting and waste minimization program needed; disposal of old appliances and hazardous material
Groundwater contamination risks; in Tauhunu disposal pits pose health hazards and attract wandering pigs and flies; waste minimization and composting program needed; disposal of old appliances and hazardous material
Groundwater contamination risks; wandering pigs and flies a problem with open rubbish dump sites; composting and waste minimization program needed; disposal of old appliances and hazardous material
Groundwater contamination risks; wandering pigs and flies a problem with open rubbish dump sites; composting and waste minimization program needed; disposal of old appliances and hazardous material

Appendix 11 33
Overview of Existing Electricity Supply Services – Southern Islands Group Item Rarotonga Aitutaki Mangaia Atiu Mauke Mitiaro Manuae Takutea Electricity
Source Diesel gensets Diesel gensets Diesel gensets; 24 hrs/day supply; pilot wind power generation
Diesel gensets Diesel gensets; 19 hrs/day supply
Diesel gensets; 19 hrs/day supply
Distribution By TAU (state owned enterprise); overhead low and underground high voltage lines;
By APS (state owned enterprise); underground high and overhead low voltage lines;
By Island Council; overhead lines
By Island Council; overhead lines
By Island Council; overhead lines
By Island Council; both overhead and underground lines
These two islands are uninhabited, so no permanent infrastructure present
Coverage All; over 97% Over 97% Over 95% Over 95% Over 95% Over 95% Adequacy Adequate Adequate;
some outages Adequate; some outages
Some outages Some outages Inadequate; some outages
Issues Could put lines underground for better cyclone protection;
Security of supply; CIC overseeing its privatization;
High O&M costs, high user costs, limited technical capacity
Maintenance costs high; wooden power poles need replacement; genset failures; limited technical capacity
Maintenance costs high; distribution system needs better maintenance; genset failures; limited technical capacity; supply limitations
Maintenance costs, genset failures; limited technical capacity; supply limitations; demand management

34 Appendix 11
Overview of Existing Electricity Supply Services – Northern Islands Group Item Palmerston Pukapuka Nassau Manihiki Rakahanga Penrhyn Suwarrow Source Diesel genset;
supply 19 hrs/day Diesel genset for public buildings (9 am – 3 pm) and as emergency back up; solar power used otherwise;
Diesel genset; supply 19 hrs/day
Diesel genset; supply 19 hrs/day
Diesel genset/battery bank (hybrid); supply 24 hrs/day
Diesel genset; supply 24 hrs/day
Distribution Reticulated and private
Reticulated and private
Reticulated and private
Reticulated and private
Reticulated Reticulated and private
Island uninhabited, so no permanent infrastructure present
Coverage Over 95% Over 95% Over 95% Over 95% Over 95% Over 95% Adequacy Adequate for now Adequate for now Adequate for now Adequate for now Adequate for now Adequate for now Issues Maintenance,
lack of technical capacity
Solar batteries near end of useful life; high capital costs for solar units; converters for household appliances too expensive; maintenance of assets; lack of technical capacity
Maintenance, lack of technical capacity
Maintenance; lack of technical capacity
Maintenance; lack of technical capacity;
Maintenance; lack of technical capacity

Appendix 11 35
Overview of Existing Telecommunication Services – Southern Islands Group Item Rarotonga Aitutaki Mangaia Atiu Mauke Mitiaro Manuae Takutea Network services Underground
land lines; GSM network; 56 kbs dial up Internet; 256 kbs ADSL broadband Internet
Land lines(u/g); GSM network; 56 kbs dial up Internet; 115 kbs IDSL broadband Internet
Land line (u/g); 28 kbs dial up Internet access
Land line (u/g); 28 kbs dial up Internet access
Land line (u/g); 28 kbs dial up Internet access
Land line (u/g); 28 kbs dial up Internet access
These two islands are uninhabited, so no permanent infrastructure present
Coverage 84% dwellings 80% dwellings 84% dwellings 80% dwellings 84% dwellings 80% dwellings Cyclone warning Broadcast on
local FM radio; rebroadcast on HF radio
Broadcast on local AM radio; rebroadcast on HF radio
Broadcast on local AM radio; rebroadcast on HF radio
Broadcast on local AM radio; rebroadcast on HF radio
Broadcast on local AM radio; rebroadcast on HF radio
Broadcast on local AM radio; rebroadcast on HF radio
Adequacy Adequate Adequate Adequate Adequate Adequate Adequate Issues Residents
content with level of service; no issues; 2% broadband user target
As for Rarotonga
Residents content with level of service; no issues; 2% broadband user target
As for Rarotonga
Residents content with level of service; no issues; 2% broadband user target
As for Rarotonga

36 Appendix 11
Overview of Existing Telecommunication Services – Northern Islands Group Item Palmerston Pukapuka Nassau Manihiki Rakahanga Penrhyn Suwarrow Network services
Only public phones/faxes; Internet centre
Land line u/g); Peacesat station link up with Rarotonga and Nassau; 28 kbs dial up Internet access
Only public phones/faxes; Peacesat station link up with Rarotonga and Pukapuka; Internet centre
Land line (u/g); 28 kbs dial up Internet access; 4-channel satellite television
Land line (u/g); 28 kbs dial up Internet access
Land line (u/g); 28 kbs dial up Internet access;
Coverage 80% dwellings; 80% dwellings; 80% dwellings; 80% dwellings; 80% dwellings; 80% dwellings;
Island uninhabited, so no permanent infrastructure present
Cyclone warning
Broadcast on local AM radio; rebroadcast on HF radio
Broadcast on local AM radio; rebroadcast on HF radio
Broadcast on local AM radio; rebroadcast on HF radio
Broadcast on local AM radio; rebroadcast on HF radio
Broadcast on local AM radio; rebroadcast on HF radio
Broadcast on local AM radio; rebroadcast on HF radio
Adequacy Adequate Adequate Adequate Adequate Adequate Adequate Issues Maintenance; Maintenance; Maintenance; Maintenance; Maintenance; Maintenance; no
television service;

Appendix 11 37
III. INFRASTRUCTURE INVENTORY
Water Supply Inventory Island: Rarotonga Date: SOURCES Rainwater Type #1 Type #2 Type #3 Type #4 Number of domestic rainwater tanks 206 capacity of tanks (L) typical catchment/roof area (m2) first flush mechanism fitted (Y/N) tank condition water quality Number of communal rainwater tanks 46 capacity of tanks (L) typical catchment area (m2) first flush mechanism fitted (Y/N) tank condition water quality adequate cyclone protection for tanks
Groundwater Bore #1 Bore #2 Bore #3 Bore #4 bore diameter (mm) None depth to water table (m) no. of pumps pump make and model pump model pump duty if known (flow, head) bore/pump condition water quality Groundwater Bore #5 Bore #6 Bore #7 Bore #8 bore diameter (mm) None

38 Appendix 11
depth to water table (m) no. of pumps pump make pump model pump duty if known (flow, head) bore/pump condition water quality Springs Source #1 Source #2 Source #3 Source #4 discharge rate (L/s) None seasonal variation in flow (large-small) elevation above sea level (m) water quality
Streams Stream Name Avatiu Matavera Ngatoe Rutaki Takuvain
e Totokoitu Avana Turangi
discharge rate (L/s) Lowest Recorded 15.9l/s 30.5l/s 9.98l/s 15.646l/s 26.615l/s 11.988l/s 24.368l/s 35.084l/s Highest Recorded 281.23l/s 156.09l/s 77.25l/s 150.557l/s seasonal variation in flow (large-small) elevation above sea level (m) 84.00msl 65.00msl 60.00msl 60.00msl 60.00msl 66.00msl 84.00msl 74.00msl water quality
DISTRIBUTION SYSTEM Pipelines Type #1 Type #2 Type #3 Type #4 diameter (mm) 250, 200, 150, 100, 75,
50
total length (m) 200km (Est.)
material (GI, PVC, HDPE etc) uPVC, AC, GI, MDPE condition Varies year installed 1960's to
2005

Appendix 11 39
Distribution Storages capacity 2.425
mega litres
elevated/on-ground On ground condition Fair adequate cyclone protection good
Pump Stations Pump
Station #1 Pump Station #2
Pump Station #3
no. of pumps 1 (Tereora)
1 (Tepuka)
pump make Grundfos Helical pump model Multi
Stage
pump power rating (kW) pump duty if known (flow, head) 50m condition of pumps Fair Fair year of installation 2001 2001 power supply Electrical Electrical Isolating Valves number Many diameter Ranging from 50 - 250 condition Fair to
Good
TREATMENT NA communal source treatment nil households boiling water? ( Y/N) only when advised by Helath
Department

40 Appendix 11
OPERATION AND MAINTENANCE no. of operators/technicians 14 skill type and qualification of technicians water engineers, water quality technicians, pipe
fitters, plumbers
how often are rainwater tanks cleaned plant and equipment used are headworks cyclone-proof? annual council operating costs ($/year)
USER CHARACTERISTICS 2001 no. of people on island 12188 no. of households on island 2556 no. connections to piped network 2450 no. properties not connected to network and have no rainwater tank no. dwellings relying on water vendors 19
COMMUNITY WATER RELATED ISSUES list any issues here: 1. turbid reticulated water when it rains 2. takes a long time for leakages/breakages on the main to be fixed or repaired
3. no reserve storage for emergencies, eg. drought, cyclones

Appendix 11 41
Wastewater Management Inventory Island: Rarotonga Date: ON-SITE SYSTEMS Septic Tanks Type #1 Type #2 Treatment system quantity (no. of tanks) 3272 capacity (L) varies no. of chambers 1, 2, 3 tank condition (typical) desludging frequency (years) Depends Effluent disposal absorption trenches (if Yes length, m) soakage pits disposal to land or sea nil get on-site water logging? (Y/N) no
Pit Latrines NA quantity (installed in how many houses) typical capacity ( m3) condition (well maintained, flies etc) how often is it "moved"? get on-site water logging? (Y/N) Lagoon Toilets NA quantity (used by how many houses) how often "move" Other description Pour flush no. of households using this method 118

42 Appendix 11
In-house Wastewater Generation Toilets no. flush units 3272 no. pour-flush units 118 Wastewater sources* are black and grey waters separated (Y/N) no if separated, where is greywater going? *note: blackwater - toilet, kitchen wastes; greywater - wastewater from bath, laundry etc
Commercial Premises Type #1 Type #2 Type #3 Type #4 Treatment plant type of process biofilters capacity (m3/day) no. of such facilities on island 11 to where is treated effluent discharged? on site power source and usage (kWh) condition of plant year installed Waste management is effluent discharge monitored/recorded? no effluent quality how is sludge treated and how often? SEPTAGE TREATMENT FACILITIES NA type of system capacity (m3/day) to where is treated effluent discharged? power source and usage (kWh) condition of plant year installed OPERATION AND MAINTENANCE NA

Appendix 11 43
no. of plumbers on the island Private contractor - desludging
skill level/qualification of technicians if have central plant, no. of operators plant and equipment used annual municipal operating costs ($/year) ENVIRONMENTAL EFFECTS are there any algal blooms in lagoon? some parts of the island lagoon water quality freshwater lens water quality
HEALTH EFFECTS collect annual statistics fro the past 3-5 years on water-borne diseases Year 2005 2004 2003 2002 infant mortality diarrhea dysentery hepatitis worms fish poisoning COMMUNITY ATTITUDE 1. Satisfaction with the current sanitation practices?
2. Aware of the link between groundwater contamination and onsite waste disposal (septic tanks)?
3. Is it better to discharge treated waste water into the sea (beyond the reef if possible) or to land?
4. Is there any link between the waste discharge and the water quality in the lagoon?
5. What is preferable, discharge of reclaimed water from waste plants to land or into the sea?

44 Appendix 11
6. Willing to make a small contribution towards operating a wastewater system if it eliminates waste problems around the house?
COMMUNITY SANITATION ISSUES list any issues here:

Appendix 11 45
Solid Waste Management Inventory Island: Rarotonga Date: WASTE DISPOSAL METHODS Domestic Waste indicative quantity (kg/household/week) .21kg/p/d any separation at source? (Y/N) some, about 30% how separated? (compostables, etc) glass, plastics, aluminium,
general refuse
how is rubbish stored at the house? bins, containers, plastic bags, sacks, 40gal drums, boxes means of disposal (council collection, self) Contract (with MOW) compostables yes plastics, paper yes frequency of disposal (days) weekly
Commercial Waste no. people on premises 541 commercial
establisments
indicative quantity (kg/premise. week) 2.07kg/premise/week any separation at source? (Y/N) Contractor charges extra if not separate at source how separated (compostables, etc) yes means of disposal (council collection, self) Contract compostables yes plastics, paper yes frequency of disposal (days) weekly any fee paid? ($/collection) $10/m3 at Rarotonga
Landfill
Metals and Hazardous Waste type of material (metals, engine oil, etc) how often collected as required indicative quantity

46 Appendix 11
means of collection any fee paid? ($/collection)
MUNICIPAL DISPOSAL SITES Municipal Landfill or Dump capacity (m3) Rarotonga Landfill - 81500 Design life 15yrs ex spare capacity (m3 or %) Nil is there waste separation on site? (Y/N) no is site lined? yes, HDPE membrane is leachate intercepted for treatment? yes type and no. of mech plant, equipment Hired from Contractor -
????
condition of site (management) Depends on weather - Strong winds and heavy rainfall cause havoc at the site
year constructed 2004 Recycling Depot capacity (m3) what materials are collected plastic bottles, alluminium cans, glass bottles recyclables packaging procedures sorted, crushed into specified weight bales, strapped, sprayed and packed into
shipment containers
where are recyclables shipped to? Paper Reclaim, NZ how often is shipment made? 6 containers/yr cost per shipment avg $2000/container Hazardous Material Recycling Facility what materials are collected batteries packaging procedures where are recyclables shipped to? how often is shipment made? cost per shipment

Appendix 11 47
OPERATION AND MAINTENANCE no. of council staff in solid waste section 2 staffs no. operators at council disposal site same as above skill level of operators practical experience no. staff at recycling depot 3 staffs no. staff involved in haz waste recycling annual council operating costs ($/year) ENVIRONMENTAL EFFECTS are pigs, flies etc a nuisance problem? only have problem with flies on warmer days are wind-blown plastic bags a problem? yes any rubbish entering lagoon? no COMMUNITY ATTITUDE 1. Satisfaction with the current solid waste management practices?
it's a public perception that waste management is an entity responsibility
2. Would prefer regular council collection of rubbish or disposal by self? weekly is adequate but some areas require twice weekly 3.Would do onsite composting if given the equipment and know-how?
yes
4. Would be prepared to separate rubbish before disposal to save valuable land areas?
Need public awareness
5. Willing to make a small contribution towards council operating a total waste management collection and treatment system?
COMMUNITY SOLID WASTE ISSUES list any issues here:

48 Appendix 11
Electricity Supply Inventory Island: Rarotonga Date: ELECTRICITY GENERATION Diesel Generators no, of units 7 ( excluding two hired), proposed to install two additional gensets in two yrs genset make Duvant, Duvant, Mirless Blackstone, Lister Blackstone, Lister Blackstone, Blackstone, MAN B&W (2
Cummins-hired) genset model capacity (kWh) 2116, 2116, 1725, 600, 600, 1200, 2970, (2 x
800)
year installed 1991, 1991, 1990, 1970, 2001, 2006, (2004) condition all operational current generation rate (kWh/day) 82159 (avg) fuel storage capacity (L) 3 x 51000 litres (3 x 60000 litre tanks) fuel storage adequate for how many days 20000 litres per day, 7 days max. adequate cyclone protection for plant? yes
Alternate Energy Sources NA type (solar, wind) solar - commonly used for hot water heating, very few households using solar PV for electricity generation capacity (kWh) year installed condition current generation rate (kWh/day) what proportion of demand met (%) reliability (%) adequate cyclone protection for plant? Household Solar Panels (where applicable) no. of households fitted with panels less than 0.5% households with solar PV for electricity house electricity demand met (%) reliability (%) regular maintenance done? (if Yes, what)

Appendix 11 49
adequate cyclone protection for panels? DISTRIBUTION NETWORK network coverage (%) 100 supply availability (hrs/day) 24 length of cabling in network (m) 75km - HV, 170km - LV proportion of cables underground (%) electricity poles of what material? concrete and timber any service transformers (no.) 73 total make and capacity of transformers ABB, 75 - 750 kVA condition of system OK year constructed 1950, upgrade 1990, continual replacement by age TARIFFS AND REVENUE current tariffs Domestic: 0.39 - 0.65; Commercial: 0.65 = 5.00/mth; Demand: 0.54/unit, 20.00 - 25.00/kW frequency of billing monthly annual revenue collected 14 million annual operating costs 12 million OPERATION AND MAINTENANCE no. of council staff in electricity section 41 total (power station = 21, distribution system = 11, Billing = 5, Administration = 4) no. technicians on island type and qualification of technicians electrical/mechanical trades plant and equipment used cherry pickers, pickup trucks, jinker, cable winch, handtools (elec/mech) any emergency spare parts in storage for each genset: full set of spares for 12000hrs; distribution: use stock until minimum level then restock
spares COMMUNITY ELECTRICITY ISSUES list any issues here: 1. high tariff charge 2. land issues (location of substations, street lights, tree/vegetation management - trimming, planting under aerial lines, no secondary road to power station) 3. noise pollution at power station

50 Appendix 11
4. waste oil spills into stream at power station 5. disposal of non-biodegradable wastes (cables offcuts, transformer oils, etc) 6. aerial lines susceptible to cyclone damage 7. some lines still live until turned off at substation (may not be able access substation during cyclone)

Appendix 11 51
Telecommunications Inventory Island: Rarotonga Date: 28/07/2006SERVICES Telephone Landlines service coverage (% households) 86 individual house connections 5060 no. public access centers 15 system capacity 6956 total length of distribution network (m) 300km lines underground (%) 100 condition excellent Mobile network coverage service coverage (% households) 24 individual house connections 4000 no. public access centers 6 system capacity 5000 Internet Dial-up access service coverage (% households) 5060 connection access speed (kbs) 56K individual house connections 1650 no. public access centers 5 Broadband (ADSL) service coverage (% households) 5060 connection access speed (kbs) 256K individual house connections 200 no. public access centers 5 Radio and Television

52 Appendix 11
no. of radio stations AM/FM 5 no of television channels 1 EMERGENCY WARNINGS Describe procedure of issuing warnings Radio/TV broadcasts TARIFFS AND REVENUE current tariffs telephone internet access frequency of billing annual revenue collected annual operating costs OPERATION AND MAINTENANCE no. of staff on island 100 no. technicians on island 20 type and qualification of technicians NZCE transmission stations cyclone-proof? 3 any emergency spare parts in storage 5 COMMUNITY TELECOMMUNICATION ISSUES list any issues here:

Appendix 11 53
Road Inventory Island: Rarotonga Date:ROAD INVENTORY Length of Road Good condition Fair condition Poor condition Total Sealed Road Length (km) single bituminous surface treatment double bituminous surface treatment 59.7 other (AC, concrete) subtotal Gravel/crushed limestone (km) 55.1 Earth Total Bridges and Culverts Good condition Fair condition Poor condition Total Bridges (no) concrete 43 steel including Bailey timber other (masonry) Total 43 Culverts (no) concrete box 2 concrete pipe 36 steel pipe masonry Total 38 Causeways and swales (no) MOTOR VEHICLE REGISTRATIONS 2004 2005 2006 (to Mar) Cars and 4WD 293 350 91 Trucks - vans and pickups 89 131 29 Trucks - med trucks, buses 41 58 14

54 Appendix 11
Trucks - heavy (>2 axles) 2 35 4 Motorcycles 1151 1086 431 Total 3580 1660 569

Appendix 11 55
Airport Inventory Island: Rarotonga Date:AIRPORT INVENTORY Airfield Data Comment on
condition Runway name Rarotonga Runway specifications RWY 08/26 length (m) 2328 width (m) 45 pavement construction reinforced concrete OK runway markings? yes OK runway lighting? yes OK Runway Strip length (m) 2368 width (m) 213 Taxiway if applicable NA length (m) width (m) pavement construction markings? lighting? Apron length (m) 153 width (m) 77 pavement construction reinforced concrete OK markings? yes OK lighting? yes OK Visual aids Windsock (lighted?) yes/yes OK VASIS or PAPI? T-VASIS OK other NA Other airfield facilities

56 Appendix 11
drainage yes OK fencing yes OK Safety issues obstacle clearances - buildings, trees no compliance livestock, vehicles, pedestrians in strip no none erosion, flooding, sea surges no except sea surges at western end during cyclones Telecommunications and Radio Navaids Data Comment ATC facility/equipment? yes Navaid? yes NDB, VOR, DME,
ILS NOTAM or weather report facility? yes Aircraft Support and Utilities Data Comment Aircraft fuel storage capacity (l) 2,653,244 3 nos tanks: RA1 - storage, RA2 - slop, RA3 - service type of storage steel tanks structurally OK frequency and reliability of resupply 2 months Fire and Rescue category and vehicle ICAO Category 8 Water supply storage capacity (l) 450,000 storage type reinforced concrete tank source groundwater via well Power supply main power? yes standby generator? yes Telecommunications telephone yes fax yes internet yes Passenger and Cargo Handling Data Comment Terminal building (sq m) 4479 3085 international, 1394 domestic

Appendix 11 57
construction, age and condition steel, timber reinf concrete
built early 1970s, structurally OK
passenger handling counter? yes baggage handling? yes water supply yes toilets yes power supply yes telephone yes Airport Maintenance Data Comment Maintenance equipment AACI and Contractor Maintenance service AACI and Contractor Airport Ownership Data Comment Airport land Crown Terminal building Crown Other buildings and facilities Crown Landing charge? yes aircraft over 40 tonnes - $20.48 per 1000kg MGTOW Terminal rental charge? yes $8.15 per arriving
pax AIRPORT TRAFFIC 2004 2005 2006 Scheduled flights per week by aircraft type Flights by other than Air Rarotonga Annual or monthly aircraft movements 8108 (excl transit) 4311 (to June, excl transit) Annual or monthly arriving and departing pax 94790,
94607:86177, 42799(D)
101275, 100739 (international)
Annual or montly arriving and departing cargo 765t, 677t 917t, 746t 289t, 199t (to March)

58 Appendix 11
Port and Harbour Inventory Island: Rarotonga Date:PORT AND HARBOUR INVENTORY Facilities Data Comment on
condition Breakwater details armour rocks
(basalt) western breakwater damaged by cyclone in 1987
Wharf or Jetty length (m) 500 cargo loading/unloading area (sq m) 6000 cargo storage area (sq m) 1500 Slipway length (m) 30 width (m) 10 construction (concrete, other) reinf concrete Barge NA dimensions (m) capacity (t) engines (no. and hp) construction (aluminium, steel) age and condition Cargo handling crane type and capacity (t) NA fork lift truck and capacity (t) 1 x 35t, 1 x 25t, 1 x 18t, 3 x 3t age and condition of each 1989 - good, 1986 - good, 1984 - good, 1989 - good Transit shed

Appendix 11 59
area (sq m) 1800 construction type conc floor, steel framing, corrugated claddings for roof & walls age and condition over 20 yrs, good concrete floor yes Breakwater details armour rocks Navigation aids details purple lead-in lights, VHF, tug boat Port Charges Data Comment Lighterage service ($/tonne or $/pallet) Berthing fee structure Cargo storage charge Ownership Data Comment Port land Crown Transit shed Crown Other buildings and facilities Crown PORT TRAFFIC 2004 2005 2006 Shipping service frequency (indicate interval) indicate shipping line and vessel Annual ship arrivals indicate shipping line and vessel where possible cruise liners 22 26 28 container ships 32 34 42 indicate yacht, fishing, cruise ships where possible Boats based in port by number and type commerical fishing, diving, tourist fishing = 18, diving = 3, others = 12 private boats 24

60 Appendix 11
Annual port traffic passenger arrivals and departures 15600 16000 16800 containers (number and tonnage) 2168, 51756t 2229, 54311t 2243, 54701t pallets (number and tonnage) diesel (number of tanks and litres) petrol (number of tanks and litres) 24428027 26474770 27142740 aviation fuel (number of tanks and litres) LPG (number of tanks and litres)
Telecommunications Inventory Island: Aitutaki Date: 28/07/200
6SERVICES Telephone Landlines service coverage (% households) 30 individual house connections 598 no. public access centers 5 system capacity 716 total length of distribution network (m) 100km lines underground (%) 100 condition excellent Mobile network coverage service coverage (% households) 20 individual house connections 200 no. public access centers 2 system capacity 500 Internet Dial-up access

Appendix 11 61
service coverage (% households) 598 connection access speed (kbs) 56K individual house connections 40 no. public access centers 1 Broadband (ADSL) service coverage (% households) 598 connection access speed (kbs) 115/256
K
individual house connections 15 no. public access centers 1 Radio and Television no. of radio stations AM/FM 1 no of television channels 1 EMERGENCY WARNINGS Describe procedure of issuing warnings Radio/TV
broadcasts TARIFFS AND REVENUE current tariffs telephone internet access frequency of billing annual revenue collected annual operating costs OPERATION AND MAINTENANCE no. of staff on island 5 no. technicians on island 2

62 Appendix 11
type and qualification of technicians transmission stations cyclone-proof? 1 any emergency spare parts in storage 1 COMMUNITY TELECOMMUNICATION ISSUES list any issues here:
Airport Inventory Island: Aitutaki Date:AIRPORT INVENTORY Airfield Data Comment on
condition Runway name Aitutaki length (m) 1820 width (m) 30 pavement construction bitumen chip sealing runway markings? yes runway lighting? yes Runway Strip length (m) 2100 width (m) 150 Taxiway if applicable length (m) width (m) pavement construction markings? lighting? Apron length (m) 66 width (m) 49

Appendix 11 63
pavement construction bitumen chip sealing markings? yes lighting? yes Visual aids Windsock (lighted?) yes, yes VASIS or PAPI? PAPI other NA Other airfield facilities drainage no fencing yes deterrant only Safety issues obstacle clearances - buildings, trees no compliance livestock, vehicles, pedestrians in strip no erosion, flooding, sea surges no susceptible to sea surges during severe cyclones Telecommunications and Radio Navaids Data Comment ATC facility/equipment? yes air traffic control via Rarotonga Navaid? yes NDB NOTAM or weather report facility? yes air traffic control via Rarotonga Aircraft Support and Utilities Data Comment Aircraft fuel storage capacity (l) type of storage frequency and reliability of resupply Fire and Rescue category and vehicle ICAO Category 5?? or 4?? Water supply storage capacity (l) 2 x 3000 litres storage type plastic tanks source groundwater well Power supply

64 Appendix 11
main power? yes standby generator? yes Telecommunications telephone yes fax yes internet yes Passenger and Cargo Handling Data Comment Terminal building (sq m) 760 construction, age and condition timber framed built 2000, structurally OK passenger handling counter? yes baggage handling? yes water supply yes toilets yes power supply yes telephone yes Airport Maintenance Data Comment Maintenance equipment AACI Maintenance service AACI/Contractor Airport Ownership Data Comment Airport land Lease to Crown Terminal building AACI Other buildings and facilities AACI Landing charge? yes, aircraft: < 5700kg MGTOW = $29.40, < 40t MGTOW = $5.30 per 1000kg, > 40t
MGTOW - prior approval Terminal rental charge? yes $5.00 per passenger AIRPORT TRAFFIC 2004 2005 2006 Scheduled flights per week by aircraft type Flights by other than Air Rarotonga

Appendix 11 65
Annual or monthly aircraft movements 1591 1581 Annual or monthly arriving and departing pax 31247, 33225 3117, 30555 Annual or montly arriving and departing cargo
Port and Harbour Inventory Island: Aitutaki Date:PORT AND HARBOUR INVENTORY Facilities Data Comment on
condition Breakwater NIL details Wharf or Jetty length (m) 100 cargo loading/unloading area (sq m) 2000 cargo storage area (sq m) 1400 Slipway length (m) 30 width (m) 12 construction (concrete, other) reinf concrete Barge 2 nos dimensions (m) 18 x 4.8m capacity (t) 40t engines (no. and hp) 2 nos 95HP outboard motors construction (aluminium, steel) steel age and condition 6yrs - good, 15yrs - deteriorating Cargo handling 2 nos crane type and capacity (t) P&H 30t, Coradini

66 Appendix 11
22t fork lift truck and capacity (t) NIL age and condition of each good, fair Transit shed area (sq m) 200 construction type conc floor, steel framing, corrugated iron claddings for roof & walls age and condition over 20 yrs, good concrete floor yes Breakwater details NIL Navigation aids details Lead-in light, VHF Port Charges Data Comment Lighterage service ($/tonne or $/pallet) Berthing fee structure Cargo storage charge Ownership Data Comment Port land Crown Transit shed Crown Other buildings and facilities Crown PORT TRAFFIC 2004 2005 2006 Shipping service frequency (indicate interval) indicate shipping line and vessel cruise liners 26 28 32 container ships 32 36 38 indicate shipping line and vessel where possible indicate yacht, fishing, cruise ships where possible

Appendix 11 67
Boats based in port by number and type fishing = 3, private = 2
commerical fishing, diving, tourist private boats Annual port traffic passenger arrivals and departures 300 400 containers (number and tonnage) 449, 8066t 407, 8119 480, 9120 pallets (number and tonnage) diesel (number of tanks and litres) petrol (number of tanks and litres) 1.5 million litres 1.5 million litres 1.7 million litres aviation fuel (number of tanks and litres) LPG (number of tanks and litres)

68 Appendix 11
Telecommunications Inventory Island:Atiu Date: 28/07/200
6SERVICES Telephone Landlines service coverage (% households) 87individual house connections 188no. public access centers 5system capacity 216total length of distribution network (m) 50klines underground (%) 100condition excellent Mobile network coverage service coverage (% households) individual house connections no. public access centers system capacity Internet Dial-up access service coverage (% households) 188connection access speed (kbs) 56Kindividual house connections 5no. public access centers 1Broadband (ADSL) service coverage (% households) 0connection access speed (kbs) 256Kindividual house connections 0no. public access centers 1

Appendix 11 69
Radio and Television no. of radio stations AM/FM 1no of television channels 1 EMERGENCY WARNINGS Describe procedure of issuing warnings Radio/TV
broadcasts TARIFFS AND REVENUE current tariffs telephone internet access frequency of billing annual revenue collected annual operating costs OPERATION AND MAINTENANCE no. of staff on island 2no. technicians on island 1type and qualification of technicians transmission stations cyclone-proof? 1any emergency spare parts in storage 1 COMMUNITY TELECOMMUNICATION ISSUES list any issues here:

70 Appendix 11
Airport Inventory Island: Atiu Date:AIRPORT INVENTORY Airfield Data Comment on
condition Runway name Atiu Licensee: The Proprietory of the Enuamanu Airport Incorprated length (m) 1300 width (m) 30 pavement construction compacted coral sand and gravel runway markings? no runway lighting? no Runway Strip length (m) 1300 width (m) 90 Taxiway if applicable NA length (m) width (m) pavement construction markings? lighting? Apron length (m) width (m) pavement construction reinforced concrete markings? no lighting? no Visual aids Windsock (lighted?) yes (no) VASIS or PAPI? other Other airfield facilities

Appendix 11 71
drainage no fencing deterrant only Safety issues obstacle clearances - buildings, trees no livestock, vehicles, pedestrians in strip yes erosion, flooding, sea surges no Telecommunications and Radio Navaids Data Comment ATC facility/equipment? Navaid? NOTAM or weather report facility? via air traffic control in Rarotonga Aircraft Support and Utilities Data Comment Aircraft fuel storage NA capacity (l) type of storage frequency and reliability of resupply Fire and Rescue NA category and vehicle Water supply storage capacity (l) 5000 storage type concrete tank source rainwater catchment Power supply NA main power? standby generator? Telecommunications yes telephone yes operated by Air Raro fax yes operated by Air Raro Passenger and Cargo Handling Data Comment Terminal building (sq m)

72 Appendix 11
construction, age and condition reinforced concrete passenger handling counter? yes baggage handling? yes water supply yes toilets yes power supply no telephone yes Airport Maintenance Data Comment Maintenance equipment Contract/AIA Shared btwn PEAI and AIA Maintenance service Contract/AIA Shared btwn PEAI and AIA Airport Ownership Data Comment Airport land The Proprietory of the Enuamanu Airport Incorprated Terminal building The Proprietory of the Enuamanu Airport Incorprated Other buildings and facilities The Proprietory of the Enuamanu Airport Incorprated Landing charge? $30 Terminal rental charge? no AIRPORT TRAFFIC 2004 2005 2006 Scheduled flights per week by aircraft type Flights by other than Air Rarotonga Annual or monthly aircraft movements Annual or monthly arriving and departing pax Annual or montly arriving and departing cargo Telecommunications Inventory Island: Mangaia Date: 28/07/2006SERVICES Telephone Landlines service coverage (% households) 93 individual house connections 213

Appendix 11 73
no. public access centers 1 system capacity 228 total length of distribution network (m) 50km lines underground (%) 100 condition excellent Mobile network coverage service coverage (% households) 0 individual house connections 0 no. public access centers 0 system capacity 0 Internet Dial-up access service coverage (% households) 598 connection access speed (kbs) 56K individual house connections 5 no. public access centers 1 Broadband (ADSL) service coverage (% households) 0 connection access speed (kbs) 256K individual house connections 0 no. public access centers 1 Radio and Television no. of radio stations AM/FM 1 no of television channels 1 EMERGENCY WARNINGS Describe procedure of issuing warnings Radio/TV
broadcasts

74 Appendix 11
TARIFFS AND REVENUE current tariffs telephone internet access frequency of billing annual revenue collected annual operating costs OPERATION AND MAINTENANCE no. of staff on island 2 no. technicians on island 2 type and qualification of technicians CISC transmission stations cyclone-proof? 1 any emergency spare parts in storage 1 COMMUNITY TELECOMMUNICATION ISSUES
list any issues here:
Airport Inventory Island: Mangaia Date: AIRPORT INVENTORY Airfield Data Comment on condition Runway name Mangaia CIBE: Lat 21' 53' 57'', Long 157' 54' 13'' - Datum WGS84, 13m amsl length (m) 1060 width (m) 30 pavement construction compacted coral sand and gravel runway markings? yes painted tyre markers (rescue orange) runway lighting? no Runway Strip

Appendix 11 75
length (m) 1060 width (m) 60 Taxiway if applicable NA length (m) width (m) pavement construction markings? lighting? Apron length (m) width (m) pavement construction reinforced concrete markings? no lighting? no Visual aids Windsock (lighted?) yes (no) VASIS or PAPI? other Other airfield facilities drainage fencing Safety issues obstacle clearances - buildings, trees no livestock, vehicles, pedestrians in strip yes fence only a deterrant to vehicles and livestock erosion, flooding, sea surges yes western end damaged by cyclone, yet to be repaired Telecommunications and Radio Navaids Data Comment ATC facility/equipment? Navaid? NOTAM or weather report facility? yes received via air traffic control in Rarotonga Aircraft Support and Utilities Data Comment

76 Appendix 11
Aircraft fuel storage NA capacity (l) type of storage frequency and reliability of resupply Fire and Rescue NA category and vehicle Water supply Yes storage capacity (l) 6000 storage type plastic tank source rainwater Power supply NA main power? standby generator? Telecommunications Yes telephone yes operated by Air Raro fax Passenger and Cargo Handling Data Comment Terminal building (sq m) construction, age and condition 1994 passenger handling counter? yes baggage handling? yes water supply yes toilets yes power supply no telephone yes operated by Air Raro Airport Maintenance Data Comment Maintenance equipment MIA Maintenance service MIA Airport Ownership Data Comment

Appendix 11 77
Airport land Numangatini On behalf of Te Aronga Mana Terminal building Numangatini On behalf of Te Aronga Mana Other buildings and facilities Numangatini On behalf of Te Aronga Mana Landing charge? Terminal rental charge? AIRPORT TRAFFIC 2004 2005 2006 Scheduled flights per week by aircraft type Flights by other than Air Rarotonga Annual or monthly aircraft movements Annual or monthly arriving and departing pax Annual or montly arriving and departing cargo
Airport Inventory Island: Manihiki Date: AIRPORT INVENTORY Airfield Data Comment on condition Runway name Manihiki length (m) 1300 proposed 1800m width (m) 30 pavement construction compacted coral sand and gravel runway markings? no runway lighting? no Runway Strip length (m) 1300 width (m) 90 upgraded Taxiway if applicable NA length (m) width (m) pavement construction

78 Appendix 11
markings? lighting? Apron length (m) width (m) pavement construction reinforced concrete markings? no lighting? no Visual aids Windsock (lighted?) no VASIS or PAPI? other Other airfield facilities drainage fencing Safety issues obstacle clearances - buildings, trees yes most trees and some physical structure non-compliance livestock, vehicles, pedestrians in strip yes no fence erosion, flooding, sea surges yes susceptible to damage from sea surges during cyclones Telecommunications and Radio Navaids Data Comment ATC facility/equipment? Navaid? NOTAM or weather report facility? yes received via air traffic control in Rarotonga Aircraft Support and Utilities Data Comment Aircraft fuel storage yes operated by Air Raro capacity (l) capacity varies depending on frequency of boats to Manihiki type of storage 200 litre drums frequency and reliability of resupply once every 6 months, not reliable Fire and Rescue NA category and vehicle

Appendix 11 79
Water supply NIL storage capacity (l) storage type source Power supply NIL main power? standby generator? Telecommunications Yes telephone yes operated by Air Raro fax nil Passenger and Cargo Handling Data Comment Terminal building (sq m) 65 privately owned micro shelter construction, age and condition concrete floor, timber framed passenger handling counter? yes baggage handling? yes water supply no toilets no power supply no telephone yes operated by Air Raro Airport Maintenance Data Comment Maintenance equipment MIA Maintenance service MIA Airport Ownership Data Comment Airport land Land owners Terminal building Private Other buildings and facilities nil Landing charge? $100 Collected by Manihiki landowners Terminal rental charge?

80 Appendix 11
AIRPORT TRAFFIC 2004 2005 2006 Scheduled flights per week by aircraft type 1 Flights by other than Air Rarotonga nil Annual or monthly aircraft movements Annual or monthly arriving and departing pax Annual or montly arriving and departing cargo
Telecommunications Inventory Island:Manihiki Date: 28/07/200
6SERVICES Telephone Landlines service coverage (% households) 60individual house connections 114no. public access centers 1system capacity 192total length of distribution network (m) 10klines underground (%) 100condition excellent Mobile network coverage service coverage (% households) individual house connections no. public access centers system capacity Internet Dial-up access service coverage (% households) 60connection access speed (kbs) 56K

Appendix 11 81
individual house connections 3no. public access centers 1Broadband (ADSL) service coverage (% households) 0connection access speed (kbs) 256Kindividual house connections 0no. public access centers 1 Radio and Television no. of radio stations AM/FM 1no of television channels 1 EMERGENCY WARNINGS Describe procedure of issuing warnings Radio/TV
broadcasts TARIFFS AND REVENUE current tariffs telephone internet access frequency of billing annual revenue collected annual operating costs OPERATION AND MAINTENANCE no. of staff on island 2no. technicians on island 1type and qualification of technicians transmission stations cyclone-proof? 1any emergency spare parts in storage 1
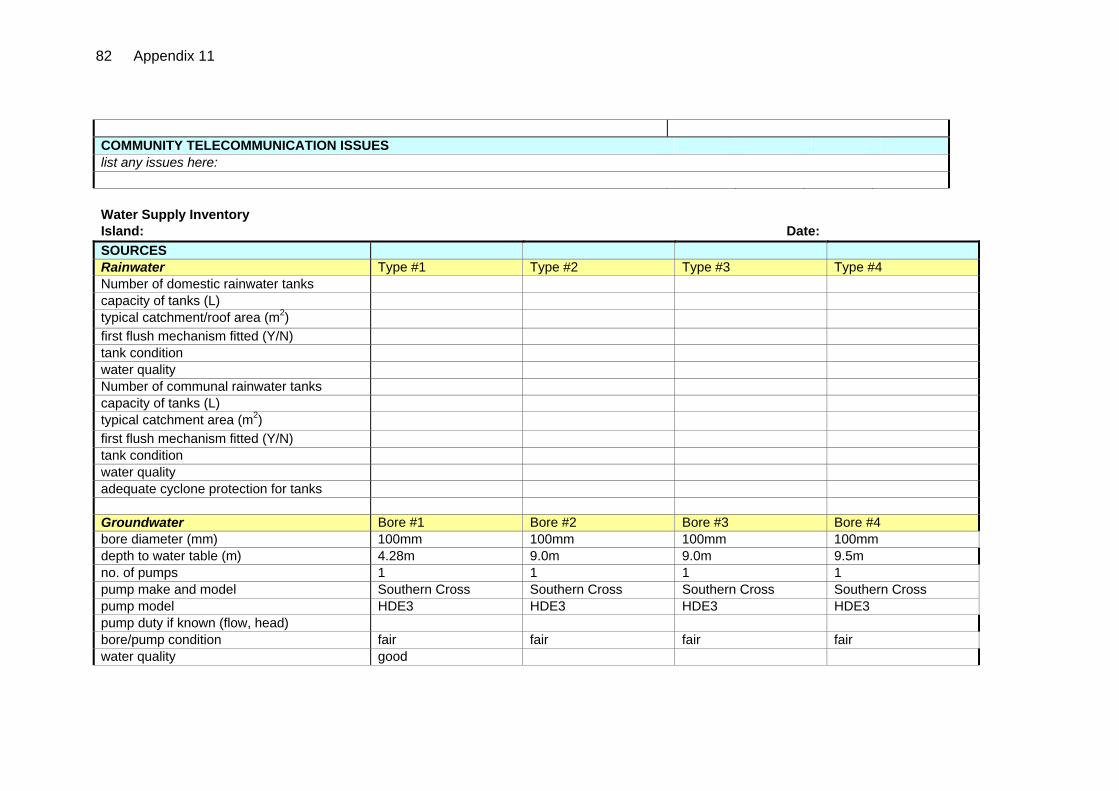
82 Appendix 11
COMMUNITY TELECOMMUNICATION ISSUES list any issues here:
Water Supply Inventory Island: Date:SOURCES Rainwater Type #1 Type #2 Type #3 Type #4 Number of domestic rainwater tanks capacity of tanks (L) typical catchment/roof area (m2) first flush mechanism fitted (Y/N) tank condition water quality Number of communal rainwater tanks capacity of tanks (L) typical catchment area (m2) first flush mechanism fitted (Y/N) tank condition water quality adequate cyclone protection for tanks
Groundwater Bore #1 Bore #2 Bore #3 Bore #4 bore diameter (mm) 100mm 100mm 100mm 100mm depth to water table (m) 4.28m 9.0m 9.0m 9.5m no. of pumps 1 1 1 1 pump make and model Southern Cross Southern Cross Southern Cross Southern Cross pump model HDE3 HDE3 HDE3 HDE3 pump duty if known (flow, head) bore/pump condition fair fair fair fair water quality good

Appendix 11 83
Groundwater Bore #5 Bore #6 Bore #7 Bore #8 bore diameter (mm) 100mm 100mm 100mm 100mm depth to water table (m) 9.0m 9.5m 9.0m 9.0m no. of pumps 1 none none none pump make Southern Cross pump model HDE3 pump duty if known (flow, head) bore/pump condition deteriorating water quality good Springs Source #1 Source #2 Source #3 Source #4 discharge rate (L/s) seasonal variation in flow (large-small) elevation above sea level (m) water quality
Streams discharge rate (L/s) seasonal variation in flow (large-small) elevation above sea level (m) water quality
DISTRIBUTION SYSTEM Pipelines Type #1 Type #2 Type #3 Type #4 diameter (mm) 75mm 50mm 40mm 20mm total length (m) 130 2500m, 300m 900m 300 material (GI, PVC, HDPE etc) GI GI, HDPE GI GI condition year installed Distribution Storages Kimiangatau Oiretumu capacity (litres) 22500 22500 elevated/on-ground elevated elevated

84 Appendix 11
condition good good adequate cyclone protection good good
Pump Stations Pump Station #1 Pump Station #2 Pump Station #3 Pump Station #4 no. of pumps pump make pump model pump power rating (kW) pump duty if known (flow, head) condition of pumps year of installation power supply Isolating Valves number 6 6 diameter 50mm 50mm condition good good TREATMENT communal source treatment households boiling water? ( Y/N) OPERATION AND MAINTENANCE no. of operators/technicians 2 skill type and qualification of technicians trade how often are rainwater tanks cleaned community/MIA plant and equipment used are headworks cyclone-proof? yes annual council operating costs ($/year)
USER CHARACTERISTICS no. of people on island 389

Appendix 11 85
no. of households on island 198 no. connections to piped network 192 no. properties not connected to network 6 and have no rainwater tank 0 no. dwellings relying on water vendors nil Wastewater Management Inventory Island: Date:ON-SITE SYSTEMS Septic Tanks Type #1 Type #2Treatment system Flush Pour flushquantity (no. of tanks) 134 5capacity (L) 5000 5000no. of chambers 2 2tank condition (typical) good gooddesludging frequency (years) only when full (8-10
yrs) only when full
Effluent disposal absorption trenches (if Yes length, m) nil nilsoakage pits yes yesdisposal to land or sea land landget on-site water logging? (Y/N) no no Pit Latrines quantity (installed in how many houses) 51 typical capacity ( m3) 0.4 condition (well maintained, flies etc) fair how often is it "moved"? 4yrs get on-site water logging? (Y/N) no Lagoon Toilets quantity (used by how many houses) how often "move"

86 Appendix 11
Other description no. of households using this method In-house Wastewater Generation Toilets no. flush units no. pour-flush units Wastewater sources* are black and grey waters separated (Y/N) if separated, where is greywater going? *note: blackwater - toilet, kitchen wastes; greywater - wastewater from bath, laundry etc
Commercial Premises Type #1 Type #2 Type #3 Type #4Treatment plant type of process capacity (m3/day) no. of such facilities on island to where is treated effluent discharged? power source and usage (kWh) condition of plant year installed Waste management is effluent discharge monitored/recorded? effluent quality how is sludge treated and how often? SEPTAGE TREATMENT FACILITIES Nil type of system capacity (m3/day) to where is treated effluent discharged?

Appendix 11 87
power source and usage (kWh) condition of plant year installed OPERATION AND MAINTENANCE Nil no. of plumbers on the island skill level/qualification of technicians if have central plant, no. of operators plant and equipment used annual municipal operating costs ($/year) ENVIRONMENTAL EFFECTS are there any algal blooms in lagoon? no lagoon water quality good freshwater lens water quality good HEALTH EFFECTS collect annual statistics fro the past 3-5 years on water-borne diseases
Year 2005 2004 2003 2002infant mortality diarrhea dysentery hepatitis worms fish poisoning COMMUNITY ATTITUDE 1. Satisfaction with the current sanitation practices?
2. Aware of the link between groundwater contamination and onsite waste disposal (septic tanks)?

88 Appendix 11
3. Is it better to discharge treated waste water into the sea (beyond the reef if possible) or to land?
4. Is there any link between the waste discharge and the water quality in the lagoon?
5. What is preferable, discharge of reclaimed water from waste plants to land or into the sea?
6. Willing to make a small contribution towards operating a wastewater system if it eliminates waste problems around the house?
COMMUNITY SANITATION ISSUES list any issues here:

Appendix 11 89
Solid Waste Management Inventory Island: MAUKE Date: 13-Jul-06WASTE DISPOSAL METHODS
Domestic Waste indicative quantity (kg/household/week) 15 any separation at source? (Y/N) N
how separated? (compostables, etc) how is rubbish stored at the house? Bin means of disposal (council collection, self) MIA collection
compostables Dump plastics, paper Dump
frequency of disposal (days) 14
Commercial Waste no. people on premises 10 indicative quantity (kg/premise. week) 20 any separation at source? (Y/N) N
how separated (compostables, etc) means of disposal (council collection, self) MIA collection
compostables Dump plastics, paper Dump frequency of disposal (days) 14 any fee paid? ($/collection) N
Metals and Hazardous Waste
type of material (metals, engine oil, etc) metals how often collected 14 days indicative quantity 25 means of collection MIA collection any fee paid? ($/collection) N

90 Appendix 11
MUNICIPAL DISPOSAL SITES Municipal Landfill or Dump
capacity (m3) ex spare capacity (m3 or %) is there waste separation on site? (Y/N) is site lined? is leachate intercepted for treatment? type and no. of mech plant, equipment condition of site (management) year constructed
Recycling Depot capacity (m3) what materials are collected recyclables packaging procedures where are recyclables shipped to? how often is shipment made? cost per shipment
Hazardous Material Recycling Facility what materials are collected packaging procedures where are recyclables shipped to? how often is shipment made? cost per shipment
OPERATION AND MAINTENANCE no. of council staff in solid waste section 2

Appendix 11 91
no. operators at council disposal site nil skill level of operators semi skilled no. staff at recycling depot nil no. staff involved in haz waste recycling 2 annual council operating costs ($/year)
ENVIRONMENTAL EFFECTS are pigs, flies etc a nuisance problem? yes are wind-blown plastic bags a problem? yes any rubbish entering lagoon? no
COMMUNITY ATTITUDE 1. Satisfaction with the current solid waste management practices? yes 2. Would prefer regular council collection of rubbish or disposal by self? leave as is 3.Would do onsite composting if given the equipment and know-how? yes 4. Would be prepared to separate rubbish before disposal to save valuable land areas? yes 5. Willing to make a small contribution towards council operating a total waste management collection and treatment system? yes Electricity Supply Inventory Island: Mauke Date: ELECTRICITY GENERATION Diesel Generators no, of units 4 genset make Lister genset model 212 HR6 AM 20 161 HR6 20 459 HR6 A28 201 HR6 A24 capacity (kWh) 42 42 42 42 year installed 2002 2002 2006 2004 condition good good good good current generation rate (kWh/day) 680 fuel storage capacity (L) 16880

92 Appendix 11
fuel storage adequate for how many days 20 adequate cyclone protection for plant? yes Alternate Energy Sources NA type (solar, wind) generation capacity (kWh) year installed condition current generation rate (kWh/day) what proportion of demand met (%) reliability (%) adequate cyclone protection for plant? Household Solar Panels (where applicable) no. of households fitted with panels house electricity demand met (%) reliability (%) regular maintenance done? (if Yes, what) adequate cyclone protection for panels? DISTRIBUTION NETWORK network coverage (%) 100 supply availability (hrs/day) 24 length of cabling in network (m) proportion of cables underground (%) electricity poles of what material? timber and concrete any service transformers (no.) 5 nos Tyree make and capacity of transformers 3 x 30kva 1x50kva 1x100kva condition of system good year constructed 1986

Appendix 11 93
TARIFFS AND REVENUE
current tariffs commercial - $0.58,
domestic - $0.36 frequency of billing mthly annual revenue collected $97,000 annual operating costs $127,000 OPERATION AND MAINTENANCE no. of council staff in electricity section 4 no. technicians on island 2 type and qualification of technicians CINC plant and equipment used Hiab crane truck any emergency spare parts in storage nil COMMUNITY ELECTRICITY ISSUES list any issues here: 1. low voltage experienced during peak hours at the end of the distribution network 2 Telecommunications Inventory Island:Mauke Date: 28/07/2006 SERVICES Telephone Landlines service coverage (% households) 95 individual house connections 133 no. public access centers 1 system capacity 140 total length of distribution network (m) 50k lines underground (%) 100 condition excellent

94 Appendix 11
Mobile network coverage service coverage (% households) individual house connections no. public access centers system capacity Internet Dial-up access service coverage (% households) 95 connection access speed (kbs) 56K individual house connections 5 no. public access centers 1 Broadband (ADSL) service coverage (% households) 0 connection access speed (kbs) 256K individual house connections 0 no. public access centers 1 Radio and Television no. of radio stations AM/FM 1 no of television channels 1 EMERGENCY WARNINGS Describe procedure of issuing warnings Radio/TV broadcasts TARIFFS AND REVENUE current tariffs telephone internet access

Appendix 11 95
frequency of billing annual revenue collected annual operating costs OPERATION AND MAINTENANCE no. of staff on island 2 no. technicians on island 1 type and qualification of technicians transmission stations cyclone-proof? 1 any emergency spare parts in storage 1 COMMUNITY TELECOMMUNICATION ISSUES list any issues here: high cost of telephone charges email/internet high cost tv channels not enough frequent telephone breakdowns, delays in tending to faults continuous/repeated same faults need mobile telecomm radio telephone - emergencies, ship to shore communications

96 Appendix 11
Road Inventory Island: Mauke Date: ROAD INVENTORY Length of Road Good condition Fair condition Poor condition Total Sealed Road Length (km) single bituminous surface treatment double bituminous surface treatment other (AC, concrete) subtotal Gravel/crushed limestone (km) Earth Total Bridges and Culverts Good condition Fair condition Poor condition Total Bridges (no) concrete steel including Bailey timber other (masonry) Total Culverts (no) concrete box concrete pipe 2 steel pipe masonry Total 2 Causeways and swales (no) nil MOTOR VEHICLE REGISTRATIONS 2006 Registrations Cars and 4WD Buses Trucks - light and pickups

Appendix 11 97
Trucks – medium Trucks - heavy (>2 axles) Motorcycles Total

98 Appendix 11
Airport Inventory Island: Mauke Date: 13-Jul-06 AIRPORT INVENTORY Airfield Data Comment on condition Runway name Mauke length (m) 1800 width (m) 90 pavement construction compacted coral sand/aggregates runway markings? car tyres runway lighting? nil Runway Strip length (m) width (m) Taxiway if applicable nil length (m) width (m) pavement construction markings? lighting? Apron length (m) width (m) pavement construction reinforced concrete markings? nil lighting? nil Visual aids Windsock (lighted?) yes (not lighted) VASIS or PAPI? nil other nil Other airfield facilities drainage nil

Appendix 11 99
fencing partly Safety issues obstacle clearances - buildings, trees livestock, vehicles, pedestrians in strip erosion, flooding, sea surges nil, nil, once during cyclone Telecommunications and Radio Navaids Data Comment ATC facility/equipment? nil Navaid? nil NOTAM or weather report facility? radio telephone received via air traffic control in Rarotonga Aircraft Support and Utilities Data Comment Aircraft fuel storage nil capacity (l) type of storage frequency and reliability of resupply Fire and Rescue nil category and vehicle Water supply storage capacity (l) water tank storage type source reticulated Power supply main power? mains power standby generator? nil Telecommunications telephone yes operated by Air Raro fax yes operated by Air Raro Passenger and Cargo Handling Data Comment Terminal building (sq m) construction, age and condition

100 Appendix 11
passenger handling counter? yes baggage handling? yes water supply yes toilets yes power supply yes telephone no Airport Maintenance Data Comment Maintenance equipment MIA slasher, grass cuutter, lawn movers Maintenance service MIA Airport Ownership Data Comment Airport land Land owners Terminal building Land owners Other buildings and facilities Land owners Landing charge? $20 ($10 - MIA, $10 - Landowners Terminal rental charge? nil AIRPORT TRAFFIC 2004 2005 2006 Scheduled flights per week by aircraft type 3 x Banderantte 3 x Banderantte 3 x Banderantte Flights by other than Air Rarotonga nil nil nil Annual or monthly aircraft movements 12 monthly 12 monthly 12 monthly Annual or monthly arr and dep pax Annual or monthly arr and dep cargo Dep 28972kg

Appendix 11 101
Port and Harbour Inventory Island:Mauke Date: 13-Jul-06 PORT AND HARBOUR INVENTORY Facilities Data Comment on condition Breakwater details southern side only Wharf or Jetty length (m) cargo loading/unloading area (sq m) cargo storage area (sq m) Slipway length (m) 15 width (m) 6.8m construction (concrete, other) reinforced concrete Barge dimensions (m) 2.4x5.4x.8 capacity (t) 8 engines (no. and hp) 40hp Yamaha 2-stroke construction (aluminium, steel) aluminium age and condition 9yrs, OK Cargo handling crane type and capacity (t) Hiab crane truck, 5t, deteriorating fork lift truck and capacity (t) nil age and condition of each Transit shed area (sq m) construction type timeber framed

102 Appendix 11
age and condition 20 concrete floor yes Breakwater details reinforced concrete Navigation aids details navigation lights Port Charges Data Comment Lighterage service ($/tonne or $/pallet) $30/pallet, $30/m3 Berthing fee structure nil Cargo storage charge nil Ownership Data Comment Port land Crown Transit shed Crown Other buildings and facilities Crown PORT TRAFFIC 2004 2005 2006 Shipping service frequency (indicate interval) indicate shipping line and vessel one per month one per month one per month Annual ship arrivals indicate shipping line and vessel where possible Taio Shipping indicate yacht, fishing, cruise ships where possible
nil
Boats based in port by number and type nil commercial fishing, diving, tourist private boats Annual port traffic passenger arrivals and departures nil

Appendix 11 103
containers (number and tonnage) nil pallets (number and tonnage) diesel (number of tanks and litres) petrol (number of tanks and litres) aviation fuel (number of tanks and litres) nil LPG (number of tanks and litres)

104 Appendix 11
Electricity Supply Inventory Island: Mitiaro Date: ELECTRICITY GENERATION Diesel Generators no, of units 4 genset make Lister genset model 212 HR6 AM 20 capacity (kWh) 42 year installed 2002 condition good current generation rate (kWh/day) 680 fuel storage capacity (L) fuel storage adequate for how many days 20 adequate cyclone protection for plant? yes
Alternate Energy Sources type (solar, wind) generation capacity (kWh) year installed condition current generation rate (kWh/day) what proportion of demand met (%) reliability (%) adequate cyclone protection for plant? Household Solar Panels (where applicable) no. of households fitted with panels house electricity demand met (%) reliability (%) regular maintenance done? (if Yes, what) adequate cyclone protection for panels?

Appendix 11 105
DISTRIBUTION NETWORK network coverage (%) 100 supply availability (hrs/day) 24 length of cabling in network (m) proportion of cables underground (%) electricity poles of what material? timber and concrete any service transformers (no.) 5 nos Tyree make and capacity of transformers 3 x 30kva 1x50kva 1x100kva condition of system good year constructed 1986 TARIFFS AND REVENUE current tariffs commercial - $0.58, domestic - $0.36 frequency of billing mthly annual revenue collected $97,000 annual operating costs $127,000 OPERATION AND MAINTENANCE no. of council staff in electricity section 4 no. technicians on island 2 type and qualification of technicians CINC plant and equipment used Hiab crane truck any emergency spare parts in storage nil COMMUNITY ELECTRICITY ISSUES list any issues here: 1. low voltage experienced during peak hours at the end of the distribution network 2

106 Appendix 11
Telecommunications Inventory Island: Mitiaro Date: 28/07/2006 SERVICES Telephone Landlines service coverage (% households) 78 individual house connections 79 no. public access centers 1 system capacity 92 total length of distribution network (m) 5k lines underground (%) 100 condition excellent Mobile network coverage service coverage (% households) individual house connections no. public access centers system capacity Internet Dial-up access service coverage (% households) 78 connection access speed (kbs) 56K individual house connections 0 no. public access centers 1 Broadband (ADSL) service coverage (% households) 78 connection access speed (kbs) 256K individual house connections 0 no. public access centers 1 Radio and Television

Appendix 11 107
no. of radio stations AM/FM 1 no of television channels 1 EMERGENCY WARNINGS Describe procedure of issuing warnings Radio/TV broadcasts TARIFFS AND REVENUE current tariffs telephone internet access frequency of billing annual revenue collected annual operating costs OPERATION AND MAINTENANCE no. of staff on island 1 no. technicians on island 1 type and qualification of technicians CISC transmission stations cyclone-proof? 1 any emergency spare parts in storage 1 COMMUNITY TELECOMMUNICATION ISSUES list any issues here:

108 Appendix 11
Airport Inventory Island: Mitiaro Date: 13-Jul-06 AIRPORT INVENTORY Airfield Data Comment on condition Runway name Mitiaro length (m) 1500 width (m) 30 pavement construction compacted coral sand/aggregates runway markings? car tyres only for part of the runway runway lighting? nil Runway Strip length (m) 1500 width (m) 90 Taxiway if applicable nil length (m) width (m) pavement construction markings? lighting? Apron length (m) width (m) pavement construction reinforced concrete markings? nil lighting? nil Visual aids Windsock (lighted?) yes (not lighted) VASIS or PAPI? nil other nil Other airfield facilities drainage nil

Appendix 11 109
fencing partly Safety issues obstacle clearances - buildings, trees no livestock, vehicles, pedestrians in strip no erosion, flooding, sea surges susceptible to sea surges during cyclones Telecommunications and Radio Navaids Data Comment ATC facility/equipment? nil Navaid? nil NOTAM or weather report facility? radio telephone received via air traffic control in Rarotonga Aircraft Support and Utilities Data Comment Aircraft fuel storage nil capacity (l) type of storage frequency and reliability of resupply Fire and Rescue nil category and vehicle Water supply NIL storage capacity (l) storage type source Power supply NIL main power? standby generator? Telecommunications telephone yes operated by Air Raro fax Passenger and Cargo Handling Data Comment Terminal building (sq m) construction, age and condition reinf concrete and timber framed, OK

110 Appendix 11
passenger handling counter? yes baggage handling? yes water supply no toilets yes power supply no telephone yes Airport Maintenance Data Comment Maintenance equipment MIA slasher, grass cuutter, lawn movers Maintenance service MIA Airport Ownership Data Comment Airport land Land owners Terminal building Land owners Other buildings and facilities Land owners Landing charge? $20 ($10 - MIA, $10 - Landowners Terminal rental charge? nil AIRPORT TRAFFIC 2004 2005 2006 Scheduled flights per week by aircraft type 3 x Banderantte 3 x Banderantte 3 x Banderantte Flights by other than Air Rarotonga nil nil nil Annual or monthly aircraft movements 12 monthly 12 monthly 12 monthly Annual or monthly arr and dep pax Annual or monthly arr and dep cargo

Appendix 11 111
Solid Waste Management Inventory Island: MAUKE Date: 13-Jul-06 WASTE DISPOSAL METHODS Domestic Waste indicative quantity (kg/household/week) 15 any separation at source? (Y/N) N how separated? (compostables, etc) how is rubbish stored at the house? Bin means of disposal (council collection, self) MIA collection compostables Dump plastics, paper Dump frequency of disposal (days) 14
Commercial Waste no. people on premises 10 indicative quantity (kg/premise. week) 20 any separation at source? (Y/N) N how separated (compostables, etc) means of disposal (council collection, self) MIA collection compostables Dump plastics, paper Dump frequency of disposal (days) 14 any fee paid? ($/collection) N Metals and Hazardous Waste type of material (metals, engine oil, etc) metals how often collected 14 days indicative quantity 25 means of collection MIA collection any fee paid? ($/collection) N

112 Appendix 11
MUNICIPAL DISPOSAL SITES Municipal Landfill or Dump capacity (m3) ex spare capacity (m3 or %) is there waste separation on site? (Y/N) is site lined? is leachate intercepted for treatment? type and no. of mech plant, equipment condition of site (management) year constructed Recycling Depot capacity (m3) what materials are collected recyclables packaging procedures where are recyclables shipped to? how often is shipment made? cost per shipment Hazardous Material Recycling Facility what materials are collected packaging procedures where are recyclables shipped to? how often is shipment made? cost per shipment OPERATION AND MAINTENANCE no. of council staff in solid waste section 2 no. operators at council disposal site nil skill level of operators semi skilled no. staff at recycling depot nil

Appendix 11 113
no. staff involved in haz waste recycling 2 annual council operating costs ($/year) ENVIRONMENTAL EFFECTS are pigs, flies etc a nuisance problem? yes are wind-blown plastic bags a problem? yes any rubbish entering lagoon? no COMMUNITY ATTITUDE 1. Satisfaction with the current solid waste management practices? yes 2. Would prefer regular council collection of rubbish or disposal by self? leave as is 3.Would do onsite composting if given the equipment and know-how? yes 4. Would be prepared to separate rubbish before disposal to save valuable land areas? yes 5. Willing to make a small contribution towards council operating a total waste management collection and treatment system? yes
COMMUNITY SOLID WASTE ISSUES list any issues here:

114 Appendix 11
Telecommunications Inventory Island:Penrhyn Date: 28/07/200
6SERVICES Telephone Landlines service coverage (% households) 82individual house connections 95no. public access centers 1system capacity 116total length of distribution network (m) 10klines underground (%) 100condition excellent Mobile network coverage service coverage (% households) individual house connections no. public access centers system capacity Internet Dial-up access service coverage (% households) 82connection access speed (kbs) 56Kindividual house connections 3no. public access centers 1Broadband (ADSL) service coverage (% households) 0connection access speed (kbs) 256Kindividual house connections 0no. public access centers 1

Appendix 11 115
Radio and Television no. of radio stations AM/FM 1no of television channels 1 EMERGENCY WARNINGS Describe procedure of issuing warnings Radio/TV
broadcasts TARIFFS AND REVENUE current tariffs telephone internet access frequency of billing annual revenue collected annual operating costs OPERATION AND MAINTENANCE no. of staff on island 2no. technicians on island 1type and qualification of technicians transmission stations cyclone-proof? 1any emergency spare parts in storage 1 COMMUNITY TELECOMMUNICATION ISSUES list any issues here:

116 Appendix 11
Airport Inventory Island: Penrhyn Date: AIRPORT INVENTORY Airfield Data Comment on condition Runway name Penrhyn length (m) 2286.5 width (m) 30 pavement construction compacted coral sand and gravel runway markings? no runway lighting? no Runway Strip length (m) 2286.5 width (m) 90 Taxiway if applicable NA length (m) width (m) pavement construction markings? lighting? Apron length (m) width (m) pavement construction reinforced concrete markings? nil lighting? nil Visual aids Windsock (lighted?) yes (no) VASIS or PAPI? other Other airfield facilities drainage

Appendix 11 117
fencing Safety issues obstacle clearances - buildings, trees livestock, vehicles, pedestrians in strip erosion, flooding, sea surges Telecommunications and Radio Navaids Data Comment ATC facility/equipment? Navaid? NOTAM or weather report facility? Aircraft Support and Utilities Data Comment Aircraft fuel storage yes operated by Air Raro capacity (l) varies capacity varies depending on frequency of boats to Manihiki type of storage 200 litre drums frequency and reliability of resupply once every 6 months, not reliable Fire and Rescue NA category and vehicle Water supply NIL storage capacity (l) storage type source Power supply NIL main power? standby generator? Telecommunications Yes telephone yes operated by Air Raro fax nil Passenger and Cargo Handling Data Comment Terminal building (sq m) construction, age and condition concrete floor, timber framed

118 Appendix 11
passenger handling counter? no baggage handling? yes water supply yes toilets yes power supply no telephone no Airport Maintenance Data Comment Maintenance equipment PIA Maintenance service PIA Airport Ownership Data Comment Airport land Penrhyn Airport Proprietors Incorporated Terminal building Other buildings and facilities Landing charge? Terminal rental charge? AIRPORT TRAFFIC 2004 2005 2006 Scheduled flights per week by aircraft type Flights by other than Air Rarotonga Annual or monthly aircraft movements Annual or monthly arriving and departing pax Annual or montly arriving and departing cargo

Appendix 11 119
Telecommunications Inventory Island:Pukapuka Date: 28/07/200
6SERVICES Telephone Landlines service coverage (% households) 94individual house connections 83no. public access centers 1system capacity 88total length of distribution network (m) 10klines underground (%) 100condition excellent Mobile network coverage NAservice coverage (% households) individual house connections no. public access centers system capacity Internet Dial-up access service coverage (% households) 94connection access speed (kbs) 56Kindividual house connections 3no. public access centers 1Broadband (ADSL) service coverage (% households) 0connection access speed (kbs) 256Kindividual house connections 0no. public access centers 1

120 Appendix 11
Radio and Television no. of radio stations AM/FM 1no of television channels 1 EMERGENCY WARNINGS Describe procedure of issuing warnings Radio/TV
broadcasts TARIFFS AND REVENUE current tariffs telephone internet access frequency of billing annual revenue collected annual operating costs OPERATION AND MAINTENANCE no. of staff on island 2no. technicians on island 1type and qualification of technicians transmission stations cyclone-proof? 1any emergency spare parts in storage 1 COMMUNITY TELECOMMUNICATION ISSUES list any issues here:

Appendix 11 121
Airport Inventory Island: Pukapuka Date: AIRPORT INVENTORY Airfield Data Comment on condition Runway name length (m) 1500m, 1250m meqasured by GHD width (m) pavement construction coral runway runway markings? overgrown by grass in some areas, 1 winsock, 2 end markers runway lighting? Runway Strip adequate for infrequent Banderrantte flights although lots of workers sent for maintenance - very little
is done length (m) GHD took measurements and will prepare improvement plan probably $2m width (m) Taxiway if applicable 6 flights x 8 persons = 100 E-D pass per person length (m) width (m) pavement construction markings? lighting? Apron length (m) width (m) pavement construction markings? lighting? Visual aids Windsock (lighted?) VASIS or PAPI? other Other airfield facilities

122 Appendix 11
drainage fencing Safety issues obstacle clearances - buildings, trees livestock, vehicles, pedestrians in strip erosion, flooding, sea surges Telecommunications and Radio Navaids Data Comment ATC facility/equipment? Navaid? NOTAM or weather report facility? Aircraft Support and Utilities Data Comment Aircraft fuel storage capacity (l) type of storage frequency and reliability of resupply Fire and Rescue category and vehicle Water supply storage capacity (l) storage type source Power supply main power? standby generator? Telecommunications telephone fax Passenger and Cargo Handling Data Comment Terminal building (sq m) thatched hut

Appendix 11 123
construction, age and condition passenger handling counter? no covered area at aircraft for cargo and equipment, fuel brough from nearby village baggage handling? water supply toilets power supply telephone Airport Maintenance Data Comment Maintenance equipment Maintenance service Airport Ownership Data Comment Airport land Terminal building Other buildings and facilities Landing charge? Terminal rental charge? AIRPORT TRAFFIC 2004 2005 2006 Scheduled flights per week by aircraft type Flights by other than Air Rarotonga Annual or monthly aircraft movements Annual or monthly arriving and departing pax Annual or montly arriving and departing cargo

124 Appendix 11
Telecommunications Inventory Island:Rakahanga Date: 28/07/200
6SERVICES Telephone Landlines service coverage (% households) 80individual house connections 35no. public access centers 1system capacity 44total length of distribution network (m) 5klines underground (%) 100condition excellent Mobile network coverage service coverage (% households) individual house connections no. public access centers system capacity Internet Dial-up access service coverage (% households) 80connection access speed (kbs) 56Kindividual house connections 1no. public access centers 1Broadband (ADSL) service coverage (% households) 0connection access speed (kbs) 256Kindividual house connections 0no. public access centers 1

Appendix 11 125
Radio and Television no. of radio stations AM/FM 1no of television channels 1 EMERGENCY WARNINGS Describe procedure of issuing warnings Radio/TV
broadcasts TARIFFS AND REVENUE current tariffs telephone internet access frequency of billing annual revenue collected annual operating costs OPERATION AND MAINTENANCE no. of staff on island 2no. technicians on island 1type and qualification of technicians transmission stations cyclone-proof? 1any emergency spare parts in storage 1 COMMUNITY TELECOMMUNICATION ISSUES list any issues here:

126 Appendix 11
Telecommunications Inventory Island:Palmerston Date: 28/07/200
6SERVICES Telephone Landlines service coverage (% households) 0individual house connections 0no. public access centers 1system capacity 5total length of distribution network (m) 0lines underground (%) 0condition 0Mobile network coverage service coverage (% households) individual house connections no. public access centers system capacity Internet Dial-up access service coverage (% households) 0connection access speed (kbs) 0individual house connections 0no. public access centers 0Broadband (ADSL) service coverage (% households) 0connection access speed (kbs) 256Kindividual house connections 0no. public access centers 1

Appendix 11 127
Radio and Television no. of radio stations AM/FM 1no of television channels 0 EMERGENCY WARNINGS Describe procedure of issuing warnings Radio broadcasts TARIFFS AND REVENUE current tariffs telephone internet access frequency of billing annual revenue collected annual operating costs OPERATION AND MAINTENANCE no. of staff on island 1no. technicians on island 1type and qualification of technicians transmission stations cyclone-proof? 0any emergency spare parts in storage 0


Appendix 12 1
I. REVIEW OF AVAILABLE LITERATURE
A. Policy and Strategic Planning
1. The principal reference is the National Sustainable Development Plan (NSDP), a draft of which was available throughout the TA. For each island, socio-economic development profiles and five year strategic plans for 2000 – 2005 period were prepared as part of ADB TA 3795 – COO in 2003 (Preparing the Outer Islands Development Program).
1. The National Sustainable Development Plan
2. The NSDP itself was launched in January 2007. NSDP development originated in 2003 when the Cook Islands Government held a National Development Forum to develop a framework to guide national development into the future. NSDP development involved the Cook Islands principal development partners and is based on the country’s needs and priorities.
3. The NSDP sets out nine sustainable development goals. An analysis of the goals that affect infrastructure is given in Table A12 1 below.
Table A12 1: Analysis of NSDP Targets Directly Affecting Infrastructure Development Goal Sector and Strategy Quantified Outcome Targets by
2010 ICT: encourage private sector-lead Information, Communications and Technology development to provide universal access
• Increased ICT literacy by 50%
ICT: strengthen e-government initiatives for increased public sector efficiency
• Electronic public access to government information by 50%
Energy: rationalize management of the energy sector by developing and implementing CI Energy Strategic Plan for all islands
• Decreased per capita energy consumption by 20%
• Increased use of renewable energy by 30%
Transport: provide a national road transport system for each island that is safe and efficient
• Land transport strategy for each island developed by 2007 with priority actions commencing in 2008
Transport: provide safe, efficient and affordable air and sea transport to all islands in partnership with the private sector
• Air and sea transport strategic plan developed and implemented by March 2007
4. Strengthened and affordable basic infrastructure
Airports and Harbors: provide and maintain safe and secure airport and port facilities and services on all islands
• A prioritized plan for improving airport facilities and services developed and implemented by end 2007 including reliability of new navigation aids and air traffic systems improved 90% by 2008
• Airports improved to ICAO standards and management responsibility transferred to the CI Aviation Authority by 2010
• A prioritized plan for upgrading and maintaining port facilities to meet domestic and international shipping needs;
• A plan to meet international shipping and port security codes

2 Appendix 12
1.Well-managed private sector-led economic development
Private Sector Development: promote and enhance private sector-lead development of the tourism industry that recognizes the importance of the natural environment and cultural heritage of the CI
• A prioritized National Tourism Strategy by end 2006 that emphasizes tourism growth of 5%
Marine: strengthen CI Marine Resources Strategy incorporating guiding principles and strategies agreed in Pacific Islands Regional Oceans Policy and other regional/international guiding fishing management instruments
• Increased gross value of product from the marine sector by 30%
Marine: develop and implement Offshore Fisheries Management Plan in partnership with Tuna Industry Association and other stakeholders
• Increased industry value by at least 20%
Marine: sustainable ecosystem management of inshore fisheries and increased community management of the resource
• Increased area of well managed community based Raui’s by 25%
Environment: implement National Environmental Strategic Action Framework ensuring use and management of natural resource and environment reflect a balanced economic, social and environmental consideration across all sectors and at all levels
• Short-term priorities listed in NESAF in relation to each of the broad thematic areas such as biodiversity conservation, land, waste and climate change relevant to coastal zone and freshwater resources
3. Sustainable use and management of natural resources and environment
Water: develop and implement a comprehensive freshwater management plan of action to guide supply and demand of water on each island to ensure universal access to safe drinking water
• Increased access to safe drinking water on Rarotonga by 10%
• Action plans for sustainable water management developed and implemented for at least the main outer islands by 2008
• Increased access to sustainable, reliable and quality water services to the people by 40%
• Improve the governance of water management by reviewing relevant legislation as appropriate by 2007 focusing on developing public private partnerships in the supply of water and demand side management including the adoption of user pay principles and encouraging households to also use rainwater.
Waste: improve management of solid, liquid and other forms of wastes, minimizing the human health effects and the impacts on the environment
• A prioritized solid waste management plan increasing recycling and reducing residual solid wastes going to landfill by 30%
• a harmonized and integrated liquid waste management policy for reducing water borne diseases and environmental costs
9. A safe, secure and resilient Cook Islands:
All Hazard Risk Management: establish a coordinated and effective national risk reduction management system for all hazards
• A prioritized National Risk Plan of Action for Disaster Risk Reduction and Disaster Management developed and implemented by 2007
• for natural hazards such as cyclones and droughts associated with climate change and variability, develop and implement a country focused action plan by 2007 including:
• mainstreaming disaster risk management in the national planning

Appendix 12 3
and budgetary process and • reduced costs of average natural
disaster events by 20% Aid Effectiveness: Increase effectiveness of development partner financial and technical assistance
• Achieving coordinated and harmonized donor support including:
• at least 50% of development support to CI reflects immediate and short-term national and sector priorities by 2007
8. An effective foreign affairs policy that meets the needs and aspirations of the CI
Aid Effectiveness: limit vulnerability to development assistance by mobilizing aid for strengthening national capacities at all levels
• Proportion of aid allocated to targeted national capacity development increased by 20%
• 30% reduction in transaction costs on development partner projects to CI by 2008
2. Outer Island Strategic Plans
4. The strategic plans, in addition to defining the island’s aspirations for future development, also identified a list of specific needs in various sectors, including specific infrastructure improvements. In subsequent years each island administration has prepared an annual business plan as part of the budgetary process. The annual business plans contain a request for implementation of high-priority projects identified in the strategic plans as well as new projects.
5. The island profiles are summarized in Appendix 11 together with a list of infrastructure projects contained in their 2003-2008 strategic plans and their FY2006-2007 business plans.
B. Budgeting
6. Key references are the Budget Policy Statement, 2006-2007 and the 2005 – 2006 Appropriation Amendment. The latter document provided information Government recurrent and development expenditures. Breakdowns of capital expenditure and foreign funding by island and by sector are shown though not all allocations of foreign funding is shown, nor are amounts spent on maintenance of facilities and equipment. extracted fron eapital and operational expenditure, from the Government’s own sources and from aid funding. Key figures are quoted in Part 2 of Volume 1.
C. Sectors
7. For each sector, the main source of information was the appropriate Ministry or authority, as well as the site visits undertaken to the individual islands (combined with the study team from GHD Pty engaged by NZAID for the northern group). Further specific information from plans, feasibilitiy studies was also made use of for each sector, as listed below. These are cited in the body of the report

4 Appendix 12
II. REFERENCES
Title Date Author Funding Agency Sector
A Partial Commentary on the National Building Code - Cook Islands 1990 Ministry of Works CIGOV/AusAid Infrastructure
Aerodrome Emergency Plan - Rarotonga International Airport Airport Authority Airport Authority Air Transport
Aid Policy Statement 1998 Cook Islands Government CIGOV Multi-sector
Airport Authority Financial Statements 2005 Jun-05 Airport Authority Airport Authority Air Transport
Aitutaki Harbout Development Nov-03 MOW / CIPA n/a Marine Transport
Aitutaki Island Administration Business Plan 2006-2007 Apr-06 Mr Sabati Solomona, Is Secretary CIGOV Island Administration
Appropriation Amendment Act, 2006 2006 Cook Islands Government n/a Finance
Atiu Island Administration Business Plan 2006-2007 Apr-06 Mr Mann Unuia, Is Secretary CIGOV Island Administration
Atiu Power Sector Feasibility Report 2004 2004 UNDP/UNESCO Technical Assistance Project UNDP/CIGOV Energy
Avatiu Harbour Development for Fishing Industry - Proposed Quay Wall Berth May-02 Ministry of Works CIGOV Marine Transport
Avatiu Harbour Western Side Development Study - Final Report Apr-87 Wilton & Bell Pty Ltd
Australian Development Assistance Bureau Marine Transport
Budget Policy Statement 2006 – 2007 Mar-06 Cook Islands Government n/a Finance
Building Controls & Standards 1991 Cook Islands Government CIGOV Infrastructure
Cities, Seas, & Storms, Managing Change in Pacific Island Economies; Vol IV Adapting to Climate Change Nov-00 PNG & PI Country Unit & World Bank Aid Agencies Environment

Appendix 12 5
Climate Change Activites - Assisting non-Annex I Countries International Global Change Institute - NZ Environment
Climate Proofing: A Risk-based Approach to Adaptation Oct-04 Maunsell-IGCI ADB Multi-sector
Coming in on a Jet Plane 1994 Colin Hall Airport Authority Air Transport
Condition Assessment of Existing Harbour - Atiu Harbour Jul-06 GHD Consultants NZAid/CIGOV Marine Transport
Cook Is 2001 Census of Population & Dwelling - Main Report 2003 Statistics Office CIGOV Statistics
Cook Islands 2000 Census of Agriculture & Fisheries 2000 Cook Islands Government CIGOV Agriculture
Cook Islands Climate Risk Profile 2004 ADB Climate Adaptation Program for the Pacific ADB Multi-sector
Cook Islands Cyclone Recovery Reconstruction Plan 2006 Cook Islands GOvernment CIGOV Multi-sector
Cook Islands Disaster Risk Management Plan 2006 Apr-06 Cook Islands Government Disaster Management
Cook Islands Investment Corporation Annual Report 04/05 2005 Cook Islands Investment Corporation CIIC Buildings
Cook Islands National Energy Policy 2003 Cook Islands Government CIGOV Energy
Cook Islands Outer Island Aerodromes Audit Reports 31-Dec-02 George Cowan CAANZ Air
Cook Islands Ports Authority, Avatiu Western Basin Development Peer Review of Proposed Development, Comments upon the Draft Report by AC Consulting Group Feb-03 Ata Herman - MOW NZAid/CIGOV Marine Transport
Cook Islands Ports Authority, Avatiu Western Basin Development Project Implementation Document Nov-02 Tenga Epi Mana AusAid/CIGOV Marine Transport
Cook Islands Ports Authority, Avatiu Western Basin Development Stage 2, Project Implementation Document Rev 2,
April 2005 AC Consulting Group Ltd NZAid/CIGOV Marine Transport
Cook Islands Ports Authority, Avatiu Western Basin Development Stage 2, Concept Design Report Rev 1 Aug-04 AC Consulting Group Ltd NZAid/CIGOV Marine Transport

6 Appendix 12
Cook Islands Ports Authority, Avatiu Western Basin Development Stage 1 Development Options & Cost Estimates Jul-02 AC Consulting Group Ltd NZAid/CIGOV Marine Transport
Cook Islands Vulnerability and Adaptation Assessment 2001 National Environment Service CIGOV Multi-sector
Design Concept for Proposed Harbour Upgrade - Mitiaro Harbour Jul-06 GHD Consultants NZAid/CIGOV Marine Transport
Development Investment Act 1995-96 Cook Islands Government Foreign Investment
Development Partnership Arrangement between NZ/AUS/CIGOV for outer is development infrastructure construction & upgrade OMIA/Aid Management Govt Infrastructure
Disaster Risk Management Bill Draft 9 Jun-06 Crown Law/EMCI NZAid/SOPAC/ CIGOV
Emergency Management
Environmental Law in the Pacific 1996 SPREP/IUCN Edited by Ben Boer IUCN Environment
Harbour Surveys Avatiu, Avarua, Avana, Arutanga Mar-06 Robert Smith, SOPAC SOPAC/CIGOV Marine Transport
Home Building Manual for Cook Islands Ministry of Works Govt Infrastructure
Hyogo Framework for Action 2005-2015; Building the resilience of nations and communities to disasters Jan-05
United Nations International strategy for disaster reduction UN Disaster Management
Implementing the Yokohama Strategy & Plan of Action - Pacific Islands regional progress report (1994-2004) SOPAC SOPAC Disaster Management
Initial Damage Assessment - Field Reference Guide Office of US Foreign Disaster Assistance USAID Multi-sector
Initial Damage Assessment National Course Geoff Mackley SOPAC Disaster Management
Island Government Bill/Ministry of Islands Development - Draft Cook Islands Government CIGOV Multi-sector
Legal & Institutional Strengthening of Environment Management in the Cook Islands - Vol 1 - Review of Legal Institutional Frameworks Environment Services/ADB/Crown Law ADB Environment

Appendix 12 7
Legal & Institutional Strengthening of Environment Management in the Cook Islands - Vol 2 - Institutional Profiles Environment Services/ADB/Crown Law ADB Environment
Managing Environmental Change International Global Change Institute - NZ Environment
Mangaia Island Administration Business Plan 2006-2007 Apr-06 Mrs Tuaine Tuara, Is Secretary CIGOV Island Administration
Manihiki Island Administration Business Plan 2006-2007 Apr-06 Mr Araipu Munokoatini, Is Secretary CIGOV Island Administration
Mauke Island Administration Business Plan 2006-2007 Apr-06 Mr Tai Tura, Is Secretary CIGOV Island Administration
Mauke Power Sector Feasibility Report 2004 2004 UNDP/UNESCO Technical Assistance Project UNDP/CIGOV Energy
Ministry of Works - Annual Report 03/04 2004 Ministry of Works MOW
Ministry of Works - Cyclone Emergency Assistance Programme - Recovery Activities Mar-06 Ministry of Works MOW
Infrastructure/Disaster Management
Mitiaro Island Administration Business Plan 2006-2007 Apr-06 Mr Tai Topa, Is Secretary CIGOV Island Administration
Mitiaro Power Sector Feasibility Report 2004 2004 UNDP/UNESCO Technical Assistance Project UNDP/CIGOV Energy
National Building Code for the Cook Islands Ministry of Works Govt Infrastructure
National Disaster Management Plan 1997 Cook Islands Government CIGOV Disaster Management
National Environment Strategic Action Framework 2005-2009 Dec-04 National Environment Service
NZAid/AusAid/ UNDP/SPREP/ CIGOV Environment
National Sustainable Development Plan 2006-2010 Apr-06 Office of the Prime Minister CIGOV Multi-sector
Nikao-Takuvaine Backroad Upgrading Project, Field Study Report (A condensed version) Aug-06
China Highway Planning & Design Institute (HPDI) Consultant Inc China/CIGOV Road Transport
Peer Review of Proposed Harbour Upgrade - Mangaia Harbour Jul-06 GHD Consultants NZAid/CIGOV Marine Transport
Peer Review of Proposed Harbour Upgrade - Mauke Harbour Jul-06 GHD Consultants NZAid/CIGOV Marine Transport

8 Appendix 12
Penrhyn Island Administration Business Plan 2006-2007 Apr-06 Mr Roland Long, Is Secretary CIGOV Island Administration
Pipeline Network Ugrading Project Proposal Document - Mauke Ata Herman & Ben Parakoti- MOW NZAid/CIGOV Water
Ports Authority Annual Reports 2004 and 2005 15-Oct-05 Ports Authority Marine Transport
Preliminary Assessment of Environmental Effects of Proposed Channel and Harbor Improvements. Aitutaki April 2004 Auckland Uniservices Ltd, New Zealand n/a Marine Transport
Public Health Act 2004 Cook Islands Government CIGOV Multi-sector
Pukapuka Power Sector Feasibility Report 2004 2004 UNDP/UNESCO Technical Assistance Project UNDP/CIGOV Energy
Rakahanga Island Administration Business Plan 2006-2007 Apr-06 Mr Taunga Tuteru, Is Secretary CIGOV Island Administration
Rarotonga Airport Runway Extension Feasibility: Executive Summary Report Mar-2004 Airport Planning (NZ) Ltd CIGOV Air Transport
Rarotonga Environment Act 2003 Cook Islands Government CIGOV Environment
Rarotonga International Airport Development 10 Year Land Use Plan 2001 Auckland International Airport Ltd Air Transport
Reconnaissance Report, Wharf Facility Shore Protection, Penrhyn Island Jun-02
Strategic & International Policy Division, Department of Defence, Australia AusAid Marine Transport
Report on Tropical Cyclones in the Cook Islands Arona Ngari CIGOV Disaster Management
Report on Water Investigations - Mauke Feb-04 Tony Falkland, Ecowise Environmental for GHD Pty Ltd AUSAid Water
Socio Economic Profiles & Strategic Plans - Northern/Southern OMIA/ADB ADB Multi-sector
Strengthening Disaster Management & Mitigation in the Cook Is Oct-05 Alan Mearns ADB/SOPAC Disaster Management
Strengthening Disaster Management & Mitigation in the Cook Is - Component 1 - Interim Report Oct-05 Alan Mearns ADB/SOPAC Disaster Management

Appendix 12 9
Strengthening Disaster Management & Mitigation in the Cook Islands - Inception Report Oct-05 Alan Mearns ADB/SOPAC Disaster Management
Te Aponga Uira Avatiu Valley Power Station Generation Capacity Augmentation Study Aug-03 Russell Jorgensen Te Aponga Uira Energy
Te Aponga Uira Corporate Plan 01 July 2005 - 30 June 2010 Apr-05 Kevin Bruce Te Aponga Uira Energy
Te Aponga Uira Operating & Capital Budget 05/06 Jun-05 Te Aponga Uira Te Aponga Uira Energy
Te Aponga Uira Tarriff Review Apr-05 Kevin Bruce Te Aponga Uira Energy
Telecom Cook Islands Hurricane Safety Instructions 04/05 TCI TCI Disaster Management
Tender documents for the Avatiu Harbour Western Basin Development Stage 1 Aug-02 Miro Consultants NZAid/CIGOV Marine Transport
The additional study on coastal protection and port improvement in the Cook Islands Mar-94 Pacific Consultants International
Overseas Coastal Area Development Institute of Japan Marine Transport
Wharf Facility Shore Protection, Penhryn Island. Jun-02 Royal Australian Army Engineers Australia Marine Transport