coal rail infrastructure master plan - edition 3
TRANSCRIPT

2009 Coal Rail Infrastructure Master Plan

QR Network Pty Ltd
i
2009 Coal Rail Infrastructure Master Plan
Copyright
Copyright © 2009 QR Network Pty Ltd. Copyright in all works in this Coal Rail Infrastructure Master Plan (CRIMP) belongs to QR Network Pty Ltd, and all rights conferred by the law of copyright and by virtue of international copyright conventions are reserved to QR Network Pty Ltd. This document may not be copied reproduced or otherwise redistributed in whole or part, without the prior written consent of QR Network Pty Ltd.
Disclaimer and Limit of Liability
This document has been prepared as part of QR Network Pty Ltd’s Coal Rail Infrastructure Master planning process. QR Network Pty Ltd has endeavoured to include accurate and up-to-date information in this document.
Neither QR Network Pty Ltd nor any person involved in creating, producing or delivering this document makes any warranties or representations about any content or information in this document.
To the extent permitted by law QR Network Pty Ltd excludes (and where the law does not permit an exclusion, limits to the extent permitted by law) all:
• Warranties and representations about the currency, accuracy, suitability, reliability or completeness of
any content or information in this document
• Liability for any direct, indirect, consequential or incidental costs, losses, damages (including punitive
damages) and expenses suffered or incurred in any way(included but not limited to that arising from
negligence), in connection with any use of this document or any reliance on or any errors or omissions
in the content or information contained in this document.
Use of this document and the contents and information in this document is solely at the user’s risk.
For specific enquiries about the contents of this document, please contact:
Howard Van Der Klauw Manager Network Planning – Coal QR Network Email: [email protected] Phone: +61 7 3235 3733
Published October 2009

QR Network Pty Ltd
2009 Coal Rail Infrastructure Master Plan
ii
Contents
Copyright.............................................................................................................................. i Disclaimer and Limit of Liability......................................................................................... i
1.Executive Summary ....................................................................................... 2
2.CRIMP Purpose............................................................................................... 4
3.CRIMP Context ............................................................................................... 6 3.1. Forecast Coal Demand ............................................................................................... 6
3.1.1. Metallurgical Coal................................................................................................ 6 3.1.2. Thermal Coal....................................................................................................... 7
3.2. Queensland Export Coal Demand ............................................................................. 8 3.2.1. Metallurgical Export Coal Demand...................................................................... 9 3.2.2. Thermal Export Coal Demand........................................................................... 10
3.3. Background ............................................................................................................... 10 3.3.1. Queensland Coal Industry................................................................................. 10 3.3.2. Participants in the Coal Supply Chain ............................................................... 11 3.3.3. Characteristics of the Coal Supply Chain.......................................................... 12 3.3.4. Context of the CRIMP ....................................................................................... 13
3.4. Objectives and Process ........................................................................................... 14 3.5. Stakeholders ............................................................................................................. 15 3.6. Previous Coal Rail Infrastructure Master Plans..................................................... 15 3.7. Strategic Risk ............................................................................................................ 16
3.7.1. Concentration of Supply Chain.......................................................................... 16 3.7.2. Congestion Impacts........................................................................................... 16 3.7.3. Route Diversity .................................................................................................. 17 3.7.4. Incremental Growth ........................................................................................... 17 3.7.5. Force Majeure Events ....................................................................................... 17 3.7.6. System Interoperability...................................................................................... 17
4.Potential Expansion Paths ........................................................................... 19 4.1. Coal Supply Chain Throughput Railed ................................................................... 19 4.2. Coal Supply Chain Expansion Potential ................................................................. 20 4.3. Potential Port Capacities.......................................................................................... 20 4.4. Planning Additional Rail Capacity........................................................................... 23 4.5. Existing Rail Network Capability ............................................................................. 24 4.6. Rail Corridor Capacity .............................................................................................. 26
4.6.1. Newlands System Capacity............................................................................... 27 4.6.2. Goonyella System Capacity .............................................................................. 28 4.6.3. Blackwater System Capacity............................................................................. 29 4.6.4. Moura System Capacity .................................................................................... 30 4.6.5. Surat Basin Rail................................................................................................. 31 4.6.6. Galilee Basin ..................................................................................................... 31
4.7. Methods for Assessing Corridor Expansion Options ........................................... 32 4.7.1. Goonyella to APCT (GAP)................................................................................. 33 4.7.2. Expansion of DBCT Beyond 85 mtpa................................................................ 34 4.7.3. Galilee Basin to APCT....................................................................................... 37 4.7.4. Other Expansion Paths ..................................................................................... 39 4.7.5. Conclusion......................................................................................................... 39

QR Network Pty Ltd
2009 Coal Rail Infrastructure Master Plan
iii
5.Southern Bowen Basin Expansion ............................................................... 43 5.1 Introduction ............................................................................................................... 43 5.2 Update on Previous / Committed Projects and Forecast Capacity ...................... 45
5.2.1 Gladstone.......................................................................................................... 45 5.2.2 Wiggins Island Coal Export Terminal ................................................................ 50
5.3 Planning Scenarios................................................................................................... 53 5.4 Detailed Tonnage Throughputs Underpinning Planning ...................................... 54 5.5 SBB76 ........................................................................................................................ 54 5.6 SBB82 ........................................................................................................................ 55
5.6.1 Increased Throughput Initiatives ....................................................................... 55 5.6.2 SBB82 – Capacity Analysis Results.................................................................. 57 5.6.3 Power Systems Upgrades................................................................................. 59
5.7 SBB100 ...................................................................................................................... 59 5.8 SBB165 ...................................................................................................................... 59
5.8.1 SBB165 – Blackwater System Expansion......................................................... 60 5.9 SBB225 ...................................................................................................................... 61 5.10 SBB Summary ........................................................................................................... 61
6.Northern Bowen Basin Expansion................................................................ 65 6.1 Introduction ............................................................................................................... 65 6.2 Update on Previous/ Committed Projects and Forecast Capacity ...................... 66
6.2.1 Dalrymple Bay Coal Terminal............................................................................ 66 6.2.2 Abbot Point (Goonyella to Abbot Point expansion project) ............................... 69
6.3 Planning Scenarios................................................................................................... 71 6.4 Detailed Tonnage Throughputs Underpinning Planning ...................................... 72 6.5 NBB148 ...................................................................................................................... 72 6.6 NBB154 ...................................................................................................................... 73
6.6.1 Goonyella Power Systems ................................................................................ 73 6.7 NBB195 ...................................................................................................................... 74
6.7.1 Goonyella to Abbot Point Expansion Project..................................................... 75 6.8 NBB 266 ..................................................................................................................... 76 6.9 NBB333 ...................................................................................................................... 77 6.10 NBB Summary........................................................................................................... 79
7.Western System ........................................................................................... 82 7.1 Introduction ............................................................................................................... 82 7.2 Update on Previous and Committed Projects ........................................................ 83 7.3 Planning Scenarios................................................................................................... 83 7.4 Detailed Tonnage Throughputs Underpinning Planning ...................................... 83 7.5 W8............................................................................................................................... 85 7.6 W10............................................................................................................................. 86 7.7 W14............................................................................................................................. 87 7.8 W20............................................................................................................................. 87 7.9 Western System Summary....................................................................................... 88
8.Asset Replacement Strategy ....................................................................... 90
9.Projects for Endorsement ............................................................................ 93 9.1 Blackwater System Concept and Prefeasibility Study .......................................... 93
9.1.1 NCL Triplication between Aldoga & Rocklands (Concept Study Phase)........... 94 9.1.2 Concept & Prefeasibility Study for rest of Blackwater system for proposed
expansion beyond 68 mtpa ............................................................................... 94

QR Network Pty Ltd
2009 Coal Rail Infrastructure Master Plan
iv
9.2 Goonyella System Concept and Prefeasibility Study............................................ 97 9.2.1 Coppabella – DBCT / HPSCT (Up to Prefeasibility Stage) ............................... 97 9.2.2 West of Coppabella Upgrades (Up to Prefeasibility Stage)............................... 98
9.3 Callemondah Feeder Station renewal / upgrade prefeasibility........................... 101 9.4 Wotonga Feeder Station prefeasibility.................................................................. 101
10.Glossary of Terms .................................................................................... 103
11.Abbreviations ........................................................................................... 107
12.Appendices............................................................................................... 110 12.1 Modelling ................................................................................................................. 110
12.1.1 Static Modelling ......................................................................................... 110 12.1.2 Dynamic Modelling .................................................................................... 111
12.2 Appendix for Chapter 5 - Southern Bowen Basin................................................ 112 12.2.1 Coal System Operational Characteristics.................................................. 112 12.2.2 SBB82 Modelling Assumptions and Results ............................................. 115 12.2.3 SBB100 Modelling Assumptions and Results ........................................... 121
12.3 Appendix for Chapter 6 – Northern Bowen Basin................................................ 127 12.3.1 Coal System Operational Characteristics.................................................. 127 12.3.2 NBB154 Modelling Assumptions and Results ........................................... 129 12.3.3 NBB195 Modelling Assumptions and Results ........................................... 134

QR Network Pty Ltd
2009 Coal Rail Infrastructure Master Plan
v
Tables Table 1: Export Coal Ports ..........................................................................................................................12 Table 2: Export Port and Rail System Throughput (mtpa) ..........................................................................19 Table 3: Industry Capacity Requests ..........................................................................................................20 Table 4: Port Capacities ..............................................................................................................................22 Table 5: Typical Rail Network Capabilities..................................................................................................25 Table 6: Newlands System – Potential Port and Rail Capacity ..................................................................27 Table 7: Goonyella System – Potential Port and Rail Capacity ..................................................................28 Table 8: Blackwater & Moura Systems – Potential Port and Rail Capacity ................................................30 Table 9: Merit of Potential Expansion Option – Goonyella to APCT..........................................................33 Table 10: Merit of Potential Expansion Option – DBCT greater than 85 mtpa ..........................................36 Table 11: Merit of Potential Expansion Option – Galilee Basin to APCT...................................................38 Table 12: Relative Merits of Potential Expansion Options .........................................................................40 Table 13: Southern Bowen Basin Planning Scenarios ...............................................................................53 Table 14: SBB – System Source and Export Port Statistics .......................................................................54 Table 15: SBB Summary of Scenario Expansion Paths .............................................................................62 Table 16: Northern Bowen Basin Planning Scenarios ................................................................................71 Table 17: NBB - System Source and Export Port Statistics........................................................................72 Table 18: NBB Summary of Scenario Expansion Paths .............................................................................79 Table 19: Western System Planning Scenarios.........................................................................................83 Table 20: Western System – Alternative Expansion Options Considered..................................................86 Table 21: Western System Summary of Rail Infrastructure Enhancement Scenarios ...............................88 Table 22: Asset Replacement Expenditure.................................................................................................91 Table 23: Proposed Cost of Blackwater System Expansion Study (Concept and Prefeasibility) ...............95 Table 24: Forecast Total Export Tonnage for Hay Point Coal Terminals. ..................................................97 Table 25: Proposed Cost of Goonyella System Expansion Studies (Concept and Prefeasibility)..............99 Table 26: SBB82 – Blackwater System Track Utilisation.........................................................................115 Table 27: SBB82 – Moura System Track Utilisation ................................................................................120 Table 28: SBB100 – Blackwater System Track Utilisation.......................................................................122 Table 29: SBB100 – Moura System Track Utilisation ..............................................................................125 Table 30: NBB154 – Goonyella System Track Utilisation........................................................................130 Table 31: NBB154 – Newlands System Track Utilisation ........................................................................133 Table 32: NBB195 – Goonyella System Track Utilisation........................................................................135 Table 33: NBB195 – Newlands System Track Utilisation ........................................................................138

QR Network Pty Ltd
2009 Coal Rail Infrastructure Master Plan
vi
Figures Figure 1: Metallurgical Coal – Forecast of World Demand to 2025 ..............................................................6 Figure 2: Thermal Coal – Forecast of World Demand to 2025 .....................................................................7 Figure 3: Total Forecast Queensland Export Coal........................................................................................8 Figure 4: Metallurgical Coal – Forecast Queensland Export Demand..........................................................9 Figure 5: Thermal Coal – Forecast Queensland Export Demand...............................................................10 Figure 6: Map of Queensland Coal Export Ports ........................................................................................21 Figure 7: Comparison of Tonnage Forecasts..............................................................................................23 Figure 8: Incremental Economic Cost Model .............................................................................................32 Figure 9: DBCT Brownfield Expansion Incremental Economic Cost .........................................................35 Figure 10: New Corridor from Galilee Basin to APCT Incremental Economic Cost ..................................37 Figure 11: Blackwater System Rail Network ...............................................................................................43 Figure 12: Moura System Rail Network ......................................................................................................44 Figure 13: Gladstone Ports Rail Expansion Projects ..................................................................................46 Figure 14: Blackwater System Forecast Export Capacity...........................................................................47 Figure 15: Moura System Forecast Export Capacity ..................................................................................48 Figure 16: Gladstone Port and Rail Export Capacity ..................................................................................49 Figure 17: WICET Rail Expansion Projects ................................................................................................50 Figure 18: Moura System Rail Network ......................................................................................................51 Figure 19: Gladstone Export Rail Capacity with 8000 tonne Payload Trains .............................................58 Figure 20: Goonyella System Rail Network ................................................................................................65 Figure 21: Newlands System Rail Network.................................................................................................66 Figure 22: Dalrymple Bay Coal Terminal Rail Expansion Projects .............................................................67 Figure 23: Goonyella System Forecast Export Capacity ............................................................................68 Figure 24: Abbot Point Coal Terminal Rail Expansion Projects..................................................................69 Figure 25: Newlands System Forecast Export Capacity.............................................................................70 Figure 26: Western System Map.................................................................................................................82 Figure 27: Map of Possible Scope for Blackwater Concept and Prefeasibility Studies ..............................96 Figure 28: Map of Possible Scope for Goonyella Concept and Prefeasibility Studies..............................100

Coal Rail Infrastructure Master PlanChapter 1
Executive Summary
1

QR Network Pty Ltd
2009 Coal Rail Infrastructure Master Plan
2
1. Executive Summary This is the 2009 edition of the Coal Rail Infrastructure Master Plan (CRIMP). Since the first CRIMP was released in 2006, QR Network has developed a works program of over $1.7B. This program has supported new coal unloaders at DBCT and RGTCT and future planned port expansions at the ports of Hay Point, Abbot Point and Gladstone. The rail costs on each of these future port expansions are likely to be of the same order of magnitude as the total program committed so far.
Wood Mackenzie’s export coal demand forecast indicates the total coal export task for the coal supply chain is likely to expand from 154 million tonnes per annum (mtpa) to around 294 mtpa by 2020. At this rate of growth a new port coal unloader will be required approximately every two years to match growth in global demand.
In order to achieve an economically optimum supply chain expansion, industry needs to be informed of the expansion path options, the port and rail infrastructure costs and hence the relative economics of the options. For this reason QR Network is planning to undertake extensive concept and prefeasibility studies on the Goonyella and Blackwater systems over the next couple of CRIMP planning cycles.
Endorsement is sought in this CRIMP for $64 million for various environmental and engineering works. This will complement the work currently being completed on the Newlands system as prefeasibility for the GAP project and work planned on the Moura system to support SBR/WICET. Completion of these studies will give industry a comprehensive understanding of the rail expansion paths available, their relative costs and their threshold triggers.
Chapter 4 “Potential Expansion Paths” of this CRIMP broadly describes the most likely expansion path for each rail system and provides a high level economic and qualitative analysis. This analysis indicates that rail capacity can be increased on each corridor to match proposed port expansions and to meet foreseeable increases in global export coal demand. Chapters 5, 6 and 7 describe in more detail the potential tonnage scenarios and matching rail expansions for the Southern Bowen Basin, Northern Bowen Basin and Western coal systems respectively.
Since the last CRIMP further limitations in the existing traction power systems have been identified. QR Network has prepared a detailed working paper which will be a strategic plan for coal network power systems. This will include new infrastructure, renewals and upgrades required to sustain current tonnages and support future expansion. The immediate projects supported by the working paper are for concept and prefeasibility works for the renewal (and if necessary relocation) of the feeder station at Callemondah and a new feeder station at Wotonga.
219 203 213
Coal Rail Infrastructure Master PlanChapter 2
CRIMP Purpose
2

QR Network Pty Ltd
2009 Coal Rail Infrastructure Master Plan
4
2. CRIMP Purpose The Coal Rail Infrastructure Master Plan (CRIMP) is developed by QR Network to inform stakeholders of the scope, cost and timing of investments required in the coal supply chain to support industry growth.
Through the CRIMP process, QR Network collaborates closely with access seekers, port operators and rail operators to determine the optimum rail system solutions to match proposed port nameplate capacity increases. Other investments to improve system efficiency and / or increase system throughput are also investigated.
The CRIMP details expansion paths for each rail system based on specific below rail infrastructure expansion projects and the associated above rail investments required to meet future demand predictions.
The CRIMP cycle is an annual business planning process that is associated with the financial year.
The main purpose of the CRIMP is to provide a rail system that expands to meet industry demands. Further, this maintains consistent and fair access for both existing and new access seekers.
The impact of rail infrastructure expansion projects on existing operations is measured via “Below Rail Transit Time %” (BRTT%). Expansion projects are required to provide the additional throughput capacity while maintaining BRTT% below limits that are set for each system in the Access Undertaking. This ensures additional rolling stock is not required for existing contracts.
The CRIMP also guides QR Network’s investment approval and project delivery processes by providing the demand / volume trigger points, sequence for expansion projects and the target dates for completion.
Finally the CRIMP informs coal producers of the projects that require endorsement through the voting process.

Coal Rail Infrastructure Master PlanChapter 3
Master Planning Context
3

QR Network Pty Ltd
2009 Coal Rail Infrastructure Master Plan
6
3. CRIMP Context 3.1. Forecast Coal Demand
The future forecast world coal demand is an important contextual element for the Australian and Queensland coal export industry and subsequently the CRIMP. A long term view extracted from the Coal Market Service – International Trade information, provided by Wood Mackenzie, dated May 2009 is provided in this chapter.
As an aid to understanding what the likely situation of world demand for coal might be up to 2025, the following forecast information is current as at May 2009. Reports are provided for both metallurgical and thermal coal.
3.1.1. Metallurgical Coal
Metallurgical coal is used, together with iron ore, to produce pig iron in traditional blast oxygen furnaces. This pig iron can then be used to produce crude steel.
World demand for metallurgical coal imports is forecast to grow at a compound annual average rate of approximately 4% to 2025. Metallurgical coal imports are forecast to reach 347 million tonnes (mt) by 2025 (refer to Figure 1 below), an increase of 162 mt from 2009 import levels.
Figure 1: Metallurgical Coal – Forecast of World Demand to 2025
0
50
100
150
200
250
300
350
400
2009 2011 2013 2015 2017 2019 2021 2023 2025
Years
Mt
Source: Wood Mackenzie Coal Market Service – Metallurgical Trade, May 2009.

QR Network Pty Ltd
2009 Coal Rail Infrastructure Master Plan
7
Asian countries represent the main demand drivers for the future. Blast furnace hot metal production growth is forecast to significantly increase in the countries of India, China, Brazil and South Korea, with growth primarily concentrated in India (63 mt), China (33 mt) and Brazil (18 mt).
3.1.2. Thermal Coal
The world market in imported thermal coal is forecast to show significant growth with imports increasing from 660mt in 2009 to 969mt by 2020 and 1,063mt in 2025. This represents a compound annual average growth rate of about 2.5% to 2025. Refer to Figure 2 below for forecast global thermal coal import levels up to 2025.
According to Wood Mackenzie’s Coal Market Service – Thermal Trade, rapidly increasing power sector requirements in Asia with increasing power generation capacity and higher utilisation rates are the main drivers of the thermal coal import demand.
Figure 2: Thermal Coal – Forecast of World Demand to 2025
0
200
400
600
800
1000
1200
2009 2011 2013 2015 2017 2019 2021 2023 2025
Years
Mt
Source: Wood Mackenzie Coal Market Service – Thermal Trade, May 2009
Japan is currently the world’s largest importer of thermal coal. This should continue into the future but with minimal growth. The major markets in 2008 were Japan and Europe which together provided 50% of import demand. By 2025 these markets are forecast to change so that together they represent only 32% of world thermal coal trade. The main driver of demand for the future is the increased use of thermal coal for coal fired power stations in China and India.

QR Network Pty Ltd
2009 Coal Rail Infrastructure Master Plan
8
3.2. Queensland Export Coal Demand
The demand for coal from Queensland mines up to 2020 is generally on the increase. Figure 3 below exhibits this trend. The overall increase in forecast export tonnes from 2010 to 2020 is 140 mtpa. This represents an increase of approximately 90% overall.
The tonnage line shows a flattening out in 2019 and 2020. This most likely represents future uncertainty in mine production and demand.
This predicted strong ongoing growth in demand over the next 10 years supports the view that the current reduction in demand is only for a short term.
Figure 3: Total Forecast Queensland Export Coal
0.00
50.00
100.00
150.00
200.00
250.00
300.00
350.00
2010 2011 2012 2013 2014 2015 2016 2017 2018 2019 2020
Years
Mtp
a
Source: Wood Mackenzie Coal Supply Service.
A break up into metallurgical and thermal coal forecast exports over the period 2010 to 2020 is provided in the following section.

QR Network Pty Ltd
2009 Coal Rail Infrastructure Master Plan
9
3.2.1. Metallurgical Export Coal Demand
The forecast for metallurgical coal up to 2020 is shown in Figure 4 below. Noticeably the forecast curve has a relatively small increase over the period. In fact the tonnage shift from 2010 to 2020 represents an increase of 79 mtpa (i.e. an annual average of 7.9mtpa) which is a 69% increase overall. There is a flattening out in supply in the last three years.
Figure 4: Metallurgical Coal – Forecast Queensland Export Demand
0.00
20.00
40.00
60.00
80.00
100.00
120.00
140.00
160.00
180.00
200.00
2010 2011 2012 2013 2014 2015 2016 2017 2018 2019 2020
Years
Mtp
a
Source: Wood Mackenzie Coal Supply Service.

QR Network Pty Ltd
2009 Coal Rail Infrastructure Master Plan
10
3.2.2. Thermal Export Coal Demand
The forecast demand for thermal exports up to 2020 is shown in Figure 5 below. For the period 2010 to 2020 the forecast tonnage growth is 61mtpa (i.e. an annual average of 6.1mtpa) which represents a change of 150%.
Figure 5: Thermal Coal – Forecast Queensland Export Demand
0.00
20.00
40.00
60.00
80.00
100.00
120.00
2010 2011 2012 2013 2014 2015 2016 2017 2018 2019 2020
Years
Mtp
a
Source: Wood Mackenzie Coal Supply Service.
3.3. Background
3.3.1. Queensland Coal Industry
Queensland’s export coal industry is the largest in Australia. It accounts for approximately 58% of the Australian total. Approximately 85% of Queensland’s coal production is exported. This constitutes about 20% of the consolidated global traded coal market, and comprises almost 50% of global traded coking coal and almost 10% of global traded thermal coal.
Demand for Queensland coal is predicted to continue increasing in concert with world demand for resources. These higher volumes will place pressure on the capacity and performance of the coal supply chain from mine to ship.
The ability of Queensland coal producers to maintain Queensland’s position as a leading coal exporter and respond to the growth in global coal consumption is contingent upon a number of factors1:
1 ABARE, (October, 2006), Australian Coal Exports, Outlook to 2025 and the role of infrastructure, ABARE research report 0.6.15

QR Network Pty Ltd
2009 Coal Rail Infrastructure Master Plan
11
• Timely and responsive development of new mines and supporting rail and port infrastructure; • Access to water resources; and • Availability of skilled resources
This development necessitates the need for a strategic approach to infrastructure planning.
3.3.2. Participants in the Coal Supply Chain
Most Queensland export coal sales are based on free-on-board (FOB) sales. For the purpose of this CRIMP, the supply chain will be considered to extend from the mine pit to the ship hatch.
The Queensland export coal supply chain comprises five interdependent logistical networks:
• The specific coal mines (coal recovery, wash-plant, stockpiling, mine loops, out-loading). • The below rail infrastructure (train path availability). • The above rail infrastructure (rolling stock and operations). • The port infrastructure (in-loading loops, in-loading pits, stockpiles, ship loaders, berths).
3.3.2.1 Coal Mines
Queensland currently has 40 export coal mines in the Central Queensland coal region, located principally in two basins: The Northern Bowen Basin (including the Goonyella and Newlands rail systems) and the Southern Bowen Basin (comprising the Blackwater and Moura rail systems). There are an additional three coal mines in southern Queensland associated with the Western rail system. Mines are owned by the private sector (private or publicly listed entities). Some entities own more than one mine. Each mine has an access point for rail infrastructure, which may be for its sole use or may be shared with nearby mines.
3.3.2.2 Below Rail Infrastructure
Rail Infrastructure used by the coal industry is owned, managed and maintained by QR Network. The access charges that QR Network is permitted to charge rail operators for their use of the rail infrastructure are governed by QR Network’s Access Undertaking approved by the Queensland Competition Authority (QCA). The Undertaking is subject to periodic revision.
The current Undertaking covers the period to 30 June 2009.
A new Access Undertaking covering the period to 30 June 2013 is currently being considered by the QCA. The QCA determines the below rail infrastructure assets deemed prudent for coal haulage requirements. These assets form QR Network’s regulatory asset base. This asset base is used for calculating reference tariffs that form the basis of access charges to above rail operators/ end users.
3.3.2.3 Above Rail Operators
Mine owners negotiate individually with above rail operators to haul coal from mine out-loading points to port in-loading points. Above rail operators provide rolling stock, crewing and consumables including fuel. They also obtain access (train paths) from QR Network for their trains in exchange for the payment of access charges. Access charges are calculated on distance travelled, tonnage railed, type of locomotive tractive power (i.e. diesel or electric) and train paths used.
3.3.2.4 Coal Port Locations
The ports that service the export of coal railed from Queensland coal regions are described in Table 1 below:

QR Network Pty Ltd
2009 Coal Rail Infrastructure Master Plan
12
Table 1: Export Coal Ports
Port Asset Description Owner Operator
Abbot Point Abbot Point Coal Terminal North Queensland Bulk Ports Corporation Limited Abbot Point Bulkcoal Pty Ltd
Hay Point Services Coal Terminal
BHP Billiton-Mitsubishi Alliance Hay Point Services
Hay Point Dalrymple Bay Coal Terminal
Owned by North Queensland Bulk Ports Corporation Limited , leased by DBCT management
DBCT Pty Ltd
RG Tanna Coal Terminal Gladstone Ports Corporation Gladstone Ports Corporation Gladstone
Barney Point Coal Terminals Gladstone Ports Corporation Gladstone Ports Corporation
Brisbane Fisherman Islands Coal Terminal Port of Brisbane Corporation Queensland Bulk Handling Pty Ltd
3.3.3. Characteristics of the Coal Supply Chain
Historically, there has been a tendency for individual logistics networks to self-manage with limited recognition of the interdependencies between the links. This paradigm is reflected in different contracting frameworks between the mines and other parties within the supply chain and has led to embedded risks in the total supply chain. Generally, these risks are not formally allocated, are not priced, and negatively impact overall supply chain performance.
The management of the supply chain in this manner has worked in the past because of:
• Latent capacity within the supply chain. • Fewer and more vertically integrated entities with more public-sector ownership. • The collaboration and goodwill between the various parties.
However, the historical ‘slack’ has now been consumed, requiring more efficient and accountable interfaces between the parties to achieve the optimal total system throughput to meet the growing demands.
Identifying the optimal response to an increase in throughput tonnage requirements in a supply chain requires consideration of:
• Supply chain / logistics network characterisation. • Managing a supply chain / logistics network. • Supply chain capacity. • Managing capacity constraints and variation. • Supply chain velocity and mine performance. • The role of modelling.
Current practice in the coal supply chains has seen a more co-operative approach between supply chain participants. This is reflected in the expanded number of formal and informal meetings that are taking place. Some of these committees are the:
• Gladstone Coal Export Executive (GCEE). • Dalrymple Bay Coal Chain committee (DBCC). • Wiggins Island Coal Export Terminal (WICET) meetings. • Blackwater User Group (BUG). • Moura User Group (MUG).

QR Network Pty Ltd
2009 Coal Rail Infrastructure Master Plan
13
• Capricornia Coal Chain Steering Committee meeting (CCCSC). • Coal Chain Environmental Forum (CCEF). • Stakeholder Operational Monthly Meeting (SOMM). • Ports Operational Working Group (POWG) and the • DBCT Technical User Group.
In addition to these forums, QR Network planners have had specific meetings with DBCT expansion designers, HPSCT expansion designers, Ports Corporation of Queensland modellers (APCT), DBCC contracted coal chain model builders, and the Gladstone Ports Corporation regarding detailed dump station design assumptions used when designing port facilities.
3.3.4. Context of the CRIMP
The efficiency of the overall coal supply chain from mines to shipping is an outcome of the efficiency of each of the component logistics networks (mine – rail – port), and the effectiveness of the interfaces between each network. The rail network also has its own separate above-rail and below rail interface to manage.
The composition, management and optimisation of the supply chain is quite complex, but it is worth observing that increased throughput can be achieved by various means in specific circumstances, including additional port infrastructure, additional below rail infrastructure, additional trains, amended operating practices in mine loading, rail operations, port operations or any combination of these factors.
There is currently no forum in which the good of the overall supply chain can be adjudicated and implemented. Instead, individual entities in the supply chain act rationally to maximise profit and to meet other individual objectives with only coincidental benefit to other participants or to the overall efficiency of the supply chain. If QR Network, whose business is the provision of train paths, believes a particular capacity constraint in the supply chain would be best addressed by additional trains or train modifications (e.g. Electrically Controlled Pneumatic Braking) rather than below rail infrastructure duplication, QR Network can attempt to influence rail operators to acquire such trains but cannot direct that this be done.
QR Network recognises the need to have a consultation process involving stakeholders in the supply chain. To the extent that QR Network believes that a particular coal supply chain constraint can be removed by provision of additional rail infrastructure, QR Network requires the QCA’s agreement that the additional asset can be included in the QR Network regulatory asset base (RAB). The RAB is used as a basis for calculation of reference tariffs. These then form the basis of access charges to rail operators and so ultimately to the mines themselves under the mine-rail operator haulage contracts or end user agreements.
Recognising the keen interests of the various stakeholders, both for reasons of potential direct costs exposure and the possibility of non-infrastructure-based solutions, QR Network proposed, as part of the development of the 2005 Access Undertaking, that:
.. “uncertainties surrounding (QR Network) capital expenditure requirements be addressed through a Master Planning process involving consultation with stakeholders. This proposal was supported by all stakeholders.” (QCA Decision, December 2005, - Preamble, p.vii).
In consequence, the Coal Rail Infrastructure Master Plan published in September 2006 was developed to present for discussion with stakeholders of the coal supply chain QR Network’s four to five-year view (at that time) of the required capacity and performance of the coal rail network. These included growth in system throughput demand, anticipated capacity constraints, analysis of alternatives and recommended solutions.
Building upon the work that was undertaken in the formulation of the previous CRIMP documents published in September 2006, September 2007 and October 2008, this document is also based on an analysis of the total supply chain and its key attributes, including:
• The dynamic performance of the various logistics networks.

QR Network Pty Ltd
2009 Coal Rail Infrastructure Master Plan
14
• Key capacity constraints and the establishment of disciplined processes to maximise the utilisation at these areas of constraints.
• The design and construction of the supply chain (e.g. operating mode). • The system capacity of the supply chain.
QR Network believes that this focus on the overall supply chain will allow all parties to gain a greater understanding of the dynamics of the system and will highlight where action should be directed in order to improve overall system throughput. This focus should also identify the most efficient enhancements to the system to meet increasing demand. Individual participants are then better able to plan their specific expansion paths to achieve the optimal system capacity and provide the overall best return to all parties.
Similar to previous master plans, this document is expected to provide a basis for stakeholder discussion as to the optimal phased pathway for expansion of the rail infrastructure in each of the four systems comprising the Central Queensland coal region2, as well as the Western system in southern Queensland, to meet future expected growth.
3.4. Objectives and Process
The CRIMP document provides to user groups information about expansion of the rail network within a period of two to five years. It gives broad advice for periods beyond five years.
User groups have been established for each Central Queensland system (Goonyella, Blackwater, Newlands and Moura) with pro-rata voting based on reference tonnes. Port owners and operators, train operators and the QRC are non-voting participants in the relevant user groups.
This document contains:
• Forecast tonnages, as well as port expansions and rail expansion paths to support these tonnages. • For general expansion capital investments expected in the near term, sufficient detail on scope.
standards and costs, reasons for expansion, capacity analysis and volume trigger points. • Information on rail infrastructure renewal investment by category and year.
QR Network recognises the long lead-time associated with delivery of below rail infrastructure. A primary driver of QR Network’s planning is to have required additional below rail network capacity available by the time rail operators require that capacity to transport additional volumes of coal. This needs to be achieved without over investing or investing too early. QR Network also recognises the impact construction work has on current throughput, and through its delivery strategy aims to minimise these impacts.
The master plan provides QR Network’s customers and stakeholders with access to information on network capacity and QR Network’s views of demand, and analysis of capacity expansion options. The process outlined above provides user groups with a forum for direct comment and input, and provides for discussion of non-rail solutions that user group participants may wish to explore. This CRIMP document is also envisaged to be the central framework to facilitate regulatory review of QR Network’s general expansion capital expenditure plans.
2 Newlands, Goonyella, Blackwater and Moura systems

QR Network Pty Ltd
2009 Coal Rail Infrastructure Master Plan
15
3.5. Stakeholders
The key stakeholders of QR Network for the purpose of this master plan are:
• Coal mining companies with operating mines in Queensland. • Coal mining companies with prospective mines in Queensland • Domestic consumers of coal who rely on rail transport services (e.g. Stanwell Power Station,
Gladstone Power Station, Queensland Alumina Ltd). • Rail operators (Pacific National, QR National Coal). • Queensland port owners (Babcock & Brown Infrastructure (DBCT) Management Pty Ltd (BBI), Ports
Corporation of Queensland, Gladstone Ports Corporation, BHP Billiton Mitsubishi Alliance and Port of Brisbane Corporation).
• Queensland port operators (DBCT Management Pty Ltd, Abbot Point Bulk Terminal, Hay Point Services, GPC and Queensland Bulk Handling).
• Queensland Resources Council. • Queensland Government. • Queensland Competition Authority. • Local Government Authorities.
QR Network has consulted stakeholders during the preparation of this master plan and addressed their views where possible. QR Network is committed to ongoing consultation with key stakeholders to ensure that the purpose of the CRIMP is being achieved.
3.6. Previous Coal Rail Infrastructure Master Plans
The CRIMP process was initiated in 2005/ 2006 resulting in the first CRIMP document, the 2006 Coal Rail Infrastructure Master Plan, being published in September 2006. In the following year the Addendum to 2006 Master Plan was published in September 2007.
In October 2008, the 2008Coal Rail Infrastructure Master Plan was published. In concert with the publishing of this document was the issuing of a number of working papers. These supporting working papers were categorised into technical system papers and papers explaining the rationale behind the projects being proposed for endorsement. Specifically these working papers were:
• WP1: The Coal Supply Chain
• WP2: Designing and Managing Capacity on Queensland Coal Rail Systems
• WP3.1: Queensland Coal Rail Systems – Characteristics and Constraints – Northern Bowen Basin
• WP3.2: Queensland Coal Rail Systems – Characteristics and Constraints – Southern Bowen Basin
• WP3.3: Queensland Coal Rail Systems – Characteristics and Constraints – Western System
• WP4.1: Rationale for NBB148CA projects
• WP4.2: Rationale for NBB179 projects
• WP4.3: Rationale for Coal Loss project
• WP4.4: Rationale for SBB76 (UT3) projects
• WP4.5: Rationale for Power Systems Upgrade in the Blackwater System ( Published in March 2009)
All of these documents are available for downloading from the QR Network website at:
http://www.qrnetwork.com.au/networks/coal/coal-infrastructure-master-plan.aspx

QR Network Pty Ltd
2009 Coal Rail Infrastructure Master Plan
16
3.7. Strategic Risk
Section 3.2 highlighted significant forecast growth in Queensland coal exports from 154mtpa in 2010 to 294mtpa in 2020. This level of growth of coal exports presents a number of strategic risks to the supply chain. These are discussed below.
3.7.1. Concentration of Supply Chain
There are currently three major export coal ports servicing central Queensland (Abbot Point, Hay Point and Gladstone), supported by four major rail corridors (Newlands, Goonyella, Blackwater and Moura). The North Coast line from Yukan to Abbot Point is not considered to be a major coal exporting corridor. It does not offer long term economic viability as a coal export route due mainly to the longer haul distance and the fact that it does not traverse new coal fields. In addition, there is a high density of freight and passenger traffic on this corridor upon which coal traffic would have a high impact and significant interaction.
The port facility at Abbot Point is currently expanding from 25 mtpa capacity to 50 mtpa with further potential to expand to beyond 100 mtpa. The port precincts at Gladstone and Hay Point also have potential for significant expansion. Therefore it would appear that total export demand to beyond 2020 can be met by the existing three major port precincts.
This means that the central Queensland coal supply chain will probably remain concentrated on the existing four major rail routes to the three major port precincts for at least the medium term. This leads to strategic risks associated with congestion, route diversity, incremental growth, force majeure events and system interoperability.
A strategic approach to network development can be used to manage these risks, each of which is considered in more detail below.
3.7.2. Congestion Impacts
Currently the Blackwater train operating plan schedules departures from Bluff no closer than 30 minutes apart. The Goonyella train operating plan schedules departures at an interval no closer than 24 minutes from Coppabella. Port expansions could see the demand on the rail system increase such that a train is required every 15 to 20 minutes to service around 8 to 10 unloaders in a port precinct.
This level of traffic density increases the risk of the system becoming congested around the ports with issues including:
• Queuing of out-of-sequence trains awaiting an unloading slot. • Crossing of trains entering and leaving multiple terminals and unloaders. • Train breakdown at a critical location. • Rail infrastructure failure at a critical location. • Different unload rates and total unload time at each unloader. • Limited exit paths from multiple unloaders.
Possible strategic solutions to congestion include:
• Separating rail access to multiple port terminals with their own grade separated entry and exit roads. • Providing redundancy in critical port entry and exit rail infrastructure. • Design the total supply chain around sustainable levels of unloading pit utilisation. • Design the total supply chain to have additional capacity either side of the system constraint in a
demand pull system (cargo assembly with low % of storage at the port): this means ensuring trains are always queuing to unload.
• Develop rail route diversity in conjunction with new port developments (see Route Diversity below). • Balancing growth across the three port precincts (see Incremental Growth below).

QR Network Pty Ltd
2009 Coal Rail Infrastructure Master Plan
17
3.7.3. Route Diversity
As throughput demand increases on each major rail corridor, the track capacity and electric traction capacity (where applicable) can generally be increased to match demand. When a rail corridor is serviced by fully duplicated track future expansion may be able to continue on the existing corridor by adding sections of third and fourth tracks. However strategically it may be a better option at this stage to provide diverse routes by building a new rail corridor instead to meet the expansion demand.
Diverse routes offer the advantages of:
• Potentially reducing congestion impacts at the port precincts by completely separating the supply chain paths to new port developments.
• Reducing the impact of force majeure events (see Force Majeure Events below). • Limiting the impact of a supply chain failure (e.g. major derailment) to one route only. • Possibly providing some latent capacity for peak railings, system recovery after shutdowns or
incidents and diversion of tonnes in the event of supply chain failures.
However it is generally considered environmentally unfriendly to build new transport routes that substantially duplicate existing ones. If it is not environmentally or economically possible to develop diverse routes to each port precinct, at least strategic risk is reduced by balancing growth across the three port precincts.
3.7.4. Incremental Growth
Incremental growth presents a strategic risk because the combination of many small incremental growth decisions based on short term economic analysis may produce a sub optimal supply chain in the long term.
Developing a strategic vision for the future supply chain configuration can reduce this risk by guiding short term decision making towards achievement of a long term goal. This issue is further discussed in Chapter 4 of this document.
3.7.5. Force Majeure Events
Events like natural disasters can have a significant impact on throughput and can affect any or all of mine production, rail haulage and port operations.
In terms of the rail network the following strategies can help reduce the impact of force majeure events;
• Providing some latent capacity so that after an event the system can catch up and still meet annual contract tonnages.
• Providing diverse routes so that the impacts of an event may be limited to only one rail route to a port precinct.
• Provide relatively balanced port and rail capacity expansion across the three major port precincts so that an event affecting a single port precinct does not have a disproportionate affect on throughput.
3.7.6. System Interoperability
As the rail network develops it is beneficial to train operators to be able to operate the same train types anywhere across the network (at or about the same gross tonne kilometre charges). This allows them to invest in trains confident that they will not end up with stranded assets if their future haulage contracts change. This issue needs to be considered when decisions are made about whether to build new corridors in standard, narrow or dual gauge and whether to electrify parts of the network. Also, building and/ or upgrading the rail network to have consistent ruling grades, signalling systems, operating parameters and locomotive and wagon technology would allow trains of the same length and payload to operate seamlessly across multiple systems.

Coal Rail Infrastructure Master PlanChapter 4
Potential Expansion Paths
4

QR Network Pty Ltd
2009 Coal Rail Infrastructure Master Plan
19
4. Potential Expansion Paths 4.1. Coal Supply Chain Throughput Railed
Table 2 below shows the history of coal tonnage railed to the ports from their respective coal systems.
Table 2: Export Port and Rail System Throughput (mtpa)
Export Port Rail System 2005/2006 2006/2007 2007/2008 2008/2009
Gladstone Exports
Blackwater 39.5 43.6 46.4 44.7
Moura 6.3 7.9 8.1 8.2
Ex Goonyella 3.4
RGTCT 40.4 45.0 49.9 52.4
BPCT 5.3 6.5 4.6 3.9
Gladstone Export Totals 45.8 51.5 54.5 56.3
Domestic Blackwater 5.7 5.7 6.0 6.0
Blackwater Totals 45.2 49.5 52.4 50.7
Domestic Moura 3.8 3.8 3.5 3.1
Moura Totals 10.1 11.7 11.6 11.3
Hay Point Exports
Goonyella 82.4 87.8 81.6 83.1
DBCT 50.8 50.6 43.8 47.3
HPSCT 31.6 37.2 37.8 35.8
Hay Point Export Totals 82.4 87.8 81.6 83.1
Abbot Point Exports
Newlands 11.6 11.2 11.7 14.2
via Goonyella / NCL 1.2 0.5
APCT 11.6 11.2 12.9 14.7
Abbot Point Export Totals 11.6 11.2 12.9 14.7
Goonyella Totals 82.4 87.8 82.8 86.5
Newlands Totals 11.6 11.2 11.7 14.2
Brisbane Exports
Western System 4.1 3.8 5.4 6.1
Port of Brisbane 4.1 3.8 5.4 6.1
Brisbane Export Totals 4.1 3.8 5.4 6.1
Domestic Western System 0.5 0.5 0.1 0.0
Western System Totals 4.6 4.3 5.5 6.1
Total QLD Exports 143.9 154.3 154.4 160.2
All Rail Systems Total 153.9 164.3 164.0 169.3

QR Network Pty Ltd
2009 Coal Rail Infrastructure Master Plan
20
4.2. Coal Supply Chain Expansion Potential
Table 3 below shows current coal producer requests for future access to port and rail capacity. Many of these requests are expressions of interest only and there may also be other potential demand that is not yet included in these figures.
Table 3: Industry Capacity Requests
Port Precinct
Current Capacity (mtpa)
Increase by 2020 (mtpa)
New Total by 2020 (mtpa)
Abbot Point 25 61 86
Hay Point 129 99 228
Gladstone 76 149 225
Brisbane 5 10 15
Total 235 319 554
This total of 554 mtpa by 2020 is well in excess of the Wood Mackenzie estimated total export demand for Queensland coal of 294 mtpa as shown in Figure 3 on page 8. The Wood Mackenzie forecast represents an increase of 140 mtpa from a base of 154 mtpa in 2009.
This translates to an average annual market growth of 14 mtpa. This compares with market growth of only 10 mtpa experienced between 2005/06 and 2007/08 during a time of high global demand and price. On this basis the Wood Mackenzie demand estimates would not seem overly conservative, especially considering that the market has softened over the last year.
The capacity requests above represent average annual market growth to 2020 of approximately 33 mtpa. Similarly there are a number of port expansion projects being considered that can provide capacity in excess of 500 mtpa by as early as 2015. This would represent an average annual market growth of 50 - 60 mtpa. The potential port expansions are detailed below.
4.3. Potential Port Capacities
In the 2008 edition of the CRIMP, QR Network identified a range of potential expansion paths for the rail / port supply chain. These expansion paths were qualitatively rated and high level economic modelling was completed to enable some comparison to be made between options.
New ports were being considered for Mackay Harbour and Shoalwater Bay. Mackay Harbour has been ruled out as an option for a new coal terminal due to community sensitivities. Shoalwater Bay has not received required planning approvals and will not be investigated further at this time. The Port of Brisbane provides only relatively limited expansion potential for coal exports from the Western rail system.
This leaves three port precincts on the Queensland eastern seaboard to support major export coal expansion from the Bowen, Surat and Galilee coal basins. These precincts are located at Abbot Point, Hay Point and Gladstone. The map below shows major existing and potential coal export facilities in each precinct.

QR Network Pty Ltd
2009 Coal Rail Infrastructure Master Plan
21
Figure 6: Map of Queensland Coal Export Ports

QR Network Pty Ltd
2009 Coal Rail Infrastructure Master Plan
22
The following table shows the current throughput, current nameplate capacity and potential future capacity of the existing and proposed coal export facilities in each precinct.
Table 4: Port Capacities
Precinct Coal Terminals
2008/09 Throughput
(mtpa)
Nameplate Capacity
June 2009 (mtpa)
Possible Port
Capacity (mtpa)
Potential Port
Capacity (mtpa)
Abbot Point Abbot Point 14.7 25 105 105
Saltwater Creek 1003
Sub Total 14.7 25 105 205
Hay Point Hay Point 35.8 44 75 75
Dalrymple Bay 47.3 85 153 153
Dudgeon Point 100
Sub Total 83.1 129 228 328
Gladstone RG Tanna 52.4 69 75 75
Barney Point 3.9 7 04 0
Wiggins Island 90 90
Balaclava Island 30
Fitzroy River Barging 15
Curtis Island 100
Sub Total 56.3 76 165 310
Brisbane QBH Coal Berth 6.1 10 12 14
Total 160.2 240 510 857
This table demonstrates that potential export coal capacity from the three central Queensland port precincts is more than five times current throughput. This level of port capacity far exceeds long term annual demand forecasts for central Queensland export coal. This indicates that there is no foreseeable need for a fourth coal exporting port precinct on the central Queensland eastern seaboard.
The table also shows that there is some limited expansion capacity at the Port of Brisbane. However this expansion may be limited by the viability of expanding the rail system to cope with the increased tonnages.
3 Nominal port capacities of 100 mtpa have been used for potential new terminals at Saltwater Creek, Dudgeon Point and Curtis Island.
4 Barney Point Coal Terminal is to be closed when the Wiggins Island Coal Terminal is commissioned.

QR Network Pty Ltd
2009 Coal Rail Infrastructure Master Plan
23
4.4. Planning Additional Rail Capacity
The following graph in Figure 7 shows the variation between global demand forecasts, current capacity inquiries and potential port capacity over the next 11 years.
Figure 7: Comparison of Tonnage Forecasts
0
100
200
300
400
500
600
2010 2011 2012 2013 2014 2015 2016 2017 2018 2019 2020
Years
Mtp
a
Global Demand Potential Port Capacity Port Access Inquiries
Figure 7 above shows a wide range of rates at which industry demand for rail capacity could grow over the next decade. The remainder of this chapter will discuss the ways in which the rail system can be expanded to meet even the highest forecast tonnage demands.
In principle QR Network recommends that rail capacity be underwritten and constructed to meet industry demand ahead of underwritten port expansion projects. In this way the impacts of construction of new rail capacity on existing throughput are minimised or eliminated. This also eliminates the undesirable situation of port capacity being available with no rail capacity in place to match.
However the relative timing of delivery of rail capacity to match port capacity will vary depending on
• the size and rate of expansion
• the level of rail construction activity required
• the certainty of the rail and port construction schedules
• the planned ramp up of coal tonnages through the port
Future expansion plans for each rail system will include tonnage trigger points, construction lead times, assessment of construction impacts on throughput and the additional system capacity required in

QR Network Pty Ltd
2009 Coal Rail Infrastructure Master Plan
24
advance to mitigate these impacts. This may result in some latent capacity being designed into the rail system to accommodate future expansions.
This means that underwriting for rail expansion projects needs to occur concurrently with port expansion projects. Also concept, prefeasibility and feasibility studies of rail projects needs to occur early enough to ensure that adequate scope, accuracy of cost estimates and estimates of access pricing can be provided to help support coal producers’ business cases and underwriting requirements.
To achieve this objective in the future QR Network is working very closely with port operators and with industry as a whole to ensure our tonnage forecasts, planning horizons and underwriting processes are aligned.
4.5. Existing Rail Network Capability
QR Network has existing trunk rail corridors accessing each of the three central Queensland port precincts. The existing network is narrow gauge and is currently capable of handling trains up to 10,000 net tonnes travelling at 80km/hr. The current maximum train lengths and net train loads are shown in Table 5. The feasibility of running longer and heavier (2500m and nearly 12,000 net tonnes) trains from the Surat Basin and Blackwater/ Goonyella systems is currently being investigated.
The existing network has been developed over a number of decades and now represents a multi-billion dollar investment. The network capability has been progressively increased by electrification, track duplication, additional crossing loops, crossing loop lengthening, concrete re-sleepering, curve re-alignment and grade easing. This has facilitated the increase of axle loads, train lengths and train speeds to their current levels.
In principle, the major factors affecting the efficiency of a heavy haul rail system are:
• The ruling grade of the track which determines the amount of locomotive power required to haul a given load plus track alignment and grading issues.
• Passing and balloon loop lengths, wagon drawbar strength and available locomotive power. These all affect the maximum length of a train in a system.
• The combination of track gauge, structure gauge (tunnel size, bridge clearance, etc) maximum rolling stock envelope, wagon length and maximum axle load.
• Whether the system is electrified. An electrified system has a lower operating cost (but higher capital cost), higher train speed on ruling grades and reduced locomotive servicing requirements.
• A secondary consideration is the ability of loaded trains to maintain a constant and efficient speed. This can be affected by track alignment, changes of grade and the configuration of signalling, passing loops and crossovers.
A number of initiatives have also been suggested at various times to further improve the efficiency of the central Queensland coal rail network. These include;
• Reducing the ruling grades to allow the running of longer heavier trains, for instance bringing the Blackwater system to the same standard as the Goonyella system by regrading 3 track sections.
• Introducing 30tal locomotives on existing 26.5tal track with higher tractive effort that can haul more payload per locomotive.
• Increasing axle load limits to 30 tonnes on suitable new corridors or lines where track components and formation strength can be designed for the additional loading. This would allow heavier coal wagons to be produced.
• Increasing the maximum train speed for empty coal trains to 100km/hr. • Higher powered electric locomotives (for which the current power systems have not been designed).
These initiatives will be addressed in more detail in future CRIMP releases.

QR Network Pty Ltd
2009 Coal Rail Infrastructure Master Plan
25
The following table compares examples of typical network capabilities:
Table 5: Typical Rail Network Capabilities
Track Gauge (mm)
Axle Load
(tonnes)
Ruling Grade
Max. Train Speed (km/hr)
Max. Train
Length (metres)
Electric Traction
Max. Net
Train Load
(tonnes)
Example
1067 20 1:80 80 1300 No 5000 QR Newlands System
1067 26.5 1:80 80 1700 No 8350 QR Moura System
1067 26.5 1:80 80 2500 No 12000 Proposed SBR / Moura System
1067 26.5 1:86 80 1700 Yes 8350 QR Blackwater System
1067 26.5 1:100 80 2100 Yes 10000 QR Goonyella System
1435 30 1:80 80 No 8400 ARTC Hunter Valley Coal
1067 28 1:160 80 2500 Yes 17000 Spoornet Richards Bay Coal
1435 32 1:300 75 2500 No 30000 Typical Pilbara Heavy Haul
1435 25 75 3000 No 13000 NRG Flinders Power / PN
The above table shows that standard gauge railways generally can support higher axle loads and longer heavier payload trains than narrow gauge railways.
It would be possible to build new standard gauge rail corridors in central Queensland which would have higher operational efficiency than existing corridors. QR Network has existing standard gauge and dual gauge track in south east Queensland between the Port of Brisbane, Acacia Ridge freight terminal and the NSW border. Similarly both rail operators in Queensland operate standard gauge coal trains in NSW. Therefore the existing owners and operators are capable of building and running standard gauge networks.
The existing port precincts are currently serviced by existing narrow gauge rail corridors of substantial length. Therefore it is unlikely that economic and network capacity analysis will support building additional standard gauge rail corridors to these port precincts in the short term. This is because there are substantial benefits in expanding the existing network instead. Incremental tonnage increases only require incremental expansions rather than the construction of a whole new network. In addition, there is the benefit of interoperability of trains across the existing network.
However for new coal hauls of substantial tonnage, e.g. from the Galilee and Surat basins, new standard gauge corridors or standard gauge track on existing corridors from the basins to new standard gauge ports, could have long term strategic and economic benefits.

QR Network Pty Ltd
2009 Coal Rail Infrastructure Master Plan
26
4.6. Rail Corridor Capacity
The capacity of a rail corridor to meet coal demand is determined by the number of usable train paths that can be provided after maintenance and other network unavailability has been considered. This assumes unloading slots at the ports are also available as required to meet the train services. For every loaded train path, an empty train path for the return trip has to be provided as well.
Using current train characteristics on the QR network, network capacity modelling shows that a fully duplicated rail corridor can service around 80 – 100 mtpa of dedicated coal throughput. Once a corridor is duplicated, the maximum throughput is determined chiefly by maintenance requirements and how close together the trains can run. This is known as headway or separation. Trains on the Blackwater system are currently scheduled to run no closer than 30 minutes apart. Following completion of recent projects in the Goonyella system trains are now scheduled at 24 minutes apart.
Maximum throughput of coal on a rail corridor is reduced if the corridor is shared with other rail users like general freight and passenger trains. Each of these trains uses a path that is no longer available for a coal train, e.g. the Blackwater system and the NCL. The variation in train performance and legislation that gives priority to passenger services can further reduce the number of paths effectively available to coal trains.
In general terms, if train separation can be reduced to 15 minutes, each fully duplicated rail corridor to a port precinct will theoretically be able to handle around 160 – 200 mtpa of dedicated coal traffic. Approximately 6 – 8 coal unloaders will be required in each port precinct to meet peak unloading rates. However at this intensity of train operations maintenance becomes problematic. This may result in a need to build infrastructure specifically to support an effective maintenance regime.
If all rail corridors to the three central Queensland port precincts were duplicated and running 15 min train separation, then rail capacity would meet all foreseeable throughput growth and be approximately five times current tonnages. QR Network is able to provide the below rail infrastructure to provide this level of service, however train operators will need to run highly disciplined train operations to consistently operate trains at 15 minute separations.
Until recently QR Network has been increasing the network capacity primarily by building new passing loops and selectively duplicating sections of track. In the Goonyella system we are entering a new phase of expansion where increased capacity will be provided by safely reducing train separation. The recently completed Connor’s Range Re-signalling and Mindi and Bolingbroke feeder stations have allowed train separation in the operational train plan to be reduced from 30 minutes to 24 minutes.
While each system is different, in principle future capacity expansions are likely to be provided for in a number of ways including:
• Decreasing the running time of single line sections by building additional passing loops mid section. • Duplicating track to double the track capacity of critical sections. • Safely reducing train separations with intermediate signalling and other initiatives. • Constructing infrastructure that allows for increased train lengths and/or payloads. • Train operators maximising the payloads hauled on each path by investing in new locomotives and
wagons. • Minimising the impacts on throughput of maintenance and construction activities.
For fully duplicated rail corridors, reducing train separation or increasing train payloads are likely to be some of the most cost efficient incremental capacity expansion approaches. Put simply, reducing train separation increases the number of train paths available (although reducing the time available for maintenance) and increasing the payload increases the tonnage carried per path.

QR Network Pty Ltd
2009 Coal Rail Infrastructure Master Plan
27
4.6.1. Newlands System Capacity
The Newlands system is not currently electrified and provides about 19 mtpa rail capacity (2008/09 throughput was 14.2mtpa) with diesel trains of up to 1300m length and 20 tonne axle load. The Abbot Point Coal Terminal is currently expanding its port capacity to 50 mtpa. To increase the rail capacity to 50 mtpa the Goonyella to Abbot Point Expansion Project (GAP) project is proposing both NML and Newlands system upgrades. This will enable diesel hauled trains of 1,402 metres with 26.5 tonne axle load to use the system. A more detailed listing of the proposed scope of the GAP project is outlined at “6.7.1 Goonyella to Abbot Point Expansion Project” on page 75.
Further expansion including the electrification of this rail system up to 100 mtpa has been considered at a high level. However, additional work on this will only be performed if user demand supports this.
There is potential for a second port facility at Abbot Point located (near APCT) in the Saltwater Creek area. This port has potential capacity of around 100 mtpa bringing the total port capacity to 205 mtpa. If the Newlands system is fully duplicated and train separation is reduced to 15 minutes then the rail system will also have a theoretical capacity of approximately 200 mtpa (with 10,000 tonne trains). Triplication of critical sections of track may be required to address operational and maintenance issues. Also additional expansion projects on the branches and in the yards and loops are not included in this and would be necessary to support this tonnage throughput.
In summary, if the current scope for the GAP project is committed to by users and completed it will increase capacity from 1 mtpa to 50 mtpa. Depending upon rail capacity requests, capacity may be further increased in the future from 50 mtpa to 100 mtpa and then from 100 mtpa to 200 mtpa.
Table 6: Newlands System – Potential Port and Rail Capacity
Precinct Port Potential Port Capacity (mtpa)
Rail System Potential Rail Capacity (mtpa)
Abbot Point Coal Terminal 105 Newlands/GAP Abbot Point
Saltwater Creek Coal Terminal 100 Duplicated 200
Total 205 200

QR Network Pty Ltd
2009 Coal Rail Infrastructure Master Plan
28
4.6.2. Goonyella System Capacity
When the currently endorsed projects for the Goonyella system (Coppabella – Ingsdon duplication and Jilalan yard upgrade) are completed the network capacity will be 129 mtpa in cargo assembly mode. (The throughput for 2008/09 was 87.0 mtpa.) Previously train separation east of Coppabella has been limited to a minimum of 30 minutes by power system constraints. The recent completion of all works associated with the new feeder stations at Mindi and Bolingbroke has removed this restriction.
Minimum train separation is now determined by the longest section which is Hatfield Choke through Black Mountain to the Farm House signal near Yukan (down the Connors Range). The Connors Range Re-signalling project has already reduced the required train separation through this section to approximately 22 minutes. The proposed train operating plan has train services scheduled every 24 minutes which equates to 60 loaded train paths per day.
At 24 minutes of train separation, capacity down the Connors Range is approximately 140 mtpa. If train separation can be reduced further to 15 minutes then capacity will increase to approximately 200 mtpa subject to operating parameters of the supply chain.
Feasibility studies indicate that train separation could be reduced to around 20 minutes by relocating Black Mountain crossover and signals and implementing Electric Pneumatic Control (EPC) braking on all trains for a total cost of around $100M. This will potentially increase capacity to around 160 mtpa. However the power systems capacity will have to be reviewed for any throughput above 140 mtpa and additional power supply may be required.
Further reductions in separation would require additional refuge loops and progressive triplication between Hay Point and Coppabella with intermediate signalling and power systems upgrades. One of the first sections identified for triplication is the Connors Range. This section will remain the rail system constraint to capacity due to having the longest section running time and requiring high levels of maintenance. A Concept study for the range crossing has been completed and the preferred option has been costed as being in the order of $270M. It is expected that a fully triplicated system to Coppabella could handle around 230 mtpa of throughput.
If both the existing ports at Hay Point were upgraded to maximum capacities they would require around 230 mtpa of rail capacity. However if a new port was constructed at Dudgeon Point it is possible that additional rail capacity would be required. Four tracks between Coppabella and Hay Point could be expected to provide around 320 mtpa of throughput on this corridor.
In summary reducing train separation to 24 minutes will increase the rail capacity to 140 mtpa between Coppabella and Jilalan. Capacity can be further increased from 140 mtpa to 160 mtpa by reducing train separation to around 20 minutes down the Connors Range. Further reduction in train separation will require partial or full triplication from Hay Point to Coppabella in order to provide a reliable system that can be maintained and recover from variability. This would provide around 230 mtpa of capacity and would support foreseeable expansion in this port precinct. Alternatively a four track rail corridor from Coppabella to the ports would double this capacity to 320 mtpa. Additional expansion projects on the branches and in the yards and loops are not included in these estimates and would be necessary to support this tonnage throughput.
Table 7: Goonyella System – Potential Port and Rail Capacity
Precinct Port Potential Port Capacity (mtpa)
Rail System Potential Rail Capacity (mtpa)
Hay Point Services Coal Terminal 75 Goonyella
Dalrymple Bay Coal Terminal 153 Triplicated 230 Hay Point
Dudgeon Point Coal Terminal 100 Quadruplicated 320
Total 328 320

QR Network Pty Ltd
2009 Coal Rail Infrastructure Master Plan
29
4.6.3. Blackwater System Capacity
When the currently endorsed projects for the Blackwater system are completed the track will be fully duplicated between Rocklands and Burngrove and the network capacity will be in the order of 85 mtpa. (The throughput for the Blackwater system in 2008/09 was 50.7 mtpa.) This work is currently planned to be completed in 2013, prior to the planned commissioning of the Wiggins Island Coal Export Terminal Stage 1. However delays in the commitment to construct WICET could see these projects planned completion dates delayed.
The track between Aldoga and Rocklands is already duplicated but is shared use between Blackwater system coal traffic and North Coast line freight and passenger services. Train paths are available every 15 minutes on the North Coast line which allows for the mixed type and speed of traffic to be catered for. Every second path in the loaded direction is allocated to coal trains, i.e. a dedicated coal train path is available every 30 mins. The alternate 15 minute paths are available as required for freight, passenger and if required, additional coal services.
The current train operating plan is based on coal services departing Bluff at a 30 minute separation in order to obtain a dedicated coal train path on the North Coast line. This is consistent with the longest sectional running time for diesel hauled coal services of around 25 minutes between Bluff and Rocklands. In other words to reliably schedule train services at a reduced separation would require a reduction in running time for the longest section.
The mix of diesel and electric traction in the Blackwater system creates variability in the operating performance of the system. Generally the use of diesel locomotives reduces the overall capacity of the system. Power systems are planned to be upgraded by the middle of 2013. This will remove current restrictions on the number of electric trains that can operate in the system and remove the requirement to maintain separation between electric trains due to existing power system constraints. When the pinpoint detectors are replaced as the first stage of this project, then new generation AC traction electric locomotives will be allowed to operate in the Blackwater system. This is planned for completion by March 2010.
When the power systems upgrades are completed then the electrical capacity will be around 87 mtpa of electric hauled throughput. A minimum of around 12 mtpa of throughput will remain diesel hauled from Rolleston and Minerva. This means that following the currently planned power systems upgrades and duplications, the power systems will be suitable for a Blackwater system delivering around 100 mtpa of predominantly electric traction hauled coal throughput. However track and train capacity will have to be upgraded to provide this level of throughput as described below.
Once the Blackwater system is fully duplicated the rail system throughput can be significantly improved by increasing the length and/or payload of train services. In some cases this will require associated rail infrastructure works. This approach to increasing capacity may defer the need to triplicate the shared North Coast corridor between Aldoga and Rocklands. Following is the suggested expansion path for the Blackwater system;
• Increase average Blackwater train payloads to 8,000 tonnes. This will involve above rail operator investment in new 106 tonne coal wagons and sufficient locomotive power to haul fully loaded Blackwater length trains. This will increase Blackwater system capacity from 68 mtpa to around 85 mtpa. This increase of 17 mtpa would be able to support the WICET Stage 1 and the closure of BPCT or higher throughputs at RGTCT.
• Construct grade easings / triplications at Tunnel and Westwood. The grade easings would reduce the longest section run time for diesel trains below 20 minutes. This would allow 20 minute train separation between Bluff and Rocklands. This would allow coal trains to utilise additional paths on the shared North Coast line (which are currently not utilised by freight or passenger services). Blackwater system capacity would increase to approximately 100 mtpa.

QR Network Pty Ltd
2009 Coal Rail Infrastructure Master Plan
30
• Construct a grade easing / triplication at Boonal and lengthen balloon loops and passing loops as required to allow Goonyella length electric trains with a 10,000 tonne payload and Surat length diesel trains to operate on the Blackwater system. This would increase Blackwater system capacity to approximately 120 mtpa. However the power systems may need further upgrading depending upon the mix of diesel and electric locomotives in service.
• Triplicate the North Coast line between Aldoga and Rocklands to make additional paths available for coal services. This would allow 15 minute separation between coal services and throughput of around 160 mtpa. The power systems will require upgrading to provide electrical capacity to match this track capacity.
In summary, completion of the 2008 CRIMP endorsed track and endorsed power systems projects will increase Blackwater rail system capacity to around 85 mtpa with the use of 8,000 tonne average payload trains. After this point significant investment in grade easings, further power systems upgrades and triplication between Aldoga and Rocklands will be required to provide up to an additional 75 mtpa of capacity through the Blackwater system. Additional expansion projects on the branches and in the yards and loops are not included in this estimate and would be necessary to support this tonnage throughput.
4.6.4. Moura System Capacity
The Moura system capacity is approximately 17mtpa and has previously hauled about 11.3 mtpa of coal to the Gladstone precinct ports and domestic users. There is minimal freight impact on capacity with a weekly intermodal service to Biloela and seasonal livestock and grain services. In the future the Moura system may be required to haul over 80 mtpa of coal from mines in the Moura, Monto and Surat areas. The bulk of this expansion is expected to be through the Surat area.
To haul these tonnages the bulk of the Moura system would require some duplication, loop extensions, new passing loops and formation strengthening. Commercial negotiations have commenced between QR Network and coal producers to fund these works.
In summary the Moura system is capable of being expanded by the upgrading of tracks to handle the increase in tonnage being driven predominantly by Surat Basin coal mines. Potential then exists to reduce headways which would further increase capacity, however this has not been considered in detail.
When the Moura and Blackwater potential system capacities are combined, the total rail capacity to the Gladstone port precinct will exceed 240 mtpa. This exceeds the combined port capacity of RGTCT and the planned WICET which is 165 mtpa. There are other port options under consideration that could utilise this potential rail capacity (refer to Table 8 below).
Table 8: Blackwater & Moura Systems – Potential Port and Rail Capacity
Precinct Port Potential Port
Capacity (mtpa)
Rail System Potential Rail Capacity (mtpa)
RG Tanna Coal Terminal 75 Blackwater 160
Wiggins Island Coal Terminal 90 Moura 85
Balaclava Island Coal Terminal 30
Fitzroy River Barging 15
Gladstone
Curtis Island Coal Terminal 100
Total 310 245

QR Network Pty Ltd
2009 Coal Rail Infrastructure Master Plan
31
4.6.5. Surat Basin Rail
There are significant coal resources in the West Moreton and Surat Basins west of Brisbane. Currently there exists a limited rail and port capacity to export coal from the West Moreton deposits. Construction of a railway between Wandoan and the existing Moura system together with upgrading of the existing railways and expansion of the Port of Gladstone has been identified as the most viable option to enable the future development of the Surat Basin coal fields. This proposal was previously known as the Southern Missing Link but is now referred to as the SBR project.
The Queensland Government has announced the formation of a consortium currently consisting of ATEC (Dawson Valley Railway) Pty Ltd, Xstrata Coal Surat Basin Rail Pty Ltd and QR Surat Basin Pty Ltd. The consortium is currently investigating the feasibility of development of the Surat Basin Rail and delivery of the project on a commercial basis in a time frame to suit industry demand.
As described above, QR Network is investigating the expansion path required on the Moura system to support around 80 mtpa of export coal via the Surat Basin Rail.
4.6.6. Galilee Basin
The Galilee Basin in central Queensland represents a vast untapped source of predominantly thermal coal (estimated at around 10 billion tonnes). Current activity in the basin by prospective coal producers could see ultimate railings of coal to port of around 100 to 130 mtpa.
Initial Advice Statements and other public information about these projects indicate that the most favoured possible export ports are Abbot Point Coal Terminal (APCT) and/ or a new coal terminal at Dudgeon Point just north of the current Hay Point port precinct.
For the APCT option another coal terminal together with a multi cargo facility could be constructed to increase port capacity to over 200 mtpa. Rail options to support this include a new standard gauge rail corridor from the mines to the port or a new narrow gauge line joining the current QR Network system near the present Blair Athol mine. The rail network between Blair Athol, Wotonga and Abbot Point would need upgrading to meet the tonnage demand.
The initial tonnage demand from the Galilee Basin is likely to be around 60 to 70 mtpa. This could be handled on the existing QR rail system by upgrading from Blair Athol to the junction with the NML and completing the GAP project to 100 mtpa capacity. Alternatively 70 mtpa of extra capacity could be provided on the Goonyella system to rail to an expanded DBCT or a new port facility at Dudgeon Point.
The prospective coal producers for the Galilee Basin have had their respective projects declared as “significant projects” by the Coordinator-General for which environmental impact statements (EIS) are required. It will not be until these EIS’s are finalised that more details as to the intended rail corridor(s), the export coal terminal, the type of rolling stock to be used etc will be known. Preliminary estimates of the date for commissioning of these new mine - rail - port supply chain systems is not before mid 2013.

QR Network Pty Ltd
2009 Coal Rail Infrastructure Master Plan
32
4.7. Methods for Assessing Corridor Expansion Options
There are different methods that may be used to evaluate expansion options. These include consideration of capital costs, operating costs, total costs and related risks (for example cost risk, demand risk and market risk5).
QR Network will seek to present for each new corridor option the related risks and capital and operating costs for users and other stakeholders. A methodology has been developed in consultation with users for considering the average incremental economic cost of a particular corridor development. This is called the “Incremental Economic Cost Model”, and is a relatively simple method for considering total costs to users for a given option, providing a cost curve for a given level of additional demand.
An overview of how this model works is presented below.
Figure 8: Incremental Economic Cost Model
X X X X X
/ / /
INCREMENTAL ECONOMIC COST MODEL
TRAIN COST TRACK COST
Operating cost($ / tonne km)
PORT COST
Capex ($M)Incremental
operating cost ($/ tonne km)
Capex ($M) Operating cost($ / tonne)
Capex ($M)
Average Haul Distance (km)
WACC & Depreciation %
Average Haul Distance (km)
WACC & Depreciation %
WACC & Depreciation %
ECONOMIC COST ($/ TONNE)
Incremental Tonnes
Incremental Tonnes
Incremental Tonnes
The incremental economic cost curve for each rail-port corridor option considered is included in sections 4.7.1 to 4.7.3 below. The assumptions underlying each cost curve are detailed in each section.
There are also other considerations that may lead to one or other corridor development appearing to be more attractive to individual users or wider stakeholders. These considerations include among others:
• Time required for each corridor to be commissioned (users may favour corridors providing their capacity requirements at the desired time).
• Overall objective of achieving the shortest average haul distance for central Queensland mines. • Potential to defer expensive green field developments. • Perception of risk over sustainability of supply chain performance. • Consumer views on security of supply (preferences for cross-system traffic options for risk
management).
5 For example the long term profitability of individual markets such as coking coal, thermal coal, PCI coal

QR Network Pty Ltd
2009 Coal Rail Infrastructure Master Plan
33
• Source of long term demand growth. • Environmental concerns relating to some Greenfield developments. • Shipping costs (from port to final destination) including demurrage charges.
For each rail-port corridor option, a qualitative assessment of these factors is provided to assist in the overall understanding of the merit of the particular expansion option.
4.7.1. Goonyella to APCT (GAP)
4.7.1.1 Background
The Northern Missing Link (NML) rail line would connect the Goonyella system with the Newlands system. This potential corridor is an option for capacity expansion for the Goonyella system mines. The rail line would join the Goonyella system near North Goonyella mine and the Newlands system near Newlands mine. The broad scope for GAP project covers upgrade works on the Newlands system, together with the construction of the green field NML as well as upgrade works in the northern corridors of the Goonyella system.
4.7.1.2 Economic Assessment
The Northern Missing link project (now called the Goonyella to Abbot Point expansion project [GAP]) was originally expected to be constructed in a number of stages over a 15 to 20 year period. However based on expressions of interest in additional capacity at APCT potentially increasing to 50mtpa, a much quicker take up of volume has been planned. Below rail capital estimates have accordingly been set at expenditure to around an overall amount $1.0 billion to $1.2 billion for the 50 mtpa. The estimated capital cost at APCT to lift capacity to 50mtpa is a further $913million. This is a relatively expensive initial investment, and represents the step function inherent in development of new corridors.
The rail infrastructure and APCT facility could be expanded further to meet future demand growth, with later expansion being less expensive on a mtpa basis.
Detailed cost and price data is currently the subject of negotiations with potential users of the GAP project and because of this an incremental economic cost curve cannot be shown.
A qualitative assessment of other factors that need to be taken into account is shown in Table 9 below and summarises the merit of this potential expansion.
Table 9: Merit of Potential Expansion Option – Goonyella to APCT
Factor Qualitative Score for
this Option
Comment
Ultimate Throughput Capability (mtpa) ●
Ultimate throughput capability deemed quite high, supported by potential expansion of APCT to 100mtpa, and supporting rail network
Approximate Economic Cost ($/t) ●
Economic cost for the supply chain is expected to be higher than other alternatives for the Goonyella system tonnes.

QR Network Pty Ltd
2009 Coal Rail Infrastructure Master Plan
34
Factor Qualitative Score for
this Option
Comment
Potential Earliest Time to Commissioning ●
Land acquisition almost complete; Concept and Prefeasibility stages complete. Once user endorsement is agreed this expansion option to 50 mtpa has the potential to be delivered by mid 2012.
Achieving objective of shortest average haul distance for CQ mines ●
For mines in the North Goonyella cluster in particular, haul distance is only 25 to 40km greater than to DBCT/HPSCT. Coal from this region, if railed to APCT, has the potential to free up capacity at DBCT/HPSCT, to be replaced by coal from mines in the South Goonyella corridor currently being hauled to a much further Gladstone.
Relative Reduction in Supply Risk to Export Markets
●
New corridor, with relatively lower traffic reduces overall supply chain operational risk.
Sources of long term demand ●
Although the catchment area for the corridor comprises of mainly coking coal mines there is an asset stranding risk for this project.
Relative Environmental Concerns ●
No major adverse environmental issues are contemplated for this corridor expansion.
Relative Shipping Costs
(port to end customer including demurrage, $/t)
●
Shipping costs expected to be in line with other major coal export ports in Queensland
4.7.2. Expansion of DBCT Beyond 85 mtpa
4.7.2.1 Background
The Goonyella system main line’s capacity will be lifted from about 92 mtpa from August 2009 to about 129 mtpa with the commissioning of the upgraded Jilalan yard. Hay Point port precinct access enquiries have been identified to about 228 mtpa in the future. This expansion deals with DBCT’s expansion in tonnage capacity from 85 mtpa to 153 mtpa.
4.7.2.2 Economic Assessment
Following the significant enhancement of DBCT infrastructure in June 2009, nameplate capacity of DBCT has increased to 85 mtpa. DBCT Management Pty Ltd has received access requests beyond this capacity to 153 mtpa. Consultants have been engaged to investigate possible expansion options for the

QR Network Pty Ltd
2009 Coal Rail Infrastructure Master Plan
35
terminal to this capacity volume including the optional fourth and fifth unloading facilities. Estimated cost to take volumes to this new level is $4.680 billion6.
Rail infrastructure expansion to facilitate this increase in coal throughput railings through DBCT is expected to cost in the vicinity of $2.1 billion, comprising additional passing loops and/or intermediate signalling on single line sections as well as additional rail infrastructure in the Jilalan to ports area. Additional trains are assumed to be required for each additional 4mt in the system. Incremental operating costs for the ports, rail infrastructure and rail operations are also estimated and included.
The graph below (Figure 9) presents the average incremental economic cost of this Brownfield DBCT expansion option for the Goonyella system as a cost curve.
Figure 9: DBCT Brownfield Expansion Incremental Economic Cost
5
10
15
20
25
30
35
40
5 10 15 20 25 30 35 40 45 50 55 60 65Incremental Tonnes (millions)
Econ
omic
Cos
t ($/
tonn
e)
DBCT - 85 mtpa to 153 mtpa
Table 10 below summarises the merit of this potential expansion, including a qualitative assessment of other factors (in addition to the economic cost to the supply chain) that need to be taken into account.
6 Cost estimates were provided by a DBCT Management presentation in July 2009.

QR Network Pty Ltd
2009 Coal Rail Infrastructure Master Plan
36
Table 10: Merit of Potential Expansion Option – DBCT greater than 85 mtpa
Factor Qualitative Score for
this Option
Comment
Ultimate Throughput Capability (mtpa) ●
Ultimate throughput capability may be limited through limits down the Connors Range as well as limits to physical expansion of DBCT terminal
Approximate Economic Cost ($/t) ●
Economic cost for the supply chain in the vicinity of: o $18 / tonne for incremental volume of 26mtpa o $12-$13 / tonne for incremental volume of 68
mtpa
Potential Earliest Time to Commissioning
●
Planning timeframe expected to be quite lengthy as this involves a significant expansion of the coal terminal. In addition, the requirements to operate the number of trains down the Connors Range need to be fully assessed, and the introduction of ECP braking (if required) will take some time to implement.
Achieving objective of shortest average haul distance for CQ mines ●
Shortest distance for Goonyella system coal is to DBCT/HPSCT. Current average haul distance is 221km, and this option will ensure average haul distance remains low.
Relative Reduction in Supply Risk to Export Markets
●
Increased traffic on a heavily trafficked corridor, in particular down the Connors Range increases operational risk. In addition, high volume export terminals increases risk of adverse weather impacting on port operations.
Sources of long term demand ●
Market risk is mitigated by the fact the catchment area for this export terminal comprises mainly coking coal mines.
Relative Environmental Concerns ●
Some environmental issues may need to be addressed, particularly relating to close proximity to Louisa Creek township, and potential for increased dust and noise issues.
Relative Shipping Costs
(port to end customer including demurrage, $/t)
●
Shipping costs expected to be in line with other major coal export ports in Queensland

QR Network Pty Ltd
2009 Coal Rail Infrastructure Master Plan
37
4.7.3. Galilee Basin to APCT
4.7.3.1 Background
The rail corridor to be used to move coal being produced from the opening up of the Galilee Basin coal reserves in Central Queensland north of the town of Alpha has not been confirmed at present. One option is to rail coal via a new green field rail corridor across country approximately 120 kilometres to join onto the South Western Goonyella corridor near the Blair Athol mine. From here coal can be railed northwards via the NML to APCT using the current and proposed QR Network rail system. Upgrading of QR Network rail would allow staging of costs to match tonnage ramp up and therefore offer an alternative to a standalone railway. This option is considered below.
4.7.3.2 Economic Assessment
This expansion path has only been costed to a very early stage to assess the technical feasibility to assess the likely supply chain incremental cost of expanding the Central Queensland Coal region through development of the Galilee Basin. Further work needs to be done to test the economies. As such caution needs to be applied to directly compare this option with other options which have been costed to greater accuracy. Goonyella size trains have been used for the track and train data with port data being based on the GAP port amounts. Refer to Figure 10 below.
Figure 10: New Corridor from Galilee Basin to APCT Incremental Economic Cost
5
10
15
20
25
30
35
40
5 10 15 20 25 30 35 40 45 50 55 60Incremental Tonnes (millions)
Econ
omic
Cos
t ($/
tonn
e)
Galilee Basin to Blair Athol to APCT - 0 mtpa to 60 mtpa
Table 11 below provides a qualitative assessment of factors that need to be taken into account in considering the merit of this potential expansion.

QR Network Pty Ltd
2009 Coal Rail Infrastructure Master Plan
38
Table 11: Merit of Potential Expansion Option – Galilee Basin to APCT
Factor Qualitative Score for
this Option
Comment
Ultimate Throughput Capability (mtpa) ●
Ultimate throughput capability deemed quite high, supported by potential expansion of APCT to 100mtpa, and supporting rail network
Approximate Economic Cost ($/t)
●
Economic cost for the supply chain at the 60 mtpa level is about $18 - $19 / tonne.
Potential Earliest Time to Commissioning ●
Planning timeframe expected to be quite lengthy as this involves green field rail construction. This option has the potential to be delivered 2012-2014.
Achieving objective of shortest average haul distance for CQ mines ●
This is a considerably long haul of approximately 400 kilometres from the load out to APCT however it represents the best option for the Galilee location.
Relative Reduction in Supply Risk to Export Markets
●
New corridor spreads the operational risk for the supply of exported Queensland coal.
Sources of long term demand ●
Galilee Basin contains significant deposits of thermal and PCI coal.
Relative Environmental Concerns ●
Environmental issues may not be very significant given that the main infrastructure requirements are to be built in sparsely populated rural areas.
Relative Shipping Costs
(port to end customer including demurrage, $/t)
●
Shipping costs expected to be in line with other major coal export ports in Queensland

QR Network Pty Ltd
2009 Coal Rail Infrastructure Master Plan
39
4.7.4. Other Expansion Paths
Expansion paths that are at very early stages of Concept or Prefeasibility are also mentioned below. Due to the lack of meaningful cost data these possible options are not depicted. However a narrative of their description is provided. When further advancement in their stages of growth is progressed and cost data is available then these options will be depicted graphically.
4.7.4.1 Greenfield Expansion of Dudgeon Point
This option involves the development of a new export terminal at Dudgeon Point, just north of the existing terminal of DBCT and HPSCT. Dudgeon Point has more than 850 hectares that is suitable for development for industry or an export port.
4.7.4.2 Southern Missing Link via Wiggins Island
Coal from the western Darling Downs is currently exported through the Port of Brisbane. There are significant coal reserves with development potential in the Surat Basin region. There are limitations with the rail system’s ability to provide sufficient paths down the Toowoomba Range and through the Brisbane suburban area plus port capacity restrictions associated with the operation of large volumes of coal and associated shipping. Construction of a railway between Wandoan and the existing Moura system (Southern Missing Link, or more recently referred to as the Surat Basin Railway) together with upgrading of the existing railways and expansion of the Port of Gladstone has been identified as the most likely option to enable the future development of the Surat Basin coal fields.
4.7.4.3 Fitzroy River Barging Operation
A proposal involving exporting coal by barging it along the Fitzroy River from near Rockhampton is currently under investigation. The concept envisages the transportation of coal via rail from the Blackwater and Moura systems to a new balloon loop with associated holding tracks to be located adjacent to the North Coast Line (NCL) in the Bajool area approximately 30 kilometres south of Rockhampton. Unloading of coal via a conventional under-track coal unloader (dump station) is proposed. This will then be transferred directly onto barge via a conveyor. Use of intermediate stockpiles may be necessary. Barges are proposed to operate along the Fitzroy River and around the Port Alma area to transport coal to a transfer barge then into ships positioned off the coast.
The proposed capacity of the facility is 15Mtpa. A commissioning date will be determined as studies are progressed. The project is still considering various options.
4.7.4.4 Balaclava Island Coal Export Terminal
This is a new proposal that has only reached Initial Advice Statement stage. The proposal is for a coal terminal on Balaclava Island which is at the mouth of the Fitzroy River and the Raglan Creek estuaries, south of Rockhampton. It is possible that an EIS may be lodged by 2011.
Due to the nature of the timing and the operation mode sufficient cost details are not available to provide an economic assessment.
4.7.5. Conclusion
4.7.5.1 Economic Assessment
Several rail-port corridor expansion options have been considered above. Some of these may be considered as alternatives to the others, whilst others provide expansion options for specific geographic regions.
The economic cost assessment does not equate with a commercial cost per tonne for users. The actual costs per tonne that would be charged to users under each corridor option will be a function of the following:

QR Network Pty Ltd
2009 Coal Rail Infrastructure Master Plan
40
• The pricing methodology in place.
• Pre-existing volumes on the corridor (on the rail infrastructure and at the port).
• The level of take up of available capacity (where a corridor’s capacity is under-utilised the cost per unit
will rise).
These factors mean that, while this CRIMP document is able to indicate a preferred corridor development option this may not translate into being the most commercially attractive option for individual users seeking to expand their business. This may or may not be considered to be a problem for the Queensland coal supply chain stakeholders to address. The below rail pricing methodology adopted is expected to contribute to the selection of the most preferred corridor development. Such considerations are outside the scope of this document.
4.7.5.2 Relative Merits of Potential Expansion Options
Table 12 below summarises the relative merits of the various expansion options detailed in this chapter, and may provide customers with an improved basis for determining the preferred expansion option for the Central Queensland coal regions.
Table 12: Relative Merits of Potential Expansion Options
Option Ultimate Throughput Capability
(mtpa)
Approx. Economic
Cost ($/t)
Potential Earliest Time to Execute
Achieving objective
of shortest average
haul distance for CQ mines
Relative Reduction in Supply Risk to Export
Markets
Sources of long term
demand
Relative Environ-mental
Concerns
Relative Shipping
Costs (port to
end customer including demurrag
e, $/t)
Goonyella – APCT ● ● ● ● ● ● ● ●
DBCT expansion beyond 85 mtpa
● ● ● ● ● ● ● ●
Greenfield development of Dudgeon Point ● ● ● ● ● ● ● ●
Southern Missing Link via WICET ● ● ● ● ● ● ● ●
Fitzroy River Barge Operation ● ● ● ● ● ● ● ●

QR Network Pty Ltd
2009 Coal Rail Infrastructure Master Plan
41
Option Ultimate Throughput Capability
(mtpa)
Approx. Economic
Cost ($/t)
Potential Earliest Time to Execute
Achieving objective
of shortest average
haul distance for CQ mines
Relative Reduction in Supply Risk to Export
Markets
Sources of long term
demand
Relative Environ-mental
Concerns
Relative Shipping
Costs (port to
end customer including demurrag
e, $/t)
Galilee Basin to APCT ● ● ● ● ● ● ● ● Balaclava Island (Port Alma)
● ● ● ● ● ● ● ●
As can be seen from Table 12 the Goonyella to APCT corridor development option is considered one of the more favourable options for the Northern Bowen Basin.

Coal Rail Infrastructure Master PlanChapter 5
Southern Bowen Basin Expansion
5

QR Network Pty Ltd
2009 Coal Rail Infrastructure Master Plan
43
5. Southern Bowen Basin Expansion 5.1 Introduction
The Southern Bowen Basin comprises the Blackwater and Moura systems.
The Blackwater system services the coal mines of Central Queensland and carries product to Stanwell Power Station, Gladstone Power Station, Fisherman’s Landing and the Port of Gladstone (RGTCT and BPCT). The Blackwater system is shown in Figure 11 below.
Figure 11: Blackwater System Rail Network

QR Network Pty Ltd
2009 Coal Rail Infrastructure Master Plan
44
The Moura system services the coal mines of Dawson, Baralaba, Boundary Hill and Callide. Coal is transported to Gladstone Power Station, Comalco Aluminium Refinery, Queensland Alumina Limited (QAL) and the Port of Gladstone. The route is a single line with passing loops which have been extended to allow ‘Blackwater size’ trains to operate in this system. A view of the Moura rail network is provided in Figure 12 below.
Figure 12: Moura System Rail Network

QR Network Pty Ltd
2009 Coal Rail Infrastructure Master Plan
45
5.2 Update on Previous / Committed Projects and Forecast Capacity
Details of projects that have been previously undertaken together with committed projects are listed below. The projects have been grouped into categories that relate specifically to the port expansions.
Forecast capacity charts are also depicted in the following, based on the coal rail systems.
5.2.1 Gladstone
Figure 13 below refers to the status of previously constructed rail infrastructure.

QR Network Pty Ltd
2009 Coal Rail Infrastructure Master Plan
46
Figure 13: Gladstone Ports Rail Expansion Projects
Cos
t($
M)
Q1
Q2
Q3
Q4
Q1
Q2
Q3
Q4
Q1
Q2
Q3
Q4
Q1
Q2
Q3
Q4
Q1
Q2
Q3
Q4
Wal
laro
o to
Try
phin
ia to
Din
go D
uplic
atio
n34
.8$
Win
dah
to G
rant
leig
h D
uplic
atio
n25
.9$
Blu
ff to
Bla
ckw
ater
Dup
licat
ion
54.0
$
Yan
Yan
Pass
ing
Loop
11.3
$
Aro
ona
to D
uarin
ga D
uplic
atio
n31
.0$
Bla
ckw
ater
to B
urng
rove
Dup
licat
ion
37.8
$
Wyc
arba
h to
Wes
twoo
d D
uplic
atio
n25
.9$
Sta
nwel
l to
Wyc
arba
h D
uplic
atio
n71
.5$
Gra
ntle
igh
to T
unne
l Dup
licat
ion
49.0
$
Rep
lace
men
t of p
inpo
int d
etec
tors
for A
C tr
actio
n lo
com
otiv
es6.
9$
Filte
rs a
nd c
ompe
nsat
ors
for A
C tr
actio
n lo
com
otiv
es
TBC
Pow
er S
yste
m S
treng
then
ing
at R
anga
l0.
4$
Roc
klan
ds to
Kab
ra D
uplic
atio
n66
.0$
Pow
er S
yste
m S
treng
then
ing
at R
agla
n Su
bsta
tion
35.0
$
New
Fee
der S
tatio
n at
Wyc
arba
h47
.5$
New
Fee
der S
tatio
n at
Dua
ringa
47.5
$
New
Fee
der S
tatio
n at
Blu
ff45
.5$
Mou
ra P
assi
ng L
oop
Exte
nsio
ns22
.4$
RG
Tan
na C
oal T
erm
inal
Loo
ps16
.3$
Cal
lem
onda
h to
RG
Tan
na C
oal T
erm
inal
3rd
Spu
r & E
xt.
of N
o. 2
Arr
ival
Rd.
40.5
$ 66
9.2
$
($29
.1M
/ m
tpa)
Gla
dsto
ne E
xpan
sion
Tot
al
Coa
l Rai
l Inf
rast
ruct
ure
Prog
ress
Rep
ort
Gla
dsto
ne E
xpan
sion
53
to 7
6 m
tpa
Expo
rt
Bla
ckw
ater
Sys
tem
Mou
ra S
yste
m
2008
/09
2012
/13
Gla
dsto
ne L
ocal
Are
a Sy
stem
(Cal
lem
onda
h)
2009
/10
2010
/11
2011
/12
Com
plet
ed M
ay 0
6
Com
plet
ed A
ug 0
5
May
09
Jun
10
Sep
09
Feb
13
Mar
09
Jan
11
Jun
10
Aug
08
Com
plet
ed J
un 0
7
Com
plet
ed D
ec 0
7
Com
plet
ed S
ep 0
7
Com
plet
ed O
ct 0
7
Com
plet
ed N
ov 0
6
Com
plet
ed J
un 0
7
Mar
13
Mar
10
Mar
10
Apr
13
May
13

QR Network Pty Ltd
2009 Coal Rail Infrastructure Master Plan
47
Figure 14, Figure 15 and Figure 16 below show possible forecast tonnage capacity for the Blackwater and Moura systems and Gladstone port.
Figure 14: Blackwater System Forecast Export Capacity
Blac
kwat
er S
yste
m e
xpor
t cap
acity
050100
150
2005
/2006
2006
/2007
2007
/2008
2008
/2009 Sep-09 Dec-09 Mar-10 Ju
n-10 Sep
-10 Dec-10 Mar-11 Ju
n-11 Sep
-11 Dec-11 Mar-12 Ju
n-12 Sep
-12 Dec-12 Mar-13 Ju
n-13 Sep
-13 Dec-13 Mar-14 Ju
n-14 Sep
-14 Dec-14 Mar-15 Ju
n-15 Sep
-15 Dec-15 Mar-16 Ju
n-16 Sep
-16 Dec-16 Mar-17
System throughput (mtpa)
Port
com
mitt
ed
Port
prop
osed
Belo
w R
ail c
omm
itted
Belo
w Ra
il pro
pose
dDo
mes
tic &
Exp
ort C
apac
ityAc
tual
Ton
nes
Rock
land
s-Ka
bra
Dupl
icat
ion
Kabr
a-St
anwe
ll Du
plic
atio
n
SBB1
00
SBB1
65
Gra
ntle
igh-
Tunn
el
Dup
licat
ion
Wal
ton-
Bluf
f D
uplic
atio
n
*WIC
T 25
mtp
a *W
ICT
70 m
tpa *W
ICT
90
mtp
a
* WIC
T ne
w c
apac
ity is
sha
red
betw
een
Blac
kwat
er a
nd M
oura
rail s
yste
ms
Ding
o-W
alto
n Du
plic
atio
n

QR Network Pty Ltd
2009 Coal Rail Infrastructure Master Plan
48
Figure 15: Moura System Forecast Export Capacity M
oura
Sys
tem
exp
ort c
apac
ity
020406080100
2005
/2006
2006
/2007 20
07/20
0820
08/20
09 Sep-09 Dec-09 Mar-10 Ju
n-10 Sep
-10 Dec-10 Mar-11 Ju
n-11 Sep
-11 Dec-11 Mar-12 Ju
n-12 Sep
-12 Dec-12 Mar-13 Ju
n-13 Sep
-13 Dec-13 Mar-14 Ju
n-14 Sep
-14 Dec-14 Mar-15 Ju
n-15 Sep
-15 Dec-15 Mar-16 Ju
n-16 Sep
-16 Dec-16 Mar-17
System throughput (mtpa)
Port
com
mitt
ed
Port
prop
osed
Bel
owR
ail c
omm
itted
Belo
w R
ail p
ropo
sed
Dom
estic
& E
xpor
t Cap
acity
Actu
al T
onne
s
SB
B10
0
SB
B16
5
Loop
ext
ensi
ons
*WIC
T 50
mtp
a
*WIC
T 70
mtp
a
* WIC
T ne
w c
apac
ity is
sha
red
betw
een
Blac
kwat
er a
nd M
oura
rail
syst
ems
*WIC
T 90
mtp
a

QR Network Pty Ltd
2009 Coal Rail Infrastructure Master Plan
49
Figure 16: Gladstone Port and Rail Export Capacity G
lads
tone
Por
t and
Rai
l exp
ort c
apac
ity
050100
150
200
2005
/2006
2006
/2007
2007
/2008
2008
/2009 Sep-09 Dec-09 Mar-10 Ju
n-10 Sep
-10 Dec-10 Mar-11 Ju
n-11 Sep
-11 Dec-11 Mar-12 Ju
n-12 Sep
-12 Dec-12 Mar-13 Ju
n-13 Sep
-13 Dec-13 Mar-14 Ju
n-14 Sep
-14 Dec-14 Mar-15 Ju
n-15 Sep
-15 Dec-15 Mar-16 Ju
n-16 Sep
-16 Dec-16 Mar-17
System throughput (mtpa)
Port
com
mitt
edPo
rt pr
opos
edBe
low
Rai
l com
mitt
edBe
low
Rai
l pro
pose
dAc
tual
Ton
nes
SB
B10
0
SB
B76
SB
B165
RG
Tann
a 69
mtp
a B
PC
T 7
mtp
a
RG
Tann
a 75
mtp
a
WIC
T 25
mtp
a B
PC
T 0
MTP
A
WIC
T 50
mtp
a W
ICT
70 m
tpa
WIC
T 90
mtp
a

QR Network Pty Ltd
2009 Coal Rail Infrastructure Master Plan
50
5.2.2 Wiggins Island Coal Export Terminal
Figure 17 below refers to the status of previously constructed rail infrastructure.
Figure 17: WICET Rail Expansion Projects
Cost
($M)
Q1Q2
Q3Q4
Q1Q2
Q3Q4
Q1Q2
Q3Q4
Q1Q2
Q3Q4
Q1Q2
Q3Q4
22.0
$ 46
.0$
62.3
$ 41
.4$
90.0
$ 26
1.7$
Wigg
ins Is
land E
xpan
sion T
otal
Wigg
ins Is
land C
oal T
ermina
l Rail
Infra
struc
ture P
relim
inary
Early
Work
s
Wigg
ins Is
land C
oal T
ermina
l Rail
Infra
struc
ture E
arly W
orks
Kabra
to S
tanwe
ll Dup
licati
on
Ding
o to W
alton
Dup
licati
on
Walt
on to
Bluf
f Dup
licati
on
Blac
kwate
r Sys
tem
2012
/13
Coal
Rail I
nfras
tructu
re Pr
ogres
s Rep
ort
Wigg
ins Is
land E
xpan
sion t
o 25 m
tpa Ex
port
Glad
stone
Loca
l Area
Syste
m
2008
/0920
09/10
2010
/1120
11/12
Feb1
0
Feb 1
0
Apr 1
1
Oct 1
1
Jun 1
2

QR Network Pty Ltd
2009 Coal Rail Infrastructure Master Plan
51
Long term demand growth in the Gladstone catchment area is planned to be met by the proposed new Wiggins Island Coal Export Terminal (WICET). A consortium of mining companies has been established to develop the Wiggins Island Coal Export Terminal. The WICET consortium has entered into negotiations with Gladstone Ports Corporation (GPC) to develop the facility. The GPC will operate the port, including unloaders. Export coal sources and tonnages have not been finalised, but the latest information available is that both QR and WICET expect to know firm tonnage information by the end of 2009, 6 months prior to the targeted Project Sanction Date of 30 June 2010. The targeted commissioning date for WICET is mid 2013. The majority of the overall demand for WICET appears to be sourced from the Moura system and more specifically from the Surat Basin.
The WICET is being planned with the long term in mind. The terminal could eventually be a terminal for up to 90mtpa of export coal traffic, and the planning for this terminal requires long term planning for the related rail infrastructure.
The Callemondah yard cannot support any major increases in traffic beyond future committed levels for RGTCT, BPCT and Gladstone Power Station. Consequently a new yard is required for provisioning, maintaining and marshalling services to WICET.
QR Network has conducted a feasibility study on the rail infrastructure requirement for WICET. Figure 18 below presents the existing Gladstone area rail infrastructure in yellow, together with the proposed new rail infrastructure supporting WICET in red.
Figure 18: Moura System Rail Network
The current proposed scope for the rail infrastructure is to have WICET coal traffic from the Moura system progress along the existing line to near Stirrat and then traverse in the northern direction through the new Moura link connecting to the North Coast Line near Mt Larcom and Aldoga. It is then to utilise dedicated WICET line tracks to the unloaders at the balloon loops proposed to be located on the southern side of the North Coast Line at Mt Miller just north of Gladstone. Coal is then to be unloaded and transported along conveyors to the stockpile area within the new coal terminal at Golding Point at the mouth of the Calliope River.

QR Network Pty Ltd
2009 Coal Rail Infrastructure Master Plan
52
QR Network, though requiring a shorter lead time than the port for commissioning of rail infrastructure, will align its programme to that of the WICET construction.
To date the Feasibility Study is being conducted in two separable portions. The first part deals with Wiggins Island Coal Terminal which includes the coal terminal and the unloading balloon loops. The second part includes the Moura Link – Aldoga Yard (MLAY) which includes the quadruplication of the North Coast Line between WICET and Aldoga, New Moura Link connecting Aldoga to the Moura Short Line and the Aldoga Yard provisioning and maintenance yard.
The Environmental Impact Statement (EIS) for the WICET Balloon Loop has been completed and the Coordinator-General’s report has been released. The land acquisition process is well advanced. Detailed design for Stage 1 of the civil works is nearly complete and signalling, power and overhead wiring design is in progress. Planning approval requirements have been identified and are currently being secured.
The EIS for the Moura Link / Aldoga Rail is nearing completion. QR Network has completed all investigations and the Coordinator-General’s report was released in early October 2009. Preliminary design has been completed with detailed design planned to commence soon. Planning approval requirements have been confirmed through the Coordinator-General’s report. Land acquisition requirements have been identified and the acquisition process for any parcels that are required to be acquired by a formal resumption process will progress. The detailed design component may require some amendments depending on the tonnage information and timing that are to be advised by the coal industry.
QR Network is currently reviewing the delivery strategy for the project and it is anticipated that QR Network will brief the coal industry in the near future on its intended approach. There will be further briefings scheduled to provide the coal industry with updates on progress and QR Network’s requirements from industry in order to meet the targeted sanction date.

QR Network Pty Ltd
2009 Coal Rail Infrastructure Master Plan
53
5.3 Planning Scenarios
QR Network has developed four planning scenarios for future SBB export coal tonnages. These are based on currently known port expansion options.
Table 13: Southern Bowen Basin Planning Scenarios
Coal Terminals
Capacity Mtpa
SBB76 (UT3)
2009/2010
SBB82
2010/2012
SBB100
2012/2013
SBB165
2013/2015
SBB225
2015+
RG Tanna 69 69 75 75 75 75
Barney Point 7 7 7 0 0 0
25 0 25
50
70
Wiggins Island
90 90 105
15 <15> Balaclava Island
30 30
Fitzroy River 15 <4> <7> <11> 15
Total Domestic 9.5 10 10 10 10
Total Export 76 82 100 165 225
Total Tonnes 85.5 92 110 175 235 Tonnages enclosed by < > indicate that the amount is recognised as a proposed possible tonnage expansion but has not been included in the totals or modelling
The timing shown above is by financial year, is indicative only and is based on either publically available information or by estimation based on the dates of the Initial Advice Statement and/or by liaison with the relevant proponents.
The scenarios are named according to the volume of export coal. Domestic coal tonnages are additional and are provided for in the system capacity modelling.
Key assumptions include:
• RGTCT nameplate capacity has been increased from 69mtpa to 75mtpa.
• BPCT will close for coal exports when WICET is commissioned.
• WICET will have a nameplate capacity of 90 mtpa but may be able to handle up to 105 mtpa.
• Balaclava Island and Fitzroy River Barging or other alternative ports could potentially provide up to
45mtpa of export capacity. Potential incremental capacity from these proposals has not yet been
included in the totals or capacity modelling. However this port capacity is included in the final SBB225
scenario.
• Domestic tonnages are expected to remain constant at around 10mtpa.

QR Network Pty Ltd
2009 Coal Rail Infrastructure Master Plan
54
5.4 Detailed Tonnage Throughputs Underpinning Planning
Table 14 below shows the source of tonnages, aggregated by system and by export facility. These have been compiled from QR Network’s file of access requests. Where there has not been any information available, industry experience, liaison and research has been used to estimate demand. These are the mine/ port combinations that are used to perform the static and dynamic modelling that indicates if rail infrastructure expansion is required.
Table 14: SBB – System Source and Export Port Statistics
Throughput Mtpa
Coal Systems
and Terminals
2006/ 2007
2007/ 2008
2008/ 2009
SBB76 (UT3)
2009/2010
SBB82
2010/2012
SBB100
2012/2013
SBB165
2013/2015
SBB225
2015+
Blackwater export (a) 43.6 46.4 44.7 60.70 61.70 69.60 82.95 107
Moura export 7.9 8.1 8.2 13.30 13.30 15.40 30.55 41
Surat export 0 0 0 0.00 0.00 0.00 41.80 67
Goonyella export (a) - - 3.4 2.00 7.00 15.00 9.70 10
Total export via Gladstone
51.5
54.5
56.3
76
82
100
165
225
via RGTCT via BPCT via WICET via FRCT via PACT
45.0 6.5 0 0 0
49.9 4.6 0 0 0
52.4 3.9 0 0 0
69 7 0 0 0
75 7 0 0 0
75 0
25 0 0
75 0
90 0 0
75 0
105 15 30
Blackwater domestic
5.7 6.0 6.0 6 6 6 4 4
Moura domestic
3.8 3.5 3.1 4 4 4 6 6
Total domestic
9.5 9.5 9.1 10 10. 10 10 10
Total Export & Domestic 61.0 64.0 65.4 86 92 110 175 235
(a) Previous Goonyella sourced tonnes exported via Gladstone were included in the Blackwater figures: these are now shown separately.
5.5 SBB76
This scenario was included in the 2008 Coal Rail Infrastructure Master Plan with the following rail enhancement projects proposed for the Blackwater system:
• Duplication of two sections to support 76 mtpa of export coal with a robust system. • Completion of the full duplication of the Blackwater mainline between Rocklands and Burngrove is to
be constructed in advance of WICET Stage 1. • Power system upgrades including new feeder stations at Bluff, Duaringa and Wycarbah.
These projects were endorsed by the industry vote in December 2008 and received QCA scope approval in February and April 2009.

QR Network Pty Ltd
2009 Coal Rail Infrastructure Master Plan
55
QR Network is currently planning to complete the duplications progressively between 2010 and mid 2013 and to complete the feeder stations by 2013. Commissioning of the feeder stations is dependent upon Powerlink power feeds which are not expected until 2013. Every effort is being made to bring this date forward. It is assumed that all of these projects are completed as base case rail infrastructure for the future tonnage scenarios.
5.6 SBB82
The SBB76 scenario was based on a nameplate capacity of RGTCT of 69mtpa and assumptions about train fleet configuration and train operating performance based on the current access agreements with QRNational. On this basis rail infrastructure enhancements were proposed to provide a contracted export capacity of 76mtpa via RGTCT and BPCT. Additional rail expansion projects were proposed to provide additional capacity to support the proposed WICET.
In early 2009 the Gladstone Ports Corporation announced that the nameplate capacity of RGTCT was being increased from 69mtpa to 75mtpa. QR Network has matching access requests for 6mtpa of additional tonnage to support this port capacity increase.
The previous SBB76 capacity analysis revealed that there were only limited below rail infrastructure enhancements that could marginally increase throughput at Callemondah. This was because the system constraints exist around the port unloaders and Callemondah yard where train operators are required to provision and service their trains. A number of infrastructure enhancements have been completed in Callemondah yard and these are the enhancements that could deliver the majority of throughput benefits. However QR Network remains receptive to testing the feasibility and economic viability of any new enhancements that might be suggested.
5.6.1 Increased Throughput Initiatives
There are however a number of non-rail infrastructure initiatives that may increase throughput. Broadly these initiatives will be associated with mine or port infrastructure or train fleet and operations. These are discussed below:
5.6.1.1 Train Loading at Mines
System throughput may be able to be increased by decreasing the amount of time trains spend being loaded at mines. Further modelling will be required to identify where mine infrastructure or process improvements could provide system throughput benefits.
5.6.1.2 Train Unloading at Ports
There are currently restrictions on route selection into the port unloaders at RGTCT based on the coal source and unloading time restrictions at BPCT. The need for a level of discipline in train sequencing is required to minimise capacity loss due to these restrictions. Further modelling is required to determine the sensitivity of disciplined sequencing on port capacity and to determine if port infrastructure investments can provide system throughput benefits.
In the 2006 Coal Rail Infrastructure Master Plan an additional holding road between the Cooling Channel Bridge and the RGTCT unloading loops was proposed. This proposal should be reconsidered to determine if it can deliver additional throughput and whether it is cost effective.
The capacity of the Cooling Channel Bridge has also been questioned, however while this is a business critical asset with no redundancy, it is not a capacity constraint on the system. Utilisation of this section is approximately 60% at current levels of traffic. Further analysis is required to fully understand the impact of this piece of infrastructure at higher volumes of traffic.
Similarly an additional holding road to service the BPCT has been considered. However this does not appear to be a viable project considering that BPCT is slated to close when WICET opens. This means that any investment to support BPCT would have to be amortised over a limited time frame.

QR Network Pty Ltd
2009 Coal Rail Infrastructure Master Plan
56
5.6.1.3 Additional Train Provisioning Facilities
Relocating some or all of the locomotive provisioning activities out of Callemondah Yard could potentially increase throughput. This concept requires further validation by detailed capacity modelling. Currently provisioning of loaded trains on the way to the port is not constraining throughput. However this may not remain the case with higher levels of throughput and additional trains operating in the system.
A new provisioning facility is planned at Aldoga with the commissioning of the WICET. Preliminary investigations by QRNational have indicated that it is not economically viable to construct this facility earlier. However further whole of supply chain commercial analysis is required to be able to compare the cost effectiveness of this option with alternative investments.
5.6.1.4 Reducing the Callemondah Yard Mini Cycle
A mini cycle is the time taken from when a loaded train arrives at a depot until it is ready to depart the depot for its next cycle. Activities that take place during the mini cycle include:
• Unloading • Train examinations • Changing crews • Provisioning and servicing locomotives • Shunting • Queuing
The mini cycle is contractually agreed between QR Network and the train operators. A mini cycle of around 6.5 hrs is currently contractually in place for up to 76 mtpa of export coal. This mini cycle time is used in the dynamic modelling undertaken for this scenario. Achieving this time will require an improvement on current performance. It is unlikely that further reductions in mini cycle would be possible at Callemondah Yard at throughput levels higher than this.
5.6.1.5 Increasing the Electric Locomotive Fleet
Electric locomotives do not require refuelling and therefore require less time in Callemondah Yard for their mini cycle. As the power systems upgrades are constructed, current restrictions on the number of electric trains that can operate in the Blackwater system will be lifted. Both train operators have indicated a preference to invest in electric locomotives in the future.
However initial modelling results do not indicate any significant gain in throughput for a predominantly electric locomotive fleet. This is mostly due to time taken for various queuing practices that are required by Callemondah yard restrictions. Further more detailed modelling of movements of electric locomotives around Callemondah will be required to identify the added value of increasing the number of electric locomotives.
5.6.1.6 Increasing the Train Payloads
The Blackwater system is a 26.5 tonne axle load system (apart from Minerva), which means that coal wagons up to 106 tonne gross mass can operate on most hauls. However the existing fleet available to operate in the Blackwater system is currently a mix of 80 to 106 tonne wagons.
The maximum length train that can run in the Blackwater system is 1700 metres. This means train operators can configure trains with up to 100 coal wagons and 4 locomotives. However some present train configurations are not maximum length due to the current locomotive power and wagon size limitations.
As a result of these factors the throughput calculations for the SBB76 scenario were based on an average train payload of 6,800 tonnes. However it is expected that in the future all new trains added to the fleet by either train operator will be 106 tonne wagons and configured at maximum Blackwater train length.

QR Network Pty Ltd
2009 Coal Rail Infrastructure Master Plan
57
If all wagons in the fleet were either 104 or 106 tonne capacity and all trains were configured at close to maximum Blackwater length then the average payload can increase to around 8,000 tonnes and there is potential for additional system throughput. However any investment in new rolling stock by train operators would have to be underwritten by commercially viable haulage contracts.
5.6.2 SBB82 – Capacity Analysis Results
For the SBB82 scenario, QR Network tested a range of train operational solutions to determine if it is feasible for the rail system to provide 75 mtpa throughput to RGTCT and 7 mtpa throughput to BPCT.
The following key assumptions were made:
• Minerva trains remain at current payloads due to axle load restrictions which restrict these trains to using 80 tonne coal wagons.
• All other trains use 98 to 100 wagons of 104 tonne to 106 tonne gross mass which can provide an average payload of approximately 8,000 tonnes for a Blackwater length train.
• The Callemondah Yard mini cycle is achieved as contracted with the train operators in existing access agreements.
• Only Minerva and Rolleston services need to remain diesel hauled: all other services can be electric locomotive hauled.
• All endorsed Blackwater mainline duplications are completed. • All endorsed power systems upgrades are completed. As a result AC traction electric locomotives can
be used for all non diesel services. • Export demand is split as: Blackwater 61.7 mtpa, Goonyella cross traffic 7.0 mtpa and Moura 13.3
mtpa.
In summary there are a number of non-rail infrastructure initiatives that may be able to increase system throughput. Generally further analysis is required to determine the effectiveness and relative cost efficiency of these initiatives. In practice it is likely that increased throughput will only be achieved by incrementally implementing a combination of these initiatives. These initiatives will need to be supported by appropriate commercial solutions to make them financially viable for the proponents. QR Network has modelled the initiative of increasing train payloads and the results follow.

QR Network Pty Ltd
2009 Coal Rail Infrastructure Master Plan
58
Figure 19: Gladstone Export Rail Capacity with 8000 tonne Payload Trains
82 mtpa
127%
0102030405060708090
100110120130140
27 28 29 30 31 32 33 34 35
Number of Trains
Expo
rt T
onne
s (m
tpa)
0%10%20%30%40%50%60%70%80%90%100%110%120%130%140%
BR
TT%
RGTanna Tonnes BPCT Tonnes Tonnage TargetBlackwater BRTT% BRTT% Target
The results of the dynamic modelling analysis are shown in Figure 19. In summary they show that 82 mtpa of rail system throughput could be achieved with 33 trains with an average payload of 8,000 tonnes per train. BRTT% for this case is 124% which is below the regulatory/ contractual limit of 127%.
However additional detailed modelling is required of the rail / port interface as it may not be possible to unload this volume of coal through the existing loop and unloader infrastructure. QR Network intends to complete this additional modelling in conjunction with rail and port operators during the next CRIMP planning cycle.
To support higher tonnages to WICET the Blackwater system may require significant further expansion. On this basis QR Network is recommending that a Concept and Prefeasibility Study to be commenced into options to expand the Blackwater system capacity from 76 mtpa to over 100 mtpa.
Issues to be considered in the Concept and Prefeasibility Studies include:
• Whether an alternative train operating plan can increase the number of paths available and utilised by coal trains on the shared Rocklands – Aldoga corridor.
• Whether a third or fourth track is required between Rocklands and Aldoga and what are the land procurement and environmental issues associated with this.
• Whether infrastructure upgrades are economically viable to allow longer coal trains to operate in the Blackwater system.
• Whether further power systems upgrades are required to meet increased tonnage demand.

QR Network Pty Ltd
2009 Coal Rail Infrastructure Master Plan
59
• Whether any additional refuge loops or triplicated sections are required between Rocklands and Burngrove.
In addition the Callemondah Feeder Station is currently approaching the end of its economic life and will require renewal. Its current location and configuration may not be suitable to support the WICET expansion. A separate concept and prefeasibility study is required to investigate renewal and possible relocation issues for this feeder station.
In summary the SBB82 scenario does not currently require new project endorsements for construction but does require endorsement for Concept and Prefeasibility studies into future expansion options for the Blackwater system.
5.6.3 Power Systems Upgrades
Since the publication of the 2008 CRIMP document in October 2008, investigations have continued into the Blackwater power systems. As a result of this Working Paper 4.5 was published in February 2009 to provide additional information about the reasons for building four new feeder stations.
Further detailed modelling of the power systems has now been completed and has identified more accurately the constraints of the current power system around maximum current draw, harmonics and negative phase sequencing. Analysis is continuing to identify the maximum number of electric train services that can be run in the Blackwater system prior to the new feeder stations being constructed.
There is additional work required to renew / upgrade the existing feeder stations to meet both the short term demands until the new feeder stations are constructed and the long term demands after this. QR Network has released a detailed working paper to inform industry of these issues. This will support the endorsement being sought for the concept and prefeasibility study on the Callemondah Feeder Station.
5.7 SBB100
This scenario is based on the completion of WICET Stage 1 with 25 mtpa of port capacity and the closure of BPCT. RGTCT remains at the 75 mtpa nameplate capacity used in SBB82. Base case rail infrastructure is the same as for SBB82 with the addition of tonnage derived from the Blackwater system only.
Demand for WICET Stage 1 in this scenario is based on:
• An additional 15.9 mtpa from the Blackwater system (including cross system Goonyella tonnages) • 2 mtpa additional from the Moura system
On this basis the fully duplicated Blackwater system will be able to handle the additional tonnage and no further main line rail infrastructure will be required in the Blackwater system. However further capacity enhancing projects (passing loops) may be required on the Gregory Branch to support cross system traffic from Goonyella. Further tonnage scenarios will consider higher Blackwater tonnages to WICET.
The additional two mtpa from the Moura system has no material affect upon rail infrastructure.
No further projects are considered for endorsement for the SBB100 tonnage scenario in this CRIMP document.
These issues will be considered in future planning studies for the Blackwater and Moura systems.
5.8 SBB165
This scenario is based on WICET expanding to its full nameplate capacity of 90 mtpa. Base case rail infrastructure is that required for SBB100.
Demand growth totalling 65 mtpa, beyond SBB100, is assumed to be from;

QR Network Pty Ltd
2009 Coal Rail Infrastructure Master Plan
60
• 1 mtpa in the Blackwater system plus 6 mtpa in cross-system Goonyella traffic • 16 mtpa in the Moura system • 42 mtpa from SBR via the Moura system
With the inclusion of the forecast Surat Basin tonnages and the need to maintain contract tonnages on the Moura system, substantial expansion work will be required. This is being studied in conjunction with the project’s proponents.
The formation in the Moura system needs to be strengthened to allow for the significant increase in tonnages over the network. A combination of treatment methods are recommended including formation reconstruction and lime slurry pressure injection (LSPI). Some bridge and culvert upgrades are also expected to be required. It is planned, based on current projections, to commence the formation strengthening during the later half of 2010 so as to be able to complete most of the upgrade works prior to the commissioning of the WICET.
The likely initial rail infrastructure requirements identified below are based on the updated coal tonnage forecasts from individual mines, their timing, preliminary capacity modelling, extent of formation upgrade works and impact on rail operations:
• Additional passing loops are required between Earlsfield and Belldeen, Byellee and Stowe and Stirrat and Clarke
• Duplications from the 52 kilometre mark (near Clarke) to the 73 kilometre mark (near Fry), between Fry to Mt. Rainbow, Mt. Rainbow to Dumgree and Dumgree to Annandale
• Extension of existing passing loops at Mt. Rainbow, Dumgree, Annandale and Belldeen to accommodate the longer Surat trains
• Passing loops at Banana Junction to facilitate train movements to and from SBR and the Moura Short Line west of the junction.
Further modelling is expected to be carried out in the future involving detailed consideration of formation strengthening works and their impact on train operations, possible use of a mix of train configurations, staging of infrastructure as well as sensitivity testing on a range of modelling parameters. This could likely result in some modifications / changes to the proposed infrastructure upgrades and their timing. These modifications / changes may include amendments to passing loop and duplication locations and the addition of new infrastructure. QR Network will continue to progress studies on the infrastructure requirements and engage with the coal industry on a regular basis.
5.8.1 SBB165 – Blackwater System Expansion
In this scenario Blackwater system tonnages are increased from around 86 mtpa to around 93 mtpa (including Goonyella cross system traffic). To understand the impact of this demand increase it is necessary to understand the operating paradigm of the Blackwater system.
The Blackwater system joins with the North Coast Line (NCL) at Rocklands and from Rocklands to Callemondah the duplicated rail corridor is shared use between Blackwater coal traffic and NCL freight and passenger rail traffic. This results in a mix of loaded and unloaded coal, general freight and both high speed and locomotive hauled passenger services sharing the two tracks. The speed differential between these services creates a high level of variability in the system.
To enable the system to function coal trains are assigned paths every 30 minutes with other services scheduled between them, i.e. on the alternating quarter hours. This theoretically provides 48 loaded and 48 unloaded coal train paths per day and 48 train paths in each direction for other traffic. Not all of these paths can be utilised every day due to maintenance requirements, port shutdowns etc.
After allowing for this, initial high level capacity analysis indicates that the fully duplicated Blackwater system could handle up to around 85 mtpa based on 8,000 tonne average train payloads as described in SBB82.

QR Network Pty Ltd
2009 Coal Rail Infrastructure Master Plan
61
To increase the Blackwater system capacity to 93 mtpa will probably require a reduction of train separation to 20 minutes. This is currently not achievable for diesel trains in two sections east of Bluff with steep grades. Constructing triplications as grade easings in the Westwood to Windah and Tunnel to Edungalba sections will allow all trains to run at 20 minutes separation. This could increase Blackwater mainline capacity to 100 mtpa.
This is based on at least 12 mtpa remaining diesel hauled from Minerva and Rolleston which means the power systems with four new feeder stations will be capable of supporting this throughput. It is likely that expansion projects will also be required on the Gregory Branch and Rolleston Branch to handle increases in tonnage from both local and cross system coal traffic.
These issues will be considered in future planning studies for the Blackwater and Moura systems and no further projects are considered for endorsement for the SBB165 tonnage scenario in this CRIMP document.
5.9 SBB225
QR Network is aware of tonnage requests totalling in excess of 150 mtpa above the existing contracted export tonnage of 76 mtpa. This tonnage demand can be met by all currently proposed port expansions meeting their full potential capacity. Alternatively other port options, e.g. Curtis Island, may be built in response to this long term demand.
Based on current tonnage requests the tonnage on the Blackwater corridor would be 117 mtpa (including Goonyella cross system traffic) and the tonnage on the Moura corridor would be 108 mtpa. To achieve this, the Moura corridor will require full duplication to the SBR junction.
To increase Blackwater capacity to 117 mtpa will require either running longer heavier payload trains or reducing train separation by triplicating the Rocklands to Aldoga section. To allow Goonyella length trains to run in the Blackwater system would require the triplication / grade easing of the Boonal to Bluff section and extension to passing and balloon loops as required. Alternatively an above rail option would be the addition of an extra locomotive to each train. The Gregory Branch will also require at least partial duplication.
At these tonnage levels the power system in Blackwater may need further upgrades and consideration could be given to electrification of the Rolleston branch. Similarly electrification of the Moura / SBR system could be considered.
These issues will be considered in future planning studies for the Blackwater and Moura systems and no further projects are considered for endorsement for the SBB225 tonnage scenario in this CRIMP document.
5.10 SBB Summary
The results of the above listed scenarios are summarised in Table 15 below.

QR Network Pty Ltd
2009 Coal Rail Infrastructure Master Plan
62
Table 15: SBB Summary of Scenario Expansion Paths
Long Term Planning Scenario
Total Export via
Gladstone (mtpa)
Rail Infrastructure Required to Facilitate Expansion Estimated Cost ($m)
SBB76 (Endorsed projects)
76 Blackwater system: • Duplication of sections:
o Rocklands – Gracemere o Walton – Bluff o Kabra – Gracemere o Stanwell – Kabra o Dingo – Umolo o Umolo – Parnabal o Parnabal – Walton
• Power Systems Upgrade o Feeder Stations at Bluff, Duaringa and Wycarbah o Filters and Compensators for AC traction
locomotives o Replacement of Pinpoint Detectors for AC traction
locomotives • Full Blackwater System Main Line Duplications Design
package Gladstone Area: • Wiggins Island Export Coal Terminal Early Works
$220
$120
$8
$46
SBB82 82 Blackwater system: • Concept Study and a Prefeasibility Study to be
undertaken for Blackwater system expansion • Concept and Prefeasibility works for Callemondah feeder
Station renewal/ upgrade Moura system: • Nil
$11
$1.5
TBA
SBB100 100 Blackwater system: • Additional passing loops on the Gregory Branch • Power Systems upgrade
In the Moura system: •
TBA
TBA
SBB165 165 Blackwater system: • Triplicate / grade ease Westwood to Windah • Triplicate / grade ease Tunnel to Edungalba • Additional passing loops or duplications on the Gregory
Branch • Additional passing loops on the Rolleston branch • Power Systems Upgrade
TBA

QR Network Pty Ltd
2009 Coal Rail Infrastructure Master Plan
63
Long Term Planning Scenario
Total Export via
Gladstone (mtpa)
Rail Infrastructure Required to Facilitate Expansion Estimated Cost ($m)
Moura system: • Formation strengthening and bridge and culvert upgrades • Byellee – Stowe passing loop • Stirrat – Clarke passing loop • Fry – Mt Rainbow duplication • Mt Rainbow – Dumgree duplication • 136 klm – SBR Junction duplication • A new passing loop between Earlsfield and Belldeen • Duplications Clarke to Fry. • Extension of existing passing loops at Mt. Rainbow,
Dumgree, Annandale and Belldeen. • Passing loops at Banana Junction
TBA
SBB225 225 Blackwater system: • Triplicate / grade ease Boonal to Bluff • Extend passing / balloon loops • Duplications on Gregory branch • Power System Upgrades Moura system: • Full duplication from Gladstone to the SBR Junction
TBA
TBA
For details concerning the modelling around the initial scenarios please see 12.2 Appendix for Chapter 5 - Southern Bowen Basin.

Coal Rail Infrastructure Master PlanChapter 6
Northern Bowen Basin Expansion
6

QR Network Pty Ltd
2009 Coal Rail Infrastructure Master Plan
65
6. Northern Bowen Basin Expansion 6.1 Introduction
The Northern Bowen Basin consists of the Goonyella and Newlands systems.
The Goonyella system is used primarily to service coal mines in the northern and central areas of the Bowen Basin. Coal is transported from a number of locations to unloading facilities at the terminals of Dalrymple Bay and Hay Point Services. The system boundaries extend from Blair Athol to the west, south to the Gregory Branch junction, north to North Goonyella mine and east to the port of Hay Point. Average haul distance in the Goonyella system is approximately 220km.
A map showing the Goonyella system is depicted in Figure 20 below.
Figure 20: Goonyella System Rail Network
The Newlands system is located further north and currently services the coal mines of Collinsville, Sonoma and Newlands. This system conveys export coal to the Port of Abbot Point and domestic coal to the Queensland Nickel Refinery and the Bowen Coke Works.
The Newlands system extends a distance of 98km from Abbot Point Balloon Loop to Collinsville Junction where it branches to McNaughton (Collinsville mine) and continues to Newlands a total distance of approximately 170 kilometres.
A map showing the Newlands system is shown in Figure 21 below.

QR Network Pty Ltd
2009 Coal Rail Infrastructure Master Plan
66
Figure 21: Newlands System Rail Network
6.2 Update on Previous/ Committed Projects and Forecast Capacity
Details of projects that have been previously undertaken together with committed projects are listed below. The projects have been grouped into categories that relate specifically to the port expansions.
Forecast capacity charts, based on the coal rail systems, are also depicted in the following based on the coal rail systems.
6.2.1 Dalrymple Bay Coal Terminal
Figure 22 below refers to the status of previously constructed rail infrastructure.

QR Network Pty Ltd
2009 Coal Rail Infrastructure Master Plan
67
Figure 22: Dalrymple Bay Coal Terminal Rail Expansion Projects
Cost
($M)
Q1Q2
Q3Q4
Q1Q2
Q3Q4
Q1Q2
Q3Q4
Q1Q2
Q3Q4
Q1Q2
Q3Q4
5.9$
2.9$
88.8
$ 33
.0$
15.9
$ 67
.7$
16.2
$ 30
.0$
18.5
$ 30
.0$
190.0
$ 79
.6$
578.5
$
($15
.6M / m
tpa)
Hay P
oint E
xpan
sion T
otal
2009
/10
Copp
abell
a – In
gsdo
n Dup
licati
on
Broa
dlea –
Mall
awa –
Woto
nga D
uplic
ation
Powe
r Stre
ngthe
ning B
oling
brok
e Sub
statio
n
Dalry
mple
Bay C
oal T
ermi
nal F
eede
r Stat
ion up
grad
e
2008
/09
Jilala
n Rail
Yar
d Upg
rade
- Be
low R
ail
Powe
r Stre
ngthe
ning M
indi S
ubsta
tion
Dalry
mple
Bay C
oal T
ermi
nal 3
rd R
ail Lo
op
2012
/13
Winc
heste
r Pas
sing L
oop
2010
/1120
11/12
Copp
abell
a Yar
d Upg
rade
Harro
w (P
eak D
owns
– Sa
raji)
Pass
ing Lo
op
Step
hens
(Dys
art –
Nor
wich
Par
k) Pa
ssing
Loop
Coal
Rail I
nfra
struc
ture
Pro
gres
s Rep
ort
Hay P
oint E
xpan
sion 9
2 to 1
29 m
tpa E
xpor
t
Goon
yella
Sys
tem
Conn
ors R
ange
Res
ignall
ing
Comp
leted
Dec
05
Oct 0
8
Jun 0
9
Oct 0
9
May 1
0
Aug 1
0
Dec 0
9
Comp
leted
Jul 0
7
Comp
leted
Nov
07
Feb 0
9
Oct 0
8
Comp
leted
Mar
08
Figure 23 below shows possible future forecast tonnage capacity for the Goonyella system.

QR Network Pty Ltd
2009 Coal Rail Infrastructure Master Plan
68
Figure 23: Goonyella System Forecast Export Capacity G
oony
ella
Sys
tem
Por
t and
Rai
l cap
acity
050100
150
200
250
2005
/2006
2006
/2007
2007
/2008
2008
/2009 Sep-09 Dec-09 Mar-10 Ju
n-10 Sep
-10 Dec-10 Mar-11 Ju
n-11 Sep
-11 Dec-11 Mar-12 Ju
n-12 Sep
-12 Dec-12 Mar-13 Ju
n-13 Sep
-13 Dec-13 Mar-14 Ju
n-14 Sep
-14 Dec-14 Mar-15 Ju
n-15 Sep
-15 Dec-15 Mar-16 Ju
n-16 Sep
-16 Dec-16 Mar-17
System Capacities (mtpa)
Port
com
mitt
edP
ort p
ropo
sed
Belo
w R
ail p
ropo
sed
Bel
ow R
ail c
omm
itted
Actu
al T
onne
s
NB
B 1
95
NB
B 2
66
NB
B 3
33
DB
CT
85 m
tpa
HP
CT
44
31 C
onsi
sts
HP
CT
55 m
tpa
DB
CT
90 m
tpa
DB
CT
111
mtp
aH
PC
T 75
mtp
a
DB
CT
153
mtp
a
Jila
lan
Byp
ass
Cop
pabe
lla-In
gsdo
n D
uplic
atio
n

QR Network Pty Ltd
2009 Coal Rail Infrastructure Master Plan
69
6.2.2 Abbot Point (Goonyella to Abbot Point expansion project)
The status of previously constructed rail infrastructure is shown in Figure 24 below.
Figure 24: Abbot Point Coal Terminal Rail Expansion Projects
Cost
($M)
Q1Q2
Q3Q4
Q1Q2
Q3Q4
Q1Q2
Q3Q4
Q1Q2
Q3Q4
Q1Q2
Q3Q4
Goony
ella to
Abbot
Point
– Early
Work
s, Pre-
feasib
ility an
d land
acquis
ition
198.0
$
Goony
ella Ab
bot Po
int (G
AP) E
xpansi
on Tot
al198
.0$
Note:
the $1
98.0 m
illion in
cludes
an am
ount of
$27 m
illion w
hich w
as in t
he Ad
dendum
to the
2006
CRIMP
under
the pro
ject na
me of
"Northe
rn Miss
ing Lin
k early
works
" and s
ubsequ
ently e
ndorse
d.
2012/1
3
Coal R
ail Infr
astruc
ture P
rogres
s Repo
rtGo
onyella
Abbo
t Poin
t (GAP
) Expa
nsion
to 50
mtpa
Export
and H
ay Po
int Exp
ansion
to 228
mtpa
Export
Newla
nds Sy
stem
2011/1
2200
8/09
2009/1
0201
0/11
Dec 0
9
Figure 25 below shows possible future forecast tonnage capacity for the Newlands system.

QR Network Pty Ltd
2009 Coal Rail Infrastructure Master Plan
70
Figure 25: Newlands System Forecast Export Capacity N
ewla
nds
Syst
em P
ort a
nd R
ail c
apac
ity
050100
150
2005
/2006
2006
/2007
2007
/2008
2008
/2009 Sep-09 Dec-09 Mar-10 Ju
n-10 Sep
-10 Dec-10 Mar-11 Ju
n-11 Sep
-11 Dec-11 Mar-12 Ju
n-12 Sep
-12 Dec-12 Mar-13 Ju
n-13 Sep
-13 Dec-13 Mar-14 Ju
n-14 Sep
-14 Dec-14 Mar-15 Ju
n-15 Sep
-15 Dec-15 Mar-16 Ju
n-16 Sep
-16 Dec-16 Mar-17
System throughput (mtpa)
Por
t com
mitt
edPo
rt pr
opos
edBe
low
Rai
l com
mitt
edBe
low
Rai
l pro
pose
dN
ewla
nds
Actu
als
AP
CT
50 m
tpa
AP
CT
25 m
tpa
AP
CT
105
mtp
a
AP
CT
80 m
tpa
NM
L C
ompl
ete
NB
B 1
95
NB
B 3
33
NBB
266

QR Network Pty Ltd
2009 Coal Rail Infrastructure Master Plan
71
6.3 Planning Scenarios
The planning scenarios presented by QR Network are compiled based upon the proposed capacities of the respective Northern Bowen Basin (NBB) ports, i.e. Abbot Point Coal Terminal, Dalrymple Bay Coal Terminal, Hay Point Services Coal Terminal and any new proposed ports.
Table 16 below has been compiled using information about the proposed expansions of these ports.
Table 16: Northern Bowen Basin Planning Scenarios
Coal Terminals
Capacity Mtpa
NBB148 (Cargo
Assembly) 2009/2010
NBB154
2010/2011
NBB195
2011/2013
NBB266
2013/2015
NBB333
2016+
19 19
25 25
50 50
80 80
Abbot Point
105 105
85 85 85
90 90
111 111
Dalrymple Bay
153 153
44 44 44
55 55
Hay Point Services
75 75 75
(Connor’s Range)
129 129 145 186 228
Total Tonnes 148 154 195 266 333
The timing shown above is by financial year, is indicative only and is based on either publically available information or by estimation based on the dates of the Initial Advice Statement and/or by liaison with the relevant proponents.
The scenarios are named according to the volume of export coal. Domestic coal tonnages (where applicable) are additional and are provided for in the system capacity modelling.
The scenarios show all of the ports expanding to their earliest completion dates.

QR Network Pty Ltd
2009 Coal Rail Infrastructure Master Plan
72
6.4 Detailed Tonnage Throughputs Underpinning Planning
A further breakup of the source of the coal tonnes shipped in the Northern Bowen Basin to the various ports is shown in Table 17 below.
Table 17: NBB - System Source and Export Port Statistics
Throughput Mtpa
Coal Systems
and Terminals
2006/ 2007
2007/ 2008
2008/ 2009
NBB148
2009/2010
NBB154
2010/2011
NBB195
2011/2013
NBB266
2013/2015
NBB333
2016+
Goonyella export 87.8 81.6 87.0 129 129 145 186 228
Newlands export 11.2 12.9 14.2 19 25 50 80 105
Total Export 99.0 94.5 101.2 148 154 195 266 333
APCT - Newlands APCT via NCL APCT via GAP DBCT HPSCT
11.2 - -
50.6 37.2
11.7 1.2 -
43.8 37.8
14.2 0.5 -
47.3 35.8
17.8 1.2 -
85 44
22.7 2.3 -
85.0 44.0
22.7 -
27.3 90.0 55.0
30.0 -
50.0 111.0 75.0
35.0 -
70.0 153.0 75.0
Total 99.0 94.5 97.8 148 154.0 195.0 266.0 333.0
Goonyella via Gladstone
0.2 0 3.4 0 7.0 4.3 9.7 10
Total Export 99.2 94.5 101.2 148.0 161.0 199.3 275.7 343.0
Under the system tonnage export amounts shown for the scenarios NBB154, NBB195 and NBB266 in Table 17 detailed mine/port combination tonnage amounts have been compiled. These have come from QR Network’s file of access requests accepted and proposed. Where there has not been any information available, industry experience, liaison and research has been used.
These mine/ port combinations are used to perform the static and dynamic modelling that indicates what new rail infrastructure is required.
6.5 NBB148
The 2008 Coal Rail Infrastructure Master Plan proposed the following rail enhancement projects for the Goonyella system:
• Duplications of track:
⎯ Coppabella – Ingsdon ⎯ Winchester – Peak Downs ⎯ Wotonga – Moranbah North
• Passing Loop:
⎯ Saraji – Dysart

QR Network Pty Ltd
2009 Coal Rail Infrastructure Master Plan
73
These projects were endorsed by Industry in December 2008 and the Queensland Competition Authority in February 2009 and have been included in the base infrastructure for modelling the NBB scenarios in the following way:
• The duplication of Coppabella – Ingsdon was initially identified in Working Paper 4.1 “Rationale for NBB148 Cargo Assembly projects”. This project is being constructed and has been included as base case infrastructure for future modelling scenarios.
• The Winchester – Peak Downs and Wotonga – Moranbah North duplications and the Saraji – Dysart passing loop were recommended in Working Paper 4.2 “Rationale for NBB179 Projects”. This paper shows that these projects would be required when tonnage triggers were reached on the South Goonyella and North Goonyella branches. With the delays to the GAP project and the slowing of demand growth it is now uncertain when these tonnage triggers will be reached and which port expansion projects will trigger them. On this basis the projects are not required until either the GAP project tonnages exceed 50 mtpa (depending upon the origin of the tonnage) and/or other DBCT/HPSCT expansions cause tonnages to reach the triggers. These projects have not been included in the base infrastructure for future modelling scenarios but are nominated as potential infrastructure solutions in the relevant growth scenarios.
6.6 NBB154
As mentioned above this scenario includes the current nameplate capacities of DBCT and HPSCT but depicts an increase to 25mtpa within the Newlands system. This is in line with the proposed timeframe for the increase in nameplate capacity of APCT.
Both static and dynamic modelling was undertaken for this scenario testing for the Goonyella system the 85mtpa through DBCT and 44mtpa through HPSCT.
The following key assumptions were made:
• DBCT is operating in cargo assembly mode, • Train payloads are as provided by the rail operators: Goonyella size payloads for trains railing to
DBCT and HPSCT, Blackwater size payloads for trains railing to Gladstone ports, • An allowance has been made for train paths used by non-coal trains, • A port closure program detailing port closures per annum on a pit basis; to accommodate pit
maintenance • A track closure program detailing annual track closures on a system wide basis (for zonal
maintenance) and also incorporating specific sections (for track maintenance) has been used based on the UT3 submission.
• Sufficient capacity exists at the respective operator’s depot to hold the trains during maintenance activities,
The modelling results for NBB154 show that in the Goonyella system no additional track infrastructure enhancements will be required.
For the Newlands system modelling has identified possible rail enhancements, however, negotiations are ongoing in respect of commercial arrangements for these enhancements in conjunction with the GAP project. Consequently there are no projects submitted for proposed endorsement at this time.
6.6.1 Goonyella Power Systems
The new feeder stations at Mindi and Bolingbroke have recently been commissioned which has removed the restriction on electric train separation east of Coppabella. However at current tonnages (around 85 mtpa) problems are now being experienced with the Coppabella feeder station being overloaded. This problem has been exacerbated by the completion of the Broadlea – Mallawa – Wotonga duplication and the new mine balloon loops coming into service at Carborough Downs and Isaac Plains.

QR Network Pty Ltd
2009 Coal Rail Infrastructure Master Plan
74
To manage this situation in the short term a 30 minute separation restriction has been placed on electric train operations west of Coppabella. At current tonnage levels this restriction will have no noticeable affect on system throughput. In the longer term the power systems working paper supports the need for concept and prefeasibility works for a new feeder station at Wotonga. Endorsement is being sought for this.
6.7 NBB195
The significant changes to the coal supply chain under this scenario incorporate the increase at the Hay Point coal terminals of DBCT of 5mtpa to 90mtpa and HPSCT of 11mtpa to 55mtpa. The other major change over the NBB154 scenario is the completion of the Northern Missing Link (NML) which facilitates the lifting of coal volumes exported through APCT to 50mtpa.
Also, if cross system traffic from Goonyella to Blackwater exceeds 2mtpa then further rail enhancements on the south Goonyella and Gregory branches may be needed. Additionally below rail infrastructure at the ports, the track segment from the ports to Jilalan and other branch line enhancement may be required.
Both static and high level dynamic modelling was undertaken for this scenario.
The results of the initial dynamic modelling on the Goonyella system indicate that the following enhancements may be required to meet the proposed 145 mtpa being railed to DBCT and HPSCT via the Connors Range:
• Duplication of Winchester – Peak Downs (previously endorsed)
• Duplication of the Wotonga – Moranbah North section (previously endorsed)
• A passing loop between Saraji and Dysart (previously endorsed)
• Duplication of the Red Mountain – Winchester sections
• A passing loop in the Bundoora – Yan Yan section
• Additional roads at Coppabella yard
• Additional holding roads at Jilalan yard
• Relocation and Re-signalling of Black Mountain
• ECP Braking to provide for decreasing the train separation time down the Connor’s Range
• Preliminary power systems analysis indicates an additional feeder station may be required at Wotonga
The implementation of ECP braking together with the re-configuration of the Black Mountain crossover and signalling (at approximate cost of $100 million) is one of the most cost efficient enhancements to increase throughput on the Connor’s Range. It is expected that this will increase the Connor’s Range capacity to around 160mtpa. This will need to be further modelled to identify this tonnage threshold.
Since the actual timing and sequence of port expansions in the NBB is currently uncertain, QR Network is not planning to construct any of these projects at this time. When further details of the planned port expansions are available, including mine to port tonnages, further detail modelling will be completed and this detail will be included in future editions of the CRIMP.
However there is potential for Goonyella system tonnage to increase from the current contracted 129 mtpa to 228 mtpa. There are a number of options of operational and infrastructure enhancements that may meet the tonnage task for this scenario. Because of this QR Network is recommending that a Concept and Prefeasibility Study be undertaken into the options to meet tonnage demand above 129 mtpa between Coppabella and the Hay Point port precinct and also west of Coppabella.
The details of the scope of each of these studies can be found in chapter 9 “Projects for Endorsement” beginning on page 97.

QR Network Pty Ltd
2009 Coal Rail Infrastructure Master Plan
75
Issues to be included in investigating these options are:
• The possible need for triplication and / or refuge loops from the ports to Coppabella since Infrastructure maintenance becomes more critical as volumes increase.
• The feasibility of a third and fourth road down the Connor’s Range. • The need for grade separation of port entry and exit roads (tracks). • Additional holding and bypass roads (tracks) at Coppabella and Jilalan. • Additional passing loops and duplication beyond Coppabella. • A third balloon loop at the third unloader at HPSCT. • A fourth and fifth balloon loop at the fourth and fifth unloader at DBCT. • The potential for running longer and heavier trains than the current Goonyella length electrics. • Power systems upgrades to sustain current tonnages and support the future expansion. Proposed
increased railing on the Goonyella system is resulting in concerns about the robustness, capacity and train operational procedures associated with management of the power systems infrastructure in the Wotonga area.
6.7.1 Goonyella to Abbot Point Expansion Project
In the 2008 Coal Rail Infrastructure Master Plan a scope that provided 50 mtpa capacity to Abbot Point Coal Terminal was depicted for the GAP project. Because of changes in demand a revised scope has been compiled.
This new scope for 50 mtpa is the current expected one but is subject to change in the future.
The current rail system extends from Newlands Mine to Abbot Point and is capable of transporting 19 mtpa of coal from the Bowen Basin for export through a single coal unloader at Abbot Point.
Increasing production from coal mines in the Bowen Basin has created demand for additional export capability via Abbot Point and QR has initiated the development of rail infrastructure through the Goonyella to Abbot Point Expansion Project (GAP) to meet this demand.
The existing railway is to be upgraded to allow trains of 3 x 4000 class diesel locos with 82 wagons of 106t mass. These trains will carry approximately 6,800 tonnes of coal at up to 80 km/h.
The project comprises the Northern Missing Link, upgrades on the Newlands system, expansion of QR Network’s part of Pring marshalling yard, expansion of the Abbot Point Balloon Loop configuration and works in the Goonyella rail system.
Route Wide Works - A programme of reconstruction and strengthening of substantial portions of the existing track to Newlands Junction will be required to support the increased axle loads and train configurations. This will involve formation improvement and replacement of ballast, sleepers and rails.
Some speed enhancement opportunities have been identified which will generally involve track geometry improvements.
All-weather access roads will be provided in areas where new rail tracks are to be installed.
Communications on QR’s coal transport systems will be upgraded to use fibre optic systems for all new and upgraded facilities. The fibre optic “backbone” cable will be installed during the GAP project from Abbot Point to the Goonyella system where it will tie in with existing communications systems.
The majority of the numerous existing level crossings on the route will have to be modified to cater for the increased train numbers.
Abbot Point to Pring Yard - Work at the port area includes the addition of one new balloon loop and associated holding roads. Access tracks, level crossings and driver change pads will also be constructed to enable maintenance and crew changes to be carried out with minimal disruption to the unloading trains.

QR Network Pty Ltd
2009 Coal Rail Infrastructure Master Plan
76
The track between Abbot Point and Pring Yards will be duplicated from Durroburra to Euri Creek. A new bridge will be constructed over Euri Creek.
Two new holding roads will be provided at the existing marshalling yard at Pring.
Buckley to Newlands - The route between Buckley and Newlands Junction will have new passing loops at Buckley, Aberdeen and Cockool and a major duplication of track between North Collinsville and Briaba.
The existing Sheep Station Creek Bridge will have to be reconstructed to take the new 26.5 tonne axle loads.
In addition to the bridges, several existing culverts will be extended and it is anticipated that a number will have to be replaced to take the new loading regime and flood immunity levels.
The Northern Missing Link - The Northern Missing Link will be a new single track of 69km connecting the existing Goonyella railway system to the Newlands system. This will allow rail traffic from the Goonyella system to travel north to Abbot Point.
The railway will be constructed in a new 60 metre wide corridor which may be locally widened for deep cuts and high fills. Two passing loops will be provided along the link.
This section of the project includes significant structural works. A total of 11 rail bridges ranging from three to seven spans are required over the length of the railway. In addition, two road overpass bridges will be constructed.
A ballast siding will also be provided at the northern end of the Link section.
Goonyella system Works - The existing Goonyella rail system currently provides electrified rail transport for coal mines in the Bowen Basin with trains travelling east to the coal terminal of Hay Point Services and Dalrymple Bay. The Goonyella system works for the GAP project comprise a turning angle at Wotonga to enable trains to travel to the north. A passing loop is also provided at Wotonga to cater for the additional train movements in the area.
Where required mine-specific works, to enable trains to turn north to access the missing link, will be included in the GAP project. These will not be funded within the GAP project budget.
Because the above GAP works are associated with negotiations being carried out on the GAP project, which is separate from the CRIMP process, scope approval is currently not being sought.
6.8 NBB 266
Further increases in port capacity for DBCT to 111mtpa, HPSCT to 75mtpa and APCT to 80mtpa are the key changes in this scenario.
To support this additional throughput to Hay Point, train separation will need to be reduced on the Connor’s Range. With a high number of closely separated train paths being used the system will have to be made more robust to handle unplanned events and to allow for maintenance activities. This will require refuge loops to be built at critical locations and other critical sections of track to be triplicated.
To ensure that available train paths and unloading slots are fully utilised the system will have to move towards a choke feed arrangement for the ports. This will involve additional holding roads at Coppabella and Jilalan to stack trains awaiting a path to the port. It will also involve providing additional trains above an efficient number.
Depending on the source mines, additional duplications will be required on the South Goonyella and North Goonyella branches. Additional feeder stations and upgrades to existing feeder stations may be required to match increased track capacity.

QR Network Pty Ltd
2009 Coal Rail Infrastructure Master Plan
77
To support this additional throughput to Abbot Point additional duplications on the Newlands system and additional passing loops on the NML will be required. On the North Coast Line grade separation and triplication will be required to separate coal and non coal traffics. Train length and payload will need to be increased to Goonyella length trains. This will require passing loop extensions.
Full electrification of the Newlands/NML may be economically justified at this tonnage level and would provide a lower operating cost and more efficient rail operation (but at a higher capital cost).
In summary, for the Goonyella system to support 186 mtpa to Hay Point and 50 mtpa of cross system traffic to Abbot Point, the following projects may be required:
• Triplication or intermediate signalling of critical sections including the Connor’s Range and Jilalan to the ports
• Third track refuge loops at critical locations • New feeder station at Saraji and the upgrade of existing feeder stations • Duplication from Peak Downs to Saraji • Duplication from Moranbah North to Riverside Junction • Additional holding roads at Coppabella and Jilalan. • Grade separation of unloading loop entry and exit roads at HPSCT and DBCT. • A third arrival road and unloading loop at HPSCT • A fourth arrival road and unloading loop at DBCT’s new southern stockpile • Mallawa Wotonga grade easing works
For the Newlands system to support 80mtpa to Abbot Point could require:
• Third arrival road and loop at APCT • Triplication of Durroburra to Kaili • Extra holding roads in Pring yard • Additional passing loops on the NML • Binbee-Armuna duplication • Colinsville-Almoola duplication • Grade separation at Durroburra Junction (intersection of Newlands and NCL) • Passing loop extensions to support Goonyella length trains • Electrification of the NML and Newlands, with up to 5 new traction feeder stations
6.9 NBB333
This scenario is based on the maximum expansion of the existing ports at Hay Point and Abbot Point. There is potential for additional ports at Dudgeon Point or Saltwater Creek which would require additional rail capacity above 333 mtpa, however this is not being actively considered at this time.
To support the 228 mtpa level of throughput to Hay Point the Goonyella system will require further reductions in train separation between Coppabella and the ports. The system will need to operate with extremely low variability and as a full choke feed operation to the ports.
Maintenance between trains will become completely impractical and a third track as a relief road will probably be required all the way from Coppabella to the ports. This enables maintenance to be conducted on one track while two remain in service.
This will probably require full triplication from Coppabella to the ports, intermediate signalling to allow reduced separation and extensive duplication on the South Goonyella, North Goonyella and Blair Athol branches. Power systems upgrades may be required to match the increased track capacity.
To support the 105 mtpa throughput to Abbot Point full duplication of the Newlands system and the NML will probably be required.

QR Network Pty Ltd
2009 Coal Rail Infrastructure Master Plan
78
In summary for the Goonyella system to support 228 mtpa to Hay Point and 70 mtpa of cross system traffic to Abbot Point, the following projects may be required;
• Full triplication from Coppabella to the ports • Intermediate signalling between Coppabella and Jilalan • Refuge loops retained at critical locations • Power system upgrade • Duplication from Saraji to Dysart • Duplication from Wotonga to Moranbah • Additional holding roads at Coppabella and Jilalan. • A fifth arrival road and unloading loop at DBCT’s new southern stockpile.
For the Newlands system to support 105 mtpa to Abbot Point could require;
• Fourth arrival road and loop at APCT • Full duplication of the Newlands system and NML. • Extra holding roads in Pring yard

QR Network Pty Ltd
2009 Coal Rail Infrastructure Master Plan
79
6.10 NBB Summary
The above scenario results are summarised below in Table 18.
Table 18: NBB Summary of Scenario Expansion Paths
Long Term Planning Scenario
Total Export Hay Point
ports (mtpa)
Total Export via
APCT (mtpa)
Rail Infrastructure Required to Facilitate Expansion
Estimated Cost ($m)
NBB148 (Endorsed projects)
129 19 Goonyella system: • Coppabella – Ingsdon Duplication
$82
NBB154 129 25 Goonyella system: • Concept Study and a Prefeasibility Study to be
undertaken for Goonyella NBB333 tonnage implications
• Concept and prefeasibility works for a new Wotonga Feeder Station
$50
$1.5
NBB195 145 50 Goonyella system: • Duplication of Winchester – Peak Downs
(previously endorsed) • Duplication of the Wotonga – Moranbah North
section (previously endorsed) • A passing loop between Saraji and Dysart
(previously endorsed) • Duplication of the Red Mountain – Winchester
sections • A passing loop in the Bundoora – Yan Yan
section • Additional roads at Coppabella yard • Additional holding roads at Jilalan yard • Relocation and Re-signalling of Black Mountain • ECP Braking to provide for decreasing the train
separation time down the Connor’s Range • New feeder station at Wotonga Newlands system: • Duplication from Durroburra to Euri Creek • Duplication from Nth Collinsville to Briaba • New passing loop at Buckley • New passing loop at Aberdeen • New passing loop at Almoola • New passing loop at Cockool • 2 extra holding roads at Pring yard • A second arrival road and unloading loop at
APCT
TBA

QR Network Pty Ltd
2009 Coal Rail Infrastructure Master Plan
80
Long Term Planning Scenario
Total Export Hay Point
ports (mtpa)
Total Export via
APCT (mtpa)
Rail Infrastructure Required to Facilitate Expansion
Estimated Cost ($m)
NBB266 186 80 Goonyella system: • Triplication of critical sections including the
Connor’s Range and Jilalan to the ports • Third track refuge loops at critical locations • New feeder station at Saraji and the upgrade of
existing feeder stations • Duplication from Ingsdon to Red Mountain • Duplication from Peak Downs to Saraji • Duplication from Moranbah North to Riverside
Junction • Additional holding roads at Coppabella and
Jilalan. • Grade separation of unloading loop entry and exit
roads at HPSCT and DBCT. • Third arrival road and unloading loop at HPSCT • Fourth arrival road and unloading loop at DBCT • Mallawa Wotonga Grade easing works Newlands system: • Third arrival road and unloading loop at APCT • Triplication of Durroburra to Kaili • Extra holding roads in Pring yard • Additional passing loops on the NML • Binbee-Armuna duplication • Colinsville-Almoola duplication • Grade separation at Durroburra Junction
(intersection of Newlands and NCL) • Electrification of NML and Newlands, with up to 5
new traction feeder stations
TBA
NBB333 228 105 Goonyella system: • Full triplication from Coppabella to the ports • Intermediate signalling between Coppabella and
Jilalan • 4th track refuge loops retained at critical locations • Upgrade of the feeder station at Moranbah South • Duplication from Saraji to Dysart • Duplication from Wotonga to Moranbah • Additional holding roads at Coppabella and
Jilalan. • A fifth arrival road and unloading loop at DBCT Newlands system: • Fourth arrival road and loop at APCT • Full duplication of the Newlands system and
NML. • Extra holding roads in Pring yard
TBA
For details concerning the modelling around the initial scenarios go to 12.3 Appendix for Chapter 6 – Northern Bowen Basin.

Coal Rail Infrastructure Master PlanChapter 7
Western System Expansion
7

QR Network Pty Ltd
2009 Coal Rail Infrastructure Master Plan
82
7. Western System 7.1 Introduction
The Western system is located in south and south-western Queensland and primarily services the Clarence-Moreton Basin and Surat Basin coal mines. This system conveys export coal currently from Macalister via Toowoomba through the Brisbane suburban area to the Port of Brisbane, as well as domestic coal to the Swanbank Power Station. Figure 26 below shows a map of the Western system.
Figure 26: Western System Map
Demand forecasts suggest that if there were no rail or port capacity constraints, there would be demand of up to approximately 20 mtpa in the medium term (2012-2014), in the Western system.
The system in its current configuration could reach a possible maximum capacity of railings in excess of 10.8 mtpa of export and approximately 1 mtpa of domestic coal, with an increase in the number of trains operating on the route, a reduction in non-coal services down the Toowoomba Range, improvement in system operations (e.g. infrastructure planning, train operations etc) and infrastructure works. Further increase in capacity is contingent upon items such as:
• Significant capacity enhancements including, but not limited to, signalling upgrades, a minimum of three new passing loops on the Toowoomba range, track strengthening to increase rail reliability and efficiency and additional rail infrastructure through the suburban rail system.
• Expansion of the Port of Brisbane’s coal export facilities.

QR Network Pty Ltd
2009 Coal Rail Infrastructure Master Plan
83
• Future suburban train service requirements under the Passenger Priority Legislation. • Legislative guidelines (e.g. cultural and heritage legislation). • System demand (e.g. contracting of paths from mines to Port). • System operations.
Other ways of increasing capacity in the medium to long term are detailed in 7.6 below. This assumes railings to destinations that are east of Toowoomba.
In the medium term the development of Wiggins Island Coal Export Terminal (WICET) and a Southern Missing Link to the Moura system may provide an alternative corridor for the coal basins located in this region. This Link is proposed to join onto the Moura line at around the township of Banana, proceed south for approximately 200 kilometres and join onto the Wandoan branch line near Wandoan. In this event, significant rail infrastructure enhancements will be needed on the Wandoan branch and the Western line east of Miles. QR Network is working with coal industry players to progress studies to provide a railway of coal level standard between the Western system and the SBR.
7.2 Update on Previous and Committed Projects
A number of network enhancement projects have been undertaken in recent years to enable coal to achieve its current rail capacity. Because of the limited number of train paths available for coal trains on the network due to the infrastructure and legislative requirements, future projects will increasingly include reliance on above rail innovations.
7.3 Planning Scenarios
The Port of Brisbane’s coal handling facility’s current nameplate capacity is approximately 10 mtpa. The port operator has plans to expand its capacity to increase the throughput of coal by increasing its stockpile area to almost one million tonnes in late 2009. Further increases in capacity at the port may depend more on operational logistics improvements in moving the coal through the port rather than on physical infrastructure enhancements.
Table 19 below has been compiled based on the most likely coal tonnage scenarios to expand the Western system,
Table 19: Western System Planning Scenarios
Coal System W7
2009/2010
W8
2010/2011
W10
2011/2012
W14
2015+
W20
2020+
Western 6.8 7.9 10.0 14.9 21.0
Total Domestic 0.5 0.5 0.5 1.0 1.0
Total Export 6.3 7.4 9.5 13.9 20.0
Total Tonnes 6.8 7.9 10.0 14.9 21.0
The scenarios are named using the system name (i.e. Western system is “W”) and the volume of export coal for the forecast period.
7.4 Detailed Tonnage Throughputs Underpinning Planning
Under the system tonnage export amounts shown for the scenarios in Table 19 detailed mine/port combination tonnage amounts have been compiled. These have come from QR Network’s access requests accepted and proposed. Where there has not been any information available, industry experience, liaison and research has been used.

QR Network Pty Ltd
2009 Coal Rail Infrastructure Master Plan
84
The challenge in the Western system has always been to increase the available train paths for coal carrying services through the competing Brisbane metropolitan area, and to do so in a cost effective way.
Coal traffic in the Western system shares the network with a significant number of other traffics, (agriculture, container, general freight). Coal is a minority traffic east of Rosewood where passenger services become the predominant traffic. The challenge for the Western system coal services is made more difficult with QR’s obligations under s. 266 of the Transport Infrastructure Act 1994 (Queensland) in relation to priority to passenger services. In addition, the Queensland Government ‘s $107 billion South East Queensland Infrastructure Plan 2009-2026 (SEQIP) outlines two decades of development for road, transport, water, energy, health, education and community infrastructure. In the plan, in excess of $35 billion has been allocated for a transport package for roads, rail, buses, walking and cycling. SEQIP will create a more efficient, accessible and comprehensive transport system in South East Queensland. The developments proposed to enable rail freight reliability include:
• Corinda to Darra upgrades • Darra to Goodna upgrades • Lytton Junction works including the Murarrie area • Signalling and turnout upgrades
The planned significant expansion of the metropolitan commuter system emanating from the SEQIP and the resultant growth in passenger service levels has increased uncertainty as to the availability of capacity for coal trains through the Brisbane metropolitan area. This is particularly in light of s.266 of the Transport Infrastructure Act and Department of Transport and Main Roads’ communicated requirements under these provisions.
QR Network is involved in joint assessments with Department of Transport and Main Roads of the likely implications of the SEQIP, specifically, the availability of capacity for freight traffic to Fisherman Islands, and the limitations anticipated service levels might create, in terms of both absolute capacity and timing of availability.
Notwithstanding the challenges mentioned above, QR Network continues to plan for additional capacity for train services. In essence, additional train paths can only be provided if the infrastructure is capable of handling the extra gross tonnes, if passing loops are of sufficient length to accommodate at least reasonable sized coal trains, if refuge facilities and the signalling system in the Brisbane metropolitan area are compatible with freight train configurations and if the increased number of trains can operate safely on the network.
The essential infrastructure strategy required to increase export tonnage to 7.4 mtpa (W8) includes strengthening the existing track, replacement of bridges, turnout upgrades and changing of signalling locations/ configurations. To achieve up to 9.5mtpa of export tonnage (W10), and then growth beyond this, a number of works need to be undertaken that will enhance capacity. These are summarised in Table 21 below.
Identified congestion points above maximum train coal path capacity of 7.9 mtpa include:
• The Toowoomba Range. • Sharing of corridors with other traffic through the Brisbane Metropolitan Area. • The execution of SEQIP and other construction works. • Path and resource availability. • The contract term period.
The key corridors encountered by the Western system coal traffic through the Brisbane metropolitan area are:
• From the west, the Ipswich Line to Corinda corridor with freight traffic from the west and passenger traffic to and from Ipswich.
• Corinda to Yeerongpilly corridor with north coast traffic.

QR Network Pty Ltd
2009 Coal Rail Infrastructure Master Plan
85
• Yeerongpilly to Park Road corridor with passenger traffic to and from Gold Coast and Beenleigh and narrow and standard gauge traffic from the south to the port.
• Park Road to Lytton Junction corridor with passenger traffic to and from Cleveland and standard gauge and narrow gauge traffic to and from the port.
In the Brisbane metropolitan area, QR will construct a third track including designing a quadruplicated track from Darra to Corinda, currently scheduled for completion in 2010. This is in preparation for the connection of the Springfield branch line at Darra under the SEQIP programme. Once completed, the third track project benefits will be to improve system reliability and robustness of services on this corridor through a better separation of freight from passenger traffic. This will also enable the increased capacity of freight and passenger services on the line. The challenge to QR during this period is the number of closures required to complete the works while maintaining existing coal tonnages. QR has looked at this closely with its Project Delivery Teams. Whilst maintaining traffic under the existing program of works is difficult, it certainly highlights the constraints to achieve any coal growth through the Brisbane metropolitan area until SEQIP construction is completed, which is not expected before 2025.
7.5 W8
Based on the planning assumptions in Table 19 above, works required to lift the coal tonnage above the 6.8 mtpa to the system train path capacity of up to 7.9 mtpa will need both system strengthening and capacity enhancement works. Short term infrastructure works in excess of $130 million (excluding signalling upgrades) will need to be undertaken.
The construction of improvements at coal loading points (e.g. a balloon loop) improves throughput due to reduced time at loading. The balloon loop eliminates the need to complete locomotive run-around movements and allows for a second train to arrive at the loading location prior to the first train departure. Also, the balloon loop at a coal loading point allows for “Kwik Drop Door” levers to be on the correct side when the train arrives at Fisherman Island and thus eliminates the turning time at the Port of Brisbane. In addition, a bi-directional balloon loop at Fisherman Islands would further enhance the efficiency of the unloading facility.
Track strengthening works are required with the goal of achieving operational reliability and infrastructure maintenance efficiency. These include reducing locations of one hundred percent timber sleeper pattern and eliminating weak areas prior to accepting increased number of coal services. In certain selected sections of track the replacement of wooden sleepers with concrete sleepers, steel re-sleepering, heavier rail replacement, replacing existing 47kg turnouts with 60kg turnouts, welding of rail to reduce the number of mechanical joints and installation of concrete sleepers on tight curves are all aimed at strengthening the track and eliminating weak areas.
Formation strengthening works are required for reliability and to limit wear and tear on the rail infrastructure in this predominant black soil area. This project achieves rehabilitation of problem areas between Gowrie and Macalister.
Elimination of short length timber bridges west of Toowoomba is required to reduce the risk of bridge bolt failures (and subsequent bridge damage) caused by the increase tonnage.
Three passing loops (between Macalister and Miles) are required to be extended marginally to enable passing of 655m trains for the increased tonnage. Currently not all passing loops in between Miles and Toowoomba are of sufficient length to pass 655m coal trains.
Additional holding tracks and crossover at Fisherman Islands are required to enable reliability and train throughput to stow or queue trains before unloading or before the empty train can obtain clearance to depart through the Brisbane metropolitan area.

QR Network Pty Ltd
2009 Coal Rail Infrastructure Master Plan
86
7.6 W10
This scenario is based on the W8 scenario with an additional 2.1mtpa being exported. The domestic railings remain at 0.5 mtpa. For this scenario three additional passing loops on the Toowoomba Range (at Toowoomba, Harlaxton and Ballard) enable more trains to traverse the Toowoomba Range, increasing capacity on that section of track. The extent of the additional capacity provided, at 15 loaded trains per week, is limited to that available through the Brisbane metropolitan area.
Investment in remote controlled signalling increases the train capacity feeding from the west into the Toowoomba Range once capacity limits are reached. Track enhancements are also required.
For this W10 expansion option, several other options have been considered to increase capacity for export coal through the Port of Brisbane. These are summarised in Table 20 below.
Table 20: Western System – Alternative Expansion Options Considered
Project High Level Estimated
Cost ($m)
Expected Sustainable Throughput
Capacity (mtpa) and number of trains per week
Predominant Reason for the Project
Option 1: Implement wagon 20 tonne axle loading capability.
$365 10.4 (78 trains pw)
Increases the carrying capacity of each train by increasing the axle loading.
Option 2: Implement longer trains through introduction of triple header trains.
TBA 10.6 (81 trains pw)
Increases the carrying capacity of each train by increasing the train length from 655m to 940m.
Option 3: Implement close coupled wagons on trains. (Production manufacturing not confirmed). This is an operator only option.
$205 10.6 (80 trains pw)
Increases the carrying capacity of each train by creating a denser 655m long train. Note: this option can only be exercised after civil works for W8 scenario are complete.
QR continues to investigate alternatives to achieve increased capacity in the Western system supply chain at reasonable cost to customers. To this end a study has been commenced using a train with close coupled wagons and a 20 tonne axle load. The purpose is to identify what works need to be undertaken if either of these options were to be introduced being aware of the risk involved.
High level dynamic modelling for this tonnage scenario has been undertaken using the following assumptions:
• Existing rolling stock train payload of 1,940 tonnes • Close coupled rolling stock train payload of 2,610 tonnes • Maintenance possessions of 12 hours on Sundays and 8 hours on Mondays • 3 hours am and 3 hours pm peak exclusions (Tuesday – Friday) for metropolitan area • Net system availability is 182 days per year which also includes a 30% unavailability factor • Path allocation for non-coal traffic (other than suburban passenger) is 54 paths weekly east of
Toowoomba into various off loading points in the Brisbane metropolitan area
The results of the high level modelling indicate that 10 mtpa can be achieved. One of these scenarios includes the following below rail infrastructure enhancements and above rail operational change:

QR Network Pty Ltd
2009 Coal Rail Infrastructure Master Plan
87
• Reducing path separation in loaded direction from 60 minutes to 45 minutes from Jondaryan eastwards.
• Using 13 trains each employing close coupled wagons instead of the normal wagons. • new passing loops at Harlaxton, Ballard, Toowoomba and between Holmes and Murphy’s Creek. • Enhance mine loadout track infrastructure to balloon loops capable of holding 2 trains clear of the
main line. • Possible additional dock road at Rosewood for Citytrain operations to clear the main line. • A new crossover near 39.2 kilometre mark on main line and a new crossover at Ipswich station. • Duplication of dual gauge line Yeerongpilly to Dutton Park and Cannon Hill to Lytton Junction. • RCS signalling from Toowoomba to Malu.
It should be noted that more modelling needs to be undertaken. This analysis is a high level assessment of likely additional investments required. It does not include any track, formation, loadout or unloading facilities to maintain the weighted average system cycle time assumed in the analysis.
7.7 W14
This scenario is founded on the W10 scenario with an additional 4.4 mtpa of Western system coal exported via the Port of Brisbane. Domestic coal (railed to Swanbank Power Station) may also increase by an added 0.5 mtpa.
High level modelling of the Western system rail network has identified that throughput tonnages on the rail network of approximately 15mtpa can be achieved by the introduction of a number of below rail and above rail options. These enhancements include:
• The assumptions mentioned in 7.6 “W10” above. • Reducing path separation from 60 minutes to 30 minutes. • 21 trains in the system with approximately half of these being close coupled wagon trains. • New crossing of the Toowoomba Range (with a single long tunnel) and a new crossing of the Little
Liverpool Range (around Yarongmula). • Enhancements at Fisherman Islands to support a 30 minute arrival pattern. • Full duplication of dual gauge line from Yeerongpilly to Fisherman Islands.
As with the scenario above, only high level modelling has been undertaken to provide an idea as to what improvements might be needed to produce the coal tonnage to be railed under this scenario. Further modelling work will need to be undertaken in the future to more clearly define the most cost effective enhancements.
7.8 W20
This scenario is based on what might be possible over and above the W14 scenario with increases of 5 to 6 mtpa railing from possibly new Clarence–Moreton Basin mines and new Surat Basin mines. Above and below rail enhancements to achieve this level of tonnage throughput would include the enhancements mentioned in W14 scenario above together with an increase in the number of trains on the coal network to approximately 32 with nearly half of these to be close couple wagon trains. Other significant infrastructure enhancements (e.g. signalling, re-sleepering, reduction on maintenance window, passing loops/ duplications etc) are also required for this tonnage level of coal to be railed.
This scenario has been included only to provide a sense of what might be possible on the network. Obviously much work in the future needs to be accomplished, in the modelling, construction and political spheres for this type of scenario to occur.

QR Network Pty Ltd
2009 Coal Rail Infrastructure Master Plan
88
7.9 Western System Summary
A summary of the expansion works that have been identified as being required under each scenario is summarised in Table 21 below.
Table 21: Western System Summary of Rail Infrastructure Enhancement Scenarios
Long Term Planning Scenario
Total Export via POB (mtpa)
Total Export
and Domestic
(mtpa)
Rail Infrastructure Required to Facilitate Expansion
Estimated Cost ($m)
W7.8 • Construction of a balloon loop at a coal loading points
• Track strengthening works, incorporating: o Concrete and steel re-sleepering o Heavier rail replacement o Replacing turnouts with heavier ones o Welding into long welded rail sections
• Formation strengthening works Gowrie to Macalister
• Elimination of short length timber bridges • Lengthening passing loops to accommodate
655m trains • Additional holding tracks and crossover at
Fisherman’s Island to stow or queue trains
> $130
W10 • Construct additional passing loops on the Toowoomba Range (655m trains)
• Implement Remote Control Signalling from Toowoomba to Malu
TBA
W14 • New Little Liverpool Range crossing (around Yarongmula),
• New Toowoomba Range crossing from Helidon to Toowoomba,
• Duplication of dual gauge track Yeerongpilly to Fisherman Islands,
TBA
W20 • Significant infrastructure enhancements including:
o Signalling o Re-sleepering o Passing loops/ duplications
TBA

Coal Rail Infrastructure Master PlanChapter 8
Asset Replacement Strategy
8

QR Network Pty Ltd
2009 Coal Rail Infrastructure Master Plan
90
8. Asset Replacement Strategy QR Network’s capital expenditure program is designed to maintain and increase the reliability and efficiency of the rail network. The program includes a variety of projects aimed at replacing and/or repairing life expired assets to maintain safety and system reliability and increase capacity to meet additional forecasted tonnage growth. Under this program, the asset replacement strategy focuses on those capital projects directly aimed at replacing and/or repairing life expired assets.
Under the asset replacement strategy, the primary aim is to maintain operational performance within the coal systems through capital expenditure focused on maintaining safety, reliability and efficiency. This will also include the necessity for future upgrades as assets reach the end of their service lives or become technologically redundant.
Capital expenditure to maintain safety, reliability and efficiency is designed to meet industry’s expectation for cycle time performance and improve overall network reliability. Therefore the short to mid-term focus is on achieving and maintaining heavy axle loads at maximum operational speeds, whilst the long term focus is to lower network operating costs through efficient work practices. Therefore, QR Network strives to find the most appropriate mix of maintenance and capital expenditure in order to ensure capacity, improve operational efficiency and safety, whilst satisfying customer demand.
QR Network applies life-cycle cost analyses to investment decisions involving asset replacement. These decisions involve trade-offs between increase in recurring maintenance, resulting track outages and upfront capital investment in modern equivalent infrastructure. These decisions also involve trade-offs between high and low capital investment options, each with different implications for ongoing maintenance, future network growth and capacity implications.
Asset lives throughout the coal systems vary depending on the technology involved. Traditional asset forms such as that in the track asset continue to have relatively long service lives. Current initiatives within the plan include the replacement of the original 53kg rail and remaining timber sleepers located on branches or balloon loops and replacing life expired track turnouts and points. These strategies are driven by the deteriorating serviceability of the existing assets and the high forecast maintenance costs for defect removal in case of the rail and timber sleeper availability and price for like replacement of the existing asset. The consequence of a do nothing strategy are rising maintenance costs, higher operational derailment risk and reduced serviceability/reliability of the asset reducing throughput capacities.
The decision path for the newer technology trackside system assets of signalling and telecommunications tend to be driven by technical obsolescence rather than condition based serviceability. In general technology based assets have significantly shorter lives than traditional asset forms. Generally acceptable industry standards indicate that at best a 10-15 year operational life can be expected before technological evolvement makes the asset obsolete and no longer supported by manufacture’s spare parts or service. Some life extension can be achieved through component re-engineering however this tends to be expensive due to development costs being totally funded by QR. Asset failure has a significant affect on train delay with fall back safe working systems being both time and labour intensive. For this reason asset replacements are based on discussions with equipment suppliers on spare parts availability. Replacement technology sometimes provides the ability to extend the platform lives of other assets. This has been especially the case with optic fibre where degrading fibre condition has been able to be recovered with the replacement of aging signal interface equipment.
In line with QR Network’s Zero Harm philosophy assets are also upgraded for the benefit of safe working. For example, the upgrade of signalling to LED bulbs allows greater visibility of signals and reduces the risk of collision and derailment.
Power supply and overhead distribution systems are a unique element within the coal system assets. Significant operational delays and capacity restrictions result from any asset failure related incident. Failure trending analysis has been performed to identify high risk componentry for a pre-emptive change-out strategy.

QR Network Pty Ltd
2009 Coal Rail Infrastructure Master Plan
91
Asset replacement may be unique to individual coal systems, across all coal systems or across the entire QR network. For those projects that are QR system wide, an allocation of forecast cost that is directly attributable to the Central Queensland Coal System has been made in accordance with QR Network’s Costing Manual.
Table 22 below provides, for information purposes only, an overview of the forecast asset replacement expenditure for the next five years.
Table 22: Asset Replacement Expenditure
2009/10 2010/11 2011/12 2012/13 2013/14
Blackwater 6,926,000 7,425,000 2,797,500 552,500 5,000,000
Goonyella 9,903,000 9,617,500 4,965,000 4,475,000 11,212,500
Moura 5,500,000 5,000,000
Newlands 4,000,000 14,000,000
CQCR Wide 21,158,000 31,674,000 17,900,000 19,350,000 14,230,000
QR System Wide 1,753,600 1,444,400 4,050,400 1,482,800 1,677,600
Telecommunications 6,781,000 4,562,800 5,601,600 5,006,000 3,000,000
TOTAL 56,021,600 68,723,700 40,314,500 30,866,300 35,120,100

Coal Rail Infrastructure Master PlanChapter 9
Projects for Endorsement
9

QR Network Pty Ltd
2009 Coal Rail Infrastructure Master Plan
93
9. Projects for Endorsement There are four projects being proposed for endorsement:
• Blackwater System Concept and Prefeasibility Study ($11 million) • Goonyella System Concept and Prefeasibility Study ($50 million) • Callemondah Feeder Station renewal / upgrade prefeasibility ($1.5 million) • Wotonga Feeder Station prefeasibility ($1.5 million)
The scopes of these projects are provided below.
9.1 Blackwater System Concept and Prefeasibility Study
The triplication of the North Coast Line (NCL) between Aldoga and Rocklands was originally envisaged under the SBB 120 scenario in the 2008 Coal Rail Infrastructure Master Plan based on the tonnage volumes of that scenario. Recent analysis of data suggests there may be potential for initial WICET tonnes to come predominantly from the Blackwater system. This may result in tonnage increments going well beyond the current projection of 68 mtpa and potentially up to 120 mtpa.
A combination of above rail and below rail solutions is proposed to be considered to provide additional capacity throughput on the Blackwater system. At present there has been very little study done towards determining these solutions. Some options that need further investigations are indicated below:
• All trains using heavier wagons (106t) on the Blackwater system, resulting in an increase in each train’s carrying capacity from around 7,000t to around 8,000t.
• Use of longer train consists for trains using the Wiggins Island Coal Terminal. Possible use of Goonyella or even Surat length consists to be investigated. This would require review of existing track grades.
• Use of Diesel consists vs. Electric consists. • Intermediate signals on longer sections to reduce train separation. • Power systems upgrades to meet additional capacity requirements. • Additional or longer passing loops, loop extensions and holding roads on the Blackwater and lower
Goonyella systems. • Formation investigations. • NCL triplication between Aldoga and Rocklands.
During the Concept phase, it is proposed to investigate a number of alternatives as well as develop high level operational plans and capacity modelling to understand the use of heavier and longer train consists and the impact on below rail infrastructure upgrades and their timing. The next step then would be to proceed with development of a limited number of alternatives during the Prefeasibility study on the rail infrastructure upgrades indentified.
Based on very preliminary checks it would appear that the NCL triplication between Aldoga and Rocklands, a critical and highly sensitive component of the upgrades, could perhaps be deferred to the later stages of the WICET – subject to coal tonnage increase on the Blackwater system. This may be the case if some or all of the above rail solutions (those identified above and possibly other solutions identified through the study phase) were implemented.
However, in the event that these identified rail solutions were not feasible (for various reasons) the triplication of the NCL between Aldoga and Rocklands is likely to be brought forward to support the additional Blackwater system coal.
QR Network now proposes to carry out Concept and Prefeasibility Stage investigations as follows:

QR Network Pty Ltd
2009 Coal Rail Infrastructure Master Plan
94
9.1.1 NCL Triplication between Aldoga & Rocklands (Concept Study Phase)
• Aerial Survey & Mapping. • Fatal Flaw Studies (Options Analysis). • Desktop Engineering Investigations & Field Inspections. • Concept Engineering Design including Schematic Plans, Line Diagrams, etc. • Desktop Environmental Assessment including Initial Field Investigations, Identification of Major Issues
and High Level Planning Approval requirements. • Desktop Cultural Heritage & Native Title Studies & Initial Consultations. • Desktop Property Assessment including Property Searches, Initial Landowner Consultations. • Initial Local Community & Government Agency Consultations. • Initial Operational Philosophy & Static Capacity Planning. • High Level Capex Estimates (± 50%). • Funding Requirement for future stages.
9.1.2 Concept & Prefeasibility Study for rest of Blackwater system for proposed expansion beyond 68 mtpa
• Preliminary capacity modelling to determine rail infrastructure upgrade options to meet the additional coal demand.
• Preliminary engineering design (civil, track, signalling, overheads, power systems, telecoms, etc.) of the preferred options including connection to the NCL at Rocklands and a potential bypass.
• Aerial survey and mapping of the corridor. • Preliminary engineering investigations such as geotechnical, hydrological, survey, etc. to provide an
indication of existing conditions. • Environmental investigation and assessment to provide input into rail alignment design and determine
planning approval requirements. • Cultural Heritage surveys, Traditional Owner engagement and draft Cultural Heritage Management
Plans. • Identification of additional land requirements and initial consultation with landowners including
identification of Native Title issues. • Commence community engagement and agency consultation (significant interaction anticipated in
populated areas). • Interaction with Government agencies (Main Roads, Councils) on road / rail interface issues. • Preliminary level crossing assessments to determine impact of additional coal traffic on existing level /
occupational crossings. • Preliminary Operation Philosophy and Train Operational Plan. • Capital Cost estimates (± 25% accuracy).
These estimates are based on existing corridor expansion and do not allow for investigation of new green field expansions (with the exception of concept level investigations of a possible Rocklands bypass).
The proposed Concept and Prefeasibility Studies along with the already endorsed studies for the WICET project will provide a cohesive coverage of works for the increased coal tonnages being railed on the Blackwater system to the new Wiggins Island Coal Export Terminal.
QR Network now seeks the industry’s endorsement for the underwriting of costs of these works.
The estimated overall cost is $11.0 million.
The cost breakdown is shown in Table 23 below.

QR Network Pty Ltd
2009 Coal Rail Infrastructure Master Plan
95
Table 23: Proposed Cost of Blackwater System Expansion Study (Concept and Prefeasibility)
Description Total
Engineering Investigations $ 6,800,000
Environmental, Cultural Heritage, Property Investigations $ 1,700,000
Project Management, Operational Planning & Estimates $ 1,100,000
Sub-total $ 9,600,000
Contingencies $ 1,400,000
Total $ 11,000,000
Figure 27 below depicts in graphical form the extent of the possible areas that the studies will cover.

QR Network Pty Ltd
2009 Coal Rail Infrastructure Master Plan
96
Figure 27: Map of Possible Scope for Blackwater Concept and Prefeasibility Studies
Blackwater

QR Network Pty Ltd
2009 Coal Rail Infrastructure Master Plan
97
9.2 Goonyella System Concept and Prefeasibility Study
Dalrymple Bay Coal Terminal (DBCT) and Hay Point Services Coal Terminal (HPSCT) have completed expansions to increase capacity to a total of 129 mtpa in July 2009. QR Network has already secured industry endorsement for additional infrastructure required (Coppabella – Ingsdon duplication) through the 2008 Coal Rail Infrastructure Master Plan. The construction of this infrastructure is currently being progressed and expected to be commissioned in August 2010.
DBCT and HPSCT are now progressing with preliminary investigations on further expanding the combined throughput capacity to 166 mtpa by 2014 and 228 mtpa by 2016. The tonnage expansion profile is given in Table 24 below:
Table 24: Forecast Total Export Tonnage for Hay Point Coal Terminals.
HPSCT DBCT Possible Total Export Tonnage Possible Timing
44 85 129 From Mid 2009
55 111 166 2014
75 153 228 2016
The port expansions will involve construction of additional balloon loops at both coal terminals with possible additional roads within the port areas. QR Network has been approached by both terminals with regard to its plan for rail infrastructure expansion to meet the additional coal throughput.
QR Network now proposes to carry out Concept and Prefeasibility Stage investigations for the Goonyella system. The scope of work will generally cover the following works:
9.2.1 Coppabella – DBCT / HPSCT (Up to Prefeasibility Stage)
9.2.1.1 Concept
• Initial Operational Philosophy and Static Capacity Planning. • Aerial Survey & Mapping. • Fatal Flaw Studies (Options Analysis). • Desktop Engineering Investigations and Field Inspections. • Concept Engineering Design including Schematic Plans, Line Diagrams, etc. • Desktop Environmental Assessment including Initial Field Investigations, Identification of Major Issues
and High Level Planning Approval requirements. • Desktop Cultural Heritage & Native Title Studies and Initial Consultations. • Desktop Property Assessment including Property Searches, Initial Landowner Consultations. • Initial Local Community and Govt Agency Consultations. • Other infrastructure expansion options such as Goonyella corridor west of Coppabella. • High Level Capex Estimates (± 50%). • Funding Requirement for future stages.
9.2.1.2 Prefeasibility
• Preliminary Operational Philosophy, and Train Operational Plan. • Dynamic capacity modelling to determine required rail infrastructure upgrade options to meet the
additional coal demand. • Preliminary engineering design (civil, track, signalling, overheads, power systems, telecoms, etc) of
the recommended options including triplication of Connors Range.

QR Network Pty Ltd
2009 Coal Rail Infrastructure Master Plan
98
• Preliminary engineering investigations such as geotechnical, hydrological, survey, etc. to provide an indication of existing conditions.
• Environmental investigation and assessment to provide input into rail alignment design and determine planning approval requirements.
• Cultural Heritage surveys, Traditional Owner engagement and draft Cultural heritage Management Plans.
• Identification of additional land requirements and initial consultation with landowners including identification of Native Title issues.
• Preliminary level crossing assessments to determine impact of additional coal traffic on existing level / occupational crossings.
• Capital Cost estimates (± 25% accuracy). • Funding Requirement for future stages.
9.2.2 West of Coppabella Upgrades (Up to Prefeasibility Stage)
9.2.2.1 Concept
• Initial Operational Philosophy and Static Capacity Planning. • Aerial Survey & Mapping. • Fatal Flaw Studies (Options Analysis). • Desktop Engineering Investigations and Field Inspections. • Concept Engineering Design including Schematic Plans, Line Diagrams, etc. • Desktop Environmental Assessment including Initial Field Investigations, Identification of Major Issues
and High Level Planning Approval requirements. • Desktop Cultural Heritage & Native Title Studies and Initial Consultations. • Desktop Property Assessment including Property Searches, Initial Landowner Consultations. • Initial Local Community and Govt Agency Consultations. • Other infrastructure expansion options such as rail infrastructure upgrades around Jilalan yard and the
coal terminals. • High Level Capex Estimates (± 50%). • Funding Requirement for future stages.
9.2.2.2 Prefeasibility
• Preliminary Operational Philosophy, and Train Operational Plan. • Dynamic capacity modelling to determine required rail infrastructure upgrade options to meet the
additional coal demand. • Preliminary engineering design (civil, track, signalling, overheads, power systems, telecoms, etc) of
the recommended options including triplication of Connors Range. • Preliminary engineering investigations such as geotechnical, hydrological, survey, etc. to provide an
indication of existing conditions. • Environmental investigation and assessment to provide input into rail alignment design and determine
planning approval requirements. • Cultural Heritage surveys, Traditional Owner engagement and draft Cultural heritage Management
Plans. • Identification of additional land requirements and initial consultation with landowners including
identification of Native Title issues. • Power systems study. • Preliminary level crossing assessments to determine impact of additional coal traffic on existing level /
occupational crossings. • Capital Cost estimates (± 25% accuracy). • Funding Requirement for future stages.
These estimates are based on existing corridor expansion and do not allow for investigation of new green field expansions.
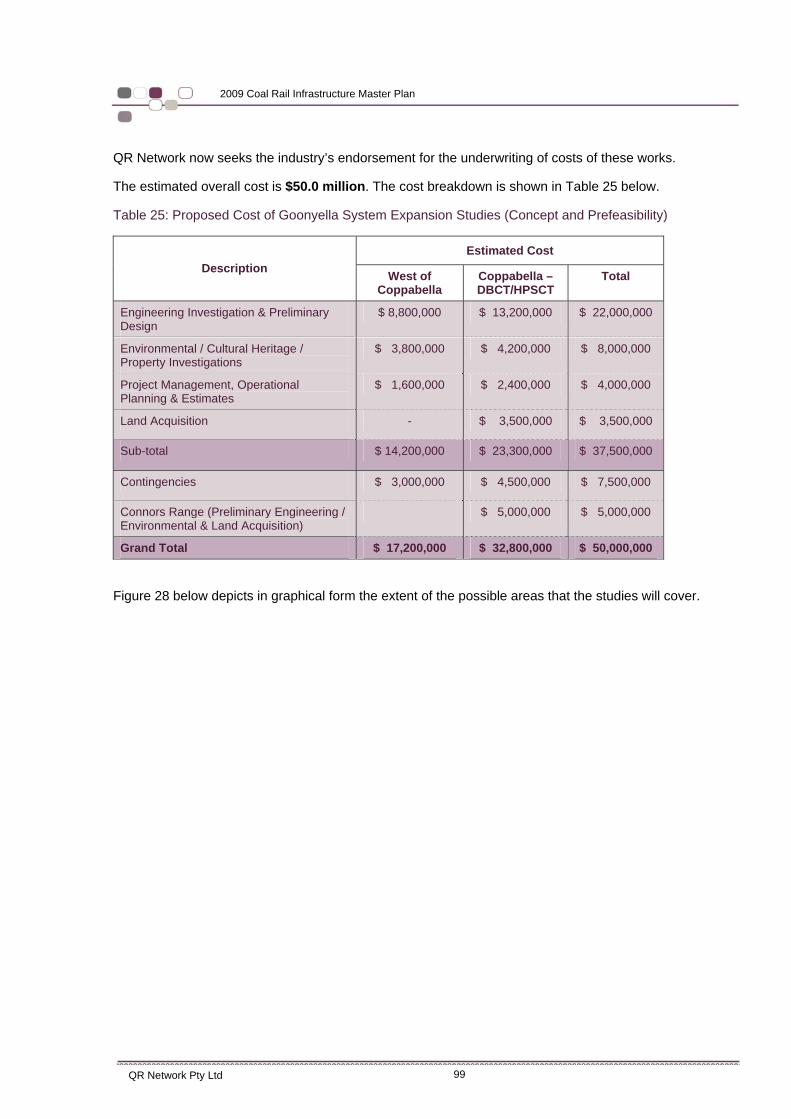
QR Network Pty Ltd
2009 Coal Rail Infrastructure Master Plan
99
QR Network now seeks the industry’s endorsement for the underwriting of costs of these works.
The estimated overall cost is $50.0 million. The cost breakdown is shown in Table 25 below.
Table 25: Proposed Cost of Goonyella System Expansion Studies (Concept and Prefeasibility)
Estimated Cost Description West of
Coppabella Coppabella – DBCT/HPSCT
Total
Engineering Investigation & Preliminary Design
$ 8,800,000 $ 13,200,000 $ 22,000,000
Environmental / Cultural Heritage / Property Investigations
$ 3,800,000 $ 4,200,000 $ 8,000,000
Project Management, Operational Planning & Estimates
$ 1,600,000 $ 2,400,000 $ 4,000,000
Land Acquisition - $ 3,500,000 $ 3,500,000
Sub-total $ 14,200,000 $ 23,300,000 $ 37,500,000
Contingencies $ 3,000,000 $ 4,500,000 $ 7,500,000
Connors Range (Preliminary Engineering / Environmental & Land Acquisition)
$ 5,000,000 $ 5,000,000
Grand Total $ 17,200,000 $ 32,800,000 $ 50,000,000
Figure 28 below depicts in graphical form the extent of the possible areas that the studies will cover.

QR Network Pty Ltd
2009 Coal Rail Infrastructure Master Plan
100
Figure 28: Map of Possible Scope for Goonyella Concept and Prefeasibility Studies
Goonyella

QR Network Pty Ltd
2009 Coal Rail Infrastructure Master Plan
101
9.3 Callemondah Feeder Station renewal / upgrade prefeasibility
This includes prefeasibility work for a new/ upgrade feeder station works at the Callemondah Feeder Station. The estimated amount for this project is $1.5 million.
Refer to Working Paper 4.6 for the detailed scope and justification for this proposed project.
9.4 Wotonga Feeder Station prefeasibility
This includes prefeasibility work for a new feeder station at Wotonga. The estimated amount for the project is $1.5 million.
Refer to Working Paper 4.6 for the detailed scope and justification for this proposed project

Coal Rail Infrastructure Master PlanChapter 10
Glossary of Terms
10

QR Network Pty Ltd
2009 Coal Rail Infrastructure Master Plan
103
10. Glossary of Terms
Word/ Phrase Description Above rail The segment of the rail service that comprises the operation of trains.
Absolute Capacity The maximum number of Standard Train Paths that can be scheduled over a section, line segment or rail corridor within a specified time period.
Access The non-exclusive utilisation of a specified section of rail infrastructure for the purposes of operating train services.
Allowance for system variability
The allowance needed to reflect the impact of a variety of events on the nominal capacity, in arriving at a realistic determination of capacity in the day to day operating environment.
Available Capacity The number of Standard Train Paths that can be scheduled over a particular line segment for a specified time period, once contracted train paths, infrastructure maintenance and construction requirements and operational reliability are considered.
Ballast The granular material placed around and between the sleeper and the formation to hold the track to top and line, to provide lateral stability and to assist in drainage of the track and load spreading from the rail and sleepers to the formation, so that the formation is not overstressed.
For a Train Service travelling between its origin and destination, the sum of:
(i) the relevant nominated Section Running Times (in the direction of travel) as specified in the Train Service Entitlement;
(ii) identified Below Rail Delays for that Train Service;
(iii) time taken in crossing other Trains to the extent that such time is not contributed to by Above Rail causes or Force Majeure Events or otherwise included in Paragraph (i) of this definition; and
Below Rail Transit Time (BRTT)
(iv) delays due to Operational Constraints directly caused by the activities of QR in maintaining the Rail Infrastructure or due to a fault or deficiency in the Rail Infrastructure provided such delays are not contributed to by Above Rail causes or Force Majeure Events or otherwise included in Paragraph (ii) or (iii) of this definition.
Below rail services The activities associated with the provision and management of Rail Infrastructure, including the construction, maintenance and renewal of Rail Infrastructure assets, and the network management services required for the safe operation of Train Services on the Rail Infrastructure, including Train Control Services and the implementation of Safe working Procedures and “Below Rail” has a similar meaning.
Brownfield A site/location which has previous development which needs to be redeveloped.
Cant The cross level or superelevation of the track.
Capacity The capability of a specified section of Rail Infrastructure to accommodate Train Services within a specified time period after providing for QR’s reasonable requirements for the exclusive utilisation of that specified section of Rail Infrastructure for the purposes of performing activities associated with the repair or enhancement of the Rail Infrastructure, including the operation of work Trains.
Capacity analysis An assessment of the extent to which a specified section of Rail Infrastructure has Available Capacity and whether that Available Capacity is sufficient for the proposed Access Rights and, if the Available Capacity is not sufficient for the proposed Access Rights, an assessment of Rail Infrastructure expansion or other Capacity enhancement required to meet those proposed Access Rights.

QR Network Pty Ltd
2009 Coal Rail Infrastructure Master Plan
104
Word/ Phrase Description Cluster A group of mines in close proximity to each other sharing the same reference
tariff.
coal fouling/coal contamination/coal spillage
The contamination of ballast from coal dropping onto the track from coal rolling stock whether loading, in transit, unloading or in an incident.
Coal supply chain The coal supply chain encompasses all activities associated with the flow and transformation of coal from the extraction stage, through to the end user, as well as the associated information flows.
Cycle time The total time taken by a train once ready to depart from the depot; to travel to the mine, load, travel to the port, unload and arrive back at the depot. It includes all planned and unplanned dwells and delays.
Dewirement An incident where the overhead electrical line becomes separated from its supporting structure.
Direct Traffic Control (DTC) A system of safe working where train movements are governed by instructions contained in DTC Authorities issued by the Train Controller to a Train Driver. In DTC Territory the track is divided into sections known as DTC Blocks, the entry to which is identified by line-side Block Limit Boards. A DTC Authority gives a train possession of the block/s up to the nominated Block Limit Board.
Free on board (FOB) The title of the goods is transferred at the shipping point and the buyer is responsible for all risk and cost once the goods pass the ships rail.
Grade The steepness of the track structure expressed in 1 metre height gained for X metres travelled.
Greenfield A location for development where there has not previously been any development previously.
Haul distance The distance from origin to destination for a relevant train service.
Headways The amount of time that elapses between two trains passing the same point travelling in the same direction on a given route.
Load time The time from commencement of loading when the first coal is loaded in the first wagon or into the shipping vessel to completion of loading when the last coal is loaded in the last wagon or into the shipping vessel.
Maximum Sustainable Capacity
The most that the system can put through on a sustainable basis (weekly/monthly peak)
Monumenting The activity of placing and identifying an object such as a post, mast or stone in the ground so as to mark a position. These markers assist in making measurements to monitor the track and other maintenance activities.
Nominal capacity The throughput the system would be able to produce from the below rail infrastructure if it performed as simulated in an even manner, assuming a given number of trains.
Planimate™ Planimate is a discrete event simulation and end user application development platform developed by InterDynamics and used by QR to develop a capacity modelling application which simulates the running of trains on the rail network in accordance with the infrastructure and business rules associated with that network.
Rail grinding A maintenance process of mechanically grinding the rail to maintain its profile.
Rated capacity The estimated throughput that can be achieved on average by the system from the below rail infrastructure, assuming a given number of trains.
Reference Capacity Model (RCM)
QR’s in-house capacity modelling application based on the Planimate platform.
Remote Control Signalling (RCS)
A system of safe working where train movements are governed by the aspects displayed in colour light signals which are controlled from a remote location (or

QR Network Pty Ltd
2009 Coal Rail Infrastructure Master Plan
105
Word/ Phrase Description from designated local control panels), and by the passage of trains.
Rolling stock Locomotives, carriages, wagons, rail cars, rail motors, light rail vehicles, light inspection vehicles, rail/road vehicles, trolleys and any other vehicle that operates on or uses the track.
Section running times The time period measured from the time a Train Service passes the signal controlling entry into a track section between two relevant specified locations on the Nominated Network to the time the Train Service arrives at the signal controlling entry into the next track section between two relevant specified locations on the Nominated Network, and does not include an allowance for Planned Dwell Times.
Standard Train Path A train path consumed by a train service conforming to a certain criteria, including carrying a specified commodity type, operating between specified geographical areas and conforming to specified technical and operational characteristics.
Stowage The short-term storage of Trains on the Nominated Network at locations specified by QR but does not include storage of individual items of Rolling stock or the long-term storage of Trains.
System cycle time The weighted average Cycle Time for a specific system.
Time at mine Total time a coal train spends at the loading facilities at the mine, comprising time from when the train presents itself for loading to the first coal being loaded in the first wagon, load time, and time from when last coal is loaded in the last wagon and train departs.
Time at port or destination Total time a coal train spends at the unloading facilities of the port or destination terminal, comprising time from when the train presents itself for unloading to the first coal falls out of first wagon, unload time, and time from when last coal falls out of last wagon and train departs.
Train length The total length in metres of a train including the locomotives. For the purposes of comparison with the length of crossing loops, an addition of 1% (1 metre for every 100 metres) shall be allowed to the calculated length of the train to allow for train stretching.
Train path An identified time period on any corridor that enables the passage of a train or other on-track vehicles.
Train payload The total net tonnage hauled by a train.
Train separation The spacing of train according to their speed, braking capability and track gradient to ensure a safe distance between trains.
Train/ train consist A configuration of rolling stock, comprising locomotives and wagons.
Train service The running of a train between a specified origin and destination by an operator in accordance with a train service description.
Transit Time The Cycle Time of a train service less the Time at Mine and Time at Port of that train service.
Universal Traffic Control (UTC)
A PC based train control supervisory system that provides the means to remotely control train movements over a large area and provide management and train users with real time train related information.
Unload time The time from commencement of unloading (when the first coal falls out of the first wagon) to completion of unloading (when the last coal falls out of the last wagon and the train clears the unloading pit).

Coal Rail Infrastructure Master PlanChapter 11
Abbreviations
11

QR Network Pty Ltd
2009 Coal Rail Infrastructure Master Plan
107
11. Abbreviations
Abbreviation Expansion ALCAM Australian Level Crossing Assessment Model
ABARE Australian Bureau of Agriculture and Resource Economics
APCT Abbot Point Coal Terminal
BMA BHP Billiton Mitsubishi Alliance
BPCT Barney Point Coal Terminal
BRTT Below Rail Transit Time
CRIMP Coal Rail Infrastructure Master Plan
DTC Direct Traffic Control
DBCT Dalrymple Bay Coal Terminal
DORC Depreciated Optimised Replacement Cost
ECP Electronically Controlled Pneumatic
EIS Environmental Impact Statement
FOB free-on-board
GPC Gladstone Port Corporation
HPSCT Hay Point Services Coal Terminal
JIT Just-in-time
KPI Key Performance Indicator
Mt million tonnes
Mtpa million tonnes per annum
NBB Northern Bowen Basin
NML Northern Missing Link
PCQ Ports Corporation of Queensland
POB Port of Brisbane
QAL Queensland Alumina Limited
QCA Queensland Competition Authority
QR QR Limited
RCM Reference Capacity Model
RCS Remote Control Signalling
RGTCT RG Tanna Coal Terminal
SBB Southern Bowen Basin
SBR Surat Basin Railway
SCADA Supervisory Control and Data Acquisition
SEQ South East Queensland
SEQIP South East Queensland Infrastructure Program

QR Network Pty Ltd
2009 Coal Rail Infrastructure Master Plan
108
Abbreviation Expansion SML Southern Missing Link
SRT Sectional running time
TAL Tonne Axle Load
UTC Universal Traffic Control
WACC Weighted Average Cost of Capital
WICET Wiggins Island Coal Export Terminal

Coal Rail Infrastructure Master PlanChapter 12
Appendices
12

QR Network Pty Ltd
2009 Coal Rail Infrastructure Master Plan
110
12. Appendices 12.1 Modelling
12.1.1 Static Modelling
For the rail network to be able to withstand the expected variability in the supply chain, critical sections require a given tolerance level for congestion. The tolerance level assumed is for no more than 75% utilisation of the network. If this level is exceeded the network will become a constraint on the ability of the supply chain to maximise utilisation of the critical assets, being the coal export terminals7.
Static modelling endeavours to highlight the sections of the network that are approaching the congestion threshold of 75% of track utilisation. Track utilisation capacity was determined by first calculating for each track section the number of available paths8 and comparing this with the required number of paths9 to haul the tonnage of this scenario. This provides a snapshot percentage utilisation figure for each section.
Sections that are identified as approaching the congestion threshold are the main focus for dynamic modelling to determine the exact benefits to be achieved if infrastructure enhancements are necessary and are implemented.
The expected track utilisation is modelled by QR Network using the spreadsheet model called the Capacity Planning Utilisation Model (CPUM). It is the CPUM that is being referred to when the term “static modelling” is mentioned in this chapter.
It should be noted that there are some limitations with the CPUM static modelling. Particular factors that are not analysed and may impact on capacity are:
• Cycle times. • Traffic interaction / priorities. • Unplanned/ emergency maintenance activities (Planned maintenance activities are included in the
reduction factor). • Capacity of Depots, Ports, Mines. • Required activities at different locations (E.g. Crew change, Yard Run, Roll-by, Terminal
Examinations). • Differences between modelled geography and actual.
While static modelling provides an indication of what track utilisation might be and a guide as to what the possible priority order of expansion projects are, it does not take into consideration other potential solutions or the interdependencies and multiple dynamics of the coal supply chain as a whole. Additional and more comprehensive modelling results are presented as a consequence of using QR Network’s Dynamic Capacity Model.
In each of the tables in this chapter:
• Southern Bowen Basin - Table 26, Table 27, Table 28 and Table 29 and
• Northern Bowen Basin - Table 30, Table 31, Table 32 and Table 33,
7 Queuing theory describes how a system behaves under the impacts of congestion, and the general observation is that queuing delays rise exponentially once the system is operating above 75% of its maximum design capacity. This is described further in WP2 – Designing and Managing Capacity on Queensland Coal Systems, page 6.
8 Available paths is the number of theoretically available paths less any consumed by maintenance activities, background trains etc.
9 Number of individual (empty and loaded) trains required to travel over each section to haul the tonnages in each scenario

QR Network Pty Ltd
2009 Coal Rail Infrastructure Master Plan
111
the “% Utilisation” column indicates what sections might need enhancement and provides an indication of what priority each section has for infrastructure enhancement. A cell with the red percentage number indicates that the utilisation for that section has breached the 75% congestion threshold. A cell with an orange percentage number shows that the utilisation is approaching the congestion threshold and action must be undertaken to address this before it progresses beyond the threshold. A cell with the yellow percentage number indicates a potential utilisation that if tonnage throughput increases will provide a congestion point.
12.1.2 Dynamic Modelling
Dynamic capacity analysis is carried out (using the Central Queensland Reference Capacity Model (CQRCM), which runs on the Planimate™ platform) to further analyse those possible below rail enhancements identified in the static analysis and to test operating changes and investment options. The main variables are below rail infrastructure, number of trains and related section running time, mine and port tonnage profile, load times, unload times and the various planned system outages and delay factors.
The aim of the dynamic modelling is to simulate network operating conditions as realistically as possible and therefore provide outputs that are realistically comparable.
To do this, assumed below rail enhancements are added to the “base case” QR Network infrastructure to form the below rail enhancement required in meeting the demand. The base case incorporates the present infrastructure together with those infrastructure projects endorsed by the previous Coal Rail Infrastructure Master Plan and approved for construction by the QR Board.

QR Network Pty Ltd
2009 Coal Rail Infrastructure Master Plan
112
12.2 Appendix for Chapter 5 - Southern Bowen Basin
12.2.1 Coal System Operational Characteristics
The operational characteristics that support and guide the relevant coal systems and that are used to form the basis of the assumptions employed in the QR Network static and dynamic modelling are presented below.
12.2.1.1 Blackwater System
• Train Dispatch – Rules of Operation
⎯ The Blackwater system will assume an even railings operation over a 52 weeks simulation period.
⎯ Trains will be despatched from Callemondah every 30 mins in the empty direction and 30mins from Bluff in the loaded direction. (30mins Slot Separation).
⎯ The throughput figure is discounted by 12.25% to account for losses attributed to the following: o Unplanned incidents; o Unplanned maintenance; o Unplanned high impact speed restrictions; o Unplanned rolling stock availability interruptions; o Loading and unloading interruptions and exigencies; o Unplanned port unavailability; o Coal unavailability; o Shipping and arrival issues – including seasonality in coal demand o Crewing interruptions.
• Mine – Loader Assumptions
⎯ Assumes all loadouts will require 30 mins recharge interval. ⎯ Assumes all loadouts will require a minimum of 30 mins dispatch separation. ⎯ Cumulatively, dispatch between trains to the same mine / loadout will be the sum of loading times
+ recharge time + loadout dispatch separation, unless otherwise specified. ⎯ Pre-load time is different for each individual mine. ⎯ Post-load time is different for each individual mine. ⎯ Unload & Load times are modelled on a load or unload rate. Variation is applied to these rates
on a triangular distribution.
• Port – Unloader Assumptions (RG Tanna Coal Terminal)
⎯ Assumes a Pre load interval of 16 mins (RGTCT) ⎯ Assumes a Post Load interval of 7 mins (RGTCT). ⎯ Assumes a Pre load interval of 9 mins (BPCT). ⎯ Assumes a Post Load interval of 6 mins (BPCT). ⎯ Unload & Load times are modelled on a load or unload rate. Variation is applied to these rates
on a triangular distribution. ⎯ Assumes current Belt Route / Pit combinations at RG Tanna. ⎯ Assumes a 6.5 hour Mini Cycle through Callemondah and RG Tanna (Optional, can be turned on
& off). ⎯ Restricted hours of operation (BPCT only).
• Rolling Stock Activity Assumptions
⎯ Diesel & Electric consists will assume a 15 minute cab clean every cycle. ⎯ Diesel & Electric consists will assume a 20 minute provisioning allowance per loco every 7
cycles.

QR Network Pty Ltd
2009 Coal Rail Infrastructure Master Plan
113
⎯ Diesel consists will assume a 40 minute refuel every cycle (25mins Leads & 15mins Remotes). ⎯ Train Examination frequency shall be every 19 – 21 days for a duration of 6 hours.
• Depot Delays – Crewing
⎯ All trains passing through Bluff will assume a 20 minute crew change delay. ⎯ All trains passing through Callemondah will assume a 20 minute crew change delay. ⎯ At this time there are no other crewing delays being modelled on route in the Blackwater system.
• Network – Section Running
⎯ The Blackwater system assumes different SRT’s for Diesel & Electric consist configurations (Diesel is slightly slower than Electric).
⎯ All consist configurations will assume running times as per currently agreed between QR National and QR Network Planning (Section Run Times Jul - Dec 07 Final.xls).
⎯ All section run times are increased by 5% to reflect a blanket 5% speed restriction allowance. ⎯ Stop / Start allowances for Diesel consists will be 5 and 5 minutes respectively. ⎯ Stop / Start allowances for Electric consists will be 3 and 3 minutes respectively.
• Non – Coal Traffic
⎯ Non – Coal traffic will be modelled based on the current Master Train Plan sourced from QR Network.
• Resource Unavailability
⎯ Port and Track closures are applied based on information and the regime outlined in UT3.
o 12 hours system wide shutdown every 2 weeks
⎯ Track closures where possible are aligned and integrated with the major port shutdowns
o Track closure activities include, but are not limited to the following:
Zonal Maintenance Ballast Cleaning Machines Railing Grinding Machines Stone Blowing Resurfacing Civil Maintenance
12.2.1.2 Moura System
• Train Dispatch – Rules of Operation
⎯ The Moura system will assume an even railings operation over a 52 weeks simulation period. ⎯ Trains will be despatched from Callemondah every 40 mins in the empty direction. ⎯ The throughput figure is discounted by 12.25% to account for losses attributed to the following:
o Unplanned incidents o Unplanned maintenance o Unplanned high impact speed restrictions o Unplanned rolling stock availability interruptions o Loading and unloading interruptions and exigencies o Unplanned port unavailability o Coal unavailability o Shipping and arrival issues – including seasonality in coal demand o Crewing interruptions.

QR Network Pty Ltd
2009 Coal Rail Infrastructure Master Plan
114
• Mine – Loader Assumptions
⎯ Assumes all loadouts will require 30 mins recharge interval. ⎯ Assumes all loadouts will require a minimum of 30 mins dispatch separation. ⎯ Cumulatively, dispatch between trains to the same mine / loadout will be the sum of loading times
+ recharge time + loadout dispatch separation, unless otherwise specified. ⎯ Pre-load delay time is different for each individual mine. ⎯ Post-load delay time is different for each individual mine. ⎯ Unload & Load times are modelled on a load or unload rate. Variation is applied to these rates
on a triangular distribution.
• Port – Unloader Assumptions (RG Tanna Coal Terminal) same as Blackwater system above.
• Rolling Stock Activity Assumptions
⎯ Diesel consists will assume a 15 minute cab clean every cycle. ⎯ Diesel consists will assume a 40 minute provisioning allowance per consist every 7 cycles
(25mins Leads & 15mins Remotes). ⎯ Diesel consists will assume a 40 minute refuel every cycle (25mins Leads & 15mins Remotes). ⎯ Train Examination frequency shall be every 19 – 21 days for a duration of:
o 6hrs for large consists (Blackwater size) o 4hrs for smaller consists
• Depot Delays – Crewing
⎯ All trains passing through Callemondah will assume a 20 minute crew change delay. ⎯ At this time there are no other crewing delays being modelled on route in the Blackwater system.
• Network – Section Running
⎯ The Blackwater system will assume the same SRT’s for each consist configuration. ⎯ All consist configurations will assume running times as per currently agreed between QR National
and QR Network Planning (Section Run Times Jul - Dec 07 Final.xls). ⎯ All section run times are increased by 5% to reflect a blanket 5% speed restriction allowance. ⎯ Stop / Start allowances for Diesel consists will be 5 and 5 minutes respectively.
• Non – Coal Traffic
⎯ Non – Coal traffic will be modelled based on the current Master Train Plan sourced from QR Network.
• Resource Unavailability
⎯ Port and Track closures are applied based on information and the regime outlined in UT3.
o 12 hours system wide shutdown every 4 weeks.
⎯ Track closures where possible are aligned and integrated with the major port shutdowns.
o Track closure activities include, but are not limited to the following:
Zonal Maintenance Ballast Cleaning Machines Railing Grinding Machines Stone Blowing Resurfacing Civil Maintenance

QR Network Pty Ltd
2009 Coal Rail Infrastructure Master Plan
115
12.2.2 SBB82 Modelling Assumptions and Results
12.2.2.1 Blackwater
Static Modelling of the SBB82 scenario for the Blackwater system uses the following assumptions:
• Port
⎯ the annual volume is distributed as: 75 mtpa through RGTCT and 7 mtpa through BPCT,
• Above Rail
⎯ Train payloads are as provided by the rail operators. This means there are unique sized trains
for:
o The mines serviced in the Blackwater system. o Those mines serviced on the Central Western system. o Moura system based mines. o The Surat Basin mines.
⎯ Section run times are as per the agreed times with rail operators, ⎯ Services operate 52 weeks per year. ⎯ An allowance for stopping and starting trains on single-line sections of: electric empty – 3minutes,
electric loaded – 4 minutes and diesel empty and loaded – 5 minutes. This is applied to each section which gives a very conservative result.
• Below Rail
⎯ An allowance of 35 days p.a. lost due to planned maintenance. ⎯ An allowance for stopping and starting trains on single-line sections of: electric empty – 3minutes,
electric loaded – 4 minutes and diesel empty and loaded – 5 minutes. ⎯ From Bluff to Callemondah 30 minute slots are used for train despatch. Accordingly non-coal
traffic is assumed to run in between these slots.
Results of the static modelling are shown in Table 26 below.
Table 26: SBB82 – Blackwater System Track Utilisation
Track Section
No. of Tracks
% Utilisation
Barney Point – South Gladstone 3 %
Parana – South Gladstone 2 %
Callemondah – Parana 2 %
Callemondah – Gladstone Powerhouse Jct 2 %
Gladstone Powerhouse Jct – Golding 2 %
Callemondah – Mount Miller 2 666000%%%
Mount Miller – Yarwun 2 666000%%%
Yarwun – Aldoga 2 666000%%%
Aldoga – Mount Larcom 2 666111%%%

QR Network Pty Ltd
2009 Coal Rail Infrastructure Master Plan
116
Track Section
No. of Tracks
% Utilisation
Mount Larcom – Ambrose 2 666777%%%
Ambrose – Epala 2 666777%%%
Epala – Raglan 2 666777%%%
Raglan – Marmor 2 666777%%%
Marmor – Bajool 2 666777%%%
Bajool – Archer 2 666777%%%
Archer – Midgee 2 666777%%%
Midgee – Rocklands 2 666777%%%
Rocklands – Gracemere 2 666777%%%
Gracemere – Kabra 2 666777%%%
Kabra – Stanwell 2 666777%%%
Stanwell – Warren 2 666444%%%
Stanwell Powerhouse – Warren 1 777%%%
Warren – Wycarbah 666444%%%
Wycarbah – Westwood 2 666444%%%
Westwood – Windah 2 666444%%%
Windah – Grantleigh 2 666444%%%
Grantleigh – Tunnel 2 666444%%%
Tunnel – Edungalba 2 666444%%%
Edungalba – Aroona 2 666444%%%
Aroona – Duaringa 2 666444%%%
Duaringa – Wallaroo 2 666444%%%
Wallaroo – Tryphinia 2 666444%%%
Tryphinia – Dingo 2 666444%%%
Dingo – Umolo 2 666444%%%
Umolo – Parnabal 2 666444%%%
Parnabal – Walton 2 666444%%%
Walton – Bluff 2 666444%%% Bluff – Boonal Balloon Points 2 35%
Boonal Balloon Points – Boonal Balloon 1 10%

QR Network Pty Ltd
2009 Coal Rail Infrastructure Master Plan
117
Track Section
No. of Tracks
% Utilisation
Boonal – Blackwater 2 29%
Blackwater – Sagittarius 2 9%
Sagittarius – Rangal 2 7%
Rangal – Burngrove 2 15%
Burngrove – Crew 1 30%
Crew – Mackenzie 1 37%
Mackenzie – Fairhill 1 25%
Fairhill – Yan Yan 1 27%
Yan Yan – Gregory Junction 1 14%
Blackwater – Koorilgah 1 1%
Koorilgah – Koorilgah Balloon 1 0%
Koorilgah Balloon – Laleham Balloon 1 0%
Sagittarius – Curragh 1 13%
Rangal – Tikardi 1 21%
Tikardi – Boorgoon 1 20%
Boorgoon – Boorgoon Balloon 1 0%
Boorgoon – Kinrola Junction 1 21%
Kinrola Junction – Kinrola Balloon 1 12%
Kinrola Junction – Memooloo 1 33%
Togara – Memooloo 1 7%
Memooloo – Rolleston 1 40%
Mackenzie – Ensham Balloon 1 12%
Yan Yan – Gordonstone Balloon 1 8%
In Table 26 above, the track sections from Callemondah to Bluff are identified as approaching the 75% utilisation threshold and while not triggering an immediate response they will need to be scrutinised under dynamic modelling to validate the need for possible additional rail infrastructure.
The dynamic modelling uses a number of assumptions. These assumptions are the same as the static modelling assumptions except for the following:
• Port
⎯ An Even Railings operating mode applies. ⎯ Sufficient port capacity exists to enable trains to be scheduled so that delays are not incurred. ⎯ A port closure program detailing port closures per annum on a pit basis; to accommodate pit
maintenance. ⎯ Unload rates are:

QR Network Pty Ltd
2009 Coal Rail Infrastructure Master Plan
118
o RG Tanna Coal Terminal – 4,500 tonnes per hour on average10, o Barney Point Coal Terminal – 1,800 tonnes per hour on average10,
• Above rail
⎯ Services operate 52 weeks pa. ⎯ The Blackwater BRTT% to be attained is 127%. ⎯ Sufficient capacity exists at the respective operator’s depot to hold the trains during maintenance
activities. ⎯ The Callemondah mini cycle is 6.5 hrs.
• Below rail
⎯ An allowance for stopping and starting trains on single-line sections of: electric empty – 3 minutes, electric loaded – 4 minutes and diesel empty and loaded – 5 minutes.
⎯ A track closure program detailing annual track closures on a system wide basis (for zonal maintenance) and also incorporating specific sections (for track maintenance developed under Access Undertaking 3 – UT3).
⎯ A generic allowance of 5% applied to the system section run times to account for speed restrictions.
⎯ Sufficient capacity exists at the depot to hold the trains during maintenance activities. • Mine
⎯ Coal is loaded at the loading rate as per the agreement using the minimum, mode and maximum (triangular) rates of loading.
⎯ Sufficient coal is available to be loaded to enable a train to depart with full coal wagons. ⎯ Loading of trains is undertaken when the trains arrive.
The results of the dynamic modelling indicate that the rail infrastructure is more than sufficient to carry this level of tonnage. Accordingly rail infrastructure enhancements are not required.
12.2.2.2 Moura
Static modelling of the SBB82 scenario for the Moura system uses the following assumptions:
• Port
⎯ The annual volume is distributed as: 75 mtpa through RGTCT and 7 mtpa through BPCT,
• Above rail
⎯ Train payloads are as provided by the rail operators. This means there are unique sized trains for:
o The mines serviced in the Blackwater system, o Those mines serviced on the Central Western system, o Moura system based mines, and o The Surat Basin mines.
⎯ Section run times are as per the agreed times with rail operators for Blackwater and Moura systems.
10 This rate is indicative only. In the Dynamic Model historical data is used for each mine/ port combination. The actual data used is based upon the minimum, maximum and mode of the historical data set applied using triangular distribution.

QR Network Pty Ltd
2009 Coal Rail Infrastructure Master Plan
119
⎯ Services operate 52 weeks per year. • Below rail
⎯ An allowance of 35 days p.a. lost due to planned maintenance. ⎯ An allowance for stopping and starting trains on single-line sections of: electric empty – 3minutes,
electric loaded – 4 minutes and diesel empty and loaded – 5 minutes. This is applied to each section which gives a very conservative result.
⎯ An allowance has been made for train paths that non-coal trains occupy during the year for: ⎯ Non-coal traffic is negligible.
Results of the static modelling are shown in Table 27 below.

QR Network Pty Ltd
2009 Coal Rail Infrastructure Master Plan
120
Table 27: SBB82 – Moura System Track Utilisation
Track Section
No. of Tracks
% Utilisation
Barney Point – South Gladstone 3 %
Parana – South Gladstone 2 %
Callemondah – Parana 2 %
Callemondah – Gladstone Powerhouse Jct 2 %
Gladstone Powerhouse Jct – Golding 1 %
Callemondah – Byellee 1 24%
Byellee – Stowe 1 36%
Stowe – Graham 1 24%
Graham – Stirrat 1 22%
Stirrat – Clarke 1 39%
Clarke – Fry 1 24%
Fry – Mt Rainbow 1 37%
Mt Rainbow – Dumgree 1 39%
Dumgree – Boundary Hill Junction 1 27%
Boundary Hill Junction – Annandale 1 11%
Annandale – Earlsfield Junction 1 19%
Earlsfield Junction – Belldeen 1 26%
Belldeen – SBR Junction 1 27%
SBR Junction – Moura Mine Junction 1 15%
Moura Mine Junction – Moura Mine Balloon 1 10%
Graham – Taragoola 1 <1%
Earlsfield Junction – Koonkool 1 2%
Koonkool – Dakenba 1 4%
Dakenba – Callide Balloon 1 3%
Boundary Hill Junction – Boundary Hill Balloon 1 4%
Moura Mine junction – Baralaba Loadout 1 0%
For this scenario all sections are utilised much less than the congestion threshold. Accordingly it would appear that rail infrastructure enhancements are not required.
The dynamic modelling uses a number of assumptions. These assumptions are the same as the static modelling assumptions except for the following:
• Port
⎯ An Even Railings operating mode applies.

QR Network Pty Ltd
2009 Coal Rail Infrastructure Master Plan
121
⎯ Sufficient port capacity exists to enable trains to be scheduled so that delays are not incurred. ⎯ A port closure program detailing port closures per annum on a pit basis; to accommodate pit
maintenance. ⎯ Unload rates are:
o RG Tanna Coal Terminal – 4,500 tonnes per hour on average11. o Barney Point Coal Terminal – 1,800 tonnes per hour on average11.
• Above rail
⎯ A track closure program detailing annual track closures on a system wide basis (for zonal maintenance) and also incorporating specific sections (for track maintenance).
⎯ Services operate 52 weeks pa. ⎯ The Blackwater BRTT% to be attained is 130%. ⎯ Sufficient capacity exists at the respective operator’s depot to hold the trains during maintenance
activities.
• Below rail
⎯ An allowance for stopping and starting trains on single-line sections of: electric empty – 3 minutes, electric loaded – 4 minutes and diesel empty and loaded – 5 minutes.
⎯ A generic allowance of 5% applied to the system section run times to account for speed restrictions.
⎯ Sufficient capacity exists at the depot to hold the trains during maintenance activities.
• Mine
⎯ Coal is loaded at the loading rate as per the agreement using the minimum, mode and maximum (triangular) rates of loading.
⎯ Sufficient coal is available to be loaded to enable a train to depart with full coal wagons. ⎯ Loading of trains is undertaken when the trains arrive.
The results of the dynamic modelling under scenario SBB82 for Moura show that the rail infrastructure is more than sufficient to carry this level of tonnage. Accordingly rail infrastructure enhancements are not required.
12.2.3 SBB100 Modelling Assumptions and Results
12.2.3.1 Blackwater
Static Modelling of the SBB100 scenario for the Blackwater system uses the following assumptions:
• Port
⎯ The annual volume is distributed as: 75 mtpa through RGTCT, 25 mtpa through WICET and nil mtpa through BPCT (closed not long after WICET is commissioned),
• Above rail
⎯ Train payloads are as provided by the rail operators. This means there are unique sized trains
for:
o The mines serviced in the Blackwater system. o Those mines serviced on the Central Western system.
11 This rate is indicative only. In the Dynamic Model historical data is used for each mine/ port combination. The actual data used is based upon the minimum, maximum and mode of the historical data set applied using triangular distribution.

QR Network Pty Ltd
2009 Coal Rail Infrastructure Master Plan
122
o Moura system based mines. o The Surat Basin mines.
⎯ Section run times are as per the agreed times with rail operators.
⎯ Services operate 52 weeks per year.
• Below rail
⎯ An allowance of 35 days p.a. lost due to planned maintenance. ⎯ An allowance for stopping and starting trains on single-line sections of: electric empty – 3minutes,
electric loaded – 4 minutes and diesel empty and loaded – 5 minutes. This is applied to each section which gives a very conservative result.
⎯ From Bluff to Callemondah 30 minute slots are used instead of section run times. Accordingly non-coal traffic is assumed to run in between these slots.
Results of the static modelling are shown in Table 28 below.
Table 28: SBB100 – Blackwater System Track Utilisation
Track Section
No. of Tracks
% Utilisation
Barney Point – South Gladstone 3 %
Parana – South Gladstone 2 %
Callemondah – Parana 2 %
Callemondah – Gladstone Powerhouse Jct 2 %
Gladstone Powerhouse Jct – Golding 2 %
Callemondah – Mount Miller 2 53% Mount Miller – Yarwun 2 53% Yarwun – Aldoga 2 53%
Aldoga – Mount Larcom 2 666000%%%
Mount Larcom – Ambrose 2 666000%%%
Ambrose – Epala 2 666000%%%
Epala – Raglan 2 666000%%%
Raglan – Marmor 2 666000%%%
Marmor – Bajool 2 666000%%%
Bajool – Archer 2 666000%%%
Archer – Midgee 2 666000%%%
Midgee – Rocklands 2 666000%%%
Rocklands – Gracemere 2 666000%%%
Gracemere – Kabra 2 666000%%%
Kabra – Stanwell 2 666000%%%

QR Network Pty Ltd
2009 Coal Rail Infrastructure Master Plan
123
Track Section
No. of Tracks
% Utilisation
Stanwell – Warren 2 666333%%% Stanwell Powerhouse – Warren 1 6%
Warren – Wycarbah 666333%%%
Wycarbah – Westwood 2 666333%%%
Westwood – Windah 2 666333%%%
Windah – Grantleigh 2 666333%%%
Grantleigh – Tunnel 2 666333%%%
Tunnel – Edungalba 2 666333%%%
Edungalba – Aroona 2 666333%%%
Aroona – Duaringa 2 666333%%%
Duaringa – Wallaroo 2 666333%%%
Wallaroo – Tryphinia 2 666333%%%
Tryphinia – Dingo 2 666333%%%
Dingo – Umolo 2 666111%%%
Umolo – Parnabal 2 666111%%%
Parnabal – Walton 2 666111%%%
Walton – Bluff 2 666111%%%
Bluff – Boonal Balloon Points 2 31%
Boonal Balloon Points – Boonal Balloon 1 9%
Boonal – Blackwater 2 26%
Blackwater – Sagittarius 2 8%
Sagittarius – Rangal 2 6%
Rangal – Burngrove 2 14%
Burngrove – Crew 1 27%
Crew – Mackenzie 1 33%
Mackenzie – Fairhill 1 25%
Fairhill – Yan Yan 1 26%
Yan Yan – Gregory Junction 1 14%
Blackwater – Koorilgah 1 2%
Koorilgah – Koorilgah Balloon 1 1%
Koorilgah Balloon – Laleham Balloon 1 0%
Sagittarius – Curragh 1 12%

QR Network Pty Ltd
2009 Coal Rail Infrastructure Master Plan
124
Track Section
No. of Tracks
% Utilisation
Rangal – Tikardi 1 16%
Tikardi – Boorgoon 1 15%
Boorgoon – Boorgoon Balloon 1 0%
Boorgoon – Kinrola Junction 1 16%
Kinrola Junction – Kinrola Balloon 1 9%
Kinrola Junction – Memooloo 1 25%
Togara – Memooloo 1 6%
Memooloo – Rolleston 1 31%
Mackenzie – Ensham Balloon 1 9%
Yan Yan – Gordonstone Balloon 1 8%
The track sections from Callemondah to Bluff are identified as approaching the 75% utilisation threshold and while not triggering an immediate urgent response they will need to be scrutinised under dynamic modelling to validate the need for possible additional rail infrastructure.
The dynamic modelling uses a number of assumptions. For a list of these please refer to those mentioned under the SBB82 scenario on page 117.
The results of the dynamic modelling indicate that the rail infrastructure is more than sufficient to carry this level of tonnage. Accordingly rail infrastructure enhancements For SBB100 are not required.
12.2.3.2 Moura
Normal Conditions
Static modelling of the SBB100 scenario for the Moura system under a normal tonnage profile uses the following assumptions:
• Port
⎯ The annual volume is distributed as: 75 mtpa through RGTCT, 25 mtpa through WICET and nil mtpa through BPCT (closed not long after WICET is commissioned).
• Above rail
⎯ Train payloads are as provided by the rail operators. This means there are unique sized trains
for:
o The mines serviced in the Blackwater system, o Those mines serviced on the Central Western system, o Moura system based mines, and o The Surat Basin mines.
⎯ Section run times are as per the agreed times with rail operators for Blackwater and Moura systems. Section run times for the Surat Basin Rail capacity tonnages was calculated using initial distance and average speed data,
⎯ Services operator 52 weeks per year. • Below rail

QR Network Pty Ltd
2009 Coal Rail Infrastructure Master Plan
125
⎯ An allowance of 35 days p.a. lost due to planned maintenance. ⎯ An allowance for stopping and starting trains on single-line sections of: electric empty – 3minutes,
electric loaded – 4 minutes and diesel empty and loaded – 5 minutes. This is applied to each section which gives a very conservative result.
⎯ An allowance has been made for train paths that non-coal trains occupy during the year for: ⎯ Non-coal traffic is negligible.
Results of the static modelling are shown in Table 29 below.
Table 29: SBB100 – Moura System Track Utilisation
Track Section
No. of Tracks
% Utilisation
Barney Point – South Gladstone 3 %
Parana – South Gladstone 2 %
Callemondah – Parana 2 %
Callemondah – Gladstone Powerhouse Jct 2 %
Gladstone Powerhouse Jct – Golding 1 %
Callemondah – Byellee 1 32%
Byellee – Stowe 1 47%
Stowe – Graham 1 32%
Graham – Stirrat 1 30%
Stirrat – Clarke 1 54%
Clarke – Fry 1 34%
Fry – Mt Rainbow 1 51%
Mt Rainbow – Dumgree 1 55%
Dumgree – Boundary Hill Junction 1 37%
Boundary Hill Junction – Annandale 1 16%
Annandale – Earlsfield Junction 1 28%
Earlsfield Junction – Belldeen 1 42%
Belldeen – SBR Junction 1 44%
SBR Junction – Moura Mine Junction 1 14%
Moura Mine Junction – Moura Mine Balloon 1 8%
Graham – Taragoola 1 0%
Earlsfield Junction – Koonkool 1 0%
Koonkool – Dakenba 1 0%
Dakenba – Callide Balloon 1 0%
Boundary Hill Junction – Boundary Hill Balloon 1 4%
Moura Mine junction – Baralaba Loadout 1 2%

QR Network Pty Ltd
2009 Coal Rail Infrastructure Master Plan
126
For this scenario all sections are utilised much less than the congestion threshold. Accordingly it would appear that rail infrastructure enhancements are not required.
The dynamic modelling uses a number of assumptions. For a list of these please refer to those mentioned under the SBB82 scenario on page 117.
The results of the dynamic modelling under scenario SBB100 for Moura show that the rail infrastructure is more than sufficient to carry this level of tonnage. Accordingly rail infrastructure enhancements under normal conditions are not required.
Preparation for SBR Traffic Conditions
Due to the increased coal rail traffic from the Surat rail system additional rail expansion work in the Moura system is required. This expansion work will take the form of bridge and culvert upgrades and formation strengthening at selected track sites. This work is being undertaken in liaison with the proponents of this project work.
So that this additional rail expansion work does not restrict the railing of contract tonnages, additional rail infrastructure will need to be constructed at the proposed formation strengthening sites. This has been dynamically modelled and the following infrastructure projects are proposed:
• Additional passing loops between Earlsfield and Belldeen. • Duplication of track from near Clarke (52 kilometre mark) and near Fry (73 kilometre mark). • Extension of existing passing loops at Mt Rainbow, Dumgree, Annandale and Belldeen to
accommodate the longer Surat trains. • Holding roads at Banana Junction to facilitate train movements to and from SBR.

QR Network Pty Ltd
2009 Coal Rail Infrastructure Master Plan
127
12.3 Appendix for Chapter 6 – Northern Bowen Basin
12.3.1 Coal System Operational Characteristics
The operational characteristics that support and guide the relevant coal systems and that are used to form the basis of the assumptions employed in the QR Network static and dynamic modelling are presented below.
12.3.1.1 Goonyella system
• Train Dispatch – Rules of Operation
⎯ The Goonyella system assumes an even railings operation over a 52 week simulation period with an allowance for Cargo Assembly.
⎯ Trains separation is managed on 20 minutes slots from Jilalan to Coppabella and return.
• Mine – Loader Assumptions
⎯ Assumes all loadouts will require 30 mins recharge interval. ⎯ Assumes all loadouts will a minimum of 30 mins dispatch separation. ⎯ Cumulatively, dispatch between trains to the same mine / loadout will be the sum of loading times
+ recharge time + loadout dispatch separation, unless otherwise specified. ⎯ Assumes a Pre load interval of 5 mins. ⎯ Assumes a Post Load interval of 10 mins. ⎯ Unload & Load times are modelled on a load or unload rate. Variation is applied to these rates
on a triangular distribution.
• Port – Unloader Assumptions
⎯ Assumes a Pre load interval of 7 mins ⎯ Assumes a Post Load interval of 8 mins ⎯ Unload & Load times are modelled on a load or unload rate. Variation is applied to these rates
on a triangular distribution.
• Rolling Stock Activity Assumptions
⎯ Electric configurations will assume a 15 minute cab clean per cycle and 20 min provisioning allowance per loco every 7 days.
⎯ TE frequency shall be every 20 – 21 days for a duration of:
o 9,949t payload 7 hrs
• Depot Delays – Crewing
⎯ All trains passing through both Coppabella and Jilalan will assume a 20 minute crew change delay at both locations except for short haul mines not requiring a crew change.
⎯ All other crewing delays are modelled on route to reflect on route crewing activities as per current.
• Network – Section Running
⎯ All consist configurations will assume running times as per currently agreed between QR National and QR Network Planning (Section Run Times Jul - Dec 07 Final.xls).
⎯ All section run times are increased by 5% to reflect a blanket 5% speed restriction allowance. ⎯ Stop / Start allowances for Electric Goonyella configurations will be 3 and 4 minutes respectively.
• Non – Coal Traffic

QR Network Pty Ltd
2009 Coal Rail Infrastructure Master Plan
128
⎯ Non – Coal traffic will be modelled based on the current Master Train Plan sourced from QR Network.
• Resource Unavailability
⎯ Port and Track closures are applied based on information and the regime outlined in UT3.
o DBCT pit one to shut down ever fortnight for 12 hours o HPCT pits 2 and 3 shut down 12 hours every 4 weeks (alternating)
⎯ Track closures where possible are aligned and integrated with the major port shutdowns.
o Track closure activities include, but are not limited to the following: Zonal Maintenance Ballast Cleaning Machines Railing Grinding Machines Stone Blowing Resurfacing Civil Maintenance
12.3.1.2 Newlands system
• Train Dispatch – Rules of Operation
⎯ The Newlands system assumes an even railings operation over a 52 weeks simulation period. ⎯ Trains are separated by a minimum 30 minutes from Pring south only. (Note this is Time
Separation and not Slot Separation).
• Mine – Loader Assumptions
⎯ Assumes all loadouts will require 30 mins recharge interval. ⎯ Assumes all loadouts will a minimum of 30 mins dispatch separation. ⎯ Cumulatively, dispatch between trains to the same mine / loadout will be the sum of loading times
+ recharge time + loadout dispatch separation, unless otherwise specified. ⎯ Assumes a Pre load interval of 5 mins. ⎯ Assumes a Post Load interval of 10 mins. ⎯ Unload & Load times are modelled on a load or unload rate. Variation is applied to these rates
on a triangular distribution.
• Port – Unloader Assumptions
⎯ Assumes a Pre load interval of 7 mins. ⎯ Assumes a Post Load interval of 8 mins. ⎯ Unload & Load times are modelled on a load or unload rate. Variation is applied to these rates
on a triangular distribution.
• Rolling Stock Activity Assumptions
⎯ All diesel configurations will assume a 15 minute cab clean every cycle. ⎯ All diesel configurations will assume a 25 minute provisioning allowance per loco per cycle
(including refuel). ⎯ Any electric configurations will assume a 15 minute cab clean per cycle and 15 min provisioning
allowance loco per cycle. ⎯ Train Examination frequency shall be every 20 – 21 days for a duration of:
o 9,949t payload 7 hrs o 6,800t payload 6 hrs

QR Network Pty Ltd
2009 Coal Rail Infrastructure Master Plan
129
• Depot Delays – Crewing
⎯ All trains passing through Pring will assume a 20 minute crew change delay. ⎯ At this time there are no other crewing delays being modelled en route in the Newlands System.
• Network – Section Running
⎯ The Newlands, Goonyella system and GAPE will assume the same SRT’s for each consist configuration
⎯ All consist configurations will assume running times as per currently agreed between QR National and QR Network Planning (Section Run Times Jul - Dec 07 Final.xls)
⎯ SRT’s across the link will assume 60km running based on distances from stopping location to stopping location.
⎯ All section run times are increased by 5% to reflect a blanket 5% speed restriction allowance. ⎯ Consist configurations exceeding 4,600t will assume 2 additional minutes running time across the
Briaba – Collinsville section (Assumes that grade easing will reduce SRT by 2 mins once complete).
⎯ Stop / Start allowances for Diesel configurations will be 5 and 5 minutes respectively.
• Non – Coal Traffic
⎯ Non – Coal traffic will be modelled based on the current Master Train Plan sourced from QR Network.
• Resource Unavailability
⎯ Port and Track closures are applied based on information and the regime outlined in UT3.
o APCT pit one to shut down ever fortnight for 12 hours o APCT pits 2 and 3 shut down 12 hours every 4 weeks (alternating)
⎯ Track closures where possible are aligned and integrated with the major port shutdowns
o Track closure activities include, but are not limited to the following:
Zonal Maintenance Ballast Cleaning Machines Railing Grinding Machines Stone Blowing Resurfacing Civil Maintenance
12.3.2 NBB154 Modelling Assumptions and Results
12.3.2.1 Goonyella
Static Modelling of the NBB154 scenario for the Goonyella system uses the following assumptions:
• Port
⎯ The given annual volume of 129mtpa is distributed as: 85mtpa through DBCT and 44mtpa through HPSCT.

QR Network Pty Ltd
2009 Coal Rail Infrastructure Master Plan
130
• Above rail
⎯ Train payloads are as provided by the rail operators: Goonyella size payloads for trains railing to DBCT and HPSCT, Blackwater size train payloads for trains railing cross-system from the Goonyella system to Gladstone ports.
⎯ Section run times are as per the agreed times with rail operators. ⎯ Services operate 52 weeks per year. ⎯ An allowance for stopping and starting trains on single-line sections of: electric empty – 3minutes,
electric loaded – 4 minutes. This is applied to each section which gives a very conservative result.
• Below rail
⎯ Duplication of the Coppabella – Ingsdon section is included in the base. ⎯ Note: duplication of the Winchester – Peak Downs and Wotonga – Moranbah North sections,
together with the addition of a passing loop on the Saraji – Dysart section, have all been put on hold at this stage and not included for modelling purposes.
⎯ An allowance of 35 days lost due to planned maintenance. ⎯ An allowance has been made for train paths used by non-coal trains during the year:
o Yukan to Coppabella up to 2,778 paths o Coppabella to Ingsdon 1,460 paths o Coppabella to Mt McLaren 260 paths
The results of the static modelling are depicted in Table 30 below.
Table 30: NBB154 – Goonyella System Track Utilisation
Track Section No. of Tracks
% Utilisation
Ports – Coppabella
Dalrymple Bay - Dalrymple Crossover Points 2 22%
Hay Point - Dalrymple Crossover Points 1 34%
Dalrymple Crossover Points - Praguelands 2 31%
Praguelands – Jilalan 2 22%
Jilalan – Yukan 2 23%
Yukan - Black Mountain 2 48%
Black Mountain – Hatfield 2 31%
Hatfield – Bolingbroke 2 31%
Bolingbroke – Balook 2 42%
Balook – Wandoo 2 30%
Wandoo – Waitara 2 38%
Waitara – Braeside 2 22%
Braeside – Mindi 2 34%
Mindi - South Walker Junction 2 22%

QR Network Pty Ltd
2009 Coal Rail Infrastructure Master Plan
131
Track Section No. of Tracks
% Utilisation
South Walker Junction - Tootoolah 2 11%
Tootoolah - Macarthur Junction 2 11%
Macarthur Junction - Coppabella 2 31%
Coppabella - Gordonstone Junction
Coppabella – Ingsdon 2 22%
Ingsdon - Red Mountain 1 34%
Red Mountain - Winchester 1 25%
Winchester - Peak Downs 1 31%
Peak Downs – Harrow 1 21%
Harrow – Saraji 1 21%
Saraji – Dysart 1 28%
Dysart – Stephens 1 17%
Stephens - Norwich Park 1 23%
Norwich Park – Bundoora 1 25%
Bundoora – Gordonstone Junction 1 58%
Coppabella – Watonga
Coppabella – Broadlea 2 22%
Broadlea – Mallawa 2 12%
Mallawa – Wotonga 2 5%
Wotonga - Blair Athol
Wotonga – Moranbah 1 12%
Moranbah – Villafranca 1 13%
Villafranca - Mount McLaren 1 14%
Mount McLaren - Blackridge 1 14%
Blackridge - Blair Athol Junction 1 12%
Blair Athol Junction - Blair Athol Mine 1 5%
Wotonga - North Goonyella
Wotonga – Riverside 1 33%
Riverside - North Goonyella Junction 1 3%
In Table 30 above, because all the sections were well below the congestion threshold, indications are then that there are no sections in the Goonyella system identified as needing further investigation.
Dynamic modelling uses a number of assumptions. These assumptions are the same as the static modelling except for the following additional assumptions:

QR Network Pty Ltd
2009 Coal Rail Infrastructure Master Plan
132
• Port
⎯ Sufficient port capacity exists to enable trains to be scheduled so that delays are not incurred, ⎯ A port closure program detailing port closures per annum on a pit basis; to accommodate pit
maintenance, ⎯ Unload rates are:
o Dalrymple Bay Coal Terminal – pits 1 & 2: 4,800 tonnes per hour on average and pit 3: about 12% higher at 5,500 tonnes per hour on average12,
o Hay Point Services Coal Terminal – 5,000 tonnes per hour on average12, o Abbot Point Coal Terminal – 6,000 tonnes per hour on average12.
• Above rail
⎯ Services operate 52 weeks pa. ⎯ The Goonyella BRTT% to be attained is 123%. ⎯ Sufficient capacity exists at the respective operator’s depot to hold the trains during maintenance
activities.
• Below rail
⎯ Duplication of the Coppabella – Ingsdon section. ⎯ An allowance for stopping and starting trains on single-line sections of: electric empty – 3 minutes
and electric loaded – 4 minutes. ⎯ A track closure program detailing annual track closures on a system wide basis (for zonal
maintenance) and also incorporating specific sections (for track maintenance developed for Access Undertaking 3 – UT3).
⎯ A generic allowance of 5% applied to the system section run times to account for speed restrictions.
• Mine
⎯ Coal is loaded at the loading rate as per the agreement using the minimum, mode and maximum (triangular) rates of loading.
⎯ Sufficient coal is available to be loaded to enable a train to depart with full coal wagons. ⎯ Loading of trains is undertaken when the trains arrive.
The results of the dynamic modelling for NBB 154 showed that there was no need for any other rail infrastructure enhancements to facilitate the 129mtpa railings to the Hay Point ports.
12.3.2.2 Newlands System
Static Modelling of the NBB154 scenario for the Newlands system uses the following assumptions:
• Port
⎯ Annual volume of 25 mtpa is railed to APCT. This is sourced as 22.7 mtpa from the Newlands system and 2.3 mtpa from the Goonyella system railed via the North Coast Line (NCL),
• Above rail
⎯ Train payloads are as provided by the rail operator: Newlands size payloads. ⎯ Section run times are as per the agreed times with the rail operator.
12 This rate is indicative only. In the Dynamic Model historical data is used for each mine/ port combination. The actual data used is based upon the minimum, maximum and mode of the historical data set applied using triangular distribution.

QR Network Pty Ltd
2009 Coal Rail Infrastructure Master Plan
133
⎯ Services operate 52 weeks per year.
• Below rail
⎯ An allowance of 35 days lost due to planned maintenance. ⎯ An allowance for stopping and starting trains on single-line sections of: diesel empty and loaded
– 5 minutes. This is applied to each section which gives a very conservative result.
The results of the static modelling are depicted in Table 31 below.
Table 31: NBB154 – Newlands System Track Utilisation
Track Section No. of Tracks
% Utilisation
Abbot Point – Newlands
Abbot Point - Kaili 1 46%
Kaili - Durroburra 1 36%
Durroburra - Pring 1 29%
Pring - Armuna 1 57%
Armuna - Binbee 1 666444%%%
Binbee - Briaba 1 48%
Briaba - Collinsville 1 777000%%% Collinsville - Birralee 1 48%
Birralee - Havilah 1 34%
Havilah - Newlands 1 29%
In Table 31 above, the sections Briaba to Collinsville and Armuna to Binbee are flagged (in priority order) as sections needing to be further investigated for possible infrastructure improvements under dynamic modelling.
Dynamic modelling uses a number of assumptions. These assumptions are the same as the static modelling except for the following additional assumptions:
• Port
⎯ Sufficient port stock pile capacity exists to enable trains to be scheduled so that delays are not incurred.
⎯ A port closure program detailing port closures per annum on a pit basis; to accommodate pit maintenance.
⎯ Unload rates are 6,000 tonnes per hour on average. • Above rail
⎯ An even railings operating mode applies. ⎯ Services operate 52 weeks pa, ⎯ The Newlands BRTT% to be attained is 124%, ⎯ Sufficient capacity exists at the respective operator’s depot to hold the trains during maintenance
activities,

QR Network Pty Ltd
2009 Coal Rail Infrastructure Master Plan
134
• Below rail
⎯ An allowance for stopping and starting trains on single-line sections of: diesel empty and loaded – 5 minutes.
⎯ A track closure program detailing annual track closures on a system wide basis (for zonal maintenance) and also incorporating specific sections (for track maintenance developed for Access Undertaking 3 – UT3)
⎯ A generic allowance of 5% applied to the system section run times to account for speed restrictions,
• Mine
⎯ Coal is loaded at the loading rate as per the agreement using the minimum, mode and maximum (triangular) rates of loading.
⎯ Sufficient coal is available to be loaded to enable a train to depart with full coal wagons. ⎯ Loading of trains is undertaken when the trains arrive.
The results of the modelling indicate that the some additional infrastructure enhancements will meet the throughput and BRTT % requirements.
At this stage however, negotiations are being carried out separate to the CRIMP process regarding these enhancements.
12.3.2.3 NBB154 Summary
In the Goonyella system there were no rail infrastructure enhancements identified as being required for the export railing of 85mtpa to Dalrymple Bay Coal Terminal and 44mtpa to Hay Point Services Coal Terminal.
For exporting 25mtpa to Abbot Point Coal Terminal from the Newlands system and the Goonyella system via the NCL, rail enhancements were identified. The funding and construction of these however are being negotiated outside of the CRIMP process.
12.3.3 NBB195 Modelling Assumptions and Results
12.3.3.1 Goonyella
Static Modelling of the NBB195 scenario for the Goonyella system uses the following assumptions:
• Port
⎯ The given annual volume of 145mtpa is distributed as: 90mtpa through DBCT and 55mtpa through HPSCT,
• Above rail
⎯ Train payloads are as provided by the rail operators: Goonyella size payloads for trains railing to DBCT and HPSCT, Blackwater size payloads for trains railing to Gladstone ports,
⎯ Section run times are as per the agreed times with rail operators, ⎯ Services operate 52 weeks per year,
• Below rail
⎯ The Northern Missing Link between Newlands mine and the North Goonyella mine has been constructed,
⎯ Duplication of the Winchester – Peak Downs and Wotonga – Moranbah North sections, together with the addition of a passing loop on the Saraji – Dysart section, have all been put on hold,
⎯ An allowance of 35 days lost due to planned maintenance,

QR Network Pty Ltd
2009 Coal Rail Infrastructure Master Plan
135
⎯ An allowance for stopping and starting trains on single-line sections of: electric empty – 3minutes, electric loaded – 4 minutes. This is applied to each section which gives a very conservative result
⎯ An allowance has been made for train paths used by non-coal trains during the year: o Yukan to Coppabella up to 2,778 paths and o Coppabella to Ingsdon 1,460 paths, o Coppabella to Mt McLaren 260 paths.
The results of the static modelling are depicted in Table 32 below.
Table 32: NBB195 – Goonyella System Track Utilisation
Track Section No. of Tracks
% Utilisation
Ports - Coppabella
Dalrymple Bay - Dalrymple Crossover Points 2 24%
Hay Point - Dalrymple Crossover Points 1 43%
Dalrymple Crossover Points - Praguelands 2 35%
Praguelands - Jilalan 2 25%
Jilalan – Yukan 2 26%
Yukan - Black Mountain 2 55%
Black Mountain - Hatfield 2 35%
Hatfield - Bolingbroke 2 35%
Bolingbroke - Balook 2 48%
Balook – Wandoo 2 33%
Wandoo - Waitara 2 42%
Waitara - Braeside 2 24%
Braeside – Mindi 2 38%
Mindi - South Walker Junction 2 24%
South Walker Junction - Tootoolah 2 12%
Tootoolah - Macarthur Junction 2 12%
Macarthur Junction - Coppabella 2 35%
Coppabella - Gordonstone Junction
Coppabella - Ingsdon 2 22%
Ingsdon - Red Mountain 1 45%
Red Mountain - Winchester 1 33%
Winchester - Peak Downs 1 41%
Peak Downs - Harrow 1 27%
Harrow – Saraji 1 27%
Saraji – Dysart 1 32%
Dysart - Stephens 1 15%

QR Network Pty Ltd
2009 Coal Rail Infrastructure Master Plan
136
Track Section No. of Tracks
% Utilisation
Stephens - Norwich Park 1 19%
Norwich Park - Bundoora 1 20%
Bundoora - Gordonstone Junction 1 50%
Coppabella - Watonga
Coppabella - Broadlea 2 29%
Broadlea - Mallawa 2 16%
Mallawa - Wotonga 2 6%
Wotonga - Blair Athol
Wotonga - Moranbah 1 32%
Moranbah - Villafranca 1 34%
Villafranca - Mount McLaren 1 35%
Mount McLaren - Blackridge 1 38%
Blackridge - Blair Athol Junction 1 32%
Blair Athol Junction - Blair Athol Mine 1 14%
Wotonga – North Goonyella
Wotonga - Riverside 1 777666%%%
Riverside - North Goonyella Junction 1 57%
In Table 32 above, the section Wotonga – Riverside at 76% utilisation is identified as a section that has breached the 75% utilisation threshold and will need to be scrutinised under dynamic modelling to validate the need for possible additional rail infrastructure.
The dynamic modelling uses a number of assumptions. These assumptions are the same as the static modelling assumptions except for the following:
• Port
⎯ Sufficient port capacity exists to enable trains to be scheduled so that delays are not incurred. ⎯ A port closure program detailing port closures per annum on a pit basis; to accommodate pit
maintenance. ⎯ Unload rates are:
o Dalrymple Bay Coal Terminal – pits 1 & 2: 4,800 tonnes per hour on average and pit 3: about 15% higher at 5,500 tonnes per hour on average13.
o Hay Point Services Coal Terminal – 5,000 tonnes per hour on average13. o Abbot Point Coal Terminal – 6,000 tonnes per hour13.
• Above rail
⎯ Services operate 52 weeks pa. 13 This rate is indicative only. In the Dynamic Model historical data is used for each mine/ port combination. The actual data used is based upon the minimum, maximum and mode of the historical data set applied using triangular distribution.

QR Network Pty Ltd
2009 Coal Rail Infrastructure Master Plan
137
⎯ The Goonyella BRTT% to be attained is 123%. ⎯ Sufficient capacity exists at the respective operator’s depot to hold the trains during maintenance
activities.
• Below rail
⎯ An allowance for stopping and starting trains on single-line sections of: electric empty – 3 minutes and electric loaded – 4 minutes.
⎯ A track closure program detailing annual track closures on a system wide basis (for zonal maintenance) and also incorporating specific sections (for track maintenance developed for Access Undertaking 3 – UT3).
⎯ A generic allowance of 5% applied to the system section run times to account for speed restrictions.
⎯ Sufficient capacity exists at the depot to hold the trains during maintenance activities. • Mine
⎯ Coal is loaded at the loading rate as per the agreement using the minimum, mode and maximum (triangular) rates of loading.
⎯ Sufficient coal is available to be loaded to enable a train to depart with full coal wagons. ⎯ Loading of trains is undertaken when the trains arrive.
The results of the dynamic modelling on the Goonyella system indicate that the following enhancements are required to meet the proposed 145mtpa being railed to DBCT and HPSCT and the additional tonnage through to APCT.
• Duplication of the Ingsdon – Peak Downs sections.
• Duplication of the Wotonga – Moranbah North section (previously endorsed).
• A passing loop at the Saraji – Dysart section (previously endorsed).
• Additional roads (tracks) at Coppabella yard.
• Additional infrastructure at Jilalan yard (yet to be defined).
Due to the proposed timing of this scenario (i.e. 2011/ 213) there won’t be any proposals for endorsement put forward in this document.
12.3.3.2 Newlands
Static modelling of the NBB195 scenario for the Newlands system uses the following assumptions:
• Port
⎯ annual volume of 50 mtpa is railed to APCT.
• Above rail
⎯ Train payloads are as provided by the rail operator: Newlands size payloads. ⎯ Section run times are as per the agreed times with the rail operator. ⎯ Services operate 52 weeks per year.
• Below rail
⎯ An allowance of 35 days lost due to planned maintenance.
⎯ An allowance for stopping and starting trains on single-line sections of: diesel empty and loaded – 5 minutes. This is applied to each section which gives a very conservative result.
The results of the static modelling are depicted in Table 33 below.

QR Network Pty Ltd
2009 Coal Rail Infrastructure Master Plan
138
Table 33: NBB195 – Newlands System Track Utilisation
Track Section No. of Tracks
% Utilisation
Abbot Point – Newlands
Abbot Point - Kaili 1 30%
Kaili - Durroburra 1 19%
Durroburra - Pring 1 14%
Pring - Armuna 1 42%
Armuna - Binbee 1 49%
Binbee - Briaba 1 33%
Briaba - Collinsville 1 55%
Collinsville - Birralee 1 38%
Birralee - Havilah 1 48%
Havilah - Newlands 1 33%
North Goonyella – Newlands (NML)
MNL Junction – Leichhardt Range 1 28%
Leichhardt Range – Suttor Creek 1 999555%%%
Suttor Creek – Eaglefield Creek 1 888111%%%
Eaglefield Creek – Riverside 1 888333%%%
In Table 33 above, the sections “Leichhardt Range – Suttor Creek”, “Suttor Creek – Eaglefield Creek” and “Eaglefield Creek – Riverside” stand out as having breached the congestion threshold and requiring definite further analysis under dynamic modelling.
The dynamic modelling uses a number of assumptions. These assumptions are the same as the static modelling assumptions except for the following:
• Port
⎯ A cargo assembly operating mode applies. ⎯ Sufficient port capacity exists to enable trains to be scheduled so that delays are not incurred. ⎯ A port closure program detailing port closures per annum on a pit basis; to accommodate pit
maintenance. ⎯ Unload rates are – 6,000 tonnes per hour14.
• Above rail
⎯ A track closure program detailing annual track closures on a system wide basis (for zonal maintenance) and also incorporating specific sections (for track maintenance).
⎯ Services operate 52 weeks pa. ⎯ The Newlands BRTT% to be attained is 124%.
14 This rate is indicative only. In the Dynamic Model historical data is used for each mine/ port combination. The actual data used is based upon the minimum, maximum and mode of the historical data set applied using triangular distribution.

QR Network Pty Ltd
2009 Coal Rail Infrastructure Master Plan
139
⎯ Sufficient capacity exists at the respective operator’s depot to hold the trains during maintenance activities.
• Below rail
⎯ An allowance for stopping and starting trains on single-line sections of: diesel empty and loaded – 5 minutes.
⎯ A track closure program detailing annual track closures on a system wide basis (for zonal maintenance) and also incorporating specific sections (for track maintenance developed for Access Undertaking 3 – UT3.
⎯ A generic allowance of 5% applied to the system section run times to account for speed restrictions.
⎯ Sufficient capacity exists at the depot to hold the trains during maintenance activities. • Mine
⎯ Coal is loaded at the loading rate as per the agreement using the minimum, mode and maximum (triangular) rates of loading.
⎯ Sufficient coal is available to be loaded to enable a train to depart with full coal wagons. ⎯ Loading of trains is undertaken when the trains arrive.
The results of the modelling have indicated that rail enhancements were required to carry this tonnage profile. However, the funding and construction details regarding these enhancements are related to negotiations that are being carried out separate to the CRIMP process. Accordingly these enhancement details are not subject to inclusion in this section.
12.3.3.3 NBB195 Summary
In the Goonyella system there were rail infrastructure enhancements required for the export railing of 90mtpa to Dalrymple Bay Coal Terminal and 55mtpa to Hay Point Services Coal Terminal however due to the estimated timing of these they will be dealt with in more detail in a subsequent CRIMP document.
For the export of 50mtpa to Abbot Point Coal Terminal through the Northern Missing Link and the Newlands system, rail enhancements were identified. The funding and construction of these however are related to negotiations being conducted outside of this CRIMP process.