infrastructure master plan 2017 2017/2018 – 2047/2048 · i preface this infrastructure master...
TRANSCRIPT

Infrastructure Master Plan 2017 2017/2018 – 2047/2048Volume 2
Improving Quality of Life and Enhancing Sustainable Economic Development
Planning Services, Engineering and Scientific Services Division, Umgeni Water
PO Box 9, Pietermaritzburg, 3200, KwaZulu-Natal, South AfricaTel: 033 341 1522, Fax: 033 341 1218, Email: [email protected], Website: www.umgeni.co.za

For further information, please contact:
Planning Services
Engineering & Scientific Services Division
Umgeni Water
P.O.Box 9, Pietermaritzburg, 3200
KwaZulu-Natal, South Africa
Tel: 033 341-1522
Fax: 033 341-1218
Email: [email protected]
Web: www.umgeni.co.za


i
P R E FA C E This Infrastructure Master Plan 2017 describes Umgeni Water’s infrastructure plans for the financial period 2017/2018 – 2047/2048. It is a comprehensive technical report that provides detailed information on the organisation’s current infrastructure and on its future infrastructure development plans. This report replaces the last comprehensive Infrastructure Master Plan that was compiled in 2016. The report is divided into two volumes:
Volume 1 describes the most recent changes and trends within the primary environmental dictates that influence Umgeni Water’s infrastructure development plans (Section 2). Section 3 provides a review of historic water sales against past projections, as well as Umgeni Water’s most recent water demand projections, compiled at the end of 2016. Section 4 provides a high level review of the energy consumption used to produce the water volumes analysed in Section 3. The current water resource situation, for both surface and groundwater, for the catchments that are important to Umgeni Water’s operational requirements, is described in Section 5. Climatic impacts on these water resources and the potential future impacts of climate change are presented. Future water resource development plans for these catchments, as well as alternatives to the traditional resources, are discussed. Linkages are made to the water supply infrastructure development plans that are discussed in Volume 2.
Volume 2 documents the current water supply infrastructure that Umgeni Water utilises for operational purposes and describes the most recent infrastructure plans that have been developed to address the future water demand requirements (Section 6). These plans are aligned to the latest water demand projections and proposed water resources infrastructure developments as presented in Volume I. Section 7 describes the wastewater works currently operated by Umgeni Water, and Section 8 provides individual project sheets for those infrastructure projects discussed in Section 6. All references made throughout the entire Infrastructure Master Plan are listed at the end of each volume.
It is important to note that information presented in this report is in a summarised form and it is recommended that the reader refer to the relevant planning reports if more detail is sought. Since the primary focus of this Infrastructure Master Plan is on Umgeni Water’s existing bulk infrastructure supply network, the water resource infrastructure development plans are not discussed at length. The Department of Water and Sanitation (DWS), as the responsible authority, has undertaken the regional water resource development investigations within Umgeni Water’s area of operation. All of these investigations have been conducted in close collaboration with Umgeni Water and other major stakeholders in order to ensure that integrated planning occurs. Details on these projects can be obtained directly from DWS, Directorate: Options Analysis (East). Cognisance is taken of the initiatives relating to water conservation and water demand management being undertaken by Umgeni Water and the various Water Services Authorities. However, these are not discussed in this Infrastructure Master Plan as they fall outside its primary focus, even though they are within the overall framework of Umgeni Water’s infrastructure planning process. The Infrastructure Master Plan is a dynamic and evolving document. Outputs from current planning studies, and comments received on this document will therefore be taken into account in the preparation of the next update.

ii
T A B L E O F C O N T E N T S Preface .............................................................................................................................................. i Table of Contents ..................................................................................................................................... ii List of Figures .......................................................................................................................................... iv List of Tables ......................................................................................................................................... viii 6. Water Supply ................................................................................................................... 243
6.1 Overview of Systems ....................................................................................................... 243 6.2 Mgeni System .................................................................................................................. 245
6.2.1 Upper Mgeni System ....................................................................................................... 252 6.2.2 Management and Operation of uMgungundlovu WTPs ................................................. 300 6.2.3 Lower Mgeni System ....................................................................................................... 309
6.3 uMkhomazi System ......................................................................................................... 278 6.3.1 Ixopo System ................................................................................................................... 278 6.3.2 Status Quo and Limitations ............................................................................................. 282 6.3.3 Recommendations........................................................................................................... 287
6.4 South Coast System ......................................................................................................... 291 6.4.1 Description ...................................................................................................................... 291 6.4.2 Status Quo and Limitations ............................................................................................. 316 6.4.3 Recommendations........................................................................................................... 332
6.5 North Coast System ......................................................................................................... 334 6.5.1 Description ...................................................................................................................... 334 6.5.2 Status Quo and Limitations ............................................................................................. 361 6.5.3 Recommendations........................................................................................................... 371
7. Wastewater ..................................................................................................................... 373 7.1 Overview .......................................................................................................................... 373 7.2 Umgeni Water Owned Wastewater Works ..................................................................... 373
7.2.1 Darvill Wastewater Works ............................................................................................... 373 7.2.2 Ixopo Wastewater Works ................................................................................................ 381 7.2.3 Albert Falls North and South Wastewater Works ........................................................... 385
7.3 Umgeni Water Operated Wastewater Works ................................................................. 388 7.3.1 Howick Wastewater Works ............................................................................................. 388 7.3.2 Mpophomeni Wastewater Works ................................................................................... 392 7.3.3 Lynnfield Park Wastewater Works .................................................................................. 394 7.3.4 Mpofana Wastewater Works .......................................................................................... 396 7.3.5 Appelsbosch Wastewater Works .................................................................................... 399 7.3.6 Cool Air Wastewater Works ............................................................................................ 401 7.3.7 Camperdown Wastewater Works ................................................................................... 403 7.3.8 Richmond Wastewater Works ......................................................................................... 405
8. Recommended Projects .................................................................................................. 408 8.1 Overview .......................................................................................................................... 408 8.2 uMkhomazi System ......................................................................................................... 413
8.2.1 uMkhomazi Water Project .............................................................................................. 413 8.2.2 Impendle BWSS ............................................................................................................... 418 8.2.3 uMzimkhulu Bulk Water Supply Scheme ........................................................................ 421
8.3 Mooi System .................................................................................................................... 425 8.3.1 Greater Mpofana Bulk Water Supply .............................................................................. 425
8.4 Mgeni System .................................................................................................................. 430 8.4.1 ‘251 Raw Water Pipeline: Midmar Dam to Midmar WTP ............................................... 430

iii
8.4.2 Midmar Water Treatment Plant Upgrade ....................................................................... 433 8.4.3 Howick-West Reservoir Upgrade .................................................................................... 436 8.4.4 Groenekloof Reservoir Upgrade ...................................................................................... 439 8.4.5 Umbumbulu Pump Station .............................................................................................. 441 8.4.6 uMshwathi Regional Bulk Water Supply Scheme ........................................................... 443 8.4.7 Wartburg to Bruyns Hill Pipeline ..................................................................................... 447 8.4.8 Vulindlela Upgrade .......................................................................................................... 449 8.4.9 Table Mountain Upgrade ................................................................................................ 452 8.4.10 Hydropower unit at the Mpofana outfall ........................................................................ 455
8.5 South Coast System ......................................................................................................... 457 8.5.1 Nungwane Raw Water Pipeline ....................................................................................... 457 8.5.2 South Coast Pipeline 2b – Kelso to Malangeni ................................................................ 459 8.5.3 Mhlabatshane Bulk Water Supply Scheme Phase 2 ........................................................ 462 8.5.4 Lower uMkhomazi Bulk Water Supply Scheme ............................................................... 465
8.6 North Coast System ......................................................................................................... 469 8.6.1 uMshwathi Regional Bulk Water Supply Scheme Phase 4 (Southern Ndwedwe Bulk
Water Supply Scheme ) ................................................................................................... 469 8.6.2 Lower Thukela Bulk Water Supply Scheme – Phase 2 ..................................................... 473 8.6.3 Maphumulo Bulk Water Supply Scheme ......................................................................... 476
8.7 Elysium Desalination Plant .............................................................................................. 479 8.8 Darvill Wastewater Works Upgrade ................................................................................ 482 8.9 Mpophomeni Wastewater Works Upgrade .................................................................... 487 8.10 Trust Feeds Wastewater Works ...................................................................................... 490 8.11 Richmond Wastewater Works Upgrade .......................................................................... 493
References .............................................................................................................................................. I Acknowledgements ................................................................................................................................ VII

iv
L I S T O F F I G U R E S Figure 6.1 Water infrastructure system configurations and linkages. ............................................ 244 Figure 6.2 General layout of the Mgeni System. ............................................................................. 246 Figure 6.3 Network chart of the Mgeni System. ............................................................................. 247 Figure 6.4 General layout of the Upper Mgeni System. .................................................................. 248 Figure 6.5 Schematic of the Upper Mgeni System. ......................................................................... 249 Figure 6.6 General layout of the Lower Mgeni System. .................................................................. 250 Figure 6.7 Schematic of the Lower Mgeni System. ......................................................................... 251 Figure 6.8 Midmar Water Treatment Plant. .................................................................................... 253 Figure 6.9 General Layout of the Howick-North Sub-System. ........................................................ 257 Figure 6.10 General Layout of the Howick-West Sub-System........................................................... 258 Figure 6.11 General Layout of the Midmar WTP to Umlaas Road Reservoir Sub-System. ............... 264 Figure 6.12 Pipeline configuration between D.V. Harris WTP and World’s View Reservoir. ............ 267 Figure 6.13 General Layout of the Umlaas Road Reservoir Sub-System. .......................................... 271 Figure 6.14 D.V. Harris Water Treatment Plant. ............................................................................... 273 Figure 6.15 General Layout of the Warburg Sub-System. ................................................................. 277 Figure 6.16 Distribution of Demands in Upper Mgeni per WSAs (October 2016). ........................... 282 Figure 6.17 Water demand from Midmar WTP. ............................................................................... 284 Figure 6.18 Analysis of historical production at Midmar WTP (November 2015 to October
2016). .............................................................................................................................. 285 Figure 6.19 Water demand from D. V. Harris WTP. .......................................................................... 289 Figure 6.20 Analysis of historical production at D.V. Harris WTP (November 2015 to October
2016). .............................................................................................................................. 290 Figure 6.21 Demand on the Upper Mgeni System as at October 2016. ........................................... 292 Figure 6.22 Five year demand projection for the Upper Mgeni System. .......................................... 293 Figure 6.23 Ten year demand projection for the Upper Mgeni System. .......................................... 294 Figure 6.24 Twenty year demand projection for the Upper Mgeni System. .................................... 295 Figure 6.25 Thirty year demand projection for the Upper Mgeni System. ....................................... 296 Figure 6.26 General layout of the four uMgungundlovu WTPs being operated and managed by
Umgeni Water. ............................................................................................................... 301 Figure 6.27 Dam supplying Appelsbosch WTP (Umgeni Water 2015). ............................................. 303 Figure 6.28 Schematic of the Appelsbosch System (subject to verification). ................................... 303 Figure 6.29 Lidgetton WTP sand wash bays with old dosing system (uMgungundlovu District
Municipality 2010) .......................................................................................................... 305 Figure 6.30 Schematic of the Lidgetton System (subject to verification). ........................................ 305 Figure 6.31 Schematic of the Mpofana System (subject to verification). ......................................... 306 Figure 6.32 Mpofana WTP (uMgungundlovu District Municipality 2010). ....................................... 307 Figure 6.33 Rosetta WTP (uMgungundlovu District Municipality 2010). .......................................... 307 Figure 6.34 Schematic of the Rosetta System (subject to verification). ........................................... 309 Figure 6.35 Layout of the Central Supply System. ............................................................................ 311 Figure 6.36 Analysis of historical production at Durban Heights WTP from November 2015 to
October 2016. ................................................................................................................. 319 Figure 6.37 Historical demand curve for Durban Heights WTP. ....................................................... 320 Figure 6.38 Extent of the South Coast Augmentation Scheme. ........................................................ 321 Figure 6.39 Analysis of historical production at Wiggins WTP from November 2015 to October
2016. ............................................................................................................................... 322 Figure 6.40 Historical demand curve for Wiggins WTP. .................................................................... 322 Figure 6.41 Maphephethwa Water Treatment Plant. ....................................................................... 324

v
Figure 6.42 Analysis of historical production at Maphephethwa WTP from November 2015 to October 2016. ................................................................................................................. 325
Figure 6.43 Historical demand curve and projections for Maphephethwa WTP. ............................. 326 Figure 6.44 Schematic of the Lower Mgeni System. ......................................................................... 327 Figure 6.45 Ixopo Water Treatment Plant. ........................................................................................ 278 Figure 6.46 Schematic of the Ixopo System. ..................................................................................... 279 Figure 6.47 General layout of the Ixopo System. .............................................................................. 280 Figure 6.48 Water Demand from Ixopo WTP. ................................................................................... 283 Figure 6.49 Analysis of historical production at Ixopo WTP (November 2015 to October 2016). .... 284 Figure 6.50 General layout of the two emergency projects implemented to mitigate the risk of
non-supply to Harry Gwala District Municipality. .......................................................... 286 Figure 6.51 Dam Level and Rainfall at Home Farm Dam (March 2015 to December 2016). ............ 287 Figure 6.52 General layout of the South Coast System. .................................................................... 292 Figure 6.53 Schematic of the South Coast System (including Ugu District Municipality bulk
supply infrastructure). .................................................................................................... 293 Figure 6.54 Middle South Coast Region. ........................................................................................... 294 Figure 6.55 Amanzimtoti Water Treatment Plant ............................................................................. 295 Figure 6.56 Amanzimtoti WTP to Quarry Reservoir. ......................................................................... 296 Figure 6.57 Craigieburn Water Treatment Plant (decommissioned). ............................................... 298 Figure 6.58 Umzinto Water Treatment Plant. ................................................................................... 301 Figure 6.59 Umzinto Supply System. ................................................................................................. 303 Figure 6.60 Mtwalume Water Treatment Plant. ............................................................................... 308 Figure 6.61 Mhlabatshane Supply System. ....................................................................................... 312 Figure 6.62 Analysis of historical production at Amanzimtoti WTP (November 2015 to October
2016). .............................................................................................................................. 317 Figure 6.63 Analysis of historical production at Umzinto WTP (November 2015 to October
2016). .............................................................................................................................. 318 Figure 6.64 Analysis of historical production at Mtwalume WTP (November 2015 to October
2016). .............................................................................................................................. 319 Figure 6.65 Analysis of historical production at Mhlabatshane WTP (November 2015 to
October 2016). ............................................................................................................... 320 Figure 6.66 Demand on the South Coast System as at November 2016. ......................................... 321 Figure 6.67 Five year demand projection for the South Coast System. ............................................ 322 Figure 6.68 Ten year demand projection for the South Coast System. ............................................ 323 Figure 6.69 Fifteen year demand projection for the South Coast System. ....................................... 324 Figure 6.70 Twenty year demand and projection for the South Coast System. ............................... 325 Figure 6.71 Thirty year demand projection for the South Coast System. ......................................... 326 Figure 6.72 Water demand from Amanzimtoti WTP. ....................................................................... 328 Figure 6.73 Water demand from Umzinto WTP. ............................................................................... 329 Figure 6.74 Water demand from Mtwalume WTP. ........................................................................... 330 Figure 6.75 Water demand from Mhlabatshane WTP ...................................................................... 331 Figure 6.76 General layout of the North Coast Supply System. ........................................................ 335 Figure 6.77 Detailed layout of the North Coast Supply System. ....................................................... 336 Figure 6.78 Schematic of the North Coast Supply System. ............................................................... 337 Figure 6.79 Hazelmere Water Treatment Plant. ............................................................................... 338 Figure 6.80 Layout of the Hazelmere/Ndwedwe sub-system. .......................................................... 342 Figure 6.81 Lower Thukela Water Treatment Plant (November 2016)............................................. 351 Figure 6.82 Layout of the Lower Thukela Bulk Water Supply Scheme. ............................................. 352 Figure 6.83 General layout of the Maphumulo BWSS. ..................................................................... 356 Figure 6.84 Schematic of the Maphumulo Supply System. ............................................................... 357 Figure 6.85 Layout of uThogathi Emergency Transfer. ..................................................................... 361

vi
Figure 6.86 Water demand from Hazelmere WTP. ........................................................................... 362 Figure 6.87 Analysis of historical production at Hazelmere WTP (November 2015 to October
2016). .............................................................................................................................. 362 Figure 6.88 Water demand from Mvoti WTP. ................................................................................... 363 Figure 6.89 Analysis of historical production at Mvoti WTP (November 2015 to October 2016). ... 364 Figure 6.90 Analysis of historical production at Maphumulo WTP (November 2015 to
October 2016). ............................................................................................................... 365 Figure 6.91 Demand on the North Coast Supply System as at May 2017 ......................................... 366 Figure 6.92 Five year demand forecast for the North Coast Supply System. ................................... 367 Figure 6.93 Ten year demand forecast for the North Coast Supply System. .................................... 368 Figure 6.94 Twenty year demand forecast for the North Coast Supply System. .............................. 369 Figure 6.95 Thirty year demand forecast for the North Coast Supply System.................................. 370 Figure 7.1 Location of Umgeni Water operated WWWs within the water infrastructure
systems. .......................................................................................................................... 374 Figure 7.2 Location of WWWs operated by Umgeni Water. ........................................................... 375 Figure 7.3 Average Daily Inflow (Mℓ/day) to Darvill WWW............................................................ 376 Figure 7.4 Projected Inflow into Darvill WWW ............................................................................... 377 Figure 7.5 Darvill WWW Anaerobic Digesters Upgrade. ................................................................. 378 Figure 7.6 Location of Darvill WWW in relation to the collection system. ..................................... 380 Figure 7.7 Average daily inflow (Ml/day) for Ixopo WWW. ............................................................ 381 Figure 7.8 Ixopo WWW New Clarifier (No 2). ................................................................................. 383 Figure 7.9 Location of Ixopo WWW. ............................................................................................... 384 Figure 7.10 Sequencing Batch Reactor (SBR) Albert Falls North WWW. .......................................... 385 Figure 7.11 Location of Albert Falls North and South WWW. ........................................................... 386 Figure 7.12 Location of Howick WWW. ............................................................................................. 389 Figure 7.13 Chlorine Contact Tank Howick WWW. ........................................................................... 390 Figure 7.14 Howick WWW Average Daily Outflows (Mℓ/day). ......................................................... 390 Figure 7.15 Location of decommissioned Mpophomeni WWW. ...................................................... 393 Figure 7.16 Location of Lynnfield Park WWW. .................................................................................. 395 Figure 7.17 Lynnfield Park WWW Aeration Tanks. ........................................................................... 396 Figure 7.18 Location of the Mpofana WWW. ................................................................................... 397 Figure 7.19 Location of the Appelsbosch WWW. .............................................................................. 400 Figure 7.20 Location of the Cool Air WWW. ..................................................................................... 402 Figure 7.21 Location of the Camperdown WWW. ............................................................................ 404 Figure 7.22 Location of the Richmond WWW. .................................................................................. 406 Figure 7.23 Richmond WWW clarifier. .............................................................................................. 407 Figure 8.1 Recommended projects per system. .............................................................................. 409 Figure 8.2 Areas that are anticipated to be supplied by Umgeni Water’s proposed projects. ....... 410 Figure 8.3 Proposed projects within uMgungundlovu WSA and the areas anticipated to be
supplied. ......................................................................................................................... 410 Figure 8.4 Proposed projects within eThekwini WSA and the areas anticipated to be
supplied. ......................................................................................................................... 411 Figure 8.5 Proposed projects within Harry Gwala WSA and the areas anticipated to be
supplied. ......................................................................................................................... 411 Figure 8.6 Proposed projects within Ugu WSA and the areas anticipated to be supplied. ............ 412 Figure 8.7 Proposed projects within iLembe WSA and the areas anticipated to be supplied. ....... 412 Figure 8.8 uMkhomazi Water Project. ............................................................................................ 414 Figure 8.9 Layout of Water Treatment Plant. ................................................................................. 415 Figure 8.10 Layout of pipeline. .......................................................................................................... 416 Figure 8.11 General layout of the Impendle Project Areas. .............................................................. 420 Figure 8.12 Proposed uMzimkhulu Bulk Water Supply Scheme. ...................................................... 423

vii
Figure 8.13 Greater Mpofana Bulk Water Supply Scheme. .............................................................. 426 Figure 8.14 Schematic of Greater Mpofana BWSS. ........................................................................... 427 Figure 8.15 General Layout of the ‘251 Raw Water Pipeline: Midmar Dam to Midmar WTP. ......... 431 Figure 8.16 General Layout of Midmar WTP upgrade. ..................................................................... 435 Figure 8.17 General layout of the proposed Howick-West Reservoir. .............................................. 437 Figure 8.18 General layout of the Groenekloof Reservoir Upgrade. ................................................ 440 Figure 8.19 General layout of the Umbumbulu Pump Station Upgrade. .......................................... 442 Figure 8.20 General layout of the uMshwathi Regional BWSS. ........................................................ 446 Figure 8.21 Wartburg to Bruyns Hill Pipeline. ................................................................................... 448 Figure 8.22 General layout of the Vulindlela System. ....................................................................... 449 Figure 8.23 Vulindlela Upgrade. ........................................................................................................ 451 Figure 8.24 Table Mountain Upgrade. .............................................................................................. 453 Figure 8.25 Layout of the proposed hydropower unit at the Mpofana Outfall. ............................... 456 Figure 8.26 General layout of the Nungwane Pipeline. .................................................................... 458 Figure 8.27 General layout of the proposed South Coast Pipeline Phase 2b. ................................... 460 Figure 8.28 General layout of the Mhlabatshane BWSS Phase 2. ..................................................... 463 Figure 8.29 Water Balance Mhlabatshane BWSS. ............................................................................. 464 Figure 8.30 Water Balance Upper and Middle South Coast. ............................................................. 465 Figure 8.31 Layout of the proposed Lower uMkhomazi BWSS. ........................................................ 466 Figure 8.32 Layout of the proposed uMshwathi RBWSS Phase 4. .................................................... 471 Figure 8.33 Lower uThukela Bulk Water Supply Scheme – Phase 2.................................................. 474 Figure 8.34 Layout of the proposed Maphumulo BWSS Phase 4. ..................................................... 477 Figure 8.35 Proposed Elysium desalination sites. ............................................................................. 481 Figure 8.36 Upgrade of Darvill WWW. .............................................................................................. 484 Figure 8.37 Darvill Anaerobic digester under construction. ............................................................. 485 Figure 8.38 Activated sludge tanks showing diffusers. ..................................................................... 486 Figure 8.39 Upgrade of Mpophomeni WWW. .................................................................................. 488 Figure 8.40 Trust Feeds WWW upgrade. .......................................................................................... 491 Figure 8.41 Richmond WWW upgrade. ............................................................................................. 494

viii
L I S T O F TA B L E S Table 6.1 Sub-divisions of the Upper Mgeni System. ................................................................... 252 Table 6.2 Characteristics of the Midmar WTP. ............................................................................. 254 Table 6.3 Pipeline details: ‘251 Pipeline. ...................................................................................... 255 Table 6.4 Pump station details: Midmar Raw Water Pump Station. ............................................ 255 Table 6.5 Clearwell details: Midmar WTP. .................................................................................... 255 Table 6.6 Reservoir details: Howick-North Reservoir Complex. ................................................... 259 Table 6.7 Pump details: Howick-North Sub-System. .................................................................... 259 Table 6.8 Pipeline details: Howick-North Sub-System. ................................................................. 259 Table 6.9 Pump details: Howick-West Sub-System. ..................................................................... 260 Table 6.10 Reservoir details: Howick-West Sub-System................................................................. 261 Table 6.11 Pipeline details: Howick-West Sub-System. .................................................................. 262 Table 6.12 Reservoir details: Midmar WTP to Umlaas Road Reservoir Sub-System. ..................... 265 Table 6.13 Tunnel details: Upper Mgeni System. ........................................................................... 265 Table 6.14 Pipeline details: Midmar WTP to Umlaas Road Reservoir Sub-System. ....................... 266 Table 6.15 Pump details: Thornville/Hopewell Supply. .................................................................. 269 Table 6.16 Reservoir details: Umlaas Road Reservoir Sub-System. ................................................ 272 Table 6.17 Pipeline details: Umlaas Road Reservoir Sub-System. .................................................. 272 Table 6.18 Characteristics of D.V. Harris WTP. ............................................................................... 274 Table 6.19 Details of the D.V. Harris clearwells. ............................................................................. 275 Table 6.20 Pipeline details: ’51 Pipeline. ........................................................................................ 275 Table 6.21 Pipeline details: Wartburg Sub-System. ........................................................................ 279 Table 6.22 Pump details: Wartburg Sub-System. ........................................................................... 280 Table 6.23 Reservoir details: Wartburg Sub-System. ..................................................................... 281 Table 6.24 Characteristics of the Appelsbosch WTP....................................................................... 302 Table 6.25 Characteristics of the Lidgetton WTP. ........................................................................... 304 Table 6.26 Characteristics of the Rosetta WTP. .............................................................................. 308 Table 6.27 Characteristics of the Durban Heights WTP. ................................................................. 310 Table 6.28 Tunnel details: Nagle Aqueduct System........................................................................ 312 Table 6.29 Siphon Pipeline details: Nagle Aqueducts. .................................................................... 314 Table 6.30 Reservoir details: Durban Heights WTP. ...................................................................... 314 Table 6.31 Pump details: Durban Heights WTP. ............................................................................. 314 Table 6.32 Characteristics of the Wiggins WTP. ............................................................................. 315 Table 6.33 Tunnel details: Inanda-Wiggins Aqueduct System. ....................................................... 316 Table 6.34 Pipeline details: Inanda-Wiggins Aqueduct. ................................................................. 316 Table 6.35 Reservoir details: Wiggins WTP. ................................................................................... 317 Table 6.36 Pump details: Wiggins WTP. ......................................................................................... 317 Table 6.37 Characteristics of the Maphephethwa WTP. ................................................................ 318 Table 6.38 Pipeline details: Ixopo System....................................................................................... 281 Table 6.39 Pump details: Ixopo System. ......................................................................................... 281 Table 6.40 Reservoir details: Ixopo System. ................................................................................... 281 Table 6.41 Characteristics of the Ixopo WTP. ................................................................................. 282 Table 6.42 Characteristics of the Amanzimtoti WTP. ..................................................................... 297 Table 6.43 Pipeline details: South Coast System. ........................................................................... 299 Table 6.44 Pump details: Mnini Pump Station................................................................................ 299 Table 6.45 Reservoir details: Upper and Middle South Coast Sub-Systems. .................................. 300 Table 6.46 Pump details: Upper and Middle South Coast Sub-Systems. ........................................ 300 Table 6.47 Characteristics of the Umzinto WTP. ............................................................................ 302 Table 6.48 Pipeline details: Umzinto Raw Water Supply System. .................................................. 304

ix
Table 6.49 Pump details: Umzinto Supply System. ......................................................................... 305 Table 6.50 Reservoir details: Umzinto Supply System. ................................................................... 306 Table 6.51 Characteristics of the Mtwalume WTP. ........................................................................ 309 Table 6.52 Pump details: Mtwalume Supply System. ..................................................................... 310 Table 6.53 Reservoir details: Mtwalume Supply System. ............................................................... 310 Table 6.54 Characteristics of Mhlabatshane WTP. ......................................................................... 313 Table 6.55 Pipeline Details: Mhlabatshane Supply System. .......................................................... 314 Table 6.56 Pump Details: Mhlabatshane Supply System. ............................................................... 314 Table 6.57 Reservoir Details: Mhlabatshane Supply System. ......................................................... 315 Table 6.58 Water Availability: South Coast System. ....................................................................... 316 Table 6.59 Water Availability: South Coast System. ....................................................................... 327 Table 6.60 Characteristics of the Hazelmere WTP. ......................................................................... 339 Table 6.61 Pipeline details: Hazelmere Raw Water Pipeline. ......................................................... 340 Table 6.62 Reservoir details: Hazelmere WTP. ............................................................................... 340 Table 6.63 Pipeline details: Waterloo Pumping Main. ................................................................... 343 Table 6.64 Pump details: Waterloo Pump Station. ......................................................................... 343 Table 6.65 Pipeline details: Grange Pumping Main. ....................................................................... 343 Table 6.66 Pump details: Grange Pump Station. ............................................................................ 344 Table 6.67 Reservoir details: Hazelmere/Ndwedwe Sub-System. .................................................. 344 Table 6.68 Pipeline details: Hazelmere/Ndwedwe Sub-System. .................................................... 345 Table 6.69 Pump details: Hazelmere/Ndwedwe Sub-System. ....................................................... 345 Table 6.70 Pipeline details: Hazelmere/La Mercy/Avondale Sub-System. ..................................... 347 Table 6.71 Reservoir details: Hazelmere/La Mercy/Avondale Sub-System.................................... 347 Table 6.72 Pump details: Hazelmere to La Mercy .......................................................................... 348 Table 6.73 Pump details: Hazelmere to Avondale Sub-System. ..................................................... 348 Table 6.74 Reservoir details: Avondale/Honolulu Sub-System. ..................................................... 348 Table 6.75 Pipeline details: Avondale/Honolulu Sub-System. ........................................................ 349 Table 6.76 Pump details: Avondale/Honolulu Sub-System. ........................................................... 349 Table 6.77 Reservoir details: Honolulu/KwaDukuza Sub-System. .................................................. 349 Table 6.78 Pipeline details: Honolulu/KwaDukuza Sub-System. .................................................... 350 Table 6.79 Pump details: Honolulu/KwaDukuza Sub-System. ........................................................ 350 Table 6.80 Characteristics of the Lower Thukela WTP. .................................................................. 353 Table 6.81 Pipeline details: Lower Thukela Supply System. ........................................................... 354 Table 6.82 Reservoir details: Lower Thukela Supply System. ......................................................... 354 Table 6.83 Pump details: Lower Thukela Supply System ................................................................ 354 Table 6.84 Pump details: Maphumulo BWSS. ................................................................................ 358 Table 6.85 Reservoir details: Maphumulo BWSS. ........................................................................... 358 Table 6.86 Pipeline details: Maphumulo BWSS. ............................................................................. 359 Table 6.87 Characteristics of the Maphumulo WTP. ...................................................................... 360 Table 7.1 Darvill WWW infrastructure. ......................................................................................... 379 Table 7.2 Ixopo WWW infrastructure. .......................................................................................... 382 Table 7.3 Albert Falls North WWW Infrastructure ....................................................................... 387 Table 7.4 Albert Falls South WWW Infrastructure ....................................................................... 387 Table 7.5 Howick WWW infrastructure. ....................................................................................... 391 Table 7.6 Mpophomeni WWW infrastructure. ............................................................................. 392 Table 7.7 Lynnfield WWW infrastructure. .................................................................................... 394 Table 7.8 Mpofana WWW infrastructure. .................................................................................... 398 Table 7.9 Appelsbosch WWW infrastructure. .............................................................................. 399 Table 7.10 Cool Air WWW infrastructure. ...................................................................................... 401 Table 7.11 Camperdown WWW infrastructure. ............................................................................. 403 Table 7.12 Richmond WWW infrastructure.................................................................................... 405

x
Table 8.1 Project description: uMkhomazi Water Project. ........................................................... 416 Table 8.2 Project information: Impendle BWSS. .......................................................................... 419 Table 8.3 Project information: uMzimkhulu Bulk Water Supply Scheme..................................... 422 Table 8.4 Project information: Greater Mpofana Bulk Water Supply Scheme. ............................ 428 Table 8.5 Water forecasts for the Greater Mpofana BWSS. ......................................................... 429 Table 8.6 Project information: ‘251 Raw Water Pipeline from Midmar Dam to Midmar WTP. .. 430 Table 8.7 Project information: Midmar WTP Upgrade. ................................................................ 433 Table 8.8 Storage Requirement at Howick-West Reservoir. ........................................................ 438 Table 8.9 Project information: Howick-West Reservoir Upgrade. ................................................ 438 Table 8.10 Project information: Groenekloof Reservoir Upgrade. ................................................. 439 Table 8.11 Project information: Umbumbulu. ................................................................................ 441 Table 8.12 Project information: uMshwathi Regional Bulk Water Supply Scheme. ....................... 444 Table 8.13 Project information: Vulindlela Upgrade. ..................................................................... 450 Table 8.14 Project information: Table Mountain Upgrade............................................................. 454 Table 8.15 Project information: Nungwane Raw Water Pipeline. .................................................. 457 Table 8.16 Project information: South Coast Pipeline Phase 2b. ................................................. 461 Table 8.17 Project information: Mhlabatshane BWSS Phase 2. .................................................... 462 Table 8.18 Project components and AADD capacity for the Lower uMkhomazi BWSS. ................ 467 Table 8.19 Supply from uMshwathi BRWSS Phase 4 ...................................................................... 470 Table 8.20 Project information: Lower Thukela BWSS – Phase 2 . ................................................. 473 Table 8.21 Project information: Maphumulo BWSS. ..................................................................... 478 Table 8.22 Rural demand to be supplied by the Maphumulo BWSS (MSW 2008). ........................ 478 Table 8.23 Project description: Elysium Desalination Plant. .......................................................... 480 Table 8.24 Project information: Darvill Wastewater Works Upgrade. ........................................... 483 Table 8.25 Project information: Mpophomeni Wastewater Works Upgrade. ............................... 487 Table 8.26 Project information: Trust Feeds Wastewater Works. ................................................. 490 Table 8.27 Project information: Richmond Wastewater Works. .................................................... 493

243
6. WATER SUPPLY
6.1 Overview of Systems All existing water resources and water supply infrastructure utilised by Umgeni Water, as well as the proposed infrastructure, has been categorised into a number of primary systems in order to assist with better describing and understanding the dependencies and interconnectivity between the many components (refer to Figure 6.1). Each of these systems is defined by the catchment which forms the primary, or original, source of water for a particular bulk supply network. The exception here is the South Coast where a number of small adjacent catchments provide the necessary water resources, and hence have been grouped together. These primary systems do not necessarily match the water resource systems described in Section 5 of this Infrastructure Master Plan, which are often regions comprising logically grouped catchments. For further clarity, the larger primary systems have been divided into secondary systems. Within a primary system, and where applicable a secondary system, logical networks of water supply infrastructure have been classified as sub-systems. The larger networks can contain a number of sub-systems. Whilst each water supply system is generally self-contained, in most cases there is interconnectivity between the various systems. Linking the various supply systems such that they can receive potable water from more than one source is important to ensure that a sustainable supply of water can be provided within each system at all times. These linkages therefore form part of the long-term planning processes undertaken by Umgeni Water. Figure 6.1 illustrates all the existing and proposed water system configurations and linkages, and provides a point of reference for Section 6, Section 7 and Section 8 of the IMP 2017. This section of the IMP 2017 describes each of the existing systems and the current and future constraints identified within each. Recommendations on the bulk water supply infrastructure required to alleviate these constraints are also provided within this chapter. The Mooi system currently contains no bulk potable water supply infrastructure that is owned or operated by Umgeni Water, and hence it is not addressed individually in this section. Section 8 discusses the proposed projects within this system. The North Coast System (Section 6.5) discusses existing and proposed bulk potable water supply infrastructure that links the Mdloti, Mvoti and Lower Thukela systems into one integrated system known as the North Coast Supply System (NCSS).

244
Figure 6.1 Water infrastructure system configurations and linkages.

245
6.2 Mgeni System The Mgeni System is an integrated water resource and bulk potable water distribution system comprising two major sub-systems, viz.
The Upper Mgeni System (also referred to as the Inland System) serving the uMgungundlovu District Municipality, Msunduzi Municipality and eThekwini Municipality’s Outer West area; and
The Lower Mgeni System serving the coastal areas and hinterland of the eThekwini Municipality. This sub-system also serves the northern coastal areas of Ugu District Municipality via the South Coast Augmentation Pipeline and the South Coast Pipeline (Section 6.4).
The Mgeni system is shown in Figure 6.2 and Figure 6.3. The water resources of the two sub-systems are located on the same river system and are highly inter-dependant (Section 5.4.4). The respective bulk distribution systems are not inter-connected by Umgeni Water’s infrastructure. Both systems can, however, serve eThekwini Municipality’s Outer West area. Figure 6.4 and Figure 6.5 show the Upper Mgeni System and Figure 6.6 and Figure 6.7, the Lower Mgeni System.

246
Figure 6.2 General layout of the Mgeni System.

247
Mgeni System
Upper Mgeni (Inland) Lower Mgeni (Coastal)
Midmar WTP D.V. Harris WTPDurban Heights
WTPWiggins WTP
Howick-North
Sub-System
Howick-West
Sub-System
Midmar WTP to
Umlaas Road
Sub-System
Umlaas Road
Sub-System
Wartburg Sub-
System
Umgungundlovu DM Umgungundlovu DMUmgungundlovu DM
The Msunduzi LMUmgungundlovu DM
eThekwini MM
Umgungundlovu DM
The Msunduzi LM
eThekwini MM
Ugu DM
eThekwini MMThe Msunduzi LM
Figure 6.3 Network chart of the Mgeni System.

248 Figure 6.4 General layout of the Upper Mgeni System.

249
Figure 6.5 Schematic of the Upper Mgeni System.

250
Figure 6.6 General layout of the Lower Mgeni System.

251
Figure 6.7 Schematic of the Lower Mgeni System.

252
6.2.1 Upper Mgeni System
Description
The Upper Mgeni System currently serves urban, peri-urban and rural settlements within the uMgungundlovu, Msunduzi and eThekwini (Outer West) municipal areas (Figure 6.5). The system extends from Howick/Mpophomeni/Vulindlela in the west, to Wartburg/New Hanover/Dalton in the east, to Cato Ridge/Mpumulanga in the south and to Eston/Umbumbulu in the south west. The system derives its water resource from the upper Mgeni River, fed from Midmar Dam, with periodic augmentation from the Mooi-Mgeni Transfer Scheme (MMTS) (Section 5.4.4). Water is treated at two Water Treatment Plants (WTPs), namely the Midmar WTP located in Howick and the D.V. Harris WTP located in Pietermaritzburg. For the purpose of describing the Upper Mgeni System, it has been divided into Sub-Systems which have been further divided into links. This is illustrated in Table 6.1.
Table 6.1 Sub-divisions of the Upper Mgeni System.
Sub-System Water Treatment Plant
Link
Howick-North Midmar Mill Falls Pump Station to Howick-North Reservoir
Howick-West Midmar Mill Falls Pump Station to Howick-West Reservoir
Howick-West Reservoir to Groenekloof Reservoir
Groenekloof Reservoir Supply Area
Midmar WTP to Umlaas Road Reservoir
Midmar ‘251 Pipeline: Midmar WTP to D.V. Harris Off-Take
’53 Pipeline: D.V. Harris WTP to Umlaas Road Reservoir
’61 Pipeline: D.V. Harris WTP to World’s View Reservoi
’61 Pipeline: World’s View Reservoir to ED2
’61 Pipeline: ED2 to Umlaas Road Reservoir
Ashburton Supply
Richmond Pipeline
Thornville/Hopewell Supply
Umlaas Road Reservoir Midmar & D.V. Harris
’57 Pipeline
Eston / Umbumbulu Pipeline
Lion Park / Manyavu Pipeline
Wartburg D.V. Harris Msunduzi Supply
’69 Pipeline (Claridge Reservoir to Wartburg Reservoir)
Wartburg Reservoir to Bruyns Hill Reservoir
Wartburg Reservoir to Dalton Reservoir

253
Midmar Water Treatment Plant
The Midmar WTP (Figure 6.8, Table 6.2), which was commissioned in 1996, draws raw water from Midmar Dam. Water from the dam is supplied under pumping via the ‘251 Pipeline (Table 6.3). The ‘251 raw water pipeline consists of two sections (one that has recently been constructed and is in the process of being commissioned) – two gravity feed pipelines from the dam to a raw water pump station, and two rising mains from the pump station to the WTP. The new raw water pipeline was implemented as a risk mitigation measure to ensure the sustainability of supply should any one of the mains be out of service. Four pump sets are currently installed in the raw water pump station (3 duty + 1 standby) (Table 6.4). The details for the WTP clearwells are shown in Table 6.5.
Midmar WTP currently has a design capacity of 250 Mℓ/day, although a capacity upgrade to 395 Mℓ/day is currently under construction and completion expected towards the end of 2017. The WTP can operate in excess of 250 Mℓ/day during short peak demand periods. The WTP supplies water to the uMngeni Local Municipality, most of the south-western and southern suburbs of Pietermaritzburg, Greater Edendale, Vulindlela, Thornville, Hopewell, Richmond and the Umlaas Road node via the ’61 Pipeline. It also serves eThekwini Municipality’s Outer West area (comprising Cato Ridge, Georgedale, Camperdown, Gillitts, and Hillcrest), as well as consumers on the Lion Park and Eston-Umbumbulu pipelines from the Umlaas Road node. The primary source of water for the Umlaas Road Reservoir node is the Midmar WTP, although this is supported by a potential maximum of 45 Mℓ/day from the D.V. Harris WTP via the ’53 Pipeline. This, not only reduces the operational risk of having a single pipeline supplying Umlaas Road, but also allows Umgeni Water to transfer some of the demand off the ‘61 Pipeline system, especially during high demand periods and planned outages.
Figure 6.8 Midmar Water Treatment Plant.

254
Table 6.2 Characteristics of the Midmar WTP.
WTP Name: Midmar WTP
System: Upper Mgeni System
Maximum Design Capacity: 250 Mℓ/day
Current Utilisation: 275 Mℓ/day
Raw Water Storage Capacity: 0 Mℓ
Raw Water Supply Capacity: 375 Mℓ/day @ velocity of 2.3 m/s
Pre-Oxidation Type: Pre-chlorination
Primary Water Pre-Treatment Chemical: Polymeric Coagulant
Total Coagulant Dosing Capacity: 35 l/hr (according to Operating Manual)
Rapid Mixing Method: Static Mixer
Clarifier Type: Pulsator Clarifier
Number of Clarifiers: 4
Total Area of all Clarifiers:
Total Capacity of Clarifiers: 375 Mℓ/day
Filter Type: Constant Rate Rapid Gravity Filters
Number of Filters: 12
Filter Floor Type Plate Design
Total Filtration Area of all Filters 837.6 m2
Total Filtration Design Capacity of all Filters: 250 Mℓ/day (50 Mℓ/day x 5 filters – 1 filter offline)
Total Capacity of Backwash Water Tanks: 700 m3
Total Capacity of Sludge Treatment Plant: 360 - 900 m3/hr (rating on thin sludge pumps)
Capacity of Used Washwater System: 10 Mℓ/day
Primary Post Disinfection Type: Chloramination
Disinfection Dosing Capacity: 15 kg/hr
Disinfectant Storage Capacity: 8 x 1 ton full chlorine cylinders + 20 ton of ammonia delivered
Total Treated Water Storage Capacity: 7 Mℓ

255
Table 6.3 Pipeline details: ‘251 Pipeline.
System Pipeline Name From To Length (km) Nominal Diameter
(mm) Material
Capacity * (Mℓ/day)
Age (years)
Upper Mgeni ‘251 Pipeline Midmar Raw Water Pump Station Midmar WTP 3.30 1600 Steel 347.91 0.1
Upper Mgeni ‘251 Pipeline Midmar Dam Midmar Raw Water
Pump Station 0.40 1600 Steel 347.91 20
Upper Mgeni ‘251 Pipeline Midmar Raw Water Pump Station Midmar WTP 3.30 1600 Steel 347.91 20
Upper Mgeni ‘251 Pipeline Midmar WTP Midmar Reservoir 6.50 1600 Steel 347.91 20
Upper Mgeni ‘251 Pipeline Midmar Reservoir D.V. Harris WTP 8.06 1600 Steel 347.91 20
* Based on a velocity of 2 m/s
Table 6.4 Pump station details: Midmar Raw Water Pump Station.
System Pump Station
Name Pump Set
Pump Status Pump Description Supply From Supply To
Static Head (m)
Duty Head (m)
Duty Capacity (Mℓ/day) Duty Standby
Upper Mgeni Midmar Raw Water Pump No 1 Sulzer Bros:SM 602-570 Midmar Dam Midmar WTP 15 35 131
Upper Mgeni Midmar Raw Water Pump No 2 Sulzer Bros:SM 602-570 Midmar Dam Midmar WTP 15 35 131
Upper Mgeni Midmar Raw Water Pump No 3 Sulzer Bros:SM 602-570 Midmar Dam Midmar WTP 15 35 131
Upper Mgeni Midmar Raw Water Pump No 4 Sulzer Bros:SM 602-570 Midmar Dam Midmar WTP 15 35 131
Table 6.5 Clearwell details: Midmar WTP.
System Reservoir Site Reservoir Name Capacity (Mℓ) Reservoir Function TWL
(mASL) FL (mASL)
Upper Mgeni Midmar WTP Midmar Clearwells 7 Bulk 979.00 974.0*
*Assumed value

256
Howick-North Sub-System
The Howick-North Sub-System is shown in Figure 6.9.
Mill Falls Pump Station to Howick-North Reservoir Complex
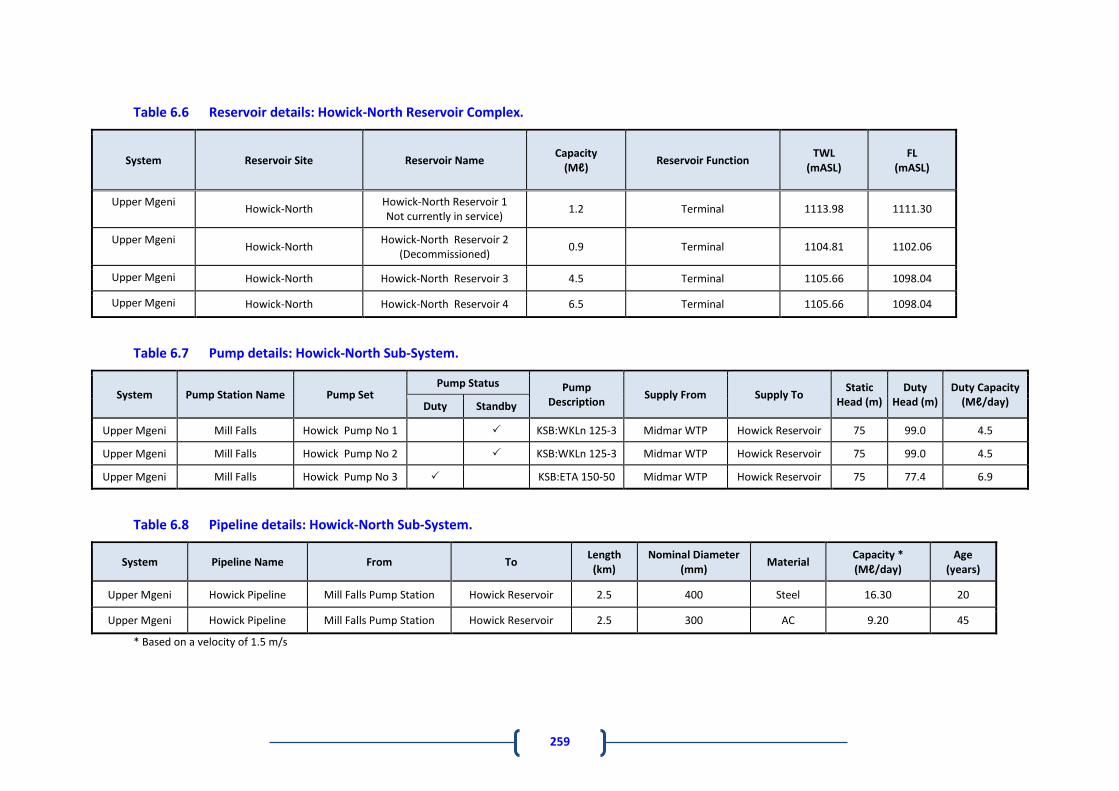
The Howick-North Reservoir Complex consists of four reservoirs having varying top water levels (Table 6.6). Water treated at Midmar WTP is pumped from the Mill Falls Pump Station (Table 6.7) through a 400 mm diameter pipeline (Table 6.8) to Reservoir 3 (4.5 Mℓ/day) via a 300mm diameter pipeline, the new Reservoir 4 (6.5 Mℓ/day) and Reservoir 1 (1.2 Mℓ/day). Howick Reservoir 2 (0.9 Mℓ/day) has now been decommissioned. Howick Reservoir 1 is not currently operational, but future use is expected when a request is received from uMgungundlovu District Municipality to supply water to the high lying areas. The existing 300 mm diameter pipeline from Reservoir 1 to Reservoir 3 will be abandoned. The old supply pipeline (Greendale pipeline) is no longer in use, but has been left in place as an emergency rising main. Alternatively it could be used, in future, as a back-feed reticulation line by uMgungundlovu District Municipality (Table 6.8).
Howick-West Sub-System
The Howick-West Sub-System is shown in Figure 6.10.
Mill Falls Pump Station to Howick-West Reservoir
Water from the Mill Falls Pump Station (Table 6.9) is also pumped to the Howick-West Reservoir Complex (Table 6.10) through a 700 mm diameter pipeline (Table 6.11). The original 375 mm diameter supply line from Midmar WTP to Howick-West Reservoir is now utilised as a back-feed pipeline (Table 6.11). This back-feed pipeline supplies potable water to Merrivale, a low-cost housing scheme at Howick West, online consumers and the Midmar WTP.
Howick-West Reservoir to Groenekloof Reservoir
The Howick-West Reservoir Complex consists of two 8.25 Mℓ reservoirs (Table 6.10). These reservoirs provide storage for the residential communities in Howick-West and Mpophomeni and also serve as balancing reservoirs within the bulk supply system. Water is pumped from the Howick-West Pump Station (Table 6.9), situated at the Howick-West Reservoir Complex, to the Groenekloof Reservoir through a 600 mm diameter pipeline (’67 Pipeline) (Table 6.11).

257
Figure 6.9 General Layout of the Howick-North Sub-System.

258
Figure 6.10 General Layout of the Howick-West Sub-System.
259
Table 6.6 Reservoir details: Howick-North Reservoir Complex.
System Reservoir Site Reservoir Name Capacity
(Mℓ) Reservoir Function
TWL (mASL)
FL (mASL)
Upper Mgeni Howick-North
Howick-North Reservoir 1 Not currently in service)
1.2 Terminal 1113.98 1111.30
Upper Mgeni Howick-North
Howick-North Reservoir 2 (Decommissioned)
0.9 Terminal 1104.81 1102.06
Upper Mgeni Howick-North Howick-North Reservoir 3 4.5 Terminal 1105.66 1098.04
Upper Mgeni Howick-North Howick-North Reservoir 4 6.5 Terminal 1105.66 1098.04
Table 6.7 Pump details: Howick-North Sub-System.
System Pump Station Name Pump Set Pump Status Pump
Description Supply From Supply To
Static Head (m)
Duty Head (m)
Duty Capacity (Mℓ/day) Duty Standby
Upper Mgeni Mill Falls Howick Pump No 1 KSB:WKLn 125-3 Midmar WTP Howick Reservoir 75 99.0 4.5
Upper Mgeni Mill Falls Howick Pump No 2 KSB:WKLn 125-3 Midmar WTP Howick Reservoir 75 99.0 4.5
Upper Mgeni Mill Falls Howick Pump No 3 KSB:ETA 150-50 Midmar WTP Howick Reservoir 75 77.4 6.9
Table 6.8 Pipeline details: Howick-North Sub-System.
System Pipeline Name From To Length
(km) Nominal Diameter
(mm) Material
Capacity * (Mℓ/day)
Age (years)
Upper Mgeni Howick Pipeline Mill Falls Pump Station Howick Reservoir 2.5 400 Steel 16.30 20
Upper Mgeni Howick Pipeline Mill Falls Pump Station Howick Reservoir 2.5 300 AC 9.20 45
* Based on a velocity of 1.5 m/s

260
Table 6.9 Pump details: Howick-West Sub-System.
System
Pump Station Name
Pump Set
Pump Status Pump Description
Supply From
Supply To
Static Head (m)
Duty Head (m)
Duty Capacity (Mℓ/day)
Duty Standby
Upper Mgeni Mill Falls Howick-West Pump No 1 KSB Midmar WTP Howick-West 86 107 25.1
Upper Mgeni Mill Falls Howick-West Pump No 2 KSB Midmar WTP Howick-West 86 107 25.1
Upper Mgeni Howick-West Mpophomeni Pump No 1 KSB:WKLn 150/3 Howick-West Reservoir Mpophomeni Reservoir 56 120 6.1
Upper Mgeni Howick-West Mpophomeni Pump No 2 KSB:WKLn 150/3 Howick-West Reservoir Mpophomeni Reservoir 56 120 6.1
Upper Mgeni Howick-West Groenekloof No 1 KSB:ROL 250-620 Howick-West Reservoir Groenekloof Reservoir 87 130 18.0
Upper Mgeni Howick-West Groenekloof No 2 KSB:ROL 250-620 Howick-West Reservoir Groenekloof Reservoir 87 130 18.0
Upper Mgeni Groenekloof Low Lift Pump No 1 Amalgamated Power
Eng:DSM 150-46 Groenekloof Reservoir Vulindlela Reservoir 1 103 120 7.1
Upper Mgeni Groenekloof Low Lift Pump No 2 Amalgamated Power Eng:Omega 150-605
Groenekloof Reservoir Vulindlela Reservoir 1 103 120 7.1
Upper Mgeni Groenekloof Low Lift Pump No 3 Amalgamated Power
Eng:DSM 150-46 Groenekloof Reservoir Vulindlela Reservoir 1 103 120 7.1
Upper Mgeni Groenekloof High Lift Pump No 1 Amalgamated Power Eng:RKB Size 200-37
Groenekloof Reservoir Vulindlela Reservoirs 2 - 5 226 351 11
Upper Mgeni Groenekloof High Lift Pump No 2 Amalgamated Power Eng:RKB Size 200-37
Groenekloof Reservoir Vulindlela Reservoirs 2 - 5 226 351 11
Upper Mgeni Groenekloof High Lift Pump No 3 Amalgamated Power
Eng:WL 200/7 Groenekloof Reservoir Vulindlela Reservoirs 2 - 5 226 351 11

261
Table 6.10 Reservoir details: Howick-West Sub-System.
System Reservoir Site Reservoir Name Capacity
(Mℓ) Reservoir Function
TWL (mASL)
FL (mASL)
Upper Mgeni Howick-West Howick-West Reservoir 1 8.3 Distribution 1125.1 1118.1
Upper Mgeni Howick-West Howick-West Reservoir 2 8.3 Distribution 1125.1 1118.1
Upper Mgeni Blackridge Blackridge Reservoir 2.2 Terminal 1006.0 1004.0*
Upper Mgeni Sweetwaters** Sweetwaters Reservoir 0.5 Terminal 1107.0 1103.0
Upper Mgeni Vulindlela Vulindlela Reservoir 1 10.0 Distribution 1313.9 1307.9
Upper Mgeni Vulindlela Vulindlela Reservoir 2 10.0 Distribution 1410.0 1404.0
Upper Mgeni Vulindlela Vulindlela Reservoir 3 0.6 Distribution 1403.9 1399.7
Upper Mgeni Vulindlela Vulindlela Reservoir 4 0.2 Distribution 1425.8 1422.5
Upper Mgeni Vulindlela Vulindlela Reservoir 5 9.2 Distribution 1494.0 1488.0
Upper Mgeni Hilton Groenekloof Reservoir 1 2.3 Distribution 1210.6 1205.1
Upper Mgeni Hilton Groenekloof Reservoir 2 5.0 Distribution 1210.6 1205.4
Upper Mgeni Hilton Groenekloof Reservoir 3 10.0 Distribution 1210.6 1205.1
* Estimated ** Reservoir owned and operated by Msunduzi Municipality

262
Table 6.11 Pipeline details: Howick-West Sub-System.
System Pipeline Name From To Length
(km) Nominal Diameter
(mm) Material
Capacity (Mℓ/day)
Age (years)
Upper Mgeni Howick West Pipeline Mill Falls Pump Station Howick-West Reservoir 3.30 700 Steel 66.6 37
Upper Mgeni Howick West Pipeline Howick-West Reservoir Midmar WTP (Backfeed) 3.40 375 AC 19.0 37
Upper Mgeni Mpophomeni Pipeline Howick-West Pump Station Mpophomeni Reservoir 5.80 250 AC 8.5 37
Upper Mgeni ’67 Pipeline (New) Howick-West Pump Station Groenekloof Reservoir 9.80 600 Steel 49.0 19
Upper Mgeni ’67 Pipeline (Old) - Backfeed Groenekloof Reservoir Howick-West Reservoir 9.80 300 AC 12.2 34
Upper Mgeni Vulindlela Pipeline Groenekloof Pump Station –
Low-Lift Pump Station Vulindlela Reservoir 1 4.25 400 Steel 21.7 20
Upper Mgeni Vulindlela Pipeline Groenekloof Pump Station –
High-Lift Pump Station Vulindlela Reservoir 5 27.90 500 Steel 34.0 20
Upper Mgeni ’56 Pipeline Groenekloof Reservoir Blackridge BPT 7.30 250 uPVC 8.5 32
Upper Mgeni Sweetwaters Pipeline ’56 Pipeline (Upstream of
Blackridge BPT) Sweetwaters Reservoir 4.40 250 uPVC 8.5 32
Upper Mgeni ’56 Pipeline Blackridge BPT Blackridge Reservoir 3.30 250 uPVC 8.5 32

263
Groenekloof Reservoir Supply Area
The Groenekloof Reservoir Complex (Table 6.10) consists of three reservoirs with a combined capacity of 17.27 Mℓ. The Groenekloof Reservoir Complex has a 300 mm diameter back-feed pipeline (old ’67 Pipeline) (Table 6.11) that supplies consumers in Hilton and Cedara. This Complex also supplies the Vulindlela reservoirs and Blackridge Reservoir. A 600 mm diameter pipeline from Groenekloof Reservoir feeds the Groenekloof Pump Station (Table 6.9). The pump station has high-lift pumps that supply Vulindlela Reservoirs 2 - 5 and low-lift pumps that supply Vulindlela Reservoir 1 (Table 6.10). The Vulindlela reservoirs supply the Vulindlela area through a network consisting of reservoirs and reticulation pipelines. Groenekloof Reservoir also supplies Blackridge Reservoir (Table 6.10), through a 250 mm diameter pipeline (’56 Pipeline) (Table 6.11). There is a 160 mm diameter off-take along this pipeline supplying Sweetwaters Reservoir (Table 6.11 and Table 6.10).
Midmar WTP to Umlaas Road Reservoir Sub-System
The Midmar WTP to Umlaas Road Reservoir Sub-System is shown in Figure 6.11.
‘251 Pipeline (Midmar WTP to D.V. Harris Off-Take)
Downstream of Midmar WTP, the ‘251 Pipeline (Table 6.14) conveys potable water via the Midmar Reservoir (Table 6.12) to the inlet of the Midmar Tunnel (Table 6.13). Downstream of the tunnel, the ‘251 Pipeline resumes and delivers water into the ’61 Pipeline (Table 6.14) at Ferncliffe in the vicinity of the D.V. Harris WTP. The ‘251 Pipeline ends at an off-take to the D.V. Harris WTP, and this allows for an emergency supply of potable water to the D.V Harris WTP. While the capacity of this pipeline is 347 Mℓ/day, the flow is restricted to 330 Mℓ/day due to the capacity of the Midmar Tunnel. The Midmar Reservoir is situated on the ‘251 Pipeline, just upstream of the inlet portal of the Midmar Tunnel. As there is limited clear water storage at Midmar WTP itself, Midmar Reservoir serves as the potable water storage facility for the Midmar WTP. It also serves as a break-pressure tank for the ‘251 Pipeline prior to its entry into the tunnel. The reservoir was constructed in 1996 when the supply to the ‘61 Pipeline was transferred across from the D.V. Harris WTP to the then newly constructed Midmar WTP.

264 Figure 6.11 General Layout of the Midmar WTP to Umlaas Road Reservoir Sub-System.

265
Table 6.12 Reservoir details: Midmar WTP to Umlaas Road Reservoir Sub-System.
System Reservoir Site Reservoir Name Capacity
(Mℓ) Reservoir Function
TWL (mASL)
FL (mASL)
Upper Mgeni Cedara Midmar Reservoir 45.0 Bulk 1014.0 1001.0
Upper Mgeni Clarendon Clarendon Reservoir 25.0 Terminal 970.0 965.0*
Upper Mgeni World’s View World’s View Reservoir 80.0 Bulk 962.0 954.8
Upper Mgeni Thornville Thornville Reservoir 2.0 Terminal 954.9 949.7
Upper Mgeni Hopewell Hopewell Reservoir 0.5 Terminal 872.4 864.4
Upper Mgeni Lillifontein Lillifontein Reservoir 5 Bulk 1022.8 1014.8
Upper Mgeni Ashburton Ashburton High-Level Reservoir 0.5 Terminal 775.3 773.3
Upper Mgeni Ferncliffe D.V. Harris Clearwells 4.1 Bulk 978.9 977.1
Upper Mgeni H.D. Hill H.D. Hill (Balancing 1) 22.4 Distribution 869.3 862.4
Upper Mgeni H.D. Hill H.D. Hill (Balancing 2) 22.3 Distribution 869.3 862.4
Upper Mgeni Cedara St. Josephs Reservoir 0.1 Terminal 1074.2 1072.2
* Estimated
Table 6.13 Tunnel details: Upper Mgeni System.
System Name Total Length (m) Height (m) Radius (m) Lining Year Constructed Transition Semi-Arc
Upper Mgeni Midmar Tunnel 6337 1800 1600 Concrete Lined 1996
Upper Mgeni Hilton Tunnel 6215 1800 1600 Concrete Lined 1959
D
R
H

266
Table 6.14 Pipeline details: Midmar WTP to Umlaas Road Reservoir Sub-System.
System Pipeline Name From To Length (km) Nominal Diameter
(mm) Material
Capacity * (Mℓ/day)
Age (years)
Upper Mgeni ‘251 Pipeline Midmar WTP Midmar Reservoir 6.50 1600 Steel 347.9 20
Upper Mgeni ‘251 Pipeline Midmar Tunnel Outlet D.V. Harris WTP 8.06 1600 Steel 347.9 20
Upper Mgeni ’61 Pipeline D.V. Harris WTP World’s View Reservoir 6.20 1000, 900 and 800 Steel 330.0 37
Upper Mgeni ’61 Pipeline World’s View Reservoir H.D. Hill 29.60 1000 and 1000 Steel 271.7 37
Upper Mgeni ’61 Pipeline H.D. Hill ED2 (Duplication) 8.90 1000 and 1000 Steel 271.7 14
Upper Mgeni ’61 Pipeline ED2 Richmond P/L off-take 4.0 800 Steel 87.0 37
Upper Mgeni ’61 Pipeline ED2 Richmond P/L off-take
(Augmentation) 4 1300 Steel 229.5 5
Upper Mgeni ’61 Pipeline Richmond P/L off-take Umlaas Road 13.00 800 Steel 87.0 37
Upper Mgeni ’61 Pipeline ED4 Umlaas Road 13.00 1100 Steel 133 2
Upper Mgeni Ambleton Pipeline Off-Take from ’61 Pipeline Ambleton Reservoir 2.00 160 Steel 3.5 24
Upper Mgeni Ashburton Pipeline Off-Take from ’61 Pipeline Ashburton Reservoir 2.70 160 Galvanised Mild Steel
3.5 24
Upper Mgeni ’Richmond Pipeline Lillifontein Reservoir Thornville Reservoir 1 4.9 350 Steel 6.2 2
Upper Mgeni ’Richmond Pipeline Lillifontein Reservoir Richmond Reservoir 22.6 600 Steel 7.6 2
Upper Mgeni Hopewell Pipeline Thornville Reservoir Hopewell Reservoir 4.91 200 mPVC 5.4 30
Upper Mgeni Thornville Thornville Reservoir De-commissioned Pump
Station 7.90 160/200 Steel/AC 8.9 30
Upper Mgeni Baynesfield Thornville Reservoir Baynesfield 4.95 200 AC 5.4 30
Upper Mgeni ’53 Pipeline D.V. Harris WTP Umlaas Road 26.60 762 Pre-Stressed
Concrete 45.0 58
* Capacity based on velocity of 2 m/s
267
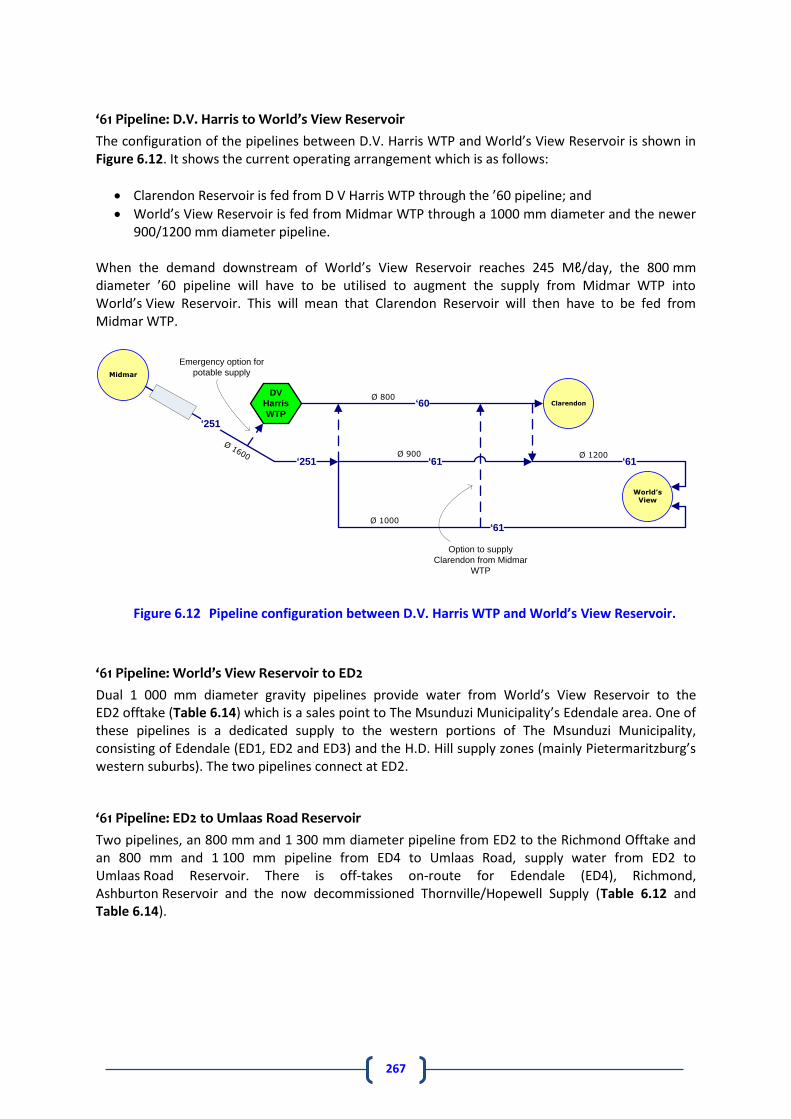
‘61 Pipeline: D.V. Harris to World’s View Reservoir
The configuration of the pipelines between D.V. Harris WTP and World’s View Reservoir is shown in Figure 6.12. It shows the current operating arrangement which is as follows:
Clarendon Reservoir is fed from D V Harris WTP through the ’60 pipeline; and
World’s View Reservoir is fed from Midmar WTP through a 1000 mm diameter and the newer 900/1200 mm diameter pipeline.
When the demand downstream of World’s View Reservoir reaches 245 Mℓ/day, the 800 mm diameter ’60 pipeline will have to be utilised to augment the supply from Midmar WTP into World’s View Reservoir. This will mean that Clarendon Reservoir will then have to be fed from Midmar WTP.
Ø 1200Ø 900
Ø 800
Ø 1000
Ø 1600
Midmar
‘251
DV
Harris
WTP
‘61
‘61
Clarendon
World’s View
‘251
‘60
‘61
Emergency option for
potable supply
Option to supply
Clarendon from Midmar
WTP
Figure 6.12 Pipeline configuration between D.V. Harris WTP and World’s View Reservoir.
‘61 Pipeline: World’s View Reservoir to ED2
Dual 1 000 mm diameter gravity pipelines provide water from World’s View Reservoir to the ED2 offtake (Table 6.14) which is a sales point to The Msunduzi Municipality’s Edendale area. One of these pipelines is a dedicated supply to the western portions of The Msunduzi Municipality, consisting of Edendale (ED1, ED2 and ED3) and the H.D. Hill supply zones (mainly Pietermaritzburg’s western suburbs). The two pipelines connect at ED2.
‘61 Pipeline: ED2 to Umlaas Road Reservoir
Two pipelines, an 800 mm and 1 300 mm diameter pipeline from ED2 to the Richmond Offtake and an 800 mm and 1 100 mm pipeline from ED4 to Umlaas Road, supply water from ED2 to Umlaas Road Reservoir. There is off-takes on-route for Edendale (ED4), Richmond, Ashburton Reservoir and the now decommissioned Thornville/Hopewell Supply (Table 6.12 and Table 6.14).

268
Ashburton Supply
An off-take from the ’61 Pipeline supplies the Ashburton High-Level Reservoir (Table 6.12) through a 160mm diameter galvanised mild steel pipeline (Table 6.14). The reservoir feeds directly into the Msunduzi Municipality’s Ashburton Lower Reservoir. The supply zone of this reservoir is the Ashburton and Lynnfield Park areas.
Richmond/Thornville/Hopewell Supply
A 600 mm diameter off-take from the ’61 Pipeline via the Richmond Pump Station supplies the Lillifontein Reservoir. The Thornville Reservoir (Table 6.12) is supplied under gravity through a 350 mm diameter pipeline (Table 6.15). The reservoir serves the Thornville and Baynesfield area. An off-take on the pipeline to Baynesfield supplies water to the Hopewell Reservoir (Table 6.12) which serves as reticulation storage for the Hopewell community. The “previous” rising main from the ’61 Pipeline to Thornville is now used as a back-feed gravity main to supply users along that line (i.e. supply is now from the Thornville Reservoir to the Thornville Pump Station). The Thornville Pump Station has now been decommissioned.
53 Pipeline: D. V. Harris WTP to Umlaas Road Reservoir
The ’53 Pipeline is a pre-stressed concrete pipeline that was commissioned in 1968 (Table 6.14). It was initially constructed to supply raw water from Midmar Dam to the Umlaas Road WTP. The pipeline was decommissioned in 2002 and the Umlaas Road Reservoir then only received potable water from the Midmar WTP via the ’61 Pipeline. The ’53 Pipeline was re-commissioned in 2006 as a potable pipeline from the D.V. Harris WTP to augment the supply to Umlaas Road Reservoir.

269
Table 6.15 Pump details: Thornville/Hopewell Supply.
System Pump Station
Name Pump Set
Pump Status Pump Description Supply From Supply To
Static Head (m)
Duty Head (m)
Duty Capacity (Mℓ/day) Duty Standby
Upper Mgeni Thornville Thornville Pump No 1 KSB:WKLn 65/4Na ’61 Pipeline Thornville Reservoir 100.0 112.0 1.5
Upper Mgeni Thornville Thornville Pump No 2 KSB:WKLn 65/4Na ’61 Pipeline Thornville Reservoir 100.0 112.0 1.5
Upper Mgeni Thornville Thornville Pump No 3 KSB:WKln 65/4 Na ’61 Pipeline Thornville Reservoir 100.0 112.0 1.5
Upper Mgeni Richmond Richmond Pump No 1 KSB Omega 300-860A ’61 Pipeline Richmond Reservoir 50-140 65-165 *23-44
Upper Mgeni Richmond Richmond Pump No 2 KSB Omega 300-860A ’61 Pipeline Richmond Reservoir 50-140 65-165 *23-44
* Initial to ultimate capacity

270
Umlaas Road Reservoir Sub-System
The Umlaas Road Reservoir Sub-System is shown in Figure 6.13. The Umlaas Road Reservoir Complex consists of a 9 Mℓ reservoir and a 45 Mℓ reservoir (Table 6.16), which is interlinked. The reservoir complex has two off-takes. One feeds the ’57 Pipeline (Table 6.17) and the other the Lion Park Pipeline (Table 6.17).
’57 Pipeline
The ’57 Pipeline consists of three pipelines (800, 1000 and 1600 mm diameter) that run from Umlaas Road Reservoir to Point M, the sales point to eThekwini Municipality (Table 6.17).
Eston/Umbumbulu Pipeline
Downstream of Umlaas Road Reservoir, the Eston/Umbumbulu Pipeline draws water from the 1000 mm diameter ’57 Pipeline. It feeds eThekwini Municipality’s Umbumbulu Reservoir. En route, there is an off-take to the Eston Reservoir (Table 6.16). Further off-takes from this pipeline feed into the Greater Eston Bulk Water Supply Scheme and the Mid Illovu system.
Lion Park / Manyavu Pipeline
There are off-takes along the route of the 800 mm diameter ’57 Pipeline for Mkhambathini Municipality (Table 6.17). The supply to eThekwini Municipality has been decommissioned. A 150 mm diameter AC pipeline and a newly constructed 350 mm diameter steel pipeline, off-take from the ’61 Pipeline, supplies individual consumers along the Lion Park road. This pipeline was extended in 2011 to feed the rural area of Manyavu (Table 6.17).
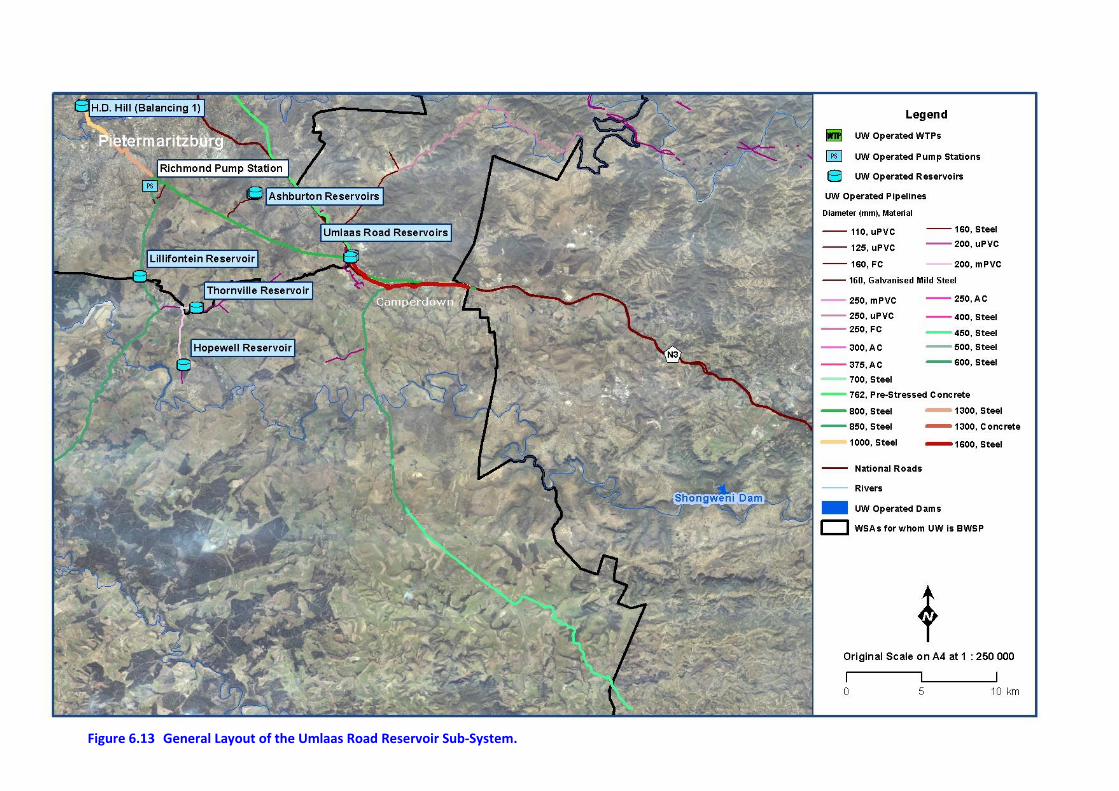
271 Figure 6.13 General Layout of the Umlaas Road Reservoir Sub-System.

272
Table 6.16 Reservoir details: Umlaas Road Reservoir Sub-System.
System Reservoir Site Reservoir Name Capacity
(Mℓ) Reservoir Function
TWL (mASL)
FL (mASL)
Upper Mgeni Umlaas Road Node Umlaas Road Reservoir 1 9.10 Distribution 844.0 837.9
Upper Mgeni Umlaas Road Node Umlaas Road Reservoir 2 45.00 Distribution 844.0 836.8
Upper Mgeni Eston Reservoir 1 Eston Reservoir 1 2.50 Terminal 791.0 786.7
Upper Mgeni Eston Reservoir 2 Eston Reservoir 2 2.50 Terminal 791.0 786.7
Table 6.17 Pipeline details: Umlaas Road Reservoir Sub-System.
System Pipeline Name From To Length
(km) Nominal
Diameter (mm) Material
Capacity * (Mℓ/day)
Age (years)
Upper Mgeni ’57 Pipeline Umlaas Road Cato Ridge Bifurcation 8.60 800 Steel 87.08 44
Upper Mgeni ’57 Pipeline Umlaas Road (Phase 3) Cato Ridge Bifurcation 8.50 1000 Steel 135.90 21
Upper Mgeni ’57 Pipeline Umlaas Road Point M 8.10 1600 Steel 347.00 7
Upper Mgeni Eston-Umbumbulu Pipeline ’57 Pipeline (Phase 3) Eston Reservoir 16.10 600 Steel 48.93 20
Upper Mgeni Eston-Umbumbulu Pipeline Eston Reservoir Umbumbulu 13.10 450 Steel 27.52 12
Upper Mgeni Lion Park Pipeline Umlaas Road Reservoir Lion Park 8.60 160 Steel 3.48 43
Upper Mgeni Lion Park Pipeline Umlaas Road Reservoir Lion Park 8.60 350 Steel 16.6 0.5
Upper Mgeni Lion Park Pipeline Lion Park Consumers along the ’53 Pipeline 4.60 90 HDPE 1.10 13
Upper Mgeni Manyavu Pipeline Lion Park Manyavu 1.00 2.00
13.00
250 160 150
uPVC uPVC
Klambon
8.50 3.50 3.10
6 6 6
* Capacity based on velocity of 2 m/s

273
D.V. Harris Water Treatment Plant
Raw water from Midmar Dam is conveyed under gravity to the D.V Harris WTP (Figure 6.14, Table 6.18) via the 1500 mm diameter ’51 Pipeline (Table 6.20). On route, the raw water passes through a raw water tunnel at Hilton (Table 6.13). The WTP has a design capacity of 110 Mℓ/day, but has accommodated peak demands of up to 125 Mℓ/day in the past. There is no need to expand the plant because it is able to accommodate the maximum raw water available from Midmar Dam. The yield at a 99% assurance of supply at Midmar Dam, with MMTS 1 and MMTS 2, is 476 Mℓ/day. Midmar WTP will treat 376 Mℓ/day and the balance of 100 Mℓ/day will be treated at D.V. Harris WTP.
There is the option for a potable water supply from Midmar WTP through the ‘251 Pipeline into the clearwells of the plant. This serves as an emergency supply should there be planned or unplanned downtime at the plant. From the clearwells (Table 6.19) at the D.V. Harris WTP, potable water is supplied to the Clarendon and Claridge Reservoirs which feed the northern and eastern suburbs of The Msunduzi Municipality, Greater Wartburg and Table Mountain. The WTP also supplies potable water to the Umlaas Road Reservoir via the re-commissioned ‘53 Pipeline (Table 6.14) to feed areas within uMgungundlovu District Municipality and eThekwini Municipality.
Figure 6.14 D.V. Harris Water Treatment Plant.
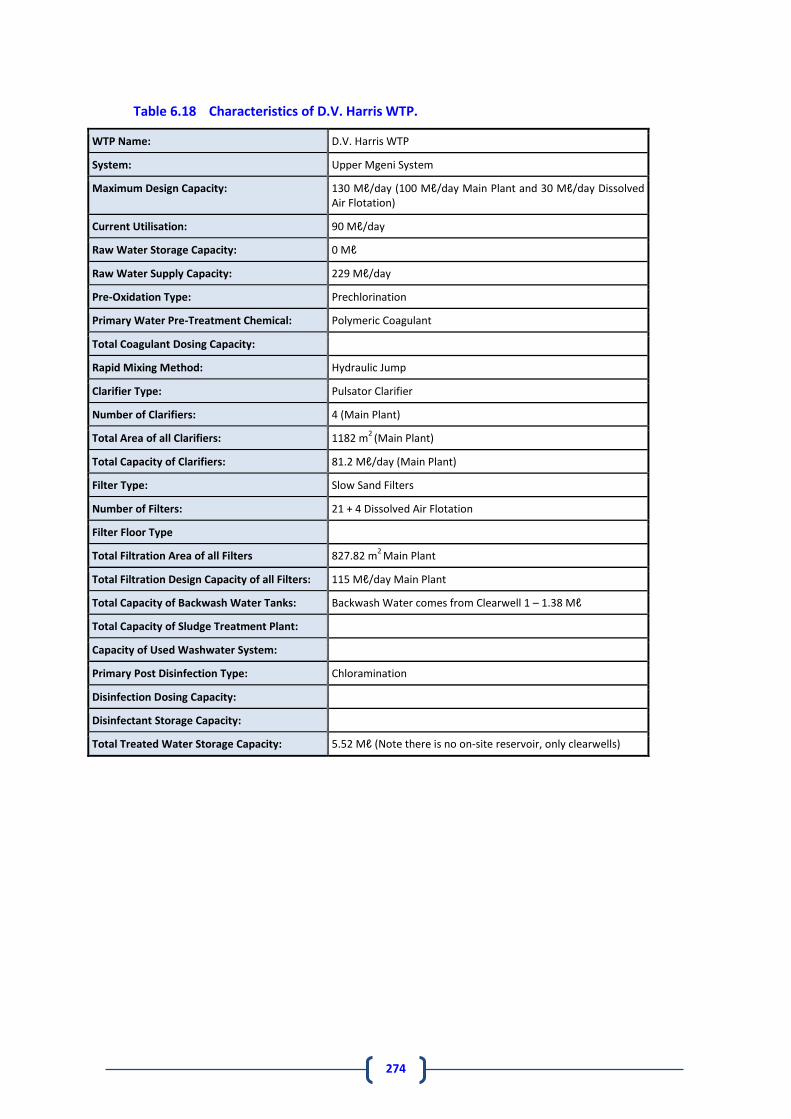
274
Table 6.18 Characteristics of D.V. Harris WTP.
WTP Name: D.V. Harris WTP
System: Upper Mgeni System
Maximum Design Capacity: 130 Mℓ/day (100 Mℓ/day Main Plant and 30 Mℓ/day Dissolved Air Flotation)
Current Utilisation: 90 Mℓ/day
Raw Water Storage Capacity: 0 Mℓ
Raw Water Supply Capacity: 229 Mℓ/day
Pre-Oxidation Type: Prechlorination
Primary Water Pre-Treatment Chemical: Polymeric Coagulant
Total Coagulant Dosing Capacity:
Rapid Mixing Method: Hydraulic Jump
Clarifier Type: Pulsator Clarifier
Number of Clarifiers: 4 (Main Plant)
Total Area of all Clarifiers: 1182 m2
(Main Plant)
Total Capacity of Clarifiers: 81.2 Mℓ/day (Main Plant)
Filter Type: Slow Sand Filters
Number of Filters: 21 + 4 Dissolved Air Flotation
Filter Floor Type
Total Filtration Area of all Filters 827.82 m2
Main Plant
Total Filtration Design Capacity of all Filters: 115 Mℓ/day Main Plant
Total Capacity of Backwash Water Tanks: Backwash Water comes from Clearwell 1 – 1.38 Mℓ
Total Capacity of Sludge Treatment Plant:
Capacity of Used Washwater System:
Primary Post Disinfection Type: Chloramination
Disinfection Dosing Capacity:
Disinfectant Storage Capacity:
Total Treated Water Storage Capacity: 5.52 Mℓ (Note there is no on-site reservoir, only clearwells)

275
Table 6.19 Details of the D.V. Harris clearwells.
System Reservoir Site Reservoir Name Capacity
(Mℓ) Reservoir Function
TWL (mASL)
FL (mASL)
Upper Mgeni D.V. Harris WTP D.V. Harris Clearwells 5.52 Bulk 978.9 977.09
Table 6.20 Pipeline details: ’51 Pipeline.
System Pipeline Name From To Length
(km) Nominal Diameter
(mm) Material
Capacity * (Mℓ/day)
Age (years)
Upper Mgeni ‘51 Pipeline Midmar Dam D.V. Harris WTP 10.80 1 300 Concrete 229.68 58
* Based on a velocity of 2 m/s

276
Wartburg Sub-System
The D.V. Harris WTP supplies the Wartburg Sub-System (Figure 6.15). This includes supply to the Wartburg and Table Mountain areas. Water is sold to The Msunduzi Municipality at the WTP and is then conveyed to Claridge Reservoir. At this point, the water is “bought back” from Msunduzi Municipality to supply Greater Wartburg. Another “buy back” point further downstream of Msunduzi Municipality’s infrastructure at Lower Glen Lyn supplies Table Mountain.
Table Mountain Supply
Umgeni Water purchases water from The Msunduzi Municipality at the municipality’s Lower Glen-Lyn Break Pressure Tank. An off-take from the break pressure tank supplies the Table Mountain Pipeline (Table 6.21), which feeds the Table Mountain Reservoir (Table 6.21), which supplies the rural communities in Table Mountain within the uMgungundlovu District Municipality.
’69 Pipeline (Claridge Reservoir to Wartburg Reservoir)
Umgeni Water’s Wartburg Pipeline, also known as the ‘69 Pipeline, supplies potable water to the Albert Falls, Wartburg, Cool Air, New Hanover, Dalton and Swayimane areas, as well as individual households en-route (Table 6.21). Water is currently conveyed between D.V. Harris WTP and Claridge Reservoir along a 6.7 km long 1 000 mm diameter steel pipeline, which is owned by The Msunduzi Municipality. Umgeni Water buys water back from The Msunduzi Municipality at Claridge Reservoir. Potable water from the Claridge Reservoir flows under gravity through the ’69 Pipeline (see above) to the Wartburg Pump Station (Table 6.22). There are off-takes to Albert Falls, Mpolweni as well as private connections en-route. From the pump station, the ’69 Pipeline continues as a rising main to the Wartburg Reservoir (Table 6.22). Umgeni Water has completed Phase 1 of the uMshwati Bulk Water Supply Scheme (BWSS), which comprises the installation of an 800 mm diameter NB steel pipeline from Claridge Reservoir to Wartburg Reservoir. The new Wartburg Booster Pump Station is currently under construction and will be commissioned towards the end of April 2017. In the interim, the existing Wartburg Booster Pump Station will be used to feed the Wartburg Reservoir along the 800 mm diameter NB steel pipeline. The existing 300 mm diameter NB steel pipeline will be used as a back feed line from Wartburg Reservoir to supply the existing consumers along this line. Similarly, the existing 300 mm diameter NB steel section from Claridge Reservoir will be used to supply the existing consumers and the Albert Falls area.
Wartburg Reservoir to Bruyns Hill Reservoir
Bruyns Hill Reservoir (Table 6.23) is supplied via a 250 mm diameter pipeline from the Wartburg Reservoir. The pipeline is initially a gravity line to the Bruyns Hill Pump Station (Table 6.22) and a rising main to the Bruyns Hill Reservoir. In 2012, this rising main was replaced with a new 250 mm steel pipeline.

277 Figure 6.15 General Layout of the Warburg Sub-System.

278
Wartburg to Dalton
Wartburg Reservoir supplies Cool Air Reservoir via the Dingle Pump Station (Table 6.22). En-route it supplies Trustfeeds and New Hanover. A further pump station at Cool Air Reservoir pumps water to Dalton Reservoir (Table 6.23). Phase 2 of the uMshwati BWSS, which comprises the installation of a 700 mm diameter NB steel pipeline from Wartburg Reservoir to a newly constructed 10 Mℓ Reservoir and a new booster pump station, is currently underway and final commissioning is expected towards the end of November 2017.
Dalton to Oswathini
Phase 3 of the uMshwati BWSS, which comprises the installation of a 700 mm diameter NB steel pipeline from Dalton Reservoir to a new 12 Mℓ Oswathini Reservoir and a new booster pump station, is currently underway and final commissioning is expected towards the end of June 2017 for the Pipeline and December 2018 for the reservoir. There will be an off-take to the Efaye community along this pipeline.

279
Table 6.21 Pipeline details: Wartburg Sub-System.
System Pipeline Name From To Length
(km) Nominal Diameter
(mm) Material
Capacity (Mℓ/day)
Age (years)
Upper Mgeni Table Mountain Pipeline Lower Glen Lyn BPT Table Mountain Reservoir 14.80 125 uPVC 2.12* 58
Upper Mgeni Wartburg Pipeline
(’69 Pipeline) Claridge Reservoir/Belfort
Reservoir Wartburg Break Pressure Tank
and Pump Station 19.30 850 Steel 87** 0.6
Upper Mgeni Wartburg Pipeline
(’69 Pipeline) Wartburg Break Pressure Tank and Pump Station
Wartburg Reservoir 6.80 850 Steel 87** 1
Upper Mgeni Wartburg Pipeline Wartburg Reservoir Dingle Break Pressure Tank and
Pump Station 9.50 250/200 FC 8.50/5.40* 26
Upper Mgeni Wartburg Pipeline Dingle Break Pressure
Tank and Pump Station Cool Air Reservoir 13.90 160 FC 2.60*** 26
Upper Mgeni Wartburg Pipeline Cool Air Reservoir Dalton Pump Station and
Reservoir 1.30 110 uPVC 1.64* 13
Upper Mgeni Bruyns Hill Pipeline Wartburg Reservoir Bruyns Hill Pump Station 9.50 250 mPVC 8.49* 20
Upper Mgeni Bruyns Hill Pipeline Bruyns Hill Pump Station Bruyns Hill Reservoir
(decommissioned in 2012) 3.69 250 uPVC 3.00***
Upper Mgeni Bruyns Hill Pipeline Bruyns Hill Pump Station Bruyns Hill Reservoir 3.69 250 Steel 8.50 6
Upper Mgeni Wartburg Pipeline Wartburg Break Pressure
Tank Mpolweni 160 uPVC 3.48* 19
Upper Mgeni Albert Falls Pipeline Wartburg Pipeline Thokozani Reservoir 10.30 200 uPVC 5.44* 14
* Based on velocity of 2 m/s ** Restricted due to insufficient head *** Restricted due to pipe class

280
Table 6.22 Pump details: Wartburg Sub-System.
System
Pump Station Name
Pump Set
Pump Status Pump Description
Supply From
Supply To
Static Head (m)
Duty Head (m)
Duty Capacity (Mℓ/day)
Duty Standby
Upper Mgeni Cool Air Dalton Pump No 1 KSB:ETA 40-250/5 Cool Air Reservoir Dalton Reservoir 58.0 100.0 0.46
Upper Mgeni Cool Air Dalton Pump No 2 KSB:ETA 40-250/5 Cool Air Reservoir Dalton Reservoir 58.0 100.0 0.46
Upper Mgeni Bruyns Hill Pump No 1 KSB:WKLN 80/2 Wartburg Bruyns Hill 43.0 184 1.63
Upper Mgeni Bruyns Hill Pump No 2 KSB:WKLN 80/2 Wartburg Bruyns Hill 43.0 184 1.63
Upper Mgeni Dingle Pump No1 KSB:WL 65/7 Wartburg Cool-Air Reservoir 178 271 1.17
Upper Mgeni Dingle Pump no 2 KSB:WL 65/7 Wartburg Cool-Air Reservoir 178 271 1.17
Upper Mgeni Table Mountain Pump No 1 KSB:ETA new 60-250 Lower Glen-Lyn Table Mountain
Reservoir 20.0 75.00 1.3
Upper Mgeni Table Mountain Pump No 2 KSB:ETA new 50-250 Lower Glen-Lyn Table Mountain
Reservoir 20.0 75.00 1.3
Upper Mgeni Table Mountain Pump No 3 KSB:F/A 50-250 Lower Glen-Lyn Table Mountain
Reservoir 20.0 75.00 1.3
Upper Mgeni Old Wartburg Pump No 1 KSB:WKLn 5016 No Wartburg Pipeline Wartburg Reservoir 164.0 189.0 0.52
Upper Mgeni Old Wartburg Pump No 2 KSB:WKLn 5016 No Wartburg Pipeline Wartburg Reservoir 164.0 189.0 0.52
Upper Mgeni New Wartburg Pump No 1 KSB:WL -100/4 Wartburg Pipeline Wartburg Reservoir 164.0 239.0 3.24
Upper Mgeni New Wartburg Pump No 2 KSB:WL -100/4 Wartburg Pipeline Wartburg Reservoir 164.0 239.0 3.24

281
Table 6.23 Reservoir details: Wartburg Sub-System.
System Reservoir Site Reservoir Name Capacity
(Mℓ) Reservoir Function
TWL (mASL)
FL (mASL)
Upper Mgeni Wartburg Wartburg Reservoir 1 0.50 Distribution 963.5 958.4
Upper Mgeni Wartburg Wartburg Reservoir 2 1.50 Distribution 963.5 958.7
Upper Mgeni Wartburg Wartburg Reservoir 3 8.0 Distribution 963.5 956.2
Upper Mgeni Belfort Claridge Reservoir 50.00 Distribution 940.3 931.6
Upper Mgeni Bruyns Hill Bruyns Hill Reservoir 1 0.40 Distribution 1006.0 1002.0
Upper Mgeni Bruyns Hill Bruyns Hill Reservoir 2 6.00 Distribution 1006.0 1002.0
Upper Mgeni Cool Air Cool Air Reservoir 0.50 Distribution 1013.1 1008.3
Upper Mgeni PMB East Table Mountain (Int) 0.10 Distribution 909.0 907.0

282
Status Quo and Limitations
The current demand off the Upper Mgeni System is approximately 312.28 Mℓ/day. Figure 6.16 illustrates the distribution of this demand between the three WSAs.
Figure 6.16 Distribution of Demands in Upper Mgeni per WSAs (October 2016).
Over recent years, eThekwini Municipality has put considerable effort into optimising the operation of its distribution systems that are served by the Lower Mgeni System. Amongst other things, this has led to them implementing new infrastructure in order to undertake a significant load shifting exercise. eThekwini Municipality’s Western Aqueduct project, which is expected to be fully commissioned in 2018, will represent the most significant of these load-shifting operations. The intention is for those areas currently being served under pumping from the Lower Mgeni System (viz. from Durban Heights WTP) to be transferred onto the Upper Mgeni System, and served under gravity from Midmar WTP via the Western Aqueduct (WA). These areas include Greater Inanda, KwaDabeka, Mt Moriah and Pinetown South. Further to this, eThekwini Municipality plans to link the WA into their Northern Aqueduct thereby extending this supply to the municipality’s northern areas as far as the Dube TradePort Development Zone. Whilst this measure will free up additional capacity within the Lower Mgeni System, which can then be redirected elsewhere within eThekwini Municipality, it does place considerable additional load on much of Umgeni Water’s infrastructure in the Upper Mgeni System. This includes the ’57, ’61 and ‘251 Pipeline systems, Midmar WTP, and ultimately on the water resources available from Midmar Dam (Section 5.4.4). The augmentation of the ’57 Pipeline (completed in 2011) and the ’61 pipeline (commissioned in 2014) were undertaken in order to provide sufficient capacity in this portion of the supply network to meet the required demands of the WA. Phase 2b of the Mooi-Mgeni Transfer Scheme (MMTS-2) has been commissioned (Section 5.4.4). The 99% assured yield of the Mgeni System, at Midmar Dam, has increased from 322.5 Mℓ/day (117.7 million m3/annum) to 476.2 Mℓ/day (173.8 million m3/annum). However, even an increased yield at Midmar Dam will be insufficient to support the proposed full Western Aqueduct load shift

283
for any significant period of time, and further water resource developments will be required to serve the increasing demand of eThekwini Municipality. After the implementation of MMTS-2, further water resource developments within the Mooi-Mgeni system are not considered to be beneficial. An alternative water resource option that is currently being investigated is the uMkhomazi Water Project (uMWP) (Section 5.4.6) which would transfer raw water from the uMkhomazi River to a WTP near Baynesfield, with potable water then being supplied to the Umlaas Road area to feed into the ’57 Pipeline and subsequently into the WA. A detailed feasibility study of the uMWP is now complete and an EIA is being undertaken for the project. The earliest that it is envisaged that the scheme could be completed and operational is 2026. With Midmar Dam’s yield reaching a maximum value after MMTS-2, it is deemed prudent that all future bulk distribution infrastructure upgrades within the Upper Mgeni System (Midmar WTP - Umlaas Road) be limited to the water resources capacity that Midmar Dam can support (bearing in mind that Midmar Dam must also contribute to the water resource requirements downstream of it). An assessment was undertaken in 2014 to determine the “load shift potential from the Lower Mgeni System to the Upper Mgeni System” (Section 5.4.4.) This study concluded that there will be approximately 118 Mℓ/day available for the Western Aqueduct Phase 2 load shift. The total available for eThekwini Municipality is 213 Mℓ/day. As mentioned in Section 6.2.1, only 330 Mℓ/day is available through the ’61 System after the tunnel. Significant infrastructure costs will need to be incurred to overcome this hydraulic constraint, and taking into account the water resource constraint mentioned above, this upgrade is not considered practical. Hence, the water available to meet demands downstream of Umlaas Road Reservoir is limited until such time as the uMWP is commissioned. Further to this, the available water for eThekwini Municipality will decrease over time as the demands upstream of the Umlaas Road Reservoir increase. The full WA load shift requirement will not be able to be accommodated by the Upper Mgeni System until the uMWP is commissioned.
Midmar Water Treatment Plant
The demand placed on the Midmar Water Treatment Plant, over the past few years, is presented in Figure 6.17. Forecast sales are shown on the same figure. The current average WTP production is approximately 260 Mℓ/day. KwaZulu-Natal is currently in the grip of a severe drought and Umgeni Water has implemented drought mitigation measures to protect the resource, i.e. Midmar Dam by curtailing the draw-off by 15%. If the drought is partly broken during the next rainfall season, it would take at least two seasons of average rainfall to recover the raw water supply system. This is reflected in the demand being constant for the 2016/17 financial year.

284
An analysis of daily historical production (November 2015 to October 2016) of the Midmar WTP is presented in Figure 6.18. It shows that for 87% of the time (98% over the previous period) the WTP was being operated above the optimal operating capacity. This is an 11% decrease from the previous year. The plant operated above design capacity 38% of the time. This is lower than the previous year where the plant operated 85% of the time above its design capacity. This is attributed to the current drought impacts in the Mgeni catchment where a 15% restriction has been imposed since December 2015 on all the Mgeni System users (Msunduzi, uMgungundlovu, eThekwini and part of Ugu Municipality). This restriction will be enforced, in the absence of rainfall, to decrease the risk of non-supply at a later stage. The demands will increase once the system recovers from the current drought. With the imminent implementation of the load transfer of the WA demand onto the Upper Mgeni System, the capacity of Midmar WTP is currently being upgraded to match the available yield of the MMTS-2 transfer scheme. Without this upgrade, Umgeni Water will not be able to accommodate even a partial load shift from 2018. The design of Midmar WTP, fortunately, lends itself to an upgrade to 395 Mℓ/day without major civil construction, as the clarifiers were already upgraded to this capacity during 2003 (Section 8.5).
Figure 6.17 Water demand from Midmar WTP.

285
Figure 6.18 Analysis of historical production at Midmar WTP (November 2015 to October 2016).
Howick-North Sub-System
Mill Falls Pump Station to Howick-North Reservoirs
Howick has been undergoing a sustained period of housing development growth, which has led to an increased demand for water. Furthermore, new developments are currently being implemented, or are planned, for sites located above the command elevation of Howick North’s reservoirs. Interim measures are currently being put in place by developers to boost pressure to supply these developments. Umgeni Water took a decision in this regard and the construction of a 6.5 Mℓ/day reservoir was completed in 2014. The Howick North Reservoir Complex (6.6 Mℓ) functions as a terminal reservoir under the current operating conditions. With the current demand at 4.7 Mℓ/day, the reservoir does not have enough storage to meet its 48 hour storage requirement. A new reservoir, at a higher level, is proposed, to supply future developments. This reservoir, which needs to be constructed by uMgungundlovu District Municipality, will be supplied from the Howick-North Reservoir Complex. The Howick-North Reservoir Complex will thereafter become a distribution reservoir. The pumps at Mill Falls and the pipeline to the reservoir were recently upgraded and hence there is sufficient capacity in this infrastructure for the foreseeable future.
Howick-West Sub-System
Mill Falls Pump Station to Howick-West Reservoir
The pump station and pipeline to Howick-West Reservoir have adequate capacity to serve the long-term demands on Howick-West Reservoir.

286
Howick-West Reservoir to Groenekloof Reservoir
The Howick-West Reservoir (16.5 Mℓ) serves as a distribution reservoir with bulk supply lines to Groenekloof and Mpophomeni reservoirs, and with direct supply into the Howick-West reticulation network. The current demand on this reservoir is approximately 34 Mℓ/day. Water is pumped from the Howick-West Reservoir to Mpophomeni Reservoir (an uMgungundlovu District Municipality reservoir). Off-takes from this pumping main have the effect of continuously changing the system curve which affects the duty point of the pumps. uMngeni Local Municipality has planned a 1500 unit low cost housing development adjacent to Mpophomeni. This development will be phased with the first 500 units expected to be occupied in mid-2016. Phase 1 will result in a 300 kℓ/day increase in demand which will cause the current demand to exceed the capacity of the Mpophomeni pipeline. New infrastructure will be required to meet the future demands.
Groenekloof Reservoir Supply
The 17.3 Mℓ Groenekloof Reservoir serves as a balancing reservoir for Vulindlela, Sweetwaters and Blackridge. The current demand out of Groenekloof Reservoir is 23 Mℓ/day. This demand is expected to increase to 45 Mℓ/day by 2030 when 24 Mℓ of storage will be required (Section 8.8). The high lift pumps to Vulindlela Reservoirs 2-5 have a capacity of about 22 Mℓ/day which is adequate to meet the current demand of 18 Mℓ/day. The high lift pump impellers were upgraded thus increasing the capacity to meet the current demand. The high lift pumps are planned to be upgraded to the ultimate capacity of the pipeline, this being 34 Mℓ/day. A 10 Mℓ Reservoir at Groenekloof Reservoir Complex will be constructed to comply with Umgeni Water’s Reservoir operating philosophy and a high lift pumping system at Vulindlela Pump Station by installing 3 x 22 Mℓ/day pump sets (2 x operating and 1 x standby).
Blackridge Reservoir Supply
The current demand from the Blackridge Reservoir is approximately 1.3 Mℓ/day. The capacity of the reservoir is 2.2 Mℓ. The reservoir functions as a terminal reservoir that should ideally have 48 hours of storage (4 Mℓ). This is a reticulation requirement and the responsibility for the upgrade, therefore lies with the Municipality.
Midmar WTP to Umlaas Road Sub-System
‘251 Pipeline: Midmar WTP to D.V. Harris Off-Take
Due to limiting head conditions in the upper portion of the ‘251 Pipeline, the maximum flow obtainable through this pipeline is 330 Mℓ/day. Augmentation of all pipeline elements downstream of the ‘251 Pipeline should therefore be based on a maximum available flow of 330 Mℓ/day.
Clarendon Reservoir
The current demand from Clarendon Reservoir is about 17.4 Mℓ/day. The capacity of the reservoir is 25 Mℓ. The reservoir functions as a terminal reservoir which should have 48 hours of storage. The reservoir should therefore be upgraded to minimise risk. This is a reticulation requirement and the responsibility to provide this storage requirement lies with the Municipality.

287
’61 Pipeline: D.V. Harris to World’s View Reservoir
This section of pipeline has been recently augmented to accommodate the maximum flow of 330 Mℓ/day. The Worlds View reservoir has two 40 Mℓ compartments and the current throughput is approximately 203 Mℓ/day.
’61 Pipeline: World’s View Reservoir to ED2
This dedicated pipeline serving The Msunduzi Municipality has sufficient capacity to satisfy the growing annual average daily demand (AADD). For a peak flow of 1.3 x AADD the pipeline could reach its capacity by 2030. However, with the proposed interlinking of the two ’61 pipelines and the anticipated relief from the ’61 Pipeline of the WA demand in 2023 (once the uMWP is commissioned), the current pipeline capacity is considered adequate.
’61 Pipeline: ED2 to Umlaas Road Reservoir
The Msunduzi Municipality intends expanding its low income housing in the Shenstone/Ambleton area. These developments will be supplied with potable water from the ED4 off-take. It is therefore expected that the increase in demand at this point will be in the region of 3% annually over the next 10 years. Further downstream of the ED4 off-take is the tie-in to the Richmond pipeline. This pipeline has placed a further demand of 11 Mℓ/day (year 2020) on this section of pipeline. A 1300 mm diameter pipeline was constructed, from ED2 to the Richmond off-take in 2012. This pipeline augments the existing 800mm diameter pipeline so that capacity constraints will not be experienced once the Richmond pipeline is operational.
ED4 to Umlaas Road
To meet the overall present and future demands of the supply area, it was necessary to install a 13 100 m section of 1 100 mm nominal diameter steel pipeline between the ED4 off-take and the Umlaas Road reservoir complex.
Ashburton Supply
The average flow in this pipeline is currently 1.2 Mℓ/day. This system has sufficient capacity for the foreseeable future.
Thornville / Hopewell Supply
The average demand through this pipeline is currently 2.5 Mℓ/day. Thornville Reservoir is now supplied from the Richmond pipeline and the existing Thornville Pump Station has been decommissioned. The rising main from the ’61 Pipeline to Thornville is now a back-feed gravity main.
’53 Pipeline: D. V. Harris WTP to Umlaas Road Reservoir
This pipeline currently supplies about 15 Mℓ/day to Umlaas Road Reservoir. This ageing pipeline has an operational history of frequent bursts and caution has to be taken to not exceed the “safe load carrying capacity” of 45 Mℓ/day.

288
Umlaas Road Sub-System
The current demand at Umlaas Road Reservoir is 96 Mℓ/day (pre-drought conditions). The reservoir serves primarily as a distribution reservoir, supplying reservoirs in Mkhambathini Municipality and eThekwini Municipality. The inlet configuration at the reservoir needs to be upgraded to ensure that the maximum volume from the augmented ’61 Pipeline can be transferred into the Umlaas Road Reservoir. Limited inflow to the reservoir means that peak outflow demands currently cause the reservoir level to decrease to low levels. The inlet constrictions have been removed with the commissioning of the new inlet control chamber.
’57 Pipeline
The existing 800 mm diameter pipeline serves a minimal demand in Camperdown. The combined capacity of the 1000mm diameter and the new 1600 mm diameter pipeline is 485 Mℓ/day which is sufficient to satisfy the future demands of the WA.
Eston/Umbumbulu Pipeline
The capacity of this pipeline is restricted to 15 Mℓ/day due to the ground level profile along the pipeline route. The flow is restricted to ensure that the hydraulic grade line is at least 20 m above a high point at Stoney Ridge. The current flow in this pipeline is 10.3 Mℓ/day. uMgungundlovu District Municipality supplies the Greater Eston area with potable water from this pipeline. This, together with the high growth rate in Umbumbulu and surrounding supply areas means that the flow in this pipeline is insufficient to meet the current demands.
Lion Park / Manyavu Pipeline
The current demand on this pipeline is in the order of 2.5 Mℓ/day. Umgeni Water constructed a pipeline from an off-take on the Lion Park Pipeline to serve the Manyavu community (circa 2007). The Manyavu demand is expected to grow to about 6 Mℓ/day by 2040. Umgeni Water has implemented the upgrade of the Lion Park Pipeline with an additional 350 mm diameter NB steel pipeline to ensure the sustainability of the supply to this area.
D.V. Harris Water Treatment Plant
The demand on the plant is made up of supply to the Msunduzi and uMshwathi Municipalities, as well as a supply to the Umlaas Road Reservoir via the ’53 Pipeline. The supply through the ’53 Pipeline varies between 25 to 35 Mℓ/day depending on the operational requirements at Umlaas Road Reservoir. While Clarendon can be supplied from the Midmar WTP, the current operating rule is to supply Clarendon Reservoir from D.V. Harris WTP to maximise the availability on the ‘251 pipeline to serve the Umlaas Road Sub-System. Due to the configuration of the ’61 Pipelines between D. V. Harris WTP and Clarendon Reservoir (Figure 6.11), it is expected that Clarendon Reservoir will have to be fed from Midmar WTP in 2018. This will relieve the demand placed on D.V. Harris WTP. The demand on the plant will be reduced further when the ’53 Pipeline is decommissioned, which will occur with the commissioning of the uMWP. D.V. Harris WTP will therefore not have to be upgraded within this 30 year horizon. The demand placed on the plant over the past few years is presented in Figure 6.19. Expected sales over the next year are also shown in the same figure. The current production at the plant is approximately 59 Mℓ/day.

289
The impacts of the current drought are shown in the demand being constant for the 2016/17 financial year.
An analysis of daily historical production (November 2015 to October 2016) of the D.V. Harris WTP is presented in Figure 6.20. It shows that for less than 32% of the time the WTP was being operated above the optimal operating capacity compared to 35% over the previous year. The plant operated above design capacity for 1.4% of the time compared to 3% in the previous year. This is attributed to the current drought in the Mgeni catchment where a 15% restriction has been imposed since December 2015 on all the Mgeni System users (Msunduzi, uMgungundlovu, eThekwini and part of Ugu Municipality). This restriction will be enforced, in the absence of rainfall, to decrease the risk of non-supply at a later stage. The demands will increase once the system recovers from the current drought.
Figure 6.19 Water demand from D. V. Harris WTP.

290
Wartburg Sub-System
Msunduzi Supply
The current supply to Msunduzi is approximately 47 Mℓ/day. Besides infill residential development, no major developments are planned that will impact substantially on the storage requirement at Claridge Reservoir.
’69 Pipeline: Claridge Reservoir to Wartburg Reservoir
An analysis of the Wartburg System indicated that the system was reaching its ultimate supply capacity due to increases in demands from existing consumers. The ’69 Pipeline is being upgraded to supply the uMshwathi Municipality and the western areas of iLembe District Municipality. The ’69 Pipeline currently runs at close to its capacity of 9.4 Mℓ/day. In an attempt to increase through put in this pipeline, the Claridge Reservoir was by-passed in 2012. This resulted in an increased head and consequent increased flow. The governing head in the pipe is now from DV Harris WTP. The extension of the existing Wartburg System proved to be the most feasible method of providing a bulk water service to Efaye and Ozwatini. The total length of the new bulk pipelines, currently under construction, including the augmentation and extension is 90km. The project, the uMshwathi Regional Bulk Water Supply Scheme (RBWSS), is currently being implemented in four phases. The construction for Phase 1, a 26 km Pipeline from Claridge to Wartburg, was completed in November 2015.
Figure 6.20 Analysis of historical production at D.V. Harris WTP (November 2015 to October 2016).

291
Wartburg Reservoir to Bruyns Hill Reservoir
The Wartburg Reservoir functions primarily as a bulk reservoir for Bruyns Hill and Cool Air Reservoirs. To function as a bulk reservoir, it should have 15 hours of the AADD supply to Cool Air and Bruyns Hill Reservoirs. Water demands from the Swayimane area have consistently increased over the years. This growth is expected to continue with the planning of further low cost housing in the area. iLembe District Municipality has also requested a supply to its Southern Ndwedwe region from Bruyns Hill. The pipeline from Bruyns Hill Pump Station to Bruyns Hill Reservoir has been upgraded to a 250 mm diameter steel pipe which has a capacity of 8.5 Mℓ/day. There is, however, a hydraulic constraint between Wartburg Reservoir and Bruyns Hill Pump Station. The supply from Wartburg Reservoir to Bruyns Hill Pump Station is currently being augmented to support this new demand node. The storage capacity at Bruyns Hill Reservoir has recently been increased and should be adequate for the next 20 years.
Wartburg Reservoir to Dalton Reservoir
The supply pipelines from Wartburg Reservoir to Dalton are adequate for the current demand. Phases 2 and 3 of the uMshwathi RBWSS are currently under construction and final commissioning of the pipeline is anticipated by November 2017 with the reservoir being commissioned in December 2018.
Recommendations
Figure 6.21, Figure 6.22, Figure 6.23, Figure 6.24 and Figure 6.25 illustrate schematically the Upper Mgeni System in its current configuration and how it will need to be upgraded over the next 30 years to accommodate the future growth in water demands. This Section should be read in conjunction with these Figures. In order to meet the anticipated load shift in demand by eThekwini Municipality from the Lower Mgeni System to the Upper Mgeni System, the following infrastructure projects will be required:
Upgrade of Midmar WTP;
Construction of Phase 1 of the uMkhomazi Water Project; and
Decommissioning of the ’53 Pipeline.

292
Figure 6.21 Demand on the Upper Mgeni System as at October 2016.

293
Figure 6.22 Five year demand projection for the Upper Mgeni System.

294
Figure 6.23 Ten year demand projection for the Upper Mgeni System.

295
Figure 6.24 Twenty year demand projection for the Upper Mgeni System.

296
Figure 6.25 Thirty year demand projection for the Upper Mgeni System.

297
Other infrastructure upgrades and additions that will be required over the next 30 years are:
Increase the capacity of Howick-West Reservoir;
Increase the capacity of Groenekloof Reservoir and Pump Station;
Augmentation of the Vulindlela BWSS;
New infrastructure for the Wartburg System. This will include augmentation of the ’69 Pipeline (Claridge to Wartburg), increase in the capacity of Wartburg Reservoir, a new pipeline from Wartburg Reservoir to a new reservoir at Dalton, a new pipeline to Ozwathini with an off-take to Efaye;
Augmentation of the Wartburg to Bruyns Hill Pump Station and pipework;
Whilst the Clarendon and Blackridge Reservoirs should be upgraded, it is recommended that this requirement be transferred to The Msunduzi Municipality as the additional 48 hour emergency storage requirement is a WSA responsibility.
Augmentation of the Umbumbulu system, construction of a new pump station and pipeline.
Midmar Water Treatment Plant
DWS upgraded the existing Midmar Dam outlet works which feeds both Midmar WTP and D.V. Harris WTP (IMP 2008). The capacity of the 1 600 mm diameter pipeline supplying raw water to Midmar WTP is 348 Mℓ/day at 2 m/s. To meet the increase in demands when the Western Aqueduct is fully commissioned in 2018, the Midmar WTP is being upgraded (Section 8.4.2) from its current treatment capacity of 250 Mℓ/day to 375 Mℓ/day so that the combined capacity of the Midmar WTP and D.V. Harris WTP will be 485 Mℓ/day. This is slightly above the 99% assurance yield of Midmar Dam of 476 Mℓ/day (173.7 million m3/annum) when supported by the MMTS-2. In addition to the WTP upgrade, a new raw water supply pipeline is being constructed whilst also increasing the capacity of the pump station(Section 8.4.1). This will lower the velocity in the raw water pipeline at maximum flow and reduce the risk of non-supply due to failure on the raw water pipeline.
Howick-North Sub-System
Taking into consideration the high-level reservoir required by UMDM to reticulate to newly developed areas to the north of Howick, the Howick Reservoir Complex would serve as a distribution reservoir that should have 36 hours for reticulation storage and 15 hours balancing storage. The total storage is 12.2 Mℓ/day (the previous storage of 6.6 Mℓ was increased with the commissioning of the 6.5 Mℓ reservoir in October 2014).
Howick-West Sub-System
Howick - West Reservoir to Groenekloof Reservoir
Storage at Howick-West Reservoir should be increased by 16 Mℓ to bring the total storage to 32.5 Mℓ (Section 8.4.3). This would then adequately serve as a distribution reservoir until 2030. A new 400 mm diameter pipeline, dedicated to serve the Mpophomeni area, will be required by the uMgungundlovu District Municipality once the new Khayalisha housing development is constructed. The existing 250 mm diameter pipeline will then become a backfeed from the Mpophomeni Reservoir.

298
Groenekloof Reservoir Supply and Vulindlela BWSS
An additional 10 Mℓ storage is proposed (Section 8.4.4) to provide adequate capacity up to 2040. The timing for this infrastructure will be determined by the growth in water demands from this reservoir over time. At this stage, it is anticipated that the upgrade will be required in 2018. The current demand for the Vulindlela BWSS is approximately 19 Mℓ/day and the projected demand is 48.4 Mℓ/day in 2045. The current 19 Mℓ/day is capable of serving the existing demand and although future growth will create an additional overbearing demand on the system. An impeller upgrade to the high lift pumps was recently commissioned to allow the delivery of up to 21 Mℓ/day. Extensive hydraulic analyses were conducted to optimise the hydraulic efficiency of the Vulindlela BWSS. The results of the hydraulic analyses indicated that the following infrastructure requirements, which are currently in detailed design stage (Section 8.4.9), are needed:
Upgrade the high lift pumping system at Vulindlela Pump Station by installing 3 x 22 Mℓ/day pump sets (2 x operating and 1 x standby).
Augment existing rising main and construct a 650mm diameter pipeline of 11 km in length from Vulindlela Pump Station to Reservoir 2.
Construct a Pump Station at Reservoir 2 consisting of 2 x 18 Mℓ/day pump sets (1 x operating and 1 x standby).
Construct one 15 Mℓ Reservoir (25 Mℓ required in total) at the Reservoir 2 site as additional storage to the existing 10 Mℓ reservoir.
Construct a back-feed pipeline of 200mm diameter with a length of 6 km, from Reservoir 5 to supply Reservoir 3 and Reservoir 4.
Construct a 10 Mℓ Reservoir at the Groenekloof Reservoir Complex to comply with Umgeni Water’s Reservoir operating philosophy.
Midmar WTP to Umlaas Road Sub-System
’61 Pipeline: World’s View Reservoir to ED2
This section of infrastructure allows for the maximum of 330 Ml/day that the tunnels can deliver. No further infrastructure is required.
Thornville/Hopewell Supply
Thornville Reservoir is now supplied from the Richmond pipeline and the existing Thornville Pump Station has been decommissioned. The rising main from the ’61 Pipeline to Thornville is now a back-feed gravity main.
’53 Pipeline: D. V. Harris WTP to Umlaas Road Reservoir
This pipeline needs to remain operational until such time as the uMWP is commissioned. Thereafter it is recommended that it be decommissioned. In the interim, caution should be taken not to exceed the “safe load carrying capacity” of 35 Mℓ/day.

299
Umlaas Road Sub-System
An analysis of the Umlaas Road Reservoir Complex showed that the augmentation to the ’61 Pipeline system resulted in little or no stress on the reservoirs. This coupled with the fact that eThekwini Municipality have indicated that they have sufficient storage in their system, and that they do not wish Umgeni Water to augment the Umlaas Road storage, means that there is no planned augmentation of storage at Umlaas Road. Additional storage will be constructed as part of the uMWP.
Eston/Umbumbulu Pipeline
The capacity of this pipeline is restricted to 15 Mℓ/day due to the ground level profile along the pipeline route. The flow is restricted to ensure that the hydraulic grade line is at least 20 m above a high point at Stoney Ridge. A booster pump station will be required to ensure that the maximum flow through this pipeline is achieved (Section 8.4.5). The projected growth in demand is envisaged to peak at 45 Mℓ/day by the year 2045. To ensure the sustainability of supply, Umgeni Water has initiated a pre-feasibility study to augment the existing supply system with a new pipeline.
Wartburg Sub-System
New bulk supply infrastructure is being constructed to meet the projected demands of both existing consumers as well as the areas of greater Efaye, Ozwathini and Southern Ndwedwe (Section 8.4.6 and Section 8.6.1). The infrastructure is as follows:
26 km, 850 mm diameter pipeline from Claridge to Wartburg (construction completed in November 2015) including a 1.25 MW booster pump station (April 2017) and 8 Mℓ Reservoir at Wartburg (May 2017).
15.5 km 700 mm diameter pipeline from Wartburg to Dalton including a 1.35 MW booster pump station and 10 Mℓ Reservoir at Dalton (November 2017).
10.7 km 750 mm diameter pipeline from Dalton to Fawn Leas (September 2017).
21.7 km long 700 mm diameter pipeline (June 2017) from Fawn Leas to a new 7 Mℓ reservoir (December 2018) at Ozwathini including a 0.5 MW booster pump station at Dalton (June 2017).
14.5 km long, 350 mm diameter pipeline from Fawn Leas to an existing reservoir at Nadi Mvoti (in Efaye) (June 2017).
Wartburg Reservoir to Bruyns Hill Reservoir
The 260 mm diameter Bruyns Hill pipeline between Bruyns Hill Pump Station and Bruyns Hill Reservoir was commissioned in 2012. The pipeline between Wartburg Reservoir and the existing Bruyns Hill pump station will have to be upgraded (Section 8.4.7). The existing pipeline system can only supply, under ideal conditions, a maximum of 6.4 Mℓ/day at a velocity of 1.5 m/s. This will not meet the ultimate demand of the area of supply. The Wartburg to Bruyns Hill Pipeline project will provide adequate supply to current and future supply areas and will eliminate non-supply issues at Swayimane. The project will consist of two components:
Construction of a pipeline from Wartburg Reservoir to Bruyns Hill Pump Station; and
A pump station near the Wartburg Reservoir site.

300
Appelsbosch Pipeline
The uMgungundlovu District Municipality requested Umgeni Water to assist in sourcing additional water for the drought stricken community of Appelsbosch in Ozwathini. A new raw water supply, to augment the existing supply and alleviate the current water shortages being experienced by the community, was implemented. The system is augmented by connecting a 160 mm diameter steel pipeline from an existing uMgungundlovu District Municipality borehole to the existing Appelsbosch System whilst including in-line chlorination. The borehole (KZN120098) has a sustainable yield of 220 kℓ/day.
6.2.2 Management and Operation of uMgungundlovu WTPs
uMgungundlovu District Municipality requested Umgeni Water to manage and operate four WTPs under their jurisdiction in 2016. Umgeni Water agreed to the request under a Memorandum of Understanding (MOU). The four WTP’s (Figure 6.26) are:
Lidgetton WTP;
Rosetta WTP;
Mpofana WTP; and
Appelsbosch WTP Umgeni Water is currently conducting assessments to determine the process efficiency of each plant. The future plans for these plants will be discussed in the 2018/2019 IMP.

301
Figure 6.26 General layout of the four uMgungundlovu WTPs being operated and managed by Umgeni Water.

302
Appelsbosch WTP
The Appelsbosch WTP (Table 6.24) is located in uMshwathi Municipality and supplies the Appelsbosch Hospital; the Appelsbosch College; and the Appelsbosch community. Water is obtained from a small dam (Figure 6.27) and a borehole (Figure 6.28).
Table 6.24 Characteristics of the Appelsbosch WTP.
WTP Name: Appelsbosch WTP
System: Appelsbosch System
Maximum Design Capacity: 0.25 Mℓ/day (Plant operated 12 hours per day) 0.5 Mℓ/day if plant is operated 24 hours a day
Current Utilisation: 0.25 Mℓ/day
Raw Water Storage Capacity:
Raw Water Supply Capacity:
Pre-Oxidation Type: None
Primary Water Pre-Treatment Chemical: Polymeric Coagulant
Total Coagulant Dosing Capacity: 6 ℓ/hr (Capacity of dosing pump)
Rapid Mixing Method: Baffled channel
Clarifier Type: Horizontal flow Clarifier
Number of Clarifiers: 2
Total Area of all Clarifiers: 32.5 m2
Total Capacity of Clarifiers: 0.78 Mℓ/day
Filter Type: Pressure filters and slow sand filters
Number of Filters: 3 Pressure filters and 4 slow sand filters (1 online)
Filter Floor Type Pipe laterals for pressure filters
Total Filtration Area of all Filters 3.39 m2
– 3 Pressure filters; 100 m
2 - 4
slow sand filters
Total Filtration Design Capacity of all Filters: 0.25 Mℓ/day Pressure filters; 0.36 Mℓ/day 4 slow sand
Total Capacity of Backwash Water Tanks: Water from final storage tank is used – approx. 106.4 kℓ
Total Capacity of Sludge Treatment Plant: Sludge discharged to the dam
Capacity of Used Washwater System: Approx. 0.017 Mℓ/day
Post Disinfection Type: Chlorination – Sodium hypochlorite
Disinfection Dosing Capacity: 1.44 kg/h (based on pumps capacity)
Disinfectant Storage Capacity: 12 X 25 kg sodium hypochlorite containers
Total Treated Water Storage Capacity: 106.4 kℓ

303
Figure 6.27 Dam supplying Appelsbosch WTP (Umgeni Water 2015).
Figure 6.28 Schematic of the Appelsbosch System (subject to verification).
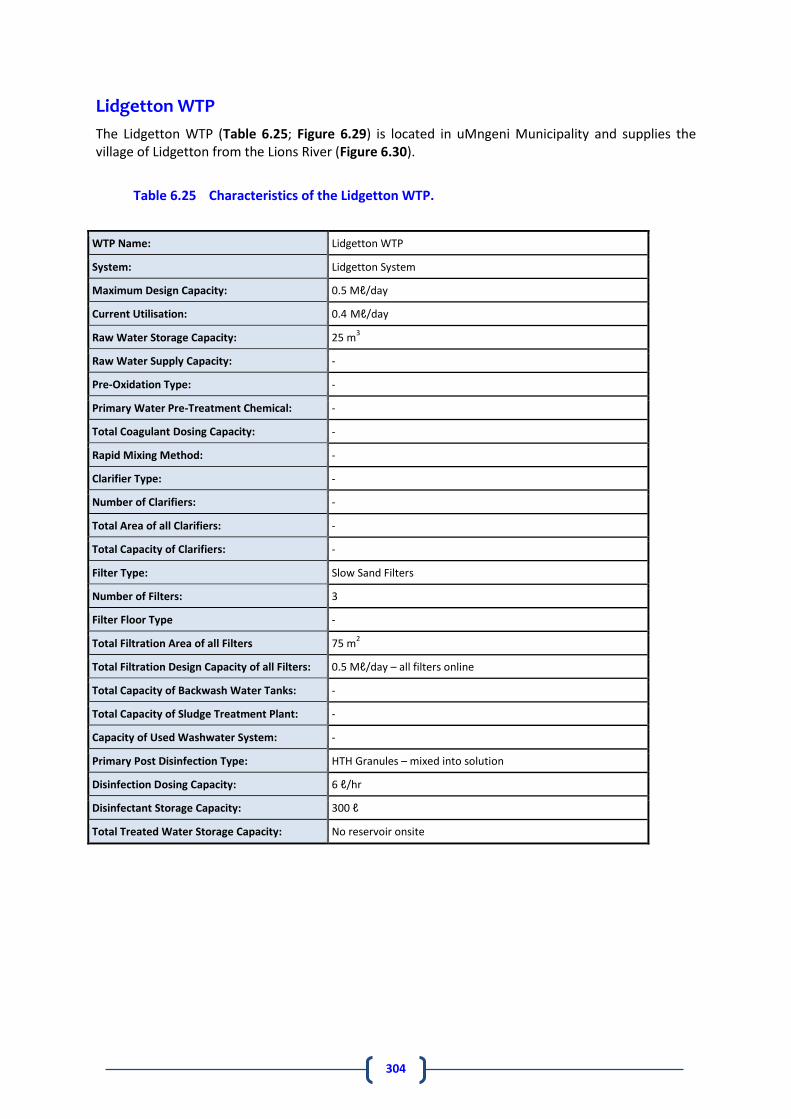
304
Lidgetton WTP
The Lidgetton WTP (Table 6.25; Figure 6.29) is located in uMngeni Municipality and supplies the village of Lidgetton from the Lions River (Figure 6.30).
Table 6.25 Characteristics of the Lidgetton WTP.
WTP Name: Lidgetton WTP
System: Lidgetton System
Maximum Design Capacity: 0.5 Mℓ/day
Current Utilisation: 0.4 Mℓ/day
Raw Water Storage Capacity: 25 m3
Raw Water Supply Capacity: -
Pre-Oxidation Type: -
Primary Water Pre-Treatment Chemical: -
Total Coagulant Dosing Capacity: -
Rapid Mixing Method: -
Clarifier Type: -
Number of Clarifiers: -
Total Area of all Clarifiers: -
Total Capacity of Clarifiers: -
Filter Type: Slow Sand Filters
Number of Filters: 3
Filter Floor Type -
Total Filtration Area of all Filters 75 m2
Total Filtration Design Capacity of all Filters: 0.5 Mℓ/day – all filters online
Total Capacity of Backwash Water Tanks: -
Total Capacity of Sludge Treatment Plant: -
Capacity of Used Washwater System: -
Primary Post Disinfection Type: HTH Granules – mixed into solution
Disinfection Dosing Capacity: 6 ℓ/hr
Disinfectant Storage Capacity: 300 ℓ
Total Treated Water Storage Capacity: No reservoir onsite

305
Figure 6.29 Lidgetton WTP sand wash bays with old dosing system (uMgungundlovu District Municipality 2010)
Figure 6.30 Schematic of the Lidgetton System (subject to verification).

306
Mpofana WTP
The Mpofana WTP abstracts water from the Mooi River to supply the town of Mooi River and Bruntville, located in Mpofana Local Municipality (Figure 6.31; Figure 6.32). At the time of release of this report, the characteristics of the Mpofana WTP were unavailable. This information will be presented in the IMP 2018/2019.
Figure 6.31 Schematic of the Mpofana System (subject to verification).

307
Figure 6.32 Mpofana WTP (uMgungundlovu District Municipality 2010).
Rosetta WTP
The Rosetta WTP (Figure 6.33; Table 6.26 ) abstracts water from the Mooi River to supply the village of Rosetta in Mpofana Municipality (Figure 6.34).
Figure 6.33 Rosetta WTP (uMgungundlovu District Municipality 2010).

308
Table 6.26 Characteristics of the Rosetta WTP.
WTP Name: Rosetta WTP
System: Rosetta System
Maximum Design Capacity: 250 m3/day
Current Utilisation: 252 m3/day
Raw Water Storage Capacity: -
Raw Water Supply Capacity: -
Pre-Oxidation Type: -
Primary Water Pre-Treatment Chemical: Rheofloc 5113
Total Coagulant Dosing Capacity: 6 ℓ/hr
Rapid Mixing Method: Inline with Orifice
Clarifier Type: Circular up-flow Clarifier
Number of Clarifiers: 1
Total Area of all Clarifiers: 9.60 m2
Total Capacity of Clarifiers: 14 m3/hr
Filter Type: Pressure Filter
Number of Filters: 2
Filter Floor Type -
Total Filtration Area of all Filters 2.26 m2
Total Filtration Design Capacity of all Filters: -
Total Capacity of Backwash Water Tanks: 2 x 10 m3
Total Capacity of Sludge Treatment Plant: -
Capacity of Used Washwater System: -
Primary Post Disinfection Type: Sodium Hypochlorite
Disinfection Dosing Capacity: 6 ℓ/hr
Disinfectant Storage Capacity: 200 ℓ
Total Treated Water Storage Capacity: 3 x 10 m3

309
Figure 6.34 Schematic of the Rosetta System (subject to verification).
6.2.3 Lower Mgeni System
Description
The Lower Mgeni System (Figure 6.6 and Figure 6.7) serves the greater eThekwini Municipal area from lower Pinetown/KwaDabeka in the west, to Phoenix/Inanda/Verulam in the north, to the Durban seaboard in the east and to Amanzimtoti/KwaMakuta in the south. It also provides water to the northern coastal areas of Ugu District Municipality. The system derives its water resources from the uMngeni River, being fed from Nagle and Inanda Dams, which are supported by Albert Falls Dam, Midmar Dam and the MMTS. Water is treated at Umgeni Water’s Durban Heights WTP (Table 6.27) located in Westville, Wiggins WTP (Table 6.32) located in Cato Manor and Maphephethwa WTP (Table 6.37) located in the Inanda Dam area. Umgeni Water sells water to eThekwini Municipality “at the fence” of these WTPs and thus does not own nor operate the bulk distribution pipelines downstream of these WTPs. However, operational and infrastructure changes within the eThekwini Municipality’s system, which is served by these WTPs, have a profound influence on the WTPs operational and infrastructure requirements. Continuous effort (Umgeni Water in collaboration with eThekwini Municipality) has gone into optimising the overall efficiency of the distribution system to share the load better between the two large WTPs. One example of these initiatives has involved the transfer of demand from areas previously supplied from Durban Heights WTP onto Wiggins WTP. This demand transfer commenced in January 2005 and involved the transfer of 40 - 60 Mℓ/day onto Wiggins WTP. Durban Heights WTP has a rated capacity of 615 Mℓ/day. The primary raw water source for the WTP is Nagle Dam, which has limited storage and is in turn supplied from Albert Falls Dam located on the uMngeni River. Raw water is conveyed from Nagle Dam to Durban Heights WTP via two systems

310
comprising a series of siphons and gravity tunnels. System 1, Nagle Aqueducts 1 and 2, comprises 11 tunnels (14.57 km) which are inter-connected by siphons (29.7 km) with a capacity of 260 Mℓ/day. System 2, Nagle Aqueducts 3 and 4 comprises 6 tunnels (21.3 km) which are inter-connected by siphons (15.4 km) with a capacity of 440 Mℓ/day. Durban Heights WTP is primarily gravity-fed with raw water from Nagle Dam via Aqueducts 1 to 4 as shown in Figure 6.35 and detailed in Table 6.28, Table 6.29 and Table 6.30. Aqueducts 1 to 4 have a total design capacity of 700 Mℓ/day at a total head of 404 metres above sea level (mASL), which is the top water level (TWL) of Nagle Dam.
Table 6.27 Characteristics of the Durban Heights WTP.
WTP Name: Durban Heights WTP
System: Lower Mgeni System
Maximum Design Capacity: 615 Mℓ/day
Current Utilisation: 464 Mℓ/day
Raw Water Storage Capacity: 0 Mℓ
Raw Water Supply Capacity: 710 Mℓ/day
Pre-Oxidation Type: Prechlorination
Primary Water Pre-Treatment Chemical: Polymeric Coagulant
Total Coagulant Dosing Capacity: Other
Rapid Mixing Method: Hydraulic Jump
Clarifier Type: Pulsator Clarifier
Number of Clarifiers: 18
Total Area of all Clarifiers: 6580 m2
Total Capacity of Clarifiers: 611 Mℓ/day
Filter Type: Constant Rate Rapid Gravity Filters
Number of Filters: 100
Filter Floor Type Plate Design
Total Filtration Area of all Filters 6227 m2
Total Filtration Design Capacity of all Filters: 615 Mℓ/day
Total Capacity of Backwash Water Tanks: 2326 m3
Total Capacity of Sludge Treatment Plant: 30 000 kg/day of thin sludge
Capacity of Used Washwater System: 25.2 Mℓ/day
Primary Post Disinfection Type: Chlorine gas
Disinfection Dosing Capacity:
Disinfectant Storage Capacity: 24 ton
Total Treated Water Storage Capacity: 506 Mℓ

311
Raw water can be supplemented to Durban Heights WTP via the Inanda Pump Station through a 1 100 mm diameter NB steel pipeline connecting onto Aqueduct 1 and through the Durban Heights Shaft Pump Station which pumps water from the Wiggins Aqueduct (Figure 6.35).
Figure 6.35 Layout of the Central Supply System.
INANDA DAM
DURBAN HEIGHTS WTP
INANDA PUMP STATION
WIGGINS AQUEDUCT
AQUEDUCTS 3 & 4
DURBAN HEIGHTS SHAFT
PUMP STATION
WIGGINS WTP
AQUEDUCTS 1 & 2
NAGLE DAM

312
Table 6.28 Tunnel details: Nagle Aqueduct System.
System Name Total
Length (m)
Height (m)
Radius (m)
Lining Year
Constructed Transition Semi-Arc
Lower Mgeni
Nagle Aqueduct 1 & 2 - Tunnel T1 533 1500 990 concrete lined
1949 & 1957
Nagle Aqueduct 1 & 2 - Tunnel T2 296 1500 990 concrete lined
Nagle Aqueduct 1 & 2 - Tunnel T3 861 1500 990 concrete lined
Nagle Aqueduct 1 & 2 - Tunnel T4 232 1500 990 concrete lined
Nagle Aqueduct 1 & 2 - Tunnel T5 3995 1500 990 concrete lined
Nagle Aqueduct 1 & 2 - Tunnel T6 2243 1500 990 concrete lined
Nagle Aqueduct 1 & 2 - Tunnel T7 1682 1500 990 concrete lined
Nagle Aqueduct 1 & 2 - Tunnel T8 996 1500 990 concrete lined
Nagle Aqueduct 1 & 2 - Tunnel T9 1246 1500 990 concrete lined
Nagle Aqueduct 1 & 2 - Tunnel T10 1751 1500 990 concrete lined
Nagle Aqueduct 1 & 2 - Tunnel T11 735 1500 990 concrete lined
D
R
H

313
System Name Total
Length (m)
Height (m)
Radius (m)
Lining Year
Constructed Transition Semi-Arc
Lower Mgeni
Nagle Aqueduct & 4 - Umzwempi Tunnel T1
254
1505 1302
concrete lined - full
1967 & 1972
245 concrete lined -
partial
Nagle Aqueduct 3 & 4 - Umbava Tunnel T2 Nagle Aqueduct 3 & 4 - Ngabayena Tunnel T2 Nagle Aqueduct 3 & 4 - Janokwe Tunnel T2 Nagle Aqueduct 3 & 4 - Shangase Tunnel T2 Nagle Aqueduct 3 & 4 - Ensutha Tunnel T2
1940
1505 1302
concrete lined - full
2866 concrete lined -
partial
Nagle Aqueduct 3 & 4 - Mkhizwane Tunnel T3 Nagle Aqueduct 3 & 4 - Nokwenzewa Tunnel T3
562
1746 978
concrete lined - full
3114 concrete lined -
partial
Nagle Aqueduct 3 & 4 - Amabedhlana Tunnel T4 Nagle Aqueduct 3 & 4 - Showe Tunnel T4
1350
1505 1302
concrete lined - full
3281 concrete lined - partial
Nagle Aqueduct 3 & 4 - Langefontein Tunnel T5
1257
1505 1302
concrete lined
3585 concrete lined -
partial
Nagle Aqueduct 3 & 4 - Kraanskloof Tunnel T6
1210
1505 1302
concrete lined
1677 concrete lined -
partial
Note: Tunnel 3 has a different cross section shape to tunnels 1, 2, 4, 5 and 6
D
R
H

314
Table 6.29 Siphon Pipeline details: Nagle Aqueducts.
System Pipeline Name From To Length
(km) Nominal Diameter
(mm) Material
Capacity * (Mℓ/day)
Age (years)
Lower Mgeni Aqueduct 1 Nagle Dam Durban Heights WTP 29.7 900 Steel 100 68
Lower Mgeni Aqueduct 2 Nagle Dam Durban Heights WTP 29.7 1 000 PCP and Steel 160 60
Lower Mgeni Aqueduct 3 Nagle Dam Durban Heights WTP 15.4 1 400 PCP 220 50
Lower Mgeni Aqueduct 4 Nagle Dam Durban Heights WTP 15.4 1 400 PCP 220 45
Table 6.30 Reservoir details: Durban Heights WTP.
System Reservoir Site Reservoir Name Capacity
(Mℓ) Reservoir Function
TWL (mASL)
FL (mASL)
Lower Mgeni Durban Heights Reservoir 1 45 Bulk 264.84 259
Lower Mgeni Durban Heights Reservoir 2 100 Bulk 272 265
Lower Mgeni Durban Heights Reservoir 3 343 Bulk 272 247
Lower Mgeni Durban Heights Dunkeld Reservoir 9 Bulk 264.84 259
Table 6.31 Pump details: Durban Heights WTP.
System
Pump Station Name
Number of Pumps Pump Description
Supply From
Supply To
Static Head (m)
Duty Head (m)
Duty Capacity (Mℓ/day)
Number of
Duty Pumps Number of
Standby Pumps
Lower Mgeni Durban Heights Booster
Pump Station 4 1 KSB Omega 200-670 Durban Heights
eThekwini Northern Aqueduct
104 35 110
Lower Mgeni Durban Heights Shaft Pump
Station 3 1
Sulzer Bbk 620-022 4 stage
Wiggins Aqueduct Durban Heights WTP 152 180 50
Lower Mgeni Inanda Pump Station 3 1 Sulzer SM 303-800 Inanda Dam Durban Heights WTP 140 200 50

315
Table 6.32 Characteristics of the Wiggins WTP.
WTP Name: Wiggins WTP
System: Lower Mgeni System
Maximum Design Capacity: 350 Mℓ/day
Current Utilisation: 276 Mℓ/day
Raw Water Storage Capacity: 0 Mℓ
Raw Water Supply Capacity: 350 Mℓ/day
Pre-Oxidation Type: Ozone
Primary Water Pre-Treatment Chemical: Polymeric Coagulant
Total Coagulant Dosing Capacity: Polymeric Coagulant
Rapid Mixing Method: Hydraulic Jump
Clarifier Type: Pulsator Clarifier
Number of Clarifiers: 4
Total Area of all Clarifiers: 3980 m2
Total Capacity of Clarifiers: 360 Mℓ/day
Filter Type: Constant Rate Rapid Gravity Filters
Number of Filters: 24
Filter Floor Type Monolithic
Total Filtration Area of all Filters 6688 m2
Total Filtration Design Capacity of all Filters: 350.16 Mℓ/day
Total Capacity of Backwash Water Tanks:
Total Capacity of Sludge Treatment Plant:
Capacity of Used Washwater System: 2.78 Mℓ/day
Primary Post Disinfection Type: Hypochlorite
Disinfection Dosing Capacity: 240 ℓ/hr
Disinfectant Storage Capacity:
Total Treated Water Storage Capacity: 248 Mℓ
Wiggins WTP is primarily gravity-fed with raw water from Inanda Dam via the Wiggins Aqueduct (Figure 6.35 and Table 6.33 and Table 6.34). The Wiggins Aqueduct has a total design capacity of 350 Mℓ/day at a total head of 147 mASL, which is the top water level (TWL) of Inanda Dam.

316
Table 6.33 Tunnel details: Inanda-Wiggins Aqueduct System.
System Name Total
Length (m)
Height (m) Radius
(m) Lining
Year Constructed
Transition Semi-Arc
Lower Mgeni
Inanda Wiggins Aqueduct - Emolweni Tunnel 5320 1350 1220 steel lined 1993
Lower Mgeni
Inanda Wiggins Aqueduct - Clermont Tunnel 5400 1350 1220 steel lined 1993
Lower Mgeni
Inanda Wiggins Aqueduct - Reservoir Tunnel 2560 1350 925 steel lined 1984
Lower Mgeni
Inanda Wiggins Aqueduct - University Tunnel 1040 1350 925 steel lined 1984
Lower Mgeni
Inanda Wiggins Aqueduct - Sherwood Tunnel 3350 1350 925 steel lined 1984
Table 6.34 Pipeline details: Inanda-Wiggins Aqueduct.
System Pipeline Name From To Length
(km) Nominal Diameter
(mm) Material
Capacity (Mℓ/day)
Age (years)
Lower Mgeni Inanda Wiggins
Aqueduct Inanda Dam Durban Heights WTP 11.8 2620 Steel 550 25
Lower Mgeni Inanda Wiggins
Aqueduct Durban Heights WTP Wiggins WTP 5.9 2315 Steel 350 33
D
R
H

317
Table 6.35 Reservoir details: Wiggins WTP.
System Reservoir Site Reservoir Name Capacity
(Mℓ) Reservoir Function
TWL (mASL)
FL (mASL)
Lower Mgeni Wiggins Reservoir 1 117 Bulk 103 96.6
Table 6.36 Pump details: Wiggins WTP.
System
Pump Station Name
Number of Pumps Pump Description
Supply From
Supply To
Static Head (m)
Duty Head (m)
Duty Capacity (Mℓ/day)
Number of
Duty Pumps Number of
Standby Pumps
Lower Mgeni Wiggins High Lift Pumps
(small) 2 1
APE 300-300-370 HMNA
Wiggins WTP Ridge
Reservoir/Lamont Reservoir
31 130 28
Lower Mgeni Wiggins High Lift Pumps (big) 1 1 APE Model 6920
5-stage Wiggins WTP
Ridge Reservoir/Lamont
Reservoir 31 130 108

318
Table 6.37 Characteristics of the Maphephethwa WTP.
WTP Name: Maphephethwa WTP (upgrade commissioned in December 2015)
System: Lower Mgeni System
Maximum Design Capacity: 5 Mℓ/day
Current Utilisation: 3.0 Mℓ/day
Raw Water Storage Capacity: None
Raw Water Supply Capacity: 5.3 Mℓ/day
Pre-Oxidation Type: Chlorine
Primary Water Pre-Treatment Chemical:
Aluminium Sulphate
Total Coagulant Dosing Capacity: 250 kg/day at 50 mg/ℓ (maximum)
Rapid Mixing Method: Flow over weirs
Clarifier Type: circular clarifiers with mechanical sludge scrapers
Number of Clarifiers: 2
Total Area of all Clarifiers: 226 m2
Total Capacity of Clarifiers: 5 Mℓ/day
Filter Type: Rapid Gravity Filters
Number of Filters: 4
Filter Floor Type Monolithic
Total Filtration Area of all Filters 50 m2
Total Filtration Design Capacity of all Filters:
5 Mℓ/day
Total Capacity of Backwash Water Tanks:
195 m3
Total Capacity of Sludge Treatment Plant:
5 Mℓ/day
Capacity of Used Washwater System: 11.7 m3/day
Primary Post Disinfection Type: Gaseous Chlorine
Disinfection Dosing Capacity: 1.5 kg/hr
Disinfectant Storage Capacity: 70 kg cylinders with automatic changeover
Total Treated Water Storage Capacity: 2.5 Mℓ

319
Status Quo and Limitations
Durban Heights Water Treatment Plant
Construction of the 400 Mℓ/day Western Aqueduct (WA) is scheduled for completion by eThekwini Municipality during 2018. Subsystems supplied from Durban Heights WTP and planned to be transferred to the WA, when commissioned, include: Outer and Inner West, Tshelimnyama, Pinetown, Kwadabeka, Ntuzuma and Mzinyathi. Water currently available from Point M to the WA, based on 1:100 year yield from the Mgeni system, is approximately 200 Mℓ/day until the proposed uMkhomazi Water Project (uMWP) is commissioned (Sections 5.4.6 and 8.2). eThekwini Municipality plan to transfer the demands off Durban Heights WTP and onto the proposed Western Aqueduct. However, until the uMWP has been commissioned, Durban Heights WTP will need to continue to supply Pinetown with 50 Mℓ/day and a minimum pumping of 30 Mℓ/day to Ntuzuma. No significant reduction in sales is anticipated once the Western Aqueduct is commissioned in 2018. The impact on Durban Heights amounts to approximately -20 Mℓ/day. The approximate 20 Mℓ/day that will initially be freed up will be utilised to meet the increasing demands of other nodes along the extension of the Northern Aqueduct. These include the demands of new housing developments in the Verulam/Tongaat area, Grange and that of the proposed Dube TradePort. An analysis of historical production for the Durban Heights WTP (November 2015 to October 2016) is presented in Figure 6.36, and shows that for 26.8% of the time the WTP was being operated above the optimal operating capacity (80% of design capacity) and 0% of the time the WTP was operated at above design capacity. The previous year Durban Heights WTP was operating above the optimal operating capacity for 80.7% of the time. This indicates a significant decrease in demand on WTP over the last year and may be attributed to water restrictions implemented as a result of the drought (Section 3.2.1).
Figure 6.36 Analysis of historical production at Durban Heights WTP from November 2015 to October 2016.

320
eThekwini Municipality have made significant investments in various water loss reduction projects, with further spending planned in the future. Among their 16 dedicated interventions for curtailing water loss is the Asbestos Cement Pipe Replacement Programme. A new pressure management system and improved customer billing system have also been introduced. The proposed developments and associated demand, as a result of these developments, within the eThekwini area of supply, were discussed with the municipality during September 2016. The subsequent demand projection scenario was based on the effect and impact of the drought. Demand for the 2015/2016 financial year was significantly affected by the drought. At present there is a 15% curtailment on all water treatment plants within the central areas of the municipality. This will have an impact on the demand forecast until such time as restrictions are lifted and this is noted in the downward trend of the 12-month moving average in Figure 6.37.
Figure 6.37 Historical demand curve for Durban Heights WTP.
Wiggins Water Treatment Plant
Wiggins WTP supplies the Amanzimtoti/KwaMakuta areas located in the southern portion of eThekwini Municipality. Due to water resource constraints at Nungwane Dam (Section 5.4.5) and the limited capacity of Amanzimtoti WTP, it is necessary to augment the supply to areas downstream of the Amanzimtoti WTP with flows from Wiggins WTP via the South Coast Augmentation (SCA) Pipeline. This will be required until such time as a new regional bulk water supply system is developed on the lower reaches of the uMkhomazi River (Sections 5.4.6 and 8.5.4). In the interim, the Wiggins WTP sub-system should have sufficient treatment and distribution capacity to meet the short and medium-term demands of Amanzimtoti and the South Coast Pipeline (SCP).

321
Figure 6.38 shows the current configuration of the existing SCA pumped supply infrastructure linking the Wiggins WTP sub-system to Amanzimtoti WTP. This system has certain operational capacity constraints that still have to be rectified to ensure that the Wiggins WTP system continues as the point of supply for Amanzimtoti and the SCP in the future.
The South Coast Augmentation Booster Pump Station was commissioned in December 2013 and serves as a medium-term infrastructure development strategy to meet current and projected demands off the SCA Pipeline up to the year 2020. An analysis of historical production at the Wiggins WTP (November 2015 to October 2016) is presented in Figure 6.39 and shows that for 52.6% of the time the WTP was being operated above the optimal operating capacity (80% of design capacity) and 0% of the time the WTP was operated at above design capacity. The impact of the drought has only marginally affected the demand from Wiggins WTP over the 2015/2016 financial. This may be attributed to the load-shedding off Durban Height WTP onto Wiggins WTP, as well as increased demand via the SCA due to the drought experienced in the Middle South Coast region. This has resulted in a negative (-1 %) growth in demand for the past year as shown in Figure 6.40. The 15% curtailment on all WTP’s will have an impact on the demand forecast until such time as restrictions are lifted.
Figure 6.38 Extent of the South Coast Augmentation Scheme.

322
Figure 6.39 Analysis of historical production at Wiggins WTP from November 2015 to October 2016.
The historical and projected water demand from the Wiggins WTP is presented in Figure 6.40.
Figure 6.40 Historical demand curve for Wiggins WTP.

323
Maphephethwa Water Treatment Plant
Maphephethwa WTP (Figure 6.41) was originally commissioned as a rural scheme under a turnkey contract. The works is located in the Inanda Dam area and draws water off one of the Nagle Dam raw water aqueducts supplying Durban Heights WTP. The raw water is filtered through a set of four slow sand filters. The filtered water is chlorinated and supplied into a 1 Mℓ on-site storage/distribution reservoir. The original works had slow sand filters with a treatment capacity of 0.75 Mℓ/day. The works was upgraded to a design capacity of 5 Mℓ/day in 2014. The WTP is currently operated at 3 Mℓ/day. Raw water to the works is drawn from Nagle Aqueduct No. 2, which delivers water to Durban Heights WTP, via a 160 mm internal diameter PVC pipeline. The off-take point of the Aqueduct is located 260 m from the works. The raw water supply pipeline to the WTP is fitted with a pre-chlorination unit, flow meter and a flow control valve. An analysis of historical production at the Maphephethwa WTP (November 2015 to October 2016) is presented in Figure 6.42 and shows that for 0.8% of the time the WTP was being operated above the optimal operating capacity (80% of design capacity) and 0% of the time the WTP was operated at above design capacity (based on the upgraded capacity of the plant).

324
Figure 6.41 Maphephethwa Water Treatment Plant.

325
Figure 6.42 Analysis of historical production at Maphephethwa WTP from November 2015 to October 2016.
Figure 6.43 shows that there has been increased demand from the WTP in recent years and the works currently produces an average of 3.3 Mℓ/day as at the end of October 2016. It is envisaged that the demand will continue to grow during 2017 following the commissioning of the plant upgrade in December 2015 Figure 6.43.

326
Figure 6.43 Historical demand curve and projections for Maphephethwa WTP.
Recommendations
Figure 6.44 illustrates, schematically, the demands on the Lower Mgeni System in its current configuration. The projects recommended to address the above-identified issues are listed below:
Investigate the need for and upgrade of the Wiggins High Lift Pump (HLP) Station. Currently there is a short term risk of pump failure (non-supply) as the pumps are not suitable for the current application. In the long term there is a need to consider system optimisation of the municipality’s distribution network considering future demands and reliance on the HLP.
A planning study to maximise the use of Inanda Dam for supply into the areas north of the dam, as well as the supply area associated with the Northern Aqueduct, i.e. potential new WTP.

327
Figure 6.44 Schematic of the Lower Mgeni System.

278
6.3 uMkhomazi System
6.3.1 Ixopo System
Description
The Ixopo System is a stand-alone system located at the town of Ixopo in the Harry Gwala District Municipality. Umgeni Water owns and operates this bulk supply system which comprises surface and groundwater resource infrastructure, raw water pipelines and the Water Treatment Plant (WTP) (Figure 6.45, Figure 6.46 and Figure 6.47). As discussed in Section 5.4.6, the Ixopo Dam is the primary source of raw water supply to Ixopo. Raw water is gravity-fed from the dam (FSL = 939.84 mASL) a distance of 418.4 m to the raw water pump station (located at the entrance to the Ixopo Wastewater Works) and then pumped a distance of 1.382 km to the WTP (approximately 1104 mASL).
Figure 6.45 Ixopo Water Treatment Plant.
The Ixopo Golf Course borehole is a single production borehole situated on the local golf course (Figure 6.47). This borehole is used conjunctively with the Ixopo Dam to meet the water requirements at the WTP. The raw water from the borehole feeds directly into the chlorination contact chamber. At times, as much as 15 to 20% of the total supply at the WTP is obtained from the borehole. Water is pumped from this production borehole (approximately 997 m ASL) via a 1.38 km rising main to the WTP. Details of the raw water pipeline from the dam and the pipeline from the borehole are shown in Table 6.38. Details of the pump station and reservoir are shown in Table 6.39 and Table 6.40 respectively. The capacity of the WTP has been upgraded a number of times. The initial capacity on commissioning was 364 kℓ/day. It was then upgraded to 2 Mℓ/day in 1999. The commissioning of the Ixopo Clarifier in September 2007 increased the capacity to 2.35 Mℓ/day. Water purification at

279
the plant was predominantly via a sand filtration process but with the recent upgrade to the filters to include pressure filters, the increased capacity of the Ixopo WTP is 3.1 Mℓ/day. In 2015 all the slow sand filters (7) were decommissioned and three pressure filters are now being used as alternatives. A 2 Mℓ/day package plant was installed and was commissioned in March 2016. This increased the capacity of the plant to 4.1 Mℓ/day. The raw water gravity pipeline from the dam to the pump sump has been augmented with a 300 mm diameter uPVC pipeline and was commissioned in December 2012. The augmentation has increased the raw water pipeline capacity to 5.45 Mℓ/day (combined pipe diameters). Although the plant has the capacity to produce 4.1 Mℓ/day the dam has a yield of 2.7 Mℓ/day. Details of the WTP are shown in Table 6.41. Potable water is sold “at the fence” of the WTP to the Harry Gwala District Municipality, which is responsible for reticulation within the town of Ixopo and the adjacent peri-urban areas within uBuhlebezwe Local Municipality. The Ixopo Potable Water Reservoir (Figure 6.46) is located at the WTP and acts as a balancing and service reservoir.
Figure 6.46 Schematic of the Ixopo System.

280
Figure 6.47 General layout of the Ixopo System.

281
Table 6.38 Pipeline details: Ixopo System.
System Pipeline Name From To Length
(km)
Nominal Diameter
(mm)
Internal Diameter
(mm) Material
Capacity* (Mℓ/day)
Age (years)
Ixopo Ixopo Raw Water Gravity Pipeline
Ixopo Dam Ixopo Raw
Water Pump Station
0.42 250 Unknown FBE Coated, Cement Mortar Line, Bell and Spigot, Welded Steel
1.79 19
Ixopo Ixopo Raw Water Gravity Pipeline
Ixopo Dam Ixopo Raw
Water Pump Station
0.42 300 Unknown uPVC 2.83 4
Ixopo Ixopo Raw Water
Rising Main
Ixopo Raw Water Pump
Station Ixopo WTP 1.38 250 Unknown
FBE Coated, Cement Mortar Line, Bell and Spigot, Welded Steel
6.37 19
Ixopo Ixopo Golf Course Borehole Pipeline
Ixopo Golf Course
Borehole Ixopo WTP 1.50 110 Unknown uPVC 1.23 >20
* Capacity based on a velocity of 1.5 m/s.
Table 6.39 Pump details: Ixopo System.
System Pump Station
Name Number of Duty
Pumps Number of
Standby Pumps Pump
Description Supply From Supply To
Static Head (m)
Duty Head (m)
Duty Capacity (Mℓ/day)
Ixopo Ixopo Raw Water 1 1 Ixopo Dam Ixopo WTP 170.36 172.123 2.7
Table 6.40 Reservoir details: Ixopo System.
System Reservoir Site Reservoir Name Capacity
Mℓ) Function
TWL (m ASL)
FL (m ASL)
Ixopo Ixopo WTP Ixopo Potable Water
Reservoir 2.5 Distribution 1105.23 1101.23
Ixopo Ixopo WTP Ixopo Raw Water
Reservoir 0.272 Header Tank for Treatment 1110.62 1108.62

282
Table 6.41 Characteristics of the Ixopo WTP.
WTP Name: Ixopo WTP
System: Ixopo System
Maximum Design Capacity: 4.7 Mℓ/day
Current Utilisation: 2.4 Mℓ/day
Raw Water Storage Capacity: 285 m3
Raw Water Supply Capacity: 2.70 Mℓ/day– from dam
Pre-Oxidation Type: Pre-chlorination and Potassium permanganate
Primary Water Pre-Treatment Chemical: Aluminium Sulphate
Total Coagulant Dosing Capacity: 30 ℓ/h
Rapid Mixing Method: Mechanical stirrer (located before the weir)
Clarifier Type: Dortmund
Number of Clarifiers: 3
Total Area of all Clarifiers: 126 m2
Total Capacity of Clarifiers: 3 Mℓ/day
Filter Type: Pressure Filters (7 Slow Sand Filters – Decommissioned)
Number of Filters: Currently only three are available
Filter Floor Type Steel plate
Total Filtration Area of all Filters 16.68 m2
for three pressure filters (33.36 m2 including new
package plant)
Total Filtration Design Capacity of all Filters: 2 Mℓ/day and it will be 4 Mℓ/day after commissioning
Total Capacity of Backwash Water Tanks: 40 m3 (2 x 20m
3 Jojo tanks)
Total Capacity of Sludge Treatment Plant: There is no sludge treatment onsite, sludge is transferred into
sewer line
Capacity of Used Washwater System: 60 m3 (3 x 20 m
3 Jojo tanks)
Primary Post Disinfection Type: Chlorine Gas
Disinfection Dosing Capacity: 4 kg/h – Pre-chlorination
2 kg/h – Post disinfection
Disinfectant Storage Capacity: Stored in 70 kg Cylinders
Total Treated Water Storage Capacity: 2.5 Mℓ
6.3.2 Status Quo and Limitations
Water demand at Ixopo is influenced by three factors: increased sales to new consumers, movement in sales to existing consumers and the movement in unaccounted for water i.e. non-revenue water. The net impact of these three factors on the Ixopo demand node is shown in Figure 6.48.
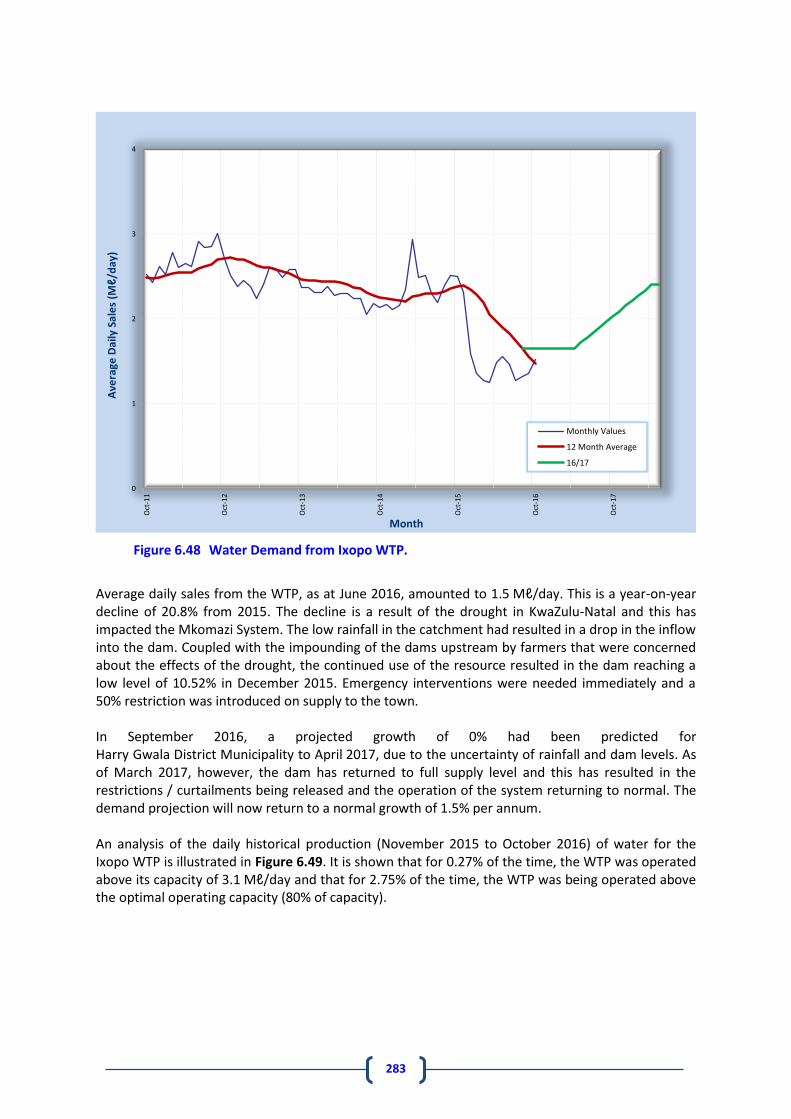
283
Figure 6.48 Water Demand from Ixopo WTP.
Average daily sales from the WTP, as at June 2016, amounted to 1.5 Mℓ/day. This is a year-on-year decline of 20.8% from 2015. The decline is a result of the drought in KwaZulu-Natal and this has impacted the Mkomazi System. The low rainfall in the catchment had resulted in a drop in the inflow into the dam. Coupled with the impounding of the dams upstream by farmers that were concerned about the effects of the drought, the continued use of the resource resulted in the dam reaching a low level of 10.52% in December 2015. Emergency interventions were needed immediately and a 50% restriction was introduced on supply to the town. In September 2016, a projected growth of 0% had been predicted for Harry Gwala District Municipality to April 2017, due to the uncertainty of rainfall and dam levels. As of March 2017, however, the dam has returned to full supply level and this has resulted in the restrictions / curtailments being released and the operation of the system returning to normal. The demand projection will now return to a normal growth of 1.5% per annum. An analysis of the daily historical production (November 2015 to October 2016) of water for the Ixopo WTP is illustrated in Figure 6.49. It is shown that for 0.27% of the time, the WTP was operated above its capacity of 3.1 Mℓ/day and that for 2.75% of the time, the WTP was being operated above the optimal operating capacity (80% of capacity).
0
1
2
3
4O
ct-1
1
Oct
-12
Oct
-13
Oct
-14
Oct
-15
Oct
-16
Oct
-17
Ave
rage
Dai
ly S
ale
s (M
ℓ/d
ay)
Month
Monthly Values
12 Month Average
16/17

284
Figure 6.49 Analysis of historical production at Ixopo WTP (November 2015 to October 2016).
The dam and borehole have sustainable yields of 2.7 Mℓ/day and 0.4 Mℓ/day under normal operating conditions. During normal operations there is, therefore, sufficient resource to meet the short-term requirements. The yield of the borehole is adequate as a medium-term resource for the system. Long-term supply options for the area will need to be investigated since no additional local sources are available. An existing borehole, situated in close proximity to the raw water pump station between the dam and the WTP, had been identified as a resource to augment the system to meet the area’s growing demands in the medium-term, however, this borehole has been vandalised and hence can no longer be used. Three additional boreholes have subsequently been drilled and tested. Unfortunately, the yields of these boreholes are insufficient to warrant them being equipped for use. No further groundwater investigations are currently planned and other alternatives will have to be considered. There are no significant water resources in close proximity to the WTP that can be used to augment the system. The long-term water resource requirements will thus have to be sourced from further afield. The water supply between the dam and the WTP is problematic. An assessment of the supply infrastructure revealed that:
The pumps are oversized and have to be throttled and they are therefore not operating efficiently with energy being wasted.
Under certain conditions, hydraulic problems exist between the dam operating level and the level in the sump at the raw water pump station.
There are capacity constraints with the existing pipework within the WTP. Non-Revenue Water (NRW) still remains a significant contributor to the water demands in Ixopo (IMP 2004 and IMP 2008). The municipality has embarked on a water demand management programme within Ixopo. The main benefit of this programme is the reduction in the potable usage and this is confirmed in Figure 6.48.
1
2
3
4
0 10 20 30 40 50 60 70 80 90 100
Sale
s V
olu
me
(Ml/
day
)
Probability
p occurrence (%) Design capacity Optimal operating capacity Total Sales

285
The planned spatial distribution of new development/demand nodes in the area may lead to options which consider new WTP sites and scheme configurations. This still has to be established in future plans. Another scheme being investigated within the Harry Gwala District Municipality, located in Ingwe Municipality, is the Greater Bulwer/Donnybrook Bulk Water Supply Scheme. This scheme will provide a sustainable potable water supply to the Greater Bulwer, Gala, Nkwazela and Donnybrook areas. The Harry Gwala District Municipality also plans to use this scheme to supply bulk water to the Greater Ixopo area. Regional schemes are currently being investigated by both Harry Gwala District Municipality and Umgeni Water with the objective of providing the District with a sustainable water supply. Five regional schemes have been identified. Umgeni Water has procured a service provider to conduct a pre-feasibility and detailed feasibility study for the regional schemes that will supply bulk water to the Umzimkhulu Local Municipality (Section 8.2.2). The project commenced in November 2015 and the completion date is June 2017. The pre-feasibility has identified a potential project that could supply the majority of the local municipality.
Impacts of the 2015/2016 Drought and Mitigation Measures Implemented
The iXhobo River system and the catchment feeding the river were heavily impacted during the recent drought within the province. This has impacted the river flow and ultimately reduced the water level in the dam. The level of Home Farm Dam dropped to 10.52% in December 2015 and Umgeni Water identified that, should no emergency intervention be implemented, the dam would have reached dead storage by end of December 2015. The water usage for the system at November 2015 was 2.4 Mℓ/day and the municipality was advised, by DWS, to reduce usage. Water Supply was thereafter reduced to 1.2 Mℓ/day. Umgeni Water implemented two emergency projects (Figure 6.50) to mitigate the risk of non-supply to the town of Ixopo. The first project entailed the use of the recently constructed pumping system, intended to at supply to the Chibini and Ufafa areas, to pump raw water from St. Isidore Dam to Home Farm Dam. This project also entailed the monitoring of the outflow from the upstream Mackenzie Dam to ensure that adequate releases were maintained as per the DWS water use licence. This was done by refurbishing an existing monitoring weir and monitoring the gauge plate on the refurbished weir on a daily basis. The second project entailed the construction of a monitoring weir upstream of the Mackenzie dams to monitor the inflow into the dams. This project was completed in November 2016. This project also included the removal of the alien trees along the inlet to Home Farm Dam which reduced the water loss in the vlei area immediately upstream of Home Farm Dam. As a result of these initiatives water supply had been maintained throughout the drought period and further recovered to a point where restrictions could be reduced to 30% in October 2016 and removed altogether in November 2016 (Figure 6.51).

286 Figure 6.50 General layout of the two emergency projects implemented to mitigate the risk of non-supply to Harry Gwala District Municipality.

287
Figure 6.51 Dam Level and Rainfall at Home Farm Dam (March 2015 to December 2016).
6.3.3 Recommendations
The following measures are recommended to address the supply issues mentioned:
The size of the installed raw water pumps to be reviewed.
The configuration and levels of the sump and in-take to the raw water pumps to be reviewed.
Undertake a pre-feasibility study to determine options of future water resources to serve the region.
All Restrictions Lifted
Drought Measures Implemented
Restrictions Lifted to 30%
Monitoring Flows

291
6.4 South Coast System
6.4.1 Description
The South Coast System comprises three sub-regions, viz.
The Upper South Coast, which extends from Amanzimtoti to the uMkhomazi River;
The Middle South Coast, which extends from the uMkhomazi River to the Mtwalume River (just north of Hibberdene); and
The Lower South Coast, which extends from the Mtwalume River to the Mtamvuna River (Port Edward).
As shown in Figure 6.52, the Upper South Coast is located in eThekwini Municipality, the Middle South Coast in the southern-most portion of eThekwini Municipality and Umdoni Municipality, and the Lower South Coast in the southern-most portion of Umdoni Municipality, Umzumbe Municipality and Ray Nkonyeni Municipality. Umgeni Water currently only operates in the Upper and Middle South Coast sub-regions, and supplies bulk treated water to the southern parts of eThekwini Municipality and to the northern parts of Ugu District Municipality. Bulk water infrastructure is located primarily within the coastal strip, with some pipelines extending into adjacent rural areas, as shown in Figure 6.52. The bulk infrastructure is either owned by Umgeni Water, eThekwini Municipality, Ugu District Municipality, or is privately owned by Sappi Saiccor. Figure 6.53 shows a schematic layout of the Middle South Coast Supply Network and is represented spatially in Figure 6.54. In terms of water resources, the Upper and Middle South Coast sub-regions rely heavily on the Lower Mgeni System (Section 5.2.2), which is already stressed. Water from Inanda Dam is treated at Wiggins WTP and potable water is supplied via the South Coast Augmentation (SCA) Pipeline to the Amanzimtoti WTP. Phase 1 of the SCA Pipeline was constructed by Umgeni Water in 1994 and transferred to eThekwini Municipality in 1997. The Phase 2 upgrade of the SCA pipeline was carried out by eThekwini Municipality in 2005. The SCA Pipeline is now wholly-owned and operated by eThekwini Municipality. Treated water is sold by Umgeni Water “at the fence” at Wiggins WTP, and there is a “buy-back” arrangement at Amanzimtoti WTP for the water required by Umgeni Water for the South Coast areas. The design capacity of the SCA in-line booster pump station is 97 Mℓ/day and, currently, this is adequate to augment the shortfall in supply from the Nungwane Dam, as well as limited treatment capacity at Amanzimtoti WTP. Wiggins WTP (Central Region, Mgeni System) via the SCA pipeline is used to augment potable water sales at Amanzimtoti WTP. As a result Amanzimtoti WTP operates as both a WTP and a bulk distribution node for the Upper and Middle South Coast sub-regions via the South Coast Pipeline (SCP).

292
Figure 6.52 General layout of the South Coast System.
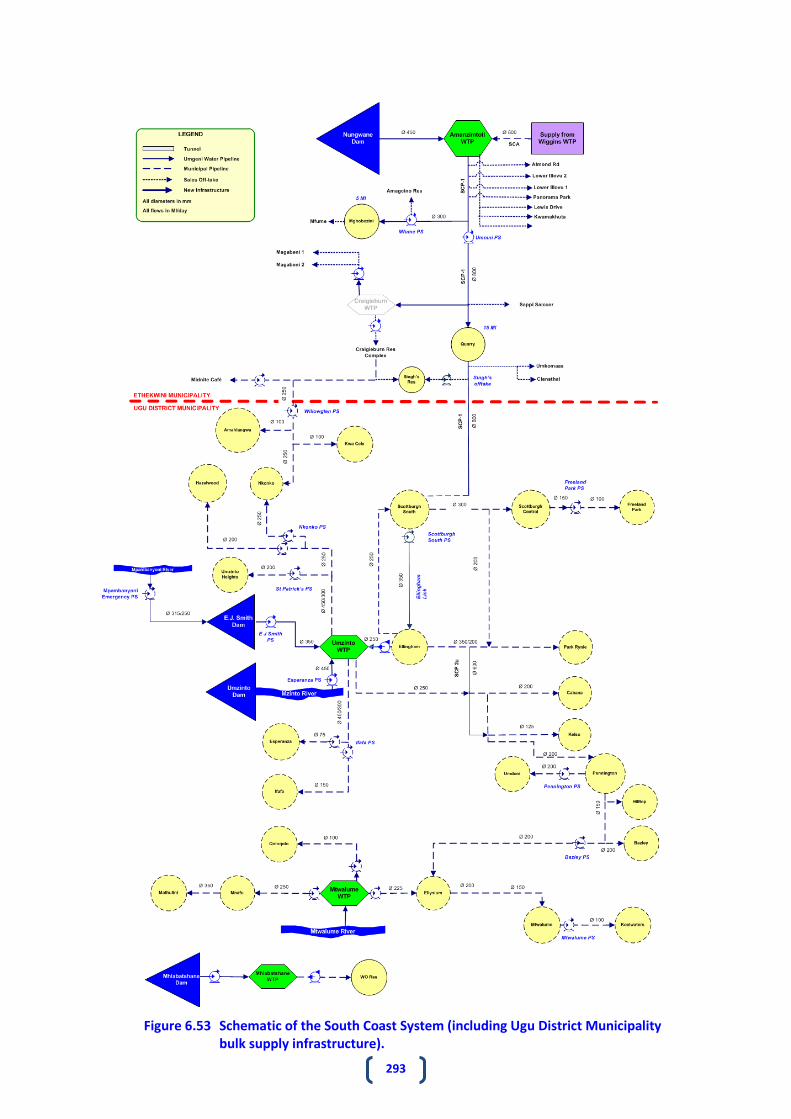
293
Figure 6.53 Schematic of the South Coast System (including Ugu District Municipality bulk supply infrastructure).

294
Figure 6.54 Middle South Coast Region.

295
Amanzimtoti Water Treatment Plant
The Amanzimtoti WTP (Figure 6.55) receives raw water from the Nungwane Dam (Figure 6.56) which has a yield of 9.9 Mℓ/day (at a 98% assurance of supply). The design capacity of the WTP is 22 Mℓ/day, which is far greater than the assured yield of the water resource. Potable water is also fed into the clear wells at the WTP from Wiggins WTP via the SCA Pipeline. The characteristics of this WTP are shown in Table 6.42.
Potable water is gravity fed from Amanzimtoti WTP along the 800 mm diameter steel South Coast Pipeline Phase 1 (SCP-1) (Table 6.43) to the uMnini Pump Station (Table 6.44) from where the water is pumped to the 15 Mℓ Quarry Reservoir (Table 6.45). eThekwini Municipality has connection points off this section of the SCP-1. From Quarry Reservoir, potable water is gravity fed along the 600 mm diameter steel SCP-1 (Table 6.43) and terminates at the off-take to Scottburgh South Reservoir. Ugu District Municipality intends to link a number of their reservoir supply zones to this section of the SCP-1. Scottburgh South Reservoir currently serves as a distribution reservoir supplying Scottburgh Central and Freeland Park reservoirs (via the Freeland Park Pump Station).
Figure 6.55 Amanzimtoti Water Treatment Plant

296
Figure 6.56 Amanzimtoti WTP to Quarry Reservoir.

297
Table 6.42 Characteristics of the Amanzimtoti WTP.
WTP Name: Amanzimtoti WTP
System: South Coast System
Maximum Design Capacity: 22 Mℓ/day
Current Utilisation: 13.0 Mℓ/day
Raw Water Storage Capacity: None
Raw Water Supply Capacity: 27.5 Mℓ/day
Pre-Oxidation Type: None
Primary Water Pre-Treatment Chemical: Other
Total Coagulant Dosing Capacity: Polymeric Coagulant
Rapid Mixing Method: Flow Over Weir
Clarifier Type: Circular Mechanical Scraper Clarifier
Number of Clarifiers: 3
Total Area of all Clarifiers: 1186.5 m2
Total Capacity of Clarifiers: 11.5 Mℓ/day
Filter Type: Other
Number of Filters: 13
Filter Floor Type 211.25 m2
Total Filtration Area of all Filters 1.7 Mℓ/day
Total Filtration Design Capacity of all Filters: 5 m3
Total Capacity of Backwash Water Tanks: 2000 kg/day of thin sludge
Total Capacity of Sludge Treatment Plant: N/A
Capacity of Used Wash water System:
Primary Post Disinfection Type: Chlorine Gas
Disinfection Dosing Capacity: 500 kg/hr
Total Treated Water Storage Capacity: 24 Mℓ

298
Craigieburn Water Treatment Plant
The Craigieburn WTP (Figure 6.57) was decommissioned with the commissioning of the SCP-1 (IMP 2009). Currently the clear wells at Craigieburn WTP receive potable water off the SCP-1 upstream of the Quarry Reservoir. Potable water is then pumped to the Craigieburn Reservoir Complex. From the Craigieburn Reservoir Complex, potable water is pumped to the Midnite Café Reservoir, from where eThekwini Municipality sells the water to Ugu District Municipality. Potable water is also pumped from the Craigieburn Reservoir Complex, via the Willowglen Booster Pump Station, to Ugu District Municipality’s Amahlangwa and Kwa Cele Reservoirs (Figure 6.53). Table 6.46 shows the details of these pump stations. The 250 mm diameter pipeline that links Amahlangwa and Nkonko reservoirs serves as an emergency supply pipeline between Craigieburn WTP and Umzinto WTP during below-average rainfall periods, and is currently used extensively (Figure 6.53).
Figure 6.57 Craigieburn Water Treatment Plant (decommissioned).
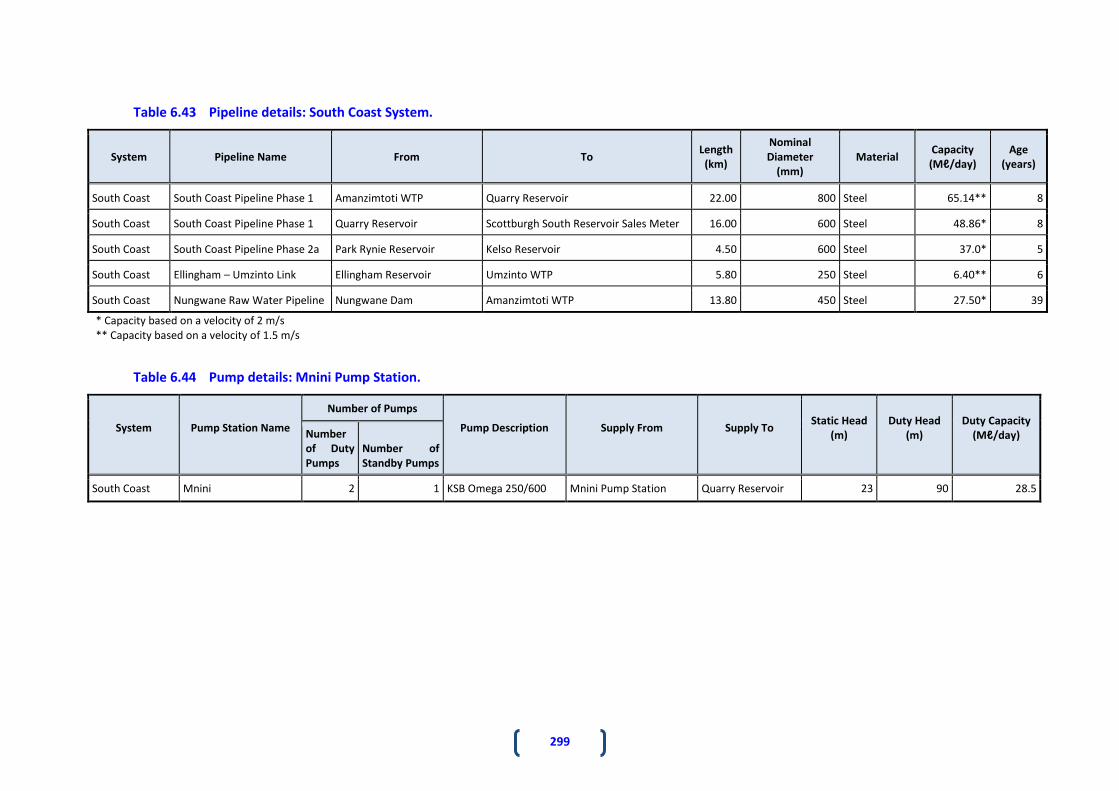
299
Table 6.43 Pipeline details: South Coast System.
System Pipeline Name From To Length
(km)
Nominal Diameter
(mm) Material
Capacity (Mℓ/day)
Age (years)
South Coast South Coast Pipeline Phase 1 Amanzimtoti WTP Quarry Reservoir 22.00 800 Steel 65.14** 8
South Coast South Coast Pipeline Phase 1 Quarry Reservoir Scottburgh South Reservoir Sales Meter 16.00 600 Steel 48.86* 8
South Coast South Coast Pipeline Phase 2a Park Rynie Reservoir Kelso Reservoir 4.50 600 Steel 37.0* 5
South Coast Ellingham – Umzinto Link Ellingham Reservoir Umzinto WTP 5.80 250 Steel 6.40** 6
South Coast Nungwane Raw Water Pipeline Nungwane Dam Amanzimtoti WTP 13.80 450 Steel 27.50* 39
* Capacity based on a velocity of 2 m/s ** Capacity based on a velocity of 1.5 m/s
Table 6.44 Pump details: Mnini Pump Station.
System
Pump Station Name
Number of Pumps
Pump Description
Supply From
Supply To
Static Head (m)
Duty Head (m)
Duty Capacity (Mℓ/day)
Number of Duty Pumps
Number of Standby Pumps
South Coast Mnini 2 1 KSB Omega 250/600 Mnini Pump Station Quarry Reservoir 23 90 28.5

300
Table 6.45 Reservoir details: Upper and Middle South Coast Sub-Systems.
System Reservoir Site Reservoir Name Capacity
(Mℓ) Function
TWL (mASL)
FL (mASL)
South Coast Amanzimtoti WTP Amanzimtoti Reservoir 1 3.50 Balancing 131.8 128.8
South Coast Amanzimtoti WTP Amanzimtoti Reservoir 2 2.79 Balancing 131.8 128.8
South Coast Amanzimtoti WTP Amanzimtoti Reservoir 3 5.00 Balancing 131.8 125.1
South Coast Amanzimtoti WTP Amanzimtoti Reservoir 4 15.00 Balancing 132.1 125.1
South Coast Mgobhozini Mgobhozini Reservoir* 5.00 Distribution 182.2 176.6
South Coast Quarry Reservoir Quarry Reservoir 15.00 Balancing 155.0 147.4
South Coast Scottburgh Scottburgh South** 5.25 Distribution 102.3 98.5
South Coast Scottburgh Scottburgh Central** 2.71 Distribution 86.1 82.4
South Coast Scottburgh Freeland Park** 2.50 Terminal 86.4 81.7
* Reservoir owned and operated by eThekwini Municipality ** Reservoir owned and operated by Ugu District Municipality
Table 6.46 Pump details: Upper and Middle South Coast Sub-Systems.
System
Pump Station Name
Number of Pumps
Pump Description
Supply From
Supply To
Static Head (m)
Duty Head (m)
Duty Capacity (Mℓ/day)
Number of
Duty Pumps
Number of Standby Pumps
South Coast Craigieburn 2 1 KSB WKLn 80/4 Craigieburn WTP Craigieburn Reservoir Complex 192.9 220 2.18
South Coast Craigieburn 1 1 KSB WKLn 80/3 Craigieburn WTP Magabeni Res 1 and 2 150.3 192 0.71
South Coast Mfume 1 1 KSB WKLn 125/4 South Coast Pipeline Phase 1 Mgobhozini Reservoir and Amagcino Reservoir
98.0 120 6.00
South Coast Freeland Park* 1 1 Scottburgh Central Reservoir Freeland Park Reservoir 4.0 10 2.00
* Pump Station owned and operated by Ugu District Municipality

301
Umzinto Water Treatment Plant
The Umzinto WTP (Figure 6.58 and Table 6.47) receives its raw water from two sources. Water is either released into the Mzinto River from the Umzinto Dam, abstracted a few kilometres downstream through a sand-abstraction system at Esperanza and pumped to the WTP. Alternatively, raw water can be pumped to the WTP directly from the E.J. Smith Dam situated on the Mzimayi River (Figure 6.59, Table 6.48 and Table 6.49). Raw water can also be supplied from both sources simultaneously. The design capacity of the Umzinto WTP is 13.6 Mℓ/day, with provision for an upgrade, which will bring the total capacity to 18.2 Mℓ/day. The supply of treated water from the WTP is currently limited by the availability of raw water, viz. 8.9 Mℓ/day at a 98% assurance level. A temporary emergency scheme to augment the raw water supply from the E.J. Smith Dam was implemented by Umgeni Water during December 2014 as a drought mitigation measure. When required, this scheme has the capacity to transfer 8.0 Mℓ/day from the Mpambanyoni River into the E.J. Smith Dam. The Umzinto WTP is owned by Ugu District Municipality, but operated by Umgeni Water under a management contract. Treated water from the WTP is sold to Ugu District Municipality “at the fence” and they are responsible for distribution within the entire network from the Umzinto WTP. The emergency pipeline as well as the pipeline details of the Umzinto Raw Water Supply System is provided in Table 6.48, and the pump and the reservoirs details in Table 6.49 and Table 6.50 respectively.
Figure 6.58 Umzinto Water Treatment Plant.

302
Table 6.47 Characteristics of the Umzinto WTP.
WTP Name: Umzinto WTP
System: South Coast System
Maximum Design Capacity: 13.6 Mℓ/day
Current Utilisation: 9.4 Mℓ/day
Raw Water Storage Capacity: N/A
Raw Water Supply Capacity: 12.24 Mℓ/day
Pre-Oxidation Type: KMnO4
Primary Water Pre-Treatment Chemical: Polymeric Coagulant
Total Coagulant Dosing Capacity: None
Rapid Mixing Method: Conventional Paddle Flash Mixer
Clarifier Type: Clari-Flocculator
Number of Clarifiers: 3
Total Area of all Clarifiers: 387 m2
Total Capacity of Clarifiers: 14 Mℓ/day at 1.5 m/hr up flow rate, 19 Mℓ/day at 2 m/hr up flow rate
Filter Type: Constant Rate Rapid Gravity Filters
Number of Filters: 5
Filter Floor Type Monolithic
Total Filtration Area of all Filters 127 m2
Total Filtration Design Capacity of all Filters: 12 at 3.9 m/hr filtration rate, 15 Mℓ/day at 5 m/hr filtration rate
Total Capacity of Backwash Water Tanks: Nil
Total Capacity of Sludge Treatment Plant: Nil
Capacity of Used Wash water System: Nil
Primary Post Disinfection Type: Chlorine Gas
Disinfection Dosing Capacity: 12 kg Cl2/hr including the Stand-By Unit
Disinfectant Storage Capacity:
Total Treated Water Storage Capacity: 5 Mℓ

303 Figure 6.59 Umzinto Supply System.

304
Table 6.48 Pipeline details: Umzinto Raw Water Supply System.
System Pipeline Name From To Length
(km)
Nominal Diameter
(mm) Material
Capacity (Mℓ/day)
Age (years)
Umzinto Mpambanyoni Emergency Mpambanyoni Temporary River Abstraction E J Smith Dam
0.61 2.13 2.70
355 315 250
Steel uPVC-O uPVC-O 8.00** 2
Umzinto Umzinto River rising main # Umzinto River Abstraction Umzinto WTP 3.5 450 AC 9 36
Umzinto E J Smith Dam rising main # E J Smith Dam Abstraction Umzinto WTP
0.65 0.65 0.65
200 200 225
Clamp on Steel HDPE Polyprop 8
26 36 36
# Pipeline owned by Ugu District Municipality and operated by Umgeni Water TBC
* Capacity based on a velocity of 2 m/s ** Capacity based on a velocity of 1.5 m/s
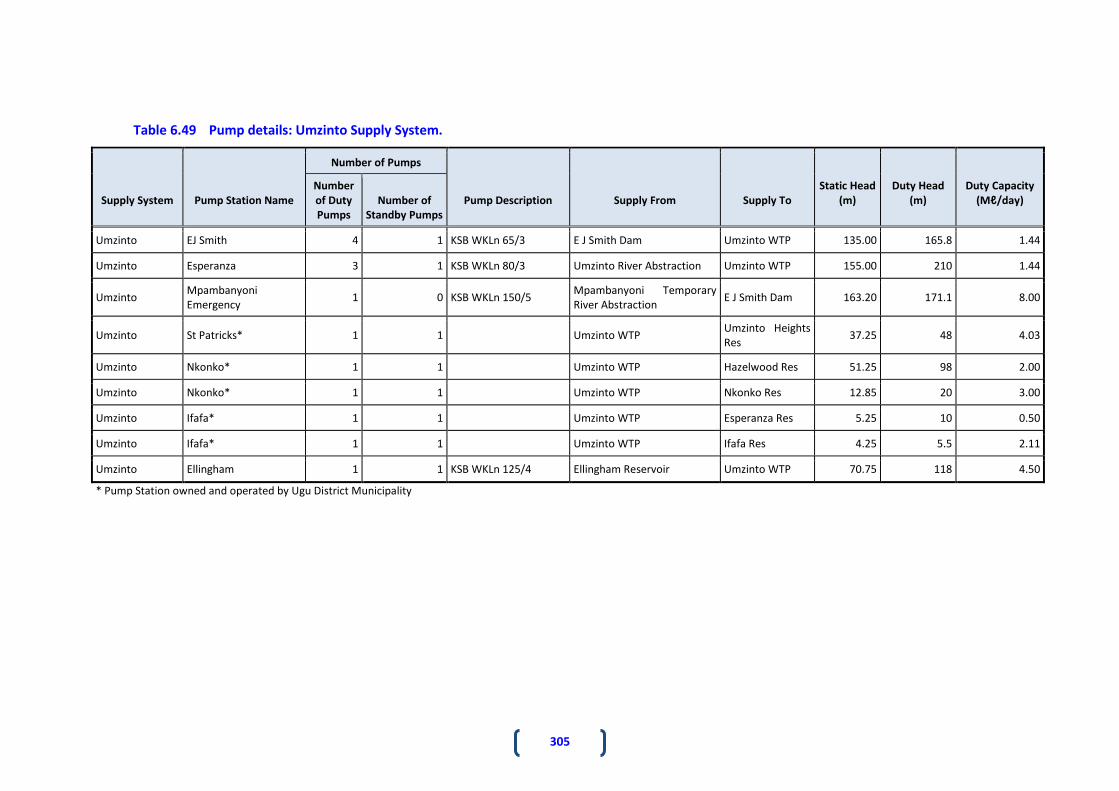
305
Table 6.49 Pump details: Umzinto Supply System.
Supply System
Pump Station Name
Number of Pumps
Pump Description
Supply From
Supply To
Static Head (m)
Duty Head (m)
Duty Capacity (Mℓ/day)
Number of Duty Pumps
Number of Standby Pumps
Umzinto EJ Smith 4 1 KSB WKLn 65/3 E J Smith Dam Umzinto WTP 135.00 165.8 1.44
Umzinto Esperanza 3 1 KSB WKLn 80/3 Umzinto River Abstraction Umzinto WTP 155.00 210 1.44
Umzinto Mpambanyoni Emergency
1 0 KSB WKLn 150/5 Mpambanyoni Temporary River Abstraction
E J Smith Dam 163.20 171.1 8.00
Umzinto St Patricks* 1 1 Umzinto WTP Umzinto Heights Res
37.25 48 4.03
Umzinto Nkonko* 1 1 Umzinto WTP Hazelwood Res 51.25 98 2.00
Umzinto Nkonko* 1 1 Umzinto WTP Nkonko Res 12.85 20 3.00
Umzinto Ifafa* 1 1 Umzinto WTP Esperanza Res 5.25 10 0.50
Umzinto Ifafa* 1 1 Umzinto WTP Ifafa Res 4.25 5.5 2.11
Umzinto Ellingham 1 1 KSB WKLn 125/4 Ellingham Reservoir Umzinto WTP 70.75 118 4.50
* Pump Station owned and operated by Ugu District Municipality

306
Table 6.50 Reservoir details: Umzinto Supply System.
Supply System
Reservoir Site Reservoir Name Capacity
(Mℓ) Function
TWL (aMSL)
FL (aMSL)
Umzinto Umzinto WTP Umzinto Reservoir 1 0.90 Balancing 204.8 201.75
Umzinto Umzinto WTP Umzinto Reservoir 2 2.10 Balancing 204.8 201.75
Umzinto Umzinto WTP Umzinto Reservoir 3 2.00 Balancing 204.8 201.75
Umzinto Umzinto Umzinto Heights** 5.00 Terminal 242.0 237.3
Umzinto Umzinto Hazelwood** 0.68 Terminal 256.0 253.18
Umzinto Umzinto Nkonko** 5.00 Terminal 217.6 212.95
Umzinto Umzinto Esperanza** 0.30 Terminal 210.0 207.00
Umzinto Umzinto Ifafa** 1.00 Terminal 209.0 206.00
Umzinto Park Rynie Ellingham** 2.00 Distribution 134.0 129.30
Umzinto Park Rynie Park Rynie** 0.90 Terminal 68.6 65.84
Umzinto Park Rynie Cabana** 1.00 Terminal 86.0 82.00
Umzinto Kelso Kelso** 0.50 Terminal 80.8 77.77
Umzinto Pennington Pennington** 3.00 Distribution 93.0 89.30
Umzinto Pennington Umdoni** 1.00 Terminal 130.0 126.00
Umzinto Pennington Hilltops** 2.00 Terminal 86.0 83.00
Umzinto Pennington Bazley** 1.00 Terminal 76.0 72.45
** Reservoir owned and operated by Ugu District Municipality
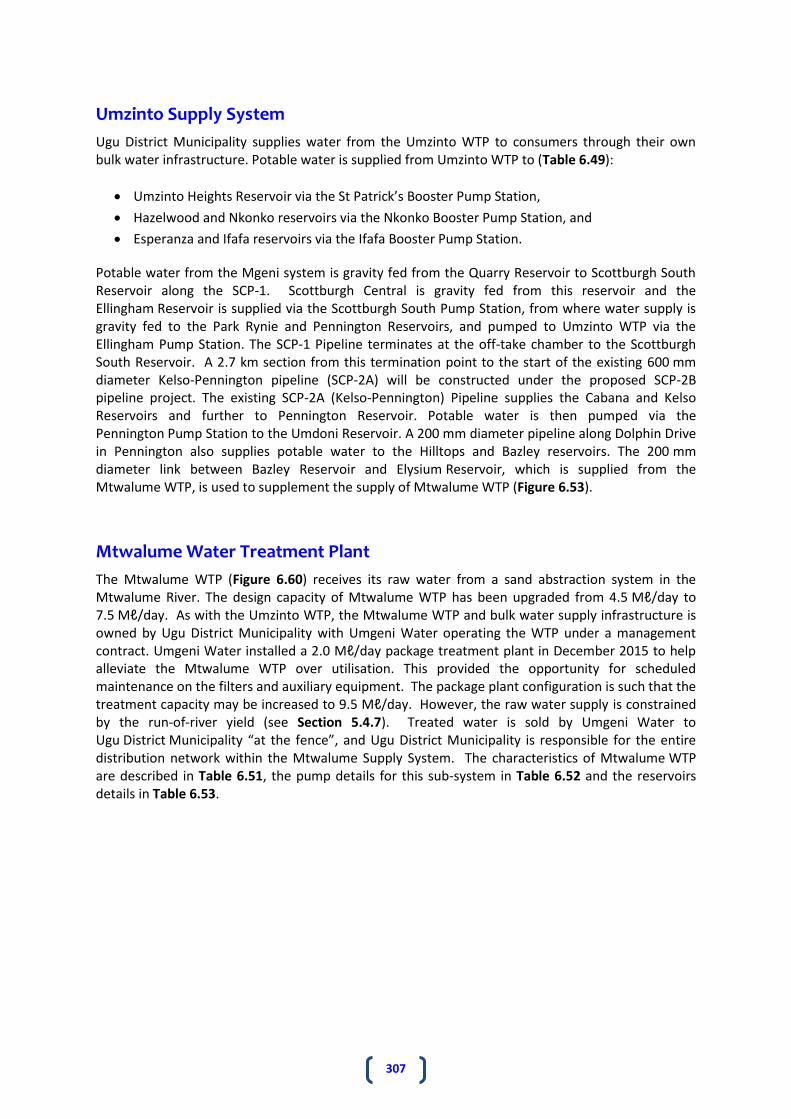
307
Umzinto Supply System
Ugu District Municipality supplies water from the Umzinto WTP to consumers through their own bulk water infrastructure. Potable water is supplied from Umzinto WTP to (Table 6.49):
Umzinto Heights Reservoir via the St Patrick’s Booster Pump Station,
Hazelwood and Nkonko reservoirs via the Nkonko Booster Pump Station, and
Esperanza and Ifafa reservoirs via the Ifafa Booster Pump Station.
Potable water from the Mgeni system is gravity fed from the Quarry Reservoir to Scottburgh South Reservoir along the SCP-1. Scottburgh Central is gravity fed from this reservoir and the Ellingham Reservoir is supplied via the Scottburgh South Pump Station, from where water supply is gravity fed to the Park Rynie and Pennington Reservoirs, and pumped to Umzinto WTP via the Ellingham Pump Station. The SCP-1 Pipeline terminates at the off-take chamber to the Scottburgh South Reservoir. A 2.7 km section from this termination point to the start of the existing 600 mm diameter Kelso-Pennington pipeline (SCP-2A) will be constructed under the proposed SCP-2B pipeline project. The existing SCP-2A (Kelso-Pennington) Pipeline supplies the Cabana and Kelso Reservoirs and further to Pennington Reservoir. Potable water is then pumped via the Pennington Pump Station to the Umdoni Reservoir. A 200 mm diameter pipeline along Dolphin Drive in Pennington also supplies potable water to the Hilltops and Bazley reservoirs. The 200 mm diameter link between Bazley Reservoir and Elysium Reservoir, which is supplied from the Mtwalume WTP, is used to supplement the supply of Mtwalume WTP (Figure 6.53).
Mtwalume Water Treatment Plant
The Mtwalume WTP (Figure 6.60) receives its raw water from a sand abstraction system in the Mtwalume River. The design capacity of Mtwalume WTP has been upgraded from 4.5 Mℓ/day to 7.5 Mℓ/day. As with the Umzinto WTP, the Mtwalume WTP and bulk water supply infrastructure is owned by Ugu District Municipality with Umgeni Water operating the WTP under a management contract. Umgeni Water installed a 2.0 Mℓ/day package treatment plant in December 2015 to help alleviate the Mtwalume WTP over utilisation. This provided the opportunity for scheduled maintenance on the filters and auxiliary equipment. The package plant configuration is such that the treatment capacity may be increased to 9.5 Mℓ/day. However, the raw water supply is constrained by the run-of-river yield (see Section 5.4.7). Treated water is sold by Umgeni Water to Ugu District Municipality “at the fence”, and Ugu District Municipality is responsible for the entire distribution network within the Mtwalume Supply System. The characteristics of Mtwalume WTP are described in Table 6.51, the pump details for this sub-system in Table 6.52 and the reservoirs details in Table 6.53.

308
Figure 6.60 Mtwalume Water Treatment Plant.
Mtwalume Supply System
It is important to take cognisance of the fact that the bulk supply system from the Mtwalume WTP is owned and operated by Ugu District Municipality, and hence Umgeni Water’s own operations and future augmentation plans are integrated into this system. Potable water is supplied from Mtwalume WTP via the Mtwalume WTP Pump Station to the Qoloqolo, Elysium and Mnafu reservoirs. Potable water is then gravity fed from the Mnafu Reservoir to the Mathulini Reservoir. Potable water is gravity fed from the Elysium Reservoir to the Mtwalume Reservoir and then the water is pumped via the Mtwalume Pump Station to the Koelwaters Reservoir (Figure 6.53).

309
Table 6.51 Characteristics of the Mtwalume WTP.
WTP Name: Mtwalume WTP
System: Mtwalume WTP Supply System
Maximum Design Capacity: 7.5 Mℓ/day
Current Utilisation: 10.4 Mℓ/day
Raw Water Storage Capacity: 0.11 Mℓ/day
Raw Water Supply Capacity: 8.4 Mℓ/day
Pre-Oxidation Type: Pre chlorination
Primary Water Pre-Treatment Chemical: Polymeric Coagulant
Total Coagulant Dosing Capacity: Other
Rapid Mixing Method: Conventional Paddle Flash Mixer
Clarifier Type: Dortmund Type Clarifier
Number of Clarifiers: 3
Total Area of all Clarifiers: 324 m2
Total Capacity of Clarifiers: 16 at Rise Rate of 2 m/hr
Filter Type: Constant Rate Rapid Gravity Filters
Number of Filters: 3
Total Filtration Area of all Filters 72 m2
Total Filtration Design Capacity of all Filters: 15.552 Mℓ/day
Primary Post Disinfection Type: Chlorine Gas
Disinfection Dosing Capacity: 8 kg Cl2/hr
Total Treated Water Storage Capacity: 9 Mℓ
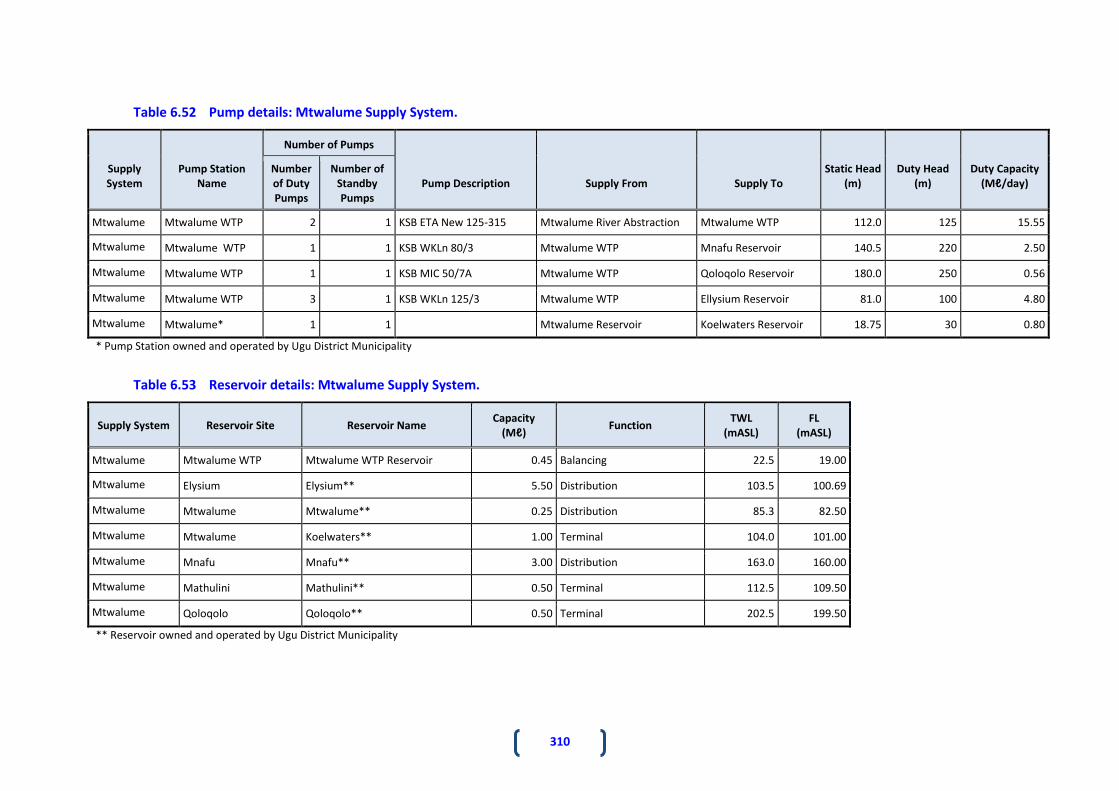
310
Table 6.52 Pump details: Mtwalume Supply System.
Supply System
Pump Station Name
Number of Pumps
Pump Description
Supply From
Supply To
Static Head (m)
Duty Head (m)
Duty Capacity (Mℓ/day)
Number of Duty Pumps
Number of Standby Pumps
Mtwalume Mtwalume WTP 2 1 KSB ETA New 125-315 Mtwalume River Abstraction Mtwalume WTP 112.0 125 15.55
Mtwalume Mtwalume WTP 1 1 KSB WKLn 80/3 Mtwalume WTP Mnafu Reservoir 140.5 220 2.50
Mtwalume Mtwalume WTP 1 1 KSB MIC 50/7A Mtwalume WTP Qoloqolo Reservoir 180.0 250 0.56
Mtwalume Mtwalume WTP 3 1 KSB WKLn 125/3 Mtwalume WTP Ellysium Reservoir 81.0 100 4.80
Mtwalume Mtwalume* 1 1 Mtwalume Reservoir Koelwaters Reservoir 18.75 30 0.80
* Pump Station owned and operated by Ugu District Municipality
Table 6.53 Reservoir details: Mtwalume Supply System.
Supply System Reservoir Site Reservoir Name Capacity
(Mℓ) Function
TWL (mASL)
FL (mASL)
Mtwalume Mtwalume WTP Mtwalume WTP Reservoir 0.45 Balancing 22.5 19.00
Mtwalume Elysium Elysium** 5.50 Distribution 103.5 100.69
Mtwalume Mtwalume Mtwalume** 0.25 Distribution 85.3 82.50
Mtwalume Mtwalume Koelwaters** 1.00 Terminal 104.0 101.00
Mtwalume Mnafu Mnafu** 3.00 Distribution 163.0 160.00
Mtwalume Mathulini Mathulini** 0.50 Terminal 112.5 109.50
Mtwalume Qoloqolo Qoloqolo** 0.50 Terminal 202.5 199.50
** Reservoir owned and operated by Ugu District Municipality

311
Lower South Coast Sub-Region (Operated by Ugu DM)
The Lower South Coast sub-region (Figure 6.52) is supplied with bulk treated water from the Bhobhoyi WTP (current capacity of 54 Mℓ/day with a planned increase in capacity to 81 Mℓ/day) located 8 km inland of Port Shepstone, and from the Mtamvuna WTP (20 Mℓ/day) located 25 km inland of Port Edward. The Bhobhoyi and Mtamvuna WTP’s receive water from the Mzimkhulu and Mtamvuna rivers respectively (Section 5.4.9). Both WTPs are owned and operated by Ugu District Municipality. In addition, there are a number of smaller WTP’s in the area, such as those supplying Harding and Dududu.
Mhlabatshane Supply System
Umgeni Water commissioned the Mhlabatshane WTP in October 2014; which it owns and operates in the Lower South Coast area. Umgeni Water’s involvement relates to bulk water supply provision and Ugu District Municipality is responsible for the reticulation aspects. The Mhlabatshane Supply System supplies the inland rural areas of the Umzumbe and Ray Nkonyeni Local Municipalities. Raw water is pumped from the dam (Figure 6.61) to the Mhlabatshane WTP situated in close proximity to a command reservoir. Potable water is pumped from the WTP to the command reservoir and is then sold to Ugu District Municipality for reticulation through an extensive gravity-fed network to the various communities in the area. Some of the reticulation components currently exist as stand-alone schemes, with the remainder in the process of being constructed. Following the recent revised demarcation of District Municipal Boundaries, some of the areas supplied by the Mhlabatshane WTP (Ndwebu) now fall within the Harry Gwala District Municipality. This scheme will therefore be regarded as a “regional scheme” with more than one WSA being supplied from the same source. A package plant that was used prior to the commissioning of the Mhlabatshane WTP remains on site as a “back-up” for when demand exceeds the WTP capacity (this package plant stopped operating in 2014/2015). Details of the water treatment plant (Table 6.54), pipelines (Table 6.55), pumps (Table 6.56) and reservoirs (Table 6.57) are given below.

312 Figure 6.61 Mhlabatshane Supply System.

313
Table 6.54 Characteristics of Mhlabatshane WTP.
WTP Name: Mhlabatshane WTP
System: Mhlabatshane Supply System
Maximum Design Capacity: 4 Mℓ/day
Current Utilisation: 2.8 Mℓ/d
Raw Water Storage Capacity: 0.5 Mℓ/day
Raw Water Supply Capacity: 8 Mℓ/day
Pre-Oxidation Type: Pre chlorination
Primary Water Pre-Treatment Chemical: Aluminium Sulphate
Total Coagulant Dosing Capacity: 150 mg/ℓ
Rapid Mixing Method: Flow Over Hydraulic weir
Clarifier Type: Dortmund – confirm off design report
Number of Clarifiers: 4
Total Area of all Clarifiers: 144 m2
Total Capacity of Clarifiers: 4 Mℓ/d
Filter Type: Rapid Gravity Sand Filters
Number of Filters: 4
Filter Floor Type Monolithic
Total Filtration Area of all Filters 65 m2
Total Filtration Design Capacity of all Filters: 8 Mℓ/day
Total Capacity of Backwash Water Tanks: N/A
Total Capacity of Sludge Treatment Plant: N/A
Capacity of Used Wash water System:
Primary Post Disinfection Type: Chlorine Gas
Disinfection Dosing Capacity: 2.5 kg/hr (max)
Disinfectant Storage Capacity: Stored in 70 kg Cylinders
Total Treated Water Storage Capacity: 2.5 Mℓ

314
Table 6.55 Pipeline Details: Mhlabatshane Supply System.
System Pipeline Name From To Length (km) Nominal Diameter (mm) Material Capacity*
(Mℓ/day)
Age
(years)
Mhlabatshane Gravity main Mhlabatshane WTP Ndwebu Tie-in at the Dam site 3.8 200 Steel 1.24 4.5
Mhlabatshane Rising main Dam Booster Pump station 1.0 450 Steel 10.25 4.5
Mhlabatshane Rising Main Booster Pump station Mhlabatshane WTP 2.7 400 PVC 10.1 4.5
Mhlabatshane Rising Main Mhlabatshane WTP Command Reservoir 0.8 350 Steel 7.86 4.5
* Capacity based on a velocity of 2 m/s
Table 6.56 Pump Details: Mhlabatshane Supply System.
Supply System
Pump Station Name
Number of Pumps
Pump Description
Supply From
Supply To
Static Head (m)
Duty Head (m)
Duty Capacity (Mℓ/day)
Number of Duty
Pumps
Number of Standby Pumps
Mhlabatshane Dam low lift pump station
2 1 KSB WKLn 150/4 Mhlabatshane Dam Raw Water Tank 156.0 NA 10.0
Mhlabathsane Booster 2 1 KSB WKLn 150/4
Raw Water Tank (500 kℓ concrete reservoir)
500 kℓ Reservoir at WTP 149.0 NA 10.0
Mhlabathshane Clean water pump station
2 1 KSB ETA 100-50/2 1750 Kℓ Potable reservoir 2 Mℓ Command Reservoir 51.0 NA 7.8

315
Table 6.57 Reservoir Details: Mhlabatshane Supply System.
System Reservoir Site Reservoir Name Capacity
(Mℓ) Function
TWL
(mASL)
FL
(mASL)
Mhlabatshane Booster Pump Station/Phungashe Booster Pump station 0.5 Balancing 738.0 735.5
Mhlabatshane Mhlabathshane WTP Potable Water Pump station 1.75 Distribution 863.1 Unknown
Mhlabatshane Mhlabatshane WTP Inlet Works 0.5 Balancing 866.8 864.3
Mhlabatshane MTN Tower Command 0.5
2.0 Distribution
911.5
909.2
908.3
905.1
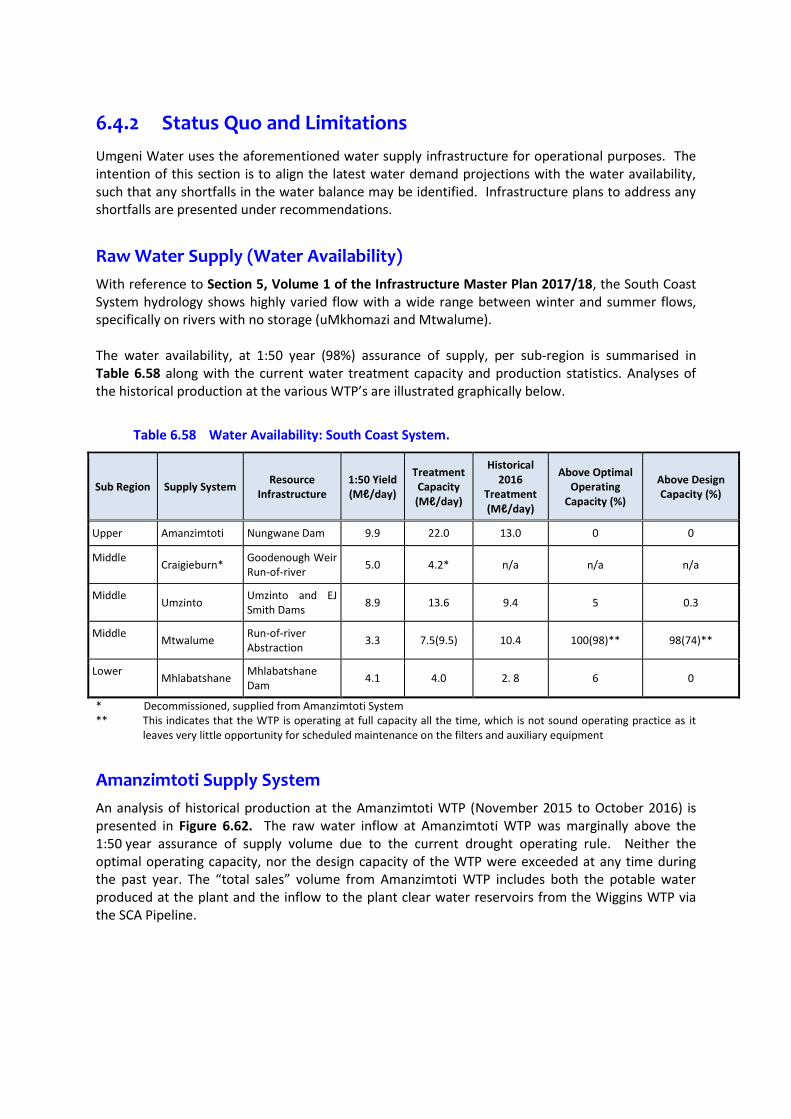
6.4.2 Status Quo and Limitations
Umgeni Water uses the aforementioned water supply infrastructure for operational purposes. The intention of this section is to align the latest water demand projections with the water availability, such that any shortfalls in the water balance may be identified. Infrastructure plans to address any shortfalls are presented under recommendations.
Raw Water Supply (Water Availability)
With reference to Section 5, Volume 1 of the Infrastructure Master Plan 2017/18, the South Coast System hydrology shows highly varied flow with a wide range between winter and summer flows, specifically on rivers with no storage (uMkhomazi and Mtwalume). The water availability, at 1:50 year (98%) assurance of supply, per sub-region is summarised in Table 6.58 along with the current water treatment capacity and production statistics. Analyses of the historical production at the various WTP’s are illustrated graphically below.
Table 6.58 Water Availability: South Coast System.
Sub Region Supply System Resource
Infrastructure 1:50 Yield (Mℓ/day)
Treatment Capacity (Mℓ/day)
Historical 2016
Treatment (Mℓ/day)
Above Optimal Operating
Capacity (%)
Above Design Capacity (%)
Upper Amanzimtoti Nungwane Dam 9.9 22.0 13.0 0 0
Middle Craigieburn*
Goodenough Weir Run-of-river
5.0 4.2* n/a n/a n/a
Middle Umzinto
Umzinto and EJ Smith Dams
8.9 13.6 9.4 5 0.3
Middle Mtwalume
Run-of-river Abstraction
3.3 7.5(9.5) 10.4 100(98)** 98(74)**
Lower Mhlabatshane
Mhlabatshane Dam
4.1 4.0 2. 8 6 0
* Decommissioned, supplied from Amanzimtoti System ** This indicates that the WTP is operating at full capacity all the time, which is not sound operating practice as it
leaves very little opportunity for scheduled maintenance on the filters and auxiliary equipment
Amanzimtoti Supply System
An analysis of historical production at the Amanzimtoti WTP (November 2015 to October 2016) is presented in Figure 6.62. The raw water inflow at Amanzimtoti WTP was marginally above the 1:50 year assurance of supply volume due to the current drought operating rule. Neither the optimal operating capacity, nor the design capacity of the WTP were exceeded at any time during the past year. The “total sales” volume from Amanzimtoti WTP includes both the potable water produced at the plant and the inflow to the plant clear water reservoirs from the Wiggins WTP via the SCA Pipeline.
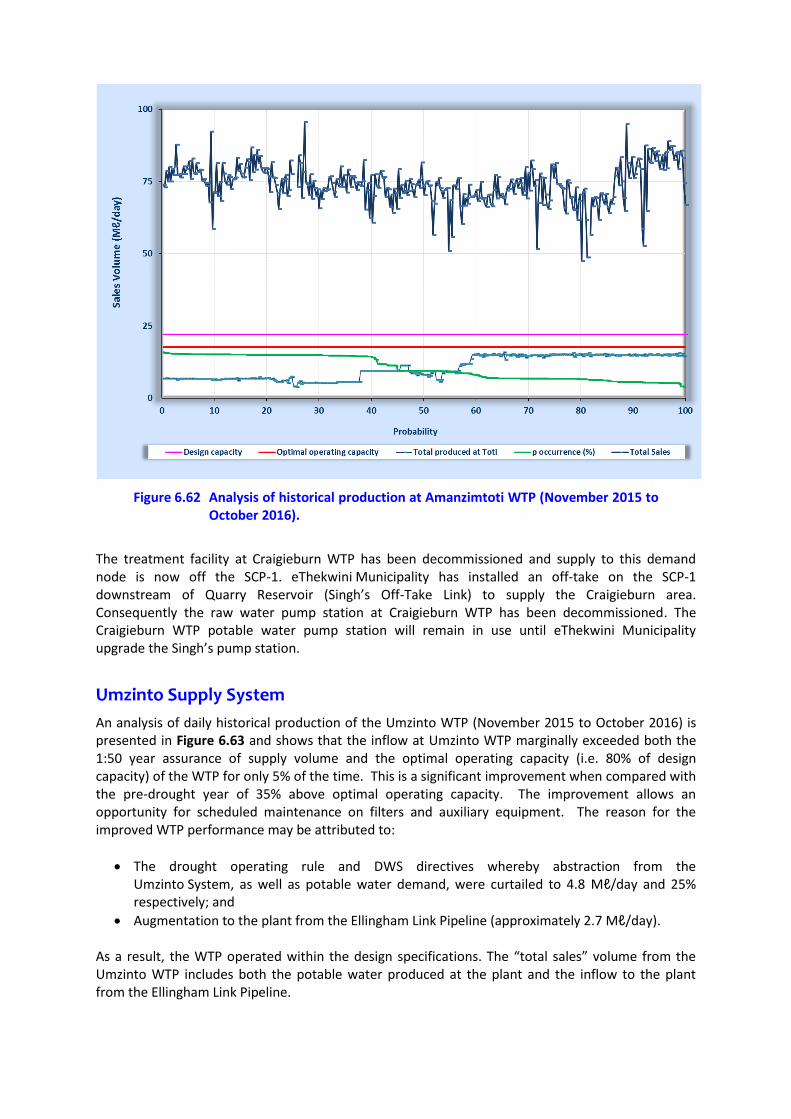
Figure 6.62 Analysis of historical production at Amanzimtoti WTP (November 2015 to October 2016).
The treatment facility at Craigieburn WTP has been decommissioned and supply to this demand node is now off the SCP-1. eThekwini Municipality has installed an off-take on the SCP-1 downstream of Quarry Reservoir (Singh’s Off-Take Link) to supply the Craigieburn area. Consequently the raw water pump station at Craigieburn WTP has been decommissioned. The Craigieburn WTP potable water pump station will remain in use until eThekwini Municipality upgrade the Singh’s pump station.
Umzinto Supply System
An analysis of daily historical production of the Umzinto WTP (November 2015 to October 2016) is presented in Figure 6.63 and shows that the inflow at Umzinto WTP marginally exceeded both the 1:50 year assurance of supply volume and the optimal operating capacity (i.e. 80% of design capacity) of the WTP for only 5% of the time. This is a significant improvement when compared with the pre-drought year of 35% above optimal operating capacity. The improvement allows an opportunity for scheduled maintenance on filters and auxiliary equipment. The reason for the improved WTP performance may be attributed to:
The drought operating rule and DWS directives whereby abstraction from the Umzinto System, as well as potable water demand, were curtailed to 4.8 Mℓ/day and 25% respectively; and
Augmentation to the plant from the Ellingham Link Pipeline (approximately 2.7 Mℓ/day). As a result, the WTP operated within the design specifications. The “total sales” volume from the Umzinto WTP includes both the potable water produced at the plant and the inflow to the plant from the Ellingham Link Pipeline.

Figure 6.63 Analysis of historical production at Umzinto WTP (November 2015 to October 2016).
Mtwalume Supply System
An analysis of the daily historical production of the Mtwalume WTP (November 2015 to October 2016), against the upgraded capacity is presented in Figure 6.64. It shows that for 98% of the time the WTP was operated above the optimal operating capacity (80% of design capacity) and for 99% of the time the WTP was operated at above design capacity. This indicates that the WTP is operating at full capacity all the time, which is not sound operating practice as it leaves inadequate opportunity for scheduled maintenance on the filters and auxiliary equipment. In this regard, Umgeni Water has installed a 2 Mℓ/day water treatment package plant at the site, resulting in the WTP operating 98% of the time above the optimal operating capacity and 74% of the time above the design capacity.

Figure 6.64 Analysis of historical production at Mtwalume WTP (November 2015 to October 2016).
Raw water supply to Mtwalume WTP is via run-of-river abstraction. This supply is ultimately constrained by the availability of stream flow, especially during the current drought.
Mhlabatshane Supply System
An analysis of historical production at the Mhlabatshane WTP (November 2015 to October 2016) is presented in Figure 6.65. The raw water inflow at Mhlabatshane WTP was significantly below the 1:50 year assurance of supply volume due a low level of uptake in demand since the commissioning of the WTP during 2014. The optimal operating capacity of the WTP was exceeded 6% of the time and design capacity was not exceeded during this period.

Figure 6.65 Analysis of historical production at Mhlabatshane WTP (November 2015 to October 2016).
Conclusions relating to raw water supply (water availability) to the South Coast System are:
The upper and middle sub regions show a failure in the hydrological water balance.
Raw water supply to the Amanzimtoti, Umzinto and Mtwalume WTP needs to be augmented to enable the full treatment capacity to be utilised.
The Mtwalume WTP is currently being operated beyond its’ design capacity.
The Mhlabatshane WTP is currently underutilised. With reference to Section 5, Volume 1 Infrastructure Master Plan 2017/18, there is sufficient raw water available in the rivers within the South Coast System. However, the opportunities for additional yield from these rivers require new infrastructure before it may be utilised. Typically these resources are too far from the users. The Mpambanyoni Emergency Scheme provides temporary relief by utilising the run-of-river flows when available, thereby improving the yield of the Umzinto System. The scheme is not permanent and the additional increase in yield is unreliable.
Water Usage and Demand Estimates
Figure 6.66; Figure 6.67; Figure 6.68; Figure 6.69; Figure 6.70; and Figure 6.71 illustrate, schematically, the South Coast System in its current configuration and the existing demands being placed on the network. These schematics should be referred to when reading this Section.

Figure 6.66 Demand on the South Coast System as at November 2016.

Figure 6.67 Five year demand projection for the South Coast System.

Figure 6.68 Ten year demand projection for the South Coast System.

Figure 6.69 Fifteen year demand projection for the South Coast System.

Figure 6.70 Twenty year demand and projection for the South Coast System.

Figure 6.71 Thirty year demand projection for the South Coast System.

The water usage per sub-region is summarised in Table 6.59, along with the current relevant reservoir storage capacities. Analyses of the historical water sales for the sub regions are illustrated graphically below.
Table 6.59 Water Availability: South Coast System.
Sub Region Supply System Infrastructure Capacity (Mℓ/day)
AADD (Mℓ/day) Storage Capacity
(Mℓ)
Upper Amanzimtoti* South Coast Pipeline 65.1 36.8 26.3
Middle Craigieburn** n/a n/a n/a n/a
Middle Umzinto*** WTP 13.6 9.4 5.0
Middle Mtwalume*** WTP 9.5 10.4 9.0
Lower Mhlabatshane WTP 4.1 2.8 2.0
* eThekwini 38.0 Mℓ/day and Ugu 25.0 Mℓ/day ** Decommissioned, supplied from Amanzimtoti System *** This indicates that the WTP is operating at full capacity
Amanzimtoti Supply System
The historical sales to the South Coast System, including a year forecast, from the Amanzimtoti WTP illustrates an AADD demand of 13.0 Mℓ/day (Figure 6.72). Sales peaked at 22.8 Mℓ/day in August 2016. Wiggins WTP (Central Region, Mgeni System) via the SCA pipeline is used to augment the above potable water sales at Amanzimtoti WTP. Augmentation is necessary to address this previously mentioned shortfall in raw water constraints at Nungwane Dam, as well as limited treatment capacity at Amanzimtoti WTP. As a result Amanzimtoti WTP operates as both a WTP and a bulk distribution node for the Upper and Middle South Coast sub-regions via the South Coast Pipeline (SCP). The design capacity of the SCA in-line booster pump station is 97 Mℓ/day, and is currently adequate to augment the shortfall in supply from the Nungwane Dam. With little opportunity for additional yield from the Nungwane Dam, the economics of operating Amanzimtoti WTP should be investigated once alternative bulk resources are made available on the South Coast. The design capacity (49 Mℓ/day) of the SCP-1 is significantly greater than the current demand of 36.3 Mℓ/day. The SCP-1 starts at Amanzimtoti WTP and terminates at the off-take to the Scottburgh South Reservoir. It serves as the primary conduit for the distribution of bulk treated water for a significant portion of the Upper and Middle South Coast sub-regions. Umgeni Water owns the SCP-1, and is responsible for the operation and maintenance of the pipeline, pump stations and reservoirs. The construction of link pipelines from the metered off-takes on the SCP-1 to the bulk distribution reservoirs is the responsibility of the relevant WSA’s.

Figure 6.72 Water demand from Amanzimtoti WTP.
Umzinto Supply System
The graph of historical sales, including a year forecast, at Umzinto WTP illustrates a current AADD demand of 9.4 Mℓ/day. Sales peaked at 12.0 Mℓ/day in November 2016. The growth in sales has increased significantly since April 2016; when EJ Smith Dam reached full supply level. The South Coast Pipeline (SCP-2a) and Mpambanyoni River Emergency Scheme assisted in continued supply to the Middle South Coast Region. The forecast sales growth is constrained by the available supply in the short term. Consequently the 12-month moving average of sales from the Umzinto WTP is projected to increase from 9.4 Mℓ/day to 12.0 Mℓ/day, i.e. the yield of the water resource (Figure 6.73) including the emergency scheme. Amanzimtoti WTP (Upper Sub Region, Nungwane / Mgeni System) via the SCP-1 pipeline is used to augment the above potable water sales at Umzinto WTP. This may be attributed to the previously mentioned shortfall in raw water resources at both Umzinto and E.J. Smith Dams. As a result Umzinto WTP operates as both a WTP and a bulk distribution node for the Middle South Coast sub-region. The design capacity of the Ellingham-Umzinto link, including in-line booster pump station at Scottburgh South Reservoir is 6.4 Mℓ/day, and is more than adequate to augment the shortfall in supply from the Umzinto and E.J. Smith Dams (Figure 6.73). With little opportunity for additional yield from these dams, the raw water supply to Umzinto WTP needs to be investigated / augmented to enable use of the installed treatment capacity.

Mtwalume Supply System
The graph of historical sales, including a year forecast, at Mtwalume WTP illustrates an AADD demand of 10.4 Mℓ/day. Sales peaked at 11.0 Mℓ/day in September 2016. The 12-month moving average of sales from the Mtwalume WTP is limited to the current water resource supply (Figure 6.74). Umzinto WTP (Middle Sub Region) via a pipeline linking the Bazley Reservoir to the Elysium Reservoir supply zone is used to augment the potable water sales at Mtwalume WTP. Augmentation is required to address the previously mentioned shortfall in raw water resources from the run-of-river abstraction. Despite the limited water availability, the infrastructure at Mtwalume WTP is also being operated at maximum capacity. As a result any growth in water demand will be curtailed. The bulk supply and distribution infrastructure should to be reviewed.
Figure 6.73 Water demand from Umzinto WTP.

Mhlabatshane Supply System
The graph of historical sales, including a year forecast, at Mhlabatshane WTP illustrates an AADD demand of 2.8 Mℓ/day. Sales peaked at 3.8 Mℓ/day in July 2016. The 12-month moving average of sales from the Mhlabatshane WTP Phase 1 will ultimately be limited to the yield of the water resource supply of 4.1 Mℓ/day (Figure 6.75). The current supply and associated infrastructure are deemed sufficient for the projected water demands.
Figure 6.74 Water demand from Mtwalume WTP.

Figure 6.75 Water demand from Mhlabatshane WTP
Conclusions relating to water usage and demand estimates (water availability) within the South Coast System are:
This system has to be viewed holistically due to the interdependency and augmentation between the sub regions. Any inadequacy of one section of the infrastructure is likely to place strain on upstream sections.
The economics of operating Amanzimtoti WTP needs to be investigated, when the raw water supply constraints have been alleviated.
Any growth in water demand from Mtwalume WTP is likely to be curtailed. The bulk supply and distribution infrastructure needs to be reviewed.
Peaks in water demand will adversely affect the Umzinto and Mtwalume WTP supply systems.
Reservoir storage requires evaluation with the sub regions integrated. Assessing demands by historical sales from WTP’s includes water losses within the distribution network. The quantum of water loss is unknown, although, effective WCDM measures are required to allow the current systems to meet demands in the short term. A DWS study, during 2014, estimated the Ugu DM non-revenue water to comprise of 30.9% by volume.

6.4.3 Recommendations
Figure 6.66; Figure 6.67; Figure 6.68; Figure 6.69; Figure 6.70; and Figure 6.71 depict the system as at November 2016 and the potential for growth in the South Coast System over the next five, ten, fifteen, twenty and thirty years respectively. Also shown in these figures is the configuration of the system that is planned to supply this demand. This section provides the details of how each subsystem will be affected by the growth in demand over the next thirty years and how the configuration of the system will have to be altered, and projects implemented, to supply the demand.
Raw Water Supply (Water Availability)
There is sufficient raw water available in the rivers within the South Coast System. However, the opportunities for additional yield from these rivers require new infrastructure before it may be utilised.
Raw Water Supply Augmentation Plans (Short to Medium Term Plans)
The raw water supply augmentation plans for Amanzimtoti, Umzinto and Mtwalume WTP to enable the full treatment capacity to be utilised include:
Replacement of the pipeline from Nungwane Dam to the Amanzimtoti WTP (Section 8.5.1).
The raw water supply to Umzinto WTP from adjacent catchments (Mpambanyoni River). The recently commissioned emergency scheme could be made permanent; however, supply is limited to run-of-river.
Investigate an upgrade to the raw water conveyance system from the Umzinto Dam; i.e. a gravity main from the Umzinto Dam through a pump station to the treatment works.
The Umzinto Dam has been designed to be raised. Raising the full supply level of Umzinto Dam could increase its firm yield. The financial viability of this should be investigated.
Create additional storage and/or reduce demands at Mtwalume WTP or, install a 2.5 Mℓ/day desalination package treatment plant at Elysium (Section 8.8).
Water Balance Plans (Long Term Plans)
The upper, middle and lower sub regions show a significant risk of failure in the hydrological water balance. Water balance plans include:
Develop a regional bulk water supply scheme in the Hull Valley area close to Sappi Saiccor. This scheme will receive raw water from an off channel storage dam (Ngwadini Dam) from the Lower uMkhomazi River (Lower uMkhomazi Bulk Water Supply Schemed (BWSS) - Section 8.5.4) for treatment and distribution into the SCP. Potable water would be fed northwards to the Upper South Coast region and Amanzimtoti, and southwards to the Middle South Coast region. This would then allow the Amanzimtoti and Craigieburn WTP’s to be fully decommissioned, or
Once the full capacity of the Lower uMkhomazi BWSS is utilised, construct a 150 Mℓ/day seawater reverse osmosis (SWRO) desalination plant near the mouth of the Lovu River to link into the SCP (Section 8.7).
Mhlabatshane Phase 2: Construct an abstraction works on the uMzimkulu River using the existing WTP and associated infrastructure (Section 8.5.3). The supply area stretches about 70 km from the Command Reservoir to KwaMadlala, near Umtentweni. The WTP would be upgraded from 4 Mℓ/day to 8 Mℓ/day.

Water Usage and Demand Estimates
Comparison of the existing system capacities with water demands indicate that the raw water resources are not aligned with the bulk supply and distribution infrastructure. This is evident by the various schemes presented to augment potable water between the three main systems. The economics of distributing potable water from a large central WTP versus aligning the various sub systems, by upgrading either the raw water supply or WTP capacities, is planned to be determined. It is likely that a hybrid solution will be necessary in order to address the short term issues whilst solving the problem in the long term.
Short term bulk pipeline infrastructure plan for Middle Sub Region
The commissioning of the SCP-1 has caused a stepped-increase in the demand to be supplied from Wiggins WTP via the SCA Pipeline. Water from the SCA Pipeline is expected to be available at the Amanzimoti WTP, in ever reducing amounts, until 2020. Therefore, the Amanzimtoti WTP will need to remain operational in the short to medium-term. The addition of the Ellingham Link to supplement the Umzinto WTP assisted considerably during the drought experienced over 2014-2016, but further increased the demand via the SCA and Mgeni System.
The South Coast Pipeline is being extended southwards in two phases. The South Coast Pipeline Phase 2a project (SCP-2A) has been implemented and runs between Park Rynie and Kelso. This project provides some relief for the Umzinto and Mtwalume WTP’s. Some of their demands will be picked up by the SCP-1 from Amanzimtoti.
Medium term bulk pipeline infrastructure plan for Middle to Lower Sub Region
The South Coast Pipeline Phase 2b (SCP-2B) project consist of four components:- Construction of a pipeline from Scottsburgh South Reservoir to Park Rynie road N2 diamond interchange, a pipeline from Kelso to Malangeni off-take, tie-in bulk pipeline into the Umdoni Reservoir and the design and construction of the Mzinto River bridge crossing (Section 8.5.2). The South Coast Pipeline Phase 3 (SCP-3) project will tie into the end of SCP-2A and will complete the section between Umdoni and Hibberdene. This project will ultimately link to the Ugu District Municipality supply system from the Bhobhoyi WTP (near Port Shepstone) to add a measure of flexibility and a contingency for drought situations in either system. The timing of SCP-3 is dependent on the development of the regional BWSS on the Lower uMkhomazi River (Section 8.5.4).
Quarry Reservoir will need to be upgraded by an additional 30 Mℓ by 2023 to be constructed in two compartments of 15 Mℓ each, phased over 5 year periods.
The WTP upgrade plans (Medium term plans), as they are currently being operated beyond
their design capacity:
o When the SCP has been commissioned in its entirety, decommission the
Mtwalume WTP. Alternatively, continue to supply inland rural communities at the existing yield of the current water resource.
o When the SCP has been commissioned in its entirety, the Umzinto WTP will continue to supply potable water to communities in the adjacent inland areas of Ugu District Municipality. Supply will then be curtailed to the existing yield of the water resource.
o Evaluate the economics of operating Amanzimtoti WTP.

334
6.5 North Coast System
6.5.1 Description
The North Coast System comprises of the Mdloti System and the Lower Thukela System (Figure 6.76). These systems have been grouped together because of the water resource interdependencies and infrastructure integration that is required to supply bulk potable water along the coastal strip of the North Coast region. The North Coast System is located north of Durban stretching along the coast from the Mdloti River in the south to the uThukela River in the north (Figure 6.77). It encompasses the Nonoti River catchment (U5), the lower Mvoti River catchment (U4), part of the Mdloti River catchment (U3) and the lower uThukela catchment (V5). The bulk supply infrastructure along the coastal strip is known as the North Coast Supply System (NCSS), and currently comprises two bulk supply systems, viz:
The Mdloti Supply System serving Phoenix, Verulam and La Mercy in northern eThekwini, a portion of rural Ndwedwe Local Municipality, the coastal towns along the Dolphin Coast and the low cost housing areas of Etete and Groutville; and
The Lower Thukela Supply System (currently being commissioned) serving the towns of Darnall, Zinkwazi, Blythedale and KwaDukuza as well as other residential and rural developments between the uThukela River and Kwadukuza.
In addition to this bulk system, Umgeni Water implemented the Maphumulo Bulk Water Supply Scheme (Figure 6.83) in May 2013 to alleviate the supply problems of borehole schemes in the Maphumulo Local Municipality. The NCSS is presented in Figure 6.77. A schematic of the bulk water distribution is presented in Figure 6.78. Other schemes that supply potable water to people in the region are Umgeni Water’s Durban Heights WTP, eThekwini Municipality’s Tongaat and Ogunjini WTP’s and iLembe District Municipality’s Mvoti WTP, Zinkwazi, Blythedale and Darnall schemes. It is likely that all of the iLembe Schemes mentioned here will be decommissioned once the Lower Thukela BWSS is fully commissioned.

335
Figure 6.76 General layout of the North Coast Supply System.
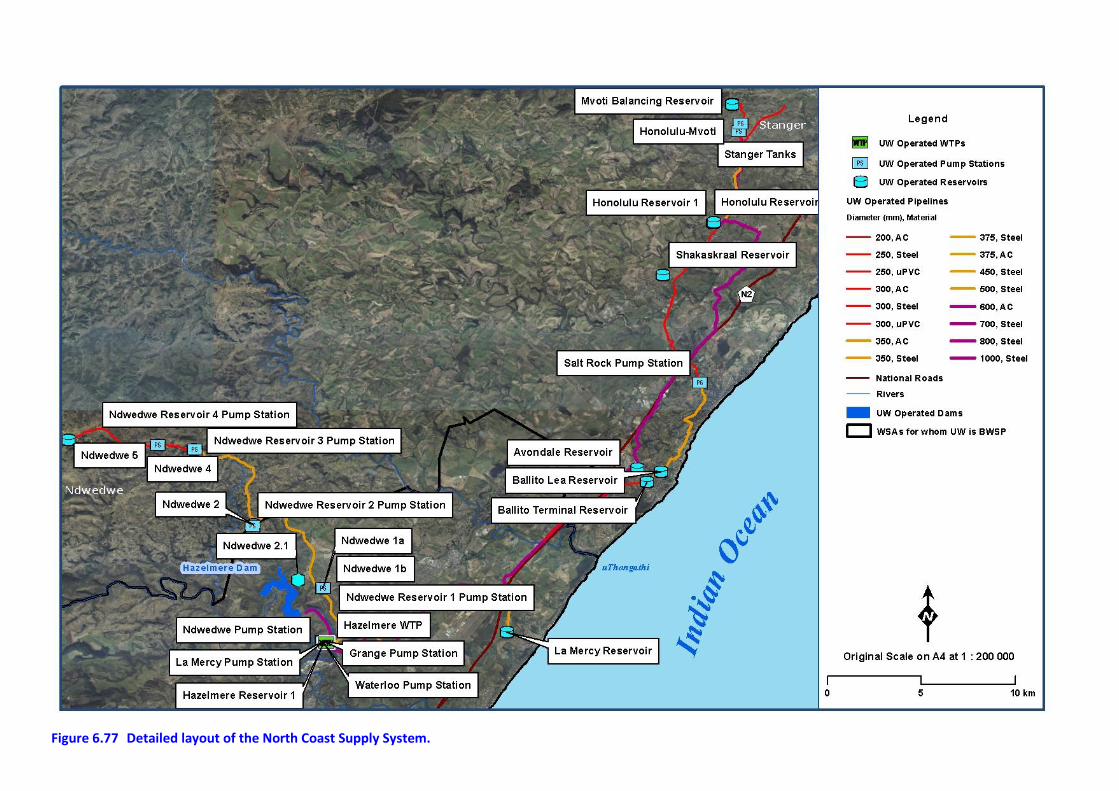
336
Figure 6.77 Detailed layout of the North Coast Supply System.

337
Figure 6.78 Schematic of the North Coast Supply System.
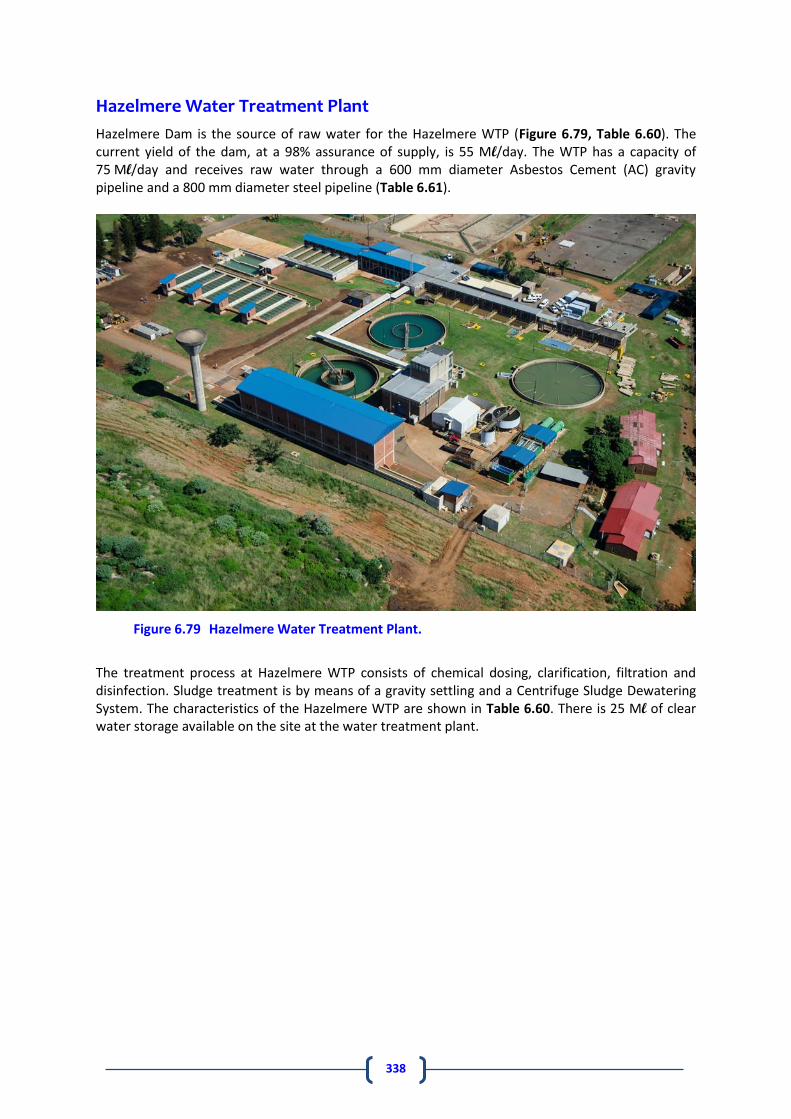
338
Hazelmere Water Treatment Plant
Hazelmere Dam is the source of raw water for the Hazelmere WTP (Figure 6.79, Table 6.60). The current yield of the dam, at a 98% assurance of supply, is 55 Ml/day. The WTP has a capacity of 75 Ml/day and receives raw water through a 600 mm diameter Asbestos Cement (AC) gravity pipeline and a 800 mm diameter steel pipeline (Table 6.61).
Figure 6.79 Hazelmere Water Treatment Plant.
The treatment process at Hazelmere WTP consists of chemical dosing, clarification, filtration and disinfection. Sludge treatment is by means of a gravity settling and a Centrifuge Sludge Dewatering System. The characteristics of the Hazelmere WTP are shown in Table 6.60. There is 25 Ml of clear water storage available on the site at the water treatment plant.

339
Table 6.60 Characteristics of the Hazelmere WTP.
WTP Name: Hazelmere WTP
System: North Coast Supply System
Maximum Design Capacity: 75 Ml/day
Current Utilisation (Nov 2016): 46.6 Ml/day
Raw Water Storage Capacity: 0 Ml
Raw Water Supply Capacity: 90.0 Ml/day
Pre-Oxidation Type: Prechlorination
Primary Water Pre-Treatment Chemical: Polymeric Coagulant
Total Coagulant Dosing Capacity: 1800 kg/day
Rapid Mixing Method: Hydraulic Jump
Clarifier Type: Clari-Flocculator Pulsator Clarifier
Number of Clarifiers: 7 4
Total Area of all Clarifiers: 1469 m2
800 m2
Total Capacity of Clarifiers: 45 Ml/day 60 Ml/day
Filter Type: Constant Rate Rapid Gravity Filters
Number of Filters: 17 6
Filter Floor Type Laterals without Nozzles Precast with nozzles
Total Filtration Area of all Filters 540 m2 294 m
2
Total Filtration Design Capacity of all Filters: 75 Ml/day
Total Capacity of Backwash Water Tanks: 300 m3 200 m
3
Total Capacity of Sludge Treatment Plant:
Capacity of Used Washwater System: 0.98 Ml/day
Primary Post Disinfection Type: Chlorine
Disinfection Dosing Capacity: 450 kg/day
Disinfectant Storage Capacity: 5 tonne
Total Treated Water Storage Capacity: 25 Ml

340
Table 6.61 Pipeline details: Hazelmere Raw Water Pipeline.
System Pipeline Name From To Length
(km)
Nominal Diameter
(mm) Material
Capacity* (Ml/day)
Age (years)
North Coast Hazelmere Raw Water Pipeline Hazelmere Dam Hazelmere WTP 2.42 600 AC 48.93 34
North Coast Hazelmere Raw Water Pipeline Hazelmere Dam Hazelmere WTP 2.42 800 Steel 90.0 3
* Based on a velocity of 2 m/s.
Table 6.62 Reservoir details: Hazelmere WTP.
System Reservoir Site Reservoir Name Capacity
(Ml) Function
TWL (aMSL)
FL (aMSL)
North Coast Hazelmere WTP Hazelmere WTP 25 Balancing 47.0 42.0

341
Hazelmere/Phoenix Sub-System
The eThekwini area of Phoenix is supplied via the eThekwini owned and managed, 375 mm diameter Waterloo Pumping Main (Table 6.63). Water treated at Hazelmere WTP is pumped via the Umgeni Water Waterloo Pump Station (Table 6.64) situated at the Hazelmere WTP and sold to eThekwini Municipality at a metered point at the outlet of the pump station.
Hazelmere/Verulam Sub-System
The eThekwini area of Verulam is supplied via the eThekwini owned and managed, 500 mm diameter Grange Pumping Main (Table 6.65, Table 6.66) which is metered at the outlet of the pump station.
Hazelmere/Ndwedwe Sub-System
This sub-system (Figure 6.80) supplies the rural communities of Ndwedwe by staged pumping from Hazelmere WTP through Ndwedwe Reservoirs 1, 2.1, 2, 3, 4 and 5 (Table 6.67, Table 6.68 and Table 6.69). Ndwedwe Reservoir 1 also feeds the southern areas of Tongaat through an emergency gravity line via Belvedere Reservoir. This emergency line is to augment the supply to the town of Tongaat when the Tongaat WTP (owned and operated by eThekwini Municipality) has insufficient water to supply the town’s needs. Ndwedwe Reservoir 1 is fed directly from Hazelmere WTP through a 500 mm diameter steel rising main (Table 6.68) from a dedicated pump station (Table 6.69) at the WTP. There are three pumps in the Hazelmere to Ndwedwe Reservoir 1 and Ndwedwe Reservoir 2 pump station. One or two pumps are utilised, depending on the system demand. Ndwedwe Reservoir 1 and Ndwedwe Reservoir 2 were upgraded through the construction of a second 2 Ml reservoir, at each site, during 2010/2011.

342
Figure 6.80 Layout of the Hazelmere/Ndwedwe sub-system.

343
Table 6.63 Pipeline details: Waterloo Pumping Main.
System Pipeline Name From To Length
(km)
Nominal Diameter
(mm) Material
Capacity* (Ml/day)
Age (years)
North Coast Waterloo Pipeline Hazelmere WTP Waterloo Sales Meter 0.05 500 Steel 14.33 21
* Based on a velocity of 2 m/s.
Table 6.64 Pump details: Waterloo Pump Station.
System
Pump Station Name
Number of Pumps Pump Description
Supply From
Supply To
Static Head (m)
Duty Head (m)
Duty Capacity (Ml/day)
Number of
Duty Pumps Number of
Standby Pumps
North Coast Waterloo Pump Station 1 KSB Omega 200-670 Hazelmere WTP Waterloo Reservoir 112.0 125 15.55
North Coast Waterloo Pump Station 1 Sulzer Bb HSC Hazelmere WTP Waterloo Reservoir 112.0 115* 2.80*
* Assumption
Table 6.65 Pipeline details: Grange Pumping Main.
System Pipeline Name From To Length
(km)
Nominal Diameter
(mm) Material
Capacity* (Ml/day)
Age (years)
North Coast Grange Pipeline Hazelmere WTP Grange Sales Meter 0.05 375 AC 14.30 26
* Based on a velocity of 2 m/s.

344
Table 6.66 Pump details: Grange Pump Station.
System
Pump Station Name
Number of Pumps Pump Description
Supply From
Supply To
Static Head (m)
Duty Head (m)
Duty Capacity (Ml/day)
Number of
Duty Pumps Number of
Standby Pumps
North Coast Grange Pump Station 1 1 Sulzer BPK 35 Hazelmere WTP Grange Reservoir 68.9 96 11.52
Table 6.67 Reservoir details: Hazelmere/Ndwedwe Sub-System.
System Reservoir Site Reservoir Name Capacity
(Ml) Function
TWL (aMSL)
FL (aMSL)
North Coast Ndwedwe Ndwedwe 1 3.94 Distribution 209.8 205.8
North Coast Ndwedwe Ndwedwe 2.1 0.22 Terminal 238.6 234.6
North Coast Ndwedwe Ndwedwe 2 4.00 Distribution 318.4 314.4
North Coast Ndwedwe Ndwedwe 3 2.00 Distribution 417.4 413.4
North Coast Ndwedwe Ndwedwe 4 2.00 Distribution 530.9 526.9
North Coast Ndwedwe Ndwedwe 5 1.94 Terminal 661.8 657.2

345
Table 6.68 Pipeline details: Hazelmere/Ndwedwe Sub-System.
System Pipeline Name From To Length
(km)
Nominal Diameter
(mm) Material
Capacity* (Ml/day)
Age (years)
North Coast Hazelmere to Ndwedwe Reservoir 1 Hazelmere WTP Ndwedwe Reservoir 1 3.76 500 Steel 25.48 22
North Coast Ndwedwe Reservoir 1 to Ndwedwe Reservoir 2 Ndwedwe Reservoir 1 Ndwedwe Reservoir 2 6.93 350 Steel 12.49 21
North Coast Ndwedwe Reservoir 2 to Ndwedwe Reservoir 3 Ndwedwe Reservoir 2 Ndwedwe Reservoir 3 6.46 350 Steel 12.49 21
North Coast Ndwedwe Reservoir 3 to Ndwedwe Reservoir 4 Ndwedwe Reservoir 3 Ndwedwe Reservoir 4 1.78 300 Steel 9.17 21
North Coast Ndwedwe Reservoir 4 to Ndwedwe Reservoir 5 Ndwedwe Reservoir 4 Ndwedwe Reservoir 5 4.69 250 Steel 6.37 21
* Based on a velocity of 1.5 m/s.
Table 6.69 Pump details: Hazelmere/Ndwedwe Sub-System.
System
Pump Station Name
Number of Pumps
Pump Description
Supply From
Supply To
Static Head (m)
Duty Head (m)
Duty Capacity (Ml/day)
Number of Duty Pumps
Number of Standby Pumps
North Coast Ndwedwe Pump Station 2 KSB WKLn 150/5 Hazelmere WTP Ndwedwe Reservoir 1 165.8 196 5.82
North Coast Ndwedwe Pump Station 1 KSB WKLn 160/5 Hazelmere WTP Ndwedwe Reservoir 1 165.8 196 5.82
North Coast Ndwedwe Reservoir 1 Pump Station 1 1 KSB WKLn 125/5 Ndwedwe Reservoir 1 Ndwedwe Reservoir 2 111.6 171 3.80
North Coast Ndwedwe Reservoir 2 Pump Station 1 1 KSB WKLn 125/5 Ndwedwe Reservoir 2 Ndwedwe Reservoir 3 102.0 149 3.34
North Coast Ndwedwe Reservoir 3 Pump Station 1 1 KSB WKLn 125/4 Ndwedwe Reservoir 3 Ndwedwe Reservoir 4 116.5 135 3.72
North Coast Ndwedwe Reservoir 4 Pump Station 1 1 KSB WKLn 125/5 Ndwedwe Res 4 Ndwedwe Res 5 133.9 177 3.34

346
Hazelmere/La Mercy/Avondale Sub-System
The Hazelmere/La Mercy/Ballito sub-system (Figure 6.77) consists of parallel pipelines, a 450 mm and 700 mm diameter steel main respectively (Table 6.70), from Hazelmere WTP to a bifurcation point near the Tongaat Toll Plaza on the N2. One leg of the bifurcation supplies the coastal areas of La Mercy and Westbrook Beach via the 450 mm diameter steel pipeline (Table 6.70) to La Mercy Reservoir (Table 6.71). The other leg supplies the Avondale Reservoir (Table 6.71) in Ballito via a 700 mm diameter steel main (Table 6.70). A recently completed pump station (commissioned in February 2015), at the Hazelmere WTP means that the above pipelines can now be considered as completely independent systems. The original Hazelmere to Bifurcation Pump Station (Table 6.72) is now utilised to pump water from Hazelmere to La Mercy through the 450 mm pipeline while the new Avondale Pump Station (Table 6.73) is used to pump water directly to Avondale Reservoir. The 700 mm diameter bifurcation to Avondale (Table 6.70) pipeline has two off-takes that can supply the Mamba Ridge Reservoir (currently closed) and reticulation to the Greylands/Frasers area.
Avondale/Honolulu Sub-System
Avondale Reservoir (Table 6.71) supplies the areas of Zimbali and Simbithi to the south of Ballito through a series of gravity pipelines and reservoirs (Figure 6.77). There is a 300 mm backfeed gravity pipeline which also supplies the areas along the Hazelmere/La Mercy/Avondale subsystem’s 700 mm rising main (Table 6.70). In addition, Avondale Reservoir supplies water north, through the North Coast Pipeline I (NCP-1) (Table 6.75) to Shakas Rock, Chakas Head, Salt Rock, Sheffield Beach, and Tinley Manor. Up until December 2009, the option existed to boost pressure at the Salt Rock Pump Station (Table 6.76) to supply Tiffany, Umhlali Village, Shakas Kraal and the Honolulu Reservoir (Table 6.74) through the NCP-1. In 2009 Umgeni Water commissioned the North Coast Pipeline II (NCP-2) (Table 6.75) to supply additional water from Avondale to Honolulu Reservoir. This is a bi-directional gravity pipeline with diameters ranging from 1 000 mm to 800 mm. Subsequent to the commissioning of the NCP-2, the Salt Rock Pump Station was decommissioned.
Honolulu/KwaDukuza Sub-System
The Honolulu Reservoir, which is fed from Avondale Reservoir, supplies the areas of Etete and Groutville and can provide a supplementary feed to the Mvoti Balancing Reservoirs (Table 6.77) via a 200 mm diameter rising main (Table 6.78). The pressure in this supplementary feed is boosted at the Stanger Tanks Pump Station (Table 6.79). An 800 mm diameter bi-directional pipeline and a new pump station were commissioned in November 2013 to augment the supply of water from Honolulu Reservoir to the Mvoti Balancing Reservoirs. Until December 2016, Mvoti Balancing received water from the Mvoti River, via the Mvoti WTP. With the commissioning of Lower Thukela Bulk Water Supply Scheme (BWSS) in January 2017, Mvoti Balancing is now supplied from this scheme.

347
Table 6.70 Pipeline details: Hazelmere/La Mercy/Avondale Sub-System.
System Pipeline Name From To Length
(km)
Nominal Diameter
(mm) Material
Capacity (Ml/day)
Age (years)
North Coast Hazelmere to Bifurcation Pipeline Hazelmere WTP La Mercy Bifurcation 10.86 450 Steel 20.64* 36
North Coast La Mercy Pipeline La Mercy Bifurcation La Mercy Reservoir 2.62 450 Steel 20.64* 18
North Coast Hazelmere to Bifurcation Pipeline Hazelmere WTP La Mercy Bifurcation 10.86 700 Steel 49.88* 4
North Coast Bifurcation to Avondale Reservoir La Mercy Bifurcation Avondale Reservoir 9.87 700 Steel 49.94* 18
North Coast Avondale to Ballito Reservoir Avondale Reservoir Ballito Reservoir 0.83 375 Steel 19.11** 29
North Coast 300 Backfeed Ballito Reservoir La Mercy Bifurcation 9.79 300 Steel 12.23** 36
* Based on a velocity of 1.5 m/s ** Based on a velocity of 2 m/s
Table 6.71 Reservoir details: Hazelmere/La Mercy/Avondale Sub-System.
System Reservoir Site Reservoir Name Capacity
(Ml) Function
TWL (aMSL)
FL (aMSL)
North Coast Ballito Avondale Reservoir 15.0 Distribution 137.4 130.6
North Coast Ballito Ballito Terminal Reservoir 3.0 Distribution 117.0 112.0
North Coast La Mercy La Mercy Reservoir 5.0 Distribution 156.0 152.0

348
Table 6.72 Pump details: Hazelmere to La Mercy
System
Pump Station Name
Number of Pumps Pump Description
Supply From
Supply To
Static Head (m)
Duty Head (m)
Duty Capacity (Ml/day)
Number of Duty Pumps
Number of Standby Pumps
North Coast La Mercy Pump Station 1 1 Sulzer RPK 42 Hazelmere WTP La Mercy Reservoir 96 152 19.01
North Coast La Mercy Pump Station 1 Samco Hazelmere WTP La Mercy Reservoir 96 135 24.00
Table 6.73 Pump details: Hazelmere to Avondale Sub-System.
System
Pump Station Name
Number of Pumps Pump Description
Supply From
Supply To
Static Head (m)
Duty Head (m)
Duty Capacity (Ml/day)
Number of Duty Pumps
Number of Standby Pumps
North Coast Avondale Pump Station 2 1 KSB Omega 250-
800A Hazelmere WTP Avondale Reservoir 90 186 32
Table 6.74 Reservoir details: Avondale/Honolulu Sub-System.
System Reservoir Site Reservoir Name Capacity
(Ml) Function
TWL (aMSL)
FL (aMSL)
North Coast Shakas Kraal Honolulu Reservoir 8.0 Distribution 105.0 99.8

349
Table 6.75 Pipeline details: Avondale/Honolulu Sub-System.
System Pipeline Name From To Length
(km)
Nominal Diameter
(mm) Material
Capacity (Ml/day)
Age (years)
North Coast North Coast Pipeline 1 Avondale Reservoir Salt Rock Pump Station 7.01 350 Steel 16.65** 29
North Coast North Coast Pipeline 1 Salt Rock Pump Station Umhlali Off-take 3.10 300 uPVC 9.17* 29
North Coast North Coast Pipeline 1 Umhlali Off-take Honolulu Reservoir 6.90 250 uPVC 6.37* 29
North Coast North Coast Pipeline 2 Avondale Reservoir Honolulu Reservoir 17.65 800/1000 Steel 86.98** 7
* Based on a velocity of 1.5 m/s ** Based on a velocity of 2 m/s
Table 6.76 Pump details: Avondale/Honolulu Sub-System.
System
Pump Station Name
Number of Pumps Pump Description
Supply From
Supply To
Static Head (m)
Duty Head (m)
Duty Capacity (Ml/day)
Number of
Duty Pumps Number of
Standby Pumps
North Coast Salt Rock Pump Station 1 1 APE Ritz Salt Rock Pump Station Honolulu Reservoir 44 58 3.90
Table 6.77 Reservoir details: Honolulu/KwaDukuza Sub-System.
System Reservoir Site Reservoir Name Capacity
(Ml) Function
TWL (aMSL)
FL (aMSL)
North Coast KwaDukuza Mvoti Balancing Reservoirs (owned by iLembe and operated by Umgeni Water) 4.3 Balancing 146.5 142.5*
*Assumption

350
Table 6.78 Pipeline details: Honolulu/KwaDukuza Sub-System.
System Pipeline Name From To Length
(km)
Nominal Diameter
(mm) Material
Capacity (Ml/day)
Age (years)
North Coast Honolulu to Groutville Pipeline Honolulu Reservoir Groutville Bifurcation 4.67 350/300 AC 12.23* 22
North Coast Groutville Pipeline Groutville Bifurcation Groutville 2.95 300 AC 12.23* 22
North Coast Stanger Tanks Pipeline Groutville Pipeline Stanger Tanks 0.72 200 AC 5.44* 22
North Coast Stanger Tanks to Mvoti Balancing Reservoir Stanger Tanks Mvoti Balancing Reservoir 1.94 200 AC 4.08** 22
North Coast Honolulu to Mvoti Balancing Reservoir Honolulu Reservoir
Mvoti Balancing Reservoir/ Darnall
7.33 800 Steel 65** 2
* Based on a velocity of 2 m/s
** Based on a velocity of 1.5 m/s
Table 6.79 Pump details: Honolulu/KwaDukuza Sub-System.
System
Pump Station Name
Number of Pumps
Pump Description
Supply From
Supply To
Static Head (m)
Duty Head (m)
Duty Capacity (Ml/day)
Number of Duty
Pumps
Number of Standby Pumps
North Coast Stanger Tanks 1 1 KSB WKLn 100/5 Stanger Tanks Mvoti Balancing Reservoir 93 115* 2.69*
North Coast Honolulu-Mvoti 1 1 KSB Omega 200-420A Honolulu Reservoir Mvoti Balancing and Darnall 11 45 15
* Assumption

351
Lower Thukela Water Treatment Plant and Supply System
The Lower Thukela Bulk Water Supply System (LTBWSS) abstracts water directly from the uThukela River in the vicinity of Mandini for treatment at a WTP situated in close proximity to the abstraction works (Figure 6.81). Bulk potable water is then supplied from the WTP southwards through a rising main into a 30 Ml balancing reservoir (Figure 6.82). From this balancing reservoir, a 900 mm diameter pipeline conveys potable water into the Mvoti Balancing Reservoir (Table 6.81, Table 6.82 and Table 6.83) Commissioning of the LTBWSS started in December 2016. The scheme currently has a capacity of 55 Ml/day with the option to upgrade to 110 Ml/day. It supplies the town of KwaDukuza (Stanger). En-route are take-offs to Nwazi, Zinkwazi, Sakamkhanye, Nonoti, Zinkwazi, and Blythedale.
Figure 6.81 Lower Thukela Water Treatment Plant (November 2016)

352 Figure 6.82 Layout of the Lower Thukela Bulk Water Supply Scheme.

353
The characteristics of the Lower Thukela WTP are shown in Table 6.80.
Table 6.80 Characteristics of the Lower Thukela WTP.
WTP Name: Lower Thukela WTP
System: North Coast Supply System
Maximum Design Capacity: 55 Ml/day
Current Utilisation: Not yet commissioned, expect an initial utilisation of 20 Ml/day
Raw Water Storage Capacity: 0 Ml
Raw Water Supply Capacity: 120 Ml/day
Pre-Oxidation Type: Prechlorination / Potassium Permanganate
Primary Water Pre-Treatment Chemical: Poly aluminium chloride blend
Total Coagulant Dosing Capacity: 0-250 l/hour
Rapid Mixing Method: Rapid mixing over weirs
Clarifier Type: Clarriflocculators
Number of Clarifiers: 3 (2 duty, 1 stand-by)
Total Area of all Clarifiers: 2,802 m2
Total Capacity of Clarifiers: 30 Ml per clarriflocculator. 2 duty, one standby provides
60 Ml/day capacity
Filter Type: Pulsator
Number of Filters: 3 (2 duty, 1 stand-by)
Filter Floor Type 1068 m2
Total Filtration Area of all Filters 30 Ml per pulsator. 2 duty, one standby provides 60 Ml/day
capacity
Total Filtration Design Capacity of all Filters: Constant Rate, constant level, Rapid Gravity Filters
Total Capacity of Backwash Water Tanks: 8 (6 duty, 2 standby)
Total Capacity of Sludge Treatment Plant: Monolithic false floor with nozzles
Capacity of Used Washwater System: 416 m2
Primary Post Disinfection Type: 55 Ml/day
Disinfection Dosing Capacity: 980 m3
Disinfectant Storage Capacity: Solid Bowl Centrifuges
Total Treated Water Storage Capacity: 2 (1 duty, 1 standby)

354
Table 6.81 Pipeline details: Lower Thukela Supply System.
System Pipeline Name From To Length
(km)
Nominal Diameter
(mm) Material
Capacity (Ml/day)
Age (years)
North Coast Raw Water Abstraction Weir Lower Thukela WTP 0.59 900 Steel 110* 0
North Coast Lower Thukela Rising Main Lower Thukela WTP Lower Thukela South
Reservoir 2.57 900 Steel 110* 0
North Coast Lower Thukela Southern Main Lower Thukela South
Reservoir Mvoti Balancing
Reservoir 28.9 900 Steel 110* 0
* Based on a velocity of 2.0 m/s
Table 6.82 Reservoir details: Lower Thukela Supply System.
System Reservoir Site Reservoir Name Capacity (Ml/day)
Function TWL
(aMSL) FL
(aMSL)
North Coast Tugela Lower Thukela South Reservoir 30.0 Balancing 249 232
Table 6.83 Pump details: Lower Thukela Supply System
System
Pump Station Name
Number of Pumps Pump Description
Supply From
Supply To
Static Head (m)
Duty Head (m)
Duty Capacity (Ml/day)
Number of Duty Pumps
Number of Standby Pumps
North Coast Lower Thukela Raw
Water 1 1
Sulzer SM 302-450
Thukela Weir Lower Thukela WTP 27.7 45.9 34.5
North Coast Lower Thukela – High
Lift 2 1
Sulzer SM 303-800
Lower Thukela WTP Lower Thukela South Reservoir 204.9 227.9 57.5

355
Maphumulo Water Treatment Plant and Supply System
The demand for water on the KwaZulu-Natal North Coast, and in particular the inland rural areas of the iLembe District Municipality, are forecast to increase significantly in the future. The requirement for potable water supply to rural backlog areas has resulted in Umgeni Water implementing the Maphumulo Bulk Water Supply Scheme with its source on the iMvutshane River. Phase 1 of this scheme (Figure 6.83 and Figure 6.84), was commissioned in May 2013 and the construction of Phase 2 - iMvutshane Dam was completed in 2015. Figure 6.84 shows a schematic of the Maphumulo Bulk Water Supply Scheme, which includes the iMvutshane Dam, an abstraction works, a treatment plant and bulk rising and gravity mains to supply potable water from the water treatment works into the iLembe District Municipality’s greater Maphumulo area. The below average rainfall in 2014 and 2015 reduced the flow in the iMvutshane River and as a result the required abstraction rate of 6 Ml/day could not be maintained. In November 2014, an emergency abstraction, with a capacity of 6 Ml/day, was commissioned to pump water from the Hlimbitwa River to the Maphumulo Raw Water Abstraction Point. The following infrastructure was constructed as part of this initiative:
Sand bags on the Hlimbithwa River to create a pool for abstraction;
Two sets of pumps with a capacity to deliver up to Ml/day;
250 mm diameter pipeline (1km length) to the current abstraction point on the iMvutshane River; and
Electrical supply to the pumps.
Raw water is treated at the Maphumulo WTP and pumped to a booster reservoir. From the booster
reservoir potable water is pumped to the Maphumulo and the Nyamazane Reservoirs (Table 6.73,
Table 6.84 and Table 6.86). The Maphumulo Reservoir serves as a distribution reservoir for the town
of Maphumulo and also supplies the Masibambisane Reservoir, which in turn supplies
Maphumulo Hospital Reservoir. The Nyamazane Reservoir serves as a distribution reservoir for the
towns of Nyamazane and Maqumbi (from Reservoir F). The Maqumbi Reservoir F in turn supplies
both the Maqumbi Reservoir T and Ashville Reservoirs (Figure 6.83).

356
Figure 6.83 General layout of the Maphumulo BWSS.

357
Figure 6.84 Schematic of the Maphumulo Supply System.

358
Table 6.84 Pump details: Maphumulo BWSS.
System
Pump Station Name
Number of Pumps
Pump Description
Supply From
Supply To
Static Head (m)
Duty Head (m)
Duty Capacity (Ml/day)
Number of Duty
Pumps
Number of Standby Pumps
Maphumulo Emergency Abstraction 1 1 KSB – ETA 125/100 Hlimbitwa River Imvutshane Abstraction 12 22 3.5
Maphumulo Temporary abstraction 2
KSB – KRTE80-250 iMvutshane River Raw Water Pump Station 9 18 6
Maphumulo Raw water Pump Station 2 1 KSB – WKLN 125/6 Raw Water Pump Station Maphumulo WTP 160 178 6.9
Maphumulo WTW Pump Station 2 1 KSB – WKLN 125/6 Maphumulo WTW Booster Reservoir 166 190 7
Maphumulo Booster Pump Station 1
Booster Pump Station 2
2 1 KSB – WKLN 100/7 Booster Reservoir (PS 1) Maphumulo Reservoir 83 136 6.6
2 1 KSB – WKLN 100/3 Booster Reservoir (PS 2) Ngcebo Reservoir 47 66 3.6
Maphumulo Maphumulo Pump Station
2 1 KSB – WKLN 100/8
Maphumulo Reservoir Masibambisane Reservoir 124 154 6
Maphumulo Nyamazane (Ngcebo) Pump Station
2 1 KSB – WKLN 80/6
Nyamazane Reservoir Maqumbi Reservoir F 53 83 2.9
Maphumulo Maqumbi Pump Station 2 1 KSB – WKLN 65/9 Maqumbi Reservoir F Maqumbi Reservoir T 85 104 1.3
Table 6.85 Reservoir details: Maphumulo BWSS.
System Reservoir Site Reservoir Name Capacity
(Ml) Function
TWL (aMSL)
FL (aMSL)
Maphumulo Maphumulo Maphumulo WTW Res 0.5 Distribution 424.1 420.5
Maphumulo Maphumulo Booster Reservoir 0.3 Distribution 585.5 582.5

359
Table 6.86 Pipeline details: Maphumulo BWSS.
System Pipeline Name From To Length
(km)
Nominal Diameter
(mm) Material
Capacity (Ml/day)
Age (years)
Maphumulo Emergency Pipeline Hlimbitwa River Imvutshane River 0.8 250 uPVC 6.4** 2
Maphumulo Temporary abstraction Imvutshane River Raw Water Pump Station 0.4 355 uPVC 12.8** 3
Maphumulo Raw Water Pipeline Raw Water Pump Station Maphumulo WTP 1.85 400 Steel 16.3** 3
Maphumulo Maphumulo Pipeline Maphumulo WTP Booster Reservoir 5.08 400/300 Steel 16.3** 3
Maphumulo Ngcebo Pipeline Booster Reservoir Ngcebo Reservoir T 3.535 350 Steel 12.5** 3
Maphumulo Maqumbi Pipeline Ngcebo Reservoir Maqumbi Reservoir F 10.15 300 Steel 9.16** 3
Maphumulo Maqumbi Pipeline Maqumbi Reservoir F Maqumbi Reservoir T 1.38 200 Steel 4.07** 3
Maphumulo Ashville Pipeline Maqumbi Reservoir T Ashville Reservoir 9 160 Steel 3.5* 3
Maphumulo Maphumulo Pipeline Booster Reservoir Maphumulo Reservoir 3.815 300 Steel 9.16** 3
Maphumulo Masibambisane Pipeline Maphumulo Reservoir Masibambisane Reservoir 2.25 300 steel 9.16** 3
* Based on a velocity of 2 m/s
** Based on a velocity of 1.5 m/s

360
The characteristics of the Maphumulo WTP are shown in Table 6.87.
Table 6.87 Characteristics of the Maphumulo WTP.
WTP Name: Maphumulo WTP
System: North Coast Supply System
Maximum Design Capacity: 6 Ml/day for Phase 1 and 12 Ml/day for Phase 2
Current Utilisation: 5.5 Ml/day
Raw Water Storage Capacity: 0 Ml
Raw Water Supply Capacity: 9 Ml/day for Phase 1 (incl. emergency abstraction) and 12 Ml/day for Phase 2
Pre-Oxidation Type: Prechlorination
Primary Water Pre-Treatment Chemical: Polymeric Coagulant
Total Coagulant Dosing Capacity: 15 l/hour
Rapid Mixing Method: Conventional Paddle Flash Mixer
Clarifier Type: Dortmund manual clarifiers
Number of Clarifiers: 4 for phase 1 increasing to 6 for Phase 2
Total Area of all Clarifiers: 345.6 m2
Total Capacity of Clarifiers: 12.5 Ml/day
Filter Type: Constant Rate Rapid Gravity Filters
Number of Filters: 5 for Phase 1 increasing to 8 for Phase 2
Filter Floor Type Laterals without Nozzles
Total Filtration Area of all Filters 80 m2
Total Filtration Design Capacity of all Filters: 12.5 Ml/day
Total Capacity of Backwash Water Tanks: 100 m3
Total Capacity of Sludge Treatment Plant: None
Capacity of Used Washwater System: 0 Ml/day
Primary Post Disinfection Type: Chlorine Gas
Disinfection Dosing Capacity: 10 kgCl2/hr
Disinfectant Storage Capacity:
Total Treated Water Storage Capacity: 0.5 Ml

361
6.5.2 Status Quo and Limitations
Hazelmere WTP Supply System
Figure 6.78 illustrates the North Coast System in its current configuration and the current demands being placed on the network. This schematic should be referred to when reading this Section. The primary source of potable water supplied to the North Coast Supply System (NCSS) is from the 75 Ml/day Hazelmere WTP and the Lower Thukela Bulk Water Supply System. During the period between October to December 2016, the average demand placed on the Hazelmere WTP was 46 Ml/day. The Lower Thukela WTP was being commissioned at the time of writing this report and hence there is no historical record of demand. The Hazelmere Dam was severely affected by the prevailing drought conditions in the country. To augment the resource, and as a temporary measure, water from the uTongathi River was transferred into in the Hazelmere Dam (Figure 6.85). In October 2016, the dam recovered to 60% and the emergency transfer scheme was decommissioned.
Figure 6.85 Layout of uThogathi Emergency Transfer.
The historical and projected demand placed on Hazelmere WTP is presented in Figure 6.86. The decline in demand over the last two years was as a result of drought restrictions that were imposed on the water works. These restrictions were relaxed in October 2016 and demands almost immediately rose to pre drought demands. The supply to Grange, which was previously supplied from Durban Heights WTP, was load shifted onto Hazelmere WTP. This also contributed to the increase in demand in the last quarter of 2017.

362
Figure 6.86 Water demand from Hazelmere WTP.
An analysis of daily historical production for the Hazelmere WTP over the past year (November 2015 to October 2016) is presented in Figure 6.87, and shows that for 98% of the time the WTP was being operated within its optimal operating capacity which is 80% of the plants design capacity. The 2% when the plant did operate above its operating capacity is attributed to four isolated instances within the reporting period.
Figure 6.87 Analysis of historical production at Hazelmere WTP (November 2015 to October 2016).

363
Mvoti WTP Supply System
Note: The following is a historical report on Mvoti WTP. The plant will no longer be operated by Umgeni Water once the Lower Thukela BWSS is fully commissioned (May 2017). Following the commissioning of the Lower Thukela BWSS, the Mvoti WTP will be handed to iLembe DM for their use or decommissioning. The historical demand placed on Mvoti WTP is shown in Figure 6.88.
An analysis of daily historical production for the Mvoti WTP over the past year (November 2015 to October 2016) is presented in Figure 6.89, and shows that for 92% of the time the WTP was being operated above the optimal operating capacity and for 83% of the time the WTP was operated at above design capacity. In October 2015, the run-of-river flow reduced dramatically due to the 2014 – 2016 drought and, as a result, the supply dropped to about 9 Ml/day.
Figure 6.88 Water demand from Mvoti WTP.
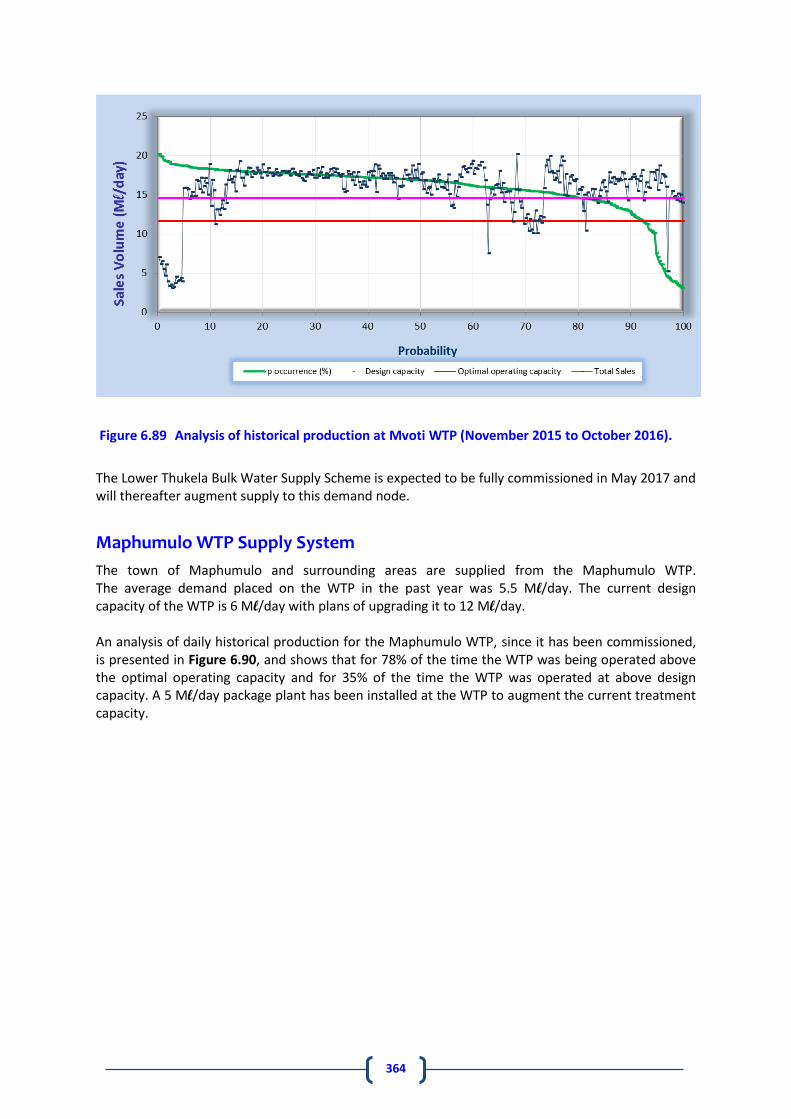
364
The Lower Thukela Bulk Water Supply Scheme is expected to be fully commissioned in May 2017 and will thereafter augment supply to this demand node.
Maphumulo WTP Supply System
The town of Maphumulo and surrounding areas are supplied from the Maphumulo WTP. The average demand placed on the WTP in the past year was 5.5 Ml/day. The current design capacity of the WTP is 6 Ml/day with plans of upgrading it to 12 Ml/day. An analysis of daily historical production for the Maphumulo WTP, since it has been commissioned, is presented in Figure 6.90, and shows that for 78% of the time the WTP was being operated above the optimal operating capacity and for 35% of the time the WTP was operated at above design capacity. A 5 Ml/day package plant has been installed at the WTP to augment the current treatment capacity.
Figure 6.89 Analysis of historical production at Mvoti WTP (November 2015 to October 2016).

365
North Coast Supply System (NCSS)
The total current demand, together with a breakdown of sales throughout the NCSS, is presented in Figure 6.91. Identified future development nodes include:
The Phase 1 of the Cornubia Housing Development, planned by eThekwini Municipality near Verulam, has already commenced. This project has a projected growth over the next 30 years to 60 000 residential housing units and industrial and commercial sites.
The King Shaka International Airport became operational on the 1st May 2010. Demand from the airport, associated Dube Trade-Port, and other developments surrounding the area is expected to grow to greater than 20 Ml/day over the next five to ten years.
More than 70 development projects are proposed within the area covered by the NCSS. These include up market housing developments such as Blythedale and Royal Palm Estates, low cost housing developments such as the Etete Low Cost Housing Projects, the Driefontein Medium Income Housing Project and the Nonoti Land Restitution Project and commercial and industrial developments.
The current economic climate has resulted in a “slowdown” in the housing development sector. However, many of the developments are still likely to be implemented although the timing of them is expected to be delayed or extended. The current (December 2016), five, ten, twenty and thirty year forecasts are shown in Figure 6.91, Figure 6.92, Figure 6.93, Figure 6.94, and Figure 6.95.
Figure 6.90 Analysis of historical production at Maphumulo WTP (November 2015 to October 2016).

366
Figure 6.91 Demand on the North Coast Supply System as at May 2017

367
Figure 6.92 Five year demand forecast for the North Coast Supply System.

368
Figure 6.93 Ten year demand forecast for the North Coast Supply System.
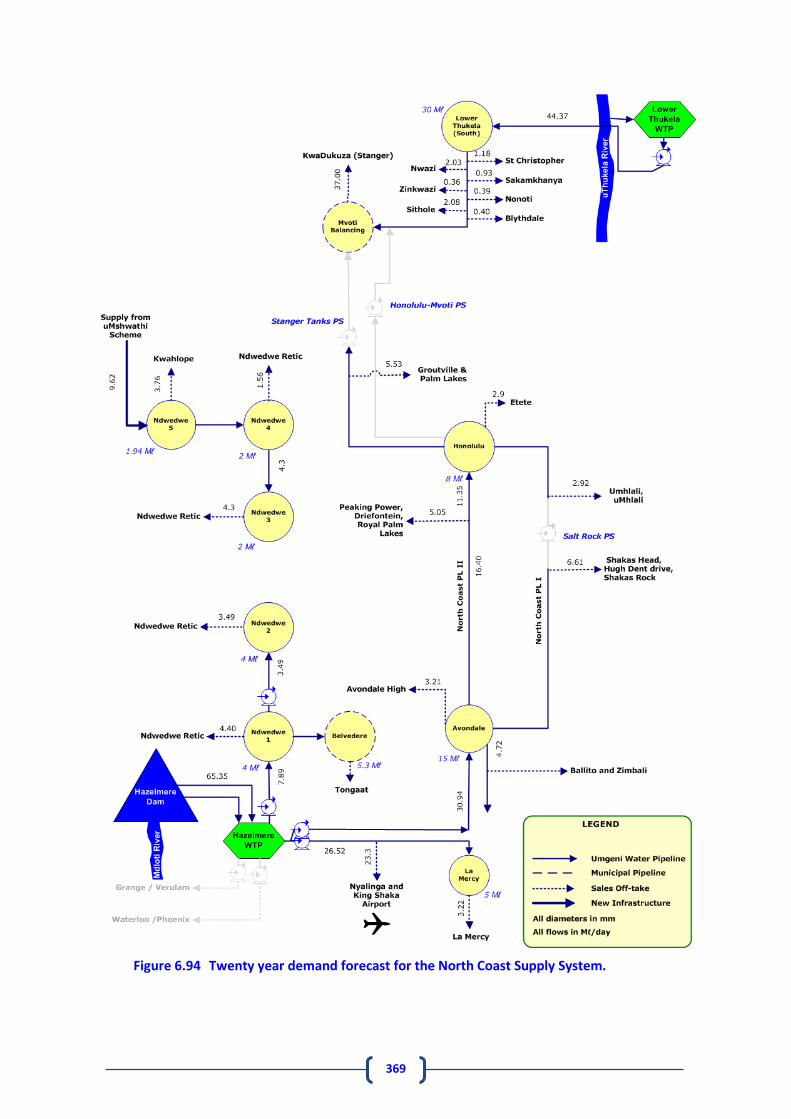
369
Figure 6.94 Twenty year demand forecast for the North Coast Supply System.

370
Figure 6.95 Thirty year demand forecast for the North Coast Supply System.
371
6.5.3 Recommendations
Figure 6.92, Figure 6.93, Figure 6.94, and Figure 6.95 depict the potential for growth in the NCSS over the next five, ten, twenty and thirty years respectively. Also shown in these figures is the configuration of the system that is planned to supply this demand. The following section provides the details of how each subsystem of the NCSS will be affected by the growth in demand over the next thirty years and how the configuration of the system will have to be altered and projects implemented to supply the demand. The scheme that would take the longest to implement, and is most likely to be the most expensive, would be to develop a dam on the Mvoti River, at either Welverdient or Isithundu. This scheme would feed into the NCSS to augment the water supplies of the Hazelmere Supply System. The following are the long-term proposals for the region:
The supply for the next twenty years will be from Hazelmere Dam and the uThukela River via the Hazelmere WTP and Lower Thukela WTP respectively.
Upgrade Lower Thukela WTP by 55 Ml/day to 110 Ml/day capacity. In addition, install pumps and construct pipeline to supply a new reservoir on the outskirts of Mandini.
Raise the full supply level of Hazelmere Dam to increase its firm yield to supply the upgraded Hazelmere WTP (up to 75 Ml/day) and the NCSS (this project is anticipated to be commissioned in 2018).
Develop water resource infrastructure on the Mvoti River, either at Welverdient or Isithundu with a regional WTP and associated supply infrastructure to further augment the NCSS. At some stage in the future, the long-term water demands to the north of the uThukela River may require the full (or majority of) allocation from the Lower Thukela WTP. In this scenario potable water from the new resource on the Mvoti River may need to supply the Mvoti Balancing Reservoir and Avondale Reservoir.
Develop a water resource in the upper Mvoti River (Mvoti-Poort Dam) to augment supply into the inland regions of iLembe DM.
Develop a desalination plant to link into the NCSS as a long-term strategy that would be implemented as and when demands are predicted to exceed supply from the other systems. It should be noted that this intervention could be developed ahead of a regional scheme on the Mvoti River if either demands in the Mgeni System require it or if it proves of better financial value than the Mvoti scheme (Sections 5 and 8)
The infrastructure to be constructed, as detailed above, will incur a high capital cost and as such the philosophy is to only develop the schemes as and when demand dictates. With the long lead time in feasibility and design of projects of this size and nature, the intention is to undertake the feasibility investigations and design of the schemes as early as possible and then to implement the schemes as and when demand dictates. The following sections detail the recommendations for development within each subsystem.
Hazelmere/Verulam Sub-System
The demand at Verulam (Grange) has been shifted from the Durban Heights WTP onto the Hazelemere WTP. Once eThekwini Municipality completes the Northern Aqueduct and the uMkhomazi Water Project is completed, this demand will once again be removed from Hazelmere WTP.

372
Hazelmere/Phoenix Sub-System
The demand in Phoenix (Waterloo) will be transferred onto the Durban Heights WTP once the Northern Aqueduct extension is commissioned by eThekwini Municipality and the uMkhomazi Water Project is completed.
Hazelmere/Ndwedwe Sub-System
The uMshwathi Regional Bulk Water Supply Scheme will be extended to supply water up to Reservoir 5 in Ndwedwe. This will then back-feed into Ndwedwe Reservoirs 4 and 3. The demand from these two reservoirs will thus be removed from the Hazelmere Supply System.
Avondale/Honolulu Sub-System
In Figure 6.91 the North Coast Pipeline supplies water from the Hazelmere System north as far as KwaDukuza. In Figure 6.95 the pipeline is reversed to supply water from the Isithundu Dam to Avondale Reservoir and the southern areas of the NCSS. The North Coast Pipeline I (NCP-1) is now used to supply users along the pipeline from Avondale to Salt Rock in a northerly direction and is also used to supply south from Honolulu Reservoir to off-takes along the pipeline route including Shakas Kraal. The Salt Rock Pump Station has been decommissioned.
Lower Thukela Water Treatment Plant and Supply System
The Lower Thukela Supply System will supply the areas which were previously supplied by Mvoti WTP. It will also supply developments along the route. The 55 Ml/day WTP has sufficient capacity to supply this region for at least the next 20 years. Phase 2 of the scheme will be implemented as and when demand dictates. Should there be a requirement to supply areas north of the uThukela River, then, apart from the duplication of the WTP capacity, a pipeline and reservoir located on the outskirts of Mandini would be required.
Maphumulo Bulk Water Supply Scheme
Phase 2 of the Maphumulo BWSS, the iMvutshane Dam, was commissioned in early 2015. Future infrastructure upgrades to this scheme are recommended as follows:
Phase 3 - Upgrade the WTP by 6 Ml/day to a new treatment capacity of 12 Ml/day. Associated with this upgrade is an upgrade to the capacity of the raw and potable water pump stations to meet the 20 year demands;
Phase 4 – Construct a new weir, abstraction works and pump station on the Hlimbitwe River and a pipeline to convey raw water into the iMvutshane Dam to meet the future 12 Ml/day demand at a 98% assurance of supply.
The Maphumulo BWSS will not be able to meet the expected 20 year demands. The Mvoti-Poort Dam needs to be developed to serve the long term requirements of Maphumulo, Ndwedwe and Ngcebo.
373
7. WASTEWATER
7.1 Overview Figure 7.1 illustrates the location of the wastewater works Umgeni Water operates in relation to the existing water system configurations discussed in Section 6. Umgeni Water owns and operates the Darvill, Ixopo, Albert Falls North and South Wastewater Works (WWW), but manages and operates a number of other WWW on behalf of municipalities (Figure 7.2). Management contracts are in place for the operation and maintenance of the Howick, Cool Air, Mpofana, Appelsbosch, Camperdown and Richmond WWW for the uMgungundlovu District Municipality and the Lynnfield Park WWW for the Msunduzi Local Municipality. All the WWW operations use aeration basins for biological nutrient removal and clarifiers for the separation process.
7.2 Umgeni Water Owned Wastewater Works
7.2.1 Darvill Wastewater Works
The Darvill WWW is the largest and most significant under Umgeni Water’s control and serves the Msunduzi LM. The average daily inflow (November 2011 to November 2016) is approximately 78 Mℓ/day (Figure 7.3) which is more than the plant’s biological treatment capacity of 65 Mℓ/day. The inflow graph also indicates the spike in flow in the summer seasons when there is ingress of storm water into the sewer system. Consequently the Darvill WWW is currently being upgraded.

374
Figure 7.1 Location of Umgeni Water operated WWWs within the water infrastructure systems.

375 Figure 7.2 Location of WWWs operated by Umgeni Water.

376
Figure 7.3 Average Daily Inflow (Mℓ/day) to Darvill WWW.
Umgeni Water is currently in the process of upgrading the Darvill WWW by 35 Mℓ/day (Section 8.9) to cope with the increased inflows and predicted wastewater demands (Figure 7.4). The average dry weather flows (ADWF) within the Darvill WWW catchment are expected to grow to about 90 Mℓ/day by 2021 (Figure 7.4). The upgrade design makes allowance for expansion in the future to a maximum capacity of 120 Mℓ/day, which is forecast to occur in 2029. Some of the proposed demand scenarios are illustrated in Figure 7.4.

377
Figure 7.4 Projected Inflow into Darvill WWW
The upgraded WWW plant comprises the following unit processes:
Storm water overflow and storage facility
Excess storm water chlorination facility and storm water return pump installation
Inlet works with Fat, Oils, Grease and Grit (FOGG) removal facility
Primary sedimentation tanks
Activated sludge process (anaerobic, anoxic, and aeration zones)
Aluminum sulfate addition to assist phosphate removal
Secondary clarifiers for separation and return of activated sludge
Chlorination of final effluent
Pre-thickener for primary sludge
Anaerobic Digesters
Sludge dewatering facility (linear screens) and disposal
Wash Water Plant The inlet works consists of two inlet channels each equipped with hand racked coarse screens, four mechanical screens (installed in pairs), four vortex flow grit separators complete with submersible centrifugal grit pumps, grit classifier and belt conveyor with screenings compactor and flow measurement. The FOG plant is combined with grit removal as an element of the inlet works to form a Fat, Oils, Grease and Grit removal facility (FOGG).
Primary treatment consists of three primary settling tanks (PST), two 30 m in diameter and a 40 m diameter tank. Primary sewage is fed from the PSTs to a balancing tank (10 Mℓ).
Primary settled sewage is transferred and lifted from the balancing tank by the main pump station to an elevated level at the activated sludge tanks inlet from where the sewage receives secondary treatment. The pump station consists of two receiving sumps with two large horizontal split casing centrifugal pumps servicing each sump. A central manifold connects the two pump sets to allow for
50
60
70
80
90
100
110
120
130
20
07
20
09
20
11
20
13
20
15
20
17
20
19
20
21
20
23
20
25
20
27
20
29
20
31
Infl
uen
t V
olu
me
(Mℓ
/day
)
Year
ADWF
Plant Capacity (Existing)
Plant Capacity (Upgraded)
Scenario 1: Consultant (TLS)
Scenario 2 : Projected basedon Historical GrowthScenario 3 : ExpectedDevelopments

378
interchangeable operation. The two pumps per sump operate in a full duty/standby configuration and are designed to operate in a flow range of 70 – 130 Mℓ/day.
The activated sludge plant at Darvill WWW consists of a number of pre anoxic / anoxic / anaerobic zones followed by the aeration basin. A total biological volume of 74 415 m3 is provided in the new system. Aeration in the aerobic zone of the biological reactor is achieved with fine bubble diffused air (FBDA) aeration. Air is supplied to the system by four duty, one standby blowers.
Secondary treatment consists of seven clarifiers with a RAS pump station fitted with centrifugal pumps operating on variable speed drives. The effluent from the clarifiers is disinfected using a high concentration chlorine solution which is discharged into the effluent upstream of the chlorine contact tank.
The chlorine disinfection unit process is followed by a series of maturation rivers / lagoons. In total there are three rivers / lagoons with a combined volume of 20 428 m3 giving a total retention time of 8.2 hours for the design flow of 60 Mℓ/day. The sludge treatment system has two sources of sludge produced and subsequently processed. Primary sludge withdrawn from the underflow of the primary sedimentation tanks is forwarded to a gravity sludge thickening stage before passing through a pre-fermentation process and then onto anaerobic digestion (Figure 7.5). The pre-fermentation process produces a supernatant high in volatile fatty acids (VFA’s) which is returned to the liquid treatment phase and aids in denitrification ahead of the aeration basis.
Figure 7.5 Darvill WWW Anaerobic Digesters Upgrade.
The methane gas generated by the anaerobic digestion process will, in future, be utilised in a co-generation plant to produce electricity. The co-generation gas engines will be cooled by water and this water will be utilised in the digesters for heating purposes. The digested sludge will pass into the post thickeners and then be dewatered and treated with lime to provide a stable product which may be used for agricultural purposes or landfill cover. The second sludge phase is the wasting of activated sludge. At Darvill WWW mixed liquor is wasted directly from the activated sludge reactor upstream of the final clarifiers. The waste mixed liquor will

379
gravitate to new building housing linear screens where it will be thickened to 6%. The sludge to the linear screens will be dosed with a cationic polyacrylamide conditioning polyelectrolyte. Thereafter it will be blended with the digested sludge and disposed of on the sludge lands adjacent to the WWW site. The high pressure water system will operate at a pressure of 8 bar with two duty and one standby pumps. The high pressure water system will draw water directly from the final effluent channel downstream of the chlorine dosing. A summary of the characteristics of the Darvill WWW are shown in Table 7.1 and the location of Darvill WWW in Msunduzi Municipality is shown in Figure 7.6.
Table 7.1 Darvill WWW infrastructure.
WWW Name: Darvill WWW
System: Upper Mgeni System
Maximum Design Capacity: 120 Mℓ/day
Current Utilisation: 75 Mℓ/day
Screens 2 x Front raked bar screen followed by 3 mm stepped screen; 1 x Hand raked by-pass 25 mm screen
Balancing Tank 10 Mℓ/day
Primary Settling Tanks 4 (2 x 20 Mℓ/day; 2 x 40 Mℓ/day)
Settled Sewage Pump Station 150 Mℓ/day
Aeration basin area
Aeration basin capacity 74 415 m3
Aerators Diffused aeration
Clarifier Type:
Number of Clarifiers: 7
Total Area of all Clarifiers 6720 m2
Total Capacity of Clarifiers: 120 Mℓ/day
Upflow Velocity 1 m/h
RAS Pump Station Capacity 120 Mℓ/day
Anaerobic Digesters 4
Chlorine Storage Capacity 18 x 900 kg drums
Chlorine Dosing Capacity 7.5 mg/ℓ
Total Capacity of Chlorine Contact Tanks
Total Capacity of Sludge Treatment Plant
Wash Water Capacity 2 Mℓ/day
Sludge Irrigation Area

380
Figure 7.6 Location of Darvill WWW in relation to the collection system.

381
7.2.2 Ixopo Wastewater Works
Ixopo WWW serves the town of Ixopo in the Harry Gwala District Municipality and is a Class D accredited treatment plant. The average daily inflow to the Ixopo WWW is shown in Figure 7.7.
Figure 7.7 Average daily inflow (Ml/day) for Ixopo WWW.
Flows to the WWW have for a number of years been reduced as a result of blockages in the Ixopo sewer network. These blockages resulted in manholes within the sewer pipe network overflowing into the natural environment during 2013 and 2014, thereby reducing the inflows to the WWW as illustrated in Figure 7.7. In response, the Harry Gwala Municipality put in place measures to clear the sewer blockages and increase the return flows to the works. Umgeni Water assisted with this initiative by constructing a new sewer bulk pipeline. These collaborative efforts resulted in improved sewerage inflow to the WWW as evidenced in Figure 7.7 from October 2014 onwards. The decrease in inflow to the wastewater works in 2016 is due to water restrictions being placed on the water supply to Ixopo town necessitated by the on-going drought. This has resulted in a marked reduction in return flows and no high flows due to the lack of rainfall events. The WWW has recently been upgraded from 2 to 3.5 Mℓ/day since the installation of a new clarifier in July 2016 (Figure 7.8). The process train follows a typical extended aeration process consisting of an inlet works, one reactor with three aerators on timers and two clarifiers, five drying beds and chlorine contact channels. Sludge is dried on beds and disposed of on a local farm that was previously owned by Umgeni Water, but was sold to the Harry Gwala District Municipality. The characteristics of the Ixopo WWW are shown in Table 7.2.

382
Table 7.2 Ixopo WWW infrastructure.
WWW Name: Ixopo WWW
System: uMkhomazi System
Maximum Design Capacity: 2 Mℓ/day
Current Utilisation: 0.7 Mℓ/day
Balancing Ponds 3 Mℓ
Raw Sewage Pump Station
Screens 1 x Hand raked, 2.5 cm gaps
Grit Chambers 2 x Constant velocity grit channel
Aeration basin area
Aeration basin capacity 1150 m3
Aerators 3 x 18.5 kW slow speed aerators
Clarifier Type: 1 x scraped floor (12.5 m ), 1 x suction lift (14.5 m)
Number of Clarifiers: 2
Total Area of all Clarifiers 274 m2
Total Capacity of Clarifiers: 6.6 Mℓ/day
Upflow Velocity 1 m/h
RAS Pump Station Capacity
Chlorine Storage Capacity 8 x 68 kg cylinders
Chlorine Dosing Capacity 0 – 1 kg/h
Total Capacity of Chlorine Contact Tanks 62 m2
Total Capacity of Sludge Treatment Plant
Anaerobic Ponds None
Sludge Drying Beds Area 720 m2
The Ixopo WWW is located next to the R612 regional road and downstream of the Home Farm Dam, which supplies the raw water to Umgeni Water’s Ixopo WTP (Figure 7.9).
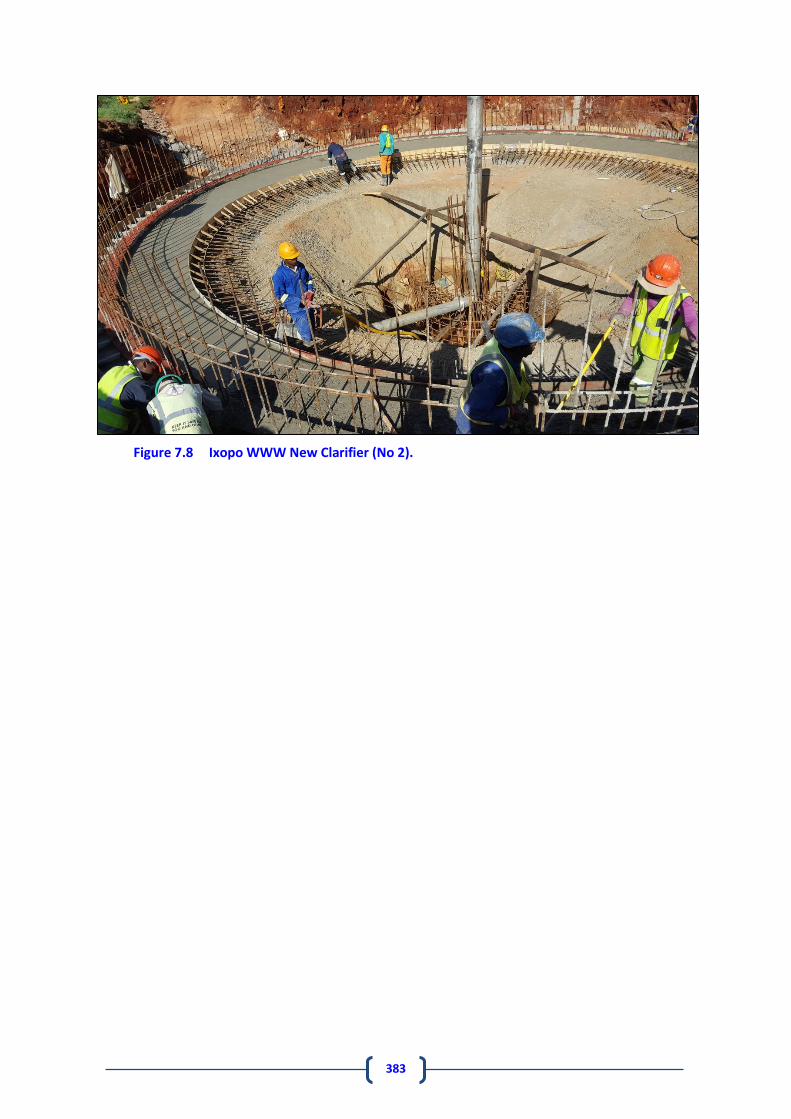
383
Figure 7.8 Ixopo WWW New Clarifier (No 2).

384
Figure 7.9 Location of Ixopo WWW.

385
7.2.3 Albert Falls North and South Wastewater Works
Albert Falls North (Figure 7.10) & South WWW (Figure 7.11) are aerobic sequential batch reactors (SBRs) with design capacities of 55 m3/day and 40 m3/day respectively. Raw sewage from the staff quarters, surrounding households and tankers is fed into the reactor via two grit channels at the Northern works and through a sump at the Southern works. Equalisation, biological treatment and secondary clarification are performed in a single tank using a timed control sequence. The system is fitted with diffusers for oxygen supplied by two blowers for biological nutrient removal. Solid-liquid separation occurs in the reactor where the actuator valve is operated alternatively to the blower timers. The diffusion occurs when the actuator valve is in a closed position and decanting occurs after the diffusion process is completed. Supernatant flows through a chlorination unit including a contact tank for disinfection. The chlorinated effluent then gravitates to a maturation pond for further stabilization and polishing. After the maturation pond the final effluent is discharged to the environment. The available clarifiers are no longer in use for clarification but serve as a safe guard for over spill during actuator valve failure and pipe blockages. Waste Activated Sludge (WAS) is discharged to the neighbouring sludge drying beds. The characteristics of the Albert Falls North and South WWW are shown in Table 7.3 and Table 7.4 respectively.
Figure 7.10 Sequencing Batch Reactor (SBR) Albert Falls North WWW.

386 Figure 7.11 Location of Albert Falls North and South WWW.

387
Table 7.3 Albert Falls North WWW Infrastructure
WWW Name: Albert Falls North WWW
System: Upper Mgeni System
Maximum Design Capacity: 0.055 Mℓ/day
Current Utilisation: Unknown (No inflow meter)
Screens None
Grit Chambers 2 x grit channels
Aeration basin 1 x Sequencing Batch Reactor
Aeration basin capacity 165 m3
Aeration 8 x Fine Bubble Diffuses
Blowers 2 x 7.5 kW
Clarifier Type: Used as overflow tank
Number of Clarifiers: 2
Total Area of all Clarifiers NA
Total Capacity of Clarifiers: 20 m3
Chlorine Storage Capacity Calcium Hypochlorite tablets
Total Capacity of Chlorine Contact Tanks 11.34 m3
Sludge Drying Beds Area 51 m2
Maturation Pond Capacity 475 m3
Table 7.4 Albert Falls South WWW Infrastructure
WWW Name: Albert Falls WWW
System: Upper Mgeni System
Maximum Design Capacity: 0.055 Mℓ/day
Current Utilisation: Unknown (No inflow meter)
Screens None
Grit Chambers 2 x grit channels
Aeration basin 1 x Sequencing Batch Reactor
Aeration basin capacity 115 m3
Aeration 6 x Fine Bubble Diffuses
Blowers 2 x 7.5 kW
Clarifier Type: Used as overflow tank
Number of Clarifiers: 2
Total Area of all Clarifiers NA
Total Capacity of Clarifiers: 20 m3
Chlorine Storage Capacity Calcium Hypochlorite tablets
Total Capacity of Chlorine Contact Tanks 11.34 m3
Sludge Drying Beds Area 46 m2
Maturation Pond Capacity 140 m3

388
7.3 Umgeni Water Operated Wastewater Works In 2014 Umgeni Water entered into a management contract to manage all the wastewater works within the uMgungundlovu District Municipality (UMDM). Umgeni Water has, for a number of years, operated the Howick WWW, which also treats wastewater from the decommissioned Mpophomeni WWW, but now operates the remaining five WWW’s within the Municipality. Additionally Umgeni Water operates the Lynnfield Park WWW on behalf of the Msunduzi Local Municipality. The majority of these WWW are small and situated in isolated rural areas. Operating information from these works is therefore not always consistent or available. For example, there is currently no flow measuring device or meter installed at Lynnfield Park WWW. Commenting on flow trends at these works is therefore not always possible. These infrastructure shortcomings will be rectified in the coming months by Umgeni Water.
7.3.1 Howick Wastewater Works
Howick WWW (Figure 7.12) is situated in the town of Howick in the Natal Midlands. It is owned by uMgungundlovu District Municipality and operated by Umgeni Water. The Department of Water and Sanitation (DWS) as per legislation, requires that the Howick WWW effluent be treated to meet the required standards set out in License No 21067202. The WWW is a Class C accredited treatment plant. The plant is an extended aeration process consisting of three separate reactors and four clarifiers. All reactors follow the Johannesburg Process configuration and are fitted with mechanical mixers in the anoxic and anaerobic zones and with surface aerators in the aerobic zones. Mixed liquor from the basins is settled in four downstream clarifiers. Waste activated sludge from the reactors is dewatered in drying beds and treated effluent is disinfected using chlorine before being discharged to the uMngeni River. Howick WWW is operating within its overall design capacity for the biological removal of COD, ammonia and phosphate Howick WWW (Figure 7.13) has a design capacity of 6.8 Mℓ/day and is currently treating 4.5 Mℓ/day (Figure 7.14) based on a 12-month moving average. Mechanical dewatering equipment installed in 2013 has alleviated operational problems to a degree although the works still has capacity problems during peak periods. If additional treatment capacity is required, the WWW will have to be upgraded. This may, however, be avoided in the short to medium term once the Mpophomeni WWW is constructed as this will reduce the volume of wastewater to be treated by 1 - 2 Mℓ/day.

389
Figure 7.12 Location of Howick WWW.

390
Figure 7.13 Chlorine Contact Tank Howick WWW.
Figure 7.14 Howick WWW Average Daily Outflows (Mℓ/day).

391
The characteristics of the Howick WWW are shown in Table 7.5.
Table 7.5 Howick WWW infrastructure.
WWW Name: Howick WWW
System: Upper Mgeni System
Maximum Design Capacity: 6.8 Mℓ/day
Current Utilisation: 5.4 Mℓ/day
Raw Sewage Pump Station
Screens 2 x Hand Raked, 5.5 cm 1 x Mechanical Screen Raker, 1 cm (Huber); 0.75 kW Motor (Bauer)
Screw Press Rotary Screw Conveyor; 0.55 kW Motor (Flender)
Grit Chambers 2 x Vortex Degritters
Degritter Pump 2 x Airlift; 7.5 kW (Wade)
Anaerobic Basin Mixers 6 x 1.5 kW, 3 x 2.2 kW Mixers
Anoxic Basin Mixers 9 x 2.2 kW Mixers
Aerators 3 x 15.5 kW (Hansen) 3 x 18.5 kW (WEG), 4 x 30 kW (Hansen)
Anaerobic Basin Area 575 m2
Anoxic Basin Area 640 m2
Aeration Basin Area 1790 m2
Aeration Basin Capacity 1.7 Mℓ/day , 1.7 Mℓ/day and 3.4 Mℓ/day (9850 m3)
Clarifier Type: 2 x Suction Lift, 2 x Mechanically Scraped
Number of Clarifiers: 4
Total Area of all Clarifiers 830 m2
Total Capacity of Clarifiers: 20 Mℓ/day
Upflow Velocity 1 m/h
RAS Pump Station
Chlorine Storage Capacity 68 kg Cylinder
Chlorine Dosing Capacity
Total Capacity of Chlorine Contact Tanks: 9 Mℓ/day
Total Capacity of Sludge Treatment Plant:
Sludge Dewatering 2 x Mechanical Screw Presses (Max. 5 m3/h)
Sludge Drying Beds Area 1920 m2

392
7.3.2 Mpophomeni Wastewater Works
Presently wastewater from Mpophomeni Township is pumped from the site of the decommissioned Mpophomeni WWW (Figure 7.15) to Howick WWW approximately 11 km away. The existing wastewater pumping and conveyance system, with an estimated operating capacity of 4.3 Mℓ/day, is inadequate to pump the projected ADWF of 5.9 Mℓ/day. Plans are therefore in place for the WWW to be re-commissioned as a treatment facility by Umgeni Water. Construction is envisaged to start towards the end of 2016. The upgrade of the WWW has been designed to treat 6 Mℓ/day with the possibility of increasing the WWW capacity to 12 Mℓ/day. The site has adequate land available for a WWW of at least 20 Mℓ/day. The existing WWW infrastructure is listed in Table 7.6, some of which will be retained in the upgrade.
Table 7.6 Mpophomeni WWW infrastructure.
WWW Name: Mpophomeni WWW
System: Upper Mgeni System
Maximum Design Capacity: 3.5 Mℓ/day
Current Utilisation: Decommissioned
Balancing Ponds 2.25 Mℓ/day wet weather storage pond
Raw Sewage Pump Station
Screens 1 x 30 mm Manually raked 1 x Mechanical Screen Raker (Huber)
Grit Chambers 2 x Vortex
Primary Settling Tank 2
Rotating Biofilters 2 x 454 m2
Clarifier Type:
Number of Clarifiers: 1 x 18 m diameter
Total Area of all Clarifiers 255 m2
Total Capacity of Clarifiers: 6 Mℓ/day
Upflow Velocity 1 m/h
Cold Digesters 2 x 600 kℓ
Supernatant Tank 1 x 450 kℓ
Humus Tanks 3
RAS Pump Station
Chlorine Storage Capacity
Chlorine Dosing Capacity
Total Capacity of Chlorine Contact Tanks
Total Capacity of Sludge Treatment Plant
Dewatering Facility
Sludge Drying Beds Area 8

393
Figure 7.15 Location of decommissioned Mpophomeni WWW.

394
7.3.3 Lynnfield Park Wastewater Works
The Lynnfield Park Wastewater Works (WWW) is a small (0.2 Mℓ/day) works that services part of the Ashburton area (Figure 7.16). Umgeni Water took over the operation of the works on behalf of the Msunduzi Local Municipality in April 2014. Inflow to the works is estimated at approximately 0.15 Mℓ/day. The WWW is currently being upgraded to 0.5 Mℓ/day with the addition of a new Sequencing Batch Reactor (SBR). The extended aeration activated sludge reactors (Figure 7.17) will be decommissioned. The addition of a duplicate SBR (0.5 Mℓ/day) is planned and this would increase the capacity of the plant to 1 Mℓ/day. The upgrade to the works is being funded by a private developer and thus the increase in capacity is being timed to coincide with planned property developments in the area. Further upgrades to 2 and 4 Mℓ/day are planned based on expected future requirements. The characteristics of the Lynnfield Park WWW are shown in Table 7.7.
Table 7.7 Lynnfield WWW infrastructure.
WWW Name: Lynnfield WWW
System: Upper Mgeni System
Maximum Design Capacity: 0.2 Mℓ/day
Current Utilisation: Unknown (No inflow meter)
Balancing Ponds Storm Dam
Screens New 1 x Mechanical raked screen, 6 mm aperture New standby 1 x Hand raked screen, 12 mm aperture
Grit Chambers 1 x vortex
Aeration basin 2 x Sequencing Batch Reactor
Aeration basin capacity 500 kℓ/day
Aeration Fine Bubble Diffused Aeration
Blowers 2 x 9.5 kW
Clarifier Type:
Number of Clarifiers: 2 (To be decommissioned)
Total Area of all Clarifiers
Total Capacity of Clarifiers:
Upflow Velocity
Chlorine Storage Capacity 25 ℓ tank Liquid Sodium Hypochlorite (NaOCL)
Total Capacity of Chlorine Contact Tanks 11.34 m3
Sludge Drying Beds Area Geofabric dewatering bag contained in a disposable skip

395 Figure 7.16 Location of Lynnfield Park WWW.

396
Figure 7.17 Lynnfield Park WWW Aeration Tanks.
7.3.4 Mpofana Wastewater Works
Umgeni Water operates the Mpofana Wastewater Works (WWW) on behalf of the uMgungundlovu District Municipality (UMDM). The wastewater works services the town of Mooi River, and adjacent township of Bruntville (Figure 7.18). Sewage from Mooi River flows into the works by gravity, but in the catchment sewage is pumped by eight pump stations to the wastewater works. The works has a design capacity of 3.5 Mℓ/day and a reported operating capacity of 5 Mℓ/day. The works is, however, receiving average dry weather inflows (AADW) of 9 Mℓ/day and is therefore operating over capacity. A number of operational issues have also been identified at the works mainly due to aging infrastructure in need of refurbishment or replacement. Umgeni Water has therefore identified the need for the treatment capacity available to be increased to meet the current and future demands of Mooi River. The characteristics of the Mpofana WWW are shown in Table 7.8.

397
Figure 7.18 Location of the Mpofana WWW.

398
Table 7.8 Mpofana WWW infrastructure.
WWW Name: Mpofana WWW
System: Mooi System
Maximum Design Capacity: 3.5 Mℓ/day
Current Utilisation: 10 Mℓ/day (up to 13Mℓ/day)
Balancing Ponds Combined 75000 m3
Raw Sewage Pump Station 375 Mℓ/day @ velocity of 2.3 m/s
Screens 3 x Hand-raked bar screen
Grit Chambers None
Aeration basin 2 x Activated sludge (1 x not operational)
Aeration basin capacity Operational 4500 m3
Aerators 3 x Hansen QVPD-3_UDN (45kW, 1480 rpm) 3 x SEW Eurodrive (not operational)
Clarifier Type: Suction Lift Clarifier
Number of Clarifiers: 2 x 20 m diameter
Total Area of all Clarifiers 628 m2
Total Capacity of Clarifiers: 15 Mℓ/day
Upflow Velocity 1 m/h
RAS Pump Station None (gravity)
Chlorine Storage Capacity Wallace & Tiernan, S10k Gas Chlorinator 68 kg cylinder
Chlorine Dosing Capacity Max. allowable 2.0 kg/h (existing)
Total Capacity of Chlorine Contact Tanks 25m3
Total Capacity of Sludge Treatment Plant 5 m3/hr
Dewatering Facility Operational
Sludge Drying Beds Area None

399
7.3.5 Appelsbosch Wastewater Works
The Appelsbosch Wastewater Works (WWW) is situated in Appelsbosch in uMshwathi Municipality (Figure 7.19). The WWW is comprised of a single rectangular aeration tank fitted with turbine aerators, a clarifier, three anaerobic ponds and a chlorine contact tank. The current treatment rate is a reported as 0.5 Mℓ/day. The plant receives sewerage from Appelsbosch and
surroundings but mainly from the hospital and college nearby. The plant is classified as a Class E works requiring a Class 1 operator onsite and a Class V supervisor available who does not necessarily have to be onsite. The characteristics of the Appelsbosch WWW are shown in Table 7.9.
Table 7.9 Appelsbosch WWW infrastructure.
WWW Name: Appelsbosch WWW
System: Upper Mgeni System
Maximum Design Capacity: 0.5 Mℓ/day
Current Utilisation: 0.13 Mℓ/day
Balancing Ponds None
Raw Sewage Pump Station Gravity
Screens 1 x Hand Raked
Grit Chambers None
Aeration basin 1 x Oxidation Ditch
Aeration basin capacity 667 m3
Aerators 2 x Brush Aerators
Clarifier Type: Scraped Floor
Number of Clarifiers: 1
Total Area of all Clarifiers 38 m 2
Total Capacity of Clarifiers: 0.9 Mℓ/day
Upflow Velocity 1 m/h
RAS Pump Station
Chlorine Storage Capacity
Chlorine Dosing Capacity
Total Capacity of Chlorine Contact Tanks
Total Capacity of Sludge Treatment Plant None
Anaerobic Ponds 3 (35 m x 10 m)
Sludge Drying Beds Area Not operational

400
Figure 7.19 Location of the Appelsbosch WWW.

401
7.3.6 Cool Air Wastewater Works
The Cool Air Wastewater Works (WWW) is situated near Cool Air Township (Figure 7.20) in the uMshwathi Local Municipality. The plant is owned by the uMgungundlovu District Municipality and operated by Umgeni Water. The plant is classified as a Class C and is required to have a Class 3 Operator, and a Class V Supervisor available, who do not necessarily have to be on the plant all the time. The WWW is an extended aeration activated sludge process with two rectangular aeration tanks, two clarifiers and a chlorine contact tank. The current treatment capacity is a reported 1.5 Ml/day. The plant was operating at a flow rate of 0.6 Ml/day (measured before the flume) and the raw wastewater ultrasonic low was reading 0.98 Ml/day. The characteristics of the Cool Air WWW are shown in Table 7.10.
Table 7.10 Cool Air WWW infrastructure.
WWW Name: Cool Air WWW
System: Upper Mgeni System
Maximum Design Capacity: 1.5 Mℓ/day
Current Utilisation: 1.0 Mℓ/day
Balancing Ponds None
Raw Sewage Pump Station Gravity
Screens Hand raked 1 x 3.5 cm, 1x2.0 cm
Grit Chambers None
Aeration basin 2 x Extended aeration
Aeration basin capacity 2 x 883 m3
Aerators 2 x 4.48 kW, 2 x 7.5 kW
Clarifier Type: 1 x suction lift, 1 x scraped
Number of Clarifiers: 2
Total Area of all Clarifiers 129 m2
Total Capacity of Clarifiers: 3.12 Mℓ/day
Upflow Velocity 1 m/h
RAS Pump Station 2 x Archimedes Screw Pumps
Chlorine Storage Capacity 68 kg cylinder chlorine gas
Chlorine Dosing Capacity 0 – 1 kg/h
Total Capacity of Chlorine Contact Tanks
Total Capacity of Sludge Treatment Plant None
Anaerobic Ponds None
Sludge Drying Beds Area 835 m2

402
Figure 7.20 Location of the Cool Air WWW.

403
7.3.7 Camperdown Wastewater Works
Camperdown Wastewater Works is situated in Camperdown (Figure 7.21) approximately half-way between Pietermaritzburg and Cato Ridge. The WWW falls within the Mkhambathini Local Municipality and the uMgungundlovu District Municipality, which is the WSA for the area. The plant is owned by uMgungundlovu District Municipality and is operated by Umgeni Water. The plant is classified as a Class E works requiring a Class 1 Operator onsite, and a Class V Supervisor available, who do not necessarily have to be onsite. The WWW is an extended aeration activated sludge process using a rectangular aeration tank and two scraped clarifiers. The current treatment rate is reported as 1.0 Mℓ/day but it is suspected that the full flow reaching the works is considerably higher. The design capacity was reported to be about 1 Mℓ/day. The characteristics of the Camperdown WWW are shown in Table 7.11.
Table 7.11 Camperdown WWW infrastructure.
WWW Name: Camperdown WWW
System: Lower Mngeni System
Maximum Design Capacity: 1 Mℓ/day
Current Utilisation: 0.1 Mℓ/day
Balancing Ponds None
Raw Sewage Pump Station Gravity
Screens 1 x Hand Raked, 2.5 cm Gaps
Grit Chambers 1 x Vortex Degritter
Aeration basin 1
Aeration basin capacity 234 m3
Aerators 2 x 5.5 kW
Clarifier Type: Scraped Floor
Number of Clarifiers: 1
Total Area of all Clarifiers 28 m2
Total Capacity of Clarifiers: 1 x 85 m3
(New Steel)) , 6.72 Mℓ/day,
Upflow Velocity 1 m/h
RAS Pump Station
Chlorine Storage Capacity Sodium Hypochlorite
Chlorine Dosing Capacity
Total Capacity of Chlorine Contact Tanks
Total Capacity of Sludge Treatment Plant
Anaerobic Ponds 1 x 30 m2
Sludge Drying Beds Area 130 m2

404
Figure 7.21 Location of the Camperdown WWW.

405
7.3.8 Richmond Wastewater Works
Umgeni Water operates the Richmond Wastewater Works (WWW) on behalf of the uMgungundlovu District Municipality (UMDM). The wastewater works services the town of Richmond (Figure 7.22), but does not include the adjacent township of Ndaleni. Sewage from Richmond flows by gravity to the wastewater works. The plant is an extended aeration activated sludge process consisting of an inlet works, a single rectangular aeration tank fitted with two surface aerators and a suction lift clarifier (Figure 7.23). Final treated wastewater is disinfected using chlorine gas. The works was designed for an Average Dry Weather Flow (ADWF) of 1 Mℓ/day with a COD loading of 740 kg/day. The plant is classified as a Class E works requiring a Class 1 Operator onsite, and a Class V Supervisor available, that do not necessarily have to be onsite. The characteristics of the Richmond WWW are shown in Table 7.12.
Table 7.12 Richmond WWW infrastructure.
WWW Name: Richmond WWW
System: Upper Mgeni System
Maximum Design Capacity: 1 Mℓ/day (Based on ADWF) 2.9 Mℓ/day
Current Utilisation: 1.5 Mℓ/day
Raw Sewage Pump Station T-series Gormann Rupp
Screens Hand-raked 11 mm gap bar screen
Grit Chambers Two
Aeration basin Activated sludge
Aeration basin capacity 1110 m3
Aerators Two slow speed Hansen Patent (18.5 kW each)
Clarifier Type: Suction Lift Clarifier
Number of Clarifiers: 1
Total Area of all Clarifiers 95 m2
Total Capacity of Clarifiers: 2.28 Mℓ/day
Upflow Velocity 1 m/h
RAS Pump Station T-series Gormann Rupp
Chlorine Storage Capacity 68kg cylinder
Chlorine Dosing Capacity Max. allowable 2.5 kg/h
Total Capacity of Chlorine Contact Tanks: 25m3
Total Capacity of Sludge Treatment Plant: Sludge lagoon (volume unknown)
Sludge Drying Beds Area 500 m2 (not used)

406 Figure 7.22 Location of the Richmond WWW.
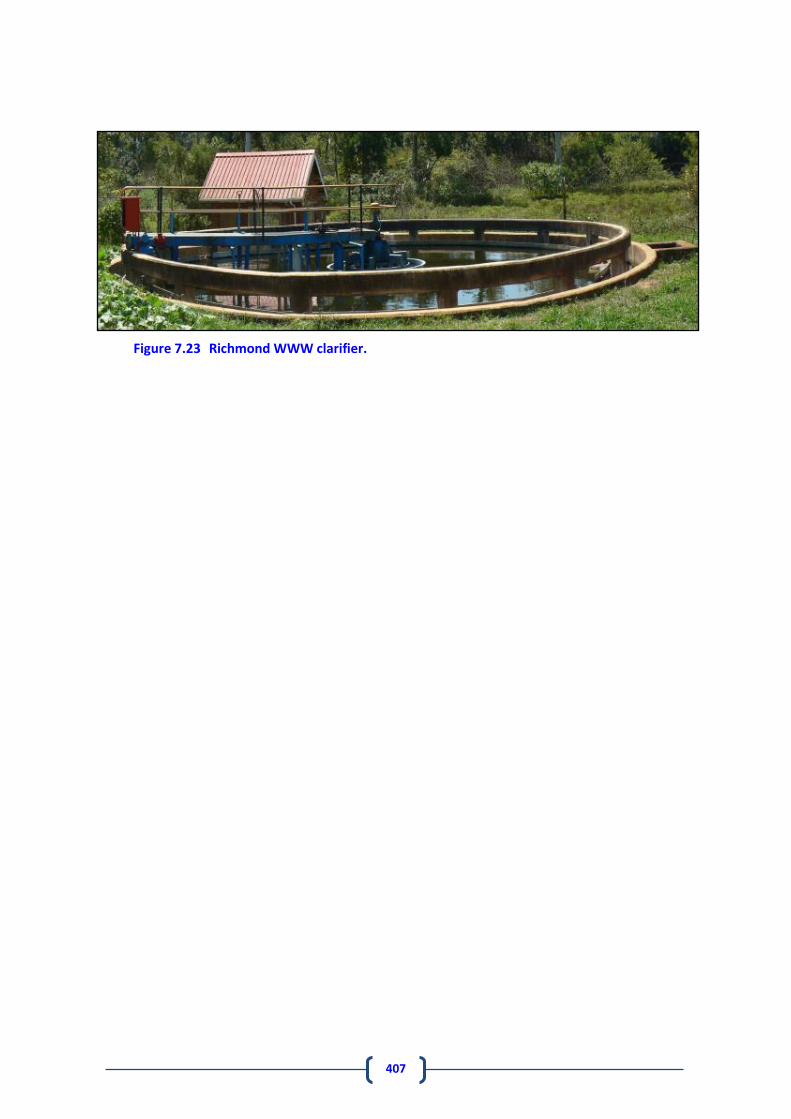
407
Figure 7.23 Richmond WWW clarifier.

408
8. RECOMMENDED PROJECTS
8.1 Overview Section 6 of this Infrastructure Master Plan describes each of the water supply systems within the Umgeni Water area of operation, discusses the constraints identified within each one, and makes recommendations on the water supply infrastructure that is required to alleviate these constraints. Figure 8.1 illustrates the systems and subsystems that each of the recommended projects belongs to, and should also be read in conjunction with Figure 6.1. This Section links directly to Section 6, and describes each of the recommended infrastructure projects of significance in more detail. In particular, projects currently being implemented, or are close to implementation, are discussed. A summary of the areas that will be supplied by these proposed projects are shown in Figure 8.2. The projects per WSA are summarised in Figure 8.3, Figure 8.4, Figure 8.5, Figure 8.6 and Figure 8.7. Also included in this Section, are descriptions of new infrastructure projects that have been identified to expand the area of supply. These projects are often planned to be linked into existing supply infrastructure and their future demands could impact on the existing infrastructure. These potential impacts are discussed in Section 6. It is important to note that the implementation of these projects is influenced, and driven, by a host of factors besides purely technical requirements. These factors include financial constraints, corporate strategy, politics and local government priorities, to mention but a few. All these factors carry their own weight in the decision making process and cannot be ignored. Hence the actual implementation and timing thereof, could well vary from what is mentioned for these projects. Finally, all planned new wastewater works (WWW) or proposed upgrades to WWW that Umgeni Water is responsible for are included at the end of this section. These proposals should be read in conjunction with Section 7. As previously mentioned in Section 7, Umgeni Water has recently taken over the operation of all the WWW within the uMgungundlovu District Municipality. Umgeni Water is assessing the nature of infrastructure development and/or rehabilitation required at these works. This assessment is currently taking place and therefore there are no definitive plans to report on at this stage. However, the Darvill WWW is in the process of being upgraded and the detailed design for the upgrade of Mpophomeni WWW has been completed and these two WWW are therefore discussed in detail.

409
Figure 8.1 Recommended projects per system.

410
Figure 8.2 Areas that are anticipated to be supplied by Umgeni Water’s proposed projects.
Figure 8.3 Proposed projects within uMgungundlovu WSA and the areas anticipated to be
supplied.

411
Figure 8.4 Proposed projects within eThekwini WSA and the areas anticipated to be supplied.
Figure 8.5 Proposed projects within Harry Gwala WSA and the areas anticipated to be supplied.

412
Figure 8.6 Proposed projects within Ugu WSA and the areas anticipated to be supplied.
Figure 8.7 Proposed projects within iLembe WSA and the areas anticipated to be supplied.

413
8.2 uMkhomazi System
8.2.1 uMkhomazi Water Project
Planning No. 114.0
Project No. UI0530
Project Status Detailed Feasibility
Project Description With the commissioning of Phase 2B of the Mooi-Mgeni Transfer Scheme (MMTS-2), the water resources available in the Mooi and Mgeni catchments, to augment the Mgeni System, are now fully utilised (Section 5.4.4). The MMTS-2 increased the safe assured yield of the Mgeni System to 394 million m3/annum. Over recent years, eThekwini Municipality has put considerable effort into optimising the operation of its distribution systems that are served by the Lower Mgeni System. Amongst other things, this has led to them implementing new infrastructure in order to undertake a significant load shifting exercise. eThekwini Municipality’s Western Aqueduct project, which is expected to be fully commissioned in mid-2018, will represent the most significant of these load-shifting operations. The intention is for those areas currently being served under pumping from the Lower Mgeni System (viz. from Durban Heights WTP) to be transferred onto the Upper Mgeni System, and served under gravity from Midmar WTP via the Western Aqueduct (WA). This will result in the full utilisation of the Upper Mgeni resource by 2018. After the implementation of MMTS-2, further water resource developments within the Mooi-Mgeni system are not considered to be beneficial. Further augmentation of the Mgeni System will then be required. Water resource development on the uMkhomazi River has been identified as the next major project to secure long-term water resources for eThekwini’s Western Aqueduct supply zone. During the late 1990’s, the then DWAF (now DWS) and Umgeni Water jointly commissioned a pre-feasibility study to investigate various options for developing the uMkhomazi River’s water resources, such that they could be utilised to augment those of the Mgeni River System. A two-phased scheme was proposed, and the overall project area is shown in Figure 8.8. Phase 1 of the proposed uMkhomazi Water Project (uMWP-1) will involve the construction of Smithfield Dam, located along the central reaches of the uMkhomazi River midway between Lundy’s Hill Bridge and Deepdale. Smithfield Dam will be the primary impoundment, whilst for Phase 2, a second dam (Impendle Dam) will be constructed upstream of the Smithfield site (just downstream of the uMkhomazi River/Nzinga River confluence). Phase 2 would only be implemented once the yield of Phase 1 (Smithfield Dam) has been fully utilised.

Figure 8.8 uMkhomazi Water Project.

415
Succinct details of the proposed potable water infrastructure are as follows: Water treatment plant design: In order to meet the proposed phased increases in demand as well as a requirement to provide support to the Mgeni System, the capacity of the uMWP-1 WTP is proposed to be 500 Ml/day. A further 125 Ml/day phase would be required in 2044. The proposed WTP layout (Figure 8.9) was constrained by the requirement for gravity supply in the overall system between Smithfield Dam and the Umlaas Road tie-in, as well as a requirement to keep the WTP footprint to a minimum. The proposed plant layout combines features of accessible and compact unit process configuration, minimum lengths of interconnecting pipework, minimum volume of excavation and ease of future extension. The recommended WTP processes are pre-chlorination, coagulation/flocculation, high-rate clarifiers, rapid gravity filtration, granular activated carbon (GAC) filtration, final chlorination and sludge treatment.
Figure 8.9 Layout of Water Treatment Plant.
Potable water reservoir: The potable water reservoir was sized to accommodate a minimum of six hours of the daily WTP capacity. Based on the WTP phasing discussed above the first 500 Ml/day WTP phase would require 125 Ml of storage, with a further 31.25 Ml/day required when the next 125 Ml/day WTP phase is constructed in 2044, i.e. a total of 156.25 Ml of storage for the uMWP-1. The reservoir for the uMWP-1 would require a footprint of 2.2 hectares. In light of a requirement to keep the WTP footprint to a minimum, it was proposed that potable water storage be constructed beneath various WTW structures. Potable water pipeline: The potable water pipeline (Figure 8.10) was designed to accommodate an average annual daily demand of 602 Ml/day; equivalent to the 1:100 year yield of the Smithfield. The peak design capacity was 753 Ml/day. Pipelines ranging from 2 820 mm diameter (15.1 km) to 2 540 mm diameter is proposed to convey the peak demand of 753 Ml/day.
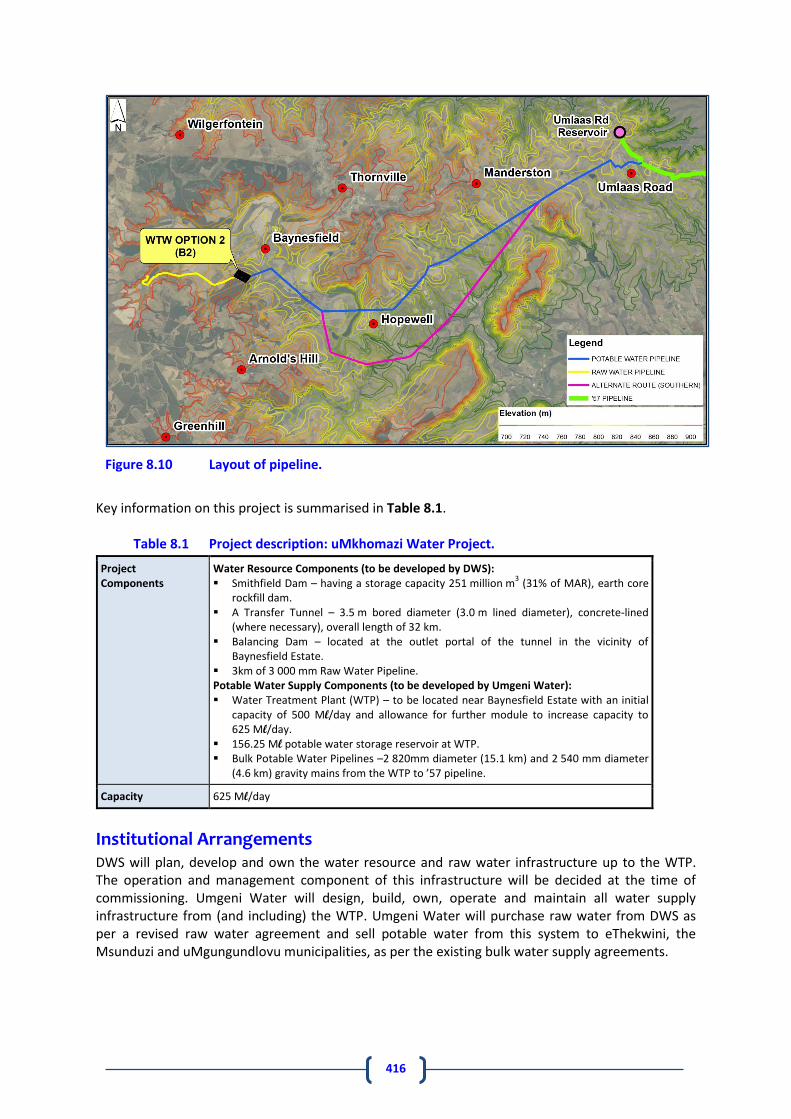
416
Figure 8.10 Layout of pipeline.
Key information on this project is summarised in Table 8.1.
Table 8.1 Project description: uMkhomazi Water Project.
Project Components
Water Resource Components (to be developed by DWS): Smithfield Dam – having a storage capacity 251 million m
3 (31% of MAR), earth core
rockfill dam. A Transfer Tunnel – 3.5 m bored diameter (3.0 m lined diameter), concrete-lined
(where necessary), overall length of 32 km. Balancing Dam – located at the outlet portal of the tunnel in the vicinity of
Baynesfield Estate. 3km of 3 000 mm Raw Water Pipeline. Potable Water Supply Components (to be developed by Umgeni Water): Water Treatment Plant (WTP) – to be located near Baynesfield Estate with an initial
capacity of 500 Ml/day and allowance for further module to increase capacity to 625 Ml/day.
156.25 Ml potable water storage reservoir at WTP. Bulk Potable Water Pipelines –2 820mm diameter (15.1 km) and 2 540 mm diameter
(4.6 km) gravity mains from the WTP to ’57 pipeline.
Capacity 625 Ml/day
Institutional Arrangements DWS will plan, develop and own the water resource and raw water infrastructure up to the WTP. The operation and management component of this infrastructure will be decided at the time of commissioning. Umgeni Water will design, build, own, operate and maintain all water supply infrastructure from (and including) the WTP. Umgeni Water will purchase raw water from DWS as per a revised raw water agreement and sell potable water from this system to eThekwini, the Msunduzi and uMgungundlovu municipalities, as per the existing bulk water supply agreements.

417
Beneficiaries The scheme will primarily serve the eThekwini Municipal area and to a lesser extent portions of uMgungundlovu District Municipality. Assuming 200 l/person/day, the estimated number of beneficiaries from the anticipated capacity of 625 Ml/day may be 3 125 000 people.
Implementation The project is divided into three components:
Module 1: Technical Feasibility Study: Raw Water (Appointment by Department of Water and Sanitation). The study was completed in 2015;
Module 2: Environmental Impact Assessment (Joint appointment by Department of Water Affairs and Umgeni Water). Report was submitted in December 2016 but further work required on the raw water component;
Module 3: Technical Feasibility Study: Potable Water (Appointment of PSP by Umgeni Water). The study was completed in 2015.
The project needs to be implemented by 2018 in order to achieve a 99% level of assurance of supply to the Mgeni System. However, the earliest possible commissioning of this scheme is 2024. The estimated cost of the entire project (raw and potable components) is in the order of R 20 billion at 2016 prices. This is made up of R 14.5 billion for the raw water component to be implemented by DWS and R 5.5 billion for the potable component to be implemented by Umgeni Water.

418
8.2.2 Impendle BWSS
Planning No. 105.44
Project No. UI0544A
Project Status Detailed design
Project Description The area of Impendle has unreliable sources of water and many small run-off-river abstraction and borehole schemes. This project will increase the level of assurance of supply to the community of Impendle as requested by uMgungundlovu District Municipality. The water schemes are part of the Impendle bulk water supply project for the Impendle Local Municipality. The Impendle Municipality’s topography predominantly comprises rolling hills, mountains and scattered settlements covering an area of 948 km2. Due to the nature of the area’s topography and extended scattered settlements, two separate bulk water supply schemes are proposed. One bulk scheme will serve the north western part of the Municipality that includes communities from Stepmore to the Lotheni area. The second bulk scheme will provide water to the communities on the east (Figure 8.11).
Stepmore
The proposed source for the scheme is a new river intake to be constructed on the uMkhomazi River. Raw water from this intake will be delivered to a proposed Stepmore Water Treatment Plant (WTP), where the water will be purified. The WTP is situated on a greenfield site and will have a capacity of 69 kℓ/hr. From a high-lift pump station within the WTP site, purified water will be delivered through a clear water rising main to Lotheni 1 Reservoir with a capacity of 1Mℓ. From Lotheni 1 Reservoir a gravity main will convey water to Lotheni 2 Reservoir. From the Lotheni 1 and 2 Reservoirs, distribution mains will convey the water by gravity to existing distribution networks in the areas of Stepmore, Inkangala and Lotheni. Umgeni Water will be responsible for the implementation of the Bulk Works from the Abstraction and Water Treatment Plant to the Lotheni 1 Reservoir.
Nzinga
The proposed source for the scheme is a new river intake to be constructed on the uMkhomazi River. Raw water from this intake will be pumped to the proposed Nzinga Raw Water Pump Station (NRWPS) located approximately 190 metres from the intake structure. From the NRWPS, raw water will be delivered through a 325/355 mm diameter x 7.6 km long rising main to the Nzinga WTP located on the same site as the existing WTP. The pipeline is designed to supply 275 kℓ/hr of raw water. The BWSS will be operated and maintained by Umgeni Water. Key information on this project is summarised in Table 8.2.

419
Table 8.2 Project information: Impendle BWSS.
Project Components: Nzinga Waterworks
The proposed plant has a capacity of 10 Mℓ/day with an abstraction capacity of 11 Mℓ/day.
355 mm diameter x 7.6 km long rising main.
1 Mℓ Nzinga Reservoir.
Stepmore Waterworks
The proposed plant has a capacity of 1.66 Mℓ/day with an abstraction capacity of 1.78 Mℓ/day
1 Mℓ Lotheni 1 Reservoir.
650 kℓ Lotheni 2 Reservoir.
Construction of approximately 11,5 km of 100 mm diameter to 200 mm diameter uPVC and steel pipelines.
Capacity: 15 Mℓ.
Beneficiaries The upgrade to the BWSS will benefit consumers within the Impendle Local Municipality with an estimated population of 37 000.
Implementation The construction duration of this project is anticipated to be six years. The total cost is estimated to be R351 million at 2016 prices.

Figure 8.11 General layout of the Impendle Project Areas.

421
8.2.3 uMzimkhulu Bulk Water Supply Scheme
Planning No. 162.6
Project No. UI0816A
Project Status Detailed Feasibility
Background The uMzimkhulu Local Municipality is currently being supplied by numerous small non-sustainable schemes. Water supply in this area is isolated with little or no regional planning in place and the schemes in place provide a modest relief for the most immediate need. The recommended approach of this project is of a regional nature which is sustainable and provides proper operational, maintenance and processing systems in place. This holistic approach will allow the uMzimkhulu Bulk Water Supply Scheme to not only supply the uMzimkhulu Local Municipality but also supply parts of the Dr Nkosazana Dlamini Zuma, uBhulebezwe Local Municipalities and has the potential to supply the southern coastal areas within the KwaZulu-Natal province.
Project Description The purpose of this study is to identify any feasible bulk water supply options that could:
In particular, provide an alternative, more reliable, source of potable water for the stand-alone rural water supply schemes which rely, to a large extent, on protected springs, boreholes or run-of-river abstraction, and that continue to present operational and financial challenges for the municipality; and
In general, provide an adequate supply of potable water to meet the growing needs of the area.
A pre-feasibility and detailed feasibility investigation is being undertaken of options to supply this area with potable water. The locality map and extent of the study area are shown in Figure 8.12. The Umzimkhulu Local Municipality (KZN435) is predominantly rural in nature with dispersed settlement patterns. The northwestern limit of the study area is defined by the Ndawana River, which is the boundary between the Dr Nkosazana Dlamini-Zuma and Umzimkhulu Local Municipalities. At Coleford the Ndawana River joins the Ngwangwane River, which forms the boundary between the Dr Nkosazana Dlamini-Zuma and Umzimkhulu Local Municipalities. It is not envisaged that supply from the uMzimkhulu BWSS will supply north of the Ngwangwane River, the Greater Kilimon BWSS will supply the area from Kilimon to the St. Apollinaris area in the Dr Nkosazana Dlamini-Zuma Local Municipality. The western boundary follows the border between the Greater Kokstad local municipality and Umzimkhulu Local Municipality past Tigerhoek until the boundary shared by Ugu DM and Harry Gwala DM. The southern boundary extends from Tigerhoek along the District boundary, across the Bisi River to the uMzimkhulu River and along it till Gloucester.

422
The eastern boundary follows the uMzimkhulu River from the Ngwangwane River to the District boundary. The pre-feasibility study was completed in 2016 and the following scheme was proposed and will be taken into detailed feasibility phase. The Scheme will consist of an earth fill dam with an impermeable core, referred to as the New Biggen Dam. The dam would have a capacity of 77 million cubic metres of water and has a yield of 348 Ml/day. The scheme would consist of a WTW at the edge of the dam that would produce 43.3 Ml/day. The main pump station would be located adjacent to the WTW and pump water via two main rising mains north and south of the WTW to two command reservoirs. Most of the scheme there onwards would be supplied under gravity with minimal pumping required. The scheme would require three smaller pump stations, approximately 450 Km of pipeline varying from DN150 to DN800 and 32 reservoirs placed at strategic pints to maximise supply, see Figure 8.12. This scheme would have the capacity to supply the entire uMzimkhulu LM and adjacent LM’s with potable water and would have the option to be upgraded in the future.
Table 8.3 Project information: uMzimkhulu Bulk Water Supply Scheme.
Project Components: Phase 1: 43.3 Mℓ/day Water Treatment Works, associated pump stations, command reservoir A, rising mains to reservoir A and gravity mains from in a south westerly direction towards uMzimkhulu town. This phase will also supply water to Greater Kilimon and consist of 162 km of pipelines ranging from DN800 to DN150 in total. Phase 2: Comprises of the construction of reservoirs, pump stations and gravity mains branching of the main supply lines constructed in phase 1. A total of 134 km of pipelines ranging in diameter from DN650 to DN150 will be constructed in this phase. Phase 3: This phase will consist of the construction of the sub-mains branching off the mains constructed in the two previous phases as well as the terminal reservoirs. A total length of 164 km of pipelines ranging in diameter from DN500 to DN150 will be constructed in this phase.
Capacity (WTP): 43.3 Mℓ/day, provision will be to expand the works should the need arise.

Figure 8.12 Proposed uMzimkhulu Bulk Water Supply Scheme.

424
Note: The study area, as defined in this project, should not be construed as being fixed, but rather as a starting point for further refinement and adjustment as options are developed in more detail.
Institutional Arrangements The study will analyse the institutional, management and financial implications with respect to the ownership and management of the proposed new infrastructure. This analysis will serve as the basis for further discussions between Harry Gwala DM as the Water Services Authority, Umgeni Water and the Department of Water and Sanitation.
Beneficiaries The scheme will primarily serve the Umzimkhulu Local Municipality area and possibly portions of other Local Municipalities within Harry Gwala District Municipality. The “Umzimkhulu Bulk Water Regional Supply Scheme Pre-Feasibility Report” identifies an estimated 256 740 people that may be served by this scheme (September 2016).
Implementation The detailed feasibility has commenced on the preferred option and will be completed in June 2017. The detailed feasibility will provide implementing timeframes, project staging and funding options.

425
8.3 Mooi System
8.3.1 Greater Mpofana Bulk Water Supply
Planning No. 105.24
Project No. UI220A
Project Status Construction
Project Description Sustained housing development and tourism related activities are increasing the water demand at several nodes along Main Road R103 between Lions River (uMngeni Local Municipality) and Mooi River (Mpofana Local Municipality). This growth is beginning to stress local water resources and water supply infrastructure in the area. The Greater Mpofana Region (described in this report as the area from Mooi River to Lidgetton) does not have a reliable water supply. Much of the area relies on boreholes and run of river abstraction. With increasing demands, the future supply is not considered sustainable. A regional bulk water supply scheme referred to as the Greater Mpofana Bulk Water Supply Scheme (GMBWSS) is being implemented to ensure that the area has a reliable water supply that will sustain this growth into the future. Phase 1 of the project is currently under construction and will provide a sustainable bulk water supply to the towns of Mooi River, Rosetta and Nottingham Road. Phase 2 of the project is in the final feasibility stage and will provide a sustainable bulk water supply to the towns of Lidgetton and Lions River including the rural hinterland surrounding the abovementioned towns in KwaZulu-Natal. The GMBWSS (Figure 8.13) will obtain raw water from Spring Grove Dam on the Mooi River to a WTP to be situated adjacent to the dam. From here potable water will be pumped to two command reservoirs. The first reservoir is located at Bruntville in Mooi River. This reservoir will serve the greater Mooi River area and will have the potential to supply the Muden/Rocky Drift area. The Mooi River WTP and Rosetta WTP can then be decommissioned. The second reservoir is at Nottingham Road which will then supply Balgowan, Lidgetton and possibly Lions River. There is also a link pipeline to Mount West. The scheme is to be built in phases to gradually increase the supply area (Figure 8.14)
Key information on this project is summarised in Table 8.4.
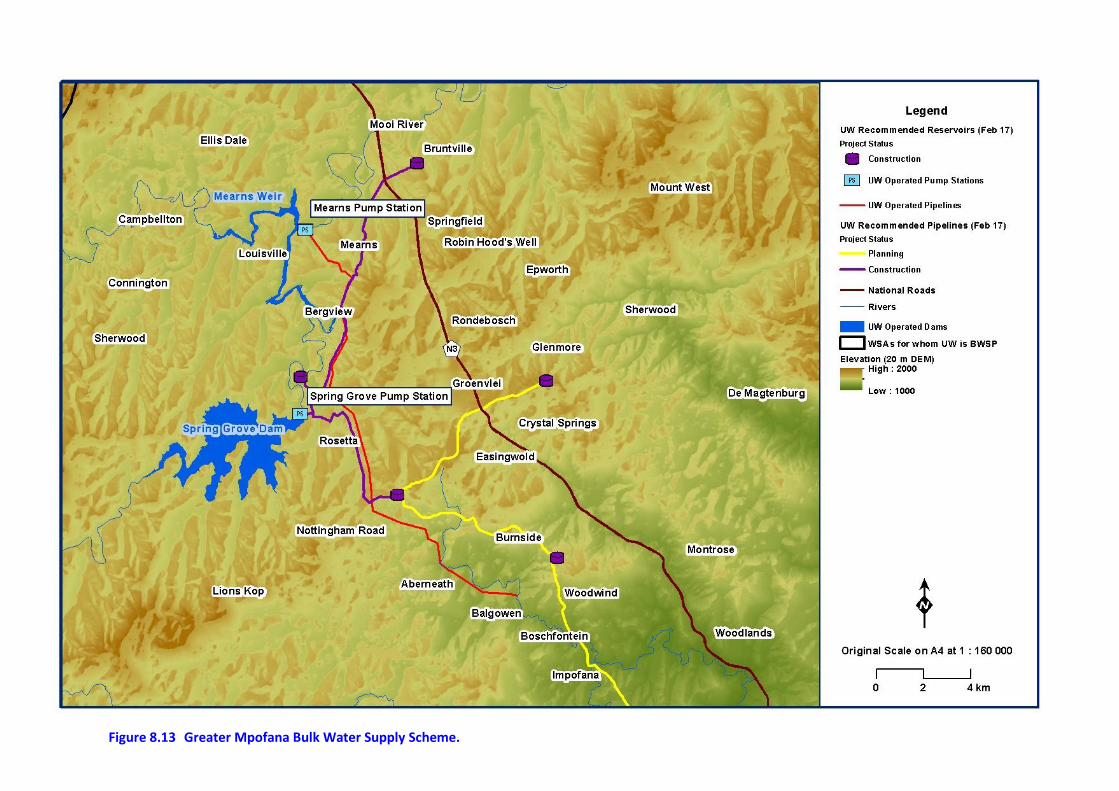
Figure 8.13 Greater Mpofana Bulk Water Supply Scheme.

427
Figure 8.14 Schematic of Greater Mpofana BWSS.

428
Table 8.4 Project information: Greater Mpofana Bulk Water Supply Scheme.
Project Components: Phase 1: 20 Mℓ/day Water Treatment Works, associated pump stations, 400 mm diameter pipeline to Nottingham Road and 10 Mℓ reservoir, and 500 mm diameter pipeline to Rosetta and Bruntville in Mooi River with 12 Mℓ reservoir at Bruntville. Phase 2: Pipeline from Nottingham Road Reservoir to Balgowan and then Lidgetton including the Balgowan Reservoir. Phase 3: Pipeline from Nottingham Road to Mount West including a reservoir at Mount West and pipeline to Lions River including a reservoir at the termination point. Phase 4: Possible Pipeline to Msinga.
Capacity (WTP): 20 Mℓ/day; Two further upgrades to be undertaken when required reaching an ultimate capacity of 60 Mℓ/day.
Institutional Arrangements Umgeni Water will own, operate and maintain this bulk scheme and will sell potable water to the uMgungundlovu District Municipality as per the Bulk Water Supply Agreement. The uMgungundlovu District Municipality will then reticulate to the end consumers through existing and new supply infrastructure.
Beneficiaries The scheme will serve residential and tourist establishments in the Mpofana Municipality and uMngeni Municipality within the uMgungundlovu District Municipality. It will also be a source of potable water for low cost housing in Bruntville and Lions River in the Mpofana and uMngeni municipalities respectively. The forecasted water demand for the Greater Mpofana BWSS is shown in Table 8.5. Assuming 100 l/person/day, the estimated number of beneficiaries from the anticipated initial capacity of 20 Ml/day may be 200 000 people.

429
Table 8.5 Water forecasts for the Greater Mpofana BWSS.
Mpofana Municipality 2013 2043
Mooi River 7.3 15.24
Weenen & Msinga 0.00 8.00
Rosetta 0.4 0.85
Mpofana Total 7.7 24.10
Mngeni Municipality 2013 2043
Nottingham Road 1.50 13.6
Mount West & Currys Post 0.0 5.1
Balgowan & Lions River 0.0 14.8
Mngeni Total 1.5 33.5
Total Volume - Expected 9.2 57.6
Implementation The project will be phased with the first phase consisting of a 20 Mℓ/day WTP at Spring Grove Dam and separate pumping mains to new reservoirs at Bruntville (12 Mℓ) and Nottingham Road (10 Mℓ). The total cost for Phase 1 is anticipated to be R 639 million as at November 2016. Construction completion is expected to be in 2019.

430
8.4 Mgeni System
8.4.1 ‘251 Raw Water Pipeline: Midmar Dam to Midmar WTP
Planning No. 105.0
Project No. UI03021A
Project Status Commissioning Stage
Project Description The Midmar Water Treatment Plant (WTP) draws raw water from Midmar Dam. Water from the dam is supplied under pumping via the ‘251 Pipeline. The ‘251 Raw Water Pipeline is a single, 1 626 mm OD (1 544 mm ID), cement-lined, steel pipe consisting of two sections. The first section, from the dam outlet works to the raw water pump station is approximately 550 m long. The second section, from the raw water pump station to the WTP is approximately 2 450 m long. The Midmar WTP currently has a design capacity of 250 Mℓ/day and is currently being upgraded to 375 Mℓ/day (Section 8.4.2). Three pump sets are currently installed in the raw water pump station (2 duty + 1 standby). A fourth pump has been installed along with the Midmar WTP upgrade. With the WTP upgrade to 375 Mℓ/day, flow velocity in the single raw water pipeline will increase to 2.3 m/s. As this pipeline is the only raw water supply into Midmar WTP, it is a strategic asset and its overall risk rating is thus high. DWS has modified the Midmar Dam outlet works and pipework to provide a second outlet pipeline and cross-connections at the dam wall. This intervention has minimised the risk of failure of the dam outlet works. Umgeni Water, in mitigating the overall risk of the raw water transfer between the dam and the Midmar WTP, is currently commissioning the second raw water transfer pipeline between the outlet and the WTP (Figure 8.15). Pumping efficiencies will also be achieved by installing this new pipeline. Key information on this project is summarised in Table 8.6.
Table 8.6 Project information: ‘251 Raw Water Pipeline from Midmar Dam to
Midmar WTP.
Project Components: 1600 mm diameter raw water pipeline from dam outlet to Midmar WTP. 1400 mm diameter through pipe jacks. Fourth raw water pump.
Capacity: 395 Mℓ/day
Institutional Arrangements The new infrastructure will be owned, operated and maintained by Umgeni Water.

Figure 8.15 General Layout of the ‘251 Raw Water Pipeline: Midmar Dam to Midmar WTP.

432
Beneficiaries The scheme will serve the ’61 System which supplies potable water to uMngeni, The Msunduzi, uMgungundlovu and eThekwini Municipalities. Assuming 200 l/person/day, the estimated number of beneficiaries from the anticipated capacity of 395 Ml/day may be 1 975 000 people.
Implementation The project will be constructed over two years and is estimated to cost R144 million as at November 2016. Construction started in June 2015 and the anticipated completion date for the project is June 2017.

433
8.4.2 Midmar Water Treatment Plant Upgrade
Planning No. 105.0
Project No. UI150A
Project Status Construction
Project Description The Midmar Water Treatment Plant (WTP), which was commissioned in 1996, draws raw water from Midmar Dam. Water from the dam is supplied under pumping via the ‘251 Pipeline. The Midmar WTP has a design capacity of 250 Mℓ/day and is currently operating at an AADD of around 226 Mℓ/day. With the imminent implementation of the load transfer of the Western Aqueduct demand onto the Upper Mgeni System, it is necessary to upgrade the capacity of Midmar WTP. The WTP is being upgraded to 390 Mℓ/day so that the combined capacity of the Midmar WTP and D.V. Harris WTP will utilise the maximum yield (at a 99% assurance level) available from Midmar Dam combined with the MMTS-2. See Figure 8.16 for layout and key information on this project is summarised in Table 8.7.
Institutional Arrangements The Midmar WTP is situated in uMngeni Local Municipality. Umgeni Water will own, operate and maintain the upgraded Midmar WTP and will sell potable water from this system to the Msunduzi Local Municipality, eThekwini Municipality and uMgungundlovu District Municipality as per existing bulk water supply agreements.
Beneficiaries The scheme will serve the ’61 System which supplies potable water to Msunduzi, uMgungundlovu and eThekwini Municipalities. Assuming 200 l/person/day, the estimated number of beneficiaries from the anticipated capacity of 375 Ml/day may be 1 875 000 people.
Implementation The project will be constructed over two years and is estimated to cost R 245 million at November 2016 prices. Anticipated project completion is end 2017.
Table 8.7 Project information: Midmar WTP Upgrade.

434
Project Components: WTP capacity upgrade from 250 Mℓ/day to 390 Mℓ/day. Design, installation, testing and commissioning of: Dosing Equipment
New dosing points at 200 s point on new rising main for Bentonite, PAC and Chlorine and associated pipework, valves and fittings.
Three new 1400 ℓ/h Bentonite dosing pumps including bursting discs.
Four new 90 ℓ/h Polyelectrolyte dosing pumps and one new recirculation pump.
Two new 20 m3 Polyelectrolyte storage tanks.
Two new 1000 mm inline static mixers.
One new ammonia dosing pump.
Chlorination equipment.
Chlorine scrubber.
Tanker connection.
Weigh bridge. Pulsator Clarifier
Vacuum fan.
Lamella packs.
Clarified water launders.
Pipework, valves, fittings and specials.
Backwash balancing tank.
Coarse bubble diffused air system.
Flow meter and motorised valve.
Relocation of grit trap compressor. Clariflocculators
Pipework, valves and specials.
Two rotating half bridge scrapers (upon which the vertical shaft mixers are installed).
Eight slow speed vertical shaft paddle mixers.
Two flocculation zones. Gravity Thickener
Distribution pipework and valves.
Fixed half bridge.
Picket fence mixer and scraper with motor.
Two progressive cavity sludge pumps.
Two thin sludge pumps. Centrifuge
The complete centrifuge assembly with all its instrumentation, fixings and fittings.
Distribution pipework and valves.
Discharge chute.
Capacity: 375Mℓ/day.

Figure 8.16 General Layout of Midmar WTP upgrade.

436
8.4.3 Howick-West Reservoir Upgrade
Planning No. 105.03
Project No. UI0613A
Project Status Detailed Design
Project Description Potable water is supplied to the Howick-West Reservoir Complex from Midmar WTP via the Mills Falls Pump Station along a 700 mm NB diameter steel pipeline. The current total storage capacity at the Howick-West Reservoir Complex is 16.5 Mℓ and serves as the distribution node for the supply area (Figure 8.17). Water is then pumped from the Howick-West Reservoir Complex to Mpophomeni and Groenekloof Reservoirs via the Howick-West Pump Station along a 250 mm and a 600 mm diameter steel pipeline respectively. The Groenekloof Reservoir Complex, with a current total storage capacity of 17.27 Mℓ, serves as a further distribution node from where the water is pumped to the Greater Vulindlela area and gravity-fed to the Sweetwaters and Blackridge terminal reservoirs. The uMngeni Local Municipality is in the process of implementing a low-cost housing development in the Mpophomeni supply area and middle to high-income residential development in the Garlington area. These proposed developments, combined with the natural growth of the Howick-West Supply System, will place undue stress on the Howick-West Reservoir Complex to sustain the projected demand. To sustain the current and future demand off the Howick-West Reservoir Complex, it is necessary to augment the existing storage capacity at the Howick West Reservoir Complex. The storage requirement is based on the following reservoir sizing parameters:
Storage for reticulation supply: 36 hours.
Storage for Mpophomeni Reservoir supply: 15 hours.
Storage for Groenekloof Reservoir supply: 8 hours. Groenekloof Reservoir is in itself a balancing reservoir therefore, to avoid “double accounting” of storage required for the Groenekloof demand, this balancing demand will be shared between the reservoirs.

Figure 8.17 General layout of the proposed Howick-West Reservoir.

438
Table 8.8 Storage Requirement at Howick-West Reservoir.
Supply Demand in 2028
(Mℓ/day) Time (hours)
Required Storage (Mℓ)
Reticulation 4.5 36 6.8
Mpophomeni 10.6 15 6.6
Groenekloof 48.0 8 16.5
TOTAL STORAGE REQUIREMENT 30.0
The determination of the storage requirement at Howick-West Reservoir is indicated in Table 8.8. Based on storage requirements and the demand projection, the upgrade of storage at Howick West Reservoir was already required in 2015. Reservoirs are sized for a 10 year future demand, hence the upgraded storage requirement is therefore determined on the 2025 demand. If projections materialise as expected, then the current storage of 16.5 Mℓ should be increased by adding a new 16 Mℓ reservoir. This will bring the total storage up to 32.5 Mℓ. Key information on this project is summarised in Table 8.9.
Table 8.9 Project information: Howick-West Reservoir Upgrade.
Project Components: New reservoir
Capacity: 16.0 Mℓ
Institutional Arrangements The new Howick-West Reservoir will be owned, operated and maintained by Umgeni Water.
Beneficiaries The upgrade to Howick-West Reservoir serves as a balancing reservoir that will indirectly serve Vulindlela, Blackridge and Sweetwaters in The Msunduzi Municipality and Mpophomeni and Hilton in the uMngeni Municipality. Assuming 200 l/person/day, the estimated number of beneficiaries from the anticipated capacity of 16 Ml/day may be 80 000 people.
Implementation The construction duration of this project is anticipated to be one year. The total cost is estimated to be R56 million. This project has been shifted outside the 5-year Capex window depending on whether the current drought will be broken over the next two rainfall periods.

439
8.4.4 Groenekloof Reservoir Upgrade
Planning No. 105.39
Project No. UI65
Project Status Design
Project Description The Groenekloof Reservoir serves as a balancing reservoir for Vulindlela, Sweetwaters and Blackridge (Figure 8.18). The current demand out of Groenekloof Reservoir is 23 Mℓ/day. This demand is expected to increase to 34 Mℓ/day by 2030 when 24 Mℓ of storage will be required. The current capacity of the reservoir is 17 Mℓ. The reservoir capacity will be over allocated by 2018. An additional 10 Mℓ storage will then be required. Key information on this project is summarised in Table 8.10.
Table 8.10 Project information: Groenekloof Reservoir Upgrade.
Project Components: New 10 Mℓ reservoir.
Capacity: 10 Mℓ.
Institutional Arrangements The new reservoir will be owned, operated and maintained by Umgeni Water.
Beneficiaries The upgrade to Groenekloof Reservoir will benefit consumers in the uMngeni and the Msunduzi local municipalities. Assuming 200 l/person/day, the estimated number of beneficiaries from the anticipated capacity of 10 Ml/day may be 50 000 people.
Implementation The construction duration of this project is anticipated to be one year. The total project cost (including Vulindlela BWSS) is estimated to be R280 million. This upgrade may be required in 2018 if demands increase at projected rates. Project construction completion is currently planned for the end of 2018.

Figure 8.18 General layout of the Groenekloof Reservoir Upgrade.

441
8.4.5 Umbumbulu Pump Station
Planning No. 105.37
Project No.
Project Status Pre-Feasibility
Project Description Supply to Greater Eston and Umbumbulu is via a 450 mm diameter pipeline. The capacity of this pipeline is restricted to 15 Mℓ/day due to the ground level profile along the pipeline route. The flow is restricted to ensure that the hydraulic grade line is at least 20 m above a high point at Stoney Ridge. The current flow in this pipeline is 11 Mℓ/day. uMgungundlovu District Municipality supplies the Greater Eston area with potable water from this pipeline. This, together with the natural growth in Umbumbulu, will mean that the flow in this pipeline could reach capacity by 2017/2018. A booster pump station would increase the capacity of the pipeline to serve future water demands. A static hydraulic analysis indicates that the pump station be situated close to the DN450 off-take to Umbumbulu (Figure 8.19).
Table 8.11 Project information: Umbumbulu.
Project Components: Designed to deliver approximately 23 Mℓ/day at 98 m pumping head. This requires four (4) pumps, three duty and one stand-by.
Capacity: 23 Mℓ/day.
Institutional Arrangements Umgeni Water will own, operate and maintain the pump station and will sell potable water from this system to uMgungundlovu District Municipality and eThekwini Municipality as per existing bulk water supply agreements.
Beneficiaries The beneficiaries will be the Greater Eston region, including the Umbumbulu and the Adams Mission communities. Assuming 100 l/person/day, the estimated number of beneficiaries from the anticipated capacity of 23 Ml/day may be 230 000 people.
Implementation The construction duration of this project is anticipated to be one year. The total cost is anticipated to be R 125 million in January 2016.

Figure 8.19 General layout of the Umbumbulu Pump Station Upgrade.

443
8.4.6 uMshwathi Regional Bulk Water Supply Scheme
Planning No. 105.22
Project No. UI99
Project Status Construction
Project Description The greater Wartburg and Dalton areas including Albert Falls, Mpolweni, Swayimana, Trust Feeds, Schroeders, Cool Air and a number of smaller consumers on route are presently supplied with bulk water from the Wartburg sub-system (part of the Upper Mgeni System, see Section 6.2.1) through the D.V. Harris WTP which feeds Claridge Reservoir. The purpose of the uMshwathi Regional Bulk Water Supply Scheme (RBWSS) is to increase of the capacity of the Wartburg sub-system to meet the increasing demands from existing consumers and to provide a sustainable bulk water supply to the communities of Efaye and Ozwathini. The project is being implemented in four phases. Figure 8.20 shows a spatial layout of Phases 1 to 3 of the uMshwathi RBWSS. Phase 4 is described in Section 8.6.1. The existing Wartburg Pipeline (also known as the ’69 Pipeline), is constructed of steel and is bitumen coated and cement mortar lined. This pipeline is approximately 26 km long and varies from 300 mm to 250 mm in diameter The new 850 mm diameter steel pipe from Claridge Reservoir to Wartburg Reservoir was constructed as part of Phase 1. The components of the project included a 26 km Pipeline, a booster pump station and 8 Ml Reservoir at Wartburg. The New Wartburg Pipeline ties into the outlet of the existing 50 Ml Claridge Reservoir. In addition this pipeline will supply the rural areas of Efaye, Ozwathini and Ndwedwe (Section 8.6.1). A 15.5 km long, 711mm OD mm diameter pipeline was constructed as Phase 2 to supply potable water from the new 8Ml Wartburg Reservoir to the new 10Ml Dalton Reservoir. This pipeline will provide the long term capacity that is required for the New Hanover, Cool Air, Dalton, Efaye, Ozwatini, Harburg and Glenside areas. An off-take to the existing Cool Air reservoir has been installed to augment the existing pipeline if this becomes necessary or as a main supply should it be decided to decommission the existing pipeline and Dingle Pump Station. The construction of Phase 3 of the project is complete and is waiting hydraulic testing at the time of this report. Phase 3 consists of:
A 10.7 km long, 660 mm OD mm diameter pipeline from the proposed new 10Ml Dalton Reservoir to the Efaye Off-take.
A 14.7km long 300mm OD pipeline off-take to Efaye.
A 21.7km long, 610mm OD pipeline from the Efaye off-take to Ozwatini.
A pump station at CH 450m on the Efaye pipeline.
A pump station at CH 19500m on Efaye off-take to Ozwatini Pipeline. The Phase 3 pipelines will provide the long term capacity that is required for the greater Efaye and Ozwatini areas as well as the Noodsberg Sugarmill, the towns of Harburg and Glenside as well as the

444
Montebello Hospital. The proposed pipeline route is generally parallel to the R614 and the Fawn Leas to Mt Elias Road. The extent of the infrastructure constructed to supply the existing consumers, and to enable supply to Efaye, Ozwathini, and central Ndwedwe is summarised in Table 8.12. Table 8.12 Project information: uMshwathi Regional Bulk Water Supply Scheme.
Project Components: Phase 1
27km DN850, pipe supply contract and pipe yard preparations.
Construction of 27 km of 850DN solvent free epoxy lined and Polyurethane coated steel pipe from Claridge/Belfort to Wartburg Reservoirs.
Construction of 2 Pipe jacks under the R33 and Ottos Bluff.
Construction of 2 sleeved railway crossings, one is Claridge and the other in the dis-used Rail line in Wartburg.
Construction of 7 inline Isolating valve chambers.
Construction of 22 scour valve chambers.
Construction of 53 air valve chambers.
Construction of 3 meter chambers.
1.35MW Pump station.
8Ml Reservoir at Wartburg. Phase 2
Construction of 16 km of 700DN solvent free epoxy lined and Polyurethane coated steel pipe from Wartburg to Dalton.
Construction of 2 Pipe jacks under the R33 and Ottos Bluff.
Construction of 2 sleeved railway crossings.
Construction of 2 inline Isolating valve chambers.
Construction of 7 scour valve chambers.
Construction of 12 air valve chambers.
Construction of 2 meter chambers.
1.25MW pump station.
10Ml Reservoir at Dalton. Phase 3
Construction of 29 km of 700DN – DN400 solvent free epoxy lined and Polyurethane coated steel pipe from Dalton via Fawn Leas to Efaye .
Construction of 18 km of 700DN solvent free epoxy lined and Polyurethane coated steel pipe from Fawn Leas to Ozwathini.
Construction of 3 Pipe jacks under the R614.
Construction of 1 sleeved railway crossings.
Construction of 2 inline Isolating valve chambers.
Construction of approximately 30 scour valve chambers.
Construction of approximately 65 air valve Chambers.
Construction of 4 meter chambers.
0.15MW Pump station.
12Ml Reservoir at Ozwathini. Phase 4
See Section 8.6.1
Capacity: 50 Ml/day

445
Institutional Arrangements The new infrastructure will be owned, operated and maintained by Umgeni Water and will be part of the Bulk Supply agreement with uMgungundlovu District Municipality and iLembe District Municipality.
Beneficiaries This project will initially benefit the residents of uMshwati Local Municipality and Ndwedwe Local Municipality. This scheme is estimated to serve approximately 324 433 people in 47 405 low income households.
Implementation The phases of the project are anticipated to be completed as follows:
Phase 1: December 2016
Phase 2: August 2017
Phase 3: May 2018
Phase 4: June 2019 The total cost is estimated to be R 2.3 billion at 2016 prices. Umgeni Water has submitted an application for Regional Bulk Water Infrastructure Grant (RBIG) as source funding to ensure the financial viability of this project. The RBIG funding has been tentatively approved and UW is waiting for final approval from DWS.

Figure 8.20 General layout of the uMshwathi Regional BWSS.

447
8.4.7 Wartburg to Bruyns Hill Pipeline
Planning No. 105.37
Project No.
Project Status Construction
Project Description The existing Wartburg to Bruyns Hill Pipeline consists of 5.8 km of 250 mm diameter pipe from Wartburg Reservoir to the Bruyns Hill Pump Station. Thereafter, there are two pipelines (each are 3.6km of 250mm diameter pipes) from the pump station to Bruyns Hill Reservoir. The system needs to be augmented due to:
Increased growth in demand within the current supply zone of Swayimane;
Proposed housing developments on the fringes of Swayimane; and
A new supply node into the Southern Ndwedwe area within the iLembe District Municipality. iLembe District Municipality has identified the Wartburg System as the most suitable source of water to feed into the Southern Ndwedwe area.
The projected demand is expected to be 9 Ml/day by 2035. A 450 mm diameter steel pipe will be constructed to meet the projected demand (Figure 8.21). In addition, a 0.5 MW booster is currently being constructed in the Wartburg Reservoir Complex.
Institutional Arrangements The new infrastructure will be owned, operated and maintained by Umgeni Water and will be part of the Bulk Supply agreement with uMgungundlovu District Municipality.
Beneficiaries This project will initially benefit the residents of uMshwati Local Municipality and Ndwedwe Local Municipality. This scheme is estimated to serve about 106 000 people in 13 000 low income households.
Implementation The infrastructure is required by 2017, to meet the planned housing projects in the supply area. Construction has commenced. The total cost is estimated to be approximately R 78.5 million at 2016 prices.

Figure 8.21 Wartburg to Bruyns Hill Pipeline.

449
8.4.8 Vulindlela Upgrade
Planning No. 105.42
Project No. UI0901A
Project Status Detailed Design
Project Description The Vulindlela Bulk Water Supply Scheme (BWSS) was handed over to the Msunduzi Municipality (MM) in 2013 as part of Umgeni Water’s rationalization strategy. Umgeni Water’s responsibility ends at the sales meters downstream of the Vulindlela Pump Station. The Vulindlela area has suffered from an insufficient and interrupted water supply. The Msunduzi Local Municipality requested Umgeni Water look at a more optimal bulk supply option for the Vulindlela BWSS to ensure an improved supply. The Vulindlela system (Figure 8.22) receives potable water from the Groenekloof Reservoir Complex (TWL of 1210.6 mASL) through two pumping systems via two bulk supply systems. The high level pumping system feeds two command reservoirs, namely, Reservoir 2 (TWL of 1410.2mASL) and Reservoir 5 (TWL of 1493.93mASL) and two additional reservoirs, Reservoir 3 and Reservoir 4. The low level pumping system only feeds command Reservoir 1. Potable water is then gravity fed from Reservoir 2 to Reservoirs 13 to 19, whilst potable water is gravity fed from Reservoir 5 to Reservoirs 6 to 12.
Figure 8.22 General layout of the Vulindlela System.
The Groenekloof Pump Station consists of three pumps, each with a design duty of 8.64 Ml/day at a generated head of 300 m. The current operating philosophy is for two pumps as duty and one as

450
standby, thus having a total duty capacity (theoretical) of 17.28 Ml/day. The pumps “hunt” on their curves due to the fact that they have to pump against two different system resistance curves along the same pipeline in their supply of water to Reservoir 2 and Reservoir 5. Key information on this project is summarised in Table 8.13 and illustrated in Figure 8.23
Table 8.13 Project information: Vulindlela Upgrade.
Project Components: Upgrade the high lift pumping system at Vulindlela Pump Station by installing 3 x 22 Ml/day pump sets (2 x operating and 1 x standby).
Augment existing rising main and construct a 750mm diameter pipeline of 11 km in length from Vulindlela Pump Station to Reservoir 2.
Construct the Pumpstation at Reservoir 2 consisting of 2 x 18 Ml/day pump sets (1 x operating and 1 x standby).
Construct one 15 Ml Reservoir (25 Ml required in total) at Reservoir 2 site as additional storage to the existing 10 Ml reservoir.
Construct a back-feed pipeline of 300mm diameter with a length of 6 km, from Reservoir 5 to supply Reservoir 3 and Reservoir 4.
Construct a 10Ml Reservoir at Groenekloof Reservoir Complex to comply with Umgeni Water’s Reservoir operating philosophy.
Capacity: 45 Mℓ/day.
Institutional Arrangements The Umgeni Water BWSS will be operated and maintained by Umgeni Water.
Beneficiaries The upgrade to the BWSS will benefit consumers within the Msunduzi Municipality and Vulindlela community. Assuming 100 l/person/day, the estimated number of beneficiaries from the anticipated capacity of 45 Ml/day may be 50 000 people.
Implementation The construction duration of this project is anticipated to be four years. The total cost is estimated at R280 million including the Groenekloof Reservoir as 2016 prices. The anticipated construction completion date is the end of 2018.

Figure 8.23 Vulindlela Upgrade.

452
8.4.9 Table Mountain Upgrade
Planning No. 105.41
Project No.
Project Status Feasibility
Project Description uMgungundlovu District Municipality requested Umgeni Water to consider the augmentation of the existing Table Mountain supply infrastructure to meet current and future demand. The initial assessment indicated that the current infrastructure is inadequate to sustain current demand. The hydraulic analysis indicated that significant augmentation is required to meet current and future demands. Complete upgrade of the pump station, the bulk supply pipeline and a 4 Ml/day reservoir is required to ensure an improved supply and greater assurance of supply over the next 20 years. A pre-feasibility study identified two possible scenarios to augment the supply to the Greater Table Mountain area. Scenario 1 entails the upgrade of the Lower Glen Lyn Break Pressure Tank to a 2 Ml storage facility, replacing the existing Table Mountain pump sets with three new pump sets to meet the current and projected demand and construct a new 4 Ml Reservoir at Table Mountain. Scenario 2 entails a direct feed off a proposed new 23 Ml Msunduzi Municipality Whispers Reservoir thus eliminating the need of augmenting the Glen Lyn Break Pressure Tank. The other components, i.e., the pump station and Table Mountain Reservoir would be as per Scenario 1. Msunduzi Municipality in February 2017 informed Umgeni Water that they are revising their Water Master Plan due to the changes in the demarcation of boundaries. The site for the proposed 23 Ml Whispers Reservoir now falls within uMshwati Local Municipality. Msunduzi Municipality is negotiating with uMshwati Local Municipality to purchase the land for the construction of the proposed reservoir. The timing is uncertain. uMgungundlovu District Municipality requested that Umgeni Water meet the 3 Ml/day demand over the next 5 years. In May 2017, Umgeni Water together with uMgungundlovu District Municipality and Msunduzi Municipality agreed to implement some of the recommendations as per Option 1 for the upgrade of the Table Mountain Bulk Water Supply Scheme (BWSS) to meet a demand of 3.0 Ml/day. This will entail the construction of a 300 mm NB, 500 m long suction pipeline, the installation of 2 x 3.2 Ml/day pump sets and the upgrade of the existing switchgear. The cost for the partial upgrade will be attached to the asset management maintenance budget. The anticipated commissioning of this portion of the upgrade is June 2018. Key information on this project is summarised in Table 8.14 and Figure 8.24.

Figure 8.24 Table Mountain Upgrade.

454
Table 8.14 Project information: Table Mountain Upgrade.
Project Components: 350 mm diameter pipeline, 4.4 km in length. 4 Ml Reservoir.
Capacity: 4 Ml.
Institutional Arrangements The infrastructure from the buy-back meter will be owned, operated and maintained by Umgeni Water.
Beneficiaries The upgrade to the BWSS will benefit consumers within the Greater Table Mountain area with estimated population of 13 500.
Implementation The construction duration of this project is anticipated to be three years. The total cost is estimated to be R100 million at 2016 prices.

455
8.4.10 Hydropower unit at the Mpofana outfall
Planning No. 609.2
Project No.
Project Status Detailed Feasibility
Project Description A Detailed Feasibility Study (DFS) to assess the viability of a Hydropower Unit on the Mooi-Mgeni Transfer Scheme (MMTS) was initiated in 2013. A cost benefit model was developed to investigate the benefit of installing larger pipe sizes under the second phase of the MMTS in the gravity section of the pipe from the Gowrie Break Pressure Tank to the Mpofana Outfall Site (Figure 8.25). It was identified that a 914 mm diameter steel pipe had the highest Internal Rate of Return (IRR), and therefore is the optimal size for installation. The residual head available for power generation at the outfall site under full flow conditions for a new pipe scenario is 148 m, and under aged pipe conditions is 128 m. The DFS has shown that a dual turbine powerhouse at the Mpofana Outfall Site, with twin turbo type turbines, each capable of discharging 2.25 m3/s at 148 m head, can produce 2.698 MW each (5.396 MW total). Electrical transmission of the power generated will be fed back into the National Grid at the Gowrie Substation in Nottingham Road. The recoupment of costs will be offset against the power generated and billed to Umgeni Water, for the MMTS, by Eskom. A hydropower unit on the MMTS will recover between 19.7 and 16.8 GW.hr/annum of power, based on MMTS operation for 6 months of the year at 83% efficiency, and depending on the age of the supply pipelines.
Institutional Arrangements The new infrastructure will be owned, operated and maintained by Umgeni Water.
Beneficiaries The MMTS Hydropower Project is economically feasible with an expected payback period of 3 years. Thereafter the project will save Umgeni Water and hence consumers an estimated R10 million per annum at the current electricity tariff. This saving in the operating costs can be offset in the tariff, which will benefit all consumers within Umgeni Water’s area of jurisdiction.
Implementation The total cost is estimated to be approximately R 79 million as at 2016 prices. Umgeni Water is currently negotiating with the Department of Water and Sanitation for access to their infrastructure. Once this permission is received then the hydropower unit can be designed and constructed.

Figure 8.25 Layout of the proposed hydropower unit at the Mpofana Outfall.

457
8.5 South Coast System
8.5.1 Nungwane Raw Water Pipeline
Planning No. 302.5
Project No. UI0657A
Project Status Construction (Tender awarded December 2016)
Project Description
Water demands from the Amazimtoti WTP supply area have consistently increased over the years with the AADD (12-month moving average) as at November 2016 equalling 73 Mℓ/day. The sustainability of the growing demand and the efficient utilisation of the existing infrastructure prompted the implementation of the South Coast Augmentation Booster Pump Station. The implementation of the South Coast Augmentation Booster Pump Station will only be able to sustain the total projected demand off Amanzimtoti WTP until the year 2020 with the support of the treatment of water at the Amanzimtoti WTP. The existing 450 mm diameter Nungwane Raw Water Pipeline (Figure 8.26), which supplies Amanzimtoti WTP with raw water, is in a poor condition due to the corrosive action by sulphur-reducing-bacteria and this pipeline now has to be replaced. The South Coast Augmentation Booster Pump Station may be used in the short to medium term in order to augment the potable water demands from the Amanzimtoti WTP whilst the raw water pipeline to the WTP is replaced. Key information on this project is summarised in Table 8.15.
Table 8.15 Project information: Nungwane Raw Water Pipeline.
Project Components: New 450 mm diameter, 13.6 km long steel pipeline
Capacity: 20 Mℓ/day
Institutional Arrangements The Nungwane Raw Water Pipeline will be owned, operated and maintained by Umgeni Water.
Beneficiaries The replacement of the existing Nungwane Raw Water Pipeline will benefit the residents of the Upper and Middle South Coast regions. Assuming 200 l/person/day, the estimated number of beneficiaries from the anticipated capacity of 20 Ml/day may be 100 000 people.
Implementation The pipe supply contract was completed in October 2015 and a separate construction tender eventually awarded in November 2016 (following an appeal process). Construction should commence by April 2017 following contract price escalation negotiations. The anticipated construction completion date is now November 2018 (original planned completion date was March 2017). The total cost is estimated to be R105 million.

Figure 8.26 General layout of the Nungwane Pipeline.

459
8.5.2 South Coast Pipeline 2b – Kelso to Malangeni
Planning No. 305.09
Project No. UI0710A
Project Status Construction (Tender to be awarded Mid-2017)
Project Description The South Coast Pipeline (SCP) Project was initiated to extend the supply of water to the South Coast Region. The project is implemented in a phased approach, with Phase 1 and Phase 2a completed. The South Coast Phase 2b project will consist of four components:-
Construction of a 2.7 km pipeline from the off-take chamber at Scottburgh South Reservoir (i.e. end point of SCP-1) to the start of the existing Kelso-Pennington pipeline (i.e. SCP-2a).
Design and construction of a 5.35 km pipeline from Kelso off-take point (i.e. end point of SCP-2a) to a termination point at the inland side of the N2 (i.e. Malangeni off-take), west of the Umdoni Reservoir.
Design and construction of the Mzinto River bridge crossing (550 m).
Design and construction of a 635 m tie-in pipeline to Umdoni Reservoir.
Kelso to Malangeni Off-take Pipeline
The South Coast Phase 2b (SCP-2b) route will tie-in to the South Coast Phase 2a pipeline and roughly follows the SANRAL servitude along the N2 south to Umdoni. This pipeline consists of a 800 mm diameter NB steel gravity pipeline with associated chambers and forms two parts extending southwards (Figure 8.27). This route includes minor stream crossings and a major bridge crossing over the Mzinto River. The pipeline will connect to the Mzinto River Bridge crossing on both the north and south banks of the bridge abutments. An off-take will be provided for a connection to the Umdoni Reservoir in the vicinity of the Malangeni off-take.
Mzinto River Bridge Crossing
This river crossing is over 550 m long and the valley is approximately 150 m deep at the centre of the bridge. Permission has been obtained from SANRAL to attach the required pipe to the deck of the N2 Umzinto River Bridge. This will provide a considerable saving to the overall project and will minimize any environmental impacts of crossing through the river or of the construction of a new pipe bridge.
Off-take to Umdoni Reservoir Pipeline
The pipeline will be designed and constructed on behalf of Ugu DM. Provision will need to be made for a booster pump station when the SCP is extended further to Hibberdene (i.e. SCP-3).
Mnini Pump Station
To sustain the demand downstream of Quarry Reservoir the level in the reservoir should be maintained between 70% and 90%. This would require two pumps operating during peak times. It is recommended that a third pump be installed at Mnini Pump Station so that a standby pump is available.

Figure 8.27 General layout of the proposed South Coast Pipeline Phase 2b.

461
The remainder of the South Coast Pipeline will ultimately be extended from Malangeni off-take (Umdoni) to Hibberdene once the Lower uMkhomazi Bulk Water Scheme is in place. The SCP will finally integrate with the Bhobhoyi WTP (near Port Shepstone) Supply Scheme in the vicinity of Hibberdene. The integration of the two schemes will provide a measure of operational flexibility. It will serve as a contingency for drought situations in either system. The Lower uMkhomazi scheme will provide an assured supply of water to the area without being reliant on the Lower Mgeni System. Key information on this project is summarised in Table 8.16.
Table 8.16 Project information: South Coast Pipeline Phase 2b.
Project Components: Section 1 – 2.7 km, 800 mm nominal diameter steel pipeline (7.8 mm wall thickness) including all ancillary works.
Section 2a - 4.96 km, 800 mm nominal diameter steel pipeline (7.8 mm wall thickness) including all ancillary works.
Section 2b – Umzinto River bridge crossing – 390 m 800 nominal diameter steel pipeline (9.3 mm wall thickness to provide an additional factor of safety thereby reducing the likelihood of pipeline failure on this section of pipeline)
Capacity: 37.5 Mℓ/day (8.34 Mℓ/day Umdoni Reservoir tie-in)
Institutional Arrangements The bulk supply infrastructure of the Kelso to Malangeni link will be owned, operated and maintained by Umgeni Water, who will sell potable water from this system to Ugu District Municipality as per the Bulk Water Supply Agreement.
Beneficiaries The construction of the South Coast Phase 2b pipelines will alleviate the pressure on the Umzinto and the Mtwalume water treatment plants and supply system by supplying potable water directly to communities within the Umdoni Municipality. Assuming 200 l/person/day, the estimated number of beneficiaries from the anticipated capacity of 37.5 Ml/day may be 187 500 people.
Implementation Detailed design stage has been completed. The construction period is estimated at 52 weeks. The pipe supply tender to be advertised end January 2017 and a separate construction tender to be advertised end February 2017. Should procurement be completed by February 2017, the anticipated construction completion date is April 2018.

462
8.5.3 Mhlabatshane Bulk Water Supply Scheme Phase 2
Planning No. 305.5
Project No. UI0712A
Project Status Detailed Design (Tender to be awarded Mid-2017 )
Project Description Umgeni Water implemented Phase 1 of the Mhlabatshane Bulk Water Supply Scheme (Section 6.4.1) as part of a larger regional scheme development by Ugu District Municipality, aimed at reducing water services backlogs in certain rural areas in the Umzumbe and Ray Nkonyeni Local Municipalities. This scheme extends from Phungashe, within the Nhlangwini Tribal Authority in the north, to Assisi Mission, within the Shabeni Tribal Authority, in the south. It falls mainly within the Umzumbe Local Municipality, is bounded by Harry Gwala District Municipality in the north, the Mzimkulu River in the west and south, the Umzumbe River in the east, and the Shabeni and KwaMadlala areas of the Ray Nkonyeni Local Municipality in the south. When water demands from this scheme exceed the firm yield of the Mhlabatshane Dam, then the intention is to develop the second phase of the project (Figure 8.28). Water will be abstracted directly from the Mzimkhulu River, pumped to the WTP (which will need to be upgraded from 4 Ml/day to 8 Ml/day) and then fed into the reticulation system via a command reservoir. Key project information is summarised in Table 8.17.
Table 8.17 Project information: Mhlabatshane BWSS Phase 2.
Project Components: Abstraction weir and abstraction works on the Mzimkulu River, with de-silting mechanism.
Raw water pump station and associated electrical and mechanical works.
Raw water rising main.
Raw water intermediate/booster pump stations and associated electrical and mechanical works.
Balancing tanks / reservoirs.
The existing 4 Ml/day water treatment works is to be upgraded to an 8Ml/day plant, which includes a clear-water pump station
Command Reservoir increase from 2 Ml to 4 Ml in storage capacity
Capacity: 8 Ml/day in total
Institutional Arrangements Umgeni Water will own, operate and maintain the bulk water supply components of the Scheme. Ugu District Municipality will own, operate and maintain all reticulation components of the Scheme.
Beneficiaries Phase 1 serves approximately 67,000 people and it is anticipated Phase 2 will serve 100,000 people in total.

Figure 8.28 General layout of the Mhlabatshane BWSS Phase 2.

464
Implementation The total estimated capital cost for Phase 2 is R500 million (2016 base year costs). The detailed feasibility and preliminary design stage of the project was completed in 2016. The project will now move to the detailed design phase only; with an anticipated hiatus before proceeding to the construction phase. Use of the ‘float’ in the key milestone timeline will alleviate the inherent risks associated with the Phase 2 commissioning date of 2022. This risk is attributed to the uncertainty in demand growth combined with the relative flat demand curve which is close to the current available water supply for Phase 1 (Figure 8.29). Any marginal growth in water demand will significantly shorten the time to commence with construction.
Figure 8.29 Water Balance Mhlabatshane BWSS.

465
8.5.4 Lower uMkhomazi Bulk Water Supply Scheme
Planning No. 305.7
Project No. UI0701A
Project Status Detailed Design (Tender to be awarded Mid-2017)
Project Description The Upper and Middle South Coast will need augmentation after 2017 when the water requirement is projected to exceed existing bulk water infrastructure and local resources (Figure 8.30). This proposed scheme is thus a critical solution to securing water supply for the South Coast Region.
Figure 8.30 Water Balance Upper and Middle South Coast.
An investigation at a detailed feasibility level and preliminary design was completed during 2016. The optimum configuration, sizing, phasing and costing of all infrastructures required for the proposed Lower uMkhomazi Bulk Water Supply Scheme (BWSS) have been determined (Figure 8.31).

Figure 8.31 Layout of the proposed Lower uMkhomazi BWSS.

467
The project (Figure 8.31) comprises of two abstraction weirs and works, Ngwadini Off-Channel Storage (OCS) dam and related water treatment and conveyance infrastructure located within the Lower uMkhomazi River catchment. The water supply scheme will be used to supply an estimated future AADD of 100 Mℓ/day to the Upper and Middle South Coast. In the high flow summer months, raw water will be abstracted from the uMkhomazi River and stored in a 10 million m3 OCS dam, for usage during the dry winter months. During summer the WTP will be supplied with raw water abstracted directly from the river at Goodenough. In winter, water will be released back into the uMkhomazi River and abstracted at the downstream Goodenough weir. Raw water will be pumped from this weir to a 6 hour raw water storage reservoir, and then gravity fed to the WTP. The Quarry Reservoir has been identified as the tie-in point to the South Coast Pipeline; all treated water from the WTP will be stored and distributed from this reservoir. All infrastructures will be designed to handle daily, as well as seasonal variations and peaks. Key information on this project is summarised in Table 8.18.
Table 8.18 Project components and AADD capacity for the Lower uMkhomazi BWSS.
Project Components: Ngwadini Weir (2.5 m high), abstraction and low lift pump station for the OCS dam located on the uMkomazi River.
Hydrocyclones desilting mechanisim (0.75 m3/s).
Pressurised pipeline to OCS dam (0.75 m3/s).
Ngwadini OCS Dam (10.5 million m3/annum) located adjacent to the
uMkomazi River.
Goodenough Weir (raised from 3 to 3.5 m high), abstraction and low lift pump station for the WTW located on the uMkomazi River.
Hydrocyclones desilting mechanisim (1.3 m3/s).
High lift pump station (1.3 m3/s).
Pressurised pipeline to Goodenough Reservoir (6 hours).
Gravity pipeline to WTP (1.2 m3/s).
WTP (100 Ml/day).
Gravity pipeline to Quarry Reservoir (1.2 m3/s).
Electrical sub-station (132 kV/22 kV), transmission and conveyance infrastructure.
A solution to deliver water at the lowest possible overall cost, and with the least environmental impact to the South Coast area.
Capacity: 100 Mℓ/day.
Institutional Arrangements The new infrastructure will be operated and maintained by Umgeni Water and will be part of the Bulk Supply agreement with the relevant stakeholders.
Beneficiaries This scheme will benefit the residents of the Upper and Middle South Coast regions. Assuming 200 l/person/day, the estimated number of beneficiaries from the anticipated capacity of 100 Ml/day may be 500 000 people.

468
Implementation The infrastructure is required by 2020 to meet the increasing demands within the supply area. The total cost is estimated to be R 2.9 billion (2016 base year costs). Power supply to site has been flagged as a risk that could cause unnecessary project delays and to mitigate this Umgeni Water will have to facilitate the upgrades of regional networks. The associated contributions towards the electrical conveyance infrastructure have been included in the scheme cost. The implementation programme critical path is the construction of Ngwadini Dam. However, the nature of the project offers flexibility and can deliver water, albeit with a 10% risk of non-supply, once the Goodenough abstraction weir and works, conveyance infrastructure, and the WTP are constructed. To enable this earlier delivery of water, related components of infrastructure have been grouped into practical implementation packages. Planning on the Lower uMkhomazi Bulk Water Supply Scheme is now complete. The next stages of the project are detailed design and construction. Tenders for the detailed design component of this project were advertised in January 2017. The detailed design is expected to be completed by the end of 2018. After which construction is anticipated to commence.

469
8.6 North Coast System
8.6.1 uMshwathi Regional Bulk Water Supply Scheme Phase 4
(Southern Ndwedwe Bulk Water Supply Scheme )
Planning No. 204.18
Project No. UI0701A
Project Status Detail design
Project Description The uMshwathi Regional Bulk Water Supply Scheme (RBWSS) supplies the rural hinterland east of Pietermaritzburg in KwaZulu-Natal. The Scheme will provide bulk water supply to large areas within the uMgungundlovu and iLembe WSA boundaries and will include the rural areas of Swayimane, Ozwathini, Efaye and the major part of Ndwedwe local municipality. The scheme will also supply economic activities in the areas of Appeldoorns and Marburg and will reinforce the supply to the towns of Wartburg, Dalton, Cool Air and Schroeders. Umgeni Water implemented the uMshwathi RBWSS, which is an expansion of the earlier Wartburg Bulk Water Supply (Section 8.4.6). The extension will enable economic growth and provision of social services in existing centres, whilst greatly extending the supply area into the traditional settlement areas thereby improving the quality and reliability of water supply and supporting backlog eradication. Umgeni Water completed a detailed feasibility study (DFS) for Phase 4 of the uMhwathi RBWSS (previously known as the Southern Ndwedwe BWSS) at the end of November 2015, which included a preliminary design phase (Figure 8.32). The supply area of Phase 4 comprises the central and southern parts of the Ndwedwe Local Municipality and occupies roughly 50% of the total area of Ndwedwe Municipality. Within the study area the proximity of neighbouring eThekwini and the Dube Trade Port are the major economic drivers leading to densification in the southern parts of the study area. The area immediately around Montebello Hospital is another minor growth mode. The remainder of the study area is predominantly rural in nature with dispersed settlement patterns. The DFS determined that the proposed source of water for the southern Ndwedwe area is the uMshwathi RBWSS. The uMshwathi RBWSS is supplied with water from the D.V. Harris WTP in Pietermaritzburg. One of the terminal points, the Dalton Reservoir, will be the supply node to the Nondabula and Montebello reservoirs, whereas the Bruyns Hill Reservoir, another terminal point of the uMshwathi RBWSS, will be the supply node to the Swayimane area and the western parts of the southern Ndwedwe area. The uMshwathi RBWSS design has allowed for 25 Ml/day of potable water to be available at the Nondabula Reservoir for distribution to consumers in both northern and southern Ndwedwe areas. The Bruyns Hill Reservoir, another terminal point of the uMshwathi RBWSS, will be the supply node to the Swayimane and the western parts of the southern Ndwedwe area. The design allows for 12 Ml/day of potable water to be made available at the Bruyns Hills Reservoir for distribution to consumers in the greater Swayimane area and the western parts of the southern Ndwedwe area.

470
Figure 8.32 shows an overview of the proposed infrastructure. This will ensure that all backlogs within the Greater Ndwedwe area are addressed. It will also relieve the supply of the Hazelmere BWSS by allowing a back-feed to the existing Ndwedwe Reservoir 4.
Institutional Arrangements Umgeni Water will own, operate and maintain the infrastructure of the uMshwathi RBWSS Phase 4 and will sell potable water from this system to the iLembe District Municipality as per the Bulk Water Supply Agreement.
Beneficiaries Phase 4 of the uMshwathi RBWSS will supply both rural and peri-urban settlement areas. Stats SA 2011 Census results and the Eskom 2011 building count were used to estimate the design population. For ease of planning, population estimates were determined for individual reservoir supply zones in the study area. The population that will be supplied by this scheme is presented in Table 8.19.
Table 8.19 Supply from uMshwathi BRWSS Phase 4
Reservoir Zone Eskom 2011
Building Count 2011 Estimated
Population 2011 Adjusted
Population 2045 Estimated
Population
Nodabula (Direct supply to consumers) 347 2778 3008 4219
Esigedleni Main 430 3440 3502 4912
Esigedleni Res No 1 124 992 992 1391
Esigedleni Res No 2 204 1632 1632 2289
KwaHlope Res No 3 31 248 248 348
KwaHlope Res No 2 564 4512 4512 6328
Mgazini 188 1504 1504 2109
KwaSonkomba Res No 1 1439 11512 11780 16522
Ndwedwe Res 5 1709 13672 16539 23197
Matholamnyama 492 3936 4087 5704
KwaSonkomba Res No 2 885 7080 9440 13240
Ndwedwe Res 3 1129 9032 11587 16252
Ndwedwe Res 4 869 6952 7475 10484
Montabello 441 3528 3583 5025
Totals 8852 70816 79869 112022*
*The 2011 calculated population within the study area is 79 869. The project design year is 2045 and the estimated design population is based on a 1.0% annual growth rate.

Figure 8.32 Layout of the proposed uMshwathi RBWSS Phase 4.

472
Implementation The anticipated completion date for the detailed design is towards the end of 2018. The phase of the uMshwathi RBWSS project is expected to cost R 720 million. An application for grant funding has been submitted to DWS.

473
8.6.2 Lower Thukela Bulk Water Supply Scheme – Phase 2
Planning No. 204.19
Project No.
Project Status Planning
Project Description Construction of Phase 1 of the Lower Thukela Bulk Water Supply Scheme (LTBWSS) was completed in December 2016. The plant was being commissioned at the time of writing this report. The Lower Thukela Bulk Water Supply Scheme will supply the town of KwaDukuza and en route communities in the KwaZulu-Natal North Coast. The Univeral Access Plan Phase 2 planning study (Umgeni Water 2016; see Section 2.7) identified the option to use LTBWSS to supply the King Cetshwayo District Municipality and the City of uMhlathuze. Phase 2 of the LTBWSS will double the treatment capacity from 55 Ml/day to 110 Ml/day and construct a pipeline to feed into a new 30 Ml reservoir on the outskirts of Mandini. Key information on this project is summarised in Table 8.20.
Table 8.20 Project information: Lower Thukela BWSS – Phase 2 .
Project Components
Upgrade WTP capacity from 55 Ml/day to 110 Ml/day.
Additional raw and potable pumps and 7.2 km of 900 mm diameter bulk supply pipelines to deliver water from the WTP to Mandini.
30 Ml Command Reservoir in Mandini.
Capacity 110 Ml/day

Figure 8.33 Lower uThukela Bulk Water Supply Scheme – Phase 2.

475
Institutional Arrangements Umgeni Water will own, operate and maintain the infrastructure of the Lower Thukela BWSS and will sell potable water from this system to the iLembe District Municipality. Investigations will be undertaken to determine if it is feasible for potable water from this system to be supplied to King Cetshwayo District Municipality and City of uMhlathuze.
Beneficiaries The beneficiaries of this scheme will be the town of KwaDukuza and the areas of the North Coast region and possibly communities and industries in King Cetshwayo District Municipality and City of uMhlathuze. Assuming 200 l/person/day, the estimated number of beneficiaries from the anticipated capacity of 110 Ml/day may be 550 000 people.
Implementation The Lower Thukela Bulk Water Supply Scheme – Phase 1 is complete and Phase 2 is at planning stage. The Universal Access Plan identified various options to supply King Cetshwayo District Municipality and City of uMhlathuze . Phase 2 will be implemented should it be determined to be a preferred supply option. The estimated total cost of Phase 2 of the project is estimated to be R507 million.

476
8.6.3 Maphumulo Bulk Water Supply Scheme
Planning No. 204.22
Project No. UI0307A / UI0307B / UI0307C / UI0307D / UI0308A
Project Status Phase 1 – iMvutshane River Abstraction, pump station and raw water rising main, 6 Ml/day WTP, bulk pipelines and reservoirs – Complete. Phase 2 – Imvutshane Dam – Complete. Phase 3 – WTP upgrade to 12 Ml/day – Design. Phase 4 – Abstraction from Hlimbitwe River and raw water pipeline to iMvutshane Dam – Planning.
Project Description This scheme supplies the communities in Maphumulo, Maqumbi and Ashville from the iMvutshane River. This river is a tributary of the Hlimbitwa River (which in turn is a tributary of the Mvoti River) and is situated approximately 10 km south of Maphumulo Town. The construction of a run-of-river abstraction works on the iMvutshane River and 6 Ml/day WTP has been completed as part of Phase 1 of the project and was commissioned in August 2013. Phase 2 of the project, which was the construction of the iMvutshane Dam on the iMvutshane River (Figure 8.34), was completed in March 2015. Future phases to the scheme include:
Phase 3 : Upgrade WTP by 6 Ml/day to new treatment capacity of 12 Ml/day and upgrade the raw water and potable water pumps;
Phase 4: New weir, abstraction works, pump station on the Hlimbitwe River and pipeline to convey raw water into the iMvutshane Dam to meet the future 12 Ml/day demand.
Key information on this project is summarised in Table 8.21.

Figure 8.34 Layout of the proposed Maphumulo BWSS Phase 4.

478
Table 8.21 Project information: Maphumulo BWSS.
Project Components
Phase 1
iMvutshane River Abstraction, pump station and raw water rising main, 6 Ml/day WTP, bulk pipelines and reservoirs.
Phase 2
3.2 million m3 iMvutshane Dam.
Phase 3
Upgrade of the WTP to 12 Ml/day and new pumps. Phase 4
Weir and abstraction from Hlimbitwe River, pump station and pipeline to iMvutshane Dam.
Capacity Phase 1: 6 Ml/day Phases 2, 3 &4: 12 Ml/day
Institutional Arrangements Umgeni Water will own, operate and maintain the infrastructure of the Maphumulo BWSS and will sell potable water from this system to the iLembe District Municipality as per the Bulk Water Supply Agreement.
Beneficiaries The Maphumulo BWSS will supply both rural and peri-urban settlement areas. The population that will be supplied by the Maphumulo BWSS is presented in Table 8.22.
Table 8.22 Rural demand to be supplied by the Maphumulo BWSS (MSW 2008).
Rural Supply Area Population
Maphumulo 4 872
Maqumbi (Phase 1) 26 280
Masibambasane CWSS 17 248
Kwa Sizabantu 17 192
Ngcebo 2 72 900
Ashville 11 264
TOTAL 149 756
Implementation Phases 1 and 2 of the Maphumulo BWSS are complete. Due to the low flows in the iMvutshane River, an emergency scheme was implemented in 2015. This supplies water from the Hlimbitwa River to the existing abstraction point on the iMvutshane River. Phase 3 is estimated to be completed by 2018 with Phase 4 in 2020. The estimated total cost of phases 3 and 4 of the project, is R215 million.

479
8.7 Elysium Desalination Plant
Planning No. 601.6
Project No. UI0911A
Project Status Detailed Feasibility
Project Description The Elysium Desalination Project is a greenfield development intended to supplement potable water supplied by the Mtwalume Water Treatment Plant (WTP) where the demand for potable water regularly exceeds the capacity of the raw water resource during the dry season. The Elysium Desalination Project would supply water to the Elysium Reservoir and this will be the only interface with existing bulk water supply infrastructure in the area (Figure 8.35). Due to poor availability of suitable fresh water resources in this region, desalination of seawater is considered the most reliable alternative source of water to supplement the output of WTP. The required potable water supply capacity of this initial phase is 2.5 Mℓ/day. Future development is anticipated in two or more future phases to an ultimate supply capacity of 10 Mℓ/day. It is necessary for the design of this initial phase to include for the anticipated future developments at lowest overall lifecycle cost. This will mean that certain components of the system may need to be designed at the outset, for the ultimate capacity of 10 Mℓ/day and that space must be reserved, in the initial site layout, for anticipated future development. The extent of the Project includes all components necessary for implementation and operation of the bulk water supply system including location, design, specification, procurement, construction, operation, maintenance and repair over the project life cycle. The Project comprises the following main physical components:
A Sea Water Abstraction System to provide raw sea water to the treatment works for processing,
An Effluent Discharge System for safe disposal of brine and treated effluents,
A Sea Water Reverse Osmosis (SWRO) Desalination plant including all necessary support processes for :
Raw water pre-treatment SWRO Modules Cleaning processes and chemical storage Effluent Treatment Post-treatment to UW Potable Water standards
A Pump station and Rising Main to elevate water from the treatment works to the existing Elysium Reservoir.
All necessary facilities, utilities and infrastructure for construction and subsequent operation of all of the installed plant.

480
Key information on this project is summarised in Table 8.23.
Table 8.23 Project description: Elysium Desalination Plant.
Project Components
Bulk Infrastructure Components (10 Mℓ/day)
Sea water intake and abstraction system (includes raw water pump station).
Raw water rising main and brine disposal pipelines.
Potable water delivery main and pump station. Treatment Plant Components (2.5 Mℓ /day)
Desalination Plant – to be located at Elysium with an initial capacity of 2.5 Mℓ/day and allowance for further modules to increase capacity to 10 Mℓ/day.
Capacity 2.5 Mℓ/day
Institutional Arrangements The Elysium desalination plant is situated in Ugu District Municipality (DM). Umgeni Water will own, operate and maintain the plant and will sell potable water from this system to the Ugu DM, as per existing bulk water supply agreements.
Beneficiaries The scheme will serve consumers in the Ugu District Municipality. Assuming 200 l/person/day, the estimated number of beneficiaries from the anticipated capacity of 2.5 Ml/day may be 12 500 people.
Implementation The infrastructure is already required to meet the demands within the supply area. The estimated cost of the entire project is in the order of R 110 million at 2015 prices. The anticipated implementation programme is as follows: Preliminary Design completed by February 2018, Detailed Design by May 2018 ready for construction. Should the project proceed to construction, the anticipated commissioning date would be December 2018.

Figure 8.35 Proposed Elysium desalination sites.

482
8.8 Darvill Wastewater Works Upgrade
Planning No. 104.1
Project No. UI0665A
Project Status Construction
Project Description The Darvill Wastewater Works (WWW) serves the city of Pietermaritzburg and surrounding communities. All water borne sewage flows by gravity or is pumped to Darvill, with the exception of a small community in Lynnfield, which has its own water borne sewage that is treated by the Lynnfield WWW (Section 7.3.3). There are, however, large areas of the city that are not served by the sewer reticulation network that are reliant on on-site sanitation system e.g. septic tanks and pit latrines. The extent of Darvill’s water borne sewer catchment area is illustrated in Figure 7.6. Darvill WWW is thus of strategic importance to the city and to the environment at large as the quality of the effluent discharged needs to comply with regulations. Demand was exceeding the treatment capacity of the works and a capacity upgrade was therefore required. It was also determined through process evaluations that the current process was inadequate and needed to be adapted.
The wastewater works is being upgraded from 65 Mℓ/day to 100 Mℓ/day to meet current and future demands (Figure 8.36). This is a comprehensive upgrade with the majority of the existing processes and infrastructure being impacted upon. Details of the process upgrades are given in Table 8.24. Two key elements of the upgrade are the sludge treatment and biological treatment aeration system. The present method of disposal of sludge by spray irrigation to land is operating adequately, but has its limitations especially as the capacity of the works increases to cope with growth. A new method of sludge thickening and dewatering is to be implemented involving the construction of a new sludge treatment building. The new facility will use linear screens for mechanical thickening and dewatering of waste activated sludge and digester sludge. The traditional surface aerators are inefficient and will be removed and replaced by a fine bubble diffused aeration (FBDA) system. The FBDA system is made up of 22 680 diffusers in three aeration lanes that are connected by a pipe network that is supplied with air from four blowers. As opposed to surface aeration which requires a lot of mechanical energy to introduce oxygen into the system, FBDA release the air at the bottom of the aeration basin through the diffusers thus achieving and even dispersion and improved oxygen transfer. Key information on this project is summarised in Table 8.24.

483
Table 8.24 Project information: Darvill Wastewater Works Upgrade.
Project Components
Inlet Works New inlet works design to handle a maximum flow of 200 Mℓ/day in
4 channels. Two mechanical screens in each channel.
Fat, Oil, Grease (FOG) and Grit Removal Additional unit process because of high FOG loads in influent. 200 Mℓ/day in 3 lanes.
Primary Settling Additional 40 m PST added.
Settled Sewage Pump Station (SSPS) The SSPS replaces the existing “Main Pump Station” which has reached its
design life. 3 duty, 1 standby and 1 spare.
Biological treatment Convert the existing anaerobic reactor to an activated sludge selector. Convert the existing Aerobic Reactor to an Anaerobic / Anoxic reactor. Construct a new deep basin reinforced concrete Aerobic Reactor with fine
bubble diffused aeration (40 150 m3).
Air for Biological Treatment Blower House. 4 x 645 kW Blowers each with a rated delivery of 7 m
3/sec @ 90 kPa.
Air Header Mains. 22 680 diffusers in three aeration lanes.
Secondary Settling 2 x 35 m diameter secondary settling tanks.
Anaerobic Sludge Digesters 2 x 4500 m
3 digesters.
Wash Water Treatment Construct 2 Mℓ/day wash water / reclamation plant.
Unit processes will include disc filters, coagulation/flocculation, Ozonation granular activated carbon, ultra-filtration and hydrogen peroxide addition.
Capacity 100 Mℓ/day Plant

Figure 8.36 Upgrade of Darvill WWW.

485
Institutional Arrangements Umgeni Water owns and operates the plant and is funding the project internally. The Msunduzi Municipality is charged a monthly tariff for discharging the city’s wastewater to Darvill.
Beneficiaries The Msunduzi Municipality is the main beneficiary of the upgrade as it will remove the constraint to development in the city.
Implementation The R 940 million project is currently being constructed (Figure 8.37 and Figure 8.38) and is due for completion in December 2017.
Figure 8.37 Darvill Anaerobic digester under construction.

486
Figure 8.38 Activated sludge tanks showing diffusers.

487
8.9 Mpophomeni Wastewater Works Upgrade Planning No. 610.1
Project No. UI0801A
Project Status Detailed Design Complete
Project Description The Mpophomeni Wastewater Works (WWW) is currently not operational and sewage from Mphophomeni Township is pumped to Howick WWW for treatment. The demand at Mphophomeni has increased to the extent where the flow exceeds the volume of effluent that the Howick WWW can treat. Additionally, there are a number of planned developments that will increase this flow significantly over the next few years. It was therefore proposed by the uMgungundlovu District Municipality that the Mphophomeni WWW be upgraded to treat 6 Mℓ/day with the possibility of upgrading the works to 12 Mℓ/day. The site has space for a plant of at least 20 Mℓ/day (Figure 8.39). The following development initiatives by the municipality will be serviced by the Mpophomeni WWW, viz.:
Refurbishment of the existing sewage reticulation system in Mpophomeni Township will increase wastewater flows to the works (ADWF 3.6 Mℓ/day);
The development of the Khayelisha social housing development on the banks of Midmar Dam (ADWF 1.3 Mℓ/day); and
Planned light/mixed industrial development park (3 Mℓ/day). The effluent from the works will be pumped and disposed of to the Sakubula stream adjacent to the national road (N3) in Howick. The pumping main will be approximately 6.8 km in length and of various diameters. Key information on this project is summarised in Table 8.25.
Table 8.25 Project information: Mpophomeni Wastewater Works Upgrade.
Project Components
Inlet Works including a mechanical screen and vortex grit tanks (2No).
Two 14 m diameter primary settling tanks.
Primary sludge pump station.
Refurbished digesters with new heating and sludge circulating system.
Mechanical equipment to dewater digested primary and activated sludge.
6 Mℓ/d (BNR Activated Sludge Treatment Plant.
Return Activated Sludge (RAS) pumping system.
Waste Activated Sludge (WAS) pumping system.
RAS and Storm Flow Recycle Refurbished Pump Station
Sludge and Storm Flow Recycle Mechanical/Electrical Plant.
Refurbished 2.25 Mℓ Storm bypass pond.
One 25 m diameter secondary clarifier.
One refurbished 18 m diameter secondary clarifier.
Aluminium sulphate, lime and chlorine chemical dosing systems.
Recycle pump station, pumping plant and pumping main from Maturation Ponds.
Disposal pipeline (6.8 km) of various diameters.
Pump station (2 duty, 1 stand-by)
Capacity 6 Mℓ/day Plant

Figure 8.39 Upgrade of Mpophomeni WWW.

489
Institutional Arrangements Umgeni Water will in future operate the plant on behalf of the uMgungundlovu District Municipality under a twenty year management contract. Umgeni Water is responsible for funding any capital improvements required by the plant. Umgeni Water charges a monthly management fee to the Municipality to cover all operation and maintenance costs as well as capital redemption.
Beneficiaries The uMgungundlovu District Municipality and uMngeni Local Municipality are the main beneficiaries of the upgrade.
Implementation The project is currently in tender adjudication / construction phase and will take approximately 18 months to complete. The estimated cost of the project is R151 million.

490
8.10 Trust Feeds Wastewater Works
Planning No. 610.4
Project No.
Project Status Detailed Design
Project Description The uMgungundlovu District Municipality (UMDM) requested that Umgeni Water design and construct a new wastewater works (WWW) at Trust Feeds. The wastewater works will serve the existing Trust Feeds community as well as a new housing development proposed by the Department of Human Settlements. The ultimate capacity of the wastewater works will be 2 Mℓ/day, but initially only half the capacity will be constructed (1 Mℓ/day). The project area is located approximately 4 km North West of Wartburg, on the eastern periphery of the uMshwathi LM boundary within Ward 8 of uMshwathi Local Municipality. The project includes:
The existing semi-formal low income housing development known as Trust Feeds, which comprises approximately 800 houses.
A proposed 3000 unit low income development which has been approved by the Department of Human Settlements to eliminate the housing backlog within the region. The new development is adjacent to Trust Feeds.
Key information on this project is summarised in Table 8.26.
Table 8.26 Project information: Trust Feeds Wastewater Works.
Project Components
Inlet Works including a mechanical screen, vortex grit chamber and flume type flow meter.
2 Mℓ/day (BNR) Activated Sludge Treatment Plant.
Return Activated Sludge (RAS) pumping system.
Waste Activated Sludge (WAS) pumping system.
Two circular 15 m diameter secondary clarifiers.
Chlorine chemical dosing tank.
15 no rectangular shaped drying beds
Capacity 2 Mℓ/day Plant
Institutional Arrangements Umgeni Water will in future operate the plant on behalf of the Umgungundlovu District Municipality under a twenty year management contract. Umgeni Water is responsible for funding any capital improvements required by the plant. Umgeni Water charges a monthly management fee to the Municipality to cover all operation and maintenance costs as well as capital redemption.
Beneficiaries The uMgungundlovu District Municipality and uMshwathi Local Municipality are the main beneficiaries of the upgrade.
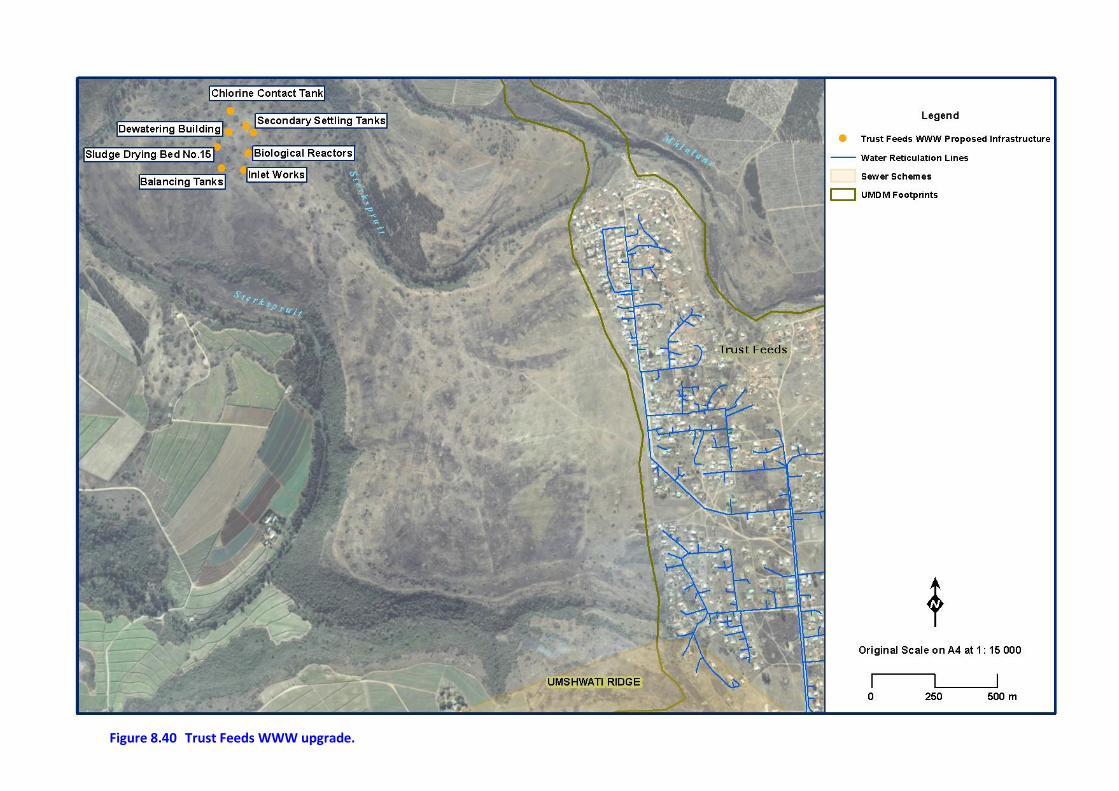
Figure 8.40 Trust Feeds WWW upgrade.

492
Implementation The project is currently in the detailed design phase, which should be completed in early 2017. The estimated capital cost of the project is R75 million.

493
8.11 Richmond Wastewater Works Upgrade
Planning No. 610.3
Project No.
Project Status Detailed Design
Project Description The uMgungundlovu District Municipality (UMDM) requested Umgeni Water upgrade the Richmond wastewater works (WWW). The existing WWW only serves the town of Richmond, but in future the WWW will have to accommodate sewage flow from additional areas. The additional areas include the low income settlements of Siyathuthuka and Lusaka that currently make use of pit latrines for basic sanitation. There are also some residential units located within the existing Richmond residential area that also need to be included in the reticulation. Consideration will also be given to any proposed future developments in the area. The proposed new extensions will cater for Biological Excess Phosphorous Removal with back-up chemical dosing facility. The ultimate capacity of the wastewater works will be 5 Mℓ/day, but initially only half the capacity will be constructed (2.5 Mℓ/day). Consulting engineers Worley Parsons (Pty) Ltd have been appointed to implement the project. Key information on this project is summarised in Table 8.27.
Table 8.27 Project information: Richmond Wastewater Works.
Project Components
New inlet works including a mechanical screen, mechanical degritters, screenings conveyor and compactor and venture flume.
2 No additional aeration basins
Return Activated Sludge (RAS) pumping system.
Waste Activated Sludge (WAS) pumping system.
1 No additional circular 18 m diameter secondary clarifier.
New chlorine contact channel.
Upgrade the existing chlorine dosing building and chlorine dosing equipment
New mechanical sludge handling equipment and housing building
New sludge drying beds and scum trap
New ferric dosing equipment
Refurbishment of sewage retention pond
Refurbishment of all ancillary facilities
New SCADA system
Capacity 5 Mℓ/day Plant
Institutional Arrangements Umgeni Water will in future operate the plant on behalf of the uMgungundlovu District Municipality under a twenty year management contract. Umgeni Water is responsible for funding any capital improvements required by the plant. Umgeni Water charges a monthly management fee to the Municipality to cover all operation and maintenance costs as well as capital redemption.
Beneficiaries The uMgungundlovu District Municipality and Richmond Local Municipality are the main beneficiaries of the upgrade.

Figure 8.41 Richmond WWW upgrade.

495
Implementation The detailed design should be complete by July 2017, at which point tenders for construction will be advertised. The estimated project cost is R 48 217 000 (inclusive of VAT). This figure includes the cost of all project phases: Planning, Design & Tender preparation and Construction.

I
R E F E R E N C E S CSIR. 2015. Updated CSIR/SACN South African Settlement Typology, Prepared by van Huyssteen, E., Mans, G., le Roux, A, Maritz, J., Ngidi, M. and Maditse, K., March 2015. CSIR. CSIR and SACN, 2016. South African Settlement Typology. GIS Dataset. Department of Arts and Culture. “Toponymic Guidelines for Maps and Other Editors”. Department: Arts and Culture, South Africa. 2016. < http://www.dac.gov.za/content/toponymic-guidelines-map-and-other-editors>. Department of Cooperative Governance and Traditional Affairs. 2009. State of Local Government in South Africa Overview Report National State of Local Government Assessments, Working Documents CoGTA 2009. Pretoria: South Africa. Department of Cooperative Governance and Traditional Affairs. 2009. Local Government Turn-Around Strategy, November 2009. Pretoria: South Africa. Department of Environmental Affairs and Geoterraimage (GTI). 2015. 2013 – 2014 South African National Land-Cover Dataset. March 2015, Version 05#2 (DEA Open Access). GIS Dataset. Department of Rural Development and Land Reform. 2015. Development Edges: A Settlement Typology Update Approach and Data Report, Prepared by Michael Kahn and Dataworld, RDLR-0075 (September 2015). Pietermaritzburg: Department of Rural Development and Land Reform. Department of Rural Development and Land Reform. 2009. Rural Settlements Update Project in KwaZulu-Natal, March 2009. Pietermaritzburg: Department of Rural Development and Land Reform. Department of Rural Development and Land Reform. 2009. KwaZulu-Natal Urban Edges Close-Out Report, September 2009. Pietermaritzburg: Department of Rural Development and Land Reform. Department of Trade and Industry. 2016. ‘Dube TradePort Designated as SEZ’. Government Notice No. 1093, Gazette No. 40515 23 September 2016. Department of Water and Sanitation. 2016. ‘New Nine (9) Water Management Areas of South Africa’. Government Notice No. 1056, Gazette No. 40279 16 September 2016. Department of Water and Sanitation, 2015. Classification of significant water resources and determination of the comprehensive reserve and resource quality objectives in the Mvoti to Umzimkulu Water Management Area. Pretoria: DWS. Department of Water Affairs, 2012. National Water Resource Strategy (NWRS). Pretoria: DWA. Department of Water Affairs. 2012. Ncwabeni Off-Channel Storage Dam feasibility study: module 1: technical study. Supporting report 1: Water Requirements and Water resources. Pretoria: Department of Water Affairs Department of Water Affairs. 2011. Water Reconciliation Project-Reutilisation of Treated Waste Water. PRELIMINARY PHASE-Rapid Determination of the Environmental Water Requirements for the uMngeni Estuary. Pretoria: Department of Water Affairs.
II
Department of Water Affairs. 2010. Water Availability Assessment in the Lower Thukela River. Pretoria: Department of Water Affairs. Department of Water Affairs. “WS NIS”. DWA Internet Home. 2012. <http://www.dwaf.gov.za/dir_ws/WSNIS/>. Department of Water Affairs and Forestry. 2008. KwaZulu-Natal Groundwater Plan. Version No. 2, January 2008. Pretoria: Department of Water Affairs and Forestry. Department of Water Affairs and Forestry. 2006. Mooi-Mgeni River Transfer Scheme Phase 2: Feasibility Study – Bridging Study 5. Pretoria: Department of Water Affairs and Forestry. Department of Water Affairs and Forestry. 2004. Mvoti to Mzimkhulu Water Management Area Internal Strategic Perspective (ISP). Pretoria: Department of Water Affairs and Forestry. Department of Water Affairs and Forestry. 2004. Thukela Water Management Area Internal Strategic Perspective (ISP). Pretoria: Department of Water Affairs and Forestry. Department of Water Affairs and Forestry. 2004. Thukela Reserve Determination Study. Pretoria: Department of Water Affairs and Forestry. Department of Water Affairs and Forestry. 2003. Mkomazi Mooi-Mgeni River Transfer Scheme Phase 2: Feasibility Study, Main Report, Report No. PB V200-00-1501. Pretoria: Department of Water Affairs and Forestry. Department of Water Affairs and Forestry. 2003. Hazelmere Dam Raising Feasibility Study. Pretoria: Department of Water Affairs and Forestry. Department of Water Affairs and Forestry. 1999. Mkomazi/Mgeni/Mooi River Hydrology Update. Pretoria: Department of Water Affairs and Forestry. Dijkstra, L. and Poelman, H. 2014. A Harmonised Definition of Cities and Rural Areas: the New Degree of Urbanisation, Regional Working Paper 2014 WP 01/2014. European Commission. Eskom. 2011. SPOT Building Count (SBC). GIS Dataset. Ezemvelo KZN Wildlife. 2016. KZN CBA Irreplaceable, Version 01022016. GIS Dataset. Ezemvelo KZN Wildlife. 2016. KZN CBA Optimal, Version 03032016. GIS Dataset. Ezemvelo KZN Wildlife. 2016. KZN ESA, Version 01022016. GIS Dataset. Ezemvelo KZN Wildlife. 2016. KZN ESA Species Specific, Version 11072016. GIS Dataset. Ezemvelo KZN Wildlife. 2016. Draft KwaZulu-Natal Biodiversity Spatial Planning Terms and Processes, Version 3.3, 27 January 2016. Pietermaritzburg: Ezemvelo KZN Wildlife. Ezemvelo KZN Wildlife. 2014. 2008 Land Cover. GIS Dataset. Ezemvelo KZN Wildlife. 2014. 2011 Land Cover. GIS Dataset.
III
Ezemvelo KZN Wildlife. 2010. Terrestrial Systematic Conservation Plan. GIS Dataset. Global Human Settlement. 2017. Global Human Settlement Layer. GIS Dataset. < http://data.jrc.ec.europa.eu/collection/GHSL> KZN Department of Agriculture and Environmental Affairs. 2012. KZN Agricultural Land Categories. GIS Dataset. KZN Department of Co-operative Governance and Traditional Affairs. 2016. KwaZulu-Natal Strategic Corridor Development Plan, 13 April 2016. Pietermaritzburg: KZN CoGTA. KZN Department of Co-operative Governance and Traditional Affairs. 2016. KwaZulu-Natal Strategic Corridor Development Plan. GIS Dataset. KZN Department of Economic Development, Tourism and Environmental Affairs. 2017. PSEDS 2016. GIS Dataset. KZN Department of Economic Development, Tourism and Environmental Affairs. 2017. Formulation of Provincial Spatial Economic Development Strategy (PSEDS) Corridor and Nodal Framework and Data Mapping, Q 41 EDTEA 15/16. Pietermaritzburg: KZN EDTEA. KZN Department of Human Settlements and Housing Development Agency. 2016. Defining a Provincial Human Settlements Master Spatial Plan for KwaZulu-Natal for Human Settlements Investment, May 2016, HAD/KZN/2015/001. Durban: HDA. KZN Department of Human Settlements and Housing Development Agency. 2016. KZN Human Settlements Master Spatial Plan. GIS Dataset. KZN Department of Transport. 2011. Road Infrastructure Framework of South Africa. GIS Dataset. KwaZulu-Natal Provincial Planning Commission. 2017. KwaZulu-Natal 2035 Provincial Growth and Development Strategy, 2016, ISBN1-920041-15-X. Pietermaritzburg: KwaZulu-Natal Provincial Planning Commission. KwaZulu-Natal Provincial Planning Commission. 2017. KwaZulu-Natal 2035 Provincial Growth and Development Plan, 2016/17, ISBN1-920041-24-9. Pietermaritzburg: KwaZulu-Natal Provincial Planning Commission. KwaZulu-Natal Provincial Planning Commission. 2017. Moving KZN Toward Achieving Vision 2035 Nerve Centre, KZN IMP and Catalytic Project Support Focus, Presentation by KZN Department of Public Works at the PGDP-DGDP-IDP Alignment Sessions April 2017. < http://www.kznppc.gov.za/index.php?option=com_content&view=article&id=125&Itemid=159>. KwaZulu-Natal Provincial Planning Commission. 2016. 2035 Provincial Growth and Development Strategy, 2016. GIS Dataset. KwaZulu-Natal Provincial Planning Commission. 2016. KwaZulu-Natal Situational Overview, 2016. Pietermaritzburg: KwaZulu-Natal Provincial Planning Commission.

IV
KwaZulu-Natal Provincial Planning Commission. 2011. Provincial Growth and Development Strategy 2011, Version 22 Final 31-08-2011. Pietermaritzburg: KwaZulu-Natal Provincial Planning Commission. KZN Treasury. 2017. KZN Gross Domestic Product by Region Spreadsheet (after Global Insight). Pietermaritzburg: KZN Treasury. Midgley, D.C., Pitman, W.V. and Middleton, B.J. 1994. Surface Water Resources of South Africa 1990. Volume VI. Drainage Regions U,V,W,X - Eastern Escarpment– Appendices and Book of Maps. WRC Report Number 298/6.1/94. Pretoria: WRC. Municipal Demarcation Board. 2016. Municipal and Ward Boundaries. GIS Dataset. <www.demarcation.org.za>. Municipal Demarcation Board. 2011. Municipal and Ward Boundaries. GIS Dataset. <www.demarcation.org.za>. National Planning Commission. 2012. National Development Plan 2030 Our Future – Make it Work. Pretoria: National Planning Commission. Presidential Infrastructure Coordinating Commission. 2012. National Infrastructure Plan. <
http://www.info.gov.za/issues/national-infrastructure-plan/index.html>. Schulze, R. 1995. Hydrology and Agrohydrology: A Text to Accompany the ACRU 3.00 Agrohydrological Modelling System, WRC Report TT69/95. Pretoria: Water Research Commission. Statistics South Africa. 2017. Community Survey 2016. SuperCross Database. <www.statssa.org.za>. Statistics South Africa. 2016. 2015 KwaZulu-Natal Citizen Satisfaction Survey: Analytical Report, Report No. 03-00-07. Pretoria: South Africa. Statistics South Africa. 2014. South African Multidimensional Poverty Index. GIS Dataset. Statistics South Africa. 2014. The South African MPI, Report No. 03-10-06, 2014. Pretoria: Statistics SA. Statistics South Africa. 2013. Census 2011. <www.statssa.org.za> Umgeni Water. 2017. Draft Infrastructure Master Plan 2017/2018 Geodatabase. GIS Dataset. Umgeni Water. 2016. Universal Access Plan Phase 2. Prepared by Bigen Africa; Hatch Goba; JTN Consulting; UWP Consulting; Ziyanda Consulting. Pietermaritzburg: Umgeni Water. Umgeni Water. 2016. Infrastructure Master Plan 2016 Volume 1 2016/2017 – 2046/2047 March 2016. Pietermaritzburg: Umgeni Water. Umgeni Water. 2016. Infrastructure Master Plan 2016 Volume 2 2016/2017 – 2046/2047 March 2016. Pietermaritzburg: Umgeni Water. Umgeni Water. 2015. Infrastructure Master Plan 2015 Volume 1 2015/2016 – 2045/2046 March 2015. Pietermaritzburg: Umgeni Water.

V
Umgeni Water. 2015. Infrastructure Master Plan 2015 Volume 2 2015/2016 – 2045/2046 March 2015. Pietermaritzburg: Umgeni Water. Umgeni Water. 2014. Infrastructure Master Plan 2014 Volume 1 2014/2015 – 2044/2045 April 2014. Pietermaritzburg: Umgeni Water. Umgeni Water. 2014. Infrastructure Master Plan 2014 Volume 2 2014/2015 – 2044/2045 April 2014. Pietermaritzburg: Umgeni Water. Umgeni Water. 2013. Infrastructure Master Plan 2013 Volume 1 2013/2014 – 2043/2044 September 2013. Pietermaritzburg: Umgeni Water. Umgeni Water. 2013. Infrastructure Master Plan 2013 Volume 2 2013/2014 – 2043/2044 September 2013. Pietermaritzburg: Umgeni Water. Umgeni Water. 2012. Infrastructure Master Plan 2012 Volume 1 2012/2013 – 2042/2043 April 2012. Pietermaritzburg: Umgeni Water. Umgeni Water. 2012. Infrastructure Master Plan 2012 Volume 2 2012/2013 – 2042/2043 April 2012. Pietermaritzburg: Umgeni Water. Umgeni Water. 2011. Infrastructure Master Plan 2011 Volume 1 2011/2012 – 2041/2042 April 2011. Pietermaritzburg: Umgeni Water. Umgeni Water. 2011. Infrastructure Master Plan 2011 Volume 2 2011/2012 – 2041/2042 April 2011. Pietermaritzburg: Umgeni Water. Umgeni Water. 2011. Mdloti Water Resources Planning Model Update for Raised Hazelmere Dam. Pietermaritzburg: Umgeni Water. Umgeni Water. 2010. Infrastructure Master Plan 2010 Volume 1 2010/2011 – 2040/2041 April 2011. Pietermaritzburg: Umgeni Water. Umgeni Water. 2010. Infrastructure Master Plan 2010 Volume 2 2010/2011 – 2040/2041 May 2010. Pietermaritzburg: Umgeni Water. Umgeni Water. 2009. Update to Infrastructure Master Plan 2008 Umgeni Water Infrastructure Master Plan 2009 2009/2010 – 2039/2040 May 2009. Pietermaritzburg: Umgeni Water. Umgeni Water. 2008. Umgeni Water Infrastructure Master Plan 2008 Volume I 2008/2009 – 2009/2010 February 2008. Pietermaritzburg: Umgeni Water. Umgeni Water. 2008. Umgeni Water Infrastructure Master Plan 2008 Volume II 2008/2009 – 2009/2010 February 2008. Pietermaritzburg: Umgeni Water. Umgeni Water. 2006. KwaZulu-Natal Regional Bulk Water Supply: Reconnaissance Study-Southern Regional Schemes. Pietermaritzburg: Umgeni Water. Umgeni Water. 2004. Umgeni Water Infrastructure Master Plan 2004. Pietermaritzburg: Umgeni Water.

VI
Umgeni Water and Department of Water Affairs. 2009. Greater Bulwer/Donnybrook Bulk Water Supply Scheme. Pretoria: Department of Water Affairs and Forestry. Umgeni Water and Department of Water Affairs and Forestry. 1999. Mkomazi/Mgeni/Mooi River Hydrology Update. Pretoria: Department of Water Affairs and Forestry. Umgeni Water and Department of Water Affairs and Forestry. 1999. System Analysis – Ngwadini and Temple dams. Pretoria: Department of Water Affairs and Forestry. Umgeni Water and Gibb Africa. 1997. Middle South Coast bulk water supply: Pre Feasibility Extension Study. Pietermaritzburg: Umgeni Water. Umgeni Water and Partners in Development. 1998. Feasibility Study for the proposed Sikoto Dam - Ozwatini Water Project. Pietermaritzburg: Umgeni Water. Umgeni Water and MBB. 2009. Maphumulo Bulk Water Supply Scheme initial feasibility study for the proposed Imvutshane Dam. Pietermaritzburg: Umgeni Water. Umgeni Water and SRK. 2000. Risk assessment of water supply shortfalls to the Middle South Coast Water Supply Area. Pietermaritzburg: Umgeni Water. Umgeni Water and WRP Consulting Engineers (Pty) Ltd. 2009. Water Resources Operational Planning Analysis of the Mooi-Mgeni River System. Pietermaritzburg: Umgeni Water. Umgeni Water and WRP Consulting Engineers (Pty) Ltd. 2002. Development of a Decision Support System for the Operational Planning of the Middle South Coast System. Pietermaritzburg: Umgeni Water. UN Habitat. 2016. Habitat III New Urban Agenda, 2016. Quito: UN Habitat. United Nations Statistical Commission. 2017. Annex III Revised List of Global Sustainable Development Goal Indicators, Report of the Inter-Agency and Expert Group on Sustainable Development Goal Indicators (E/CN.3/2017/2). New York: United Nations. WRP. 2007. Mooi-Mgeni River Transfer Scheme Phase 2: Feasibility Study: Bridging Study No. 5: Stochastic Hydrology and Determination of Yield and Transfer Capacity of the Mooi-Mgeni Transfer Scheme (MMTS) and Operating Rules of the Mooi and Mgeni Systems with the MMTS in Place. Department of Water Affairs and Forestry, Directorate: Options Analysis. Report No. WMA 07/V20/00/1807. Authors: Schäfer, NW, De Jager, FGB and Van Rooyen, PG.

VII
A C K N O W L E D G E M E N T S Umgeni Water’s comprehensive 2016 Infrastructure Master Plan has been updated and improved to produce this 2017 version. The concerted effort of the Planning Services Department as a whole in producing this document is acknowledged and appreciated. Specific contributions by the various team members deserves acknowledgement: Alka Ramnath (Planner) for managing the project, writing Section 2 of this report (including the cartographic presentation), assisting with updating the spatial information and editing the two volumes; Graham Metcalf (Geohydrologist) for assisting with the management of the project process, updating the groundwater sections and preparing the sections on wastewater, reclamation and desalination. Without such valuable input the project would not have been possible. Planning Engineers Gavin Subramanian (North), Angus Nicoll (South and Central), Vernon Perumal (Harry Gwala; Section 4; and assisting with the conversion of CAD to GIS) and Mark Scott (Inland) updated the various components relating to the water supply infrastructure plans and projects. Sandile Sithole (Hydrologist) and Sakhile Hlalukane (Hydrologist), updated the various sections relating to the water resource regions in Volume I. Ntombifuthi Vilakazi (Planning Analyst) revised the section on climate change. Nombuso Dladla (Data Analyst) updated the spatial information and maps. Sifiso Khathi (Graduate Trainee – Hydrologist) and Thabani Zondi (Graduate Trainee – Hydrologist) assisted with the proof-reading of the IMP. Tatum Donnelly (Administrator) kept the department functioning smoothly throughout the project under challenging physical conditions. The 2017 Infrastructure Master Plan was not completed by the abovementioned people without the valued assistance of numerous other staff members within Umgeni Water. Their contributions are gratefully acknowledged. Operations Division staff provided assistance in updating and confirming infrastructure information. The Water and Environment Department kindly provided updated information on water quality within the various water resource regions in Section 5, and Process Services supplied the process and treatment details for each of the water treatment plants in Section 6. Kevin Meier, PLANNING SERVICES MANAGER