preventions and solutions for the scale problem at the...
TRANSCRIPT

Preventions and Solutions
for the Scale Problem at the Geothermal Power Plant
and CDM Study in Indonesia
Study Report
February 2006
Engineering and Consulting Firms Association, Japan
Tohoku Electric Power Co., Inc

List of Contents
Executive Summary ・・・s-1
Chapter 1 The purpose of survey and overview
1.1 The background of survey ・・・ 1
1.2 The purpose of survey ・・・ 2
1.3 Survey summary ・・・ 3
Chapter 2 The present situation of the Dieng geothermal power plant 2.1 Overview of the surveyed site ・・・ 4
2.2 Actual state of the power plant ・・・ 6
Chapter 3 The present situation of scale and assumed causes 3.1 The present situation of scale ・・・ 9
3.2 Assumed cause of scale
3.2.1 Assumed cause of turbine scale ・・・ 10
3.2.2 Assumed causes of scale in wells ・・・ 11
Chapter 4 Study for Optimum O&M
4.1 A measure for scale in steam turbines 4.1.1 Our specific approaches to the problem ・・・ 14
4.1.2 Application to the Dieng geothermal power plant ・・・ 17
4.2 Measures for scale in wells 4.2.1 A way to prevent scale from clinging ・・・ 21
4.2.2 A way to remove scale ・・・ 24
4.2.3 Application to the Dieng geothermal power plant ・・・ 26
4.3 High efficiency operation of Cooling tower ・・・ 26
Chapter 5 CDM feasibility study 5.1 Information related to CDM in Indonesia ・・・ 28
5.2 Related agencies and a trend of capacity building ・・・ 32
5.3 The CDM projects applied to the DNA ・・・ 32
5.4 Possibilities of geothermal power generation projects for CDM ・・・ 33

Chapter 6 Study for the possibility of participation in geothermal power generation 6.1 Energy conditions in Indonesia
6.1.1 Overall conditions ・・・ 34
6.1.2 Energy situation and policies ・・・ 34
6.2 Extension plan for the Dieng geothermal power plant 6.2.1 A development schedule ・・・ 37
6.2.2 Project Participants ・・・ 38
6.2.3 Project Contractual Relationship ・・・ 39
6.2.4 Evaluation profitability of the project ・・・ 40
6.2.5 Possibility of participation in the project ・・・ 45
6.3 Geothermal development plan in the Sarulla region 6.3.1 Overview ・・・ 46
6.3.2 Development plan ・・・ 47
6.3.3 Development structure ・・・ 47
6.3.4 Possibility of participation in the project ・・・ 48
Chapter 7 Conclusion 7.1 Measures for scale and the optimum O&M ・・・ 49
7.2 Possibility of CDM projects ・・・ 49
7.3 Possibility of participation in geothermal power generation ・・・ 50
7.4 Suggestions ・・・ 51
APPENDIX Calculation sheet

LIST OF FIGURES AND TABLES
Fig.2-1-1 :A location map
Fig.2-1-2 :Whole view of the Dieng Plateau
Fig.2-1-3 :A fumarole
Fig.2-1-4 :Buddhism remains (1)
Fig.2-1-5 :Buddhism remains (2)
Fig.2-2-1 :Panorama of the Dieng geothermal power plant
Fig.2-2-2 :The office of geothermal power plant
Fig.3-1-1 :Silica scale of injection pipe in the initial phase of the commercial operation (1)
Fig.3-1-2 :Silica scale of injection pipe in the initial phase of the commercial operation(2)
Fig.3-2-1-1 :Scaling at the turbine nozzle
Fig.3-2-2-1 :The solubility curb of amorphous silica
Fig.3-2-2-2 :The image of scaling (1)
Fig.3-2-2-3 :The image of scaling (2)
Fig.4-1-1 :The turbine-washing equipment
Fig.4-1-2 :Steam temperature at the surface of nozzle
- Metal temperature at the surface of nozzle
Fig.4-1-3 :Scaling point on the nozzle
Table 4-1-1 :The opening angle of governing valves during water injection
Fig.4-1-4 :Turbine inlet pressure
Fig.4-1-5 :The opening angle of governing valves
Fig.4-1-6 :Condenser Vacuum
Fig.4-2-1-1 :The image of the way of well water injection
Fig.4-2-1-2 :The water injection equipment

Table 4-2-2-1:A table of comparison with 2,000m class production well
Fig.4-2-2-1 :Work scenery by Coiled Tubing
Fig.4-2-2-2 :Coiled Tubing
Fig.4-3-1 :Relations between the number of operating cooling fan and condenser vacuum
Fig.4-3-2 :Relations between condenser vacuum and output correction coefficient
Fig.5-2-1 :Approval process flowchart
Fig.6-2-1-1 :A location map of Dieng and Patuha area
Table 6-2-1-1:A development schedule
Fig.6-2-2-1 :Project Participants
Fig.6-2-3-1 :Project Contractual Relationship
Fig.6-2-4-1 :Sensitivity analysis with the number of Makeup wells
Fig.6-2-4-2 :Sensitivity analysis with Decline rate
Fig.6-2-4-3 :Sensitivity analysis with Makeup well steam flow rate
Fig.6-3-1-1 :A location map of Sarulla area
Table 6-3-2-1:A development schedule
Fig.6-3-3-1 :Project Participants
Fig.7-4-1 :Project Flow

Abbreviation ASEAN Association of Southeast Asian Nations
BOT Build, Operate, Transfer
CDM Clean Development Mechanism
CER Certified Emission Reduction
CRT Cathode Ray Tube
GDP Gross Domestic Product
IEA International Energy Agency
IPP Independent Power Producer
IRR Internal Rate of Return
JI Joint Implementation
JV Joint Venture
LNG Liquefied Natural Gas
NGO Non-Governmental Organization
NPV Net Present Value
O&M Operation & Maintenance
PPA Power Purchase Agreement
wt% Weight %

This work was subsidized by the Japan Keirin Association through its
Promotion funds from KEIRIN RACE.

S-1
Executive Summary
1.Overview of the Dieng geothermal power plant Surveys of geothermal resources on the Dieng Plateau started from 1970s. From 1985 to
1991, a geothermal power plant program(55MW×2) was established using the ADB fund. In 1994, California Energy International(CEI)in the US –led JV signed a contract for the
construction of the Dieng geothermal power plant( × 4 ,150MW by 2001 ), and No.1(60MW)was completed in 1998. Although 45 wells confirmed the potential for 350MW, the construction of No.2, 3, 4 was postponed following the Asian financial crisis. Then, Mid-American purchased CEI. After the intervention of an American investment insurance company (OPIC), “GEODIPA”, a joint venture between the PLN and Pertamina obtained the ownership of the Dieng geothermal power plant in August 2001.
2.Summary of survey results (1) The present situation of scale
Research and analyses were carries out to understand the extent, the components, and the mechanism of the silica and where it actually located at the Dieng geothermal power plant. The results confirmed that the silica scale precipitates in the wells because of flush. Due to this scale problem, the plant operates at around 42MW although the rated output is 60MW. At present, injection of chemicals is being examined to address the problem and the plant is developing effective chemicals.
The Dieng geothermal power plant
Yogyakarta
calcium carbonateシリカcomponents
flush in the wellmixture of fluids varying in pHmechanism
wellextent pipe turbine
silica
Fig.3:The possibility and actual situation of each item
calcium carbonateシリカcomponents
flush in the wellmixture of fluids varying in pHmechanism
wellextent pipe turbine
silica
Fig.3:The possibility and actual situation of each item
Fig.1:Location Map
Fig.2:Participants and Panorama of the Dieng geothermal power plant
Scaling ( Flush point )
Fluid Fluid
Ground
Well
Fig.4:The image of scaling
Pertamina ( National oil
company)
PLN(National electric
company)
Dieng geothermal power plant
Joint-Venture67% 33%
PT GEO DIPA
Pertamina ( National oil
company)
PLN(National electric
company)
Dieng geothermal power plant
Joint-Venture67% 33%
PT GEO DIPA

S-2
Sensitivity analysis with the number of Makeup wells (Output)(Decline rate:5%,Makeup well steam flow rate:45t/h)
50
60
70
80
90
100
110
120
5.00% 7.00% 9.00% 11.00% 13.00% 15.00% 17.00%
Discount rate
NP
V(m
illio
n $
)
7 New Wells (Maintain steam)
3 New Wells
No New Wells
(2) Study for Optimum O&M As an optimum O&M measure for the scale, the Dieng geothermal power plant is
considering injecting chemicals, however even if effective chemicals are developed, the cost matters. With this in mind, Tohoku Electric Power Co. is planning to inject “clean water” to prevent scale from occurring in its jurisdiction. If this proves effective, we can offer epoch- making technical cooperation to the plant.
In addition, though it is yet posing a serious consequence, considering components of the silica at the Ding geothermal power plant, silica scale in turbines might become a serious problem. In this case, our proven “turbine washing equipment” could be of great help.
(3) Extension plan for the Dieng geothermal power plant
At present, the extension plan is under way at the Dieng geothermal power plant. Under the plan, No.2 will start commercial operations in 2008 and No.2 will be put into operations in 2009. This is a large-scale extension plan to construct 5 geothermal power stations with the rated output of 300MW in the Dieng geothermal power plant as well as Patuha region close to Bundung, far from the Dieng plant.
Both Dieng and Patuha regions have sufficient geothermal resources. There seems to be no problem in terms of technology, but
the plan is delayed because it is difficult to finance huge project cost (500 million $). Taking into account additional plants at the Dieng geothermal power plant, we calculated
the IRR setting the constriction cost per unit at about 100 million $. In this case, the IRR is almost the same as the risk free rate (6.85%). Furthermore, generated CO2 credits will not be relatively low considering the amount of non- condensed gas, so our participation in this plan is considered to be difficult.
(4) Geothermal development plan in the Sarrula region
Since this plan is expected to generate about 700,000 CO2 t/year, we also conducted the survey. In the Sarrua region, 3 geothermal sites are confirmed and 300MW of electricity can be generated over a period of 30 years.In addition, No.1 of Silangkitang, which will be developed first in this region, has already confirmed sufficient steam(50MW) and the construction can be carried out with low risk and at low price.It is desirable to carry out a detailed survey for the CDM, including the CO2 Emission Potential in the Sumatra Island and the resource evaluation. If attractiveness of the plan is quantified through the survey, our more active participation can be expected.
LGTank
Condensate water
Control panel
Injection pump
Injection pump
Injection unit
Rewind drum
Coil tube
INCOLOY 825
Lubricator
Tip nozzle
LGTank
Condensate water
Control panel
Injection pump
Injection pump
Injection unit
Rewind drum
Coil tube
INCOLOY 825
Lubricator
Tip nozzle
FX-233
Main Steam System
Turbine Exhaust System
CirculatingWater System
Water Injection Equipment System
Nozzle
Water Injection Pump
CirculatingWater Pump
Jet Condenser
GeneratorTurbine
CalorimeterTo Flash Steam Cooler
Governing Valve
Main Stop Valve
To Turbine Ground
Electromagnetic Flowmeter
Scale Separator
from Production Wells
Strainer
To Cooling Tower
Fig.6:The turbine-washing equipment Fig.5:The water injection equipment
サルーラ地域Sarulla area
Medan
Namora-I-Langit(65MW×3)
Silangkitang(50MW×2)
Eastern Sibualbualiサルーラ地域Sarulla area
Medan
Namora-I-Langit(65MW×3)
Silangkitang(50MW×2)
Eastern Sibualbuali
Fig.7:Sensitivity analysis with the number of Makeup wells
Fig.8:A location map of Sarulla area

1
Chapter 1 The purpose of survey and overview 1.1 The background of survey
Although electricity demand in Indonesia was stagnant following the Asian financial
crisis in 1997 and the following plunge of the rupiah, it grew by 9.3% from 1999 to 2001. Demand is expected to grow by an estimated 7% and according to an estimate by the IEA, it will reach 300,000GWh by 2020. However, the massive debt(about 45trrion Rp.).precludes the PLN(An electricity public corporation) from raising sufficient funds to develop the necessary new power sources to meet such demand In 2003, as the power supply reserves declined to 5-10%, there are concerns of a serious power shortage around Jakarta. In addition, in order to promote investment in power production, the government has imposed considerably higher electricity charges. With several hikes, the electricity rates in Rp. have approximately tripled compared to what they were at the times of the financial crisis. Repeated rate hikes have triggered demonstrations, riots and oppression in industry, which have had a serious effect on the national economy and the lives of the Indonesian citizen.
To deal with the drastic increase in electricity demand, the Indonesian government drew up policy of securing supplies by opening up the electricity sector to private enterprise. As a result, many foreign companies started to participate in the IPP project, however the 1997 financial crisis resulted in the suspension of a lot of projects. Since 2001, negotiations aiming to reduce costs of power purchases of the PLN have been resumed in an effort to rekindle interest in the many projects, which remain incomplete. If the PLN depends solely on its own funds, it will be impossible for the PLN to improve the installed capacity corresponding to the growing power demand, so active private investment is necessary.
Indonesia is rich in geothermal resources and at present, it accounts for about 2.5% of the total installed capacity. However, while geothermal resources offer the potential for 20, 000MW of electricity, only 4% (787MW) has been developed in the past 20 years. Furthermore, in the 1990s, together with other IPP projects, contracts for geothermal development projects that amount to 3,417MW were signed, but 7 of them were suspended because of the financial crisis. Although negotiations for re-starting these projects are under way, little progress has been made.

2
The project plant, the Dieng geothermal power plant, is located on the Dieng Plateau in central Java The Dieng Plateau is a volcanic region where eruptions, steam explosions and eruptions of volcanic gas have caused a great deal of damage over the course of history. Volcanic activity remains active as can be seen by the recent eruption of hot mud in1993 and a steam explosion and a volcanic earthquake in 1998.
When it comes to the exploitation of geothermal resources on the Dieng Plateau,
various surveys have been conducted since the 1970s. From 1985 to 1991, a survey regarding the construction of the Dieng geothermal power plant was carried out primarily by the PNL with the ADB, and a power generation program constructing 55MW×2 was established. In December 1994, California Energy International in the US (CEI)-led JV signed a contract for the construction of the Dieng geothermal power plant, which is committed to build 150MW by 2001 at a cost of US $192 million. Under the plan, 4 plants were supposed to be constructed, but after the completion of No1 (60MW) in 1998, the construction and the exploration activity for No.2 was postponed. At that time, 48 wells had been drilled, and the project organizer confirmed that the potential was 350MW. After that, a US firm, Mid-American, purchased CEI, but an American investment insurance company (OPIC) intervened and mediated when the project came to a deadlock. Consequently, the ownership was shifted to the Indonesian government(PT GEO DIPA , a joint venture between the PLN and Pertamina).
During those years, No.1 also temporary stopped operation, but resumed operations again. The geothermal resources of the plant contain a lot of Si in steam, making scales cling to steam production wells, steam tubes and steam turbines. As a consequence, at present, it only generates 40MW of electricity compared to the expected 60MW output. Despite there have been several measures taken, such as the injection of acid (which is also done in Japan) none have been effective in solving the problem. Agency for the assessment and application of technology (BPPT) asked Tohoku Electric Power Co. Inc to examine the scale problem in the plant through its overseas projects. 1.2 The purpose of survey
The purpose of this survey is to understand the extent of the scale problem n the Dieng geothermal power plant and its causes and to provide a basis for a detailed examination, which will lead to setting up appropriate countermeasures.

3
I also interviewed local people concerning PT GEO DIPA, the project entity, and collected information about the possibility of our participation in the O&M project, the matter of participation, and the possibility of capital contribution for the extension plan and the necessary procedures which will accompany it. 1.3 Survey summary This survey covers the following items. (1) Collection of information regarding the project (2) Brief survey of the extent of the scale problem and its causes (3) Current scale prevention and its effects (4) Survey of actual O&M activities (5) The actual state of the CDM in Indonesia (6) The geothermal power plant development plan and research on the possibility of
capital contribution

4
Chapter 2 The present situation of the Dieng geothermal power plant 2.1 Overview of the surveyed site
The Dieng geothermal power plant is located on the Dieng Plateau, about 80km north west of Yogyakarta, an ancient city of Indonesia. “Dieng” came from “Di Hyang” in Sanskrit, which means the place where gods live. As the name suggests, there are a lot of Buddhist ruins in the area.
The Dieng Plateau is situated 2,000m above sea level. It is dotted with lakes created by volcanic activity and geysers emitting steam, which smells of sulfur. It is well known as a tourist destination together with Buddhist ruins.
The Dieng geothermal power plant
Yogyakarta
Fig.2-1-1:Location Map

5
Fig.2-1-2:Whole view of the Dieng Plateau
Fig.2-1-3:A fumarole Fig.2-1-4: Buddhism remains (1)
Fig.2-1-5: Buddhism remains (2)

6
2.2 Actual state of the power plant
The office of the Dieng geothermal power plant is located in Dieng town, about 15 minutes drive from the power plant. The plant general manager works at the office with a number of employees. Five employees are always stationed at the plant and are engaged in operation control and patrolling of the steam production facilities and the generating facilities.
The central control room, which consists of a Electric panel and 2 CRT, is very simple. A steam turbine, which is a secondhand outdoor type manufactured by Ansaldo in Italy, was used in Africa before. This reducing the financial costs was a consideration at the time of the construction.
Indonesian law requires a pre-service inspection before using the power plant, but once commercial operation starts, the law doesn’t oblige any inspections. For example, there aren’t the periodical inspections which are conducted in Japan, and all inspections are carried out on a voluntary basis. They decide the frequencies of inspection depending on the conditions of facilities, and they are being carried out annually.
Since the steam turbine is an outdoor type, there is an overhead traveling crane, so for open inspection, a moving crane is rented. Furthermore, because it is an outdoor type, open inspections cannot be carried out during the rainy season. Considering that, even if there are troubles which require an open inspection, it is difficult to take prompt measures. Therefore, this poses a risk of prolonged power failures.
The facilities in the Dieng power plant include a huge after cooler. An after cooler cools the air extracted from the condenser and separates drain from the gas. The large after cooler means they deal with a large volume of extracted gas. The rated output of the Dieng geothermal power plant is 60MW, which is close to the Yanaizunishyama geothermal power plant (56MW). Comparing both figures, it is assumed that the steam from both plants contains the same proportion of non- condensed gas. (about 5wt% at Yanaizunishyama) (The production fluid in the Dieng geothermal power plant includes rare materials. As they are planning to sell refined material, they didn’t clarify the chemical components in the fluids.)

7
Generally, most of non-condensed gas included in production fluid is CO2. For this reason, the concentration of non-condensed is a matter of great importance, when considering CO2 emission credits.
Although the rated output of the Dieng geothermal power plant is 60MW, at present, it operates at around 42MW. The prime cause of this low output is the stoppage of production wells due to silica scale.

8
Fig.2-2-1:Panorama of the Dieng geothermal power plant
Fig.2-2-2:The office of geothermal power plant

9
Chapter 3 The present situation of scale and assumed causes 3.1 The present situation of scale
In the Dieng geothermal power plant, scale, which clings to the injection pipe, was a large problem in the initial phase of the commercial operation, but it was solved by measures taken afterward. Now, scale clings to geothermal fluid production wells and the steam turbines. The main component of the scale is silica.
Fig.3-1-1:Silica scale of injection pipe in the initial phase of the commercial operation (1)
Fig.3-1-2:Silica scale of injection pipe in the initial phase of the commercial operation (2)

10
3.2 Assumed cause of scale 3.2.1 Assumed cause of turbine scale
The source of the silica, component in the scale, is considered to be silica dissolved in mist and in steam. I will explain more later using an example of Tohoku Electric Power Co., Inc Uenotai geothermal power plant. The prime cause is considered to be that the turbine nozzles boil the components of the steam mist and then the silica in the steam mist precipitates and dries.
Fig.3-2-1-1:Scaling at the turbine nozzle

11
3.2.2 Assumed causes of scale in wells
Though its route varies, scale precipitates because material that dissolves in the solvent becomes super saturated.
Silica in geothermal fluids is balanced with quartz in a fluid reservoir at high temperature and at high pressure, but in the process of eruption which bring it to ground level, it changes to amorphous silica.
The solubility of silica depends on its crystal form. The solubility curb of amorphous silica can be expressed as follows.
The solubility changes according to temperature, pH and the concentration of Na, Al
and Fe ions and the presence or absence of ions of Fe and Poly silicic acid.
The precipitation of the scale depends on the mechanism for over saturation, which varies, but is generally caused by a flush in wells which increases the concentration of dissolved components in the cooling process. On rare occasions, the cause is a change in pH, which is caused by the mixture of production fluid in multi feed increases the scale precipitate.
0
200
400
600
800
1000
1200
1400
0 50 100 150 200 250 300温度(℃)
シリ
カ濃
度(pp
m)
非晶質シリカ溶解度
非晶質シリカ 過飽和領域
The solubility of amorphous silica
Temperature ( deg. C)
Silic
a co
ncen
trat
ion
(ppm
)
Fig.3-2-2-1:The solubility curb of amorphous silica

12
In the case of water-dominated fluid reservoirs, production fluid is produced with hot water, in the state of so-called two phase flow. The more production fluid which goes up to the ground, the less the pressure on the fluid becomes. Fluid tends to vaporize at certain points known as the flush point.
Inside the wells, there are certain points where the internal diameter is considerably
larger, making them the flush points. Most of the time, the scale precipitates there, but the flush points are not stationary due to other factors such as pressure in fluid reservoirs.
The scale precipitates occur wherever the flush point may be.
Scaling ( Flush point )
Fluid Fluid
Ground
Well
Fig.3-2-2-2:The image of scaling (1)

13
Multi feed points to the situation in which production fluid is taken at several points varying in depth. In this case, if one of production fluid is acid while the other is alkaline, it becomes neutral when the fluids mix. As mentioned before, the solubility of silica is also affected by pH, and the solubility is the lowest in neutral area if temperatures and pressures remain constant. When production fluid, super saturated in acid and alkaline is mixed with it, it becomes super saturated, creating a huge amount of scale. For this reason, scale precipitates. When there is a lot of precipitate, one side of the feed point is closed off even though it results in the decline in the amount of steam production.
There is no significant difference in the PH of production fluid in the Dieng
geothermal power plant, so it can be concluded that the cause of the scale in the wells is super saturation caused by flush, but not much information is available regarding where the scale actually are located.
Scaling
Fluid (Acid) Fluid (Acid)
Fluid(Alkaline) Fluid(Alkaline)
Ground
Well
Fig.3-2-2-3:The image of scaling (2)

14
Chapter4 Study for Optimum O&M 4.1 A measure for scale in steam turbines 4.1.1 Our specific approaches to the problem
Although silica scale clings to steam turbines in the Dieng geothermal power plant, it is not yet posing a serious problem. However, since the reservoirs contain a lot of silica, there is no denying that it will become a serious problem when supplemental geothermal fluid production wells are drilled and put into operation.
In term of scale clinging to the steam turbines, similar problems have occurred in
Tohoku Electric Power Company’s Uenotai geothermal power plant just after the start of commercial operations. In this case, setting up “turbine washing equipment” worked well. For this reason, I include the outline of the measures taken by Tohoku Electric Power Company bearing in mind that it may be applied to the Dieng geothermal power plant in future.
(1) Background
The Uenotai geothermal power plant [output 28.8MW(up from 27.5MW in February in 1997)] is located in Yuzawa city in Akita prefecture. Commercial operations started in March 4th in 1994 based on a joint development with Akita Geothermal Energy in charge of steam facilities and Tohoku Electric Power Co. in charge of generating facilities.
Just after the start of operations, an opening angle of governing values rapidly
increased during the rated output operation and then the output of the generators declined. After an inspection of the dismantled steam turbines, the cause was ascertained to be scale, which was clinging to the first-stage nozzles at the mouth of the steam turbines and the strainer before main stop valve. Left untouched, the steam turbines would have needed to be dismantled for inspections and cleaning every three months, so equipment for scale prevention was developed.
(2) The formation of scale
Silica, a component of scale, is considered to originate from silica dissolving in mist and in steam and each precipitates as follows.

15
① Precipitation of silica dissolved in mist a. Precipitation by flush
In the main stop valve・sub-stop valve・strainer, the pressure is slightly decreased, resulting in the flush of a hot water mist. Most of the silica scale clinging to the main stop valve・sub-stop valve・strainer is caused by such a flushing mechanism. It is assumed that silica precipitates and clings when the mist is super saturated with the silica over a period of time.
b. Precipitation by boiling
The numerical simulation and an experiment using geothermal steam confirms that at the steam outlet near the first-stage nozzle, the temperature of nozzle is higher than that of steam.(Amagasa 1995) Thus, at the outlet, mist coming into contact with and clinging to the surface of the nozzle boils and evaporates, leading to precipitation of the dissolved components, including silica, which then dry.
Most of the silica scale found in the first-stage nozzle at the mouth of the turbine in Uenotai was considered to have occurred by boiling.
② Precipitation of silica dissolved in steam
a. Precipitation caused by a decline in pressure Silica scale in Uenotai may have precipitated because of a decline in pressure, but
it is difficult to make such quantitive evaluations. b. Precipitation caused by a change in the state of steam
In Uenotai, the steam is not super heated; therefore, there is no silica precipitation caused by a change in the state of steam.
(3) Study for countermeasures
Scale is caused by flush and boiling and injecting water into the turbine can contain the problem stemming from both causes. For this reason, we concluded that the installment of “turbine washing equipment”, injecting clean water into main steam pipes, could prevent scale from clinging. Then the following tests and analyses were carried out.
① Outline of water flushing equipment
The water flushing equipment directly sprays circulating water into the main steam pipes. The water flushing point was set at just before the main stop valve so that there is sufficient distance to mix the injected water and steam at the mouth of

16
the steam turbines. Furthermore, in order to prevent erosion of the steam turbine, the moisture meter was installed at the mouth the team turbine.
② Results of the water injection test
The water injection test was conducted over 7months on site by changing time (1hour to 14days) and volume of injecting water (1.11to4.2t/h) with the following results. ・During water injections, scale keeps growing when there is less than 2.0t/h of water,
but it is contained when there is more than 2.0t/h of water. ・Results of the water injection test over periods as long as 2 weeks show that an
opening angle of the governing valve continues to decline, and in some cases, the refractory scale, including silica, is cleaned.
・According to the open inspection of the steam turbine after the water injection test, when the moisture level is below 2%( designed allowable value), there is little erosive effect on the turbine even though water is injected for long periods of time.
・Soon after the start of water injection, the opening angle of governing valves always sharply decline. This is considered to be because soluble scale, such as NaCl, is removed.
③ The use of the water injection equipment
Following various analyses based on the test results, stable operation is maintained in the power plant today by injecting water for approximately 2hours about every 2 weeks.
(4) Conclusion
To remove scale in the Uenotai geothermal power plant, turbine-washing equipment was installed and a water injection test was conducted. The results confirmed that water was effective for the prevention of and cleaning of scale at 2.0t/h.

17
4.1.2 Application to the Dieng geothermal power plant
Although silica scale is clinging to the turbine in the Dieng geothermal power plant, the situation is not yet serious and problems such as a decline in output have yet occur. However, once becomes a serious problem, the Uenotai geothermal power plant's example could be of great help.
In such cases, the problem is how much water should be injected and at what
frequency. This depends on the allowed moisture level which will differ according to what is made
from. Since the allowed moisture level is 2% in the Uenotai geothermal power plant, the verification test was conducted while monitoring figures. Then, the optimum volume of water and frequencies were confirmed. Therefore, if this equipment is installed in the Dieng geothermal power plant, the optimum volume of water injection and frequencies should be confirmed through similar steps taken by the Uenotai geothermal power plant although the equipment itself is simple and doesn’t require specific know-how.
Fig.4-1-1:The turbine-washing equipment
FX-233
Main Steam System
Turbine Exhaust System
CirculatingWater System
Water Injection Equipment System
Nozzle
Water Injection Pump
CirculatingWater Pump
Jet Condenser
GeneratorTurbine
CalorimeterTo Flash Steam Cooler
Governing Valve
Main Stop Valve
To Turbine Ground
Electromagnetic Flowmeter
Scale Separator
from Production Wells
Strainer
To Cooling Tower

18
-10
-5
0
5
10
0 10 20 30 40 50 60 70 80 90 100翼の幅(%)
温度
差(℃
)
翼表面の蒸気温度 - 翼表面のメタル温Steam temperature at the surface of nozzle - Metal temperature at the surface of nozzle
Diff
eren
ce o
f tem
pera
ture(℃)
Width of a nozzle(%)
0 20 40 60 80 100
蒸気
背面
腹面
スケールSteam
Scale
back
ventral
Fig.4-1-2:Steam temperature at the surface of nozzle - Metal temperature at the surface of nozzle
Fig.4-1-3:Scaling point on the nozzle

19
Tabl
e 4-
1-1:
The
open
ing
angl
e of
gov
erni
ng v
alve
s du
ring
wat
er in
ject
ion
Th
e op
enin
g an
gle
of g
over
ning
val
ves
Early period
Latter period
Period
Flow
rate
(t/h)
mm
/dd
Con
dens
er
Vac
uum
Th
e op
enin
g an
gle
m
m/d
d C
onde
nser
V
acuu
m
The
open
ing
angl
e
No. 9
No.10
H7.03.29 - 04.06
H7.04.10 - 04.17
1.2
1.2
03.30
04.12
84 mmHg
83 mmHg
73 %
75 %
04.06
04.17
84 mmHg
83 mmHg
75 %
80 %
No.11
No.12
H7.04.24 - 05.08
H7.05.11 - 05.25
2.0
2.1
04.27
05.11
83 mmHg
90 mmHg
73 %
87 %
05.07
05.25
83 mmHg
84 mmHg
70 %
85 %

20
タービン入口圧力
4.2
4.4
4.6
4.8
5.0
5.2
5.4
5.6
5 7 9 11 13 15 17 19 21 23 25 27 29 1 3 5 7 9 11 13日付(日)
kscg
平成8年6月 平成8年7月
平成8年度
加減弁開度
40
45
50
55
60
65
70
5 7 9 11 13 15 17 19 21 23 25 27 29 1 3 5 7 9 11 13日付(日)
%
平成8年6月 平成8年7月
平成8年
注水 注水注水
相対真空度
570
580
590
600
610
620
630
640
5 7 9 11 13 15 17 19 21 23 25 27 29 1 3 5 7 9 11 13日付(日)
mmHg
平成8年6月 平成8年7
平成8年度
Turbine inlet pressure 1996
June July ( day )
The opening angle of governing valves 1996
June July ( day )
Condenser Vacuum 1996
June July ( day )
Injection InjectionInjection
Fig.4-1-4:Turbine inlet pressure
Fig.4-1-5:The opening angle of governing valves
Fig.4-1-6:Condenser Vacuum

21
4.2 Measures for scale in wells 4.2.1 A way to prevent scale from clinging
As previously mentioned, the largest problem in the Dieng geothermal power plant
today is scale in geothermal fluid production wells, and chemical injection is being considered as a countermeasure.
Here I include some alternative considerations to chemical injections. At present, several geothermal power plants within the jurisdiction of Tohoku Electric
Power Co. have scale in wells, just like the Dieng geothermal power plant. The component of scale differs depending on the region with calcium carbonate scale as well as silica scale being the most common. If the main component is calcium carbonate, injecting clean water dissolves the scale relatively easily and the volume of steam soon recovers. On the other hand, once silica scale precipitates, it is not able to be dissolved unless quite strong acid is used and clean water alone will be insufficient.
Therefore, in the case of silica scale, it is important to prevent precipitate from occurring. From this point of view, innovative measures are being considered at this point in time.
To prevent scale in turbines, precipitation can be prevented by injecting clean water into the steam, which increases the moisture level. The basic principal is that this prevents super saturation from occurring, which can prevent scales in wells.
Since the reaction rate of silica is fast and the stratum contains a lot of silica,
production fluid maintains balance (a saturated state) with silica included in the stratum that is near the feed point. (“A silica thermometer”, which estimates temperatures from the concentration of silica in fluid, is famous and is widely used as a geochemical thermometer.)
In the case of sales in wells, unless precipitates occur due to the mixture of fluids
varying in pH, the cause is super saturation by flush. First and foremost, the fundamental problem is that the production fluid is saturated with silica.
Therefore, if the production fluid in a saturated state is diluted with water, it won’t
become super saturated even though flush occurs to some extent. In other words,

22
precipitation of silica is contained. In addition, when silica scale is generated, the main components of hot water, such as
NaCl might precipitate first and become the core of the silica scale, so by simply injecting water, the NaCl based precipitate can easily be dissolved, which prevents a core from emerging. As a result, the precipitation of silica scale could be contained
For above reasons, if a certain amounts of clean water is injected into wells, just like
turbine washing, it won’t be super saturated in wells, which means that scale will not precipitate and the component of silica will remain the same until it reaches the separator. If the component of silica remains the same until the separator, it could be removed in the injection pipe where scale prevention is already carried out.
Meanwhile, even if the silica scale slightly precipitates in the injection pipe, it can be dealt with much more easily than by removing scales from the wells.
The concern associated with injecting clean water is the decrease in output caused by
the fall in enthalpy or the solubility decline because of the temperature fall. However, the simulation in wells confirms that as long as injecting water is limited to a fixed amount, production fluid is not saturated with silica until it reaches the ground and the fall in enthalpy doesn’t pose a problem.
Water injection
Two
phas
e
Flush point
Scaling
Measures
Two
phas
eSt
eam
Fig.4-2-1-1:The image of the way of well water injection

23
Since calcium carbonate easily dissolves in water, the method of injecting water into wells proves effective in each geothermal power plant in Japan as a measure against calcium carbonate scale. Facilities for silica scale are exactly the same as facilities for calcium carbonate.
Facilities consist of an injection unit, a rewind drum, a lubricator, a coil tube, a tip
nozzle and among others. An injection unit, which injects condensed power plant water into wells through a coil
tube, comprises of pump, pipe, various measuring instruments, and electric system. A lubricator is a facility that fixes a coil tube and stores steam seal and a tip nozzle.
Using this, it is possible to install and collect a tube without stopping production. Based on experience in each geothermal power plant, the best material for tubes is
INCOLOY 825, which is especially corrosion resistant.. In addition, a tip nozzle also works as an anchor.
LGTank
Condensate water
Control panel
Injection pump
Injection pump
Injection unit
Rewind drum
Coil tube
INCOLOY 825
Lubricator
Tip nozzle
LGTank
Condensate water
Control panel
Injection pump
Injection pump
Injection unit
Rewind drum
Coil tube
INCOLOY 825
Lubricator
Tip nozzle
Fig.4-2-1-2:The water injection equipment

24
4.2.2 A way to remove scale
Prevention of scale, which works for other sites, is not always applicable because of the regional feature. However, even if scale precipitates, it won’t be a fatal obstacle for operations of a power plant as long as scale can be removed relatively easily at low cost.
For this reason, I include how to remove scale as follows. Generally, “ work over “ is used when scale precipitated in wells is removed. “work over
“removes scale by drilling with bit after the installation of rig, just like usual drilling. It is effective when scale precipitation occurs only inside wells, but a problem is its cost. Because rig is installed just like drilling , it requires relatively long construction periods with a large scale facility. The construction cost is quite high. To solve this problem, “Coiled Tubing” method is used in recent years. In “Coiled Tubing” method, a thin tube without seams is used as if it is a wire, so drilling pipes don’t need to connect and the construction is completed for a shot period of time. With the short construction period and simple facility, the cost is low. Furthermore, the construction is carried out while letting steam emit, therefore the work efficiency can be judged immediately. It also doesn’t have to interfere other wells or induce emission.
Meanwhile, a drawback of the “Coiled Tubing” method is that the maximum tensile load is low. If scale is solid or it has a casing trouble, a full examination is necessary before adopting this method.
A table of comparison based on experiences in the jurisdiction of Tohoku Electric Power Co. can be expressed as follows.
Table 4-2-2-1:A table of comparison with 2,000m class production well Rotary drilling Coiled tubing
Drilling fluid Water・Mud Air・Production fluid Possibility of interference High Nothing Separator/Silencer Need not Need A range of ground facilities removal
Wide Narrow
Induce emission Need Need not Maximum working depth 2,700m 2,600m Pipe up-down time 6 hours 3 hours Maximum tensile load 100 t 45 t Term of works 60 days 10 days Cost(In case of 1 as Rotary) 1 0.6

25
Fig.4-2-2-1:Work scenery by Coiled Tubing
Fig.4-2-2-2:Coiled Tubing

26
4.2.3 Application to the Dieng geothermal power plant The cause of the scale problem at the Dieng geothermal power plant is not the special mechanism but oversaturation. Tohoku Electric Power Co. now prevents scale from occurring in its jurisdiction by injecting clean water. If this method proves effective, it can be applied to the Dieng geothermal power plant.
With its efficiency, “work over” by coild tubing seems appropriate to the Dieng geothermal power plant, which can’t stop operations for a long period of time. However, scale in wells at the Dieng geothermal power plant is considered to be hard because its main component is silica; therefore, whether this method is applicable or not should be decided after the experimental use. 4.3 High efficiency operation of Cooling tower
As described before, the Dieng geothermal power plant has a huge after cooler, but a
huge cooling tower also catches our eyes. Since the total number of cooling fans amounts to 18, cooling capability is quite high. The cooling tower was capable of cooling circulating water from 36.1℃ to 18℃. Consequently, the vacuum level is 93.3 kPa and the operation was carried out in a high vacuum. (almost the design value). If the vacuum level is high, it is possible to get the large output even though the amount of steam is the same because the adiabatic heat drop becomes large. However, the balance with the power spent for that purpose is important. In other words, the optimum point needs to be decided comparing the increased output because of being high vacuum and the power that is spent for cooling fans.
Although it depends on equipment, including the deterioration level of the equipment,
the number of cooling fans is not always proportionate to the vacuum level. In addition, the vacuum level in the condenser is not completely proportionate to the output. The vacuum level also varies depending on whether the load is rated or partial.
Therefore, it is impossible to judge from generalization, but considering all cooling
fans in the cooling tower are operated at the partial load in the Dieng geothermal power plant, it should be clarified how vacuum level in the condenser and net output changes when stopping fans one by one.

27
The number of operating cooling fan vs.Condenser Vacuum (An example)
70
75
80
85
90
95
18 17 16 15 14
The number of operating cooling fan
Conde
nse
r V
acuu(kP
a)
Condenser Vacuum vs.Correction Coefficient (An example)
-5
-4
-3
-2
-1
0
1
87.989.390.692.093.394.796.097.498.7
Condenser Vacuum (kPa)
Corr
ection
Coef
ficie
nt(%
)
Fig.4-3-1:Relations between the number of operating cooling fan and condenser vacuum
Fig.4-3-2:Relations between condenser vacuum and output correction coefficient

28
Chapter 5 CDM feasibility study 5.1 Information related to CDM in Indonesia
Geothermal power generation uses natural energy. It is effective for prevention of the global warming because basically, CO2 emissions are small. For this reason, it is positioned as a power source for CDM/JI based on the Kyoto Mechanism. As long as conditions are met, geothermal power generation will generate CO2 credits, creating added values.
The most fundamental condition is whether a country ratifies the United Nations Framework Convention on Climate Change (UNFCCC) and the Kyoto Protocol. Furthermore, whether the Designated National Authority(DNA) is set up within the country is also a basic condition.
The Indonesian government ratified the Kyoto Protocol on December 4th in 2004. Although it took some times to make deliberations within the country, the DNA was officially established in Indonesia. Indonesia is now listed on the DNA list of UNFCCC.
The following describes detail information related to CDM. (1) Ratification and participation in the UNFCCC
Indonesia signed the UNFCCC in 1992 and ratified it in accordance with the ordinance No6.
(2) Ratification of the Kyoto Protocol
The ratification of the Kyoto Protocol had been delayed in Indonesia not by the national resolution but by procedures related problems. Indonesia ratified the Kyoto Protocol on December 3rd and was taken effect on March 3rd in 2005.
(3) The establishment of the DNA
The DNA was established in Indonesia in July 2005, which means Indonesia meets conditions to participate in CDM project activities as Non AnnexⅠParties depicted in the Marrakesh Agreement, which includes detailed regulations of the Kyoto Protocol. Now, Indonesia is eligible to approve CDM projects.
The DNA is a national CDM committee (NCCDM) consisting of the following 9 ministries and agencies.

29
①Ministry of Environment ②Ministry of Energy and Mineral resources
③Ministry of Forestry ④Ministry of Industry ⑤Ministry of Foreign Affairs ⑥National Development Planning Board) ⑦Ministry of Home Affaires ⑧Ministry of Transportation ⑨Ministry of Agriculture
The deputy minister of MOE (Environmental Conservation) is appointed to the chairman of the NCCDM.
The NCCDM comprises of standing organizations, “secretariat” and “engineering team”. If necessary, it can seek assistance to “expert advisors” and “stockholder’s forum”.
(4) Procedure for the approval of the project ① Documents, which should be submitted to the DNA
The following documents should be submitted a. Application form(description to meet criterion) b. Project Design Document(PDD) c. Environmental Impact Assessment(EIA) d. The record of public consultations e. Recommendation from the Ministry of Forestry (only for forestation CDM) f. Others
② Procedure for the approval of the CDM
It takes 11weeks to reach a conclusion regarding the government’s approval letter after application form is submitted to DNA. (Except for revisions)
(5) Criteria for sustainable development of the CDM projects. Applicants need to prove
that the proposed project meets the following criterion. ① Environmental sustainability
Environmental sustainability that can preserve natural recourses and natural diversity ・Preservation of eco system

30
・Complying with existing national and regional environmental standards and regulations
・Preserving genetically biological species(genetic contamination is not allowed) ・Complying with the land exploration plan
Health and safety of regional society ・There should be no health risks
・Complying with vocational health standards and regulations ・There should be a procedure regarding the adequate control and actions based on
documents against possible accidents. ② Economic Sustainability
Prosperity of regional society ・There should be no negative effects on regional income ・There should be adequate measures to deal with a decline in incomes of local
residents. ・There should be an agreement with stakeholders to deal with lay off issues in
accordance with existing laws. ・Regional public services shouldn’t be declined ③ Social Sustainability
Participation in the project by regional society ・Making consultations to regional society. ・Comments and complains from regional society are taken into account.
Trust from regional society ・The project doesn’t cause confrontations in regional society. ④ Engineering Sustainability Technology transfer ・Knowledge and the operation of equipment is fully transferred without depending on
foreign countries. ・Technology is neither experimental nor obsolete. ・Technological ability and its application is promoted in the region.

31
Fig.
5-2-
1:A
ppro
val p
roce
ss fl
owch
art
Proj
ect
Prop
onen
t
Secr
etar
iat
Re
ceive
d ap
plic
atio
n
docu
men
t
Inte
rnal
C
oord
inat
ion
Mee
ting
of th
e co
mm
issio
n
Tech
nica
l G
roup
Ev
alua
tion
Secr
etar
iat
Rece
ived
Eval
uatio
n Re
ports
Dec
issio
n-m
akin
g M
eetin
g of
the
Com
miss
ion
lette
r of
appr
oval
Sect
oral
W
orkin
g G
roup
Stak
ehol
der F
orru
m
Spec
ial M
eetin
g
Expe
rt G
roup
Ev
alua
tion
Prop
osed
Pr
ojec
t do
es
not
mee
t th
e cr
iteria
(D
ata
in a
pplic
atio
n do
cum
ents
ne
ed to
be
com
plet
ed)
(Pr
ojec
t Des
ign
need
s to
be m
odifi
ed)
5da
ys
5da
ys
21da
ys
1da
y
Proj
ect
Prop
onen
t
Expe
rt G
roup
Ev
alua
tion

32
5.2 Related agencies and a trend of capacity building A trend of capacity building in Indonesia as follows. ① With the cooperation of the World Bank and GTZ, a national strategy for CDM in
the energy sector was drawn up mainly by the Ministry of Environment and NGO (Pelangi) in 2001.
② The Dutch government seems to actively work on Indonesia to sign a bilateral CER sales agreement with the Netherlands.
③ The NEDO and the IGES in Japan supported Indonesia’s approaches by co-hosting workshops in 2003 and 2004.
While the agencies of DNA and a part of officials in related to the government
agencies are well aware of CDM, there is a lack of awareness among other government agencies and people concerned. In addition, generally, industry doesn’t have much interest in the CDM, so capacity building needs to be expanded.
5.3 The CDM projects applied to the DNA
Although Indonesia officially established the DNA in July in 2005, staff members were officially positioned in December. However, due to swift actions taken by the DNA, the following 5 projects were officially approved as of January in 2006. ① The project utilizing solar heat ②,③ The project concerning cements ④ The project utilizing palm oil ⑤ The project utilizing methane from excrement of domestic animals Feces and
urine
In terms of above 5 projects, Indonesia got approval from the environmental minister and applied for the registration to the UNFCCC before the establishment of the DNA. For this reason, the government immediately approved these projects since it was considered that projects had been already approved (examined).

33
5.4 Possibilities of geothermal power generation projects for CDM (1) Methodology
At present, when it comes to geothermal power generation development,“ACM-0002” and “AM-0019” are registered as new methodology of the UNFCC.
ACM-0002,which is based on Darajat unit III in Indonesia, evaluates generated power as replacement to the average grid electricity by connecting to grid. Under this methodology, geothermal power generation is not simply approved as a shift from fossil fuel power generation.
In addition, AM-0019 is based on “Lihir Project” in Papua New Guinea. In this methodology, geothermal power generation could be a replace from fossil fuel power generation.
(2)The registration for the DNA
When it comes to geothermal power generations, Darajat unit III project of Amoseas Indonesia Inc.(Chevron’s capital)had been applied for registration to the UNFCCC together with the above mentioned projects. However, its PDD is being modified at present because there was a complaint regarding how to calculate the CO2 emission factor in the methodology. Therefore, no projects concerning geothermal power generation have been applied to the DNA.
Chevron is in charge of calculating CO2 emission factors, which will be made public through the DNA as official values in Indonesia. Thus the same emission factors can be used if it connects to the same grid this year

34
Chapter 6 Study for the possibility of participation in geothermal power generation
6.1 Energy conditions in Indonesia 6.1.1 Overall conditions
Indonesia consists of 33 provinces under republic system. President is the head of state as well as the head of the administrative body. Susilo Bambang Yodhoyono was officially sworn in the 6th president in October, 2004.
The parliament in Indonesia is People's Consultative Assembly (MPR), MPR makes up Peoples Representative Council (DPR , The fixed number : 550) and Regional Representative Council (DPD,The fixed number:128).
Indonesia’s economy suffered most in ASEAN courtiers and Korea by Asian financial crisis in July 1997and the GDP growth rate in 1998 dramatically declined to 13.13%. After that, the GDP growth rate was shifted as follows: 0.79% in 1999, 4.29% in 2000, 3.45% in 2001, 3.69% in 2002, and 4.5% in 2003. Based on such growth, major macro economic indexes are improved including reduction of inflation, stock price rise and stabilization of the rupia.
Indonesia, which is rich in resources, sets up the policy, “ generating the best possible benefit by fossil fuel and delaying the depletion of resources” in the second long term national development plan. 6.1.2 Energy situation and policies
The Indonesia’s comprehensive energy policy (February in 1998) raises the following five items as basic policies. ・Diversification of energy ・Intensifying exploration of energy resources ・Energy saving ・Energy price (price adjustment) ・Concern for the environment (1) Water resources
Water reserves in Indonesia are assumed 8,200kW. Hydraulic power generation

35
facilities are 301.5million kW at the end of 2000 and much remains to be undeveloped, but in Java island where demand is high, most places are already developed. Water reserves are concentrated in Sumatra, Kalimantan, Irian Jaya, but large scale development cannot be hoped because areas that need electricity are small and spotted. However, small-scale water development is expected to play a large role as social development projects. (2) Oil
Indonesia has 5 billion barrels of oil reserves as of the end of 2001, The central part of Sumatra has the largest oil production, followed by the north west coast of Java island, East Kalimantan and the sea near the Natuna .
Indonesia is the only OPEC member in Asia and one of the largest oil producing countries, but there are concerns that oil reserves will run out, so the government encourages citizens to shift form oil to coal and gas. (3) Natural gas
It is confirmed that natural gas reserves in Indonesia are 2triion 590billion ㎥ as of the end of 2001, which is the largest oil reserves in South East Asia. Gas fields are situated in North Sumatra, East Karimantan, off shore of East Java and the sea near the Natuna.
60% of Natural gas is exported as LNG and becomes a crucial means to gain foreign currency. (4) Coal
Coal reserves in Indonesia are 5.1billion tons as of the end of 2001.The major production sites are South Sumatra, Kalimantan、Jambi、Riau among others. Coal production has become 12 times for these 10 years.
The Indonesian government places coal as important resources replacing oil. (5) Renewable energy resources
Indonesia is one of countries that have many volcanoes with more than 130 active volcanoes across the country. It is assumed that potential geothermal capacities are about 20million kW (1995).
Several geothermal power plants have already started operations, generating 360, 000kW in the total output (2000). A lot of geothermal development projects including IPP were planned, but they were suspended because of the financial crisis. However

36
they have been reviewed again due to the shortage of power supply in recent years. New energy such as wind and sunlight is expected to contribute to local power supply.
The metrological agency investigates and sorts out basic data concerning new energy and the Ministry of Energy and Mineral Resources (MEMR)gets involved in research and development.

37
6.2 Extension plan for the Dieng geothermal power plant 6.2.1 A development schedule
At present, an extension plan is under way in the Dieng geothermal power plant. According to the schedule, No2 will start commercial operations in 2008 and No3 will be put into operations in 2009.
This extension project includes not only the Dieng geothermal power plant but also Patuha region that is close to Bandung. It is a large scale project including the construction of geothermal power plants ( the total output 300MW).
Table 6-2-1-1:A development schedule 2005 2006 2007 2008 2009 2010 Dieng No.2 (60MW) ▽
Dieng No.3 (60MW) ▽
Patuha No.1 (60MW) ▽
Patuha No.2 (60MW) ▽
Patuha No.3 (60MW) ▽
:A construction period ▽:Commercial operations start
Bandung
ディエン
パトゥーハ
Bandung
Fig.6-2-1-1:A location map of Dieng and Patuha area

38
6.2.2 Project Participants
Project entity is PT Bumigas energi (hereafter Bumigas), which gains development rights from PT GEO DIPA, based on BOT for 15 years per unit.
Under this plan, the total of 300MW electricity will be generated (Dieng is 120MW and Patuha is 180MW), but Bumigas got power sales rights up to 800MW , and has a plan to extend each to 400MW.
Pertamina ( National oil
company)
PLN(National electric
company)
PT GEO DIPA
PT BumigasPT Citra(Drilling company)
PT Rekayasa(EPC company)
Joint-Venture to develop geothermal plants67% 33%
BOT Contract for 15 years per unit
BOT Consortium
Financier
Planning (O&M company)
Joint-Venture
30%
70%
Pertamina ( National oil
company)
PLN(National electric
company)
PT GEO DIPA
PT BumigasPT Citra(Drilling company)
PT Rekayasa(EPC company)
Joint-Venture to develop geothermal plants67% 33%
BOT Contract for 15 years per unit
BOT Consortium
Financier
Planning (O&M company)
Joint-Venture
30%
70%
Fig.6-2-2-1:Project Participants

39
6.2.3 Project Contractual Relationship
Power sales revenues from PLN is first deposited in the escrow account, then 60% goes to Bumigas, 30% goes to the O&M company and 10% goes to PT GEO DIPA.
Bumigas, which receives 60%, puts this money towards covering the capital cost of the
project including interest payment. Meanwhile, 30% of revenues is given to the O&M company, but this rate is rather high
considering the level of personnel costs. On the other hand, despite interest is set at 6%, the capital cost is relatively low. In other words, the initial capital cost is low.
Indonesia adopts so- called External form standard taxation, imposing 6% tax on
revenue from power sales and it is coved by PT GEO DIPA, which receives 10% of revenues. Remaining 4% is supposed to be accumulated in PT GEO DIPA as “debt reserves”.
PLN(National electric
company)
PT GEO DIPA
PT Bumigas Planning (O&M company)
Escrowaccount
USD Payment
30%
10%
60%
Electricity sales PLN(National electric
company)
PT GEO DIPA
PT Bumigas Planning (O&M company)
Escrowaccount
USD Payment
30%
10%
60%
Electricity sales
Fig.6-2-3-1:Project Contractual Relationship

40
6.2.4 Evaluation profitability of the project
(1) Overview
The total project cost is about 500 million $. Although the cost changes depending on
the number of wells, it is calculated one unit will cost around 100 million $. In terms of revenues stems from power sales to PLN, 60% is planning to go to Bumigas,
30% will go to O&M and remaining 10% will be earmarked to taxes and others. There are a lot of hot springs, geysers and sulfur geysers in the Dieng geothermal
region, which suggests geothermal resources are plenty. It is estimated that geothermal resources are at least 300MW. During the development of No1, it was turned out that the temperature of reservoirs is 270℃ to 340℃ and the depth is 2,000 to 2600m. The potential is high.
It is obvious that the most important thing to evaluate profitability of the project is the
accuracy of assumed income and expenses. Income is calculated by multiplying generated electricity by electric price. Geothermal development is said to be risky because an accurate projection is difficult. In other words, since steam production depends on nature in geothermal power generation, production risk is high compared to fossil fuel power generation. However, in the extension project, confirmed geothermal resources will be used, so production risk is considered to be low.
Meanwhile, even if power is generated as expected, income will decrease unless
generated power is sold as planned, so a long term contract with the PLN, so-called the credibility of PPA, is extremely important. In addition, interest on finances is inverse proportion to the reliability of the project. When the reliability is high, interest is low and income from the project becomes high. On the other hand, if the credibility is low, interest goes up, resulting in low profitability of the project.
At a time of the financial crisis, which occurred from 1997 to 1998, PLN couldn’t fulfill its duty to buy electricity at promised prices. Consequently, it lost credibility in international society. However, after that, the PLN re-negotiated various kinds of long-term power sales contracts focusing on practicality. As a result, the PLN seems to

41
have no default risk at present. Generally, steam production declines naturally in geothermal power generation, so it
needs to maintain the output by drilling supplemental wells periodically. In this sense, projection regarding decline is significant because drilling wells costs a lot. However, projection is not always accurate since the steam production also depends on nature. If production capacity of reservoirs is overestimated, more than expected number of supplemental wells will have to be drilled, resulted in the sharp fall in project income.
The total production scale in the region is confirmed 300MW, which is sufficient to add
at least two of 60MW. Thus, risk of over exploitation is low. Drilling unexpected number of supplemental wells is unlikely to occur in future.
However, although above evaluation is applied to overall capacity of reservoirs, there
is no denying that steam production will decline because of local decay of wells. Specifically, scale clinging to the inside wells could cause obstacles in production. Usually in this case, “work over” is used to recover production, but “work over”, which needs large-scale facilities just like drilling, is relatively expensive and becomes a factor to deteriorate the project balance.
In this region, existing No1, which has scale in its wells, has already deteriorated.
Therefore, “pessimistic” expense projection will be necessary for the additional equipment reflecting frequencies of “work over” and the cost based on experience of No1.
(2) Calculation of profitability
Based on conditions confirmed in this survey, we calculated the profitability according to various variable factors. The results are expressed as follows.
Generally, the discount rate can be calculated by “risk free rate and risk premium”, but here we use 6.8%, which is the yield of 10-year government bond in US dollars issued by the Indonesian government. Since its evaluation varies depending on project participants, we use risk premium as the parameter and made calculations setting the discount rate at 6.85%, 10% and 15%.
For detailed calculations, please refer to attached material.

42
a. Impact of additional wells
Geothermal power generation needs supplemental wells to maintain the rated output since production steam generally declines. Regardless of the constant rated output, it is possible to operate power generation depending on natural course of event. However, the economic assumption shows that maintaining the rated output by drilling supplemental wells is much more cost efficient than letting it run its course.
($)
6.85% 109,182,789 102,969,672 91,811,11610.00% 84,932,799 81,014,645 73,509,87015.00% 59,508,206 57,596,125 53,480,513
Discountrate
7 New Wells 3 New Wells No New Wells
Sensitivity analysis with the number of Makeup wells (Output)(Decline rate:5%,Makeup well steam flow rate:45t/h)
50
60
70
80
90
100
110
120
5.00% 7.00% 9.00% 11.00% 13.00% 15.00% 17.00%
Discount rate
NP
V(m
illio
n $
)
7 New Wells (Maintain steam)
3 New Wells
No New Wells
Fig.6-2-4-1:Sensitivity analysis with the number of Makeup wells

43
b. Impacts of the rate of decrease In this region, the rate of decline is about 5%, but this rate is not always applicable
because supplemental wells are drilled in different places. Supposing the rated output is maintained, a small change in the rate of decline seems to have little effect on the economic aspect.
($)
5% 6% 7% 8%6.85% 109,182,789 106,294,469 104,482,108 102,027,463
10.00% 84,932,799 82,774,984 81,353,901 79,645,60015.00% 59,508,206 58,075,470 57,102,958 56,104,568
Decline rateDiscountrate
Sensitivity analysis with Decline rate(Maintain steam,Makeup well steam flow rate: 45t/h)
50
60
70
80
90
100
110
120
5.00% 7.00% 9.00% 11.00% 13.00% 15.00% 17.00%
Discount rate
NP
V(m
illio
n $)
Decline rate:5%
Decline rate:6%
Decline rate:7%
Decline rate:8%
Fig.6-2-4-2:Sensitivity analysis with Decline rate

44
c. Impact of steam produced in additional wells Furthermore, with supplemental wells being drilled, steam production in this region
is expected to reach about 45t/h/, however, it is not always the case. It has turned out that there is not much difference in economic efficiency when the production steam is 45t/h per well and when it is 5t/h per well.
($)
45t/h 25t/h6.85% 109,182,789 103,928,283
10.00% 84,932,799 81,252,19415.00% 59,508,206 57,345,119
Makeup well steam flow rateDiscountrate
Sensitivity analysis with Makeup well steam flow rate(Decline rate:5%,Maintain steam)
50
60
70
80
90
100
110
120
5.00% 7.00% 9.00% 11.00% 13.00% 15.00% 17.00%
Discount rate
NP
V(m
illio
n $
)
Makeup well steam flow rate:45t/h
Makeup well steam flow rate:25t/h
Fig.6-2-4-3:Sensitivity analysis with Makeup well steam flow rate

45
d. Conclusion I made a sensitivity analysis using parameters such as the number of wells, which
are drilled, the rate of decline and steam production when supplemental wells are drilled. Comparing these parameters, the IRR has larger impact on the economic efficiency of the project
When the rated output is maintained with the rate of decline at 5 % and the volume of the production steam at 45t/h, it is worth 117million dollars if the assumed discount rate is 6%. On the other hand, it is worth only 60million dollars if it is assumed that the discount rate is 15%.
For this reason, projects organizers, who intend to invest into this project, need to judge how much risk is involved in this project and how much return they hope.
When they hope around 15 % of the IRR, the value of this project has become significantly low and it is difficult to promote it. Judging from the construction cost of the plant, the expected IRR is considered to be around 10%.
6.2.5 Possibility of participation in the project
As describes above, the extension plan in this region can be judged good as a whole, however, the necessary project cost amounts to over 60 billion yen. It is considered that raising this amount of money depending solely on private loans involves a great deal of risk, so financers that offered financial contributions to Bumigas have not implemented it.
Thus, the initial plan of completing finance close in November 2005 and starting the
construction of Dieng No2 is likely to be delayed.

46
6.3 Geothermal development plan in the Sarulla region 6.3.1 Overview
This region offers high potential for geothermal development and is being promoted followed by the Dieng & Patuha extension plan. CO2 credits are expected to be about 700,000CO2-t/year. Since our participation in this project seems highly significant, we also conducted the survey.
The Sarulla region is located about 200km southwest of Medan on the Sumatra Island.
Form early 1993 to the middle of 1998, Pertamina and Unocal carried out research in this region. Research included geological survey, geochemical survey and geophysical exploration. Based on the results, 3 wells were drilled.
Research confirmed 3 geothermal sites, such as Eastern Sibualbuali, Silangkitang, Namora-I-Langit, which will make it possible to generate 330MW of electricity over a period of 30 years.
サルーラ地域Sarulla area
Medan
Namora-I-Langit
Silangkitang
Eastern Sibualbuali
Fig.6-3-1-1:A location map of Sarulla area

47
6.3.2 Development plan
In Sarulla region, 3 geothermal sites mentioned above have been confirmed, but the current development plan only covers Silangkitang and Namora-I-Langit.
Under the plan, No.1 and No.2 of Silangkitang (50MW) will start commercial operations in 2009, followed by No.1,2,3 of Namora-I-Langit (65MW), which will be put into commercial operations in 2010. Meanwhile, the Indonesian government has a strong desire to start power generation in this region at the earliest possible time due to growing power demand in the country. Therefore, there is another plan to start commercial operations of No.1 of Silangkitang in FY 2007 with 25MW×2.
Table 6-3-2-1:A development schedule (Commercial operation start) 2009 2010 Silangkitang No.1(50MW) ▽
Silangkitang No.2(50MW) ▽
Namora-I-Langit No.1 (65MW) ▽
Namora-I-Langit No.2 (65MW) ▽
Namora-I-Langit No.3 (65MW) ▽
6.3.3 Development structure Development entity of this region is PT Geo Sarulla, co-financed by PT GEO DIPA(45%) and Mega Power Mandiri (55%). Basically, PT GEO DIPA is in charge of steam production and Mega Power Mandiri is in charge of power generation. PT Geo SARULLA opened its office in Jakarta in December 2005, but was not officially registered as of January 2006. However, both PT GEO DIPA and Mega Power Mandirisend staff to the office and around 6 people are always work there to promote the project. PLN, which is also planning to invest capital in PT Geo Sarulla, will acquire 20% of shares from PT GEO DIPA. Mega Power Mandiri is a subsidiary of PT Bukaka,which had constructed hydropower plants and transmission grids. However, it has no experience of building a geothermal power plant, so it is improving development structure by hiring ex employees of Pertamina.

48
6.3.4 Possibility of participation in the project
In the Silangkitang region, which is to be developed first in the Sarulla region, 3 wells have already confirmed steam that will generate 50MW of electricity. Production steam per well is the world largest class and the reservoir there is really attractive.
In addition, steam that is necessary for power generation has already been confirmed. Since there is no need to drill new wells, it is possible to construct a power generation at low price.
For this reason, our participation in the plan to develop No.1 of Silangkitang has a lot of advantages, but PT Geo Sarulla doesn’t have to increase partners unless our participation will bring some benefits to it.
There seems to be a number of merits for PT Geo Sarulla. One of them is the CDM. Generally, the development of geothermal power plants will generate CO2 credits, which will create economic added value. Particularly, the CDM under the Kyoto Mechanism is forming a global market, so being well aware of its system and obtaining approval as a CDM project would be highly beneficial to the company. As described before, the CDM is not well recognized in Indonesia. PT GEO DIPA has just appointed persons in charge of the CDM and they are now studying its system and procedure.
Since they have not yet understood the CDM to get CO2 credits, our participation in the plan and supporting the CDM would be favorable to PT Geo Sarulla (PT GEO DIPA and Mega Power Mandiri).
Mega Power Mandiri
PT Geo Sarulla
45%(25%) (20%) 55%
( ) : A future plan
PT Bukaka Teknik Utama Tbk.
Pertamina ( National oil
PLN (National electric
PT GEO DIPA
Joint-Venture67% 33%
Fig.6-3-3-1:Project Participants

49
Chapter 7 Conclusion 7.1 Measures for scale and the optimum O&M
This survey was carried out to understand the extent of the scale problem at the Dieng geothermal power plants and its causes and to provide a basis for a detailed examination which will lead to setting up effective countermeasures.
The survey has confirmed that the silica scale that precipitates in wells is posing a
problem at the Dieng geothermal power plant and injecting chemicals is being examined as a countermeasure.
Once silica precipitates, it is not able to be dissolved unless quite strong acid is used,
so its countermeasures need to focus on preventing precipitate from occurring. In this sense, the development of effective chemicals is expected.
However, even if effective chemicals to prevent scale are developed, the problem is
their cost. There are various kinds of chemicals, known as “inhibitors”, which work for calcium carbonate scale, but they are not actively used because of the price.
Taking these points into account, Tohoku Electric Power Co. is trying to contain silica
scale in wells within its jurisdiction by injecting clean water. If effectiveness of this method proves, it can be applied to geothermal power plants around the world that have similar problems and we could do international technology transfer.
In addition, although it is not yet posing a serious problem, considering the
components of steam, silica scale clings to steam turbines might become a serious problem at the Dieng geothermal power plant. However, there is no particular problem in the Dieng plant, so the scale in turbines can easily removed by installing “turbine washing equipment”. 7.2 Possibility of CDM projects
When it comes to the CDM, the Designated National Authority (DNA) started to function in December 2005 in Indonesia. We confirmed that so far the government has approved 5 projects, but no geothermal power generation projects have obtained the

50
government approval. (One is modifying the PDD to recalculate the Emission Factor) Once it’s approved as a CDM project, economic added value will be created. In this
sense, the development of the relevant project is worth watching, but the CDM is not fully understood in Indonesia. For this reason, there is a need for us to support the CDM in the case of new geothermal development and our active involvement is expected. 7.3 Possibility of participation in geothermal power generation
Together with this survey, we interviewed local people concerning PT GEO DIPA, the
project entity, about the possibility of our participation in the O&M project, the matter of participation, the possibility of capital contribution in the extension plan and necessary procedures which will accompany it. We collected detailed information on the Dieng & Patuha extension plan as well as the geothermal development plan in Sarulla region.
In terms of the extension plan of the Dieng geothermal power plant, undisclosed
material on geothermal reservoir evaluation has confirmed that stem is sufficient to build a new power plant. We realized its high potential.
Furthermore, in the Sarulla region, 50MW-worth of steam, sufficient for the
development of No.1 of Silangkitang, has already been confirmed. We made sure that the construction could be carried out with low risk and at low price.
As mentioned, though geothermal recourses are rich at the surveyed site, the
development has not been made progress since the Indonesian government cannot raise sufficient funds.
For this reason, if we make proposals to convince the Indonesian counterpart that
our participation will be beneficial to raise necessary funds, the project would be taking a great step forward.

51
7.4 Suggestions
This survey has made us understand the high potential of geothermal resources in Indonesia. At the same time, we realized that the construction of geothermal power plants has not made progress since the Indonesian government cannot raise sufficient funds.
The most effective way to break this situation is considered to be that advanced
countries provide development funds. Therefore, Japan’s active involvement, including the support of the CDM, will promote the construction of geothermal power plants in Indonesia.
Here, I include promising project plans. 【First Stage】
This survey.
【Second Stage】 With the cooperation of Indonesian parties concerned, Japanese company will
conduct F/S by using public fund in FY2006. Specifically, Japanese company will draw up PDD in CDM F/S and carry out validation. In addition, Japanese company will sort out information that is necessary on requesting for financing to government-affiliated financial institutions while examining Japanese company’s investment possibilities of SPC in F/S.
Start of Construction
- drawing up PDD- validation- evaluation of
geothermal recourses- economic evaluation
Third Stage
ImplementingF/S
Second Stage
Start of Commercial Operation
Forth Stage
-construction consultantー plant export
Final Stage
Closing of Finance
- investment in SPC- request to JBIC for
financing
-acquisition of CO2 credit-O&M consultant
PreliminaryResearch
First Stage(now)
Involvement of Japanese company
Discussion with parties concerned implementation completionevaluation
Fig.7-4-1:Project Flow

52
【Third Stage】 As a result of F/S,if Japanese company concludes that the project is promising, we
will invest in SPC in order to reap the benefit of the project. Japanese company will also make a request to government-affiliated financial institutions for financing on better conditions so that profitability of the project can be enhanced. We assume that finance of government-affiliated financial institutions will be foreign direct financing based on Project Finance.
【Forth Stage】 For the purpose of streamlining and increasing profitability of the construction of a
geothermal power plant in a responsible manner, Japanese company will undertake consulting. And we assume that Japanese company will export the plant.
【Final Stage】
After the start of commercial operation, Japanese company will be in charge of O&M consulting so that we can be responsible for streamlining and increasing profitability of the project. In addition, we hope all CO2 credits will be given to Japanese company.

Appendix
Calculation Sheet

Dis
count
rate
:6
.85%
○C
alcula
tion s
heet(
Ele
ctr
icity
Price 4
.45¢
/kW
h(a
t 2003, In
flat
ion:1
.5%))
Year
2005
2006
2007
2008
2009
2010
2011
2012
2013
2014
2015
2016
2017
2018
2019
2020
2021
2022
Ele
ctrici
ty V
olum
eM
Wh
473,
040
473,
040
473,
040
473,
040
473,
040
473,
040
473,
040
473,
040
473,
040
473,
040
473,
040
471,
697
473,
040
473,
040
473,
040
Ele
ctr
icity
Price
¢/kW
h4.4
54.
794.
874.
945.
015.
095.
165.
245.
325.
405.
485.
565.
655.
735.
825.
90
Ele
ctr
icity
Reve
nue
$22,6
77,1
30
23,0
17,2
87
23,3
62,5
46
23,7
12,9
84
24,0
68,6
79
24,4
29,7
09
24,7
96,1
55
25,1
68,0
97
25,5
45,6
19
25,9
28,8
03
26,3
17,7
35
26,6
36,6
69
27,1
13,1
89
27,5
19,8
86
27,9
32,6
85
O&M
cost
$6,8
00,0
00
6,9
02,0
00
7,0
05,5
30
7,1
10,6
13
7,2
17,2
72
7,3
25,5
31
7,4
35,4
14
7,5
46,9
45
7,6
60,1
50
7,7
75,0
52
7,8
91,6
78
8,0
10,0
53
8,1
30,2
04
8,2
52,1
57
8,3
75,9
39
Tax
,oth
ers
$2,2
67,7
13
2,3
01,7
29
2,3
36,2
55
2,3
71,2
98
2,4
06,8
68
2,4
42,9
71
2,4
79,6
15
2,5
16,8
10
2,5
54,5
62
2,5
92,8
80
2,6
31,7
74
2,6
63,6
67
2,7
11,3
19
2,7
51,9
89
2,7
93,2
68
Net
work
ing
Cap
ital
$453,5
43
6,8
03
6,9
05
7,0
09
7,1
14
7,2
21
7,3
29
7,4
39
7,5
50
7,6
64
7,7
79
6,3
79
9,5
30
8,1
34
8,2
56
Cap
ital
exp
endi
ture
$0
00
03,0
00,0
00
3,0
00,0
00
03,0
00,0
00
3,0
00,0
00
03,0
00,0
00
03,0
00,0
00
3,0
00,0
00
0
Cas
hflow
$13,1
55,8
74
13,8
06,7
55
14,0
13,8
56
14,2
24,0
64
11,4
37,4
25
11,6
53,9
87
14,8
73,7
96
12,0
96,9
03
12,3
23,3
57
15,5
53,2
07
12,7
86,5
05
15,9
56,5
71
13,2
62,1
36
13,5
07,6
07
16,7
55,2
21
12
34
56
78
910
1112
1314
1516
1718
Dis
count
rate
%6.8
51.
000.
940.
880.
820.
770.
720.
670.
630.
590.
550.
520.
480.
450.
420.
400.
370.
350.
32
PV
$10,7
84,4
04
10,5
92,3
79
10,0
62,0
17
9,5
58,2
09
7,1
92,9
42
6,8
59,2
76
8,1
93,1
54
6,2
36,3
28
5,9
45,7
85
7,0
23,0
48
5,4
03,5
98
6,3
10,9
71
4,9
09,0
29
4,6
79,3
55
5,4
32,2
93
NP
V$
109,1
82,7
89
0
100
200
300
400
500
600
700
2008
2009
2010
2011
2012
2013
2014
2015
2016
2017
2018
2019
2020
2021
2022
生産蒸気量(t/h)
010
20
30
40
50
60
70
出力(MW)
補充
井7
本補
充井
生産
量:45t/
h減
衰率
:5%
(初年
度減
衰率
:20%)
出力
初期
坑井
生産
蒸気
量
総合
生産
蒸気
量
補充
井生
産蒸
気量
0
100
200
300
400
500
600
700
2008
2009
2010
2011
2012
2013
2014
2015
2016
2017
2018
2019
2020
2021
2022
生産蒸気量(t/h)
010
20
30
40
50
60
70
出力(MW)
1
.O
&M
cost
ass
um
ed it
30% o
f Ele
ctr
icity
Reve
nue
a
t firs
t ye
ar (A
ged
dete
riora
tion c
orr
ection
c
oeffic
ient:1.5
%)
2
.Tax
and O
thers
ass
um
ed it
10% o
f Ele
ctr
icity
R
eve
nue
3
.N
et
work
ing
Cap
ital
ass
um
ed it
2% o
f Ele
ctr
icity
R
eve
nue
4
.The c
ost
of m
akeup
well
assu
med
it 3
mill
ion $
Out
put
Tota
l ste
am fl
ow ra
te
Initi
al w
ells
stea
m fl
ow ra
te
Mak
eup
wel
ls st
eam
flow
rate
Mak
eup
wel
ls:7
Mak
eup
wel
l ste
am fl
ow ra
te:45
t/h
Dec
line
rate
:5%
(Initi
al d
eclin
e ra
te:20
%)
Steam flow rate
Output

Dis
count
rate
:6
.85%
○C
alcula
tion s
heet(
Ele
ctr
icity
Price 4
.45¢
/kW
h(a
t 2003, In
flat
ion:1
.5%))
Year
2005
2006
2007
2008
2009
2010
2011
2012
2013
2014
2015
2016
2017
2018
2019
2020
2021
2022
Ele
ctrici
ty V
olum
eM
Wh
473,
040
473,
040
473,
040
473,
040
473,
040
473,
040
471,
643
469,
841
473,
040
473,
040
473,
040
473,
040
473,
040
473,
040
473,
040
Ele
ctr
icity
Price
¢/kW
h4.4
54.
794.
874.
945.
015.
095.
165.
245.
325.
405.
485.
565.
655.
735.
825.
90
Ele
ctr
icity
Reve
nue
$22,6
77,1
30
23,0
17,2
87
23,3
62,5
46
23,7
12,9
84
24,0
68,6
79
24,4
29,7
09
24,7
22,9
48
24,9
97,8
84
25,5
45,6
19
25,9
28,8
03
26,3
17,7
35
26,7
12,5
01
27,1
13,1
89
27,5
19,8
86
27,9
32,6
85
O&M
cost
$6,8
00,0
00
6,9
02,0
00
7,0
05,5
30
7,1
10,6
13
7,2
17,2
72
7,3
25,5
31
7,4
35,4
14
7,5
46,9
45
7,6
60,1
50
7,7
75,0
52
7,8
91,6
78
8,0
10,0
53
8,1
30,2
04
8,2
52,1
57
8,3
75,9
39
Tax
,oth
ers
$2,2
67,7
13
2,3
01,7
29
2,3
36,2
55
2,3
71,2
98
2,4
06,8
68
2,4
42,9
71
2,4
72,2
95
2,4
99,7
88
2,5
54,5
62
2,5
92,8
80
2,6
31,7
74
2,6
71,2
50
2,7
11,3
19
2,7
51,9
89
2,7
93,2
68
Net
work
ing
Cap
ital
$453,5
43
6,8
03
6,9
05
7,0
09
7,1
14
7,2
21
5,8
65
5,4
99
10,9
55
7,6
64
7,7
79
7,8
95
8,0
14
8,1
34
8,2
56
Cap
ital
exp
endi
ture
$0
00
03,0
00,0
00
3,0
00,0
00
3,0
00,0
00
3,0
00,0
00
3,0
00,0
00
3,0
00,0
00
3,0
00,0
00
3,0
00,0
00
3,0
00,0
00
3,0
00,0
00
3,0
00,0
00
Cas
hflow
$13,1
55,8
74
13,8
06,7
55
14,0
13,8
56
14,2
24,0
64
11,4
37,4
25
11,6
53,9
87
11,8
09,3
74
11,9
45,6
51
12,3
19,9
53
12,5
53,2
07
12,7
86,5
05
13,0
23,3
03
13,2
63,6
52
13,5
07,6
07
13,7
55,2
21
12
34
56
78
910
1112
1314
1516
1718
Dis
count
rate
%6.8
51.
000.
940.
880.
820.
770.
720.
670.
630.
590.
550.
520.
480.
450.
420.
400.
370.
350.
32P
V$
10,7
84,4
04
10,5
92,3
79
10,0
62,0
17
9,5
58,2
09
7,1
92,9
42
6,8
59,2
76
6,5
05,1
33
6,1
58,3
53
5,9
44,1
43
5,6
68,3
99
5,4
03,5
98
5,1
50,8
37
4,9
09,5
90
4,6
79,3
55
4,4
59,6
49
NP
V$
103,9
28,2
83
0
100
200
300
400
500
600
700
2008
2009
2010
2011
2012
2013
2014
2015
2016
2017
2018
2019
2020
2021
2022
生産蒸気量(t/h)
010
20
30
40
50
60
70
出力(MW)
補充
井12本
補充
井生
産量
:25t/
h減
衰率
:5%
(初年
度減
衰率
:20%)
出力
初期
坑井
生産
蒸気
量
総合
生産
蒸気
量
補充
井生
産蒸
気量
0
100
200
300
400
500
600
700
2008
2009
2010
2011
2012
2013
2014
2015
2016
2017
2018
2019
2020
2021
2022
生産蒸気量(t/h)
010
20
30
40
50
60
70
出力(MW)
Out
put
Tota
l ste
am fl
ow ra
te
Initi
al w
ells
stea
m fl
ow ra
te
Mak
eup
wel
ls st
eam
flow
rate
Mak
eup
wel
ls:12
Mak
eup
wel
l ste
am fl
ow ra
te:
25t/
hD
eclin
e ra
te:5%
Steam flow rate
Output
1
.O
&M
cost
ass
um
ed
it 3
0% o
f Ele
ctr
icity
Reve
nue
a
t firs
t ye
ar (
Age
d de
teriora
tion c
orr
ection
c
oeff
icie
nt:1.5
%)
2
.Tax
and
Oth
ers
ass
um
ed
it 1
0% o
f Ele
ctr
icity
R
eve
nue
3
.N
et
work
ing
Cap
ital
ass
um
ed
it 2
% o
f Ele
ctr
icity
R
eve
nue
4
.The c
ost
of
mak
eup
well
assu
med
it 3
mill
ion $

Dis
count
rate
:6
.85%
○C
alcula
tion s
heet(
Ele
ctr
icity
Price 4
.45¢
/kW
h(a
t 2003, In
flat
ion:1
.5%))
Year
2005
2006
2007
2008
2009
2010
2011
2012
2013
2014
2015
2016
2017
2018
2019
2020
2021
2022
Ele
ctrici
ty V
olum
eM
Wh
473,
040
473,
040
473,
040
473,
040
473,
040
464,
317
441,
101
465,
167
434,
991
413,
241
392,
579
419,
071
391,
200
371,
640
353,
058
Ele
ctr
icity
Price
¢/kW
h4.4
54.
794.
874.
945.
015.
095.
165.
245.
325.
405.
485.
565.
655.
735.
825.
90
Ele
ctr
icity
Reve
nue
$22,6
77,1
30
23,0
17,2
87
23,3
62,5
46
23,7
12,9
84
24,0
68,6
79
23,9
79,1
99
23,1
21,9
43
24,7
49,2
23
23,4
90,8
34
22,6
51,0
36
21,8
41,2
62
23,6
64,9
06
22,4
22,3
55
21,6
20,7
56
20,8
47,8
14
O&M
cost
$6,8
00,0
00
6,9
02,0
00
7,0
05,5
30
7,1
10,6
13
7,2
17,2
72
7,3
25,5
31
7,4
35,4
14
7,5
46,9
45
7,6
60,1
50
7,7
75,0
52
7,8
91,6
78
8,0
10,0
53
8,1
30,2
04
8,2
52,1
57
8,3
75,9
39
Tax
,oth
ers
$2,2
67,7
13
2,3
01,7
29
2,3
36,2
55
2,3
71,2
98
2,4
06,8
68
2,3
97,9
20
2,3
12,1
94
2,4
74,9
22
2,3
49,0
83
2,2
65,1
04
2,1
84,1
26
2,3
66,4
91
2,2
42,2
35
2,1
62,0
76
2,0
84,7
81
Net
work
ing
Cap
ital
$453,5
43
6,8
03
6,9
05
7,0
09
7,1
14
-1,7
90
-17,1
45
32,5
46
-25,1
68
-16,7
96
-16,1
95
36,4
73
-24,8
51
-16,0
32
-15,4
59
Cap
ital
exp
endi
ture
$0
00
03,0
00,0
00
00
3,0
00,0
00
00
03,0
00,0
00
00
0
Cas
hflow
$13,1
55,8
74
13,8
06,7
55
14,0
13,8
56
14,2
24,0
64
11,4
37,4
25
14,2
57,5
38
13,3
91,4
80
11,6
94,8
10
13,5
06,7
68
12,6
27,6
77
11,7
81,6
54
10,2
51,8
89
12,0
74,7
67
11,2
22,5
55
10,4
02,5
52
12
34
56
78
910
1112
1314
1516
1718
Dis
count
rate
%6.8
51.
000.
940.
880.
820.
770.
720.
670.
630.
590.
550.
520.
480.
450.
420.
400.
370.
350.
32P
V$
10,7
84,4
04
10,5
92,3
79
10,0
62,0
17
9,5
58,2
09
7,1
92,9
42
8,3
91,6
69
7,3
76,6
27
6,0
29,0
36
6,5
16,7
59
5,7
02,0
25
4,9
78,9
46
4,0
54,7
17
4,4
69,5
20
3,8
87,7
59
3,3
72,6
63
NP
V$
102,9
69,6
72
0
100
200
300
400
500
600
700
2008
2009
2010
2011
2012
2013
2014
2015
2016
2017
2018
2019
2020
2021
2022
生産蒸気量(t/h)
010
20
30
40
50
60
70
出力(MW)
補充
井3
本補
充井
生産
量:45t/
h減
衰率
:5%
(初年
度減
衰率
:20%)
出
初期
坑井
生産
蒸気
量
総合
生産
蒸気
量
補充
井生
産蒸
気量
0
100
200
300
400
500
600
700
2008
2009
2010
2011
2012
2013
2014
2015
2016
2017
2018
2019
2020
2021
2022
生産蒸気量(t/h)
010
20
30
40
50
60
70
出力(MW)
Out
put
Tota
l ste
am fl
ow ra
te
Initi
al w
ells
stea
m fl
ow ra
te
Mak
eup
wel
ls st
eam
flow
rate
Mak
eup
wel
ls:3
Mak
eup
wel
l ste
am fl
ow ra
te:
45t/
hD
eclin
e ra
te:5%
Steam flow rate
Output
1
.O
&M
cost
ass
um
ed
it 3
0% o
f Ele
ctr
icity
Reve
nue
a
t firs
t ye
ar (
Age
d de
teriora
tion c
orr
ection
c
oeff
icie
nt:1.5
%)
2
.Tax
and
Oth
ers
ass
um
ed
it 1
0% o
f Ele
ctr
icity
R
eve
nue
3
.N
et
work
ing
Cap
ital
ass
um
ed
it 2
% o
f Ele
ctr
icity
R
eve
nue
4
.The c
ost
of
mak
eup
well
assu
med
it 3
mill
ion $

Dis
count
rate
:6
.85%
○C
alcula
tion s
heet(
Ele
ctr
icity
Price 4
.45¢
/kW
h(a
t 2003, In
flat
ion:1
.5%))
Year
2005
2006
2007
2008
2009
2010
2011
2012
2013
2014
2015
2016
2017
2018
2019
2020
2021
2022
Ele
ctrici
ty V
olum
eM
Wh
473,
040
473,
040
473,
040
473,
040
449,
915
427,
420
406,
049
385,
746
366,
459
348,
136
330,
729
314,
193
298,
483
283,
559
269,
381
Ele
ctr
icity
Price
¢/kW
h4.4
54.
794.
874.
945.
015.
095.
165.
245.
325.
405.
485.
565.
655.
735.
825.
90
Ele
ctr
icity
Reve
nue
$22,6
77,1
30
23,0
17,2
87
23,3
62,5
46
23,7
12,9
84
22,8
92,0
74
22,0
73,6
82
21,2
84,5
48
20,5
23,6
25
19,7
89,9
06
19,0
82,4
17
18,4
00,2
20
17,7
42,4
12
17,1
08,1
21
16,4
96,5
06
15,9
06,7
56
O&M
cost
$6,8
00,0
00
6,9
02,0
00
7,0
05,5
30
7,1
10,6
13
7,2
17,2
72
7,3
25,5
31
7,4
35,4
14
7,5
46,9
45
7,6
60,1
50
7,7
75,0
52
7,8
91,6
78
8,0
10,0
53
8,1
30,2
04
8,2
52,1
57
8,3
75,9
39
Tax
,oth
ers
$2,2
67,7
13
2,3
01,7
29
2,3
36,2
55
2,3
71,2
98
2,2
89,2
07
2,2
07,3
68
2,1
28,4
55
2,0
52,3
63
1,9
78,9
91
1,9
08,2
42
1,8
40,0
22
1,7
74,2
41
1,7
10,8
12
1,6
49,6
51
1,5
90,6
76
Net
work
ing
Cap
ital
$453,5
43
6,8
03
6,9
05
7,0
09
-16,4
18
-16,3
68
-15,7
83
-15,2
18
-14,6
74
-14,1
50
-13,6
44
-13,1
56
-12,6
86
-12,2
32
-11,7
95
Cap
ital
exp
endi
ture
$0
00
00
00
00
00
00
00
Cas
hflow
$13,1
55,8
74
13,8
06,7
55
14,0
13,8
56
14,2
24,0
64
13,4
02,0
12
12,5
57,1
50
11,7
36,4
62
10,9
39,5
36
10,1
65,4
40
9,4
13,2
73
8,6
82,1
65
7,9
71,2
75
7,2
79,7
91
6,6
06,9
31
5,9
51,9
36
12
34
56
78
910
1112
1314
1516
1718
Dis
count
rate
%6.8
51.
000.
940.
880.
820.
770.
720.
670.
630.
590.
550.
520.
480.
450.
420.
400.
370.
350.
32P
V$
10,7
84,4
04
10,5
92,3
79
10,0
62,0
17
9,5
58,2
09
8,4
28,4
62
7,3
90,8
58
6,4
64,9
69
5,6
39,6
69
4,9
04,6
32
4,2
50,5
62
3,6
69,0
97
3,1
52,7
13
2,6
94,6
42
2,2
88,7
97
1,9
29,7
07
NP
V$
91,8
11,1
16
0
100
200
300
400
500
600
700
2008
2009
2010
2011
2012
2013
2014
2015
2016
2017
2018
2019
2020
2021
2022
生産蒸気量(t/h)
010
20
30
40
50
60
70
出力(MW)
補充
井な
し減
衰率
:5%
(初年
度減
衰率
:20%)
出力
初期
坑井
生産
蒸気
量
0
100
200
300
400
500
600
700
2008
2009
2010
2011
2012
2013
2014
2015
2016
2017
2018
2019
2020
2021
2022
生産蒸気量(t/h)
010
20
30
40
50
60
70
出力(MW)
Out
put
Initi
al w
ells
stea
m fl
ow ra
te
Mak
eup
wel
ls:0
Dec
line
rate
:5%
(Initi
al d
eclin
e ra
te:20
%)
Steam flow rate
Output
1
.O
&M
cost
ass
um
ed
it 3
0% o
f Ele
ctr
icity
Reve
nue
a
t firs
t ye
ar (
Age
d de
teriora
tion c
orr
ection
c
oeff
icie
nt:1.5
%)
2
.Tax
and
Oth
ers
ass
um
ed
it 1
0% o
f Ele
ctr
icity
R
eve
nue
3
.N
et
work
ing
Cap
ital
ass
um
ed
it 2
% o
f Ele
ctr
icity
R
eve
nue

Dis
count
rate
:6
.85%
○C
alcula
tion s
heet(
Ele
ctr
icity
Price 4
.45¢
/kW
h(a
t 2003, In
flat
ion:1
.5%))
Year
2005
2006
2007
2008
2009
2010
2011
2012
2013
2014
2015
2016
2017
2018
2019
2020
2021
2022
Ele
ctrici
ty V
olum
eM
Wh
473,
040
473,
040
473,
040
444,
156
408,
624
375,
934
345,
859
318,
190
292,
735
269,
316
247,
771
227,
949
209,
713
192,
936
177,
501
Ele
ctr
icity
Price
¢/kW
h4.4
54.
794.
874.
945.
015.
095.
165.
245.
325.
405.
485.
565.
655.
735.
825.
90
Ele
ctr
icity
Reve
nue$
22,6
77,1
30
23,0
17,2
87
23,3
62,5
46
22,2
65,0
63
20,7
91,1
16
19,4
14,7
44
18,1
29,4
88
16,9
29,3
16
15,8
08,5
95
14,7
62,0
66
13,7
84,8
17
12,8
72,2
63
12,0
20,1
19
11,2
24,3
87
10,4
81,3
32
O&M
cost
$6,8
00,0
00
6,9
02,0
00
7,0
05,5
30
7,1
10,6
13
7,2
17,2
72
7,3
25,5
31
7,4
35,4
14
7,5
46,9
45
7,6
60,1
50
7,7
75,0
52
7,8
91,6
78
8,0
10,0
53
8,1
30,2
04
8,2
52,1
57
8,3
75,9
39
Tax
,oth
ers
$2,2
67,7
13
2,3
01,7
29
2,3
36,2
55
2,2
26,5
06
2,0
79,1
12
1,9
41,4
74
1,8
12,9
49
1,6
92,9
32
1,5
80,8
60
1,4
76,2
07
1,3
78,4
82
1,2
87,2
26
1,2
02,0
12
1,1
22,4
39
1,0
48,1
33
Net
work
ing
Cap
ital
$453,5
43
6,8
03
6,9
05
-21,9
50
-29,4
79
-27,5
27
-25,7
05
-24,0
03
-22,4
14
-20,9
31
-19,5
45
-18,2
51
-17,0
43
-15,9
15
-14,8
61
Cap
ital
exp
endi
ture
$0
00
00
00
00
00
00
00
Cas
hflow
$13,1
55,8
74
13,8
06,7
55
14,0
13,8
56
12,9
49,8
94
11,5
24,2
11
10,1
75,2
66
8,9
06,8
30
7,7
13,4
42
6,5
90,0
01
5,5
31,7
38
4,5
34,2
03
3,5
93,2
35
2,7
04,9
46
1,8
65,7
06
1,0
72,1
21
12
34
56
78
910
1112
1314
1516
1718
Dis
count
rate
%6.8
51.
000.
940.
880.
820.
770.
720.
670.
630.
590.
550.
520.
480.
450.
420.
400.
370.
350.
32P
V$
10,7
84,4
04
10,5
92,3
79
10,0
62,0
17
8,7
01,9
99
7,2
47,5
22
5,9
88,9
34
4,9
06,2
81
3,9
76,5
18
3,1
79,5
50
2,4
97,8
56
1,9
16,1
62
1,4
21,1
57
1,0
01,2
46
646,3
25
347,5
98
NP
V$
73,2
69,9
47
0
100
200
300
400
500
600
700
2008
2009
2010
2011
2012
2013
2014
2015
2016
2017
2018
2019
2020
2021
2022
生産蒸気量(t/h)
010
20
30
40
50
60
70
出力(MW)
補充
井な
し減
衰率
:8%
(初年
度減
衰率
:20%)
出力
初期
坑井
生産
蒸気
量
0
100
200
300
400
500
600
700
2008
2009
2010
2011
2012
2013
2014
2015
2016
2017
2018
2019
2020
2021
2022
生産蒸気量(t/h)
010
20
30
40
50
60
70
出力(MW)
Out
put
Initi
al w
ells
stea
m fl
ow ra
te
Mak
eup
wel
ls:0
Dec
line
rate
:8%
(Initi
al d
eclin
e ra
te:20
%)
Steam flow rate
Output
1
.O
&M
cost
ass
um
ed
it 3
0% o
f Ele
ctr
icity
Reve
nue
a
t firs
t ye
ar (
Age
d de
teriora
tion c
orr
ection
c
oeff
icie
nt:1.5
%)
2
.Tax
and
Oth
ers
ass
um
ed
it 1
0% o
f Ele
ctr
icity
R
eve
nue
3
.N
et
work
ing
Cap
ital
ass
um
ed
it 2
% o
f Ele
ctr
icity
R
eve
nue

Dis
count
rate
:6
.85%
○C
alcula
tion s
heet(
Ele
ctr
icity
Price 4
.45¢
/kW
h(a
t 2003, In
flat
ion:1
.5%))
Year
2005
2006
2007
2008
2009
2010
2011
2012
2013
2014
2015
2016
2017
2018
2019
2020
2021
2022
Ele
ctrici
ty V
olum
eM
Wh
473,
040
473,
040
473,
040
473,
040
473,
040
473,
040
473,
040
473,
040
473,
040
473,
040
473,
040
473,
040
473,
040
473,
040
473,
040
Ele
ctr
icity
Price
¢/kW
h4.4
54.
794.
874.
945.
015.
095.
165.
245.
325.
405.
485.
565.
655.
735.
825.
90
Ele
ctr
icity
Reve
nue
$22,6
77,1
30
23,0
17,2
87
23,3
62,5
46
23,7
12,9
84
24,0
68,6
79
24,4
29,7
09
24,7
96,1
55
25,1
68,0
97
25,5
45,6
19
25,9
28,8
03
26,3
17,7
35
26,7
12,5
01
27,1
13,1
89
27,5
19,8
86
27,9
32,6
85
O&M
cost
$6,8
00,0
00
6,9
02,0
00
7,0
05,5
30
7,1
10,6
13
7,2
17,2
72
7,3
25,5
31
7,4
35,4
14
7,5
46,9
45
7,6
60,1
50
7,7
75,0
52
7,8
91,6
78
8,0
10,0
53
8,1
30,2
04
8,2
52,1
57
8,3
75,9
39
Tax
,oth
ers
$2,2
67,7
13
2,3
01,7
29
2,3
36,2
55
2,3
71,2
98
2,4
06,8
68
2,4
42,9
71
2,4
79,6
15
2,5
16,8
10
2,5
54,5
62
2,5
92,8
80
2,6
31,7
74
2,6
71,2
50
2,7
11,3
19
2,7
51,9
89
2,7
93,2
68
Net
work
ing
Cap
ital
$453,5
43
6,8
03
6,9
05
7,0
09
7,1
14
7,2
21
7,3
29
7,4
39
7,5
50
7,6
64
7,7
79
7,8
95
8,0
14
8,1
34
8,2
56
Cap
ital
exp
endi
ture
$0
00
3,0
00,0
00
3,0
00,0
00
3,0
00,0
00
3,0
00,0
00
3,0
00,0
00
3,0
00,0
00
3,0
00,0
00
3,0
00,0
00
3,0
00,0
00
3,0
00,0
00
3,0
00,0
00
3,0
00,0
00
Cas
hflow
$13,1
55,8
74
13,8
06,7
55
14,0
13,8
56
11,2
24,0
64
11,4
37,4
25
11,6
53,9
87
11,8
73,7
96
12,0
96,9
03
12,3
23,3
57
12,5
53,2
07
12,7
86,5
05
13,0
23,3
03
13,2
63,6
52
13,5
07,6
07
13,7
55,2
21
12
34
56
78
910
1112
1314
1516
1718
Dis
count
rate
%6.8
51.
000.
940.
880.
820.
770.
720.
670.
630.
590.
550.
520.
480.
450.
420.
400.
370.
350.
32
PV
$10,7
84,4
04
10,5
92,3
79
10,0
62,0
17
7,5
42,2
86
7,1
92,9
42
6,8
59,2
76
6,5
40,6
19
6,2
36,3
28
5,9
45,7
85
5,6
68,3
99
5,4
03,5
98
5,1
50,8
37
4,9
09,5
90
4,6
79,3
55
4,4
59,6
49
NP
V$
102,0
27,4
63
0
100
200
300
400
500
600
700
2008
2009
2010
2011
2012
2013
2014
2015
2016
2017
2018
2019
2020
2021
2022
生産蒸気量(t/h)
010
20
30
40
50
60
70
出力(MW)
補充
井12本
補充
井生
産量
:45t/
h減
衰率
:8%
(初年
度減
衰率
:20%)
出
初期
坑井
生産
蒸気
量
総合
生産
蒸気
量
補充
井生
産蒸
気量
0
100
200
300
400
500
600
700
2008
2009
2010
2011
2012
2013
2014
2015
2016
2017
2018
2019
2020
2021
2022
生産蒸気量(t/h)
010
20
30
40
50
60
70
出力(MW)
Out
put
Tota
l ste
am fl
ow ra
te
Initi
al w
ells
stea
m fl
ow ra
te
Mak
eup
wel
ls st
eam
flow
rate
Mak
eup
wel
ls:12
Mak
eup
wel
l ste
am fl
ow ra
te:45
t/h
Dec
line
rate
:8%
(Initi
al d
eclin
e ra
te:20
%)
Steam flow rate
Output
1
.O
&M
cost
ass
um
ed it
30% o
f Ele
ctr
icity
Reve
nue
a
t firs
t ye
ar (A
ged
dete
riora
tion c
orr
ection
c
oeffic
ient:1.5
%)
2
.Tax
and O
thers
ass
um
ed it
10% o
f Ele
ctr
icity
R
eve
nue
3
.N
et
work
ing
Cap
ital
ass
um
ed
it 2
% o
f Ele
ctr
icity
R
eve
nue
4
.The c
ost
of m
akeup
well
assu
med
it 3
mill
ion $

Dis
count
rate
:6
.85%
○C
alcula
tion s
heet(
Ele
ctr
icity
Price 4
.45¢
/kW
h(a
t 2003, In
flat
ion:1
.5%))
Year
2005
2006
2007
2008
2009
2010
2011
2012
2013
2014
2015
2016
2017
2018
2019
2020
2021
2022
Ele
ctrici
ty V
olum
eM
Wh
473,
040
473,
040
473,
040
473,
040
473,
040
473,
040
473,
040
472,
316
473,
040
473,
040
473,
040
473,
040
473,
040
473,
040
470,
265
Ele
ctr
icity
Price
¢/kW
h4.4
54.
794.
874.
945.
015.
095.
165.
245.
325.
405.
485.
565.
655.
735.
825.
90
Ele
ctr
icity
Reve
nue
$22,6
77,1
30
23,0
17,2
87
23,3
62,5
46
23,7
12,9
84
24,0
68,6
79
24,4
29,7
09
24,7
96,1
55
25,1
29,5
86
25,5
45,6
19
25,9
28,8
03
26,3
17,7
35
26,7
12,5
01
27,1
13,1
89
27,5
19,8
86
27,7
68,8
30
O&M
cost
$6,8
00,0
00
6,9
02,0
00
7,0
05,5
30
7,1
10,6
13
7,2
17,2
72
7,3
25,5
31
7,4
35,4
14
7,5
46,9
45
7,6
60,1
50
7,7
75,0
52
7,8
91,6
78
8,0
10,0
53
8,1
30,2
04
8,2
52,1
57
8,3
75,9
39
Tax
,oth
ers
$2,2
67,7
13
2,3
01,7
29
2,3
36,2
55
2,3
71,2
98
2,4
06,8
68
2,4
42,9
71
2,4
79,6
15
2,5
12,9
59
2,5
54,5
62
2,5
92,8
80
2,6
31,7
74
2,6
71,2
50
2,7
11,3
19
2,7
51,9
89
2,7
76,8
83
Net
work
ing
Cap
ital
$453,5
43
6,8
03
6,9
05
7,0
09
7,1
14
7,2
21
7,3
29
6,6
69
8,3
21
7,6
64
7,7
79
7,8
95
8,0
14
8,1
34
4,9
79
Cap
ital
exp
endi
ture
$0
00
3,0
00,0
00
3,0
00,0
00
3,0
00,0
00
3,0
00,0
00
03,0
00,0
00
3,0
00,0
00
3,0
00,0
00
3,0
00,0
00
3,0
00,0
00
3,0
00,0
00
0
Cas
hflow
$13,1
55,8
74
13,8
06,7
55
14,0
13,8
56
11,2
24,0
64
11,4
37,4
25
11,6
53,9
87
11,8
73,7
96
15,0
63,0
13
12,3
22,5
87
12,5
53,2
07
12,7
86,5
05
13,0
23,3
03
13,2
63,6
52
13,5
07,6
07
16,6
11,0
30
12
34
56
78
910
1112
1314
1516
1718
Dis
count
rate
%6.8
51.
000.
940.
880.
820.
770.
720.
670.
630.
590.
550.
520.
480.
450.
420.
400.
370.
350.
32P
V$
10,7
84,4
04
10,5
92,3
79
10,0
62,0
17
7,5
42,2
86
7,1
92,9
42
6,8
59,2
76
6,5
40,6
19
7,7
65,4
49
5,9
45,4
14
5,6
68,3
99
5,4
03,5
98
5,1
50,8
37
4,9
09,5
90
4,6
79,3
55
5,3
85,5
44
NP
V$
104,4
82,1
08
0
100
200
300
400
500
600
700
2008
2009
2010
2011
2012
2013
2014
2015
2016
2017
2018
2019
2020
2021
2022
生産蒸気量(t/h)
010
20
30
40
50
60
70
出力(MW)
補充
井10本
補充
井生
産量
:45t/
h減
衰率
:7%
(初年
度減
衰率
:20%)
出
初期
坑井
生産
蒸気
量
総合
生産
蒸気
量
補充
井生
産蒸
気量
0
100
200
300
400
500
600
700
2008
2009
2010
2011
2012
2013
2014
2015
2016
2017
2018
2019
2020
2021
2022
生産蒸気量(t/h)
010
20
30
40
50
60
70
出力(MW)
Out
put
Tota
l ste
am fl
ow ra
te
Initi
al w
ells
stea
m fl
ow ra
te
Mak
eup
wel
ls st
eam
flow
rate
Mak
eup
wel
ls:10
Mak
eup
wel
l ste
am fl
ow ra
te:
45t/
hD
eclin
e ra
te:7%
Steam flow rate
Output
1
.O
&M
cost
ass
um
ed
it 3
0% o
f Ele
ctr
icity
Reve
nue
a
t firs
t ye
ar (
Age
d de
teriora
tion c
orr
ection
c
oeff
icie
nt:1.5
%)
2
.Tax
and
Oth
ers
ass
um
ed
it 1
0% o
f Ele
ctr
icity
R
eve
nue
3
.N
et
work
ing
Cap
ital
ass
um
ed
it 2
% o
f Ele
ctr
icity
R
eve
nue
4
.The c
ost
of
mak
eup
well
assu
med
it 3
mill
ion $

Dis
count
rate
:6
.85%
○C
alcula
tion s
heet(
Ele
ctr
icity
Price 4
.45¢
/kW
h(a
t 2003, In
flat
ion:1
.5%))
Year
2005
2006
2007
2008
2009
2010
2011
2012
2013
2014
2015
2016
2017
2018
2019
2020
2021
2022
Ele
ctrici
ty V
olum
eM
Wh
473,
040
473,
040
473,
040
473,
040
473,
040
473,
040
473,
040
473,
040
471,
328
473,
040
473,
040
473,
040
472,
172
473,
040
473,
040
Ele
ctr
icity
Price
¢/kW
h4.4
54.
794.
874.
945.
015.
095.
165.
245.
325.
405.
485.
565.
655.
735.
825.
90
Ele
ctr
icity
Reve
nue
$22,6
77,1
30
23,0
17,2
87
23,3
62,5
46
23,7
12,9
84
24,0
68,6
79
24,4
29,7
09
24,7
96,1
55
25,1
68,0
97
25,4
53,1
89
25,9
28,8
03
26,3
17,7
35
26,7
12,5
01
27,0
63,4
32
27,5
19,8
86
27,9
32,6
85
O&M
cost
$6,8
00,0
00
6,9
02,0
00
7,0
05,5
30
7,1
10,6
13
7,2
17,2
72
7,3
25,5
31
7,4
35,4
14
7,5
46,9
45
7,6
60,1
50
7,7
75,0
52
7,8
91,6
78
8,0
10,0
53
8,1
30,2
04
8,2
52,1
57
8,3
75,9
39
Tax
,oth
ers
$2,2
67,7
13
2,3
01,7
29
2,3
36,2
55
2,3
71,2
98
2,4
06,8
68
2,4
42,9
71
2,4
79,6
15
2,5
16,8
10
2,5
45,3
19
2,5
92,8
80
2,6
31,7
74
2,6
71,2
50
2,7
06,3
43
2,7
51,9
89
2,7
93,2
68
Net
work
ing
Cap
ital
$453,5
43
6,8
03
6,9
05
7,0
09
7,1
14
7,2
21
7,3
29
7,4
39
5,7
02
9,5
12
7,7
79
7,8
95
7,0
19
9,1
29
8,2
56
Cap
ital
exp
endi
ture
$0
00
3,0
00,0
00
3,0
00,0
00
03,0
00,0
00
3,0
00,0
00
03,0
00,0
00
3,0
00,0
00
3,0
00,0
00
03,0
00,0
00
3,0
00,0
00
Cas
hflow
$13,1
55,8
74
13,8
06,7
55
14,0
13,8
56
11,2
24,0
64
11,4
37,4
25
14,6
53,9
87
11,8
73,7
96
12,0
96,9
03
15,2
42,0
19
12,5
51,3
59
12,7
86,5
05
13,0
23,3
03
16,2
19,8
66
13,5
06,6
12
13,7
55,2
21
12
34
56
78
910
1112
1314
1516
1718
Dis
count
rate
%6.8
51.
000.
940.
880.
820.
770.
720.
670.
630.
590.
550.
520.
480.
450.
420.
400.
370.
350.
32
PV
$10,7
84,4
04
10,5
92,3
79
10,0
62,0
17
7,5
42,2
86
7,1
92,9
42
8,6
25,0
09
6,5
40,6
19
6,2
36,3
28
7,3
53,9
84
5,6
67,5
64
5,4
03,5
98
5,1
50,8
37
6,0
03,8
44
4,6
79,0
10
4,4
59,6
49
NP
V$
106,2
94,4
69
0
100
200
300
400
500
600
700
2008
2009
2010
2011
2012
2013
2014
2015
2016
2017
2018
2019
2020
2021
2022
生産蒸気量(t/h)
010
20
30
40
50
60
70
出力(MW)
補充
井9本
補充
井生
産量
:45t/
h減
衰率
:6%
(初年
度減
衰率
:20%)
出
初期
坑井
生産
蒸気
量
総合
生産
蒸気
量
補充
井生
産蒸
気量
0
100
200
300
400
500
600
700
2008
2009
2010
2011
2012
2013
2014
2015
2016
2017
2018
2019
2020
2021
2022
生産蒸気量(t/h)
010
20
30
40
50
60
70
出力(MW)
Out
put
Tota
l ste
am fl
ow ra
te
Initi
al w
ells
stea
m fl
ow ra
te
Mak
eup
wel
ls st
eam
flow
rate
Mak
eup
wel
ls:9
Mak
eup
wel
l ste
am fl
ow ra
te:45
t/h
Dec
line
rate
:6%
(Initi
al d
eclin
e ra
te:20
%)
Steam flow rate
Output
1
.O
&M
cost
ass
um
ed it
30% o
f Ele
ctr
icity
Reve
nue
a
t firs
t ye
ar (A
ged
dete
riora
tion c
orr
ection
c
oeffic
ient:1.5
%)
2
.Tax
and O
thers
ass
um
ed it
10% o
f Ele
ctr
icity
R
eve
nue
3
.N
et
work
ing
Cap
ital
ass
um
ed
it 2
% o
f Ele
ctr
icity
R
eve
nue
4
.The c
ost
of m
akeup
well
assu
med
it 3
mill
ion $

Dis
count
rate
:1
0%
○C
alcula
tion s
heet(
Ele
ctr
icity
Price 4
.45¢
/kW
h(a
t 2003, In
flat
ion:1
.5%))
Year
2005
2006
2007
2008
2009
2010
2011
2012
2013
2014
2015
2016
2017
2018
2019
2020
2021
2022
Ele
ctrici
ty V
olum
eM
Wh
473,
040
473,
040
473,
040
473,
040
473,
040
473,
040
473,
040
473,
040
473,
040
473,
040
473,
040
471,
697
473,
040
473,
040
473,
040
Ele
ctr
icity
Price
¢/kW
h4.4
54.
794.
874.
945.
015.
095.
165.
245.
325.
405.
485.
565.
655.
735.
825.
90
Ele
ctr
icity
Reve
nue
$22,6
77,1
30
23,0
17,2
87
23,3
62,5
46
23,7
12,9
84
24,0
68,6
79
24,4
29,7
09
24,7
96,1
55
25,1
68,0
97
25,5
45,6
19
25,9
28,8
03
26,3
17,7
35
26,6
36,6
69
27,1
13,1
89
27,5
19,8
86
27,9
32,6
85
O&M
cost
$6,8
00,0
00
6,9
02,0
00
7,0
05,5
30
7,1
10,6
13
7,2
17,2
72
7,3
25,5
31
7,4
35,4
14
7,5
46,9
45
7,6
60,1
50
7,7
75,0
52
7,8
91,6
78
8,0
10,0
53
8,1
30,2
04
8,2
52,1
57
8,3
75,9
39
Tax
,oth
ers
$2,2
67,7
13
2,3
01,7
29
2,3
36,2
55
2,3
71,2
98
2,4
06,8
68
2,4
42,9
71
2,4
79,6
15
2,5
16,8
10
2,5
54,5
62
2,5
92,8
80
2,6
31,7
74
2,6
63,6
67
2,7
11,3
19
2,7
51,9
89
2,7
93,2
68
Net
work
ing
Cap
ital
$453,5
43
6,8
03
6,9
05
7,0
09
7,1
14
7,2
21
7,3
29
7,4
39
7,5
50
7,6
64
7,7
79
6,3
79
9,5
30
8,1
34
8,2
56
Cap
ital
exp
endi
ture
$0
00
03,0
00,0
00
3,0
00,0
00
03,0
00,0
00
3,0
00,0
00
03,0
00,0
00
03,0
00,0
00
3,0
00,0
00
0
Cas
hflow
$13,1
55,8
74
13,8
06,7
55
14,0
13,8
56
14,2
24,0
64
11,4
37,4
25
11,6
53,9
87
14,8
73,7
96
12,0
96,9
03
12,3
23,3
57
15,5
53,2
07
12,7
86,5
05
15,9
56,5
71
13,2
62,1
36
13,5
07,6
07
16,7
55,2
21
12
34
56
78
910
1112
1314
1516
1718
Dis
count
rate
%10
1.00
0.91
0.83
0.75
0.68
0.62
0.56
0.51
0.47
0.42
0.39
0.35
0.32
0.29
0.26
0.24
0.22
0.20
PV
$9,8
84,2
03
9,4
30,1
99
8,7
01,5
02
8,0
29,1
13
5,8
69,2
08
5,4
36,6
71
6,3
07,9
42
4,6
63,8
80
4,3
19,2
61
4,9
55,7
31
3,7
03,7
95
4,2
01,8
64
3,1
74,8
50
2,9
39,6
49
3,3
14,9
31
NP
V$
84,9
32,7
99
補充
井7
本補
充井
生産
量:45t/
h減
衰率
:5%
(初年
度減
衰率
:20%)
出力
初期
坑井
生産
蒸気
量
総合
生産
蒸気
量
0
100
200
300
400
500
600
700
2008
2009
2010
2011
2012
2013
2014
2015
2016
2017
2018
2019
2020
2021
2022
生産蒸気量(t/h)
010
20
30
40
50
60
70
出力(MW)
0
100
200
300
400
500
600
700
2008
2009
2010
2011
2012
2013
2014
2015
2016
2017
2018
2019
2020
2021
2022
生産蒸気量(t/h)
010
20
30
40
50
60
70
出力(MW)
補充
井7
本補
充井
生産
量:45t/
h減
衰率
:5%
(初年
度減
衰率
:20%)
出力
初期
坑井
生産
蒸気
量
総合
生産
蒸気
量
補充
井生
産蒸
気量
補充
井生
産蒸
気量
Out
put
Tota
l ste
am fl
ow ra
te
Initi
al w
ells
stea
m fl
ow ra
te
Mak
eup
wel
ls st
eam
flow
rate
Mak
eup
wel
ls:7
Mak
eup
wel
l ste
am fl
ow ra
te:45
t/h
Dec
line
rate
:5%
(Initi
al d
eclin
e ra
te:20
%)
Steam flow rate
Output
1
.O
&M
cost
ass
um
ed it
30% o
f Ele
ctr
icity
Reve
nue
a
t firs
t ye
ar (A
ged
dete
riora
tion c
orr
ection
c
oeffic
ient:1.5
%)
2
.Tax
and O
thers
ass
um
ed it
10% o
f Ele
ctr
icity
R
eve
nue
3
.N
et
work
ing
Cap
ital
ass
um
ed it
2% o
f Ele
ctr
icity
R
eve
nue
4
.The c
ost
of m
akeup
well
assu
med
it 3
mill
ion $

Dis
count
rate
:1
0%
○C
alcula
tion s
heet(
Ele
ctr
icity
Price 4
.45¢
/kW
h(a
t 2003, In
flat
ion:1
.5%))
Year
2005
2006
2007
2008
2009
2010
2011
2012
2013
2014
2015
2016
2017
2018
2019
2020
2021
2022
Ele
ctrici
ty V
olum
eM
Wh
473,
040
473,
040
473,
040
473,
040
473,
040
473,
040
471,
643
469,
841
473,
040
473,
040
473,
040
473,
040
473,
040
473,
040
473,
040
Ele
ctr
icity
Price
¢/kW
h4.4
54.
794.
874.
945.
015.
095.
165.
245.
325.
405.
485.
565.
655.
735.
825.
90
Ele
ctr
icity
Reve
nue
$22,6
77,1
30
23,0
17,2
87
23,3
62,5
46
23,7
12,9
84
24,0
68,6
79
24,4
29,7
09
24,7
22,9
48
24,9
97,8
84
25,5
45,6
19
25,9
28,8
03
26,3
17,7
35
26,7
12,5
01
27,1
13,1
89
27,5
19,8
86
27,9
32,6
85
O&M
cost
$6,8
00,0
00
6,9
02,0
00
7,0
05,5
30
7,1
10,6
13
7,2
17,2
72
7,3
25,5
31
7,4
35,4
14
7,5
46,9
45
7,6
60,1
50
7,7
75,0
52
7,8
91,6
78
8,0
10,0
53
8,1
30,2
04
8,2
52,1
57
8,3
75,9
39
Tax
,oth
ers
$2,2
67,7
13
2,3
01,7
29
2,3
36,2
55
2,3
71,2
98
2,4
06,8
68
2,4
42,9
71
2,4
72,2
95
2,4
99,7
88
2,5
54,5
62
2,5
92,8
80
2,6
31,7
74
2,6
71,2
50
2,7
11,3
19
2,7
51,9
89
2,7
93,2
68
Net
work
ing
Cap
ital
$453,5
43
6,8
03
6,9
05
7,0
09
7,1
14
7,2
21
5,8
65
5,4
99
10,9
55
7,6
64
7,7
79
7,8
95
8,0
14
8,1
34
8,2
56
Cap
ital
exp
endi
ture
$0
00
03,0
00,0
00
3,0
00,0
00
3,0
00,0
00
3,0
00,0
00
3,0
00,0
00
3,0
00,0
00
3,0
00,0
00
3,0
00,0
00
3,0
00,0
00
3,0
00,0
00
3,0
00,0
00
Cas
hflow
$13,1
55,8
74
13,8
06,7
55
14,0
13,8
56
14,2
24,0
64
11,4
37,4
25
11,6
53,9
87
11,8
09,3
74
11,9
45,6
51
12,3
19,9
53
12,5
53,2
07
12,7
86,5
05
13,0
23,3
03
13,2
63,6
52
13,5
07,6
07
13,7
55,2
21
12
34
56
78
910
1112
1314
1516
1718
Dis
count
rate
%10
1.00
0.91
0.83
0.75
0.68
0.62
0.56
0.51
0.47
0.42
0.39
0.35
0.32
0.29
0.26
0.24
0.22
0.20
PV
$9,8
84,2
03
9,4
30,1
99
8,7
01,5
02
8,0
29,1
13
5,8
69,2
08
5,4
36,6
71
5,0
08,3
28
4,6
05,5
66
4,3
18,0
68
3,9
99,8
39
3,7
03,7
95
3,4
29,4
43
3,1
75,2
13
2,9
39,6
49
2,7
21,3
97
NP
V$
81,2
52,1
94
0
100
200
300
400
500
600
700
2008
2009
2010
2011
2012
2013
2014
2015
2016
2017
2018
2019
2020
2021
2022
生産蒸気量(t/h)
010
20
30
40
50
60
70
出力(MW)
補充
井12本
補充
井生
産量
:25t/
h減
衰率
:5%
(初年
度減
衰率
:20%)
出力
初期
坑井
生産
蒸気
量
総合
生産
蒸気
量
補充
井生
産蒸
気量
0
100
200
300
400
500
600
700
2008
2009
2010
2011
2012
2013
2014
2015
2016
2017
2018
2019
2020
2021
2022
生産蒸気量(t/h)
010
20
30
40
50
60
70
出力(MW)
補充
井12本
補充
井生
産量
:25t/
h減
衰率
:5%
(初年
度減
衰率
:20%)
出力
初期
坑井
生産
蒸気
量
総合
生産
蒸気
量
補充
井生
産蒸
気量
Out
put
Tota
l ste
am fl
ow ra
te
Initi
al w
ells
stea
m fl
ow
Mak
eup
wel
ls st
eam
flow
rate
Mak
eup
wel
ls:12
Mak
eup
wel
l ste
am fl
ow ra
te:
25t/
hD
eclin
e ra
te:5%
Steam flow rate
Output
1
.O
&M
cost
ass
um
ed
it 3
0% o
f Ele
ctr
icity
Reve
nue
a
t firs
t ye
ar (
Age
d de
teriora
tion c
orr
ection
c
oeff
icie
nt:1.5
%)
2
.Tax
and
Oth
ers
ass
um
ed
it 1
0% o
f Ele
ctr
icity
R
eve
nue
3
.N
et
work
ing
Cap
ital
ass
um
ed
it 2
% o
f Ele
ctr
icity
R
eve
nue
4
.The c
ost
of
mak
eup
well
assu
med
it 3
mill
ion $

Dis
count
rate
:1
0%
○C
alcula
tion s
heet(
Ele
ctr
icity
Price 4
.45¢
/kW
h(a
t 2003, In
flat
ion:1
.5%))
Year
2005
2006
2007
2008
2009
2010
2011
2012
2013
2014
2015
2016
2017
2018
2019
2020
2021
2022
Ele
ctrici
ty V
olum
eM
Wh
473,
040
473,
040
473,
040
473,
040
473,
040
464,
317
441,
101
465,
167
434,
991
413,
241
392,
579
419,
071
391,
200
371,
640
353,
058
Ele
ctr
icity
Price
¢/kW
h4.4
54.
794.
874.
945.
015.
095.
165.
245.
325.
405.
485.
565.
655.
735.
825.
90
Ele
ctr
icity
Reve
nue
$22,6
77,1
30
23,0
17,2
87
23,3
62,5
46
23,7
12,9
84
24,0
68,6
79
23,9
79,1
99
23,1
21,9
43
24,7
49,2
23
23,4
90,8
34
22,6
51,0
36
21,8
41,2
62
23,6
64,9
06
22,4
22,3
55
21,6
20,7
56
20,8
47,8
14
O&M
cost
$6,8
00,0
00
6,9
02,0
00
7,0
05,5
30
7,1
10,6
13
7,2
17,2
72
7,3
25,5
31
7,4
35,4
14
7,5
46,9
45
7,6
60,1
50
7,7
75,0
52
7,8
91,6
78
8,0
10,0
53
8,1
30,2
04
8,2
52,1
57
8,3
75,9
39
Tax
,oth
ers
$2,2
67,7
13
2,3
01,7
29
2,3
36,2
55
2,3
71,2
98
2,4
06,8
68
2,3
97,9
20
2,3
12,1
94
2,4
74,9
22
2,3
49,0
83
2,2
65,1
04
2,1
84,1
26
2,3
66,4
91
2,2
42,2
35
2,1
62,0
76
2,0
84,7
81
Net
work
ing
Cap
ital
$453,5
43
6,8
03
6,9
05
7,0
09
7,1
14
-1,7
90
-17,1
45
32,5
46
-25,1
68
-16,7
96
-16,1
95
36,4
73
-24,8
51
-16,0
32
-15,4
59
Cap
ital
exp
endi
ture
$0
00
03,0
00,0
00
00
3,0
00,0
00
00
03,0
00,0
00
00
0
Cas
hflow
$13,1
55,8
74
13,8
06,7
55
14,0
13,8
56
14,2
24,0
64
11,4
37,4
25
14,2
57,5
38
13,3
91,4
80
11,6
94,8
10
13,5
06,7
68
12,6
27,6
77
11,7
81,6
54
10,2
51,8
89
12,0
74,7
67
11,2
22,5
55
10,4
02,5
52
12
34
56
78
910
1112
1314
1516
1718
Dis
count
rate
%10
1.00
0.91
0.83
0.75
0.68
0.62
0.56
0.51
0.47
0.42
0.39
0.35
0.32
0.29
0.26
0.24
0.22
0.20
PV
$9,8
84,2
03
9,4
30,1
99
8,7
01,5
02
8,0
29,1
13
5,8
69,2
08
6,6
51,2
47
5,6
79,2
95
4,5
08,8
55
4,7
34,0
40
4,0
23,5
67
3,4
12,7
25
2,6
99,6
43
2,8
90,6
03
2,4
42,3
55
2,0
58,0
89
NP
V$
81,0
14,6
45
0
100
200
300
400
500
600
700
2008
2009
2010
2011
2012
2013
2014
2015
2016
2017
2018
2019
2020
2021
2022
生産蒸気量(t/h)
010
20
30
40
50
60
70
出力(MW)
補充
井3
本補
充井
生産
量:45t/
h減
衰率
:5%
(初年
度減
衰率
:20%)
出
初期
坑井
生産
蒸気
量
総合
生産
蒸気
量
補充
井生
産蒸
気量
0
100
200
300
400
500
600
700
2008
2009
2010
2011
2012
2013
2014
2015
2016
2017
2018
2019
2020
2021
2022
生産蒸気量(t/h)
010
20
30
40
50
60
70
出力(MW)
補充
井3
本補
充井
生産
量:45t/
h減
衰率
:5%
(初年
度減
衰率
:20%)
出力
初期
坑井
生産
蒸気
量
総合
生産
蒸気
量
補充
井生
産蒸
気量
Out
put To
tal s
team
flow
Initi
al w
ells
stea
m fl
ow
Mak
eup
wel
ls st
eam
flow
rate
Mak
eup
wel
ls:3
Mak
eup
wel
l ste
am fl
ow ra
te:
45t/
hD
eclin
e ra
te:5%
Steam flow rate
Output
1
.O
&M
cost
ass
um
ed
it 3
0% o
f Ele
ctr
icity
Reve
nue
a
t firs
t ye
ar (
Age
d de
teriora
tion c
orr
ection
c
oeff
icie
nt:1.5
%)
2
.Tax
and
Oth
ers
ass
um
ed
it 1
0% o
f Ele
ctr
icity
R
eve
nue
3
.N
et
work
ing
Cap
ital
ass
um
ed
it 2
% o
f Ele
ctr
icity
R
eve
nue
4
.The c
ost
of
mak
eup
well
assu
med
it 3
mill
ion $

Dis
count
rate
:1
0%
○C
alcula
tion s
heet(
Ele
ctr
icity
Price 4
.45¢
/kW
h(a
t 2003, In
flat
ion:1
.5%))
Year
2005
2006
2007
2008
2009
2010
2011
2012
2013
2014
2015
2016
2017
2018
2019
2020
2021
2022
Ele
ctrici
ty V
olum
eM
Wh
473,
040
473,
040
473,
040
473,
040
449,
915
427,
420
406,
049
385,
746
366,
459
348,
136
330,
729
314,
193
298,
483
283,
559
269,
381
Ele
ctr
icity
Price
¢/kW
h4.4
54.
794.
874.
945.
015.
095.
165.
245.
325.
405.
485.
565.
655.
735.
825.
90
Ele
ctr
icity
Reve
nue
$22,6
77,1
30
23,0
17,2
87
23,3
62,5
46
23,7
12,9
84
22,8
92,0
74
22,0
73,6
82
21,2
84,5
48
20,5
23,6
25
19,7
89,9
06
19,0
82,4
17
18,4
00,2
20
17,7
42,4
12
17,1
08,1
21
16,4
96,5
06
15,9
06,7
56
O&M
cost
$6,8
00,0
00
6,9
02,0
00
7,0
05,5
30
7,1
10,6
13
7,2
17,2
72
7,3
25,5
31
7,4
35,4
14
7,5
46,9
45
7,6
60,1
50
7,7
75,0
52
7,8
91,6
78
8,0
10,0
53
8,1
30,2
04
8,2
52,1
57
8,3
75,9
39
Tax
,oth
ers
$2,2
67,7
13
2,3
01,7
29
2,3
36,2
55
2,3
71,2
98
2,2
89,2
07
2,2
07,3
68
2,1
28,4
55
2,0
52,3
63
1,9
78,9
91
1,9
08,2
42
1,8
40,0
22
1,7
74,2
41
1,7
10,8
12
1,6
49,6
51
1,5
90,6
76
Net
work
ing
Cap
ital
$453,5
43
6,8
03
6,9
05
7,0
09
-16,4
18
-16,3
68
-15,7
83
-15,2
18
-14,6
74
-14,1
50
-13,6
44
-13,1
56
-12,6
86
-12,2
32
-11,7
95
Cap
ital
exp
endi
ture
$0
00
00
00
00
00
00
00
Cas
hflow
$13,1
55,8
74
13,8
06,7
55
14,0
13,8
56
14,2
24,0
64
13,4
02,0
12
12,5
57,1
50
11,7
36,4
62
10,9
39,5
36
10,1
65,4
40
9,4
13,2
73
8,6
82,1
65
7,9
71,2
75
7,2
79,7
91
6,6
06,9
31
5,9
51,9
36
12
34
56
78
910
1112
1314
1516
1718
Dis
count
rate
%10
1.00
0.91
0.83
0.75
0.68
0.62
0.56
0.51
0.47
0.42
0.39
0.35
0.32
0.29
0.26
0.24
0.22
0.20
PV
$9,8
84,2
03
9,4
30,1
99
8,7
01,5
02
8,0
29,1
13
6,8
77,3
51
5,8
58,0
03
4,9
77,4
05
4,2
17,6
65
3,5
62,9
25
2,9
99,3
59
2,5
14,9
14
2,0
99,0
86
1,7
42,7
24
1,4
37,8
61
1,1
77,5
59
NP
V$
73,5
09,8
70
0
100
200
300
400
500
600
700
2008
2009
2010
2011
2012
2013
2014
2015
2016
2017
2018
2019
2020
2021
2022
生産蒸気量(t/h)
010
20
30
40
50
60
70
出力(MW)
補充
井な
し減
衰率
:5%
(初年
度減
衰率
:20%)
出力
初期
坑井
生産
蒸気
量
0
100
200
300
400
500
600
700
2008
2009
2010
2011
2012
2013
2014
2015
2016
2017
2018
2019
2020
2021
2022
生産蒸気量(t/h)
010
20
30
40
50
60
70
出力(MW)
補充
井な
し減
衰率
:5%
(初年
度減
衰率
:20%)
出力
初期
坑井
生産
蒸気
量
Out
put
Initi
al w
ells
stea
m fl
owM
akeu
p w
ells:
0D
eclin
e ra
te:5%
(Initi
al d
eclin
e ra
te:20
%)
Steam flow rate
Output
1
.O
&M
cost
ass
um
ed
it 3
0% o
f Ele
ctr
icity
Reve
nue
a
t firs
t ye
ar (
Age
d de
teriora
tion c
orr
ection
c
oeff
icie
nt:1.5
%)
2
.Tax
and
Oth
ers
ass
um
ed
it 1
0% o
f Ele
ctr
icity
R
eve
nue
3
.N
et
work
ing
Cap
ital
ass
um
ed
it 2
% o
f Ele
ctr
icity
R
eve
nue

Dis
count
rate
:1
0%
○C
alcula
tion s
heet(
Ele
ctr
icity
Price 4
.45¢
/kW
h(a
t 2003, In
flat
ion:1
.5%))
Year
2005
2006
2007
2008
2009
2010
2011
2012
2013
2014
2015
2016
2017
2018
2019
2020
2021
2022
Ele
ctrici
ty V
olum
eM
Wh
473,
040
473,
040
473,
040
444,
156
408,
624
375,
934
345,
859
318,
190
292,
735
269,
316
247,
771
227,
949
209,
713
192,
936
177,
501
Ele
ctr
icity
Price
¢/kW
h4.4
54.
794.
874.
945.
015.
095.
165.
245.
325.
405.
485.
565.
655.
735.
825.
90
Ele
ctr
icity
Reve
nue
$22,6
77,1
30
23,0
17,2
87
23,3
62,5
46
22,2
65,0
63
20,7
91,1
16
19,4
14,7
44
18,1
29,4
88
16,9
29,3
16
15,8
08,5
95
14,7
62,0
66
13,7
84,8
17
12,8
72,2
63
12,0
20,1
19
11,2
24,3
87
10,4
81,3
32
O&M
cost
$6,8
00,0
00
6,9
02,0
00
7,0
05,5
30
7,1
10,6
13
7,2
17,2
72
7,3
25,5
31
7,4
35,4
14
7,5
46,9
45
7,6
60,1
50
7,7
75,0
52
7,8
91,6
78
8,0
10,0
53
8,1
30,2
04
8,2
52,1
57
8,3
75,9
39
Tax
,oth
ers
$2,2
67,7
13
2,3
01,7
29
2,3
36,2
55
2,2
26,5
06
2,0
79,1
12
1,9
41,4
74
1,8
12,9
49
1,6
92,9
32
1,5
80,8
60
1,4
76,2
07
1,3
78,4
82
1,2
87,2
26
1,2
02,0
12
1,1
22,4
39
1,0
48,1
33
Net
work
ing
Cap
ital
$453,5
43
6,8
03
6,9
05
-21,9
50
-29,4
79
-27,5
27
-25,7
05
-24,0
03
-22,4
14
-20,9
31
-19,5
45
-18,2
51
-17,0
43
-15,9
15
-14,8
61
Cap
ital
exp
endi
ture
$0
00
00
00
00
00
00
00
Cas
hflow
$13,1
55,8
74
13,8
06,7
55
14,0
13,8
56
12,9
49,8
94
11,5
24,2
11
10,1
75,2
66
8,9
06,8
30
7,7
13,4
42
6,5
90,0
01
5,5
31,7
38
4,5
34,2
03
3,5
93,2
35
2,7
04,9
46
1,8
65,7
06
1,0
72,1
21
12
34
56
78
910
1112
1314
1516
1718
Dis
count
rate
%10
1.00
0.91
0.83
0.75
0.68
0.62
0.56
0.51
0.47
0.42
0.39
0.35
0.32
0.29
0.26
0.24
0.22
0.20
PV
$9,8
84,2
03
9,4
30,1
99
8,7
01,5
02
7,3
09,8
77
5,9
13,7
43
4,7
46,8
37
3,7
77,3
65
2,9
73,8
66
2,3
09,7
55
1,7
62,5
82
1,3
13,3
97
946,2
11
647,5
43
406,0
32
212,1
13
NP
V$
60,3
35,2
26
0
100
200
300
400
500
600
700
2008
2009
2010
2011
2012
2013
2014
2015
2016
2017
2018
2019
2020
2021
2022
生産蒸気量(t/h)
010
20
30
40
50
60
70
出力(MW)
補充
井な
し減
衰率
:8%
(初年
度減
衰率
:20%)
出力
初期
坑井
生産
蒸気
量
0
100
200
300
400
500
600
700
2008
2009
2010
2011
2012
2013
2014
2015
2016
2017
2018
2019
2020
2021
2022
生産蒸気量(t/h)
010
20
30
40
50
60
70
出力(MW)
補充
井な
し減
衰率
:8%
(初年
度減
衰率
:20%)
出力
初期
坑井
生産
蒸気
量
Out
put
Initi
al w
ells
stea
m fl
ow
Steam flow rate
Output
Mak
eup
wel
ls:0
Dec
line
rate
:5%
(Initi
al d
eclin
e ra
te:20
%)
1
.O
&M
cost
ass
um
ed
it 3
0% o
f Ele
ctr
icity
Reve
nue
a
t firs
t ye
ar (
Age
d de
teriora
tion c
orr
ection
c
oeff
icie
nt:1.5
%)
2
.Tax
and
Oth
ers
ass
um
ed
it 1
0% o
f Ele
ctr
icity
R
eve
nue
3
.N
et
work
ing
Cap
ital
ass
um
ed
it 2
% o
f Ele
ctr
icity
R
eve
nue

Dis
count
rate
:1
0%
○C
alcula
tion s
heet(
Ele
ctr
icity
Price 4
.45¢
/kW
h(a
t 2003, In
flat
ion:1
.5%))
Year
2005
2006
2007
2008
2009
2010
2011
2012
2013
2014
2015
2016
2017
2018
2019
2020
2021
2022
Ele
ctrici
ty V
olum
eM
Wh
473,
040
473,
040
473,
040
473,
040
473,
040
473,
040
473,
040
473,
040
473,
040
473,
040
473,
040
473,
040
473,
040
473,
040
473,
040
Ele
ctr
icity
Price
¢/kW
h4.4
54.
794.
874.
945.
015.
095.
165.
245.
325.
405.
485.
565.
655.
735.
825.
90
Ele
ctr
icity
Reve
nue
$22,6
77,1
30
23,0
17,2
87
23,3
62,5
46
23,7
12,9
84
24,0
68,6
79
24,4
29,7
09
24,7
96,1
55
25,1
68,0
97
25,5
45,6
19
25,9
28,8
03
26,3
17,7
35
26,7
12,5
01
27,1
13,1
89
27,5
19,8
86
27,9
32,6
85
O&M
cost
$6,8
00,0
00
6,9
02,0
00
7,0
05,5
30
7,1
10,6
13
7,2
17,2
72
7,3
25,5
31
7,4
35,4
14
7,5
46,9
45
7,6
60,1
50
7,7
75,0
52
7,8
91,6
78
8,0
10,0
53
8,1
30,2
04
8,2
52,1
57
8,3
75,9
39
Tax
,oth
ers
$2,2
67,7
13
2,3
01,7
29
2,3
36,2
55
2,3
71,2
98
2,4
06,8
68
2,4
42,9
71
2,4
79,6
15
2,5
16,8
10
2,5
54,5
62
2,5
92,8
80
2,6
31,7
74
2,6
71,2
50
2,7
11,3
19
2,7
51,9
89
2,7
93,2
68
Net
work
ing
Cap
ital
$453,5
43
6,8
03
6,9
05
7,0
09
7,1
14
7,2
21
7,3
29
7,4
39
7,5
50
7,6
64
7,7
79
7,8
95
8,0
14
8,1
34
8,2
56
Cap
ital
exp
endi
ture
$0
00
3,0
00,0
00
3,0
00,0
00
3,0
00,0
00
3,0
00,0
00
3,0
00,0
00
3,0
00,0
00
3,0
00,0
00
3,0
00,0
00
3,0
00,0
00
3,0
00,0
00
3,0
00,0
00
3,0
00,0
00
Cas
hflow
$13,1
55,8
74
13,8
06,7
55
14,0
13,8
56
11,2
24,0
64
11,4
37,4
25
11,6
53,9
87
11,8
73,7
96
12,0
96,9
03
12,3
23,3
57
12,5
53,2
07
12,7
86,5
05
13,0
23,3
03
13,2
63,6
52
13,5
07,6
07
13,7
55,2
21
12
34
56
78
910
1112
1314
1516
1718
Dis
count
rate
%10
1.00
0.91
0.83
0.75
0.68
0.62
0.56
0.51
0.47
0.42
0.39
0.35
0.32
0.29
0.26
0.24
0.22
0.20
PV
$9,8
84,2
03
9,4
30,1
99
8,7
01,5
02
6,3
35,6
92
5,8
69,2
08
5,4
36,6
71
5,0
35,6
49
4,6
63,8
80
4,3
19,2
61
3,9
99,8
39
3,7
03,7
95
3,4
29,4
43
3,1
75,2
13
2,9
39,6
49
2,7
21,3
97
NP
V$
79,6
45,6
00
0
100
200
300
400
500
600
700
2008
2009
2010
2011
2012
2013
2014
2015
2016
2017
2018
2019
2020
2021
2022
生産蒸気量(t/h)
010
20
30
40
50
60
70
出力(MW)
補充
井12本
補充
井生
産量
:45t/
h減
衰率
:8%
(初年
度減
衰率
:20%)
出
初期
坑井
生産
蒸気
量
総合
生産
蒸気
量
補充
井生
産蒸
気量
0
100
200
300
400
500
600
700
2008
2009
2010
2011
2012
2013
2014
2015
2016
2017
2018
2019
2020
2021
2022
生産蒸気量(t/h)
010
20
30
40
50
60
70
出力(MW)
補充
井12本
補充
井生
産量
:45t/
h減
衰率
:8%
(初年
度減
衰率
:20%)
出力
初期
坑井
生産
蒸気
量
総合
生産
蒸気
量
補充
井生
産蒸
気量
Out
put
Tota
l ste
am fl
ow
Initi
al w
ells
stea
m fl
ow
Mak
eup
wel
ls st
eam
flow
rate
Steam flow rate
Output
Mak
eup
wel
ls:12
Mak
eup
wel
l ste
am fl
ow ra
te:
45t/
hD
eclin
e ra
te:8%
1
.O
&M
cost
ass
um
ed
it 3
0% o
f Ele
ctr
icity
Reve
nue
a
t firs
t ye
ar (
Age
d de
teriora
tion c
orr
ection
c
oeff
icie
nt:1.5
%)
2
.Tax
and
Oth
ers
ass
um
ed
it 1
0% o
f Ele
ctr
icity
R
eve
nue
3
.N
et
work
ing
Cap
ital
ass
um
ed
it 2
% o
f Ele
ctr
icity
R
eve
nue
4
.The c
ost
of
mak
eup
well
assu
med
it 3
mill
ion $

Dis
count
rate
:1
0%
○C
alcula
tion s
heet(
Ele
ctr
icity
Price 4
.45¢
/kW
h(a
t 2003, In
flat
ion:1
.5%))
Year
2005
2006
2007
2008
2009
2010
2011
2012
2013
2014
2015
2016
2017
2018
2019
2020
2021
2022
Ele
ctrici
ty V
olum
eM
Wh
473,
040
473,
040
473,
040
473,
040
473,
040
473,
040
473,
040
472,
316
473,
040
473,
040
473,
040
473,
040
473,
040
473,
040
470,
265
Ele
ctr
icity
Price
¢/kW
h4.4
54.
794.
874.
945.
015.
095.
165.
245.
325.
405.
485.
565.
655.
735.
825.
90
Ele
ctr
icity
Reve
nue
$22,6
77,1
30
23,0
17,2
87
23,3
62,5
46
23,7
12,9
84
24,0
68,6
79
24,4
29,7
09
24,7
96,1
55
25,1
29,5
86
25,5
45,6
19
25,9
28,8
03
26,3
17,7
35
26,7
12,5
01
27,1
13,1
89
27,5
19,8
86
27,7
68,8
30
O&M
cost
$6,8
00,0
00
6,9
02,0
00
7,0
05,5
30
7,1
10,6
13
7,2
17,2
72
7,3
25,5
31
7,4
35,4
14
7,5
46,9
45
7,6
60,1
50
7,7
75,0
52
7,8
91,6
78
8,0
10,0
53
8,1
30,2
04
8,2
52,1
57
8,3
75,9
39
Tax
,oth
ers
$2,2
67,7
13
2,3
01,7
29
2,3
36,2
55
2,3
71,2
98
2,4
06,8
68
2,4
42,9
71
2,4
79,6
15
2,5
12,9
59
2,5
54,5
62
2,5
92,8
80
2,6
31,7
74
2,6
71,2
50
2,7
11,3
19
2,7
51,9
89
2,7
76,8
83
Net
work
ing
Cap
ital
$453,5
43
6,8
03
6,9
05
7,0
09
7,1
14
7,2
21
7,3
29
6,6
69
8,3
21
7,6
64
7,7
79
7,8
95
8,0
14
8,1
34
4,9
79
Cap
ital
exp
endi
ture
$0
00
3,0
00,0
00
3,0
00,0
00
3,0
00,0
00
3,0
00,0
00
03,0
00,0
00
3,0
00,0
00
3,0
00,0
00
3,0
00,0
00
3,0
00,0
00
3,0
00,0
00
0
Cas
hflow
$13,1
55,8
74
13,8
06,7
55
14,0
13,8
56
11,2
24,0
64
11,4
37,4
25
11,6
53,9
87
11,8
73,7
96
15,0
63,0
13
12,3
22,5
87
12,5
53,2
07
12,7
86,5
05
13,0
23,3
03
13,2
63,6
52
13,5
07,6
07
16,6
11,0
30
12
34
56
78
910
1112
1314
1516
1718
Dis
count
rate
%10
1.00
0.91
0.83
0.75
0.68
0.62
0.56
0.51
0.47
0.42
0.39
0.35
0.32
0.29
0.26
0.24
0.22
0.20
PV
$9,8
84,2
03
9,4
30,1
99
8,7
01,5
02
6,3
35,6
92
5,8
69,2
08
5,4
36,6
71
5,0
35,6
49
5,8
07,4
44
4,3
18,9
91
3,9
99,8
39
3,7
03,7
95
3,4
29,4
43
3,1
75,2
13
2,9
39,6
49
3,2
86,4
04
NP
V$
81,3
53,9
01
0
100
200
300
400
500
600
700
2008
2009
2010
2011
2012
2013
2014
2015
2016
2017
2018
2019
2020
2021
2022
生産蒸気量(t/h)
010
20
30
40
50
60
70
出力(MW)
補充
井10本
補充
井生
産量
:45t/
h減
衰率
:7%
(初年
度減
衰率
:20%)
出
初期
坑井
生産
蒸気
量
総合
生産
蒸気
量
補充
井生
産蒸
気量
0
100
200
300
400
500
600
700
2008
2009
2010
2011
2012
2013
2014
2015
2016
2017
2018
2019
2020
2021
2022
生産蒸気量(t/h)
010
20
30
40
50
60
70
出力(MW)
Out
put To
tal s
team
flow
Initi
al w
ells
stea
m fl
ow
Mak
eup
wel
ls st
eam
flow
rate
Steam flow rate
Output
Mak
eup
wel
ls:10
Mak
eup
wel
l ste
am fl
ow ra
te:
45t/
hD
eclin
e ra
te:7%
1
.O
&M
cost
ass
um
ed
it 3
0% o
f Ele
ctr
icity
Reve
nue
a
t firs
t ye
ar (
Age
d de
teriora
tion c
orr
ection
c
oeff
icie
nt:1.5
%)
2
.Tax
and
Oth
ers
ass
um
ed
it 1
0% o
f Ele
ctr
icity
R
eve
nue
3
.N
et
work
ing
Cap
ital
ass
um
ed
it 2
% o
f Ele
ctr
icity
R
eve
nue
4
.The c
ost
of
mak
eup
well
assu
med
it 3
mill
ion $

Dis
count
rate
:1
0%
○C
alcula
tion s
heet(
Ele
ctr
icity
Price 4
.45¢
/kW
h(a
t 2003, In
flat
ion:1
.5%))
Year
2005
2006
2007
2008
2009
2010
2011
2012
2013
2014
2015
2016
2017
2018
2019
2020
2021
2022
Ele
ctrici
ty V
olum
eM
Wh
473,
040
473,
040
473,
040
473,
040
473,
040
473,
040
473,
040
473,
040
471,
328
473,
040
473,
040
473,
040
472,
172
473,
040
473,
040
Ele
ctr
icity
Price
¢/kW
h4.4
54.
794.
874.
945.
015.
095.
165.
245.
325.
405.
485.
565.
655.
735.
825.
90
Ele
ctr
icity
Reve
nue$
22,6
77,1
30
23,0
17,2
87
23,3
62,5
46
23,7
12,9
84
24,0
68,6
79
24,4
29,7
09
24,7
96,1
55
25,1
68,0
97
25,4
53,1
89
25,9
28,8
03
26,3
17,7
35
26,7
12,5
01
27,0
63,4
32
27,5
19,8
86
27,9
32,6
85
O&M
cost
$6,8
00,0
00
6,9
02,0
00
7,0
05,5
30
7,1
10,6
13
7,2
17,2
72
7,3
25,5
31
7,4
35,4
14
7,5
46,9
45
7,6
60,1
50
7,7
75,0
52
7,8
91,6
78
8,0
10,0
53
8,1
30,2
04
8,2
52,1
57
8,3
75,9
39
Tax
,oth
ers
$2,2
67,7
13
2,3
01,7
29
2,3
36,2
55
2,3
71,2
98
2,4
06,8
68
2,4
42,9
71
2,4
79,6
15
2,5
16,8
10
2,5
45,3
19
2,5
92,8
80
2,6
31,7
74
2,6
71,2
50
2,7
06,3
43
2,7
51,9
89
2,7
93,2
68
Net
work
ing
Cap
ital
$453,5
43
6,8
03
6,9
05
7,0
09
7,1
14
7,2
21
7,3
29
7,4
39
5,7
02
9,5
12
7,7
79
7,8
95
7,0
19
9,1
29
8,2
56
Cap
ital
exp
endi
ture
$0
00
3,0
00,0
00
3,0
00,0
00
03,0
00,0
00
3,0
00,0
00
03,0
00,0
00
3,0
00,0
00
3,0
00,0
00
03,0
00,0
00
3,0
00,0
00
Cas
hflow
$13,1
55,8
74
13,8
06,7
55
14,0
13,8
56
11,2
24,0
64
11,4
37,4
25
14,6
53,9
87
11,8
73,7
96
12,0
96,9
03
15,2
42,0
19
12,5
51,3
59
12,7
86,5
05
13,0
23,3
03
16,2
19,8
66
13,5
06,6
12
13,7
55,2
21
12
34
56
78
910
1112
1314
1516
1718
Dis
count
rate
%10
1.00
0.91
0.83
0.75
0.68
0.62
0.56
0.51
0.47
0.42
0.39
0.35
0.32
0.29
0.26
0.24
0.22
0.20
PV
$9,8
84,2
03
9,4
30,1
99
8,7
01,5
02
6,3
35,6
92
5,8
69,2
08
6,8
36,1
93
5,0
35,6
49
4,6
63,8
80
5,3
42,2
35
3,9
99,2
50
3,7
03,7
95
3,4
29,4
43
3,8
82,9
07
2,9
39,4
32
2,7
21,3
97
NP
V$
82,7
74,9
84
0
100
200
300
400
500
600
700
2008
2009
2010
2011
2012
2013
2014
2015
2016
2017
2018
2019
2020
2021
2022
生産蒸気量(t/h)
010
20
30
40
50
60
70
出力(MW)
補充
井9本
補充
井生
産量
:45t/
h減
衰率
:6%
(初年
度減
衰率
:20%)
出
初期
坑井
生産
蒸気
量
総合
生産
蒸気
量
補充
井生
産蒸
気量
0
100
200
300
400
500
600
700
2008
2009
2010
2011
2012
2013
2014
2015
2016
2017
2018
2019
2020
2021
2022
生産蒸気量(t/h)
010
20
30
40
50
60
70
出力(MW)
Out
put
Tota
l ste
am fl
ow ra
te
Initi
al w
ells
stea
m fl
ow
Mak
eup
wel
ls st
eam
flow
rate
Steam flow rate
Output
Mak
eup
wel
ls:9
Mak
eup
wel
l ste
am fl
ow ra
te:
45t/
hD
eclin
e ra
te:6%
1
.O
&M
cost
ass
um
ed
it 3
0% o
f Ele
ctr
icity
Reve
nue
a
t firs
t ye
ar (
Age
d de
teriora
tion c
orr
ection
c
oeff
icie
nt:1.5
%)
2
.Tax
and
Oth
ers
ass
um
ed
it 1
0% o
f Ele
ctr
icity
R
eve
nue
3
.N
et
work
ing
Cap
ital
ass
um
ed
it 2
% o
f Ele
ctr
icity
R
eve
nue
4
.The c
ost
of
mak
eup
well
assu
med
it 3
mill
ion $

Dis
count
rate
:1
5%
○C
alcula
tion s
heet(
Ele
ctr
icity
Price 4
.45¢
/kW
h(a
t 2003, In
flat
ion:1
.5%))
Year
2005
2006
2007
2008
2009
2010
2011
2012
2013
2014
2015
2016
2017
2018
2019
2020
2021
2022
Ele
ctrici
ty V
olum
eM
Wh
473,
040
473,
040
473,
040
473,
040
473,
040
473,
040
473,
040
473,
040
473,
040
473,
040
473,
040
471,
697
473,
040
473,
040
473,
040
Ele
ctr
icity
Price
¢/kW
h4.4
54.
794.
874.
945.
015.
095.
165.
245.
325.
405.
485.
565.
655.
735.
825.
90
Ele
ctr
icity
Reve
nue
$22,6
77,1
30
23,0
17,2
87
23,3
62,5
46
23,7
12,9
84
24,0
68,6
79
24,4
29,7
09
24,7
96,1
55
25,1
68,0
97
25,5
45,6
19
25,9
28,8
03
26,3
17,7
35
26,6
36,6
69
27,1
13,1
89
27,5
19,8
86
27,9
32,6
85
O&M
cost
$6,8
00,0
00
6,9
02,0
00
7,0
05,5
30
7,1
10,6
13
7,2
17,2
72
7,3
25,5
31
7,4
35,4
14
7,5
46,9
45
7,6
60,1
50
7,7
75,0
52
7,8
91,6
78
8,0
10,0
53
8,1
30,2
04
8,2
52,1
57
8,3
75,9
39
Tax
,oth
ers
$2,2
67,7
13
2,3
01,7
29
2,3
36,2
55
2,3
71,2
98
2,4
06,8
68
2,4
42,9
71
2,4
79,6
15
2,5
16,8
10
2,5
54,5
62
2,5
92,8
80
2,6
31,7
74
2,6
63,6
67
2,7
11,3
19
2,7
51,9
89
2,7
93,2
68
Net
work
ing
Cap
ital
$453,5
43
6,8
03
6,9
05
7,0
09
7,1
14
7,2
21
7,3
29
7,4
39
7,5
50
7,6
64
7,7
79
6,3
79
9,5
30
8,1
34
8,2
56
Cap
ital
exp
endi
ture
$0
00
03,0
00,0
00
3,0
00,0
00
03,0
00,0
00
3,0
00,0
00
03,0
00,0
00
03,0
00,0
00
3,0
00,0
00
0
Cas
hflow
$13,1
55,8
74
13,8
06,7
55
14,0
13,8
56
14,2
24,0
64
11,4
37,4
25
11,6
53,9
87
14,8
73,7
96
12,0
96,9
03
12,3
23,3
57
15,5
53,2
07
12,7
86,5
05
15,9
56,5
71
13,2
62,1
36
13,5
07,6
07
16,7
55,2
21
12
34
56
78
910
1112
1314
1516
1718
Dis
count
rate
%15
1.00
0.87
0.76
0.66
0.57
0.50
0.43
0.38
0.33
0.28
0.25
0.21
0.19
0.16
0.14
0.12
0.11
0.09
PV
$8,6
50,2
01
7,8
94,0
57
6,9
67,3
63
6,1
49,4
55
4,2
99,7
52
3,8
09,7
09
4,2
28,0
61
2,9
90,1
69
2,6
48,8
22
2,9
07,0
06
2,0
78,1
65
2,2
55,1
21
1,6
29,8
43
1,4
43,4
87
1,5
56,9
94
NP
V$
59,5
08,2
06
0
100
200
300
400
500
600
700
2008
2009
2010
2011
2012
2013
2014
2015
2016
2017
2018
2019
2020
2021
2022
生産蒸気量(t/h)
010
20
30
40
50
60
70
出力(MW)
補充
井7
本補
充井
生産
量:45t/
h減
衰率
:5%
(初年
度減
衰率
:20%)
出力
初期
坑井
生産
蒸気
量
総合
生産
蒸気
量
補充
井生
産蒸
気量
0
100
200
300
400
500
600
700
2008
2009
2010
2011
2012
2013
2014
2015
2016
2017
2018
2019
2020
2021
2022
生産蒸気量(t/h)
010
20
30
40
50
60
70
出力(MW)
補充
井7
本補
充井
生産
量:45t/
h減
衰率
:5%
(初年
度減
衰率
:20%)
出力
初期
坑井
生産
蒸気
量
総合
生産
蒸気
量
補充
井生
産蒸
気量
Out
put
Tota
l ste
am fl
ow ra
te
Initi
al w
ells
stea
m fl
ow ra
te
Mak
eup
wel
ls st
eam
flow
rate
Mak
eup
wel
ls:7
Mak
eup
wel
l ste
am fl
ow ra
te:
45t/
hD
eclin
e ra
te:5%
Steam flow rate
Output
1
.O
&M
cost
ass
um
ed
it 3
0% o
f Ele
ctr
icity
Reve
nue
a
t firs
t ye
ar (
Age
d de
teriora
tion c
orr
ection
c
oeff
icie
nt:1.5
%)
2
.Tax
and
Oth
ers
ass
um
ed
it 1
0% o
f Ele
ctr
icity
R
eve
nue
3
.N
et
work
ing
Cap
ital
ass
um
ed
it 2
% o
f Ele
ctr
icity
R
eve
nue
4
.The c
ost
of
mak
eup
well
assu
med
it 3
mill
ion $

Dis
count
rate
:1
5%
○C
alcula
tion s
heet(
Ele
ctr
icity
Price 4
.45¢
/kW
h(a
t 2003, In
flat
ion:1
.5%))
Year
2005
2006
2007
2008
2009
2010
2011
2012
2013
2014
2015
2016
2017
2018
2019
2020
2021
2022
Ele
ctrici
ty V
olum
eM
Wh
473,
040
473,
040
473,
040
473,
040
473,
040
473,
040
471,
643
469,
841
473,
040
473,
040
473,
040
473,
040
473,
040
473,
040
473,
040
Ele
ctr
icity
Price
¢/kW
h4.4
54.
794.
874.
945.
015.
095.
165.
245.
325.
405.
485.
565.
655.
735.
825.
90
Ele
ctr
icity
Reve
nue
$22,6
77,1
30
23,0
17,2
87
23,3
62,5
46
23,7
12,9
84
24,0
68,6
79
24,4
29,7
09
24,7
22,9
48
24,9
97,8
84
25,5
45,6
19
25,9
28,8
03
26,3
17,7
35
26,7
12,5
01
27,1
13,1
89
27,5
19,8
86
27,9
32,6
85
O&M
cost
$6,8
00,0
00
6,9
02,0
00
7,0
05,5
30
7,1
10,6
13
7,2
17,2
72
7,3
25,5
31
7,4
35,4
14
7,5
46,9
45
7,6
60,1
50
7,7
75,0
52
7,8
91,6
78
8,0
10,0
53
8,1
30,2
04
8,2
52,1
57
8,3
75,9
39
Tax
,oth
ers
$2,2
67,7
13
2,3
01,7
29
2,3
36,2
55
2,3
71,2
98
2,4
06,8
68
2,4
42,9
71
2,4
72,2
95
2,4
99,7
88
2,5
54,5
62
2,5
92,8
80
2,6
31,7
74
2,6
71,2
50
2,7
11,3
19
2,7
51,9
89
2,7
93,2
68
Net
work
ing
Cap
ital
$453,5
43
6,8
03
6,9
05
7,0
09
7,1
14
7,2
21
5,8
65
5,4
99
10,9
55
7,6
64
7,7
79
7,8
95
8,0
14
8,1
34
8,2
56
Cap
ital
exp
endi
ture
$0
00
03,0
00,0
00
3,0
00,0
00
3,0
00,0
00
3,0
00,0
00
3,0
00,0
00
3,0
00,0
00
3,0
00,0
00
3,0
00,0
00
3,0
00,0
00
3,0
00,0
00
3,0
00,0
00
Cas
hflow
$13,1
55,8
74
13,8
06,7
55
14,0
13,8
56
14,2
24,0
64
11,4
37,4
25
11,6
53,9
87
11,8
09,3
74
11,9
45,6
51
12,3
19,9
53
12,5
53,2
07
12,7
86,5
05
13,0
23,3
03
13,2
63,6
52
13,5
07,6
07
13,7
55,2
21
12
34
56
78
910
1112
1314
1516
1718
Dis
count
rate
%15
1.00
0.87
0.76
0.66
0.57
0.50
0.43
0.38
0.33
0.28
0.25
0.21
0.19
0.16
0.14
0.12
0.11
0.09
PV
$8,6
50,2
01
7,8
94,0
57
6,9
67,3
63
6,1
49,4
55
4,2
99,7
52
3,8
09,7
09
3,3
56,9
61
2,9
52,7
82
2,6
48,0
90
2,3
46,2
84
2,0
78,1
65
1,8
40,5
66
1,6
30,0
30
1,4
43,4
87
1,2
78,2
16
NP
V$
57,3
45,1
19
0
100
200
300
400
500
600
700
2008
2009
2010
2011
2012
2013
2014
2015
2016
2017
2018
2019
2020
2021
2022
生産蒸気量(t/h)
010
20
30
40
50
60
70
出力(MW)
補充
井12本
補充
井生
産量
:25t/
h減
衰率
:5%
(初年
度減
衰率
:20%)
出力
初期
坑井
生産
蒸気
量
総合
生産
蒸気
量
補充
井生
産蒸
気量
0
100
200
300
400
500
600
700
2008
2009
2010
2011
2012
2013
2014
2015
2016
2017
2018
2019
2020
2021
2022
生産蒸気量(t/h)
010
20
30
40
50
60
70
出力(MW)
補充
井12本
補充
井生
産量
:25t/
h減
衰率
:5%
(初年
度減
衰率
:20%)
出力
初期
坑井
生産
蒸気
量
総合
生産
蒸気
量
補充
井生
産蒸
気量
Out
put
Tota
l ste
am fl
ow ra
te
Initi
al w
ells
stea
m fl
ow ra
te
Mak
eup
wel
ls st
eam
flow
rate
Mak
eup
wel
ls:12
Mak
eup
wel
l ste
am fl
ow ra
te:
25t/
hD
eclin
e ra
te:5%
Steam flow rate
Output
1
.O
&M
cost
ass
um
ed
it 3
0% o
f Ele
ctr
icity
Reve
nue
a
t firs
t ye
ar (
Age
d de
teriora
tion c
orr
ection
c
oeff
icie
nt:1.5
%)
2
.Tax
and
Oth
ers
ass
um
ed
it 1
0% o
f Ele
ctr
icity
R
eve
nue
3
.N
et
work
ing
Cap
ital
ass
um
ed
it 2
% o
f Ele
ctr
icity
R
eve
nue
4
.The c
ost
of
mak
eup
well
assu
med
it 3
mill
ion $
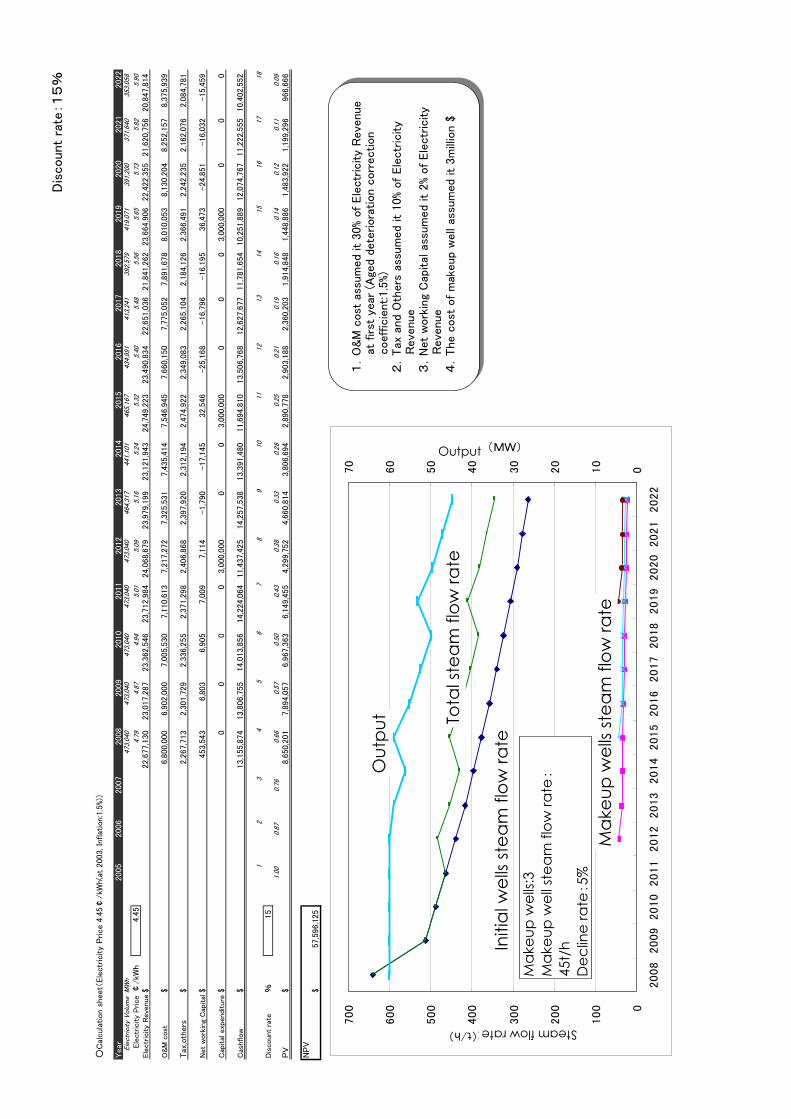
Dis
count
rate
:1
5%
○C
alcula
tion s
heet(
Ele
ctr
icity
Price 4
.45¢
/kW
h(a
t 2003, In
flat
ion:1
.5%))
Year
2005
2006
2007
2008
2009
2010
2011
2012
2013
2014
2015
2016
2017
2018
2019
2020
2021
2022
Ele
ctrici
ty V
olum
eM
Wh
473,
040
473,
040
473,
040
473,
040
473,
040
464,
317
441,
101
465,
167
434,
991
413,
241
392,
579
419,
071
391,
200
371,
640
353,
058
Ele
ctr
icity
Price
¢/kW
h4.4
54.
794.
874.
945.
015.
095.
165.
245.
325.
405.
485.
565.
655.
735.
825.
90
Ele
ctr
icity
Reve
nue
$22,6
77,1
30
23,0
17,2
87
23,3
62,5
46
23,7
12,9
84
24,0
68,6
79
23,9
79,1
99
23,1
21,9
43
24,7
49,2
23
23,4
90,8
34
22,6
51,0
36
21,8
41,2
62
23,6
64,9
06
22,4
22,3
55
21,6
20,7
56
20,8
47,8
14
O&M
cost
$6,8
00,0
00
6,9
02,0
00
7,0
05,5
30
7,1
10,6
13
7,2
17,2
72
7,3
25,5
31
7,4
35,4
14
7,5
46,9
45
7,6
60,1
50
7,7
75,0
52
7,8
91,6
78
8,0
10,0
53
8,1
30,2
04
8,2
52,1
57
8,3
75,9
39
Tax
,oth
ers
$2,2
67,7
13
2,3
01,7
29
2,3
36,2
55
2,3
71,2
98
2,4
06,8
68
2,3
97,9
20
2,3
12,1
94
2,4
74,9
22
2,3
49,0
83
2,2
65,1
04
2,1
84,1
26
2,3
66,4
91
2,2
42,2
35
2,1
62,0
76
2,0
84,7
81
Net
work
ing
Cap
ital
$453,5
43
6,8
03
6,9
05
7,0
09
7,1
14
-1,7
90
-17,1
45
32,5
46
-25,1
68
-16,7
96
-16,1
95
36,4
73
-24,8
51
-16,0
32
-15,4
59
Cap
ital
exp
endi
ture
$0
00
03,0
00,0
00
00
3,0
00,0
00
00
03,0
00,0
00
00
0
Cas
hflow
$13,1
55,8
74
13,8
06,7
55
14,0
13,8
56
14,2
24,0
64
11,4
37,4
25
14,2
57,5
38
13,3
91,4
80
11,6
94,8
10
13,5
06,7
68
12,6
27,6
77
11,7
81,6
54
10,2
51,8
89
12,0
74,7
67
11,2
22,5
55
10,4
02,5
52
12
34
56
78
910
1112
1314
1516
1718
Dis
count
rate
%15
1.00
0.87
0.76
0.66
0.57
0.50
0.43
0.38
0.33
0.28
0.25
0.21
0.19
0.16
0.14
0.12
0.11
0.09
PV
$8,6
50,2
01
7,8
94,0
57
6,9
67,3
63
6,1
49,4
55
4,2
99,7
52
4,6
60,8
14
3,8
06,6
94
2,8
90,7
78
2,9
03,1
88
2,3
60,2
03
1,9
14,8
48
1,4
48,8
86
1,4
83,9
22
1,1
99,2
96
966,6
66
NP
V$
57,5
96,1
25
0
100
200
300
400
500
600
700
2008
2009
2010
2011
2012
2013
2014
2015
2016
2017
2018
2019
2020
2021
2022
生産蒸気量(t/h)
010
20
30
40
50
60
70
出力(MW)
補充
井3
本補
充井
生産
量:45t/
h減
衰率
:5%
(初年
度減
衰率
:20%)
出
初期
坑井
生産
蒸気
量
総合
生産
蒸気
量
補充
井生
産蒸
気量
0
100
200
300
400
500
600
700
2008
2009
2010
2011
2012
2013
2014
2015
2016
2017
2018
2019
2020
2021
2022
生産蒸気量(t/h)
010
20
30
40
50
60
70
出力(MW)
補充
井3
本補
充井
生産
量:45t/
h減
衰率
:5%
(初年
度減
衰率
:20%)
出力
初期
坑井
生産
蒸気
量
総合
生産
蒸気
量
補充
井生
産蒸
気量
Out
put To
tal s
team
flow
rate
Initi
al w
ells
stea
m fl
ow ra
te
Mak
eup
wel
ls st
eam
flow
rate
Mak
eup
wel
ls:3
Mak
eup
wel
l ste
am fl
ow ra
te:
45t/
hD
eclin
e ra
te:5%
Steam flow rate
Output
1
.O
&M
cost
ass
um
ed
it 3
0% o
f Ele
ctr
icity
Reve
nue
a
t firs
t ye
ar (
Age
d de
teriora
tion c
orr
ection
c
oeff
icie
nt:1.5
%)
2
.Tax
and
Oth
ers
ass
um
ed
it 1
0% o
f Ele
ctr
icity
R
eve
nue
3
.N
et
work
ing
Cap
ital
ass
um
ed
it 2
% o
f Ele
ctr
icity
R
eve
nue
4
.The c
ost
of
mak
eup
well
assu
med
it 3
mill
ion $

Dis
count
rate
:1
5%
○C
alcula
tion s
heet(
Ele
ctr
icity
Price 4
.45¢
/kW
h(a
t 2003, In
flat
ion:1
.5%))
Year
2005
2006
2007
2008
2009
2010
2011
2012
2013
2014
2015
2016
2017
2018
2019
2020
2021
2022
Ele
ctrici
ty V
olum
eM
Wh
473,
040
473,
040
473,
040
473,
040
449,
915
427,
420
406,
049
385,
746
366,
459
348,
136
330,
729
314,
193
298,
483
283,
559
269,
381
Ele
ctr
icity
Price
¢/kW
h4.4
54.
794.
874.
945.
015.
095.
165.
245.
325.
405.
485.
565.
655.
735.
825.
90
Ele
ctr
icity
Reve
nue
$22,6
77,1
30
23,0
17,2
87
23,3
62,5
46
23,7
12,9
84
22,8
92,0
74
22,0
73,6
82
21,2
84,5
48
20,5
23,6
25
19,7
89,9
06
19,0
82,4
17
18,4
00,2
20
17,7
42,4
12
17,1
08,1
21
16,4
96,5
06
15,9
06,7
56
O&M
cost
$6,8
00,0
00
6,9
02,0
00
7,0
05,5
30
7,1
10,6
13
7,2
17,2
72
7,3
25,5
31
7,4
35,4
14
7,5
46,9
45
7,6
60,1
50
7,7
75,0
52
7,8
91,6
78
8,0
10,0
53
8,1
30,2
04
8,2
52,1
57
8,3
75,9
39
Tax
,oth
ers
$2,2
67,7
13
2,3
01,7
29
2,3
36,2
55
2,3
71,2
98
2,2
89,2
07
2,2
07,3
68
2,1
28,4
55
2,0
52,3
63
1,9
78,9
91
1,9
08,2
42
1,8
40,0
22
1,7
74,2
41
1,7
10,8
12
1,6
49,6
51
1,5
90,6
76
Net
work
ing
Cap
ital
$453,5
43
6,8
03
6,9
05
7,0
09
-16,4
18
-16,3
68
-15,7
83
-15,2
18
-14,6
74
-14,1
50
-13,6
44
-13,1
56
-12,6
86
-12,2
32
-11,7
95
Cap
ital
exp
endi
ture
$0
00
00
00
00
00
00
00
Cas
hflow
$13,1
55,8
74
13,8
06,7
55
14,0
13,8
56
14,2
24,0
64
13,4
02,0
12
12,5
57,1
50
11,7
36,4
62
10,9
39,5
36
10,1
65,4
40
9,4
13,2
73
8,6
82,1
65
7,9
71,2
75
7,2
79,7
91
6,6
06,9
31
5,9
51,9
36
12
34
56
78
910
1112
1314
1516
1718
Dis
count
rate
%15
1.00
0.87
0.76
0.66
0.57
0.50
0.43
0.38
0.33
0.28
0.25
0.21
0.19
0.16
0.14
0.12
0.11
0.09
PV
$8,6
50,2
01
7,8
94,0
57
6,9
67,3
63
6,1
49,4
55
5,0
38,3
13
4,1
04,9
55
3,3
36,2
35
2,7
04,0
86
2,1
84,9
92
1,7
59,4
08
1,4
11,0
94
1,1
26,5
70
894,6
46
706,0
48
553,0
89
NP
V$
53,4
80,5
13
0
100
200
300
400
500
600
700
2008
2009
2010
2011
2012
2013
2014
2015
2016
2017
2018
2019
2020
2021
2022
生産蒸気量(t/h)
010
20
30
40
50
60
70
出力(MW)
補充
井な
し減
衰率
:5%
(初年
度減
衰率
:20%)
出力
初期
坑井
生産
蒸気
量
0
100
200
300
400
500
600
700
2008
2009
2010
2011
2012
2013
2014
2015
2016
2017
2018
2019
2020
2021
2022
生産蒸気量(t/h)
010
20
30
40
50
60
70
出力(MW)
補充
井な
し減
衰率
:5%
(初年
度減
衰率
:20%)
出力
初期
坑井
生産
蒸気
量
Out
put
Initi
al w
ells
stea
m fl
ow ra
teM
akeu
p w
ells:
0D
eclin
e ra
te:5%
(Initi
al d
eclin
e ra
te:20
%)
Steam flow rate
Output
1
.O
&M
cost
ass
um
ed
it 3
0% o
f Ele
ctr
icity
Reve
nue
a
t firs
t ye
ar (
Age
d de
teriora
tion c
orr
ection
c
oeff
icie
nt:1.5
%)
2
.Tax
and
Oth
ers
ass
um
ed
it 1
0% o
f Ele
ctr
icity
R
eve
nue
3
.N
et
work
ing
Cap
ital
ass
um
ed
it 2
% o
f Ele
ctr
icity
R
eve
nue

Dis
count
rate
:1
5%
○C
alcula
tion s
heet(
Ele
ctr
icity
Price 4
.45¢
/kW
h(a
t 2003, In
flat
ion:1
.5%))
Year
2005
2006
2007
2008
2009
2010
2011
2012
2013
2014
2015
2016
2017
2018
2019
2020
2021
2022
Ele
ctrici
ty V
olum
eM
Wh
473,
040
473,
040
473,
040
444,
156
408,
624
375,
934
345,
859
318,
190
292,
735
269,
316
247,
771
227,
949
209,
713
192,
936
177,
501
Ele
ctr
icity
Price
¢/kW
h4.4
54.
794.
874.
945.
015.
095.
165.
245.
325.
405.
485.
565.
655.
735.
825.
90
Ele
ctr
icity
Reve
nue
$22,6
77,1
30
23,0
17,2
87
23,3
62,5
46
22,2
65,0
63
20,7
91,1
16
19,4
14,7
44
18,1
29,4
88
16,9
29,3
16
15,8
08,5
95
14,7
62,0
66
13,7
84,8
17
12,8
72,2
63
12,0
20,1
19
11,2
24,3
87
10,4
81,3
32
O&M
cost
$6,8
00,0
00
6,9
02,0
00
7,0
05,5
30
7,1
10,6
13
7,2
17,2
72
7,3
25,5
31
7,4
35,4
14
7,5
46,9
45
7,6
60,1
50
7,7
75,0
52
7,8
91,6
78
8,0
10,0
53
8,1
30,2
04
8,2
52,1
57
8,3
75,9
39
Tax
,oth
ers
$2,2
67,7
13
2,3
01,7
29
2,3
36,2
55
2,2
26,5
06
2,0
79,1
12
1,9
41,4
74
1,8
12,9
49
1,6
92,9
32
1,5
80,8
60
1,4
76,2
07
1,3
78,4
82
1,2
87,2
26
1,2
02,0
12
1,1
22,4
39
1,0
48,1
33
Net
work
ing
Cap
ital
$453,5
43
6,8
03
6,9
05
-21,9
50
-29,4
79
-27,5
27
-25,7
05
-24,0
03
-22,4
14
-20,9
31
-19,5
45
-18,2
51
-17,0
43
-15,9
15
-14,8
61
Cap
ital
exp
endi
ture
$0
00
00
00
00
00
00
00
Cas
hflow
$13,1
55,8
74
13,8
06,7
55
14,0
13,8
56
12,9
49,8
94
11,5
24,2
11
10,1
75,2
66
8,9
06,8
30
7,7
13,4
42
6,5
90,0
01
5,5
31,7
38
4,5
34,2
03
3,5
93,2
35
2,7
04,9
46
1,8
65,7
06
1,0
72,1
21
12
34
56
78
910
1112
1314
1516
1718
Dis
count
rate
%15
1.00
0.87
0.76
0.66
0.57
0.50
0.43
0.38
0.33
0.28
0.25
0.21
0.19
0.16
0.14
0.12
0.11
0.09
PV
$8,6
50,2
01
7,8
94,0
57
6,9
67,3
63
5,5
98,5
96
4,3
32,3
78
3,3
26,3
12
2,5
31,8
77
1,9
06,6
45
1,4
16,4
76
1,0
33,9
21
736,9
35
507,8
27
332,4
23
199,3
78
99,6
28
NP
V$
45,5
34,0
18
0
100
200
300
400
500
600
700
2008
2009
2010
2011
2012
2013
2014
2015
2016
2017
2018
2019
2020
2021
2022
生産蒸気量(t/h)
010
20
30
40
50
60
70
出力(MW)
補充
井な
し減
衰率
:8%
(初年
度減
衰率
:20%)
出力
初期
坑井
生産
蒸気
量
0
100
200
300
400
500
600
700
2008
2009
2010
2011
2012
2013
2014
2015
2016
2017
2018
2019
2020
2021
2022
生産蒸気量(t/h)
010
20
30
40
50
60
70
出力(MW)
補充
井な
し減
衰率
:8%
(初年
度減
衰率
:20%)
出力
初期
坑井
生産
蒸気
量
Out
put
Initi
al w
ells
stea
m fl
ow ra
te
Steam flow rate
Output
Mak
eup
wel
ls:0
Dec
line
rate
:5%
(Initi
al d
eclin
e ra
te:20
%)
1
.O
&M
cost
ass
um
ed
it 3
0% o
f Ele
ctr
icity
Reve
nue
a
t firs
t ye
ar (
Age
d de
teriora
tion c
orr
ection
c
oeff
icie
nt:1.5
%)
2
.Tax
and
Oth
ers
ass
um
ed
it 1
0% o
f Ele
ctr
icity
R
eve
nue
3
.N
et
work
ing
Cap
ital
ass
um
ed
it 2
% o
f Ele
ctr
icity
R
eve
nue

Dis
count
rate
:1
5%
○C
alcula
tion s
heet(
Ele
ctr
icity
Price 4
.45¢
/kW
h(a
t 2003, In
flat
ion:1
.5%))
Year
2005
2006
2007
2008
2009
2010
2011
2012
2013
2014
2015
2016
2017
2018
2019
2020
2021
2022
Ele
ctrici
ty V
olum
eM
Wh
473,
040
473,
040
473,
040
473,
040
473,
040
473,
040
473,
040
473,
040
473,
040
473,
040
473,
040
473,
040
473,
040
473,
040
473,
040
Ele
ctr
icity
Price
¢/kW
h4.4
54.
794.
874.
945.
015.
095.
165.
245.
325.
405.
485.
565.
655.
735.
825.
90
Ele
ctr
icity
Reve
nue
$22,6
77,1
30
23,0
17,2
87
23,3
62,5
46
23,7
12,9
84
24,0
68,6
79
24,4
29,7
09
24,7
96,1
55
25,1
68,0
97
25,5
45,6
19
25,9
28,8
03
26,3
17,7
35
26,7
12,5
01
27,1
13,1
89
27,5
19,8
86
27,9
32,6
85
O&M
cost
$6,8
00,0
00
6,9
02,0
00
7,0
05,5
30
7,1
10,6
13
7,2
17,2
72
7,3
25,5
31
7,4
35,4
14
7,5
46,9
45
7,6
60,1
50
7,7
75,0
52
7,8
91,6
78
8,0
10,0
53
8,1
30,2
04
8,2
52,1
57
8,3
75,9
39
Tax
,oth
ers
$2,2
67,7
13
2,3
01,7
29
2,3
36,2
55
2,3
71,2
98
2,4
06,8
68
2,4
42,9
71
2,4
79,6
15
2,5
16,8
10
2,5
54,5
62
2,5
92,8
80
2,6
31,7
74
2,6
71,2
50
2,7
11,3
19
2,7
51,9
89
2,7
93,2
68
Net
work
ing
Cap
ital
$453,5
43
6,8
03
6,9
05
7,0
09
7,1
14
7,2
21
7,3
29
7,4
39
7,5
50
7,6
64
7,7
79
7,8
95
8,0
14
8,1
34
8,2
56
Cap
ital
exp
endi
ture
$0
00
3,0
00,0
00
3,0
00,0
00
3,0
00,0
00
3,0
00,0
00
3,0
00,0
00
3,0
00,0
00
3,0
00,0
00
3,0
00,0
00
3,0
00,0
00
3,0
00,0
00
3,0
00,0
00
3,0
00,0
00
Cas
hflow
$13,1
55,8
74
13,8
06,7
55
14,0
13,8
56
11,2
24,0
64
11,4
37,4
25
11,6
53,9
87
11,8
73,7
96
12,0
96,9
03
12,3
23,3
57
12,5
53,2
07
12,7
86,5
05
13,0
23,3
03
13,2
63,6
52
13,5
07,6
07
13,7
55,2
21
12
34
56
78
910
1112
1314
1516
1718
Dis
count
rate
%15
1.00
0.87
0.76
0.66
0.57
0.50
0.43
0.38
0.33
0.28
0.25
0.21
0.19
0.16
0.14
0.12
0.11
0.09
PV
$8,6
50,2
01
7,8
94,0
57
6,9
67,3
63
4,8
52,4
73
4,2
99,7
52
3,8
09,7
09
3,3
75,2
74
2,9
90,1
69
2,6
48,8
22
2,3
46,2
84
2,0
78,1
65
1,8
40,5
66
1,6
30,0
30
1,4
43,4
87
1,2
78,2
16
NP
V$
56,1
04,5
68
0
100
200
300
400
500
600
700
2008
2009
2010
2011
2012
2013
2014
2015
2016
2017
2018
2019
2020
2021
2022
生産蒸気量(t/h)
010
20
30
40
50
60
70
出力(MW)
補充
井12本
補充
井生
産量
:45t/
h減
衰率
:8%
(初年
度減
衰率
:20%)
出
初期
坑井
生産
蒸気
量
総合
生産
蒸気
量
補充
井生
産蒸
気量
0
100
200
300
400
500
600
700
2008
2009
2010
2011
2012
2013
2014
2015
2016
2017
2018
2019
2020
2021
2022
生産蒸気量(t/h)
010
20
30
40
50
60
70
出力(MW)
補充
井12本
補充
井生
産量
:45t/
h減
衰率
:8%
(初年
度減
衰率
:20%)
出力
初期
坑井
生産
蒸気
量
総合
生産
蒸気
量
補充
井生
産蒸
気量
Out
put
Tota
l ste
am fl
ow ra
te
Initi
al w
ells
stea
m fl
ow ra
te
Mak
eup
wel
ls st
eam
flow
rate
Steam flow rate
Output
Mak
eup
wel
ls:12
Mak
eup
wel
l ste
am fl
ow ra
te:
45t/
hD
eclin
e ra
te:8%
1
.O
&M
cost
ass
um
ed
it 3
0% o
f Ele
ctr
icity
Reve
nue
a
t firs
t ye
ar (
Age
d de
teriora
tion c
orr
ection
c
oeff
icie
nt:1.5
%)
2
.Tax
and
Oth
ers
ass
um
ed
it 1
0% o
f Ele
ctr
icity
R
eve
nue
3
.N
et
work
ing
Cap
ital
ass
um
ed
it 2
% o
f Ele
ctr
icity
R
eve
nue
4
.The c
ost
of
mak
eup
well
assu
med
it 3
mill
ion $

Dis
count
rate
:1
5%
○C
alcula
tion s
heet(
Ele
ctr
icity
Price 4
.45¢
/kW
h(a
t 2003, In
flat
ion:1
.5%))
Year
2005
2006
2007
2008
2009
2010
2011
2012
2013
2014
2015
2016
2017
2018
2019
2020
2021
2022
Ele
ctrici
ty V
olum
eM
Wh
473,
040
473,
040
473,
040
473,
040
473,
040
473,
040
473,
040
472,
316
473,
040
473,
040
473,
040
473,
040
473,
040
473,
040
470,
265
Ele
ctr
icity
Price
¢/kW
h4.4
54.
794.
874.
945.
015.
095.
165.
245.
325.
405.
485.
565.
655.
735.
825.
90
Ele
ctr
icity
Reve
nue
$22,6
77,1
30
23,0
17,2
87
23,3
62,5
46
23,7
12,9
84
24,0
68,6
79
24,4
29,7
09
24,7
96,1
55
25,1
29,5
86
25,5
45,6
19
25,9
28,8
03
26,3
17,7
35
26,7
12,5
01
27,1
13,1
89
27,5
19,8
86
27,7
68,8
30
O&M
cost
$6,8
00,0
00
6,9
02,0
00
7,0
05,5
30
7,1
10,6
13
7,2
17,2
72
7,3
25,5
31
7,4
35,4
14
7,5
46,9
45
7,6
60,1
50
7,7
75,0
52
7,8
91,6
78
8,0
10,0
53
8,1
30,2
04
8,2
52,1
57
8,3
75,9
39
Tax
,oth
ers
$2,2
67,7
13
2,3
01,7
29
2,3
36,2
55
2,3
71,2
98
2,4
06,8
68
2,4
42,9
71
2,4
79,6
15
2,5
12,9
59
2,5
54,5
62
2,5
92,8
80
2,6
31,7
74
2,6
71,2
50
2,7
11,3
19
2,7
51,9
89
2,7
76,8
83
Net
work
ing
Cap
ital
$453,5
43
6,8
03
6,9
05
7,0
09
7,1
14
7,2
21
7,3
29
6,6
69
8,3
21
7,6
64
7,7
79
7,8
95
8,0
14
8,1
34
4,9
79
Cap
ital
exp
endi
ture
$0
00
3,0
00,0
00
3,0
00,0
00
3,0
00,0
00
3,0
00,0
00
03,0
00,0
00
3,0
00,0
00
3,0
00,0
00
3,0
00,0
00
3,0
00,0
00
3,0
00,0
00
0
Cas
hflow
$13,1
55,8
74
13,8
06,7
55
14,0
13,8
56
11,2
24,0
64
11,4
37,4
25
11,6
53,9
87
11,8
73,7
96
15,0
63,0
13
12,3
22,5
87
12,5
53,2
07
12,7
86,5
05
13,0
23,3
03
13,2
63,6
52
13,5
07,6
07
16,6
11,0
30
12
34
56
78
910
1112
1314
1516
1718
Dis
count
rate
%15
1.00
0.87
0.76
0.66
0.57
0.50
0.43
0.38
0.33
0.28
0.25
0.21
0.19
0.16
0.14
0.12
0.11
0.09
PV
$8,6
50,2
01
7,8
94,0
57
6,9
67,3
63
4,8
52,4
73
4,2
99,7
52
3,8
09,7
09
3,3
75,2
74
3,7
23,3
46
2,6
48,6
56
2,3
46,2
84
2,0
78,1
65
1,8
40,5
66
1,6
30,0
30
1,4
43,4
87
1,5
43,5
95
NP
V$
57,1
02,9
58
0
100
200
300
400
500
600
700
2008
2009
2010
2011
2012
2013
2014
2015
2016
2017
2018
2019
2020
2021
2022
生産蒸気量(t/h)
010
20
30
40
50
60
70
出力(MW)
補充
井10本
補充
井生
産量
:45t/
h減
衰率
:7%
(初年
度減
衰率
:20%)
出
初期
坑井
生産
蒸気
量
総合
生産
蒸気
量
補充
井生
産蒸
気量
0
100
200
300
400
500
600
700
2008
2009
2010
2011
2012
2013
2014
2015
2016
2017
2018
2019
2020
2021
2022
生産蒸気量(t/h)
010
20
30
40
50
60
70
出力(MW)
Out
put
Tota
l ste
am fl
ow ra
te
Initi
al w
ells
stea
m fl
ow ra
te
Mak
eup
wel
ls st
eam
flow
rate
Steam flow rate
Output
Mak
eup
wel
ls:10
Mak
eup
wel
l ste
am fl
ow ra
te:45
t/h
Dec
line
rate
:7%
(Initi
al d
eclin
e ra
te:20
%)
1
.O
&M
cost
ass
um
ed it
30% o
f Ele
ctr
icity
Reve
nue
a
t firs
t ye
ar (A
ged
dete
riora
tion c
orr
ection
c
oeffic
ient:1.5
%)
2
.Tax
and O
thers
ass
um
ed it
10% o
f Ele
ctr
icity
R
eve
nue
3
.N
et
work
ing
Cap
ital
ass
um
ed it
2% o
f Ele
ctr
icity
R
eve
nue
4
.The c
ost
of m
akeup
well
assu
med
it 3
mill
ion $

Dis
count
rate
:1
5%
○C
alcula
tion s
heet(
Ele
ctr
icity
Price 4
.45¢
/kW
h(a
t 2003, In
flat
ion:1
.5%))
Year
2005
2006
2007
2008
2009
2010
2011
2012
2013
2014
2015
2016
2017
2018
2019
2020
2021
2022
Ele
ctrici
ty V
olum
eM
Wh
473,
040
473,
040
473,
040
473,
040
473,
040
473,
040
473,
040
473,
040
471,
328
473,
040
473,
040
473,
040
472,
172
473,
040
473,
040
Ele
ctr
icity
Price
¢/kW
h4.4
54.
794.
874.
945.
015.
095.
165.
245.
325.
405.
485.
565.
655.
735.
825.
90
Ele
ctr
icity
Reve
nue$
22,6
77,1
30
23,0
17,2
87
23,3
62,5
46
23,7
12,9
84
24,0
68,6
79
24,4
29,7
09
24,7
96,1
55
25,1
68,0
97
25,4
53,1
89
25,9
28,8
03
26,3
17,7
35
26,7
12,5
01
27,0
63,4
32
27,5
19,8
86
27,9
32,6
85
O&M
cost
$6,8
00,0
00
6,9
02,0
00
7,0
05,5
30
7,1
10,6
13
7,2
17,2
72
7,3
25,5
31
7,4
35,4
14
7,5
46,9
45
7,6
60,1
50
7,7
75,0
52
7,8
91,6
78
8,0
10,0
53
8,1
30,2
04
8,2
52,1
57
8,3
75,9
39
Tax
,oth
ers
$2,2
67,7
13
2,3
01,7
29
2,3
36,2
55
2,3
71,2
98
2,4
06,8
68
2,4
42,9
71
2,4
79,6
15
2,5
16,8
10
2,5
45,3
19
2,5
92,8
80
2,6
31,7
74
2,6
71,2
50
2,7
06,3
43
2,7
51,9
89
2,7
93,2
68
Net
work
ing
Cap
ital
$453,5
43
6,8
03
6,9
05
7,0
09
7,1
14
7,2
21
7,3
29
7,4
39
5,7
02
9,5
12
7,7
79
7,8
95
7,0
19
9,1
29
8,2
56
Cap
ital
exp
endi
ture
$0
00
3,0
00,0
00
3,0
00,0
00
03,0
00,0
00
3,0
00,0
00
03,0
00,0
00
3,0
00,0
00
3,0
00,0
00
03,0
00,0
00
3,0
00,0
00
Cas
hflow
$13,1
55,8
74
13,8
06,7
55
14,0
13,8
56
11,2
24,0
64
11,4
37,4
25
14,6
53,9
87
11,8
73,7
96
12,0
96,9
03
15,2
42,0
19
12,5
51,3
59
12,7
86,5
05
13,0
23,3
03
16,2
19,8
66
13,5
06,6
12
13,7
55,2
21
12
34
56
78
910
1112
1314
1516
1718
Dis
count
rate
%15
1.00
0.87
0.76
0.66
0.57
0.50
0.43
0.38
0.33
0.28
0.25
0.21
0.19
0.16
0.14
0.12
0.11
0.09
PV
$8,6
50,2
01
7,8
94,0
57
6,9
67,3
63
4,8
52,4
73
4,2
99,7
52
4,7
90,4
14
3,3
75,2
74
2,9
90,1
69
3,2
76,1
69
2,3
45,9
39
2,0
78,1
65
1,8
40,5
66
1,9
93,3
32
1,4
43,3
81
1,2
78,2
16
NP
V$
58,0
75,4
70
0
100
200
300
400
500
600
700
2008
2009
2010
2011
2012
2013
2014
2015
2016
2017
2018
2019
2020
2021
2022
生産蒸気量(t/h)
010
20
30
40
50
60
70
出力(MW)
補充
井9本
補充
井生
産量
:45t/
h減
衰率
:6%
(初年
度減
衰率
:20%)
出
初期
坑井
生産
蒸気
量
総合
生産
蒸気
量
補充
井生
産蒸
気量
0
100
200
300
400
500
600
700
2008
2009
2010
2011
2012
2013
2014
2015
2016
2017
2018
2019
2020
2021
2022
生産蒸気量(t/h)
010
20
30
40
50
60
70
出力(MW)
Out
put
Tota
l ste
am fl
ow ra
te
Initi
al w
ells
stea
m fl
ow
Mak
eup
wel
ls st
eam
flow
rate
Steam flow rate
Output
Mak
eup
wel
ls:9
Mak
eup
wel
l ste
am fl
ow ra
te:
45t/
hD
eclin
e ra
te:6%
1
.O
&M
cost
ass
um
ed
it 3
0% o
f Ele
ctr
icity
Reve
nue
a
t firs
t ye
ar (
Age
d de
teriora
tion c
orr
ection
c
oeff
icie
nt:1.5
%)
2
.Tax
and
Oth
ers
ass
um
ed
it 1
0% o
f Ele
ctr
icity
R
eve
nue
3
.N
et
work
ing
Cap
ital
ass
um
ed
it 2
% o
f Ele
ctr
icity
R
eve
nue
4
.The c
ost
of
mak
eup
well
assu
med
it 3
mill
ion $

インドネシア
地熱発電所のスケール対策とCDM事業化調査
和文要約

要約
1.ディエン地熱発電所の概要
ディエン台地の地熱資源調査は、1970 年代から開始され、1985~1991 年にはアジア開発
銀行(ADB)の資金により地熱発電所の計画が策定された(55MW×2)。
1994 年に米国の California Energy International(CEI)主導の JV がディエン地熱発
電所建設(2001 年までに 4 基 150MW の計画)の契約を取り交わし、1998 年には 60MW の 1
号機が完成し、45 本の井戸が掘られ 350MW のポテンシャルが確認されたが、アジア経済危
機の影響で 2 号機以降の事業は中断、CEI も Mid-American 社に買収された。その後、米投
資保険会社(OPIC)の介入を経て、ディエン発電所は 2001 年 8 月に PLN とプルタミナの合
弁会社「ジオ・ディパ社」の保有となっている。
2.調査結果概要 1)ディエン地熱発電所におけるスケール発生状況
スケール発生場所、性状、メカニズムについて調査、分析した結果、坑井内にシリカスケールが、フラッシュによって発生していることが確認できた。このスケール発生のため定格出力 60MW に対して現在、42MW 程度で運転しており、この対策として薬品注入を検討中で、現在効果的な薬品を開発中とのことである。
スケール発生 (フラッシュポイント)
生産流体 生産流体
スケール発生(フラッシュポイント)
(蒸気) (蒸気) 図4:坑井におけるスケール発生箇所
坑井
地表
s-1
図 2:ディエン地熱発電所運営体制(上)および全景(下)
ディエン地熱発電所
ジョグジャカルタ
図 1:プロジェクト位置図 プルタミナ(国営石油会社)
PLN (国営電力会社)
ジオ・ディパ社
ディエン地熱発電所
共同出資67% 33%
炭酸カルシウムシリカ スケール性状
坑井内フラッシュ pH異性流体混合発生メカニズム
坑井 発生場所 配管 タービン
シリカ
図3:各項目の可能性とディエン地熱発電所での実態

図7:補充井掘削本数による経済性の変化
2)ディエン地熱発電所における最適 O&M 検討
スケール対策として、ディエン地熱発電所では薬品注入を検討中であるが、仮に効果的な薬品を開発できたとしてもコスト問題が懸念される。このことを考慮し、現在、当社管内において「清水」を注入することでスケール発生を抑制する試みを行う予定としており、その結果次第ではディエン地熱発電所に対する画期的な技術協力が可能となる。 また、現時点では大きな問題となっていないが、蒸気性状から、将来的にタービンにお
けるスケール付着が問題となる可能性があり、この場合には、当社で実績のある「タービン・ウォッシング装置」が有効である。
3)ディエン地熱発電所拡張計画 現在、ディエン地熱発電所では拡張計画
が推進されている。予定ではディエン地熱発電所 2号機が 2008 年に 3号機が 2009 年に営業運転を開始することになっている。 ここで、この拡張計画はディエン地熱発
電所単独ではなく、ディエンから遠く離れたバンドン近郊のパトゥーハ地域とセットになったプロジェクトであり、総出力300MW(5 基)の地熱発電所を建設しようとする大規模な計画である。 ディエン、パトゥーハ両地域とも資源量
は十分にあり、技術的には問題がないと判断されるが、プロジェクト総額が約 600 億円と巨額であり、融資実行の見通しが立たないことから、計画は遅延している。 また、ディエン地熱発電所の増設号機を想定し建設費用を1ユニット約 120 億円とした
場合、IRR はリスクフリーレート 6.85%とほとんど同程度となり,また,非凝縮性ガス発生量の多さから CO2クレジット発生量は比較的少ないと見込まれないことから,本邦企業の事業参画は厳しいと考えられる。
4)サルーラ地域地熱開発計画 本件は概算で約70万トン/年のCO2クレジットの発
生が見込まれることから、併せて調査を行った。 サルーラ地域では 3つの地熱系が確認され、総合計
で 330MW の発電が 30 年間に渡り安定的に操業可能であるとの判断に至っている。また、当該地域第 1号機となるシランキタン 1 号では、開発に十分な 50MW 相当の蒸気が確認済みであり、極めて低いリスクと費用での建設が可能であることが確認できた。 今後、スマトラ島の二酸化炭素排出係数算定を中心
とした CDM 化のための詳細調査を実施し、資源量評価と併せた事業性の検討を行いその魅力を定量化すれば、更なる本邦企業の積極的な関与が期待される。
LG タンク
発電所復水
操作盤
注入ポンプ
注入ポンプ
注入ユニット
巻取りドラム (巻取り時使用)
注入チューブ インコロイ825
リューブリケーター
先端ノズル
注水設備概要図
FX-233
主蒸気系統
タービン排気系統
循環水系統
スケール付着防止装置 系統
注水ノズル
ウォータインジェクションポンプ
循環水ポンプ
復水器
発電機蒸気タービン
カロリーメータフラッシュ蒸気クーラーへ
主蒸気加減弁
主塞止弁(副弁,ストレーナを含む)
タービングランドへ
電磁流量計
スケールセパレータ
生産井より
ストレーナ
スケール付着防止装置系統図
冷却塔へ
図5:スケール発生抑制設備
図6:タービン・ウォッシング装置
s-2
サルーラ地域サルーラ地域
メダン
ナモラアイランギ
シランキタン
東シバルブアリ
開発位置図
図8:サルーラ地域位置図
(50MW×2)
(65MW×3)
補充生産井本数(発電出力)の感度解析(減衰率5%,補充井蒸気量45t/h/本)
5,000
6,000
7,000
8,000
9,000
10,000
11,000
12,000
13,000
14,000
5.00% 7.00% 9.00% 11.00% 13.00% 15.00% 17.00%
割引率
NP
V(百
万円
)
補充井7本(定格維持)
補充井3本
補充井なし(成り行き)