pressure—swirl atomization of water-in …mae.eng.uci.edu/faculty/was/theme/pdfs/7.pdfatomization...
TRANSCRIPT

AtomizationandSprays, 20(12):1077–1099, 2010
PRESSURE—SWIRL ATOMIZATION OF WATER-IN-OILEMULSIONS
Christopher D. Bolszo, Adrian A. Narvaez, Vincent G. McDonell,∗Derek Dunn-Rankin, & William A. Sirignano
Department of Mechanical and Aerospace Engineering, University of California at Irvine, Irvine,California 92697-3550, USA
∗Address all correspondence to Vincent G. McDonell E-mail: [email protected]
Original Manuscript Submitted: 9/27/2010; Final Draft Received: 1/12/2011
The pressure–swirl atomization of surfactant stabilized and natural, unstable water-in-oil emulsion fuel injected into anambient environment is investigated experimentally. Fuel flow conditions are typical of large-scale gas turbine applica-tions. A specialized setup generates controlled emulsions stabilized by addition of surfactants. The emulsion generationprocess allows control over the discrete phase (water) droplet size distribution within the emulsions. The spray dropletsizes are measured using laser diffraction and the spray pattern is evaluated using imaging and mechanical patterna-tion. A statistically designed experimental test matrix was executed and the results were subjected to the analysis ofvariance. We find that emulsification can reduce or increase the average droplet size in the spray depending upon theadded amount of water fraction. The atomization process itself can change the size distribution of the discrete phasedepending upon the initial sizes present and the injector pressure differential. The fractions of oil and water phaseswere observed to vary with radial spray angle for the stabilized cases considered. For the conditions studied, the stabi-lized emulsions performed very similarly to natural unstable emulsions as long as the unstable emulsion was producedshortly prior to atomization (i.e., <1 sec) with sufficient shear as to result in a fine discrete phase droplet size. Overall,the results provide insight into how the emulsion properties influence their atomization. Findings show that injectionpressure and emulsion discrete water fraction affect the spray droplet size distribution most substantially, while the fineemulsion water droplet distributions play a less significant role. The composition of the emulsion spray appears to varyspatially and temporally when emulsions are coarse. Stabilized and naturally unstable emulsions demonstrate similarbreakup behavior during atomization.
KEY WORDS: diesel fuel, surfactant, drop size, drop distribution, spray angle, patternation
1. INTRODUCTION AND BACKGROUND
Water addition in combustion systems can be utilizedto lower combustion-generated pollutants (White et al.,1982), aid in the thermal management of hardware (Davy,1914), and increase system efficiency by increasing massthroughput of the working fluid. Water can control com-bustion temperatures via heat absorbed into the liq-uid water or steam. Oxides of nitrogen (NOx), due toa strong temperature dependency (i.e., via Zel’dovich
mechanism), can thereby be reduced (Turns, 2000). Thelower reaction temperature can also help reduce thermalstress and maintain the hardware’s structural integrity.Water injection can be accomplished with steam in a hu-midified air stream, as direct injection into the combus-tion zone utilizing a separate water circuit, or by com-bining liquid fuel and water upstream in a single circuitto form an emulsified fuel. Of these methods, the sec-ond approach has been commonly utilized as a strategy tomeet emissions regulations for liquid-fired stationary gas
1044–5110/10/$35.00 c© 2010 by Begell House, Inc. 1077

1078 Bolszoetal.
NOMENCLA TURE
ρ densityσ surfacetensionµ dynamic viscosityd droplet diameterdo fuel nozzle diametert liquid film thicknessCMC critical micelle concentrationDF2 low sulfur diesel fuel #2FN nozzle flow numberHLB hydrophilic–lipophilic balanceMMD mass median diameter (D50)ReN nozzle Reynolds number
SMD Sauter mean diameter (D32)∆P injector pressure differentialΦ water-to-diesel mass
fractionm injector mass flow rateβ spray angleθ spray half angle
SubscriptsA airL liquidW Water
turbines.In addition to thermal management, for fuel oilemulsions, the mixing of water within the fuel can utilizelow-grade and/or high-viscosity fuels; Orimulsions beinga prime example (Miller and Srivastava, 2000). The addi-tion of water produces a reduction in overall flow viscos-ity, enabling easier handling and pumping (Marcano andWilliams, 1991).
The benefits of water addition are offset by an in-creased expense per kilowatt and an increase in fuel con-sumption on the order of 2–3% (White et al., 1982). Awater and fuel emulsion system would principally requireminimal engine modifications compared with water injec-tion into the air manifold or direct injection into the com-bustor, which requires additional balance of plant, withincreasing system complexity and manufacturing costs.An additional advantage of emulsions is that at combus-tion temperatures water droplets within distillate fuel oilmight promote the phenomenon of “microexplosions,”where the water flash vaporizes within and before the fueldroplet after atomization causing additional (secondary)droplet breakup (Ivanov and Nefedov, 1962). A reviewarticle by Kadota and Yamasaki (2002) provides multiplestudies showing improvements in mixing within the com-bustion chamber, which can increase both the combus-tion and thermal efficiencies as well as lower the sootingpropensity. As a result, introduction of water into fuel asan emulsion has several apparent advantages to the morewidely used separate injection of water. A number of keyissues and questions arise relative to use of emulsions,however, and they are the focus of the present work.
The immiscibility of the thermodynamically unstableoil and water macroemulsions results in the separation ofthese components on the order of seconds for millimeter-
sized droplets and days to weeks for droplets approach-ing 1 µm. This poses a significant challenge in studyingthe hydrodynamic properties of emulsions. Macroemul-sions, which contain droplets larger than 1µm, are gen-erated quickly and with a modest expenditure of shear(experiencing a strain rate on the order of 102–103 s−1,which is typical of mechanical means (Becher, 1975). Alarge interfacial tension between the oil and water com-ponents creates the instability because water’s hydrogenbonds strongly attract each other in comparison with theweak London dispersion forces of the long hydrocarbonchains in oil. Once discrete water droplets are formed, themolecular forces within an emulsion oppose those main-taining the emulsion’s structure. The van der Waals forcesof like molecules attract neighboring molecules, initiatingthe coalescence of droplets and the separation of compo-nents. One way to reduce the interfacial tension and sig-nificantly enhance the emulsion stability is by the addi-tion of surface-stabilizing agents (surfactants) dissolvedwithin the component liquids. Surfactants reside at theliquid–liquid interface, lowering the interfacial free en-ergy associated with the formation of droplets and allow-ing the oil and water to reside next to each other in equi-librium. Concurrently, the lower interfacial tension en-hances the formation of smaller emulsion droplets witha narrower droplet size distribution with overall greaterkinetic stability (Burgess and Yoon, 1995). This can leadto a finer atomization of the emulsion during injection,modifying breakup and atomization properties comparedwith a natural unstable case (Lif and Holmberg, 2006).
Various methods have been documented in the lit-erature regarding emulsion formation. High strain ratespresent in the piping—including valves, strainers, and/or
Atomization and Sprays

Pressure–SwirlAtomizationof Water-in-Oil Emulsions 1079
bends in the flow—provide emulsification upstream ofatomizers. Dedicated inline mixers can also provide ad-ditional shear to drive the water globules/droplets to asmaller droplet size with a narrow size distribution. Thecurrent research incorporates a variable geometry andspeed rotor/stator mixing device that forces the water anddiesel fuel through small passages to create high shear in-teractions. Of course, the atomization process itself alsoprovides very high rates of shear for the emulsion. This at-omization process depends greatly on the type of injectionand on the fluid properties of the emulsion spray; theseare the two main factors studied in the current experimen-tal investigation. Liquid fuel injection is accomplished ingas turbines through several strategies. It is common touse high liquid velocity to achieve atomization throughuse of high-pressure drop devices such as plain-orifice orpressure-swirl atomizers. Alternatively, twin fluid atom-ization, where high-velocity air is used to aid the atom-ization process, is also commonly used. In current low-emission systems, some level of premixing between thefuel and air is common and both types of fuel injectionare used but with careful consideration of the interactionof the fuel with the overall air flow in the vicinity of thecombustor dome region. The current investigation focuseson the injection of fuel using a pressure-swirl atomizer.
A pressure-swirl simplex nozzle is used, which al-lows various representative droplet diameters such as theSauter mean diameter (SMD, orD32) and mass mediandiameter (MMD, orD0.5) to be applied in characterizingthe spray droplet size distribution. For example, Lefebvre(1989) formulated a SMD correlation for pressure-swirlsimplex nozzles defined as
SMD = Aσ0.25L µ0.25
L m0.25L ∆P−0.5
L ρ−0.25A (1)
whereσL is the fuel surface tension,µL is the fuel dy-namic viscosity,ρA is the air density,∆PL is the injectorpressure drop, andmL is the fuel mass flow rate. Wangand Lefebvre (1987) tried to further optimize the correla-tion by including the film thickness and spray cone anglein a two-term equation:
SMD = B
(σµ2
L
ρA∆P 2L
)0.25
(t cos θ)0.25
+ C
(σρL
ρA∆PL
)0.25
(t cos θ)0.75 (2)
wheret is thefilm thickness at the nozzle exit (Suyari andLefebvre, 1986) andθ is the spray cone half-angle. Theseexisting correlations can be compared with experimen-tal data to quantify the influence of fluid properties and
perhaps be modified to establish relationships betweenthe atomization characteristics of single-component andmulti-component fluids. Depending on the liquid ratio ofdiscrete water droplets to oil and surfactants, the size dis-tribution of the discrete water droplets, and the injectionpressure differential across the nozzle, a controlled water-in-diesel fuel emulsion spray can be produced and its per-formance can be measured and compared with its neatcomponents.
Prior discussions of how emulsion quality, oil–waterratio, or high nozzle discharge affect the major featuresof the pressure-swirl spray (e.g., overall size distribu-tion, spray angle, and pattern) are not covered extensivelyin the literature (Kadota and Yamasaki, 2002; Khavkin,2004). In addition, while previous studies have used sta-bilized emulsions, little discussion is provided regardinghow representative they are of natural unstabilized emul-sions (Butler Ellis et al., 1999). Finally, the impact of at-omization on the emulsion structure itself has not beenexamined thoroughly (Ford and Furmidge, 1967). Thepresent work provides such results for a high-capacitypressure simplex atomizer.
2. OBJECTIVES AND APPROACH
The objectives of the current study are:
1. Characterize the fluid properties of water-in-dieselfuel emulsions with varying water content, surfactantconcentrations, and different discrete droplet distri-butions of produced emulsions.
2. Quantify an emulsion “quality” by measuring thediscrete droplet diameter distributions within thediesel fuel.
3. Measure the resulting spray characteristics through ahigh-capacity pressure-swirl nozzle at different pres-sures, emulsion qualities, and oil-to-water ratios.
4. Use analysis of variance (ANOVA) to correlate theobserved spray behavior with the factors varied.
3. EXPERIMENT
3.1 Overall Facility
A test facility was developed to allow efficient productionand testing with the emulsions. A piping and instrumen-tation diagram of the generation and flow of the emulsionis provided in Fig. 1.
Volume 20, Number 12, 2010

1080 Bolszoetal.
FIG. 1: Pipingand instrumentation diagram of atomization test facility.
Fluid properties were measured to investigate and un-derstand various emulsion quality characteristics. An at-mospheric spray facility housed the injector and mea-sured spray properties using laser diffraction, high-speedvideo cinematography, and a spray half-patternator. Toachieve the ANOVA, a statistical, three-level factorialspray test matrix was developed that spanned the exper-imental space effectively. Finally, empirical models andgoverning theory were utilized to explain the atomiza-tion behavior of the water and diesel emulsions. Figure 2presents photographs of the flow system (in sequence) andatmospheric spray test rig used for the current study. Two208 L (55 gal.) holding tanks were used to store water anddiesel distillate fuel #2 (DF2) with their respective sur-factants prior to entering the emulsion generating device.Two peristaltic pumps with fluctuation dampers meteredthe flow into the emulsifier and onward to one of threeaccumulators where the emulsion was stored and thensubsequently pressurized to injection pressures by nit-rogen. The emulsion mass flow rate, temperature, and den-
FIG. 2: Photographsof the spray test facility and diag-nostic hardware. The steps in generation and flow of theemulsion are identified and are numbered sequentially.
sity were measured with an Emerson Elite Series Cori-olis flow meter and then atomized through the injec-tor.
Atomization and Sprays
Pressure–SwirlAtomizationof Water-in-Oil Emulsions 1081
The emulsifier (IKA Labor Pilot 2000/4, with the ad-ditional DR module), produces emulsions by rotating ro-tor blades within the stationary stator blades. The liquidsare sheared when they pass through or beneath the ro-tor and stator slots. A variety of emulsion qualities canbe made with different configurations of the rotor/statorblades. The motor of the device spins the rotor at speedsbetween 3160 and 7900 rpm (52.67 and 131.67 Hz) andcan generate standard maximum tip speeds of 9–26 m/swith associated strain rates between 33,600 and 92,600L/s. Therefore, a range of settings can generate differentqualities of emulsions.
3.2 Test Liquids
The individual liquids used to generate the emulsionswere (1) filtered tap water and (2) low sulfur DF2. Thesurfactants used were Sorbitan Monooleate (Span 80), anoil-soluble surfactant, and Sorbitan Trioleate (Tween 85),a water-soluble surfactant. A few of the measured fluidproperties of the four liquids in the study are shown inTable 1.
The hydrophilic–lipophilic balance (HLB value) influ-ences the type of emulsion that results. The two surfac-tants chosen in the study were mixed in proportions to
yield an overall HLB value of 5.97 (75% Span 80 and25% Tween 85), which produces a water-in-oil emulsion.Using 2 vol/% of surfactant in the emulsion, this HLBvalue for water and diesel fuel produces a stable emulsionfor at least 60 minutes (Song et al., 2000, 2002).
The emulsion fluid properties were also measured inthe laboratory with the following diagnostic tools: a grad-uated cylinder and electronic mass scale for density, afalling ball viscometer for viscosity, a stalagmometer forsurface tension, a force balance calculation of the Young–Laplace equation using the pendant drop method for inter-facial tension (Arashiro and Demarquette, 1999), and mi-croscopic visualization using a Nikon trifocal microscopein conjunction with a Canon Power Shot S60 5 megapixeldigital camera with image analysis software, Image-ProPlus v5.1, for the droplet size and number distributions.Each emulsion’s fluid properties measurements were con-ducted 3–5 times to assure repeatability.
3.3 Fuel Injector
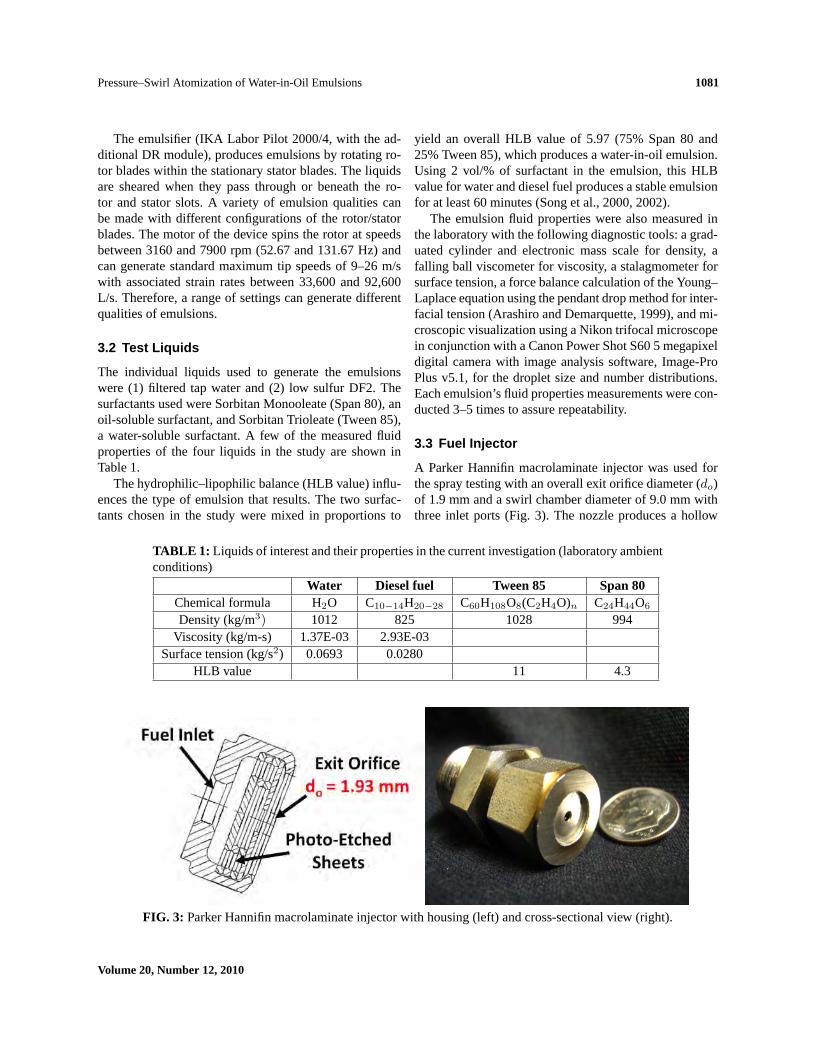
A Parker Hannifin macrolaminate injector was used forthe spray testing with an overall exit orifice diameter (do)of 1.9 mm and a swirl chamber diameter of 9.0 mm withthree inlet ports (Fig. 3). The nozzle produces a hollow
TABLE 1: Liquids of interest and their properties in the current investigation (laboratory ambientconditions)
Water Dieselfuel Tween85 Span80Chemicalformula H2O C10−14H20−28 C60H108O8(C2H4O)n C24H44O6
Density(kg/m3) 1012 825 1028 994Viscosity(kg/m-s) 1.37E-03 2.93E-03
Surfacetension (kg/s2) 0.0693 0.0280HLB value 11 4.3
FIG. 3: Parker Hannifin macrolaminate injector with housing (left) and cross-sectional view (right).
Volume 20, Number 12, 2010

1082 Bolszoetal.
cone spray downward into the test section (Fig. 4), wherethe necessary spray diagnostics are performed.
The effective flow area of a pressure atomizer can beusually described by its flow number, FN, which is ex-pressed as the ratio of the nozzle throughput to the squareroot of the fuel injection pressure differential and liquiddensity. The FN in square meters is defined as
FN =m
∆P 0.5ρ0.5L
(3)
Representingthe flow behavior non-dimensionally, thenozzle discharge coefficient (Cd) is also provided, whichis defined including the nozzle minimum area (A)
Cd =m
A√
2ρL∆P(4)
3.4 Spray Diagnostics
An Insitec real-time sizer (RTS) laser diffraction system,shown in Fig. 4, was used to conduct non-intrusive spraysize measurements. Alignment and calibration of the in-strument was checked for accuracy prior to testing witha calibration reticle. The system is able to obtain time-resolved representative diameters, the spray SMD andMMD being currently reported. The laser measurementarea (9-mm beam diameter) was positioned 3 cm belowthe nozzle exit; this position provided the strongest trans-mitted signal to the receiver for the wide-angle hollowcone spray. The reported results are averages of 60 testpoints acquired at a sample rate of one per second. In ad-dition, post-processing of the results corrected for low-light scattering due to the denseness of the spray, multiple
FIG. 4: Photographof emulsion spray during testing.
scattering of a wide spray, as well as beam steering causedby the presence of spray vapors.
High-speed video recorded the dynamics of the sprayand gave images for the measurement of the spray coneangle. A Vision Research Phantom v7.1 digital high-speed video camera was utilized at a sample rate of15,037 frames per second with a 2µs exposure.
To understand the distribution of the spray, a mechan-ical spray half-patternator was fabricated that capturessamples using a linear array of 21 sampling tubes (4 mL).Figure 5 shows the patternator installed in the rig; the in-strument is positioned 17 cm from the exit of the injectorand extends 21.7 cm from the center axis. During testing,the patternator was covered until the spray was steady.Once uncovered, the spray was sampled until the first tubereached a 4/5 fill, and the patternator was quickly cov-ered once again, completing the test. In the current effort,emulsion patternation results provide the composition ofeach fluid relative to each other at different spray angles,which is important when determining the distributions ofthe water and diesel fuel separately, in addition to provid-ing the overall spray pattern.
3.5 Quantification of Emulsion Quality
The prepared emulsions were sampled and analyzed toestablish their composition. Collected samples were di-luted 100 times with diesel fuel with its correspondingSpan 80 surfactant concentration to deter the coalescenceof water droplets and to reduce the optical density of thesample. This ensured appropriate visibility of isolated wa-ter droplets through the microscope’s planar focal field.Image-Pro Plus v5.1 was used to count water droplets and
FIG. 5: Sprayhalf-patternator installed in spray test rig.
Atomization and Sprays

Pressure–SwirlAtomizationof Water-in-Oil Emulsions 1083
measure their diameters utilizing a two-point method. Atleast 700 droplets were counted for each emulsion and testcase to ensure a statistically reliable representation of theoverall population of water droplets within the emulsion8 (Lemenand, et al., 2003). The distributions for the pre-atomized emulsions were used to classify the emulsionquality in terms of the discrete water droplet distributionstatistics used in the test matrix design.
3.6 Test Matrix
A three-level factorial design matrix was generated thatincluded 36 test cases including cases testing repeata-bility and those necessary for assessing covariance. Thematrix spanned the range of flow conditions at atmo-spheric pressure and included the information regard-ing the water mass fraction (Φ), injector pressure differ-ential, and emulsion quality. The emulsion quality wasranked with three categories prior to correlation modelconstruction: low shear, mid-shear, and high shear. Set-tings for the quality characteristic were chosen after astudy of the emulsions generated by the different config-urations of the IKA Labor Pilot. Table 2 summarizes thethree level matrix spray test factors with their respectiveranges.
The data recorded were analyzed statistically usingan ANOVA approach, where models were constructed tocapture the responses of the characteristics of the spray.The influences of each of these factors at experimen-tal conditions were quantified statistically, which helpeddetermine the parameters governing atomization perfor-mance and ultimately helped predict the effectiveness ofan emulsion spray by identifying the physical processesresponsible. The resultant influencing parameters are spe-cific to the high flow injection nozzle used in the cur-rent study. Non-dimensionalizing these spray parameterswill provide a fundamental physical understanding of thegoverning forces affecting the spray, internal injector ge-ometry, and system scalability. This topic is the focus offollow-up work, which will include additional data uti-lizing a pressure-swirl nozzle with a lower flow capac-ity.
TABLE 2: Experimental spray test factor rangesFactor Range
Injectorpressure[MPa (psi)] 0.69–3.10,(100–450)Watermass fraction (Φ) 0.230–0.375Emulsionquality (shear) Low, mid, high
4. RESULTS
The results consist of screening tests to establish the via-bility of using surfactant stabilized emulsions to represent“natural” unstable emulsions, tests to establish emulsionquality parameters, and the measured spray characteris-tics with their statistical analyses. In addition, the unsta-ble emulsion data are provided in the Appendix, the asso-ciated fluid properties for the component liquids and thenine emulsions evaluated are presented, and the emulsiongenerator settings used to prepare the emulsions are dis-cussed.
4.1 Emulsion Characteristics
4.1.1 Quantification of Emulsion Quality
Before the fluid properties were measured and spray mea-surements were taken, the three levels for the emul-sion quality factor were assigned. The levels were cho-sen based on the SMD of the discrete water droplets inthe DF2 (SMDW ), not to be confused with the spraySMD, and the number and volume water droplet distri-butions. Low, mid-, and high SMDW values were se-lected where the speed of the emulsion generator, the typeof rotor/stator configuration, and surfactant concentrationwere varied. From a comparison among 12 emulsionsgenerated forΦ = 0.23, the three levels chosen for theemulsion quality parameter were
1. Low→ 1 s, 52.7 Hz, 2 mass% surfactant;
2. Mid → 1 s, 92.2 Hz, 5 mass% surfactant; and
3. High→ 7 s, 131.7 Hz, 5 mass% surfactant;
where 1 s and 7 s represent the numbers of rotor statorstages of the unit, the frequency represents the rotor spin-ning frequency in hertz (Hz) and the overall mass percentof surfactant.
4.1.2 Emulsion Fluid Properties
The fluid viscosity, surface tension, and interfacial ten-sion, for each of the nine emulsions (three levels of emul-sion quality for each of the threeΦ’s) were measuredusing each specific measurement instrument and tech-nique. Figure 6 plots the dynamic viscosity values forthe nine generated emulsions as well as the values forthe component liquids using the falling ball viscome-ter method. Note, however, that this method is most ap-propriate for uniform Newtonian fluids; emulsions ex-hibit non-Newtonian characteristics that depend on thefraction of water present. The degree of departure from
Volume 20, Number 12, 2010

1084 Bolszoetal.
FIG. 6: Dynamicviscosity dependence on water content.
Newtonian behavior is of primary interest. Work by Cho(1979) has provided the necessary procedure modifica-tions to determine a representative viscosity using thefalling ball viscometer. Not considering the emulsion’snon-Newtonian behavior, the data coincide with the workof Antonov (1983), where the viscosity increases wellover 50% as water content reaches 40 mass/% and islarger than that of both DF2 and water. As the emulsionbecomes finer with increasing shear, the dynamic viscos-ity also increases, due to the increasing molecular inter-actions (van der Waals forces) among the discrete wa-ter droplets during flow. Using the discrete water dropletstatistics for the prepared emulsion the viscosity was cal-culated using the approaches of Pal (1998) and Krynkeand Sek (2004), and is also plotted in Fig. 6. Compar-ing the measurement and calculation highlights the de-parture from Newtonian character, which is actually quitemodest. The viscosity is over-predicted for the medium-and high-shear cases and under-predicted for the low-shear case. Interestingly, the medium-shear case presentsthe highest viscosity from the calculation. The discrepan-cies in viscosity can be explained by observing that themedium-shear droplet distribution contains both a largepopulation of very fine droplets, as well as a spectrum ofsequentially larger droplets, while the finest emulsion canbe considered monodisperse with a very narrow distribu-tion near 2µm. The wider distribution leads to a greaterresistance in flow for a closely packed population of wa-ter versus an even more closely packed distribution withdroplets of the same size. The use of surfactants from thelow-shear to mid/high-shear emulsion quality level, or theSMDW , will also contribute to the difference in viscositybetween the water–DF2 interfaces of the generated emul-sions, but its contribution to the overall viscosity was notmeasured.
The measured surface tension results using the dropletcount method derived from the droplet weight method ofHarkins and Brown (1919) are shown in Fig. 7. The sur-face tension for the nine emulsions remains close (0.26kg/s2) to neat DF2 (0.028 kg/s2) and does not changewith increasing water content up to 40%, with the changein discrete phase (water) droplet size or with the maxi-mum addition of surfactant (7%). This is consistent withthe findings of Ford and Furmidge (1967), and can be ex-plained by the presence of fine microscopic droplets re-siding just below the emulsion (oil phase) air interface,which does not substantially affect the surface tensionforce at the liquid surface, a macroscopic fluid property.From the laboratory testing, it was observed that a film ofthe continuous phase will continue to cover the discretephase of the emulsion upon exiting the nozzle, a liquid–liquid wetting. The slight decrease in surface tension forthe emulsions is due to the non-uniformity or thinning ofthe surface due to the presence of discrete water dropletsjust below the surface. Note, however, that for water thesurface tension is decreased substantially with the addi-tion of 3% Tween 85 surfactant (0.07–0.4 kg/s2). This iscaused by the decrease in hydrogen bond strength of thewater with addition of the much larger and less polar sur-factant molecule. Accounting for the viscosity and thisunvarying surface tension impacts the calculated SMDfrom the pressure simplex nozzle correlations [Eqs. (1)and (2)].
The interfacial tension, being a force measurement be-tween two liquids, was varied by the amount of surfac-tant used rather than by theΦ and emulsion quality. Theinterfacial tension effect of Span 80 and Tween 85 sur-factants for the two component liquids was measured for0, 1, 2, 3.5, and 5 mass/% (Fig. 8). Mixtures of the com-ponent fluids with their corresponding surfactants were
FIG. 7: Surface tension dependence on water content.
Atomization and Sprays

Pressure–SwirlAtomizationof Water-in-Oil Emulsions 1085
FIG. 8: Emulsioninterfacial tension dependency on sur-factant concentration.
made to produce a surfactant combination with a HLBvalue of 5.98. The results of the pendant drop measure-ments show a sharp decline in the interfacial tension withthe introduction of the surfactants, which was expected.The surfactants decrease the barrier-to-droplet breakup,which leads to smaller water droplets being producedfor the same amount of shear applied. The sharp declinein slope of interfacial tension from 0 to 1% is an indi-cator that the critical micelle concentration (CMC) hasbeen reached for a single droplet, which is in agreementwith the measurements between 0.1 and 0.45 (kg Span80)/(m3 solvent) from Bhattacharyya and Kelkar (1983)and Mikucki and Osseo-Asare (1986) using aromatic hy-drocarbon mixtures at 25◦C and from 0.54 to 2.7 (kgsurfactant)/(m3 solvent) at the interface of kerosene/waterto paraffin oil/water (Owusu and Qing-Hong, 1996). Thevariation in aromatics has a substantial linear propor-
tional on the solution CMC. In the current study, val-ues of surfactant to solvent vary from 19.9 to 50.1 (kgsurfactant)/(m3 solvent), resulting in the initial formationof micelles. However, due to the extremely large amountof new surface generated mainly during generation, andatomization, and high strain rates in the nozzle, these mi-celles are broken up and utilized at the surface to fur-ther abate separation (Butler Ellis et al., 1999). In addi-tion, stability promotes and provides sufficient time tocomplete the spray testing without much change in thequality of the emulsion. As more surfactants were mixed,the interfacial tension was lowered slightly and appearedto reach an asymptotic minimum value at concentrationslarger than 2%. This limit in the stability enhancement forthe surfactants agrees with the previous work of Song etal. (2000, 2002). Work by Butler Ellis et al. (1999) hasprovided evidence that very high strain fields, leading toa very rapid increase in interfacial area for an emulsion(such as in an atomizer), require greater amounts (exceed-ing 10%) of surfactant to provide resistance to separationand maintain stability.
A summary of the measured fluid properties are tabu-lated in Table 3. The color and shades within the Table 3correspond to the colors and shades in various graphs andfigures throughout the study. The viscosity and surfacetension values will be used to calculate droplet spray cor-relations for the atomization testing data.
4.1.3 Emulsion Droplet Distribution
This subsection analyzes the water droplet sizes and dis-tributions for the nine generated emulsions. An example
TABLE 3: Fluid property measurements
Fluid Density (kg/m3)Calculated viscosity(kg/m-s)
Surface tension(kg/s2)
HLB number
Φ = 0.00 DF2 820 0.0029 0.0280 —Φ = 0.00 DF2 surfactant 840 0.0039 0.0277 —
Φ = 0.23 low 849 0.0045 0.0265 5.98Φ = 0.23 mid 857 0.0055 0.0265 5.98Φ = 0.23 high 858 0.0065 0.0266 5.98Φ = 0.31 low 852 0.0052 0.0262 5.98Φ = 0.31 mid 878 0.0062 0.0262 5.98Φ = 0.31 high 875 0.0075 0.0260 5.98Φ = 0.38 low 878 0.0050 0.0266 5.98Φ = 0.38 mid 882 0.0062 0.0263 5.98Φ = 0.38 high 881 0.0070 0.0259 5.98Φ = 1.00 water 1010 0.0014 0.0693 —
Φ = 1.00 water surfactant 1010 0.0016 0.0403 —
Volume20, Number 12, 2010

1086 Bolszoetal.
of the number and volume droplet distributions for anemulsion withΦ = 0.31 is shown in Fig. 9. Similar dis-tributions in overall size were also seen atΦ = 0.23 and0.38 as well, with the absence of any very large droplets,in excess of 25µm.
From the distributions, the results vary as the liquidswere more intensely sheared. As the shear increased, therange of droplet sizes produced narrows, the distributionsare less skewed, and the number distributions becomeincreasingly monodisperse (between 0.5 and 5µm with
SMDW = 2.0). This is explained by the increased shear-ing at higher frequencies, resulting in droplets on the or-der of 1µm and agreeing with the typical limit in dropletsize for macro-emulsions (Becher, 1975). The SMDW forthe nine emulsions versus water content are provided inTable 4 with statistical distribution data.
Similar to the emulsion quality parameter determina-tion, the SMDW decreased with increasing shear and sur-factant concentrations. The water-to-DF2 mass fractionΦdoes not substantially influence the SMDW for the range
(a)
(b)
(c)
FIG. 9: Exampleof number and volume distribution for emulsions withΦ = 0.31 alongside corresponding micro-scopic images. (a) Low shear (2 s, 52.7 Hz, 2% surfactant), (b) mid shear (2 s, 92.2 Hz, 5% surfactant), and (c) highshear (7 s, 131.7 Hz, 5% surfactant).
Atomization and Sprays

Pressure–SwirlAtomizationof Water-in-Oil Emulsions 1087
TABLE 4: SMDW droplet statistics for generated emulsions
Φ ConfigurationPercentsurfactant(HLB = 6)
Speed(Hz)SMDW
(µm)Numberof drops
Averagediameter(µm)
Standarddeviationdiameter(µm)
Minimumdiameter(µm)
Maximumdiameter(µm)
0.232s 2 52.7 8.90 784 2.85 3.02 0.38 15.762s 5 92.2 3.17 738 1.86 0.96 0.56 6.797s 5 131.7 1.87 740 1.34 0.45 0.37 3.85
0.312s 2 52.7 9.76 745 3.79 3.60 0.57 17.302s 5 92.2 3.27 748 2.12 1.05 0.56 6.217s 5 131.7 1.99 715 1.44 0.49 0.56 3.37
0.382s 2 52.7 9.87 753 3.10 3.23 0.06 18.952s 5 92.2 3.30 752 2.24 1.02 0.56 6.217s 5 131.7 1.59 758 1.19 0.34 0.55 2.75
tested,consideringthe standard deviation of the distribu-tions. The obtained SMDW values were used to convertthe qualitative emulsion quality parameter into a quanti-tative basis. Based on the water-to-diesel fuel ratio andconfiguration of the emulsion generator, a SMDW valuewas assigned for each emulsion test point.
4.2 Atomization Results
4.2.1 Flow Capacity
The following three subsections present the results ob-tained from the atomization test matrix. Correlations werealso formulated using ANOVA to develop statistical mod-els that are able to predict each response or output as afunction of the three test factors: injector pressure dif-
ferential; emulsion water mass fraction,Φ; and emul-sion quality, or SMDW (in µm). The flow capacity of thepressure-swirl nozzle experiment is measured by the massflow rate and density of the flowing emulsion with themicro-motions flow meter. Measuring the pressure dropacross atomizer allows for the FN to be calculated. Themass flow rate dependence on injector pressure is graphedin Fig. 10a, where the incompressible Bernoulli square-root dependence between injection pressure differentialand mass flow rate is overlaid. ANOVA affirmed this de-pendence for both the stabilized emulsions as well as neatcomponent liquids, as correlated in Fig. 10b. The ANOVAresults [Eq. (4)] included the injection pressure differen-tial, ∆P , andΦ, where the pressure term dominates theoverall mass flow rate (at least 90%), which was expected.Here,Φ is included in the model to account for the emul-
(a) (b)
FIG. 10: Massflow rate versus injection pressure differential from (a) experimental test matrix and (b) from ANOVA.
Volume 20, Number 12, 2010

1088 Bolszoetal.
sion composition. As more water droplets are mixed withDF2, the density of the emulsion increases, increasing theratio of the mass to volume. The effect of SMDW on massflow rate, according to the ANOVA was not statisticallysignificant and was excluded in the formulated correla-tion. Note that the analysis was able to identify a changein mass flow rate (in kg/min) due to the varying amountof surfactant (from 2 to 5%) and was able to attribute thisto the change in emulsion density for adjustedR2 andpredictedR2 of 0.998 and 0.9978, respectively, for thecoefficients of determination.
m = 0.029133 + 1.55242∆P 0.5 + 0.1486Φ/1− Φ (5)
The correlation is statistical and not formulated using aphysical treatment (e.g., the mass flow rate should be zerowhen the pressure drop is zero), the correlation is there-fore only applicable within the range of the factors of thematrix space of∆P andΦ (refer to Table 2). However,the general form of the empirical expression is consistentwith expectations. TheR2 values are both close to unityand provide an adequate equation that represents the data(Fig. 10b).
Further analysis on the flow capacity was carried oututilizing the injector flow number, FN. In this case, anyspecial impacts of theΦ and/or dispersed water dropletsize become more apparent. The results are shown inFig. 11a, where the flow number (in m2) is plotted ver-sus mass flow rate. The ANOVA suggests that the FN canbe described as
FN = 9.58378E-007− 4.67584E-008∆P
+3.14914E-008Φ/1−Φ+8.14797E-009∆P2 (6)
The predicted versus actual plot is shown in Fig. 11b,where average adjusted and predicted correlation coeffi-cients of 0.7968 and 0.7768 were obtained. This best es-tablished agreement between the three factors is not ex-cellent. This reasonable correlation suggests again thatΦplays a role in the FN. This is due to the change in densityassociated with changingΦ. Similarly to the mass flowrate results, the SMDW was found not to be statisticallysignificant aside from the dependence on the surfactantconcentration between the low-shear, and mid- and high-shear cases. This result suggests that knowing the emul-sion discrete drop size distribution (for fine water-in-DF2)is not necessary to predict the flow capacity of the nozzle,affirming that distinctions between already fine emulsionsdo not play a significant role in flow through the pressure-swirl atomizer. Pressure plays a relatively weaker role[Eq. (3)] in the flow capacity, which is consistent by def-inition. As the pressure increases, the velocity increases,resulting in additional flow losses; hence, the main effectof pressure is a very modest reduction in flow capacity.The relatively reasonableR2 values and the appearanceof two pressure terms in Eq. (5) suggest an unexplainedphenomenon when attempting to identify the forces gov-erning flow capacity for an emulsion in comparison withNewtonian liquids.
Considering the effects of inertial and viscous forceson flow capacity, the nozzle Reynolds number (ReN =ρUdo/µ) was calculated, using the exit diameter (do) asthe characteristic length, as well as the emulsion density,viscosity, and flow velocity. The FN versusReN is plot-ted in Fig. 12. The plotted data show a trend that emergesin Fig. 12 when non-dimensionalizing the nozzle’s flow-ing forces. A change in flow behavior is identified be-
(a) (b)
FIG. 11: Flow number versus mass flow rate from (a) experimental test matrix and (b) ANOVA results.
Atomization and Sprays

Pressure–SwirlAtomizationof Water-in-Oil Emulsions 1089
FIG. 12: FN versusReN for test matrix data.
FIG. 13: Cd versusReN for test matrix data.
tween the neat liquid components (both with and with-out surfactant) and the stabilized emulsions. The varia-tion of Φ with Cd is discernable within a narrow rangeof ReN (almost constant). These data elucidate an effectof enhanced ability to flow with an increase inΦ. Plottedin a different manner using a completely dimensionlessform, the nozzleCd versusReN is provided in Fig. 13;this case presents the flow behavior with the fixed noz-zle pressure differential. Specifically, an increase in FNor Cd occurs when a fine water droplet distribution is in-troduced into DF2, increasing the viscosity and decreas-ing theReN for the current atomizer configuration. Waterpresents the opposite effect, resulting in an increased abil-ity to flow with increasingReN . Note that the two trendsmeet atReN = 10, 000, which is considered to be thevalue where fully developed turbulent flow is establishedin pipes and nozzles (Dimotakis, 1991). Figures 12 and13, therefore, provide evidence of the role of turbulencein affecting flow capacity of the pressure-swirl nozzle. It
is interesting to note that the flow rate increases with in-creased emulsion viscosity, illustrating the counteractivebreakup processes of (1) resisting the ability to flow and(2) improving the distribution of liquid at the nozzle exitand consequent breakup by increasing the swirl chamberfilm thickness (Khavkin, 2004). This is consistent withpast results with the flow of neat liquids through annu-lar orifice plates (Lefebvre, (1989). However, the flowdynamics within the swirl chamber appears to add fur-ther benefit and complexity in the liquid breakup. Furtherstudies of this phenomenon are surprisingly scarce in thespray literature.
Considering non-Newtonian effects when flowing anemulsion as well as irreversibilities, a fundamental com-parison between the emulsion mass flow rate andReN
should also be provided to evaluate the last major areaof forces resisting flow. This comparison is provided inFig. 14 for the stabilized emulsion cases. A one-to-onecorrespondence between mass flow rate and the ratio ofmomentum to viscous forces does not occur, which is ex-pected if a fluid deviates from non-Newtonian behavior,due to interfacial forces as well as the effects of frictionand irreversibilities in pipe flow. Figure 14 reveals a di-vergence in mass flow rate, which isolates the effect ofwater fraction on nozzle mass flow rate. Figure 14 alsoprovides a measure of departure from Newtonian flow be-havior in comparison with DF2 and water components.The addition of water can be used as a tailoring strategyto achieve the desired flow conditions, allowing the atom-ization performance and flow of fuel (rate of energy de-livery or heat release) to be decoupled. This increases thepossible range of turndown for the nozzle, allowing de-sired atomization conditions over a larger range of fuel
FIG. 14: Emulsionmass flow rate versusReN for testmatrix data.
Volume 20, Number 12, 2010

1090 Bolszoetal.
flow rates (energy flow rates of the carrier liquid; e.g.,DF2).
4.2.2 Atomization Characteristics
The spray testing data for the surfactant-stabilized emul-sions from the three-level factorial design matrix areshown versus injector mass flow rate in Figs. 15a and 15band versus injection pressure differential in Figs. 15c and15d. The plots show the same experimental data, however,the two pressure simplex correlations, Eqs. (1) and (2), areshown separately for clarity. As expected, both correla-tions predict that the SMD should decrease monotonicallywith increasing injector pressure drop due to higher ve-locities and centrifugal forces, generating greater shearingwithin the nozzle. The empirical coefficientsA, B, andCwere modified to provide the highest least-squares equa-tion fit (0.975 for the Wang and Lefebvre equation) for theliquid components. In the Fig. 15, these equations are alsoplotted for the emulsions with different water concentra-tions and levels of shear. The variation in SMD due tolarger water droplets or increased water content for emul-sions is captured primarily by an increase in emulsion vis-cosity. The Wang and Lefebvre correlation [Eq. (2)] pre-dicts lower SMD values, compared with Lefebvre’s corre-lation [Eq. (1)], and more closely matches the experimen-tal results. This was also expected due to the inclusionof two additional factors: spray angle and film thickness,which provide an overall better prediction of the swirlingand tangential forces.
The measured SMDs are also shown in Figs. 15a–15dwhere the component liquids have higher SMD valuesthan the emulsions, which contradicts what the correla-tions predict [an increase in viscosity and other liquidproperties should increase the spray SMD according toEqs. (1) and (2)]. The measured component liquids fol-low both correlations and the water spray produces largerdroplets than DF2 for a given pressure drop. The emul-sions also follow the correlation for the differentΦ values,where more water content produces larger drops; how-ever, the difference in the shear or dispersed water dropletsize does appear to substantially impact the spray SMD.Note that the overall size of the water droplets in the emul-sion are already fine, in the micro-emulsion range, wherethe water droplets range between 1 and 25µm for all ofthe cases. The addition of the water phase in the dieselwith surfactants has been shown to puncture the liquidfilm during breakup due to the interspersed droplets, moreeasily forming ligaments by isolating the oil and waterphases (Dombrowski and Fraser, 1954). It is believed that
the surfactants, which act as the interface between thesefluids, are ineffective due to the rapid change and devel-opment of the surface area during atomization. In otherwords, the effect of surfactant molecules is limited by thevery short time scales, which prevent their transport tonewly created surfaces (Leal-Calderon et al., 1998; But-ler Ellis et al., 1999). This implies that atomization ofsurfactant-containing emulsions may behave as unstableemulsions (without surfactants), resulting in similar spraycharacteristics. This implication is addressed toward theend of the subsection.
Applying ANOVA to the SMD results yields Eq. (7)(in µm). As projected, only the injector pressure drop andΦ were included in the model. The injector pressure dropdominates the overall SMD, accounting for 80–90% ofthe value. The coefficients for the model are also justi-fied, where increasing the injector pressure drop resultsin a lower droplet size, while adding more water to theemulsion enlarges it. It is seen that the type of shear doesnot affect the model results at greater than 5%, which isthe same conclusion obtained from the mass flow rate andFN results. The adjusted and predictedR2 values for thedesign are 0.941 and 0.929. The predicted versus actualSMD plot is provided in Fig. 15e:
SMD = 112.32264− 42.44659∆P
+13.43421Φ/(1−Φ)+7.15762∆P 2 (7)
The mass median diameter (MMD) versus mass flow rateand injection∆P is provided in Fig. 16 from the test ma-trix results. The overall trends are similar when compar-ing SMD and MMD; however, the median drop size de-creases more steadily compared with the SMD. Of inter-est is the further decreasing trend in MMD for the emul-sion cases at higher injection mass flow rates/pressures,providing further evidence that the atomization processproduces much finer droplets compared with the neatcomponent liquids, which converge at higher pressures(near 3.0 MPa).
4.2.3 Spray Cone Angle
Analysis was also conducted for the spray cone angle.Three high-speed snapshots for a mid-shear,Φ = 0.31emulsion at the three different injection pressures are de-picted in Fig. 17. The overall appearance of the spray isfairly similar to the spray visual density increasing as theinjection pressure increases. The light intensity was mod-ified to produce the same edge outline between the casesbecause with increasing mass efflux, the backlighting in-
Atomization and Sprays

Pressure–SwirlAtomizationof Water-in-Oil Emulsions 1091
(a) (b)
(c) (d)
(e)
FIG. 15: Sautermean diameter results. (a) SMD vs. mass flow rate with Lefebvre correlation, (b) SMD vs. mass flowrate with Wang and Lefebvre correlation, (c) SMD vs. pressure drop with Lefebvre correlation, (d) SMD vs. pressuredrop with Wang and Lefebvre correlation, and (e) predicted vs. actual from model.
tensity decreases due to the opaque composition of anemulsion.
The spray cone angles were measured using imagestaken from the high-speed cinemagraphic recordings.
Volume 20, Number 12, 2010

1092 Bolszoetal.
(a) (b)
FIG. 16: Massmedian diameter results. (a) MMD vs. mass flow rate and (b) MMD vs. injection pressure.
(b)
(a)
(c)
FIG. 17: Spraycone photographs for a mid-shear;Φ =0.28 emulsion for various pressures. (a) 0.689 MPa, (b)2.068 MPa, and (c) 3.103 MPa.
These images were imported into the Image-Pro soft-ware where a Sobel edge detection algorithm was applied.Time averages of 125 black and white exposures selectedat random were used to determine the spray cone angle atthe swirl nozzle exit. For the stabilized emulsion test ma-
trix cases, the full spray angle fluctuation was very small,not varying more than a few degrees, demonstrating a sta-ble spray cone during testing. Specifically, significant sur-face (Weber) breakup of the intact spray cone accountedfor the majority of local variation in spray angle, whichwas on the same order (of 1–3 degrees) of the ejectedfluid’s change in trajectory; in other words, the changein intact cone angle. An example of the Image-Pro pro-cess images for a low-shear,Φ = 0.23 emulsion is shownoverlaid in Fig. 18.
The spray angle results from the test matrix are shownfor the emulsions and component fuels in Fig. 19. The re-
FIG. 18: Exampleof processed images for a low-shear;Φ = 0.23 emulsion at various pressures.
Atomization and Sprays

Pressure–SwirlAtomizationof Water-in-Oil Emulsions 1093
(a) (b)
FIG. 19: Spraycone angle results. (a) Vs. mass flow rate and (b) predicted vs. actual from model.
sults in (Fig. 19a) indicate differences between the sprayangle for the emulsion spray and the single-componentsprays both with and without surfactants added.
The design of the experiment ANOVAs for the sprayangle is provided versus mass flow rate in Fig. 20. Themodel results identified that injection pressure andΦ hadstatistically significant roles in determining the spray an-gle with an adjustedR2 value of 0.922. Greater concen-trations of water result in a decrease of the spray angleat a given flow rate, invariant at low flow rates near 1.2kg/min and varying up about 7 degrees near 3 kg/min.From observation, the increasing cone angle with higherDF2 concentrations is due to the surface breakup of the
FIG. 20: ANOVA statistical model for spray angle versusmass flow rate.
liquid sheet, which results in a greater concentration ofspray droplets as the exiting liquid is sheared by the air.Due to the 60% lower surface tension and 20% decreasein density of DF2 in comparison with water (Table 1),the deceased surface forces allow ligaments and dropletsto be stripped from the surface with greater ease. Also,due to the composition of the emulsion, in which discretedroplets originate from beneath the liquid surface (the wa-ter droplets were immersed in DF2 upon atomization),liquid–liquid wetting occurs and water droplets, whichexit the vicinity of the spray cone, remain covered bythe continuous DF2 phase that surrounds the droplets andmaintains an emulsion as water-in-oil emulsion droplets.The presence of discrete droplets near the spray edgesalong with this wetting phenomenon appeared to furtherinhibit the production of fine DF2 droplets from the spraysurface during breakup. The addition of surfactant ap-peared to slightly decrease this surface breakup tendencywhen compared with the neat DF2 and neat water compo-nent cases; however, it is not definitively known whetherthis is due to a change in fluid properties (Table 3) or dueto the effect of the surfactant’s complex molecular struc-ture since the overall change in cone angle is quite small(∼1 degree). It is interesting that dramatic separation ofthe phases does not occur in either the stable or naturallyunstable emulsion cases.
4.2.4 Spray Patternation
Mechanical spray patternation was conducted for threeflow conditions spanning the test matrix conditions at a
Volume 20, Number 12, 2010

1094 Bolszoetal.
Φ = 0.28 and a mid-shear droplet distribution. The over-all volume flux of these stable cases is shown in Fig. 21.This overall distribution is typical of a hollow cone sprayas the volume distribution becomes concentrated towardthe center at higher injection pressures (Lefebvre, 1989).The retest near 0.75 MPa demonstrates good repeatability.The emulsions were very stable and uniform during test-ing, and were absent of any fluctuating character duringatomization.
For the spray patternation results, the localΦ is plottedin Fig. 22. For each of the cases, the localΦ varies withlower values toward the spray center line and increases atwider spray angles. This trend is present in all of the spraypressures considered for an overallΦ = 0.31. The low-est and widest angles were ignored due to the low amountof liquid collected in the innermost and outermost sam-
FIG. 21: Spraypattern results for a mid-shear;Φ = 0.28emulsion at various pressures.
FIG. 22: Exampleof the local change inΦ versus emul-sion spray cone half-angle for a mid-shear,Φ = 0.275emulsion at various pressures.
ple tubes. A linear trend line was overlaid to emphasizethe behavior of the localΦ for the three atomization pres-sures. Good repeatability was demonstrated near the low-est atomization pressure test point. It was reasoned thatthe local differences inΦ is due to the difference in radialmomentum of the water and DF2, as they have almost a20% difference in density and demonstrate different be-havior upon breakup. The DF2 sheet behaves much likea typical liquid that is sheared, deforming, and formingligaments and eventually droplets, whereas the discretewater droplets are already of very small physical size—typically, between 1 and 10µm—and do not demonstratesubstantial deformation and further breakup and followmore of a path trajectory upon exit from the nozzle. Thetrends show a dependence of atomization pressure on de-terminingΦ when considering their slopes.
4.3 Post-Atomized Emulsion DropletDistribution
Comparing the discrete water droplet distribution pre- andpost-atomization reveals that the atomization process fur-ther decreases the distribution breadth within the emul-sion. This is shown for the mid-shear case in Fig. 23,comparing the pre-atomized emulsion after preparationfrom Fig. 9 in Fig. 23a and the three atomization pres-sures of interest from the test matrix in the post atom-ization cases in Figs. 23b–23d. At the lowest atomiza-tion pressure of 0.77 MPa, the flow through the systemand through the atomizer nozzle does not significantlymodify the water droplet distribution. At the highest at-omization pressure of 3.16 MPa in Fig. 23d, the shear-ing within the system and atomization nozzle producesa very similar droplet distribution to the pre-atomizedemulsion produced at very high shear with the emulsiongenerator (shown in Fig. 9c). The pre- and post-discretedroplet distribution SMDW and associated statistics areprovided in Table 5 for the cases used in the emulsion ex-perimental test matrix. Comparing the various cases, thisfurther shearing in the atomizer is observed for each ofthe water fraction cases with increasing injection pres-sures. The water droplet statistics are plotted versus injec-tion mass flow rate in Fig. 24. A zero injection pressurerepresents the pre-atomized cases. The change in SMDW
is shown in Fig. 24, with the low-shear cases experienc-ing the largest further decrease in SMDW during atom-ization, while the mid- and high-shear cases experiencemuch less change and almost no change in water SMDW .The ANOVA results are also provided considering onlythe post-atomized test matrix cases. The fairly lowR2 of
Atomization and Sprays

Pressure–SwirlAtomizationof Water-in-Oil Emulsions 1095
(a) (b)
(c) (d)
FIG. 23: Numberand volume distributions for a mid-shear;Φ = 0.31 emulsion (a) before and (b)–(d) after atomiza-tion at various injection pressures. (d) 0.77 MPa, (c) 2.04 MPa, and (d) 3.16 MPa.
0.6735 and 0.5911 are represented by the overall devia-tion in the distributions, which is on the same order asthe decrease in SMDW with increase in injection pressure(refer to Table 5). The regression analysis provided thestatistical correlation equation shown below, which wasa function of the pre-atomized SMDW and the injectionpressure:
SMDW,Post = 1.76199−0.36527∆P +0.59264SMDW
− 0.038678 (8)
Allowing the components ample time to settle and sep-arate under gravity (consisting of a week for the lowest-pressure case and over four weeks for the highest-pressurecase), the water and DF2 component volumes were ableto be distinguished. Due to the presence of surfactant inthe emulsion, water droplets do not fully coalesce backinto a continuous liquid phase, but are stacked/packed
at the bottom of the sampling tubes. The packing con-centrations of these emulsions were quite high (0.87 tovery near unity) based on the water droplet distributionstatistics post-atomization (Ouchiyama and Tanaka, 1980,1981, 1984). The height measurement of the sample tubesand the calculation of the volume of each liquid allowedthe localΦ to be calculated for each tube of the spray (see,also, Figs. 25 and 26).
5. CONCLUSIONS
The principal conclusions drawn from this work include:
• Pressure-swirl atomization of a fine water-in-dieselfuel emulsion results in a measured decrease in spraySMD when comparing it to neat diesel fuel. The re-sultant trend in spray SMD has a strong dependence
Volume 20, Number 12, 2010

1096 Bolszoetal.
TABLE 5: Pre- and post-atomized water droplet SMD analysis
Φ Shear Dropletnumber
SMDW pre-atomization(µm)
Standarddeviation(µm)
ΦInjectionpressure(MPa)
Dropletnumber
SMDW pre-atomization(µm)
Standarddeviation(µm)
0.23
52.7Hz (low) 748 8.90 3.020.264 0.67 1318 4.59 1.500.259 1.86 1411 2.96 0.900.251 3.11 935 2.93 0.89
92.2Hz (mid) 738 3.17 0.960.192 0.71 1026 3.04 0.970.198 1.95 722 2.17 0.640.203 3.13 724 2.38 0.69
131.7Hz (high) 740 1.87 0.450.249 0.71 828 2.82 0.740.249 1.85 923 2.02 0.440.254 3.15 961 1.66 0.41
0.31
52.7Hz (low) 745 9.76 3.60.346 0.69 806 2.92 0.890.294 2.06 904 3.25 0.960.296 3.13 934 2.22 0.57
92.2Hz (mid) 748 3.27 1.050.297 0.77 935 3.61 1.120.305 2.04 946 2.80 0.840.292 3.16 976 2.03 0.54
131.7Hz (high) 737 1.99 0.540.320 0.70 701 2.31 0.680.327 1.99 725 1.60 0.350.326 3.21 726 1.83 0.41
0.38
52.7Hz (low) 753 9.87 3.230.448 0.73 1003 3.75 1.170.461 1.95 1035 3.05 0.910.459 2.88 1036 2.91 0.85
92.2Hz (mid) 752 3.30 1.020.426 0.67 748 3.12 0.950.431 1.95 719 2.20 0.630.432 3.02 713 1.94 0.51
131.7Hz (high) 758 1.59 0.340.436 0.72 715 1.94 0.430.439 1.90 722 1.98 0.480.443 3.07 915 1.90 0.41
(a) (b)
FIG. 24: Dispersedwater droplet size results after atomization. (a) Vs. injection mass flow rate and (b) predicted vs.actual from model.
Atomization and Sprays

Pressure–SwirlAtomizationof Water-in-Oil Emulsions 1097
FIG. 25: SMD versusΦ for two unstable test configura-tions.
FIG. 26: SMD comparison between the two unstable testconfigurations and the surfactant-stabilized emulsions.
on injection pressure andΦ, and a very weak depen-dence on the discrete water droplet distribution forthe fine distributions in the test matrix cases.
• Comparison between the stable and naturally unsta-ble emulsion cases demonstrates very similar trendsin measured spray SMD withΦ, which was consis-tent at the three injection pressures of interest (0.69,2.0, and 3.1 MPa). AΦ value of 0.38 produces thegreatest benefit to decreasing emulsion spray SMD.The overall discrete droplet distribution is an impor-tant influence on the spray SMD for more coarse dis-crete emulsion compositions in the unstable cases.These results overall demonstrate conditions wherethe atomization process of stable and unstable emul-sions is similar.
• The process of atomizing a stable emulsion de-creases the emulsion spray’s discrete water dropletdistribution to be centered in the small SMD range.This decrease is due to the effect of shearing withinthe geometry and at the exit orifice of the pressure-swirl nozzle.
• There appears to be a nozzle Reynolds number de-pendence on the flow capacity of the nozzle; specifi-cally, as water droplets are introduced in the form ofan emulsion, the viscosity of the emulsion increases,decreasing the Reynolds number, yet the FN signifi-cantly increases. This may be an effect due to turbu-lence within the nozzle.
• From spray patternation results, the localΦ is depen-dent on flow conditions and varies with spray angle.Lower water fractions remain closer to the spray cen-terline, while larger water fractions move to widerspray angles. This is consistent with behavior basedon the relative densities of the two liquids and thecentrifugal force imparted by the swirl atomizationprocess.
ACKNOWLEDGMENTS
The research at the University of California at Irvinewas supported by Siemens Power Generation. The au-thors would like to acknowledge Professor Peter Ta-borek, Soulak Abbilian, Adam Jepsen, and Dr. JustinBurton for assistance with the interfacial tension eval-uation algorithm, conducting measurements, and manyinsightful discussions; Richard Hack for technical guid-ance with the atomization setup; and Guillermo Gomezfor his assistance in analysis of emulsion droplet distribu-tions.
REFERENCES
Antonov, V. N., Features of preparation of water–fuel emulsionsfor diesel engines,Chem. Technol. Fuels Oils, vol. 19, pp.606–609, 1983.
Arashiro, E. Y. and Demarquette, N. R., Use of the pendant dropmethod to measure interfacial tension,Mater. Res., vol. 2, pp.23–32, 1999.
Becher, P., ed.,Encyclopedia of Emulsion Technology, NewYork: Dekker, 1975.
Bhattacharyya, D. N. and Kelkar, R. Y., Critical micelle concen-tration of some sorbitan fatty acid esters—Effects of solvents,
Volume 20, Number 12, 2010

1098 Bolszoetal.
J. Colloid Interface Sci., vol. 92, pp. 260–261, 1983.
Burgess, D. J. and Yoon, J. K., Influences of interfacial proper-ties on perfluorocarbon/aqueous emulsion stability,ColloidsSurf., vol. 4, pp. 297–308, 1995.
Butler Ellis, M. C., Tuck, C. R., and Miller, P. C. H., Diluteemulsions and their effect on the breakup of the liquid sheetproduced by flat-fan spray nozzles,Atomization Sprays, vol.9, pp. 385–397, 1999.
Cho, Y. I., The study of non-Newtonian flows in the fallingball viscometer, Ph.D. thesis, University of Illinois, Chicago,1979.
Davy, N.,The Gas Turbine, New York: Constable & Company,pp. 206–210, 1914.
Dimotakis, P. E.,High Speed Flight Propulsion Systems, vol.137, chap. 5, pp. 265–340, 1991.
Dombrowski, N. and Fraser, R. P., A photographic investigationinto the disintegration of liquid sheets,Philos. Trans. R. Soc.London, Ser. A, vol. 247, pp. 101–130, 1954.
Ford, R. E. and Furmidge, C. G. L., Physico-chemical studieson Agricultural sprays VIII—Viscosity and spray drop sizeof water-in-oil emulsions,J. Sci. Food Agric., vol. 18, no. 9,pp. 419–428, 1967.
Harkins, W. D. and Brown, F. E., The determination of sur-face tension (free surface energy), and the weight of fallingdrops: the surface tension of water and benzene by the capil-lary height method,J. Am. Chem. Soc., vol. 41, pp. 499–519,1919.
Ivanov, V. M. and Nefedov, P. I., Experimental investigation onthe combustion process of natural and emulsified liquid fuels,NASA Report 65N14944, 1962.
Kadota, T. and Yamasaki, H., Recent advances in the combus-tion of water fuel emulsions,Prog. Energy Combust. Sci., vol.28, pp. 385–404, 2002.
Khavkin, Y. I.,Theory and Practice of Swirl Atomizers, 2nd ed.,New York: Taylor & Francis, 2004.
Krynke, K. K. and Sek, J. P., Predicting viscosity of emulsion inthe broad range of inner phase concentrations,Colloids Surf.,A, vol. 245, pp. 81–92, 2004.
Leal-Calderon, F., Bibette, J., and Guimberteau, F., Method forpreparing concentrated and calibrated emulsions in a highlyviscous phase, in particular bitumen emulsions,US Patent6602917, 1998.
Lefebvre, A. H.,Atomization and Sprays, New York: Hemi-sphere, vol. 140, chap. 8, p. 7, 1989.
Lemenand, T., Della Valle, D., Zellouf, Y., and Peerhossaini, H.,Droplets formation in turbulent mixing of two immiscible flu-ids in a new type of static mixer,Int. J. Multiphase Flow,vol.23, pp. 813–840, 2003.
Lif, A. and Holmberg, K., Water-in-diesel emulsions and relatedsystems,Adv. Colloid Interface Sci., vol. 123-126, pp. 231–239, 2006.
Marcano, N. and Williams, A., Characterization of sprays ofbitumen-in-water emulsions,Proc. of 5th International Con-ference on Liquid Atomization and Spray Systems, Gaithers-burg, MD, July 15–18, 1991.
Mikucki, B. A. and Osseo-Asare, K., The liquid surfactant mem-brane process: Effect of the emulsifier type on copper extrac-tion by LIX65N-LIX63 mixtures,Hydrometallurgy, vol. 16,pp. 209–229, 1986.
Miller, C. A. and Srivastava, R. K., The combustion of Orimul-sion and its generation of air pollution,Prog. Energy Com-bust. Sci., vol. 26, no. 2, pp. 131–160, 2000.
Ouchiyama, N. and Tanaka, T., Estimation of the average num-ber of contacts between randomly mixed solid particles,Ind.Eng. Chem. Fundam., vol. 19, pp. 338–340, 1980.
Ouchiyama, N. and Tanaka, T., Porosity of solid particles havinga range of sizes,Ind. Eng. Chem. Fundam., vol. 20, pp. 66–71, 1981.
Ouchiyama, N. and Tanaka, T., Porosity estimation for randompacking of spherical particles,Ind. Eng. Chem. Fundam., vol.23, pp. 490–493, 1984.
Owusu, R. K. and Qing-Hong, Z., Interfacial parameters for se-lected Spans and Tweens at the hydrocarbon–water interface,Food Hydrocolloids, vol. 10, pp. 27–30, 1996.
Pal, R., A novel method to correlate emulsion viscosity data,Colloids Surf., A, vol. 137, pp. 275–286, 1998.
Song, M. G., Jho, S. H., Kim, J. Y., and Kim, J. D., Rapid eval-uation of water-in-oil (W/O) emulsion stability by turbidityratio measurements,J. Colloid Interface Sci., vol. 230, pp.213–215, 2000.
Song, M., Cho, S., Kim, J., and Kim, J., Novel evaluationmethod for the water-in-oil (W/O) emulsion stability by tur-bidity ratio measurements,Korean J. Chem. Eng., vol. 19, no.3, pp. 425–430, 2002.
Suyari, M. and Lefebvre, A. H., Film thickness measurementsin a simplex swirl atomizer,AIAA J. Propul., vol. 2, no. 6, pp.528–533, 1986.
Turns, S. R.,An Introduction to Combustion,New York:McGraw-Hill, 2000.
Wang X. F. and Lefebvre, A. H., Mean drop sizes frompressure-swirl nozzles,J. Propul. Power, vol. 3, pp. 11–18,1987.
White, D. J., Batakis, A., Le Cren, R. T., and Yacabucci, H. G.,Low NOx combustion systems for burning heavy residual fu-els and high fuel-bound nitrogen fuels,J. Eng. Gas TurbinesPower, vol. 104, pp. 377–385, 1982.
Atomization and Sprays

Pressure–SwirlAtomizationof Water-in-Oil Emulsions 1099
APPENDIX
Stabilized Versus Surfactant Free Emulsions
A preliminary test was performed using special hardwareto produce natural surfactant-free (unstable) emulsions. AT-junction, which introduces the water and DF2 togetherand a low-pressure drop static mesh screen, which fur-ther shears the two fluids, were tested in the atomizationtest setup to observe and measure the spray SMD. NeatDF2 was flowed first and the SMD was measured. Thewater flow was turned on and the laser diffraction sys-tem continued to measure the SMD with increasing watercontent. Figure 25 shows the spray SMD results for bothemulsions made with solely the T-junction, and emul-sions made with both the T-junction and mesh screen atan injector pressure differential of 1.71 MPa. The pres-sure drop across the mesh screen was less than 0.01 MPa,which is very low compared with the nozzle pressure dif-ferential, for the duration of the testing.
For the T-junction and screen filter configuration, aswater in mixed with DF2, the measured SMD decreasednearΦ = 0.13 and slowly increases up toΦ = 0.375;however,Φ below 0.29 resulted in droplets lower thanthose for neat DF2. This finding is important because therange ofΦ ratios is within the lower SMD range for theexperimental test matrix (fromΦ = 0.23 to 0.38). Forthe configuration of just the T-junction, the SMD resultswere slightly higher, which can be attributed to the coarse-ness of the emulsion compared with the case in which thescreen filter was used (a difference of 8–14µm)—note,also, the standard deviation of the data shown by the barsfor the two cases. The unstable cases have a considerablespread of spray droplets varying temporally over the sam-pling period, with the T-junction-only configuration hav-ing an even larger deviation. The difference in SMD indi-cates the role of the screen filter, which further shears theemulsion, producing a finer droplet distribution, resultingin the decrease in the deviation observed. A further com-parison with the surfactant-stabilized SMD results is nextexplained.
The measured surfactant-stabilized emulsion SMDvalues were compared with the unstable emulsions resultsusing the T-junction and mesh configurations to assessthe validity of the experimental procedure and show thatthe spray behavior of surfactant-stabilized emulsions issimilar to the unstable emulsions. Figure 26 includes
the surfactant-stabilized emulsion droplet sizes for an in-jector pressure drop between 1.5 and 2 MPa. The emul-sions made without surfactant in the T-junction and screenfilter resulted in droplets lower than neat DF2 within therange of theΦ of study. Note that the mean injection pres-sures between the stable and unstable cases differ by 0.24MPa. This difference is due to separate injection proce-dures between the stable and unstable injection test con-figurations. This decrease in SMD with increasing wa-ter fraction is also consistent with the behavior observedfor the surfactant-stabilized emulsions, as in the unstableemulsion case in Fig. 25, and also reinforces the con-clusion (recalling that the stabilized emulsions maintaina fine discrete water droplet distribution) that the initialemulsion droplet sizes are important in defining atomiza-tion regimes. A “critical” mass percent (Φ) and size dis-tribution exist for the high flow pressure-swirl nozzle be-low which emulsification will enhance atomization, butabove which additional benefit in atomization may onlybe marginal (Φ≥ 0.30) and will be a disadvantage (Φ >0.4 to 0.45). Note that the SMD for DF2 (Φ = 0) issmaller than that of water (Φ = 1) at the injection pres-sures considered. Therefore, it is expected, considering amixture of water and DF2, that the SMD would furtherincrease with higher concentrations of water, which is in-correct. The difference between the surfactant-stabilizedand unstable emulsion spray SMD can be attributed inpart to the 0.276 MPa difference in injection pressure,different injection flow geometry leading to different dis-crete water droplet distributions (the unstable appears tobe coarser), and the modification to the fluid and atomiza-tion properties due to the use of the surfactants (Tween 85and Span 80).
The standard deviation among the three cases inFig. 26 also shows a substantial difference, highlightingthe effect of the water droplet size distribution on theatomization. The data from the stabilized emulsion caseshowed a very narrow water droplet size distribution aswell as a consistently stable spray SMD. For both ofthe unstable cases, the standard deviation is considerablylarger and is largest for the case without the screen filter.For the unstable case without a mesh, the spray demon-strated spatial non-uniformity with temporal pulsationsand atomization of only DF2 or water components inter-mittently at normal intervals. This was further apparent bya change in spray cone angle with time as the componentsexit the nozzle.
Volume 20, Number 12, 2010