pressure, temperature, and density …home.wlu.edu/~kuehnerj/cv/jpc1998.pdf · · 2000-09-26along...
TRANSCRIPT
PRESSURE, TEMPERATURE, AND DENSITY MEASUREMENTS USING HIGH-RESOLUTION N2 CARS
M. A. Woodmansee,* J. P. Kuehner,* R. P. Lucht,† and J. C. Dutton‡
Department of Mechanical and Industrial Engineering University of Illinois at Urbana-Champaign
1206 West Green St., Urbana, IL 61801
* Graduate Research Assistant. Student Member AIAA. † Professor. Senior Member AIAA. ‡ W. Grafton and Lillian B. Wilkins Professor. Associate Fellow AIAA.
ABSTRACT Mean pressure, temperature, and density
measurements have been made in a gas cell and along the centerline of an underexpanded jet using high-resolution N2 CARS. This method takes advantage of the line-broadening effects and population shifts of the rotational structure in the nitrogen ( υ = →0 1) Q-branch which are pressure- and temperature-sensitive. Experimental CARS spectra were acquired with high spectral resolution, ∆ω = − −016 018 1. . cm . Theoretical spectra, created by a N2 spectral modeling program, were fit to the experimental spectra in a least-squares manner. Temperature and pressure were determined as adjustable parameters in the least-squares fit and density was then determined through an equation-of-state. For gas cell pressures between 1 and 5 atm, the pressure values extracted from the CARS spectra exhibited an approximately 0.15 atm bias above the transducer pressures, probably because of Raman saturation effects. However, in the underexpanded jet measurements, our Stokes laser power was lower and agreement between measured and predicted pressures and temperatures along the jet centerline was excellent. The potential of performing pressure and temperature measurements on single laser shots was also examined.
INTRODUCTION The importance of knowledge of the pressure and
temperature fields of high-speed jets and wakes has been emphasized in recent research efforts, such as the development of the High-Speed Civil Transport1 (HSCT). Currently, there is great concern over the environmental effects of the combustion pressure and temperature fields associated with a low-orbit vehicle such as the HSCT. Likewise, the pressure and temperature fields associated with other practical devices such as supersonic missiles, chemical lasers, and supersonic combustors are of great interest to both design engineers and computational personnel, who rely on experimental data for predicting the
performance of proposed designs or benchmarking computational flow models.
Currently, in the design process, the aerodynamicist is generally forced to rely on probe-based measurements or computational simulations for this thermodynamic flowfield information. However, probe-based measurements may alter the flowfield. Likewise, while great strides have been made in computational methods in recent years, major discrepancies still exist between experimental and computational results for flowfields of this type.2 Hence, today’s laser-based diagnostic methods, such as laser Doppler velocimetry (LDV), planar laser-induced fluorescence (PLIF), and coherent anti-Stokes Raman scattering (CARS), are preferred experimental techniques due to their excellent spatial resolution and non-intrusive measurement capabilities.
Over the past 25 years, CARS has been used to measure temperature and/or species concentration in hostile environments such as jet engine exhausts,3 natural gas and coal dust flames,4 simulated coal-fired magnetohydrodynamic (MHD) exhaust streams,5 natural gas-injected engines,6 and diesel engines.7 With the advent of solid-state injection-seeded lasers, unintensified charge-coupled device (CCD) cameras, and proven CARS species modeling programs, the CARS technique can now be applied to high-speed, non-combusting flows, for which sub-atmospheric pressures and temperatures cause fine yet detectable changes in the nitrogen CARS spectrum. This paper describes an innovative high-resolution N2 CARS technique that utilizes the pressure- and temperature-sensitivity of the rotational structure of the nitrogen vibrational ( υ = →0 1 ) Q-branch to obtain accurate pressure and temperature measurements in high-speed flowfields.
As a precursor to the current work, Foglesong et al.8 used a dual-pump CARS technique to measure the mean and fluctuating components of pressure, temperature, and density in a gas chamber and along the
Copyright 1998 by the American Institute of Aeronautics and Astronautics, Inc. All rights reserved.

2
centerline of an underexpanded jet. The technique provided accurate and repeatable results for P>1 atm and T=150-300 K. Unfortunately, the rotational and vibrational N2 line structure displayed limited pressure sensitivity for P<1 atm. This insensitivity at low pressure severely limits the regions in which measurements can be made in many common supersonic wind tunnel facilities.
Farrow et al.9 used a scanning10 high-resolution N2 CARS technique to acquire temperature profiles and pressure measurements near the wound filament of a nitrogen-filled tungsten lamp. By resolving the fine rotational structure (∆ω ≈ 0.1 cm-1) of the υ = →0 1 and υ = →1 2 N2 Q-branch, the high temperatures (1000-2000 K) and pressures (5.4 atm) found near the filament were measured to within ±5 % of optical pyrometer and Baratron gauge measurements, respectively. The computer program, CARSFIT,11 which will be discussed later, was used to extract pressure and temperature from the experimental CARS spectra.
Grisch et al.12 and Péalat and Lefebvre13 used dual-line CARS (DLCARS) to measure rotational temperature and gas density in low-pressure flows. In addition to a pump beam, dual-line CARS employs two narrowband dye lasers tuned to two rotational lines in the N2 bandhead, forming two distinct CARS signals. CARS measurements were made in a test section and a reference cell. Pressure and temperature were obtained by comparing the relative intensity of these four CARS signals. It was assumed that the signals were exclusively Doppler broadened, which is true for P<<0.1 atm, and that the relative signal strength followed Boltzmann distribution theory. Unfortunately, this technique is limited to low-pressure (e.g., hypersonic) flows where the mean free path between molecules is large. In addition, the creation and monitoring of four CARS signals require an extensive array of laser diagnostic equipment.
While typically used for temperature or species concentration measurements, laser-induced fluorescence (LIF) has been modified for the simultaneous measurement of pressure, temperature, and/or velocity using the rotational lines of NO14, OH15, and I2 .16,17 Hiller and Hanson16 used planar laser-induced fluorescence (PLIF), expanding the LIF technique to two spatial dimensions. In short, these LIF/PLIF experiments employ a rapid-tuning argon-ion ring dye laser to scan two rotational transitions of the seed molecule in both a reference cell and a test section. The Doppler shift of the signal from the test section is used to resolve velocity. The intensity ratio of the two rotational lines is used to obtain temperature. Finally, pressure is extracted by fitting a collisional linewidth
model to the experimental LIF spectrum. Unfortunately, the signal-to-noise ratio (SNR) of the LIF/PLIF techniques is low; because these are incoherent18 techniques, interference scattering from the flow significantly reduces the strength of the fluorescence signal. Moreover, scanning of the rotational transitions to obtain the fluorescence spectra prevents instantaneous measurements from being obtained.
Two other non-intrusive techniques for measuring pressure, temperature, and velocity are filtered Rayleigh scattering19,20 (FRS) and Raman Doppler velocimetry21 (RDV) [often referred to as inverse Raman spectroscopy18 (IRS)]. For FRS, the output of a high-power, narrow-linewidth, tunable laser is spread into a sheet. As the laser is tuned, Rayleigh scattering from molecules in the gaseous flow is captured on a CCD array. By incrementally tuning the laser and acquiring scattering images, a spectral profile of the signal is obtained. Pressure, temperature, and velocity are resolved by least-squares fitting a Rayleigh-Brillouin-based theoretical model19 to the experimental scattering profile. Like the aforementioned PLIF technique, the background scattering and spatial variations in the laser sheet significantly reduce the SNR of the technique. Alternatively, Raman Doppler velocimetry21 employs a tunable pump laser and a probe laser in a pointwise, non-linear, wave-mixing process, much like CARS. RDV monitors the gain or loss of the probe-beam energy as it mixes with the tuned pump beam. Velocity is obtained by using a forward-propagating and backward-propagating probe beam and monitoring the Doppler shift of the gain/loss spectra. Further, the (translational) temperature and pressure are resolved by least-squares fitting a Voigt linewidth model to these gain/loss spectra. As expected, this technique is susceptible to laser power fluctuations.
The high-resolution N2 CARS technique presented here extends the aforementioned laser-based techniques by exploiting the pressure- and temperature-sensitivity of the rotational lines near the ( υ = →0 1 ) N2 Q-branch bandhead. Thus, this technique may be used to measure the mean and fluctuating components of pressure, temperature, and density at a single point in a high-speed, compressible flowfield. To demonstrate the viability of this technique, time-averaged CARS measurements from a gas cell and along the centerline of an underexpanded jet are presented. Comparisons between experimental and theoretical CARS spectra, and between the CARS measurements and method-of-characteristics computations for the jet, are discussed. Finally, the paper concludes with a discussion of the potential of the

3
technique for single-shot CARS measurements of pressure, temperature, and density in the underexpanded jet.
High-Resolution N2 Theory From an experimental standpoint, the primary
advantage of CARS is that the signal generated is a coherent laser beam, shifted in frequency (and location depending on the phase-matching geometry) from the three signal-generating laser beams. The frequency shift of the CARS signal is towards the higher-energy blue region, allowing the CARS beam to be separated from the generating laser beams and background radiation and scattering. Equally important, this CARS signal is created in a relatively small region where the lasers beams intersect (e.g., typical CARS probe volume dimensions are: length=1 mm, diameter=50 µm). Thus, the CARS measurements are spatially well resolved and possess an SNR that is orders of magnitude greater than spontaneous Raman scattering.22 Further, the coherent nature of the CARS signal does not require the large solid-angle optics employed in other incoherent techniques, such as laser-induced fluorescence (LIF), to collect the generated signal. Nitrogen CARS does not require “seed” particles such as silicone oil, alumina particles, or titanium dioxide particles, as required with laser Doppler velocimetry (LDV) or other particle-based methods. Compared to pitot probe or thermocouple measurements, the CARS technique is a non-intrusive and, for moderate laser powers, a non-perturbing process.
The current level of understanding of simple diatomic molecules such as N2 , O2 , or H2 allows their rotational and vibrational CARS spectra to be modeled accurately. Thus, quantities such as temperature, species concentration, and pressure may be extracted from the experimental CARS spectra by least-squares fitting them with theoretical CARS spectra created at known conditions. To this end, the CARSFIT code,11 developed at Sandia National Laboratories, was used to reduce the experimental CARS spectra collected here.
An energy level diagram of the CARS process is provided in Fig. 1. In this diagram, a broadband laser is used as the Stokes laser, spreading its energy over a range of frequencies, as denoted by the band at the top of the figure. For N2 vibrational CARS, a frequency difference between the pump and the Stokes lasers of ∆ω = − ≈ −ω ωp s cm2330 1 will excite the υ = →0 1 vibrational Raman transition of nitrogen. Probing the induced polarization with the second pump beam produces a CARS or anti-Stokes beam. The frequency
of this beam, denoted by the downward arrow in Fig. 1, is approximately λCARS nm= 473 75. .
Figure 2 contains four theoretical CARS spectra created by CARSFIT. The multiple peaks in the figures represent the rotational modes of the nitrogen Q-branch. The theoretical spectrum in Fig. 2(a) was created for P=1.0 atm and T=295 K. The rotational transitions in Fig. 2(a) are labeled. For a gas in molecular equilibrium, the population distribution (envelope) of the rotational levels may be described by the Boltzmann relation:
NN
g e
g eJ J
kT
JkT
J
J
J=
−
−
ε
ε (1)
where NJ , gJ , and εJ are the number density, degeneracy, and energy of rotational level J, respectively; N is the total number density; k is the Boltzmann constant; and T is the temperature.
The theoretical CARS spectrum in Fig. 2(b) for P=0.1 atm is markedly different than the spectrum in Fig. 2(a), even though both spectra were created at T=295 K. Obviously, then, pressure plays an important role in determining the shape of the CARS spectrum. Collisional (pressure) broadening23 is the dominant mechanism that alters the linewidths of rotational transitions between 0.1 atm and 1.0 atm.
Figure 2(c) displays a theoretical CARS spectrum calculated for P=1.0 atm and T=90 K. Compared to Fig 2(a), the lower rotational transitions are heavily populated at these conditions, forming a single peak centered between the Q(2) and Q(4) peaks. This temperature-induced population shift is described by the Boltzmann relation (Eq. 1). Collisional broadening
Figure 1 CARS energy level diagram
ωωωωp ωωωωpωωωωs ωωωωa s
ωωωωa s = 2ωωωωp- ωωωωs
2330 cm-1

4
has eliminated the individual rotational line structure, leaving only small notches where the Q(6), Q(8), and Q(10) lines had once been. More importantly, in Fig. 2(c), the maximum (CARS Intensity)1/2 value is approximately an order-of-magnitude larger than in Fig. 2(a). This result follows from the fact that (CARS Intensity)1/2 is proportional to the number density, N, at these thermodynamic conditions.22 The individual rotational lines reappear in Fig. 2(d) at P=0.1 atm and T=90 K. The thermodynamic conditions chosen for the spectra in Fig. 2(d) are representative of the conditions often found in supersonic wind tunnel flows.24 As is evident from the four plots of Fig. 2, changes in pressure and/or temperature result in
markedly different CARS spectra, lending both pressure- and temperature-sensitivity to this technique.
EQUIPMENT AND APPARATUS Figure 3 is a plan-view schematic of the CARS
system used in the current experiments. Starting at the left, a frequency-doubled, injection-seeded Nd:YAG laser from Continuum (Powerlite Precision 8010) provides a 532 nm laser pulse (at 10 Hz with approximately 850 mJ/pulse) to the CARS system. This green beam is split so that 80% of the Nd:YAG emission pumps a conventional broadband dye laser25 (BDL) which provides the Stokes beam ωs ; the remaining twenty percent of the Nd:YAG beam, after
0
1000
2000
3000
4000
5000
6000
2322 2324 2326 2328 2330 2332
(CARS Intensity) 1/
2
Raman Shift (cm -1)
P = 1.0 atmT = 90 K
(c) (d)
Figure 2 Theoretical CARSFIT spectra (probe linewidth: ΓΓΓΓ 0000 18181818= . cm-1) for conditions (a) P=1.0 atm, T=295 K (b) P=0.1 atm, T=295 K (c) P=1.0 atm, T=90 K (d) P=0.1 atm, T=90 K
0
50
100
150
200
250
2322 2324 2326 2328 2330 2332
(CARS Intensity) 1/
2
Raman Shift (cm -1)
P = 0.1 atmT = 295 K
0
100
200
300
400
500
600
700
2322 2324 2326 2328 2330 2332
(CARS Intensity) 1/
2
Raman Shift (cm -1)
P = 1.0 atmT = 295 K
Q(2)Q(8)Q(6)
Q(4)
Q(12)Q(11)
Q(10)Q(9)
Q(18)Q(17)
Q(16)Q(15)
Q(14)Q(13)
Q(20)Q(19)
0
200
400
600
800
1000
2322 2324 2326 2328 2330 2332
(CARS Intensity) 1/
2
Raman Shift (cm -1)
P = 0.1 atmT = 90 K
(a) (b)
(CA
RS
Inte
nsity
)1/2
(CA
RS
Inte
nsity
)1/2
(CA
RS
Inte
nsity
)1/2
(CA
RS
Inte
nsity
)1/2

5
being split again with a 50/50 beamsplitter, is used to form the CARS pump beams,= ωp . Two half-wave plate Glan polarizer assemblies are used to control the energy of both the Nd:YAG and broadband Stokes beams.
Rhodamine 640 dissolved in methanol is used as the organic dye in the BDL. With this dye, the BDL lases over approximately 200 1cm− with a center wavelength of λ=607.55 nm. This red beam is expanded with a Galilean telescope and then directed, along with the two pump beams, to the front surface of the f=250 mm spherical focusing lens in a folded BOXCARS configuration.18 The three beams are then focused to a near-diffraction-limited probe volume size of approximately 1 mm length by 50 µm diameter. After passing through the rear collimating lens, the CARS beam is guided through a set of dichroic mirrors, eliminating any residual pump or Stokes beam radiation. This beam is then focused on the entrance slit of a 1 m SPEX spectrometer. Immediately after the collimating lens, the pump and Stokes beams are directed into beam traps. Two Nikon camera lenses (28 mm f/2.8 and 210 mm f/5.6 with lens extensions) are used as a relay lens system in the imaging portion of the spectrometer, magnifying the CARS spectrum at the spectrometer exit plane by a factor of approximately 7.5. A Photometrics CH250 unintensified CCD camera
is used to collect the CARS spectra; these spectra are then stored on a Gateway PC.
Pressure Vessel As shown in Fig. 3, the high-pressure gas cell, with
optical access on all four sides, is placed between the focusing and collimating lenses, allowing the beams to pass cleanly through the cell. Care is taken to ensure that none of the beams clip the sides of the stainless steel cell, which would ablate the steel surface and coat the windows. The pressure in the cell is varied using a vacuum pump and bottled air to obtain below- and above-atmospheric conditions, respectively. An MKS 25,000 torr absolute transducer is used to monitor the cell pressure. The accuracy of the transducer is ±0 5. % of its reading.
Underexpanded Jet Facility The flowfield of the underexpanded sonic jet used
here provides a wide range of centerline pressures (0.1-3.2 atm) and temperatures (90-250 K) with which to examine the accuracy of this high-resolution N2 CARS technique. Moreover, this canonical flowfield has been studied extensively over the past 50 years,26-31 providing excellent theoretical and computational benchmarks with which to compare our results. The jet facility at the University of Illinois (described in detail in King32) utilizes a converging nozzle with an exit
Freq
uenc
y D
oubl
edN
d:Y
AG
ConventionalBroadbandDye Laser
SPEX 1m Spectrometer PhotometricsCCD Camera
Gas Cell
Slit
Relay LensSystem
ωp (Pump beam, 532 nm)
ωs (Stokes beam, 607.55 nm)
ωas (anti-Stokes beam, 473.15 nm)
dichroic mirror
beamsplitter
Glan polarizer
achromatic prism
negative spherical lens
positive spherical lens
beam trap
half-waveplate
Figure 3 Schematic of CARS system
6
diameter of 5 mm exhausting into ambient air. Dry compressed air is supplied to the nozzle through a ½ in. diameter line.
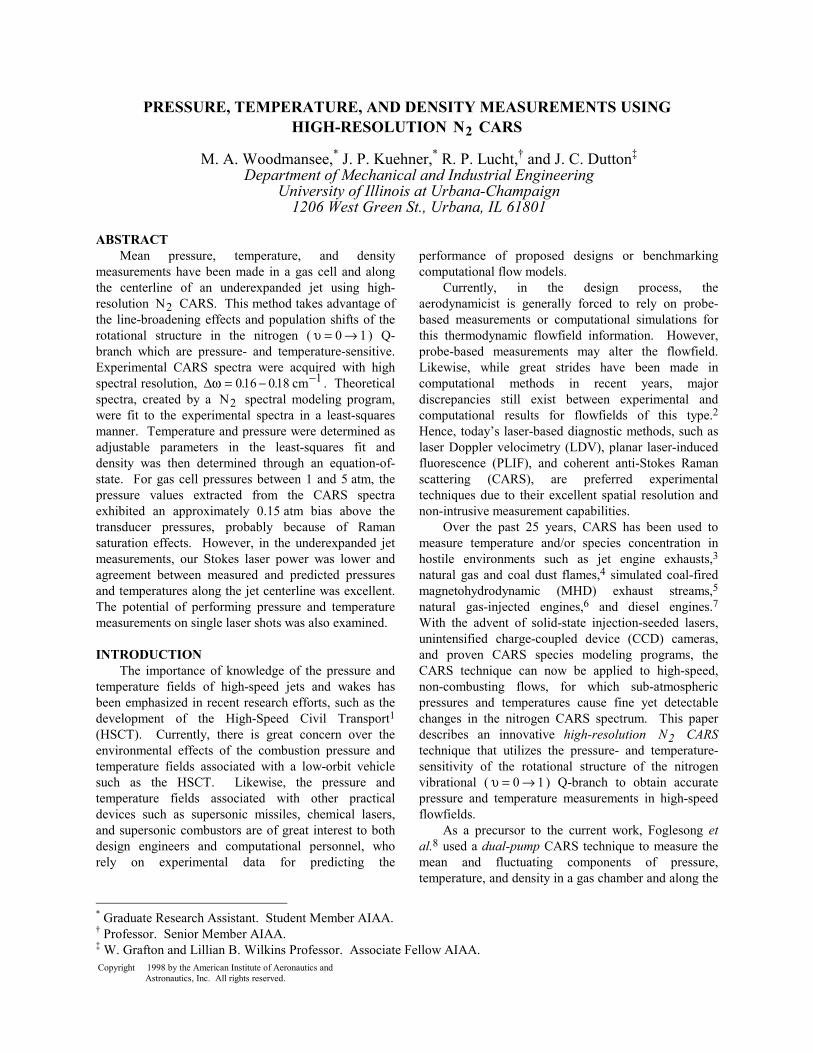
Figure 4(a) is a shadowgraph photo of the underexpanded jet flowfield; Figure 4(b) is a schematic of the initial shock and expansion wave structure near the exit of the jet. Upon exiting the jet, the issuing gas immediately encounters an axisymmetric Prandtl-Meyer expansion fan centered at the lip of the nozzle; this P-M fan turns the flow outward towards the atmospheric (constant-pressure) boundary. This boundary, however, redirects the expansion fan towards the jet centerline as a series of compression waves. An oblique interception shock is formed at the locations where the compression waves coalesce. As shown in Fig. 4(b), the oblique interception shock extends from the inner edge of the jet orifice to the Mach disk, approximately x=7 mm downstream in the current case. The Mach disk is a normal shock which forces the accelerating jet-exit flow to recompress, matching the downstream conditions of the jet. Oblique reflected shocks extend at an angle downstream from the Mach disk, and the entire shock system repeats itself until viscous effects dominate and the shock structures weaken and decay into a turbulent stream in the far field.
DATA ACQUISITION AND REDUCTION Before acquisition of the CARS spectra, a number
of signal optimization tasks were performed. These steps were taken to increase the resolution of the CARS spectra. First, the three fine-adjust mounts holding the right-angle prisms just upstream of the spherical focusing lens were adjusted until the beams overlapped at their waists. Second, while monitoring the CARS signal on the CCD camera, the spectrometer entrance slit was progressively narrowed and the spherical lens in front of the spectrometer was gradually translated until the focal point of the invisible CARS beam fell directly on the narrowed slit. Finally, both camera lenses in relay lens system were adjusted until the CARS spectrum appeared in focus across the CCD array. At this point, the resolution of the CARS signal was at an optimum.
A tradeoff existed between the CARS signal strength and its spectral resolution. As the spectrometer entrance slit was narrowed, the rotational lines became more prominent, extending farther above the Q-branch envelope. However, narrowing the spectrometer entrance diminished the overall strength of the signal detected at the CCD array. For the time-averaged measurements presented below, we chose a slit width of 6 10− µm , using a longer CCD camera exposure time to account for the decreased CARS signals strength.
This provided CARS spectra with a resolution of ∆ω ≈ − −016 018 1. . ,cm close to the theoretical resolution limit33 of our 1-m spectrometer. In comparison, most broadband CARS experiments18 trade spectral resolution ( 05 10 1. .− −cm ) for an increase in the acquired Raman shift range (100 200 1− −cm ). Finally, before collecting the CARS data, the atmospheric pressure and temperature were recorded with a Setra 370 absolute pressure transducer and a ±01. deg C thermistor, respectively.
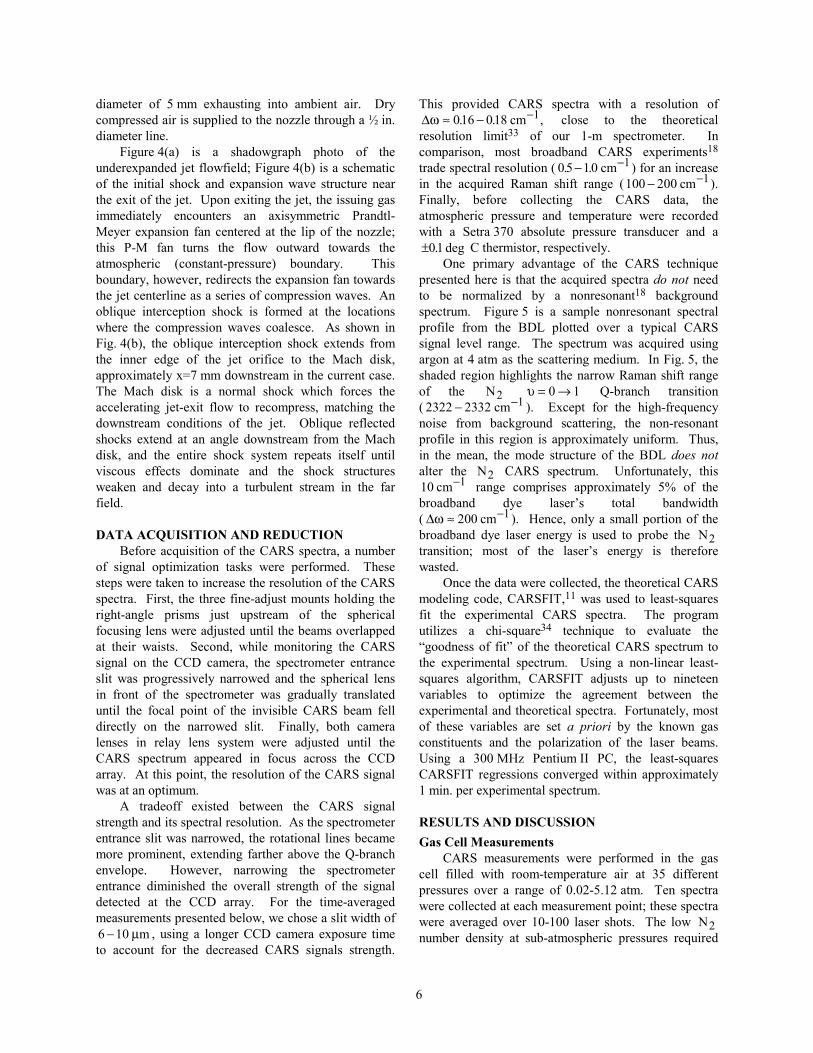
One primary advantage of the CARS technique presented here is that the acquired spectra do not need to be normalized by a nonresonant18 background spectrum. Figure 5 is a sample nonresonant spectral profile from the BDL plotted over a typical CARS signal level range. The spectrum was acquired using argon at 4 atm as the scattering medium. In Fig. 5, the shaded region highlights the narrow Raman shift range of the N2 υ = →0 1 Q-branch transition ( 2322 2332 1− −cm ). Except for the high-frequency noise from background scattering, the non-resonant profile in this region is approximately uniform. Thus, in the mean, the mode structure of the BDL does not alter the N2 CARS spectrum. Unfortunately, this 10 1cm− range comprises approximately 5% of the broadband dye laser’s total bandwidth ( ∆ω ≈ −200 1cm ). Hence, only a small portion of the broadband dye laser energy is used to probe the N2 transition; most of the laser’s energy is therefore wasted.
Once the data were collected, the theoretical CARS modeling code, CARSFIT,11 was used to least-squares fit the experimental CARS spectra. The program utilizes a chi-square34 technique to evaluate the “goodness of fit” of the theoretical CARS spectrum to the experimental spectrum. Using a non-linear least-squares algorithm, CARSFIT adjusts up to nineteen variables to optimize the agreement between the experimental and theoretical spectra. Fortunately, most of these variables are set a priori by the known gas constituents and the polarization of the laser beams. Using a 300 MHz Pentium II PC, the least-squares CARSFIT regressions converged within approximately 1 min. per experimental spectrum.
RESULTS AND DISCUSSION Gas Cell Measurements
CARS measurements were performed in the gas cell filled with room-temperature air at 35 different pressures over a range of 0.02-5.12 atm. Ten spectra were collected at each measurement point; these spectra were averaged over 10-100 laser shots. The low N2 number density at sub-atmospheric pressures required
7
longer CCD camera exposure times to overcome the background noise level. This noise was primarily caused by Nd:YAG laser scattering.
Figure 6(a) compares an experimental CARS spectrum, acquired at P=2.04 atm, to its least-squares fit
theoretical equivalent. Upon first glance, the shapes of the experimental and the theoretical spectra are almost identical. A majority of the rotational peaks, from the Q(2) transition to the Q(20) transition, coincide. (The reader is referred to Fig. 2(a) for the location of these rotational lines.) The least-squares fit theoretical spectrum was obtained for a pressure and temperature of 2.05 atm and 305 K, respectively. These values are approximately 0.01 atm and 10 K below and above the MKS transducer and ambient thermistor, respectively.
At 5.11 atm [Fig. 6(b)], the entire Q-branch evolves towards a single peak, leaving only remnants of the outer rotational lines: Q(6)-Q(20). With the loss of these features, CARSFIT predicts a pressure and temperature of 5.65 atm and 304 K, 0.54 atm and 9 K higher than the conventionally measured thermodynamic quantities (5.11 atm, 295 K). As might be expected, this technique loses sensitivity with increasing pressure above this range. (Note that the pressure obtained from the single spectrum in Fig. 6(b) does not represent the average pressure of the ten spectra collected at Ptrans =5.11 atm. As will be shown in Fig. 7, the mean value of the ten spectra was 5.27 atm, only 0.16 atm greater than the transducer measurement.) While CARSFIT is capable of fitting spectra devoid of high-resolution features, small variations in the experimental peak width or height usually leads to inaccurate pressure and temperature fits. In contrast to this, the dual-pump CARS
M = 1
D = 5 mm
Expansion Fan
Compression Waves M > 1
M < 1
M > 1M > 1
M > 1
Shear Layer
Sonic Line
MachDisk
M > 1
Intercepting Shock
Reflecting Shock
Jet Exit
Slip Line
M = 0 M = 0
CARS Measurement Point
Y
X
Z
(a) (b)
Figure 4 Underexpanded jet: (a) shadowgraph [from Foglesong et al.8] (b) measurement point schematic
Figure 5 Typical nonresonant CARS spectrum created using Ar gas. The shaded portion of the figure represents the ΝΝΝΝ 2222 ( υυυυ 0000 1111= → ) Q-branch
transition region (2322-2332 cm-1).
0
20
40
60
80
100
2320 2325 2330 2335 2340
(CARS Intensity) 1/
2
Raman Shift (cm -1)
(CA
RS
Inte
nsity
)1/2

8
technique8 proved to be an excellent method for resolving above-atmospheric pressures.
Figure 7 compares pressures measured with the high-resolution CARS technique and the MKS pressure transducer for pressures up to about 5 atm. For reasons discussed below, only the above-atmospheric pressure measurements are shown in Fig. 7. The markers represent the average pressure determined from the ten spectra acquired at each measurement point. The uncertainty bars represent one standard deviation of the ten pressure values. To illustrate the high-pressure insensitivity point made above, the standard deviation in pressure at P atmtrans = 511. is σ = 0 35. .atm This value is over four times that at P atmtrans = 2 04. ( σ = 0 07. atm ). Hence, the loss of rotational structure due to collisional narrowing decreases the sensitivity of the measurement technique at high pressures.
A slight bias is evident in Fig. 7 for higher CARS-measured pressures as compared to the transducer values. On average, the CARS measurements are 0.15 atm higher than the transducer measurements. This bias is most likely due to Stark broadening35-37 or Raman saturation.35-37 Originally, we acquired CARS spectra from 0-5 atm to examine the sub-atmospheric pressure measurement capability of this technique. Unfortunately, these low-pressure experimental spectra did not match their theoretical equivalents. Figures 8(a) and 8(b) represent example spectra obtained at 0.1 and 0.8 atm, respectively. In Fig. 8(a), the rotational lines generally agree poorly with their theoretical counterparts, with the largest discrepancy occurring at
the bandhead. More disturbingly, the relative heights of the Q(2) and Q(4) lines in the experimental and theoretical spectra are reversed. Also, the linewidths of the experimental rotational transitions are greater than the theoretical linewidths. Interestingly, as shown by the spectrum acquired at 0.8 atm [Fig. 8(b)], the effect of this broadening phenomenon decreases with increasing pressure.
Stark broadening35-37 and/or Raman saturation35-37 occur for high pump and Stokes beam intensities. These fields may artificially pump the rotational transitions in the CARS spectra. These effects may alter the relative intensities of the rotational transitions in the CARS spectra. Moreover, Rahn et al.36 also observed a switching in the relative intensities of the Q(2) and Q(4) lines when using 0.25 mJ and 70 mJ pump beams.
Centerline Underexpanded Jet Measurements In this experiment, 34 CARS measurements were
made along the centerline of the jet [see Fig. 4(b)]; each measurement point was spaced by 0.014 in. (0.356 mm). Care was taken at the outset of these experiments to align the CARS probe volume with the center of the jet orifice using a probe volume location technique described by Eckbreth.18 Equally important, using a method described by Green,25 the length of the probe volume was conservatively measured18 to be 1 mm. The diameter of the probe volume was estimated to be 50 µm. The jet was run with stagnation conditions of P atmt = 6 05. and T Kt = 296 6. . Like
(a) (b)
Figure 6 Least-squares fit of N2 CARS spectra using CARSFIT for (a) P 2.04 atmtrans = , P 2.05 atmCARS = (b) P 5.12 atmtrans = , P 5.65 atmCARS =
0
200
400
600
800
1000
1200
2322 2324 2326 2328 2330 2332
ExperimentCARSFIT Theory
(CARS Intensity) 1/
2
Raman Shift (cm -1)
0
500
1000
1500
2000
2500
3000
2322 2324 2326 2328 2330 2332
ExperimentCARSFIT Theory
(CARS Intensity) 1/
2
Raman Shift (cm -1)
(CA
RS
Inte
nsity
)1/2
(CA
RS
Inte
nsity
)1/2

9
the gas cell measurements, ten spectra were collected at each measurement location. To obtain an adequate SNR, ten laser shots per spectrum were required at the first 20 measurement points. Since the dye in the BDL degraded with time, 30 shots per spectrum were needed for the remaining measurement locations.
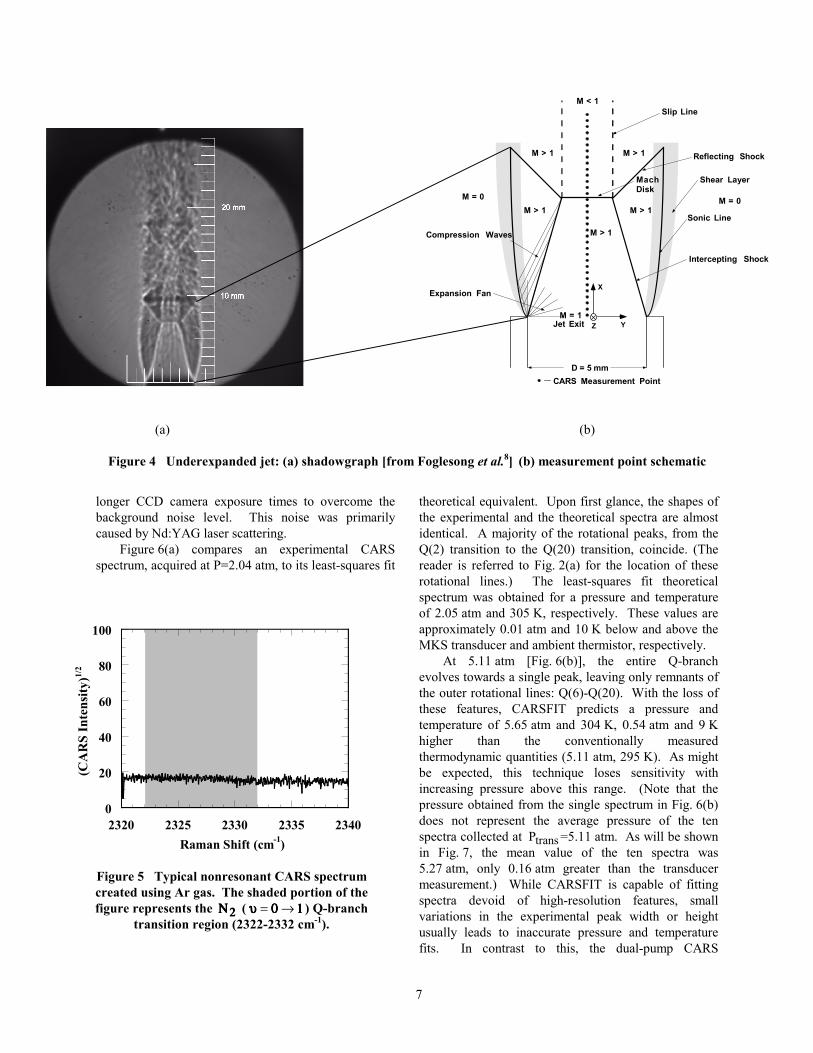
Figure 9 is a compilation of six spectra obtained at various points throughout the underexpanded jet flowfield. Like the spectra shown in Fig. 6, these plots compare the experimental and best-fit theoretical CARS spectra. As a general observation, the experimental and theoretical curves compare favorably throughout all six plots. Equally important, the shapes of the spectra change dramatically with spatial location, thus highlighting the sensitivity of this technique to changes in thermodynamic conditions. Fig. 9(a) is a plot of the time-averaged spectrum acquired at the jet exit. At the relatively high pressure ( P atm= 3 22. ) and temperature ( T K= 258 ) found at this location, collisional narrowing has begun to coalesce the entire spectrum into a single peak. However, the CARSFIT code does an excellent job of modeling the interplay of these broadened rotational lines, even picking up the remnants of the odd Q(13), Q(15), and Q(17) lines [see Fig. 2(a)].
Moving downstream, the linewidths of the rotational lines in Figs. 9(b) and 9(c) become narrower with the decreasing pressure of the accelerating flow. In addition, the decrease in temperature with downstream distance is evident as the population distribution shifts towards lower rotational transitions [Q(2)-Q(14)]. During the data reduction process, only the appropriate Raman shift range was used in the least-squares fits. For example, a Raman shift range of 2327 2331 1− −cm was used for the spectra in Fig. 9(c). Figure 9(c) is important because it illustrates the ability of this technique to resolve low pressures (P ≈ 0.2 atm)
Figure 7 Comparison of pressure measurements made in a gas cell using the high-resolution N2 CARS technique and a pressure transducer for
pressures between 1 and 5 atm
1
2
3
4
5
6
1 2 3 4 5 6
CARS Pressure (atm)
Pressure Transducer (atm)
(a) (b)
Figure 8 Comparison of experimental CARS spectra subject to high Stokes beam intensity and theoretical CARS spectra for (a) Ptrans =0.10 atm (b) Ptrans =0.80 atm
0
50
100
150
200
2322 2324 2326 2328 2330 2332
ExperimentCARSFIT Theory
(CARS Intensity) 1/
2
Raman Shift (cm -1)
0
100
200
300
400
500
600
2322 2324 2326 2328 2330 2332
ExperimentCARSFIT Theory
(CARS Intensity) 1/
2
Raman Shift (cm -1)
CA
RS
Pres
sure
(atm
)
Pressure Transducer (atm)
(CA
RS
Inte
nsity
)1/2
(CA
RS
Inte
nsity
)1/2
10
(a) (b)
(c) (d)
(e) (f)
Figure 9 Least-squares fit N2 CARS spectra using CARSFIT at different positions along the jet centerline (a) jet exit: x=0 mm, PCARS =3.22 atm, TCARS =258 K (b) x=3.56 mm, PCARS =0.67 atm, TCARS =154 K (c) before Mach disk: x=6.76 mm, PCARS =0.23 atm, TCARS =95 K (d) after Mach disk: x=7.11 mm, PCARS =1.63 atm, TCARS =293 K (e) x=11.73 mm, PCARS =1.07 atm, TCARS =250 K (f) ambient air: PCARS =0.97 atm, TCARS =297 K
0
500
1000
1500
2000
2500
2322 2324 2326 2328 2330 2332
ExperimentCARSFIT Theory
(CARS Intensity) 1/
2
Raman Shift (cm -1)
0
200
400
600
800
1000
1200
1400
2322 2324 2326 2328 2330 2332
ExperimentCARSFIT Theory
(CARS Intensity) 1/
2
Raman Shift (cm -1)
0
200
400
600
800
1000
1200
1400
2322 2324 2326 2328 2330 2332
ExperimentCARSFIT Theory
(CARS Intensity) 1/
2
Raman Shift (cm -1)
0
200
400
600
800
1000
2322 2324 2326 2328 2330 2332
ExperimentCARSFIT Theory
(CARS Intensity) 1/
2
Raman Shift (cm -1)
0
200
400
600
800
1000
2322 2324 2326 2328 2330 2332
ExperimentCARSFIT Theory
(CARS Intensity) 1/
2
Raman Shift (cm -1)
0
100
200
300
400
500
600
700
2322 2324 2326 2328 2330 2332
ExperimentCARSFIT Theory
(CARS Intensity) 1/
2
Raman Shift (cm -1)
(CA
RS
Inte
nsity
)1/2
(CA
RS
Inte
nsity
)1/2
(CA
RS
Inte
nsity
)1/2
(CA
RS
Inte
nsity
)1/2
(CA
RS
Inte
nsity
)1/2
(CA
RS
Inte
nsity
)1/2
11
and temperatures (T ≈ 90 K) as is often found in high-speed flows. Experience has shown that, at these thermodynamic conditions, the Q(2) and Q(4) lines are especially sensitive to pressure. Provided that these rotational lines are well resolved, small changes in pressure [∆P ∼ O(0.1 atm)] will noticeably alter their peak height.
The spectrum in Fig. 9(d) was acquired downstream of the Mach disk, approximately 350 µm away from the spectrum in Fig. 9(c). The increased temperature ( T K≈ 293 ) behind the normal shock populates the upper rotational transitions of the spectrum in Fig. 9(d); the corresponding increase in pressure ( P atm≈ 16. ) broadens these rotational lines. A CARS spectrum, acquired at the last downstream measurement point (x=11.73 mm), is shown in Fig. 9(e). The flow in this region is beginning to reaccelerate towards a second Mach disk. Except for the relative height of the outer rotational lines, the spectrum in Fig. 9(e) is similar to the ambient spectrum shown in Fig. 9(f), one of the last data points collected in this series. In both figures, the noise evident at the outer edges of the figures was due to the temporal degradation of the Rhodamine 640 dye in the BDL. Nevertheless, the theoretical spectra continue to model the experimental spectra well.
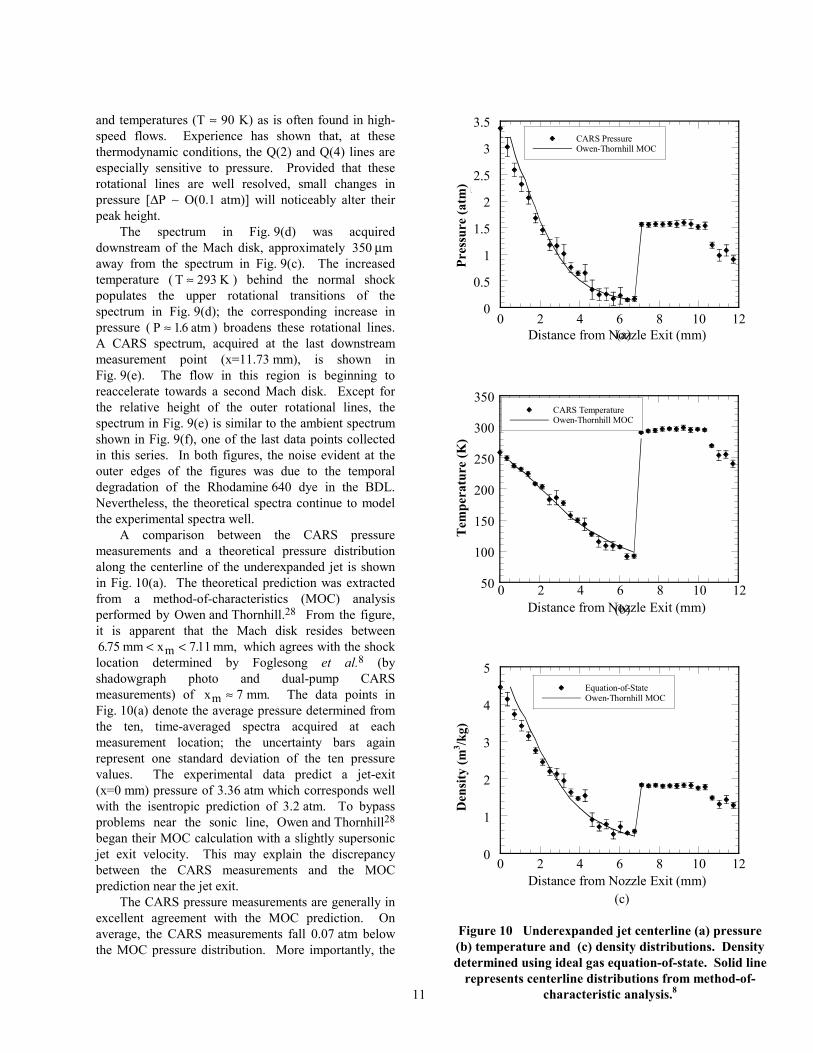
A comparison between the CARS pressure measurements and a theoretical pressure distribution along the centerline of the underexpanded jet is shown in Fig. 10(a). The theoretical prediction was extracted from a method-of-characteristics (MOC) analysis performed by Owen and Thornhill.28 From the figure, it is apparent that the Mach disk resides between 6 75 711. .mm x mm,m< < which agrees with the shock location determined by Foglesong et al.8 (by shadowgraph photo and dual-pump CARS measurements) of x mmm ≈ 7 . The data points in Fig. 10(a) denote the average pressure determined from the ten, time-averaged spectra acquired at each measurement location; the uncertainty bars again represent one standard deviation of the ten pressure values. The experimental data predict a jet-exit (x=0 mm) pressure of 3.36 atm which corresponds well with the isentropic prediction of 3.2 atm. To bypass problems near the sonic line, Owen and Thornhill28 began their MOC calculation with a slightly supersonic jet exit velocity. This may explain the discrepancy between the CARS measurements and the MOC prediction near the jet exit.
The CARS pressure measurements are generally in excellent agreement with the MOC prediction. On average, the CARS measurements fall 0.07 atm below the MOC pressure distribution. More importantly, the
(c)
Figure 10 Underexpanded jet centerline (a) pressure (b) temperature and (c) density distributions. Density determined using ideal gas equation-of-state. Solid line
represents centerline distributions from method-of-characteristic analysis.8
50
100
150
200
250
300
350
0 2 4 6 8 10 12
CARS TemperatureOwen-Thornhill MOC
Temperature (K)
Distance from Nozzle Exit (mm)
0
0.5
1
1.5
2
2.5
3
3.5
0 2 4 6 8 10 12
CARS PressureOwen-Thornhill MOC
Pressure (atm)
Distance from Nozzle Exit (mm)
0
1
2
3
4
5
0 2 4 6 8 10 12
Equation-of-StateOwen-Thornhill MOC
Density (kg/m
3)
Distance from Nozzle Exit (mm)
(b)
(a)
Pres
sure
(atm
) Te
mpe
ratu
re (K
) D
ensi
ty (m
3 /kg)

12
agreement between experiment and theory increases as the Mach disk is approached. Foglesong et al.,8 on the other hand, found the dual-pump CARS technique to be insensitive to pressure in this low-pressure region. The high-resolution N2 CARS pressure measurement just before the Mach disk is 0.16 atm. This value is 0.03 atm higher than the theoretical prediction of 0.13 atm. Assuming isentropic flow, this CARS-determined pressure corresponds to a Mach number of M=3.0 upstream of the Mach disk. Normal shock relations predict a pressure downstream of the Mach disk of 1.67 atm, which is 0.11 atm higher than the CARS pressure measurement of 1.56 atm. Interestingly, a relatively long (∆x = 3.2 mm) constant-pressure region extends downstream of the Mach disk. As mentioned before, the decrease in pressure at the end of this region corresponds to reacceleration of the flow as it approaches a second Mach disk.
The agreement between the CARS measurements and the MOC prediction is even better in Fig. 10(b) where the temperature distribution along the jet centerline is plotted. In viewing Fig. 10(b), it is important to remember that the CARS pressure and temperature data were extracted from the N2 spectra alone. No isentropic relations were required to generate these data points. The MOC temperature data, on the other hand, were determined from the pressure results assuming isentropic flow up to the Mach disk. On average, the CARS measurements are 1 K below the theoretical distribution. Interestingly, the standard deviations of the CARS temperature measurements upstream of the Mach disk ( σ T = 5.2 K) are slightly larger than the standard deviations behind the Mach disk ( σ T = 4.0 K). The cause of this reduction in precision uncertainty for temperature across the Mach disk is not currently known.
Utilizing the experimental pressure and temperature measurements in Figs. 10(a) and 10(b), respectively, and the ideal gas equation-of-state, the CARS-based density distribution along the centerline of the underexpanded jet is plotted in Fig. 10(c). The MOC distribution up to the Mach disk is again obtained from the pressure results assuming isentropic flow. The standard deviations of the CARS density measurements were determined using the procedure outlined by Kline and McClintock.38 Not surprisingly, small deviations in pressure and temperature from the theoretical values are emphasized here.
Single-Shot Measurements In addition to the time-averaged CARS spectra,
100 single-shot spectra were acquired at the 34 measurement locations along the jet centerline. The 10 ns pulse length of the Nd:YAG laser allows
instantaneous pressure and temperature measurements to be made. Figure 11 presents two examples of single-shot CARS spectra acquired at the jet exit. While the single-shot experimental spectra share many traits with their time-averaged equivalent shown in Fig. 9(a), the rotational peaks in Fig. 11 fail to consistently match the associated theoretical peaks. These discrepancies are primarily attributed to shot-to-shot variations8,39,40 in the broadband dye laser profile. Notwithstanding these differences, CARSFIT still provides reasonable pressure and temperature values of 3.09 atm, 247 K and 3.81 atm, 256 K for Figs. 11(a) and 11(b), respectively.
Figure 12 presents two single-shot experimental spectra obtained just upstream of the Mach disk (x=6.76 mm). Obviously, as compared to the time-average spectrum in Fig. 9(c), the spectra in Fig. 12 suffer from a low SNR. Still, the generation of an instantaneous CARS signal in a region of low molecular number density is encouraging. During these measurements, the entrance slit width was increased slightly to 20 µm , allowing a larger portion of the CARS signal to enter the spectrometer at the cost of spectral resolution. As mentioned before, the relative height of the Q(2) and Q(4) lines are highly sensitive to pressure at these conditions. CARSFIT was able to match the heights of these peaks, providing pressures and temperatures which are in reasonable agreement with the ensemble-averaged values of 0.23 atm and 95 K. Single-shot measurements will be the subject of future work.
CONCLUSIONS By utilizing the pressure- and temperature-sensitive
rotational lines near the N2 ( υ = →0 1) Q-branch bandhead, the high-resolution N2 CARS technique can be used to perform spatially well-resolved, mean pressure, temperature, and density measurements in high-speed flows. Moreover, the preliminary single-shot CARS data presented here indicate that this technique is capable of resolving the fluctuating pressure, temperature, and density fields in high-speed flows.
For above-atmospheric pressures in the gas cell, collisional narrowing broadened the individual rotational lines of the nitrogen Q-branch. At conditions above about 4 atm, this technique lost pressure sensitivity primarily from the lack of features with which to fit the spectra. However, the mean pressure values of the ten spectra at these conditions maintained agreement with the transducer-measured pressures. Equally important, with increasing temperature, the population distribution of the rotational lines shifted towards the higher rotational modes, spreading the CARS spectra over a 10 1cm− range. Fortunately, the

13
theoretical CARS modeling program, used to extract the thermodynamic quantities from the experimental spectra, was able to accurately emulate these changes in the experimental spectra.
Thirty-four measurements were made along the centerline of an underexpanded jet. The pressure, temperature, and density measurements compared favorably with a method-of-characteristics28 (MOC) prediction of this flow. The CARS technique adequately predicted the high pressure (3.2 atm) and temperature (247 K) region at the jet exit. In addition, the agreement between experiment and theory increased as the low-pressure (0.13 atm) and
temperature (98 K) regions upstream of the Mach disk were encountered. In comparison, the dual-pump CARS measurements of Foglesong et al.8 could not obtain the same level of agreement between experiment and theory at these conditions. The high-resolution N2 CARS technique was also able to quantify the conditions found just downstream of the Mach disk, where the flow recompressed to 1.63 atm and 293 K. As expected, the density distribution, determined through the ideal gas equation-of-state, also generally followed the MOC prediction.
Example single-shot spectra from the jet exit and upstream of the Mach disk were also presented. These
(a) (b)
Figure 11 Least-squares fit single-shot spectra acquired at the jet exit: x=0 mm (a) T 247 K,CARS = P 3.09 atmCARS = (b) T 256 K,CARS = P 3.81 atmCARS =
0
500
1000
1500
2000
2500
3000
2322 2324 2326 2328 2330 2332
ExperimentCARSFIT Theory
(CARS Intensity)1/
2
Raman Shift (cm-1)
0
200
400
600
800
1000
1200
1400
2327 2328 2329 2330 2331
ExperimentCARSFIT Theory
(CARS Intensity)1/
2
Raman Shift (cm-1)
0
200
400
600
800
1000
2327 2328 2329 2330 2331
ExperimentCARSFIT Theory
(CARS Intensity)1/
2
Raman Shift (cm-1) (a) (b) Figure 12 Least-squares fit single-shot spectra from before the Mach disk: x=6.76 mm (a) T 90 K,CARS =
P 0.13 atmCARS = (b) T 82 K,CARS = P 0.18 atmCARS =
0
500
1000
1500
2000
2500
3000
3500
2322 2324 2326 2328 2330 2332
ExperimentCARSFIT Theory
(CARS Intensity)1/
2
Raman Shift (cm-1)
(CA
RS
Inte
nsity
)1/2
(CA
RS
Inte
nsity
)1/2
(CA
RS
Inte
nsity
)1/2
(CA
RS
Inte
nsity
)1/2

14
single-shot spectra emphasized the ability of the technique to generate CARS signals in regions of low molecular number density.
ACKNOWLEDGMENTS The authors wish to thank Dr. Roger L. Farrow of
Sandia National Laboratories for supplying the most recent version of CARSFIT and for answering our subsequent questions about the code. We also wish to thank Bob Foglesong for his FORTRAN programming expertise in modifying CARSFIT. Funding for this research is provided through the Army Research Office (Grant No. DAAH04-95-1-0276) with Dr. Thomas L. Doligalski as technical monitor.
REFERENCES 1Aeronautics and Space Engineering Board (1997),
“U.S. Supersonic Commercial Aircraft: Assessing NASA's High Speed Research Program,” National Academy Press, Washington, D.C.
2Sahu, J. and Nietubicz, C.J. (1994), “Three-Dimensional Flow Calculations for a Projectile with Standard and Dome Bases,” Journal of Spacecraft and Rockets, Vol. 31, No. 1, pp. 106-112.
3Eckbreth, A.C., Dobbs, G.M., Stufflebeam, J.H. and Tellex, P.A. (1984), “CARS Temperature and Species Measurements in Augmented Jet Engine Exhausts,” Applied Optics, Vol. 23, No. 9, pp. 1328-1339.
4Lückerath, R., Woyde, M., Meier, W., Stricker, W., Schnell, U., Magel, H.-C., Görres, J., Spliethoff, H. and Maier, H. (1995), “Comparison of Coherent Anti-Stokes Raman-Scattering Thermometry with Thermocouple Measurements and Model Predictions in Both Natural-Gas and Coal-Dust Flames,” Applied Optics, Vol. 34, No. 18, pp. 3303-3312.
5Beiting, E.J. (1986), "Multiplex CARS Temperature Measurements in a Coal-Fired MHD Environment," AIAA Paper 86-0133.
6Foglesong, R.E., Rubas, P.J., Green, S.M., Lucht, R.P. and Peters, J.E. (1998), "Dual-Pump Coherent Anti-Stokes Raman Scattering Measurements in a Direct-Injection Natural Gas Engine," SAE Paper 980144.
7Kajiyama, K., Sajiki, K., Kataoka, H., Maeda, S. and Hirose, C. (1982), "N2 CARS Thermometry in Diesel Engine," SAE Paper 821036.
8Foglesong, R.E., Green, S.M., Lucht, R.P. and Dutton, J.C. (1998), “Dual-Pump Coherent Anti-Stokes Raman Scattering for Simultaneous Pressure/Temperature Measurement,” AIAA Journal, Vol. 36, No. 2, pp. 234-240.
9Farrow, R.L., Trebino, R. and Palmer, R.E. (1987), “High-Resolution CARS Measurements of Temperature Profiles and Pressure in a Tungsten Lamp,” Applied Optics, Vol. 26, No. 2, pp. 331-335.
10Kataoka, H., Maeda, S. and Hirose, C. (1982), “Effects of Laser Linewidth on the Coherent Anti-Stokes Raman Spectroscopy Spectral Profile,” Applied Spectroscopy, Vol. 36, No. 5, pp. 565-569.
11Palmer, R.E. (1989), "The CARSFT Computer Code for Calculating Coherent Anti-Stokes Raman Spectra: User and Programmer Information," Sandia Report SAND89-8206.
12Grisch, F., Bouchardy, P., Péalat, M., Chanetz, B., Pot, T. and Coët, M.C. (1993), “Rotational Temperature and Density Measurements in a Hypersonic Flow by Dual-Line CARS,” Applied Physics B, Vol. 56, pp. 14-20.
13Péalat, M. and Lefebvre, M. (1991), “Temperature Measurement by Single-Shot Dual-Line CARS in Low-Pressure Flows,” Applied Physics B, Vol. 53, pp. 23-29.
14Di Rosa, M.D., Chang, A.Y. and Hanson, R.K. (1993), “Continuous Wave Dye-Laser Technique for Simultaneous, Spatially Resolved Measurements of Temperature, Pressure, and Velocity of NO in an Underexpanded Free Jet,” Applied Optics, Vol. 32, No. 21, pp. 4074-4087.
15Chang, A.Y., Battles, B.E. and Hanson, R.K. (1990), “Simultaneous Measurements of Velocity, Temperature, and Pressure using Rapid CW Wavelength-Modulation Laser-Induced Fluorescence of OH,” Optics Letters, Vol. 15, No. 12, pp. 706-708.
16Hiller, B. and Hanson, R.K. (1988), “Simultaneous Planar Measurements of Velocity and Pressure Fields in Gas Flows using Laser-Induced Fluorescence,” Applied Optics, Vol. 27, No. 1, pp. 33-48.
17Lemoine, F. and Leporcq, B. (1995), “An Efficient Optical Pressure Measurement in Compressible Flows: Laser-Induced Iodine Fluorescence,” Experiments in Fluids, Vol. 19, pp. 150-158.
18Eckbreth, A.C. (1996), "Laser Diagnostics for Combustion Temperature and Species," Gordon and Breach, Australia.
19Forkey, J.N., Finkelstein, N.D., Lempert, W.R. and Miles, R.B. (1996), “Demonstration and Characterization of Filtered Rayleigh Scattering for Planar Velocity Measurements,” AIAA Journal, Vol. 34, No. 3, pp. 442-448.

15
20Forkey, J.N., Lempert, W.R. and Miles, R.B. (1998), “Accuracy Limits for Planar Measurements of Flow Field Velocity, Temperature, and Pressure using Filtered Rayleigh Scattering,” Experiments in Fluids, Vol. 24, pp. 151-162.
21Exton, R.J. and Hillard, M.E. (1986), “Raman Doppler Velocimetry: A Unified Approach for Measuring Molecular Flow Velocity, Temperature, and Pressure,” Applied Optics, Vol. 25, No. 1, pp. 14-21.
22Tolles, W.M., Nibler, J.W., McDonald, J.R. and Harvey, A.B. (1977), “A Review of the Theory and Application of Coherent Anti-Stokes Raman Spectroscopy (CARS),” Applied Spectroscopy, Vol. 31, No. 4, pp. 253-271.
23Siegman, A.E. (1986), "Lasers," University Science Books, Mill Valley, CA.
24Mathur, T. and Dutton, J.C. (1996), “Base-Bleed Experiments with a Cylindrical Afterbody in Supersonic Flow,” Journal of Spacecraft and Rockets, Vol. 33, pp. 30-37.
25Green, S.M. (1997), "A Dual-Pump CARS System for the Simultaneous Detection of Nitrogen and Methane," Ph.D. Thesis, University of Illinois at Urbana-Champaign.
26Adamson, T.C., Jr. and Nicholls, J.A. (1959), “On the Structure of Jets from Highly Underexpanded Nozzles into Still Air,” Journal of the Aerospace Sciences, Vol. 26, No. 1, pp. 16-24.
27Dash, S.M., Wolf, D.E. and Seiner, J.M. (1985), “Analysis of Turbulent Underexpanded Jets, Part I: Parabolized Navier-Stokes Model, SCIPVIS,” AIAA Journal, Vol. 23, No. 4, pp. 505-514.
28Owen, P.L. and Thornhill, C.K. (1948), "The Flow in an Axially-Symmetric Supersonic Jet from a Nearly-Sonic Orifice into a Vacuum," ARC Report 2616.
29Miles, R.B., Connors, J., Markovitz, E., Howard, P. and Roth, G. (1989), “Instantaneous Supersonic Velocity Profiles in an Underexpanded Sonic Air Jet by Oxygen Flow Tagging,” Physics of Fluids A, Vol. 1, No. 2, pp. 389-393.
30Gustafson, E.K., McDaniel, J.C. and Byer, R.L. (1981), “CARS Measurement of Velocity in a Supersonic Jet,” IEEE Journal of Quantum Electronics, Vol. QE-17, No. 12, pp. 2258-2259.
31Faris, G.W. and Byer, R.L. (1986), “Quantitative Optical Tomographic Imaging of a Supersonic Jet,” Optics Letters, Vol. 11, No. 7, pp. 413-415.
32King, G.F. (1997), "Dual-Tracer PLIF Measurements in the Axisymmetric Jet Near-Field,"
M.S. Thesis, University of Illinois at Urbana-Champaign.
33Jobin Yvon/SPEX Division (1994), “Guide for Spectroscopy,” Instruments S.A. Inc., Edison, NJ.
34Hogg, R.V. and Tanis, E.A. (1993), "Probability and Statistical Inference," Macmillan Publishing Company, New York.
35Farrow, R.L. (1998), personal communication. 36Rahn, L.A., Farrow, R.L., Koszykowski, M.L.
and Mattern, P.L. (1980), “Observation of an Optical Stark Effect on Vibrational and Rotational Transitions,” Physical Review Letters, Vol. 45, No. 8, pp. 620-623.
37Gierulski, A., Noda, M., Yamamoto, T., Marowsky, G. and Slenczka, A. (1987), “Pump-Induced Population Changes in Broadband Coherent Anti-Stokes Raman Scattering,” Optics Letters, Vol. 12, No. 8, pp. 608-610.
38Kline, S.J. and McClintock, F.A. (1953), “Describing Uncertainties in Single-Sample Experiments,” Mechanical Engineering, Vol. 75, No. 1, pp. 3-8.
39Snelling, D.R., Sawchuk, R.A. and Smallwood, G.J. (1992), “An Improved CARS Spectrometer for Single-Shot Measurements in Turbulent Combustion,” Review of Scientific Instruments, Vol. 63, No. 12, pp. 5556-5564.
40Snelling, D.R., Sawchuk, R.A. and Parameswaran, T. (1994), “Noise in Single-Shot Broadband Coherent Anti-Stokes Raman Spectroscopy that Employs a Modeless Dye Laser,” Applied Optics, Vol. 33, No. 36, pp. 8295-8301.