presentation: training on the ieubk model, · pdf filetraining on the ieubk model, adult lead...
TRANSCRIPT

Training on the IEUBK Model, Adult Lead Methodology, and Recent Lead Risk
Assessment Updates
TRW Lead Committee

Overview of Lead Model Training
• Introduction (why do we need models?)
• The IEUBK Model -- structure and components
• The U.S. EPA Adult Lead Methodology (ALM)
• Discuss IEUBK & ALM inputs (review data entry windows and input variables, and why some are controversial)
• Risk Assessment Issues and Guidance
• PbB calculation, risk calculation, & PRG
2

What is a Biokinetic Model?
• Biokinetic models assess the routes of environmental exposure to a substance and determine the distribution of thissubstance among the various body tissues in humans.
• Biokinetic models work best when there is a known effect that is associated with a specific tissue concentration in humans.
– e.g., impaired nerve conduction velocity in children at 10 µg Pb/dL blood.
• Biokinetic models also enable the risk assessor to predict therelative effect of an increase in body tissue that might resultfrom a specific increase in environmental exposure.
– e.g., the expected blood lead concentration that would result from an increasein soil lead concentration of 500 mg/kg.
3

Lead Risk Assessment is Different • In comparison to most other environmental contaminants, the degree of
uncertainty about the health effects of lead is quite low.
• Some of these effects, particularly changes in the levels of certain blood enzymes and in aspects of children's neurobehavioral development, may occur at blood lead levels so low as to be essentially without a threshold.
• EPA decided that it was inappropriate to derive a Reference Dose (RfD) for lead.
• EPA regulates lead exposure by using a biomarker (blood lead concentration).
• Environmental exposures to lead are modeled to predict blood lead levels associated with those exposures.
• CDC established 10 µg/dL as the Federal level of concern in 1991.
4

OSWER Lead Risk Assessment Policy
• The IEUBK Model as the primary tool to generate residential risk-based soil cleanup levels.
• OSWER’s risk reduction policy is for no child to have greater than a 5% probability of having a blood lead level >10 µg/dL.
• Modeling is used to associate environmental exposures with risk and inform cleanup decisions (relative to OSWER’s risk reduction goal).
• In general, blood lead survey data should not be used as the only basis for cleanup decisions.
5

Purpose of the Lead Models IEUBK (Integrated Exposure Uptake Biokinetic Model) • Predicts the blood lead levels in children (under 7 years old)
who are exposed to environmental lead from many sources
• Predicts the risk (probability) that a typical or hypothetical child exposed to specified media lead concentrations will have a blood lead level ≥10 µg/dL (the blood lead level of concern)
• Predicts PRG (cleanup levels) for various media for residential land use
ALM (Adult Lead Methodology) • Predicts the risk of elevated blood lead levels in non-residential
settings (adult exposure to soil; ultimate receptor is fetus) • Predicts PRG (cleanup levels) for soil in non-residential land
use 6

Characteristics of the IEUBK Model • While IEUBK model risk assessments are more complex than
the typical Superfund risk assessment approach, the IEUBK model is not as complex as variance propagation approaches (PRA)
• The IEUBK model employs more site-specific information than other EPA risk assessment models
• The IEUBK model performs well when comparing predicted and observed blood lead levels (Hogan et al., 1998. Integrated Exposure Uptake Biokinetic Model for Lead in Children: Empirical Comparisons with Epidemiologic Data. Environmental Health Perspectives, Vol. 106 No. S6)
7

Intake – Uptake – Biokinetic Relationship Daily Intake of lead is calculated as follows:
Intake = Media Concentration x Media Intake Rate For example: µg lead/day = (µg lead / g of media) x (g of media / day)
Uptake is calculated based on media-specific absorption values (defaults are available): Uptake = Intake x Absorption Factor
Biokinetic module estimates transfer rates for Pb moving between compartments and through elimination pathways to derive a predicted long-term steady state geometric mean PbB concentration.
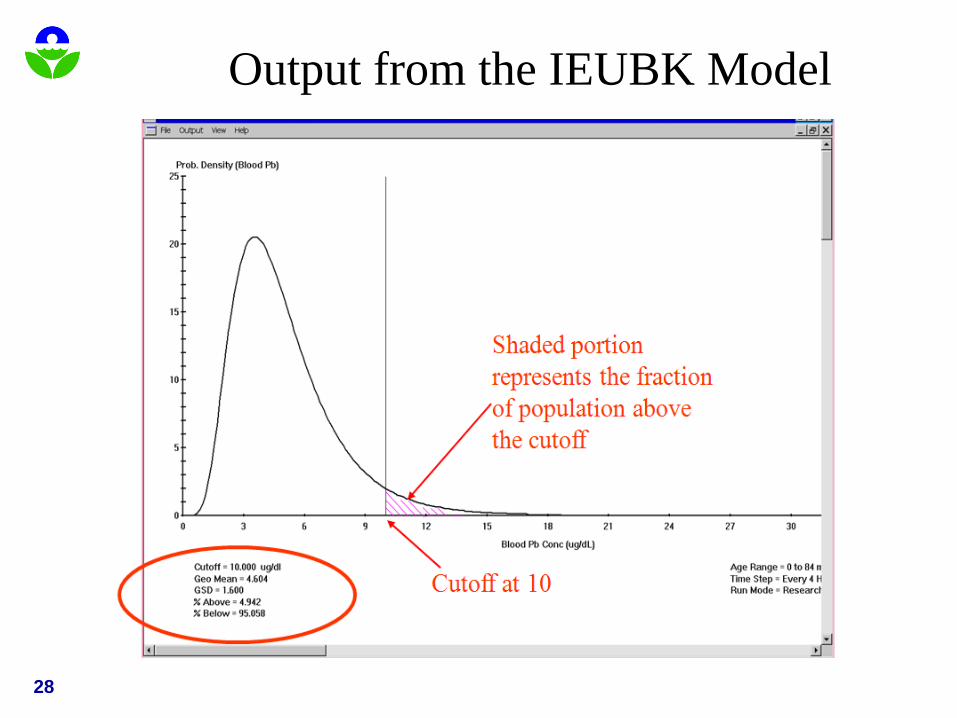
In the final step, the Probability module estimates a plausible distribution of PbB concentrations for a given GSD. The distribution is centered on the geometric mean PbB concentration calculated by the Biokinetic Module.
8

Water Air Paint Soil Diet Dust
Lungs GI Tract
Feces
Lungs GI Tract
Exhaled Air
Plasma Extra-Cellular Fluid
Feces
Urine Skin Hair Nails
Plasma Extra-Cellular Fluid
Trabecular Bone
Cortical Bone
Red Blood Cells
Liver Other Soft Tissues
Kidney
To calculate the probability of exceeding the 10 µg/dL level (P 10):
Z = [ln(10) – ln(GMPbB)] / ln(1.6)
P10 = 1 – P < Z (expressed as a percent)
Elimination Pools of the Body Body Compartments
Environmental Media Body compartment or elimination pool required in more than one component 9

History of the IEUBK Model Development
IEUBK is the product of many years of development 1985-89: Initially Office of Air Quality Planning Standards
1989: Development by Superfund following SAB review 1989-2001: DOS version (0.99d) development. 1994-2001: Release of 0.99d version by Superfund with input from EPA, ATSDR, CDC, and SAB.
1998: Independent Validation and Verification (IV&V) 1997-2001: IEUBK (0.99d) was converted to Windows 2001-present: IEUBKwin 1.0 and IEUBKwin 1.1 2005: NAS review
10

Independent Reviews of the IEUBK
The reviewers have generally found that the model was scientifically sound and useful for lead risk assessment 1990 SAB review for NAAQS 1992 SAB review and External Peer Review of model 1998 Independent Validation and Verification 1998 SAB review for TSCA Section 403 Regulation 2005 National Academies of Science (NAS) review for
Coeur d’Alene site report
11

Evaluation and Validation of the IEUBK
IV&V evaluated the following: 1. Scientific underpinnings of the model structure 2. Adequacy of parameter estimates 3. Mathematical relationships (as computer code) 4. Empirical comparisons (predicted vs. observed)
The process and results of the IEUBK validation are available online (TRW web site)
1994 Validation Strategy for the IEUBK 1998 Empirical Comparisons Manuscript (Hogan et al., 1998)
12

Comparison of IEUBK Predictions and Observed PbB
Correspondence of observed and IEUBK model-predicted blood lead concentrations by site: Kansas/Missouri, Illinois, Pennsylvania, 1991. The solid points are the GMs, whereas the open points provide 95% CIs for the GMs. Adapted from Hogan et al., 1998
13

Comparison of IEUBK Predictions and Observed PbB Comparison of Observed and Predicted Geometric Mean Blood Lead and Risk of Exceeding 10 µg/dL for Three Community Blood Lead Studies
Dataset N Observed Blood Lead (µg/dL) Model Predictions (µg/dL)
GM (95% CI)
Percent >10 (95% CI)
GM (95% CI)
Percent >10 (95% CI)
Galena, KA Jasper Co, MIa
111 5.2 (4.5-5.9)
20 (13-27)
4.6 (4.0-5.3)
18 (11-25)
Madison Co, ILa 333 5.9 (5.5-6.4)
19 (15-23)
5.9 (5.4-6.3)
23 (19-28)
Palmerton, PAb 34 6.8 (5.6-8.2)
29 (14-44)
7.5 (6.6-8.6)
31 (16-47)
Excerpts from Air Criteria Document for Lead (October 2006). Original data from Hogan et al. (1998)
CI, confidence interval; GM, geometric means aChildren away from home ≤10 hours/week bChildren away from home ≤20 hours/week
14

IEUBK Exposure Module Components
Media Concentrations for Input
Soil Soil must be sampled. Site-specific data required.
Refer to the IEUBK User’s Guide and 1994 Guidance Manual for additional information on this input parameter.
Dust Site-specific data or a value can be derived from soil concentration using multiple source analysis.
Refer to the IEUBK User’s Guide and 1994 Guidance Manual for additional information on this input parameter.
Air (default) 0.1 µg/m3
Ratio of indoor to outdoor air lead concentration is 30%. Site-specific data may be substituted.
Drinking Water (default) 4 µg/L Site-specific data may be substituted.
15
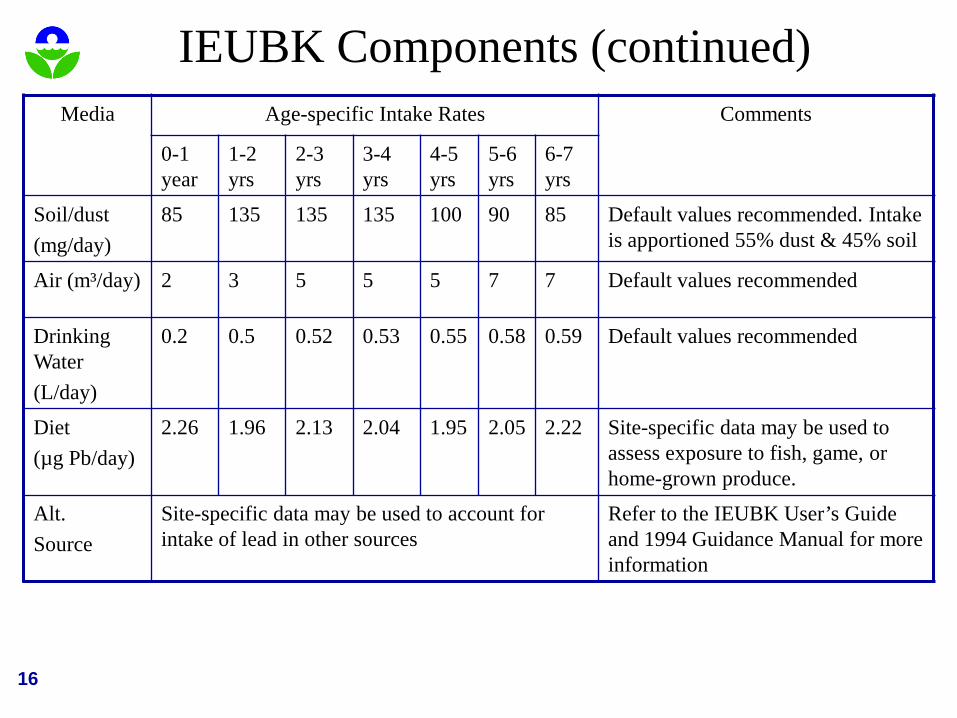
IEUBK Components (continued) Media Age-specific Intake Rates Comments
0-1 year
1-2 yrs
2-3 yrs
3-4 yrs
4-5 yrs
5-6 yrs
6-7 yrs
Soil/dust (mg/day)
85 135 135 135 100 90 85 Default values recommended. Intake is apportioned 55% dust & 45% soil
Air (m³/day) 2 3 5 5 5 7 7 Default values recommended
Drinking Water (L/day)
0.2 0.5 0.52 0.53 0.55 0.58 0.59 Default values recommended
Diet (µg Pb/day)
2.26 1.96 2.13 2.04 1.95 2.05 2.22 Site-specific data may be used to assess exposure to fish, game, or home-grown produce.
Alt. Source
Site-specific data may be used to account for intake of lead in other sources
Refer to the IEUBK User’s Guide and 1994 Guidance Manual for more information
16
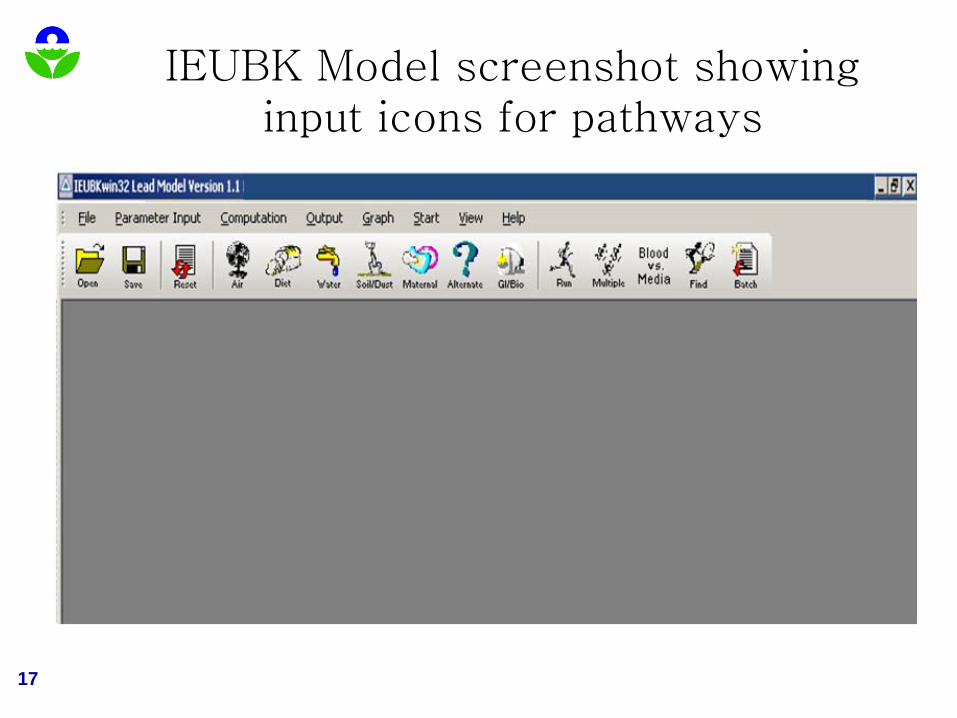
IEUBK Model screenshot showing input icons for pathways
17

Choosing the User Mode
18

Air Exposure Input
19

Dietary Exposure Input
20

Drinking Water Exposure Input
21

Soil and Dust Exposure Input
22

Multiple Source Analysis Detail
23

Bioavailability Information Input
2424

Alternate Exposure Input
25

Maternal Exposure Input
26

Run Risk Calculation (forward equation)
27
28
Output from the IEUBK Model
28

Run PRG Calculation (backward equation)
29

Sensitivity Analysis • Predicted PbB and total lead uptake were most sensitive to the
amount of soil/dust ingested per day. • Predicted PbB and total lead uptake were moderately sensitive
to the following (listed in decreasing relative sensitivity): – absorption fraction for soil dust and diet, – soil lead concentration, – indoor dust lead concentration, – dietary lead concentration, – contribution of soil lead to indoor dust lead, and – half-saturation absorbable intake (based on output-input ratio).
• The predicted probability of exceeding a specified level of concerns is very sensitive to changes in the GSD.
30

IEUBK Strengths and Limitations Strengths:
Integrates multimedia exposure and relates it to a well characterized biomarker of effect
Risk predictions and PRG over a range of exposure scenarios
Inputs tailored to support Superfund site risk assessment Risk information complementary to a public health (PbB)
study or when no public health (PbB) study is available Limitations:
Cannot assess short-term, periodic or acute exposures (exposures must be for at least 1 day per week for 90 consecutive days)
Cannot assess pica exposures Cannot assess dust exposures using loading data Cannot assess age groups >7 years
31
EPA Adult Methodology (ALM)
Adopted and modified from Bowers et al. (1994) Uses a simplified biokinetic slope factor (BKSF) Slope relates change in PbB (µg/dL) per µg/day Pb absorbed Exposure and other variables differ from IEUBK (IR,
bioavailability, etc.)
32

ALM Spreadsheet (Risk Calculation)
33

Recommended PbB0 and GDSi Input
34

Guidance for the IEUBK and ALM Model documentation (user’s guides and validation information) Short Sheets
MSD Ingestion Rate Sieving Sampling Guidance Small Arms Firing Range Exposure Point Concentration Residential Dust Guidance
Residential Sites Handbook TRW Bioavailability Guidance Frequently Asked Questions (FAQs)
TRW Lead Committee Web Site: www.epa.gov/superfund/lead
35

Soil Lead Bioavailability Guidance
36

Assessing Risk Example Exposure Scenarios 1. Site exposure to lead for a residential community where single (arithmetic
mean) media concentrations is available Risk: IEUBK single run mode PRG: IEUBK find media concentration
2. Residential exposure to lead in soil with individual residence media concentrations Risk: IEUBK batch mode run PRG: IEUBK find media concentration
3. Exposure to lead contaminated soil on an industrial property Risk: ALM PRG: ALM
4. Adolescent recreational exposure to contaminated soil Risk: ALM PRG: ALM
37

Case Studies 1. IEUBK: Single run with 500 ppm soil and default (old) dietary data. Risk calculation.
2. IEUBK: Single run with 500 ppm soil and new dietary data (attached). Risk calculation.
3. IEUBK: PRG calculation using new dietary data and modified drinking water value. Also saving and reloading a data file and reset all parameters.
4. IEUBK: Multiple runs for soil range using new dietary data and modified drinking water value. Plot of risk calculations.
5. IEUBK: Find media concentration for soil without and with new dietary data and interpretation of GM PbB output.
6. IEUBK: Creating a batch mode input file from a spreadsheet file (attached).
7. IEUBK: Running a batch mode to calculate risk.
8. ALM: Example data entry for non-residential scenario. Calculation of risk and PRG. 38

Case Studies
ALM example scenario: non residential exposure scenario for a soil-intensive contact scenario. What is PRG?
Use PbB0 & GSDi from recent NHANES and IRs of 100 mg/day
PRG = Approx 620 ppm
39

Case Studies Is the following health protective? Residential soil PRG is 600 ppm for future use. PbA = 0.05 µg/m³, PbW = 1 ppb, Soil bioavailability = 21%.
Enter media data and use new dietary values
Use find media concentration
Yes, PRG is <5% NTE 10 µg/dL
40

Case Studies Is the following health protective? PRG of 2500 ppm for a fire monitoringg station occupied byy adultspp p 7 days per week for 4 months (16 weeks) of the year.
Use ALM with EF = 112 days/year
IRs=50 mg/day
No, PRG is >5% NTE 10 µg/dL
41

Case Studies
Assuming that 2500 ppm is the selected soil lead concentration for those fire monitoring stations (occupied by adults), what is the maximum duration that they can be occupied (assuming continuous exposure)?
IRs = 50 mg/day
Reduce EF to achieve is <5% NTE 10 µg/dL
Approximately 15 weeks
42

Wrap up EPA provides risk tools and guidance to assess lead exposure at hazardous waste sites. The TRW Lead Committee is available to support users when questions or when novel applications arise • Evaluate & develop models and other risk tools • Provide technical support for the development and
implementation of EPA guidance on lead • Review application of risk assessment tools • Provide technical assistance to end users for use of non-standard (site-specific) values
TRW Lead Committee Members are EPA staff from Regions, Headquarters, and Labs
43

TRW Lead Committee Co-Chairs
• Mary Ballew (Region 1) •Mike Beringer (Region 7) • Jim Konz (OSRTI HQ)
TRW Web page: www.epa.gov/superfund/lead
Contact the TRW hotline • Send an e-mail to [email protected] • Call the toll-free TRW hotline at 1-866-282-8622
44