presentation förenergivärdentemavind - energimyndigheten.se · highest yielding onshore low wind...
TRANSCRIPT

Presentation för energivärden tema vind
Andreas Johansson, Senior Director, Vestas Power Solutions
29 May 2018

Vestas in briefThe only global wind energy company
2
We employ more than
23,300 people worldwide
and have more than 35
years of experience with
wind energy
+ 23,300We have a total of 38,892
turbines under service, or
around 76 GW
+38,892We have more than
63,500 turbines or 90 GW
of installed wind power
capacity in 77 countries
worldwide spanning six
continents
+ 63,500Vestas’ revenue for 2017
was EUR 10bn
€ 10bn

Vestas’ value chain World leading wind energy solutions with a comprehensive range of capabilities
3
Project
planning &
design
Ensuring high quality
project planning and
design helps us to
maximise total return on
investment from project
start up.
Vestas’ versatile and agile
procurement and
manufacturing concept
provides competitive
advantage.
Vestas possesses
construction and
installation expertise to
coordinate cooperative
efforts or assumes full
responsibility for wind
power plant construction
and commissioning.
Vestas provides
preventative and
corrective service and
maintenance for
consistently optimised
performance.
Procurement &
manufacturing
Construction &
installation
Operation &
maintenance
Research &
Development
Vestas has a strong
focus on continuously
developing and
optimising to lower the
cost of energy thereby
meeting customer needs
and remaining the
technology leader in the
wind power industry

Vestas ServicesBusiness areas
4
Optimise your business with
upgrades designed to
improve the performance of
your wind park.
Parts & RepairMaintenance
Partnering
Fleet
Optimisation
Benefit from a truly global
supply chain and a strong
local presence to decrease
your Operations and
Maintenance (O&M) cost.
Maximise the availability
of your wind park with the
most experienced
maintenance partner in
the industry.
Smart Data
Benefit from our digital
solutions, delivering greater
predictability, increased
renewable energy
production, more efficient
operations, and better
integration with energy grids.

5
Technology strategy and solutions Technology evolution
V117-4.2 MWV110-2.0 MW V112-3.0 MW V116-2.0 MW V117-3.3 MW V120-2.0 MW V126-3.3 MW V136-3.45 MW V136-4.2 MW V150-4.2 MW
(2018) (2018) (2018)(2018)

Versatile solutions for any wind energy project Ongoing innovation from the undisputed global wind leader
6
Installed*
40 GW
YEAR OF
PROTOTYPE
PRODUCT-
CAPACITY
Installed**
17 GW
* As of 9 November 2017, including V80-1.8/2.0 MW™ and V90-1.8 MW™
** As of 9 November 2017, Including V112-3.0 MW™
Not shown: V90-3.0 MW®, constituting 9 GW
Not shown: ‘Other’ turbine models constituting 23 GW.
2 MW PLATFORM
2004 2009 2014
V90-2.0
MW®
V100-
2.0 MW®
V110-
2.0 MW®
2017 2018
V116
2.0 MW™
V120
2.0 MW™
4 MW PLATFORM
2014 2013 2013 2018
V105-
3.45 MW™V112-
3.45 MW™**V117-
3.45 MW™V126-
3.45 MW™
2016
V136-
3.45 MW™
V117-
4.2 MW™
2013 2018
V136-
4.2 MW™
2018
V150-
4.2 MW™

Wind is growing as costs are coming downWind energy continues to increase its competitiveness
Levelised cost of energy, USD/MWh
Source: Bloomberg New Energy Finance 2018
Globally, costs have fallen • 43%
since 2009 and made has made
wind an economically competitive
power source
Levelised cost of energy (LCOE) •
analysis for 2016 showing onshore
wind energy to be fully competitive
against new build gas and coal in
many parts of the world.
Equally, offshore wind is now •
showing it’s true potential with
record low auction bids
7

Multinationals turning to windTechnological advancements making wind ever-more competitive
8
0 Michael Liebreich Vestas Board Meeting, Madrid, 18 September 2015 @MLiebreich
Images: Various; Bloomberg New Energy
Finance
SELECTED COMMERCIAL BUILDERS OR BUYERS OF RENEWABLE ENERGY
Financial
Services
Retailers and
FMCG
Primary
Industry Manufacturers
Media and
Software
Source: Bloomberg New Energy Finance
Selected commercial
builders or buyers of
renewable energy
Financial
Services
Media and
Software
Retailers and
FMCGManufacturers
Primary Industry

Reducing the cost of energy is at the core of our strategyLowering the levelised cost of energy (LCOE) faster than the market average
Vestas strategy
• At the core of our strategy is lowering the cost of energy.
It is our ambition to lower it faster than the market average.
• It is our license to operate, as we always need to prove to customers,
investors, policy makers and consumers that wind is the obvious choice.
9

Wind, from niche to mainstream
10
Onshore wind is today
one of the most cost
competitive energy
sources
The global average LCOE
for onshore wind has
droped from 96 $/MWh in
2009 to 55 $/MWh in
2018.
A reduction of 43%.
Onshore wind LCOE,
$/MWh, 2009-2018
Source: Bloomberg New Energy Finance 2018

Vestas LCOE development 2014-2021e
11
Expected LCOE development, onshore wind, Northern Europe
EUR/MWh
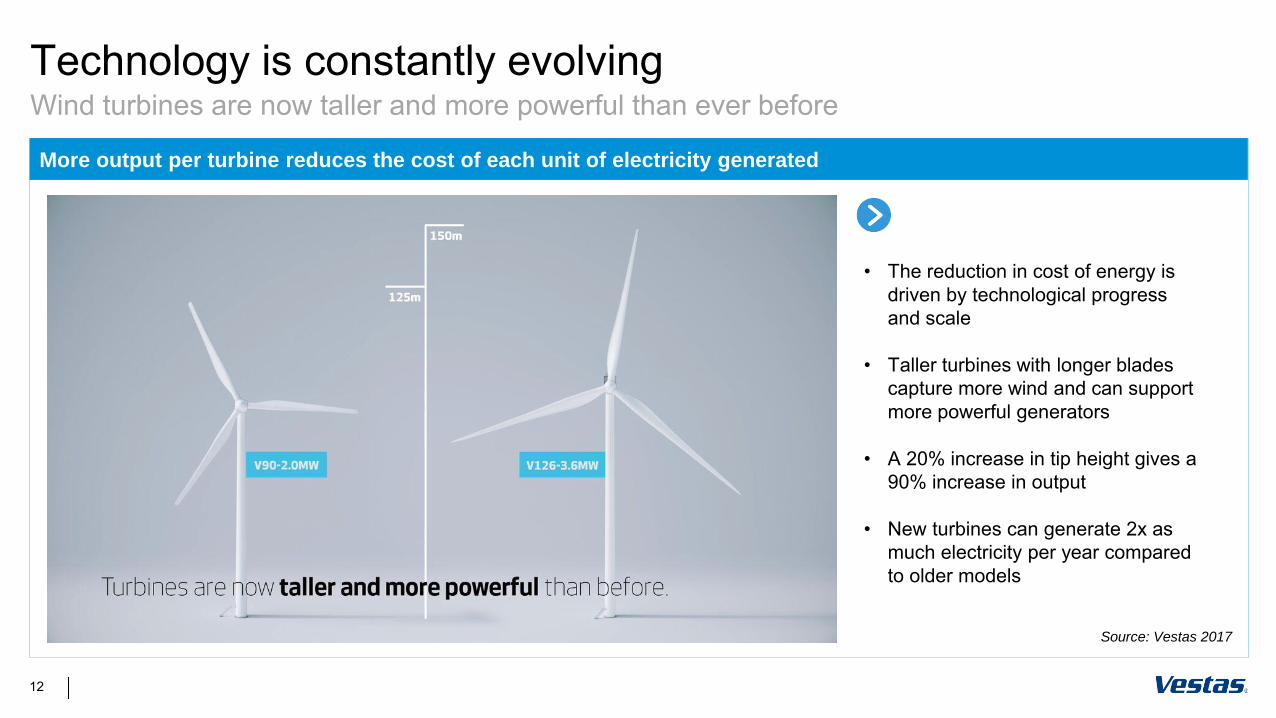
Technology is constantly evolvingWind turbines are now taller and more powerful than ever before
More output per turbine reduces the cost of each unit of electricity generated
The reduction in cost of energy is •
driven by technological progress
and scale
Taller turbines with longer blades •
capture more wind and can support
more powerful generators
A • 20% increase in tip height gives a
90% increase in output
New turbines can generate • 2x as
much electricity per year compared
to older models
Source: Vestas 2017
12

The industry has to continue to develop better technologyCost will have to continue to go down for the benefit of consumers
Technology and cost
In simple terms, the •
reduction in cost of energy
will continue to be driven by
technological progress and
scale
Rating and rotor size is •
expected to grow further
enabling increased efficiency
and lower cost of wind
energy
13

In conclusion…
Wind is today mainstream and cost competitive
Technology developments and scale is driving down cost
Long-term and predictable policy frameworks as well as
system flexibility will be key to get the best out of wind
1
2
3

4 MW platform
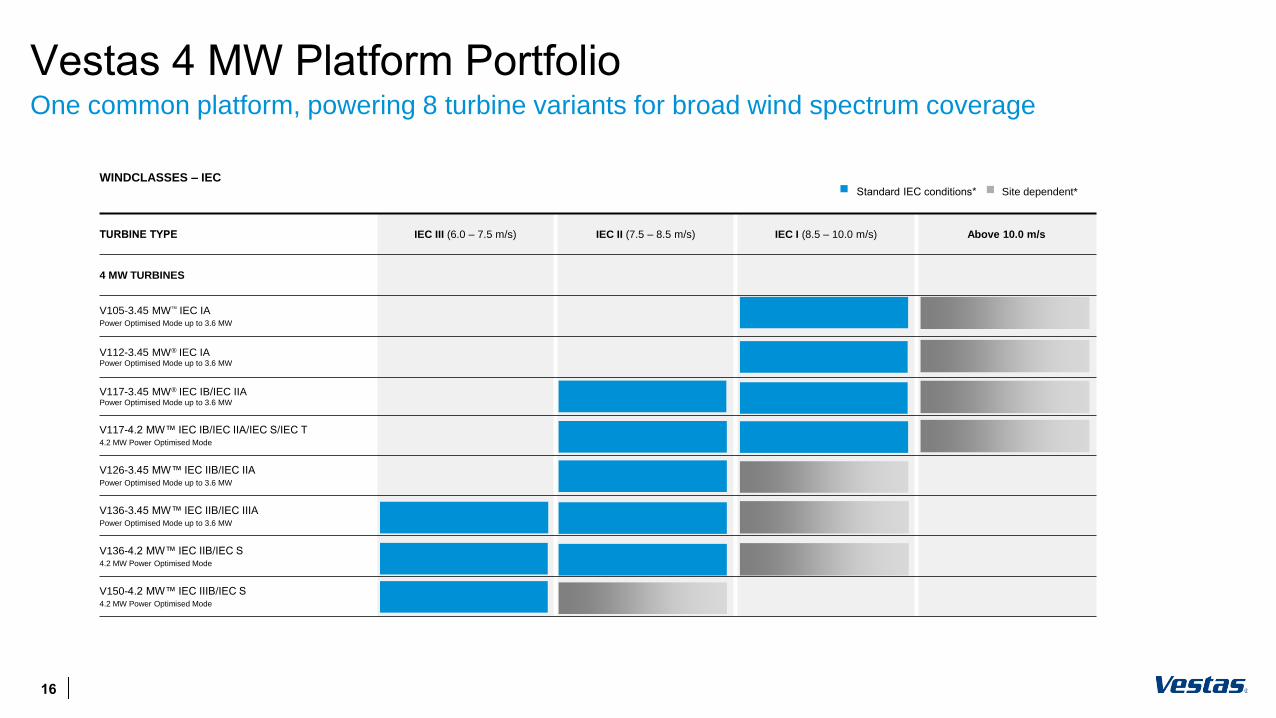
Vestas 4 MW Platform PortfolioOne common platform, powering 8 turbine variants for broad wind spectrum coverage
WINDCLASSES – IEC
TURBINE TYPE IEC III (6.0 – 7.5 m/s) IEC II (7.5 – 8.5 m/s) IEC I (8.5 – 10.0 m/s) Above 10.0 m/s
4 MW TURBINES
V105-3.45 MW IEC IAPower Optimised Mode up to 3.6 MW
V112-3.45 MW® IEC IA Power Optimised Mode up to 3.6 MW
V117-3.45 MW® IEC IB/IEC IIAPower Optimised Mode up to 3.6 MW
V117-4.2 MW™ IEC IB/IEC IIA/IEC S/IEC T4.2 MW Power Optimised Mode
V126-3.45 MW™ IEC IIB/IEC IIAPower Optimised Mode up to 3.6 MW
V136-3.45 MW™ IEC IIB/IEC IIIAPower Optimised Mode up to 3.6 MW
V136-4.2 MW™ IEC IIB/IEC S4.2 MW Power Optimised Mode
V150-4.2 MW™ IEC IIIB/IEC S4.2 MW Power Optimised Mode
Standard IEC conditions* Site dependent*
16

Controlled Unfolding of Platform PotentialMore Annual Energy production from same trusted platform
3.3 MW 3.45 MW
Wind
Tropical / strong
wind
3.45/4.2 MW3.0 MW
Upgrade to • 3.3 MW nominal
rating
New rotors: • 105 m, 117 m, 126 m
Upgrade to • 3.45 MW nominal
rating
New rotor: • 136 m
Up to • 3.6 MW Power Optimised
Mode
• First Vestas 3 MW WTG Addition of • 4.0 MW nominal
rating variants
New rotor: • 150 m
New segment: Tropical class•
4.2 • MW Power Optimised Mode
Platform Namo updated to • 4 MW
V105-3.3 MW™
2012 /2013 2017
V112-3.0 MW™
V112-3.3 MW™
V117-3.3 MW™
V126-3.3 MW™
V105-3.45 MW™V112-3.45 MW®
V117-3.45 MW®
V126-3.45 MW®
V136-3.45 MW®
V105-3.45 MW™V112-3.45 MW®V117-3.45 MW®
V126-3.45 MW®
V136-4.2 MW™
V117-4.2 MW™
V150-4.2 MW™
V136-3.45 MW®
20152010
High wind
Announcement year
Medium wind
Low wind Up to
56% AEP
since 2010*
NEW in
2017V117-4.2 MW
V136-4.2 MW
V150-4.2 MW
Double digit
AEP gains
across wind
classes
2 years 2 years 2 years*Depending on wind class
17

Increased Annual Energy ProductionLatest upgrade enables double-digit AEP gains in all standard wind classes
*AEP=Annual Energy Production. V150-4.2 MW™ with 4.2 MW Power Optimised Mode in IEC III Compared to V136-
3.45 MW™ Actual figures depend on site specific conditions.
110m
120m
130m
3.0MW 3.45MW3.3MW
V126-3.3 MW®
V117-3.3 MW®
V112-3.3 MW®V112-3.0 MW®
Rotor size
Rating
IEC III
IEC II
IEC I
140m
150m
V117-3.45 MW®
V126-3.45 MW®
V136-3.45 MW®
V150-4.2 MW™
V136-4.2 MW™
V117-4.2 MW™
+21%
AEP*
4.0 MW
18

Versatile modular approach to new developmentsContinuous steps for improving sound and power performance
Maximum
104.7
dB(A)
V105-3.45MW
105 m rotor
Maximum
105.4
dB(A)
V112-3.45MW
112 m rotor
Maximum
106.0
dB(A)
V117-4.0MW
Maximum
106.8
dB(A)
V117-3.45MW
117 m rotor
Maximum
104.4dB(A)
Maximum
107.3
dB(A)
V126-3.45MW HTq
V126-3.45MW LTq
126 m rotor
The V136-4.0MW has
been developed using a
higher torque gear box.
V136-4.0MW
Maximum
105.5dB(A)
V136-3.45MW
Maximum
103.9
dB(A)
136 m rotor
V150-4.0MW
150 m rotor
Maximum
104.9
dB(A)
19
Ge
arb
ox
ge
ne
rato
r u
pg
rad
es

V136-4.2 MW™ Turbine VariantHigh production at industry leading sound power levels
More Torque
Upgraded gearbox powering lower rotor rotational speed, enabling enhanced project specific siteability
More Power
Upgraded generator to 4.0 MW nominal rating with 4.2 MW Power Optimised Mode
Tower Portfolio
Accommodating 150-230 m tip height. Option for site specific
towers
Up to 11 %
AEP Increase*
*Compared to V136-3.45 MW. Depending on wind condition
**-1.6 dB(A) compared to V136-3.45 MW
Maximum
103.9 dB(A)*Low Sound Power
Segment leading sound power level at 103.9 dB(A)
Segment leading low
Sound Power Level
Strong siteability with
medium capabilities
20

V150-4.2 MW™ Turbine VariantHighest yielding onshore low wind turbine in the industry
Larger Swept Area
Blade length increased to 73.7 m using Vestas most advanced aerofoil design and materials
Higher Energy Production
Combined with increase in capacity factor
Tower Portfolio
Site specific tower portfolio - tip heights ranging from 180-241 m, leveraging industry leading 166 m hub height
Up to 21%
AEP Increase*
*Compared to V136-3.45 MW. Depending on wind condition
Maximum
104.9 dB(A)Reduced Sound Power Levels
Segment leading energy production combined with very low 104.9 dB(A)
Segment leading Energy
Production
Up to 241 m tip height
17,671 m²
swept area, +22%
21

Siteability of the V136-4.2 MW and V150-4.2 MWOperating strategy for maximizing siting and power performance
Application Space V136 4.0MW Application Space V150 4.2MW
V136-4.0 MW V136-4.2 MW IECS (8.0m/sec) V150-4.0 MW V150-4.2 MW IECS (7.0m/sec)
22

Main takeaways
23
✓ Proven platform & up to 21% AEP growth
✓ High selection of towers… 150m up to 230m tip height
✓ Covering low, medium & high winds
✓ Flexible siteability
✓ Ready for shipment in spring 2019