presentation examples for class 7 revenue models
TRANSCRIPT
Presentation examples used in Class 7 - Revenue Models
The Lean LaunchPad
07/02/12
Optical Equipment Revenue Model Example
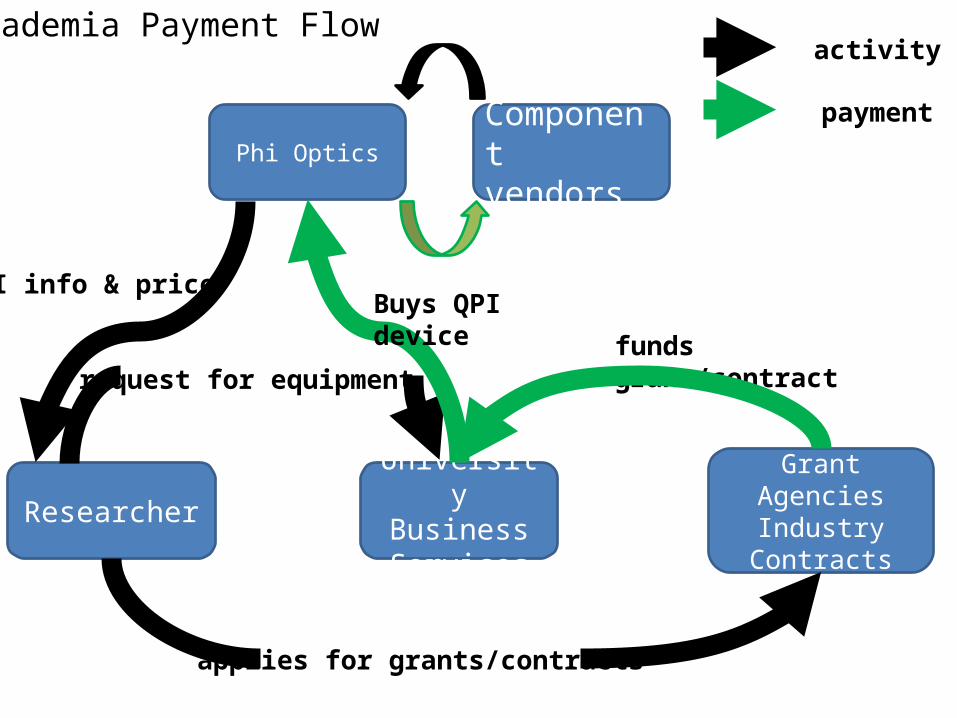
Phi OpticsComponent vendors
University Business Services
Researcher Grant AgenciesIndustry Contracts
applies for grants/contracts
funds grant/contractrequest for equipment
QPI info & price
activity
payment
Academia Payment Flow
Buys QPI device
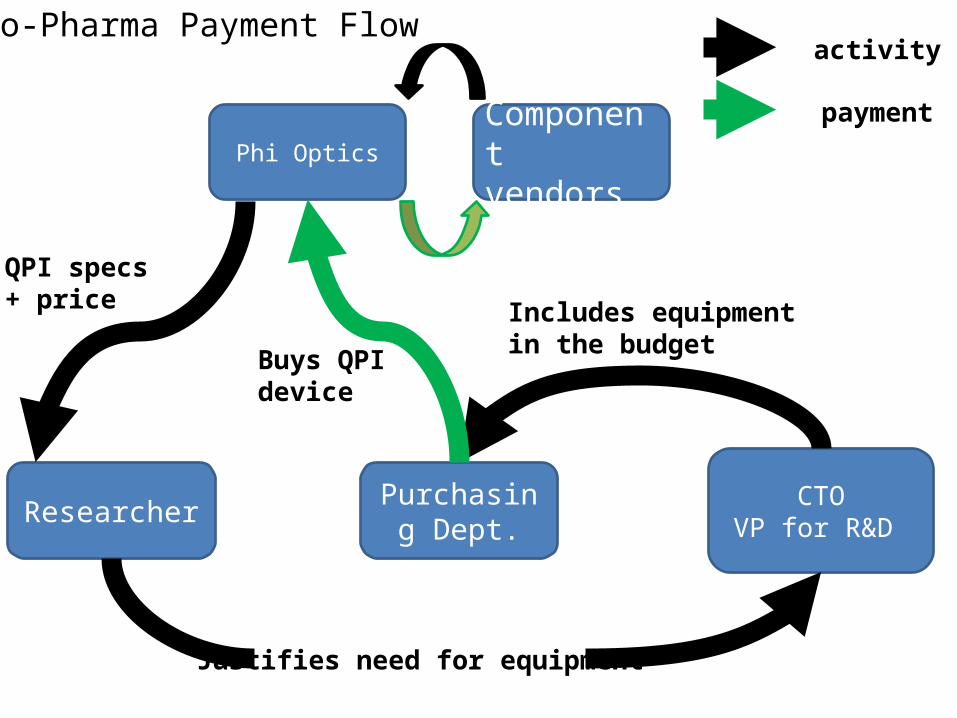
Phi OpticsComponent vendors
Purchasing Dept.Researcher CTO
VP for R&D
Justifies need for equipment
Includes equipment in the budget
QPI specs + price
activity
payment
Bio-Pharma Payment Flow
Buys QPI device
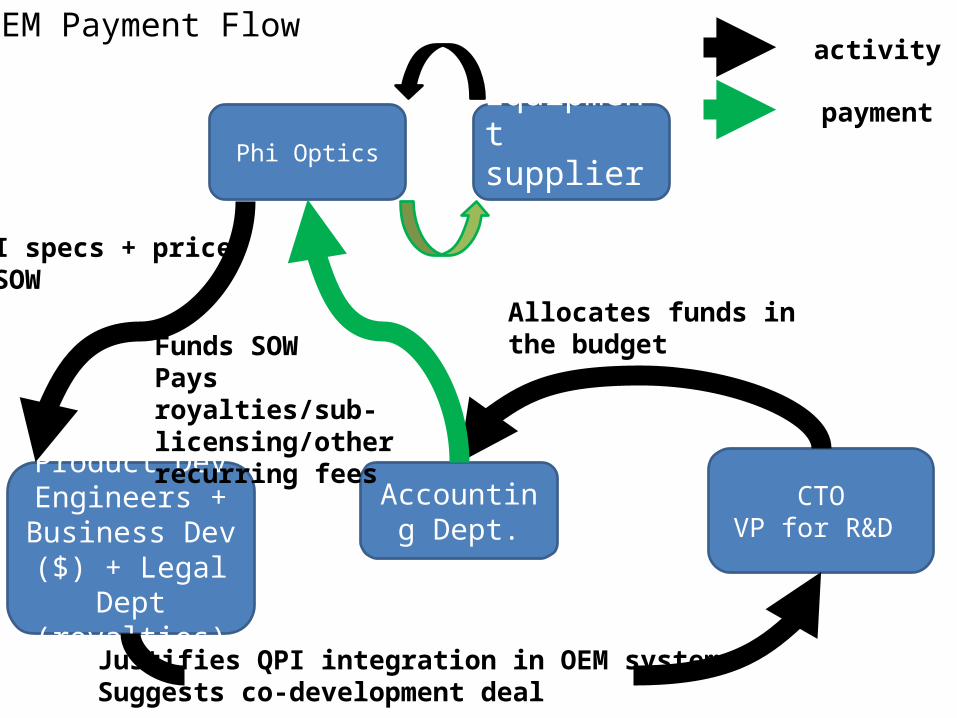
Phi OpticsEquipment suppliers
Accounting Dept.
Product Dev Engineers +
Business Dev ($) + Legal Dept (royalties)
CTOVP for R&D
Justifies QPI integration in OEM systemSuggests co-development deal
Allocates funds in the budget
QPI specs + price+ SOW
activity
payment
OEM Payment Flow
Funds SOWPays royalties/sub-licensing/other recurring fees
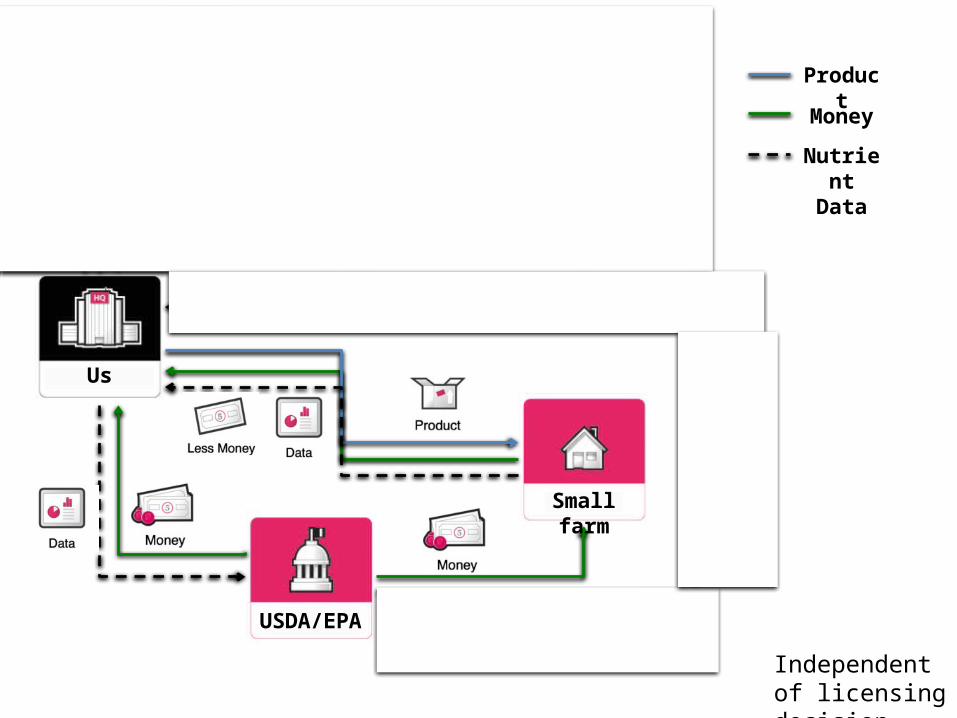
Nitrate SensorRevenue Model Example
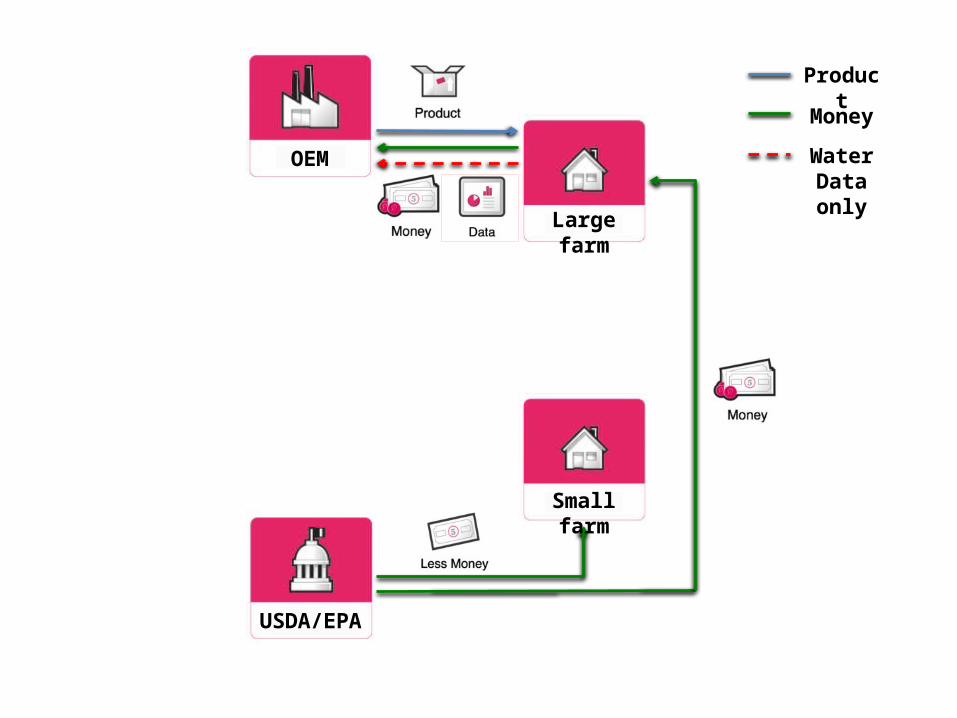
OEM
Large farm
USDA/EPA
Small farm
Product
Money
Water Data only

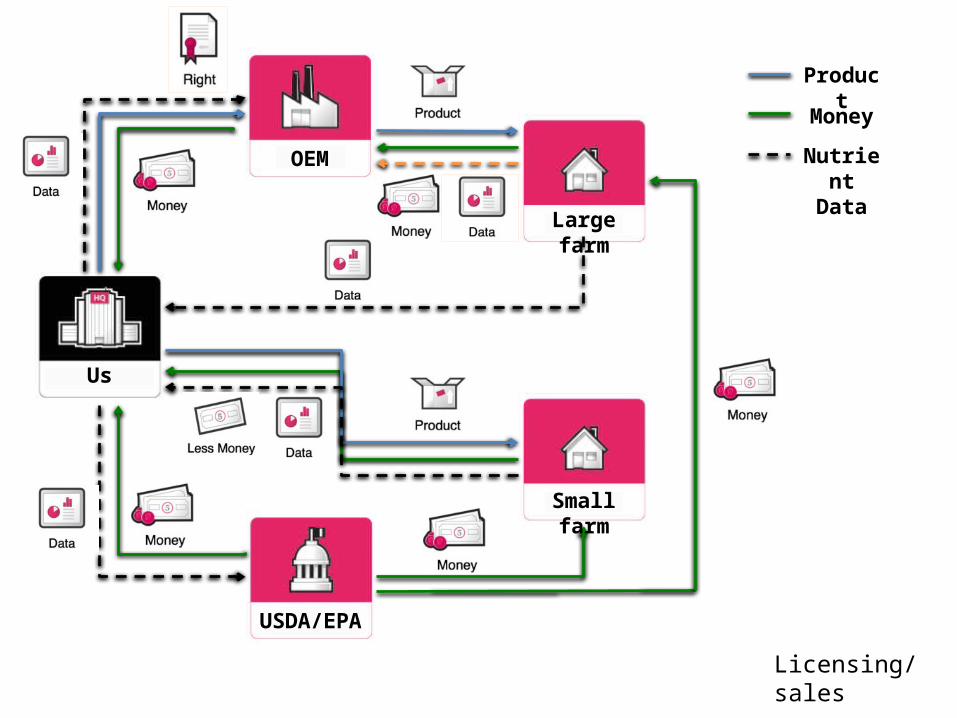
OEM
Us
Large farm
USDA/EPA
Small farm
Product
Money
Nutrient Data
Product sales
OEM
Us
Large farm
USDA/EPA
Small farm
Product
Money
Nutrient Data
Licensing/sales
OEM
Us
Large farm
USDA/EPA
Small farm
Product
Money
Nutrient Data
Independent of licensing decision
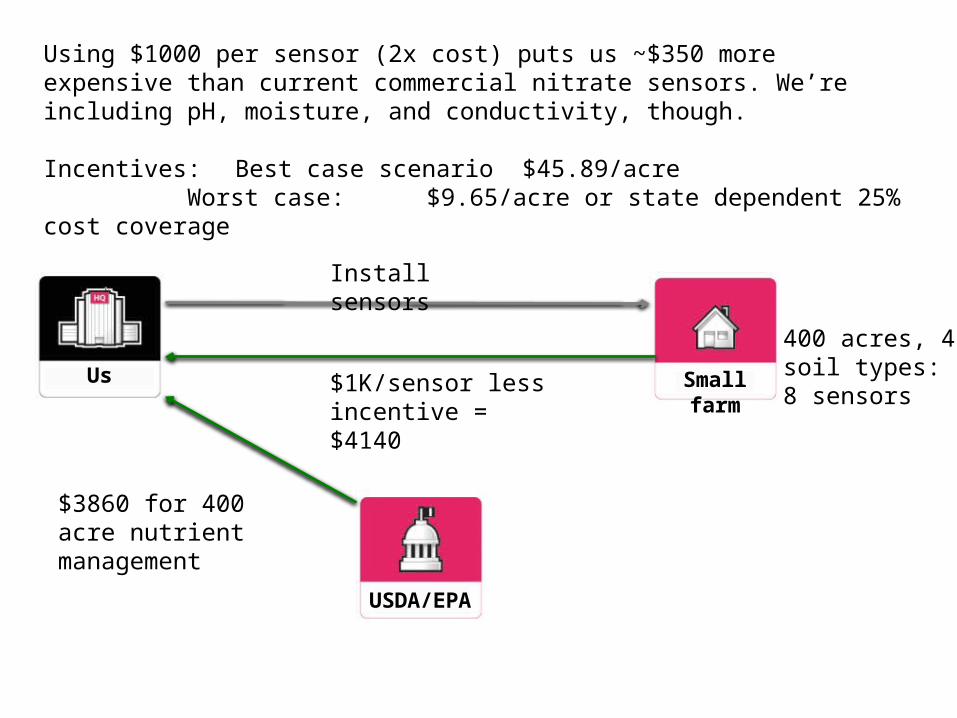
Us
USDA/EPA
Small farm
400 acres, 4 soil types: 8 sensors
Install sensors
$1K/sensor less incentive = $4140
Using $1000 per sensor (2x cost) puts us ~$350 more expensive than current commercial nitrate sensors. We’re including pH, moisture, and conductivity, though.
Incentives: Best case scenario $45.89/acreWorst case: $9.65/acre or state dependent
25% cost coverage
$3860 for 400 acre nutrient management
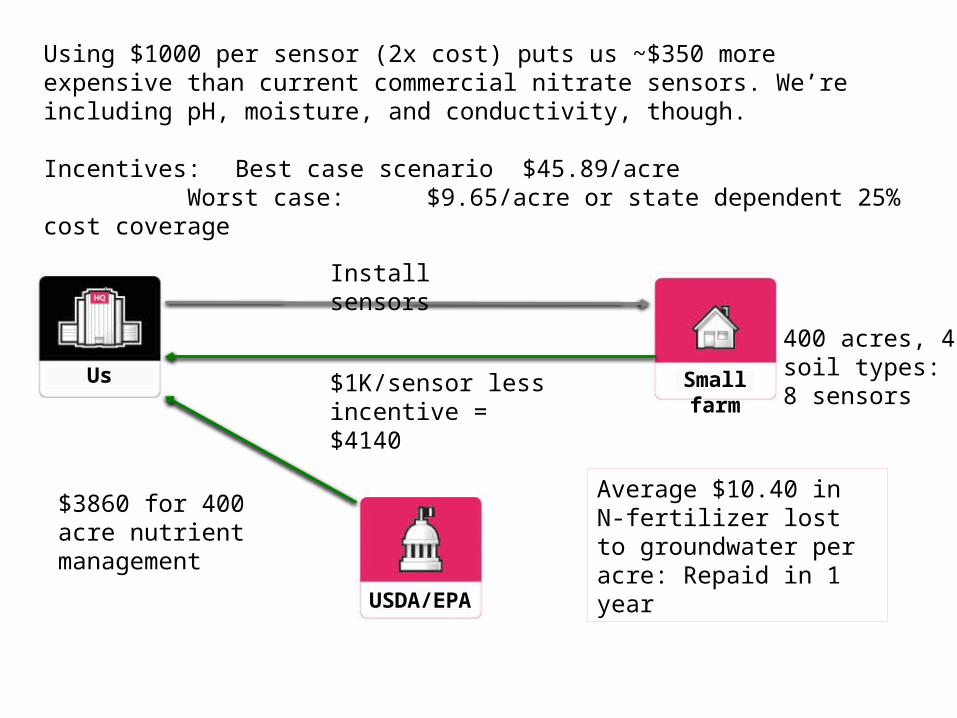
Average $10.40 in N-fertilizer lost to groundwater per acre: Repaid in 1 year
Bio-Based Chemical IntermediatesRevenue Model Example
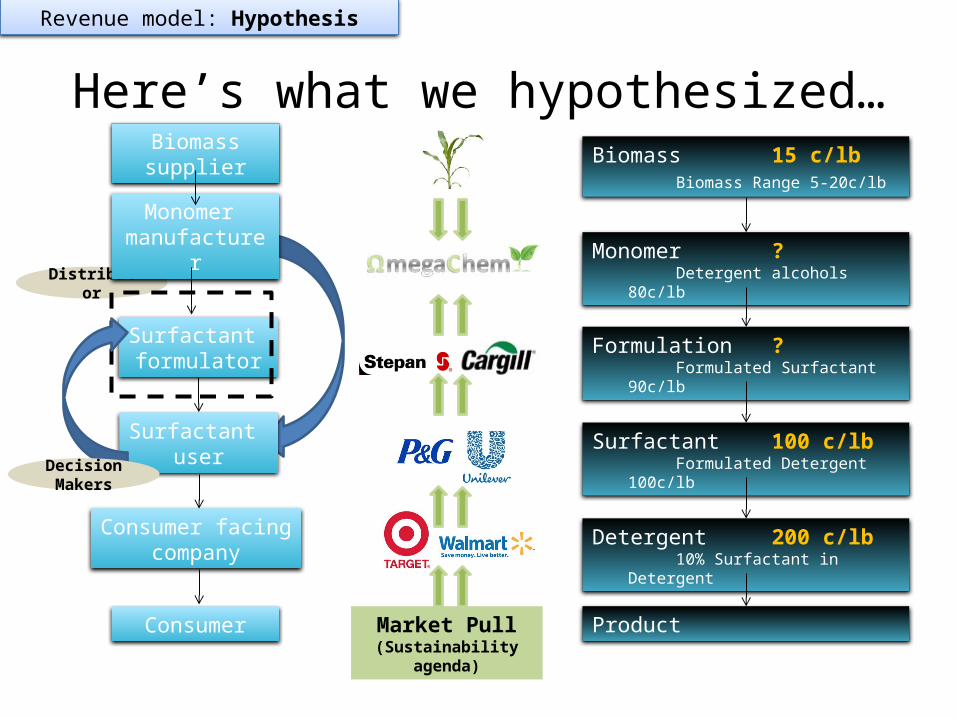
Here’s what we hypothesized…
Distributor
Monomer manufacturer
Surfactant formulator
Surfactant user
Consumer facingcompany
Consumer Market Pull(Sustainability agenda)
Revenue model: Hypothesis
Biomass supplier Biomass 15 c/lbBiomass Range 5-20c/lb
Monomer ?Detergent alcohols 80c/lb
Formulation ?Formulated Surfactant
90c/lb
Surfactant 100 c/lbFormulated Detergent
100c/lb
Detergent 200 c/lb10% Surfactant in
Detergent
Product
Decision Makers
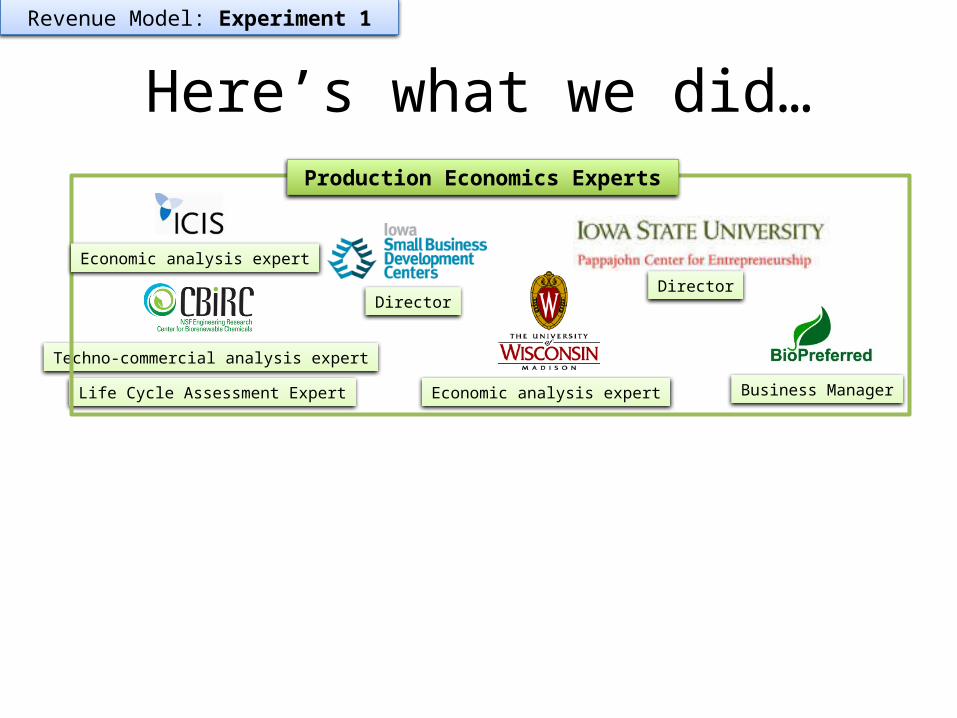
Here’s what we did…
Techno-commercial analysis expert
Revenue Model: Experiment 1
Life Cycle Assessment Expert Economic analysis expert
DirectorDirector
Production Economics Experts
Business Manager
Economic analysis expert

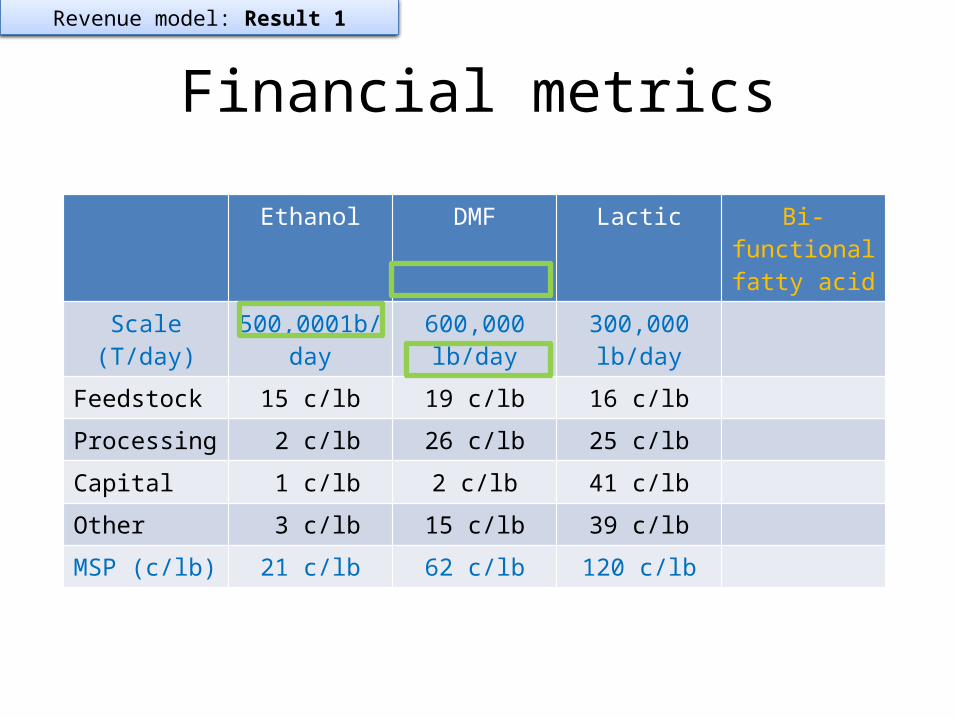
Financial metrics
Ethanol DMF Lactic Bi-functional fatty acid
Scale (T/day) 500,0001b/day
600,000 lb/day
300,000 lb/day
Feedstock 15 c/lb 19 c/lb 16 c/lb
Processing 2 c/lb 26 c/lb 25 c/lb
Capital 1 c/lb 2 c/lb 41 c/lb
Other 3 c/lb 15 c/lb 39 c/lb
MSP (c/lb) 21 c/lb 62 c/lb 120 c/lb
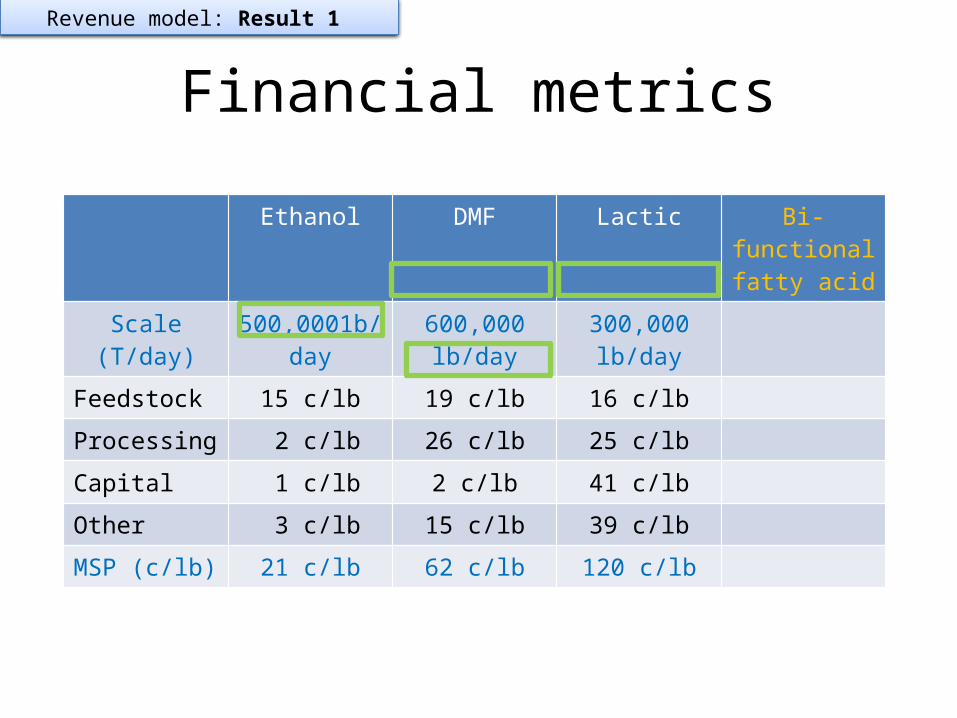
Revenue model: Result 1
Financial metrics
Ethanol DMF Lactic Bi-functional fatty acid
Scale (T/day) 500,0001b/day
600,000 lb/day
300,000 lb/day
Feedstock 15 c/lb 19 c/lb 16 c/lb
Processing 2 c/lb 26 c/lb 25 c/lb
Capital 1 c/lb 2 c/lb 41 c/lb
Other 3 c/lb 15 c/lb 39 c/lb
MSP (c/lb) 21 c/lb 62 c/lb 120 c/lb
Revenue model: Result 1
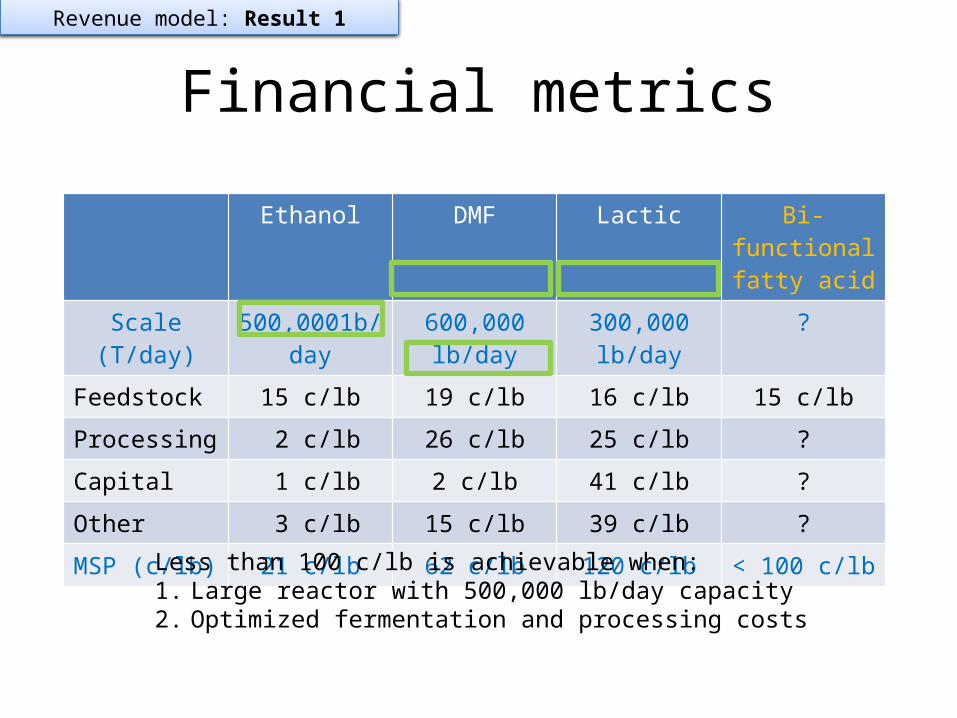
Financial metrics
Ethanol DMF Lactic Bi-functional fatty acid
Scale (T/day) 500,0001b/day
600,000 lb/day
300,000 lb/day
?
Feedstock 15 c/lb 19 c/lb 16 c/lb 15 c/lb
Processing 2 c/lb 26 c/lb 25 c/lb ?
Capital 1 c/lb 2 c/lb 41 c/lb ?
Other 3 c/lb 15 c/lb 39 c/lb ?
MSP (c/lb) 21 c/lb 62 c/lb 120 c/lb < 100 c/lb
Revenue model: Result 1
Less than 100 c/lb is achievable when:1. Large reactor with 500,000 lb/day capacity2. Optimized fermentation and processing costs
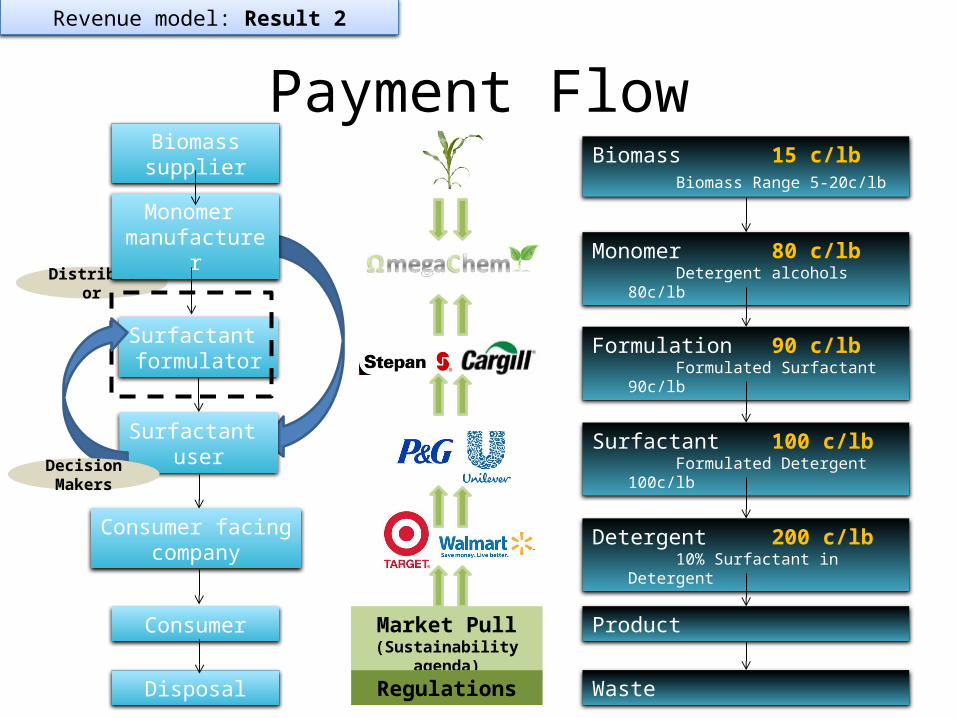
Payment Flow
Distributor
Monomer manufacturer
Surfactant formulator
Surfactant user
Consumer facingcompany
Consumer Market Pull(Sustainability agenda)
Revenue model: Result 2
Biomass supplier Biomass 15 c/lbBiomass Range 5-20c/lb
Monomer 80 c/lbDetergent alcohols 80c/lb
Formulation 90 c/lbFormulated Surfactant
90c/lb
Surfactant 100 c/lbFormulated Detergent
100c/lb
Detergent 200 c/lb10% Surfactant in
Detergent
Product
Decision Makers
Disposal WasteRegulations
Payment Flows Example
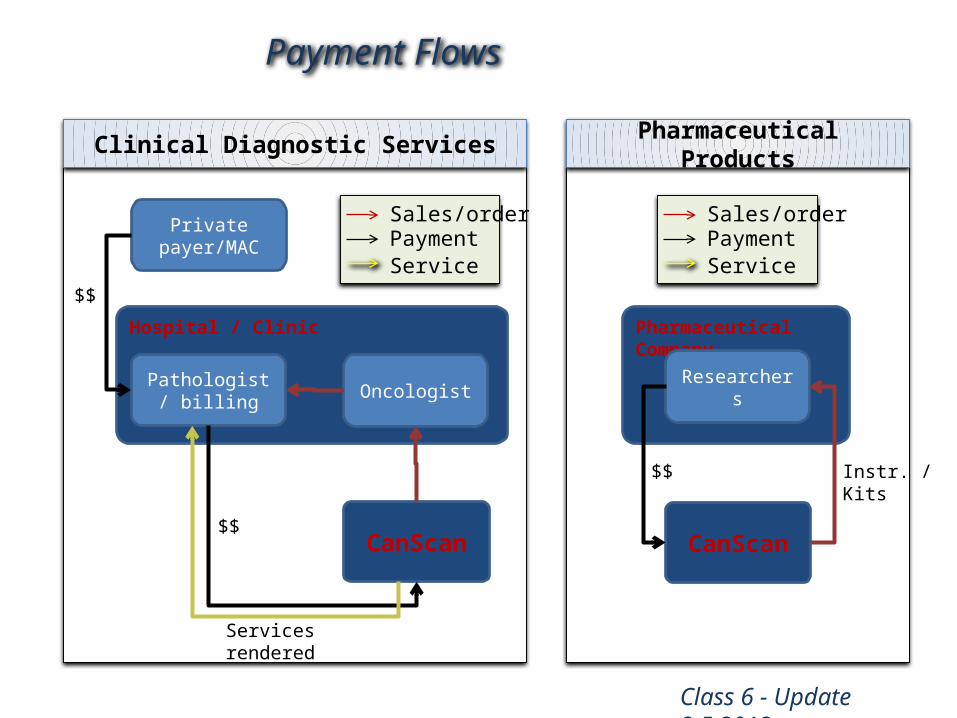
CanScan Payment Flows
Class 6 - Update 3.5.2012
CanScan
Hospital / Clinic
Oncologist
Private payer/MAC
Pathologist/ billing
Sales/orderPaymentService
Services rendered
$$
$$
Clinical Diagnostic Services
CanScan
Pharmaceutical Company
Researchers
Sales/orderPaymentService
$$
Pharmaceutical Products
Instr. /Kits
Medical DevicePricing Example
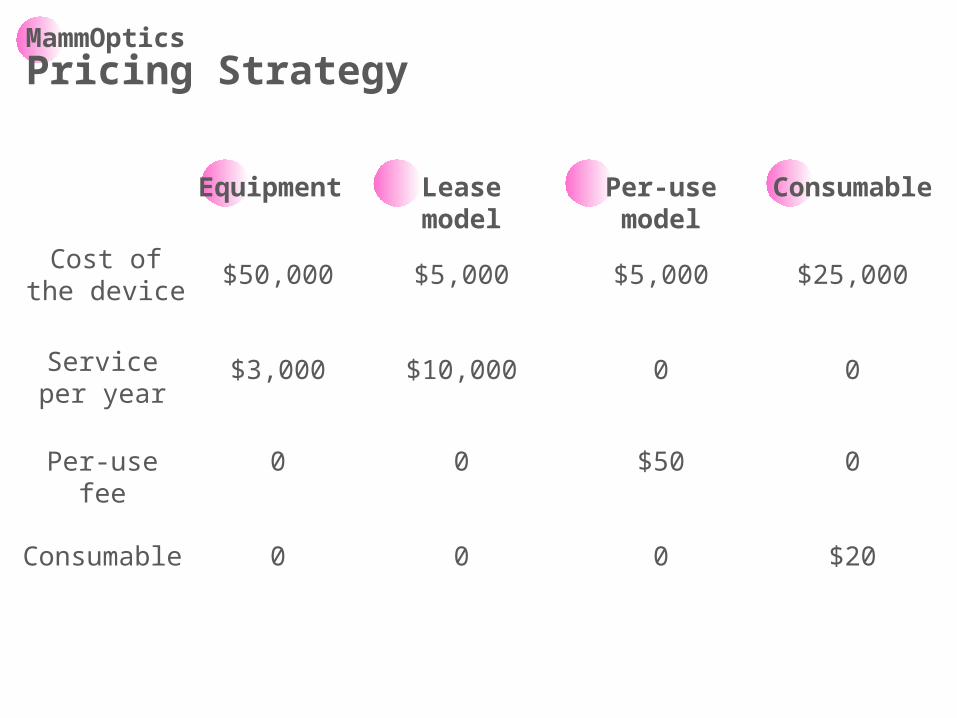
MammOpticsPricing Strategy
Equipment Lease model
Per-use model
Consumable
Cost of the device
Service per year
Per-use fee
Consumable
$50,000
$3,000
0
0
$5,000
$10,000
0
0
$5,000
0
$50
0
$25,000
0
0
$20
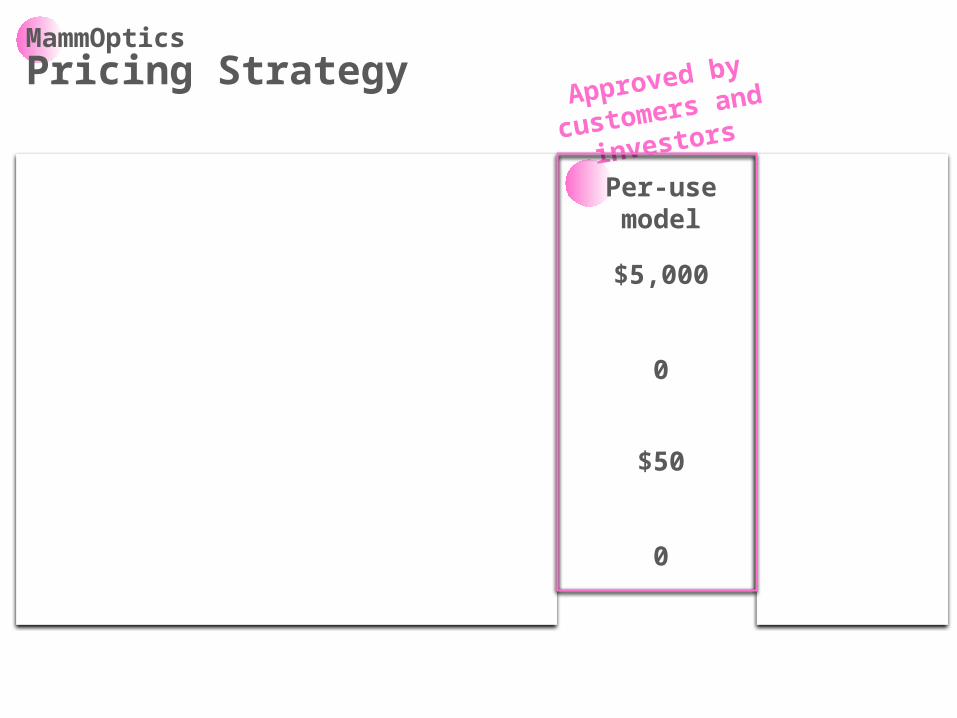
MammOpticsPricing Strategy
Equipment Lease model
Per-use model
Consumable
Cost of the device
Service per year
Per-use fee
Consumable
$50,000
$3,000
0
0
$5,000
$10,000
0
0
$5,000
0
$50
0
$25,000
0
0
$20
Approved by
customers and
investors
GrapheneRevenue Model Example
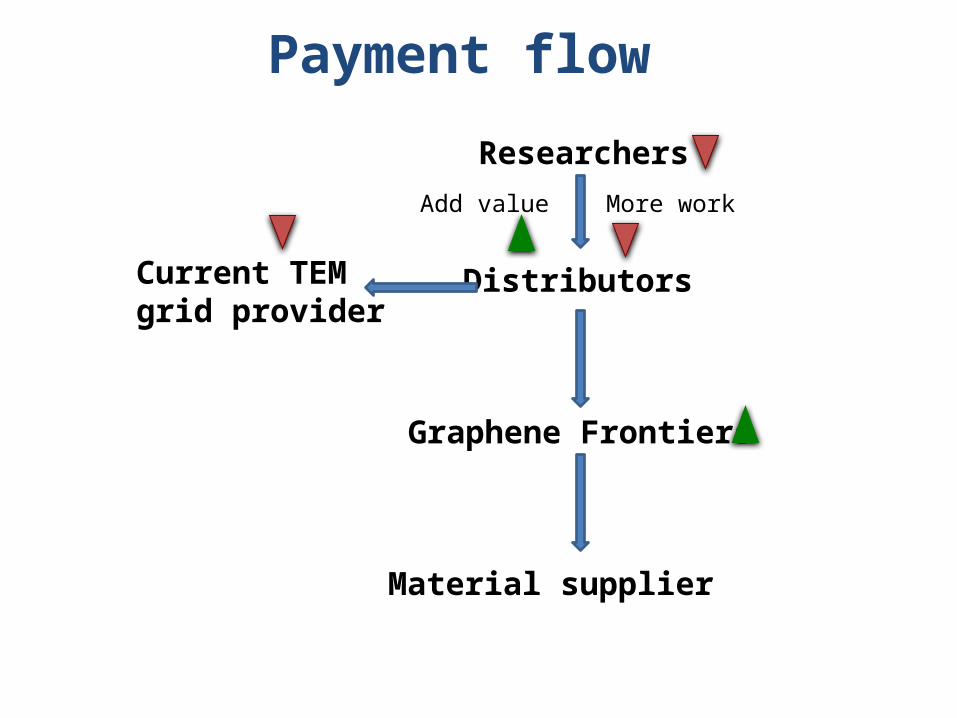
Distributors
Researchers
Graphene Frontiers
Current TEM grid provider
More workAdd value
Material supplier
Payment flow
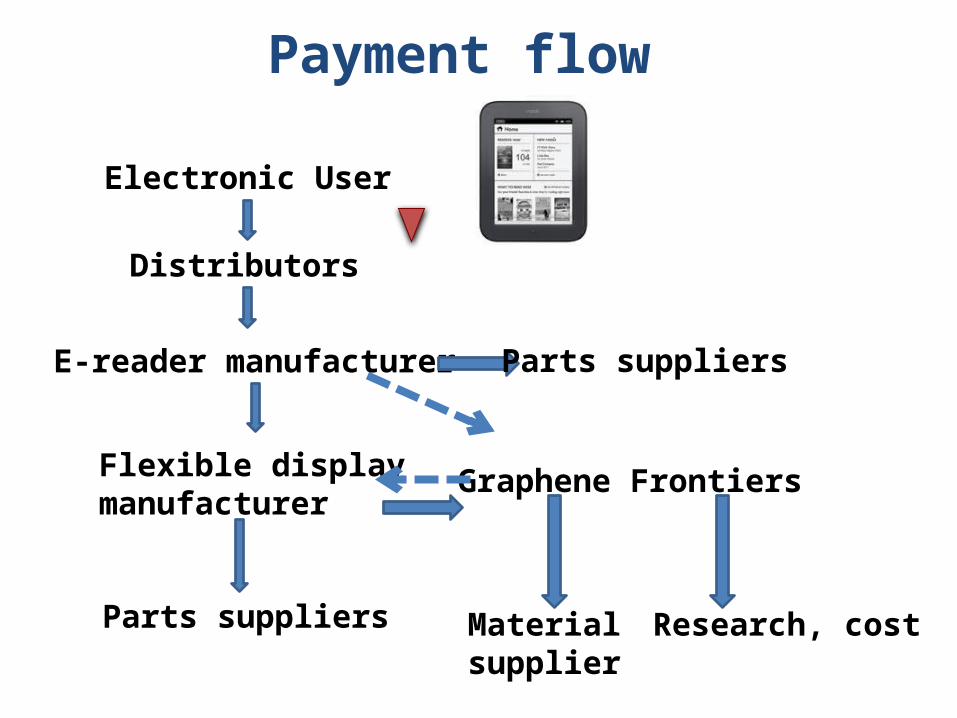
Distributors
Graphene Frontiers
Material supplier
Flexible display manufacturer
Electronic User
Research, cost
E-reader manufacturer Parts suppliers
Parts suppliers
Payment flow
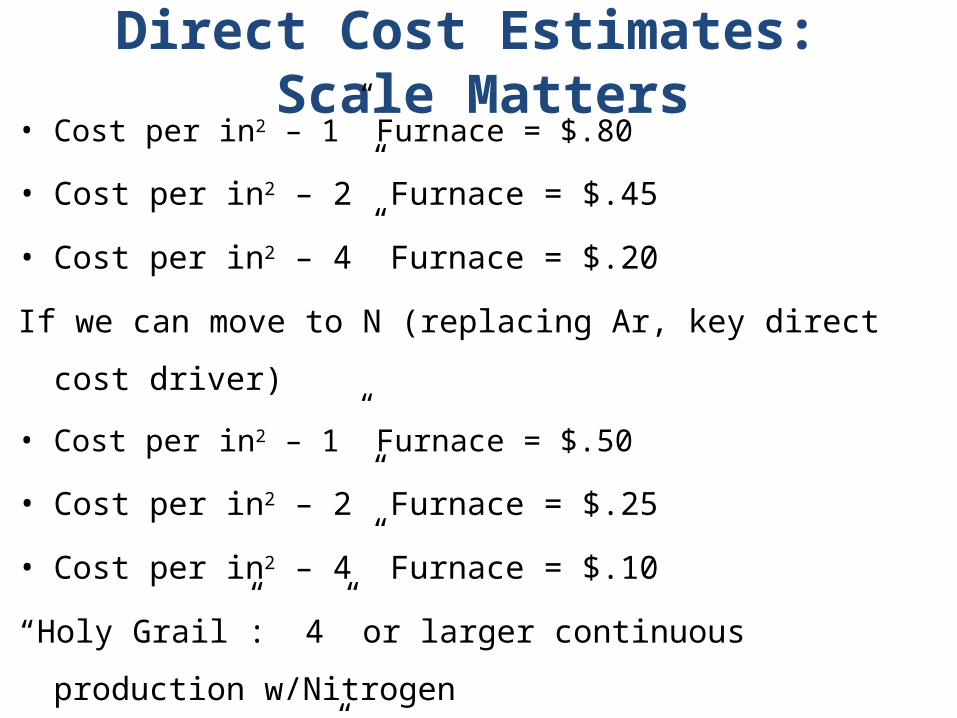
Direct Cost Estimates: Scale Matters• Cost per in2 – 1” Furnace = $.80
• Cost per in2 – 2” Furnace = $.45
• Cost per in2 – 4” Furnace = $.20
If we can move to N (replacing Ar, key direct cost driver)
• Cost per in2 – 1” Furnace = $.50
• Cost per in2 – 2” Furnace = $.25
• Cost per in2 – 4” Furnace = $.10
“Holy Grail”: 4” or larger continuous production w/Nitrogen
Cost per in2 – 4” Furnace, Batch/Continuous = … $.05
SensorPricing Tactics Example
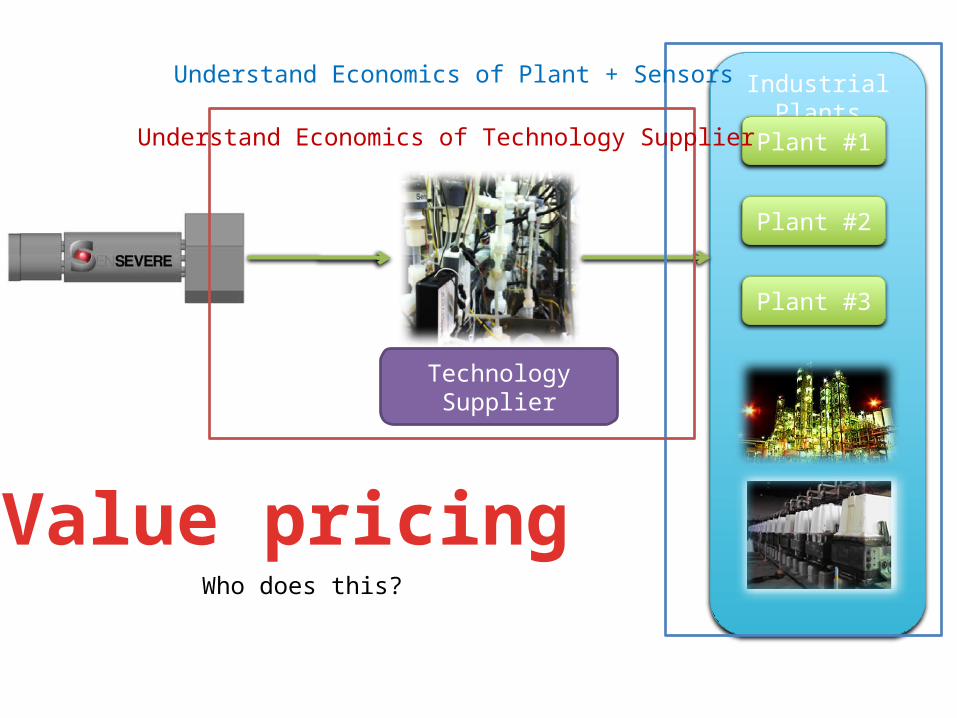
Technology Supplier
Industrial Plants
Plant #1
Plant #2
Plant #3
Understand Economics of Plant + Sensors
Understand Economics of Technology Supplier
Value pricingWho does this?
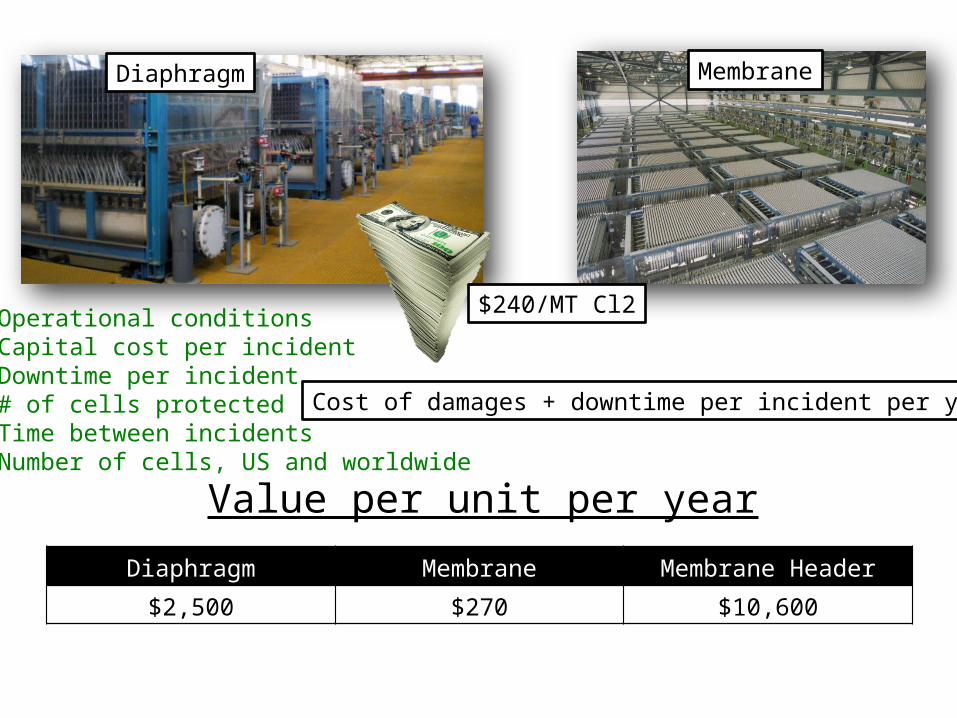
32Diaphragm Membrane
$240/MT Cl2
Cost of damages + downtime per incident per year
Operational conditions Capital cost per incident Downtime per incident # of cells protected Time between incidents Number of cells, US and worldwide
Diaphragm Membrane Membrane Header
$2,500 $270 $10,600
Value per unit per year
33
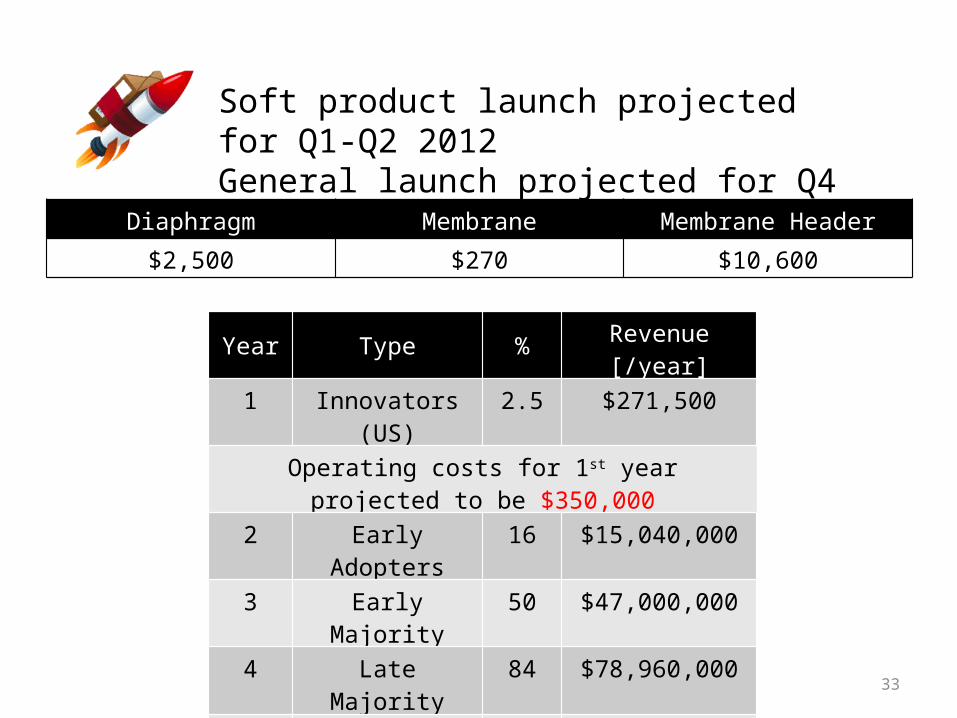
Soft product launch projected for Q1-Q2 2012General launch projected for Q4 2012
Year Type % Revenue [/year]1 Innovators (US) 2.5 $271,500
Operating costs for 1st year projected to be $350,000
2 Early Adopters 16 $15,040,000
3 Early Majority 50 $47,000,000
4 Late Majority 84 $78,960,000
Full Penetration 100 $94,000,000
Diaphragm Membrane Membrane Header
$2,500 $270 $10,600
Medical DeviceRevenue Model Example
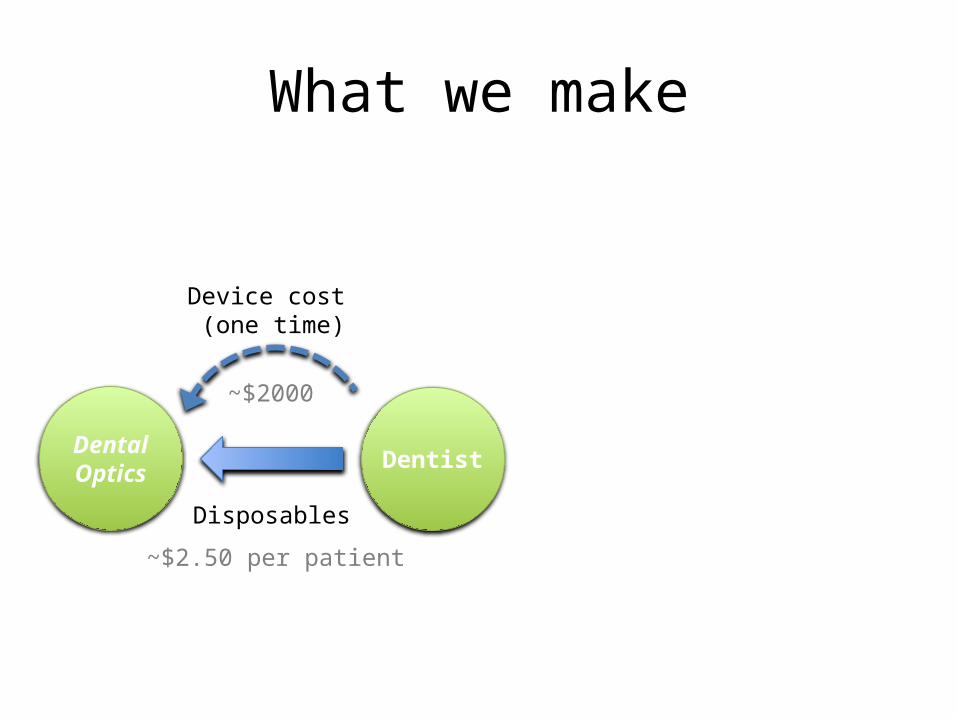
What we make
DentistDentalOptics
~$2000
Device cost (one time)
~$2.50 per patient
Disposables
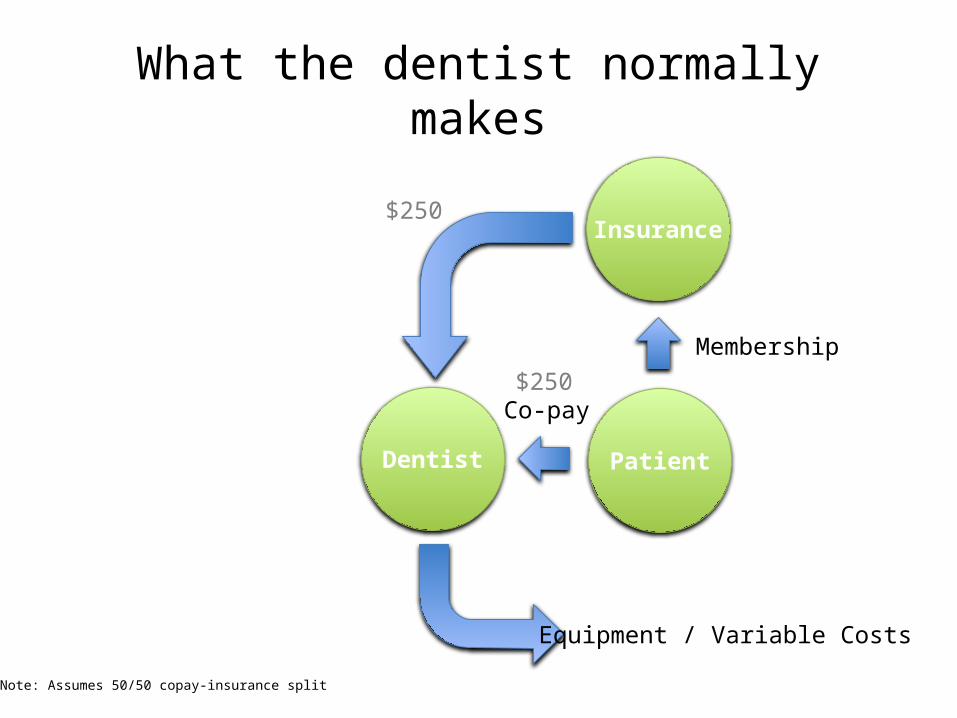
What the dentist normally makes
Dentist Patient
Insurance
Co-pay
Membership
$250
$250
Equipment / Variable Costs
Note: Assumes 50/50 copay-insurance split
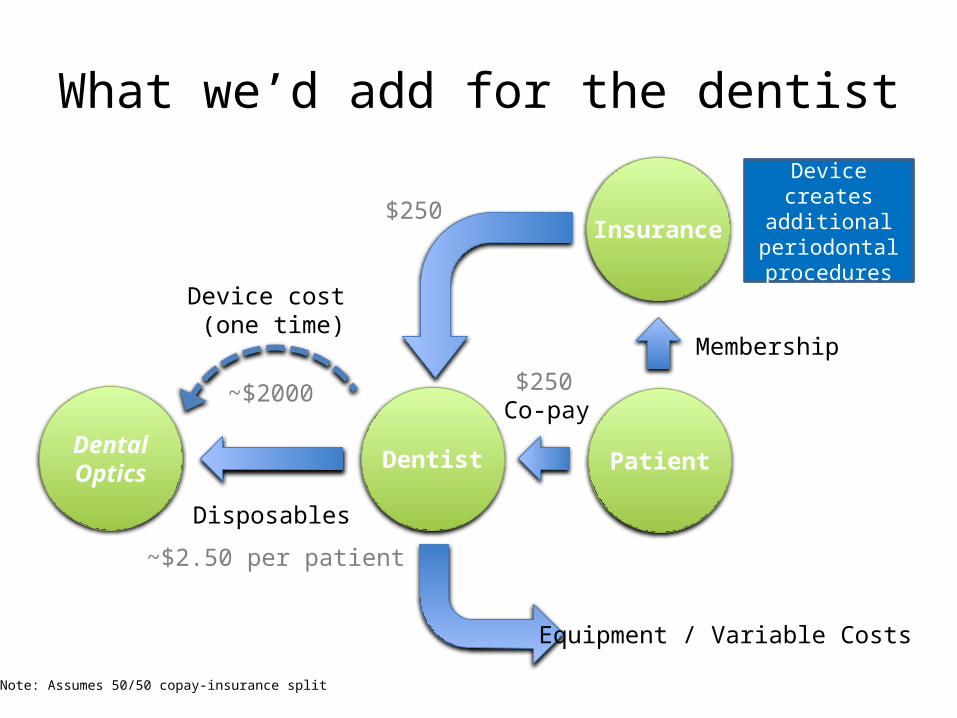
What we’d add for the dentist
Dentist PatientDentalOptics
Insurance
Co-pay
Membership
~$2000
$250
Device cost (one time)
$250
~$2.50 per patient
Disposables
Equipment / Variable Costs
Device creates
additional periodontal procedures
Note: Assumes 50/50 copay-insurance split
Farm Nitrate SensorRevenue Model Example
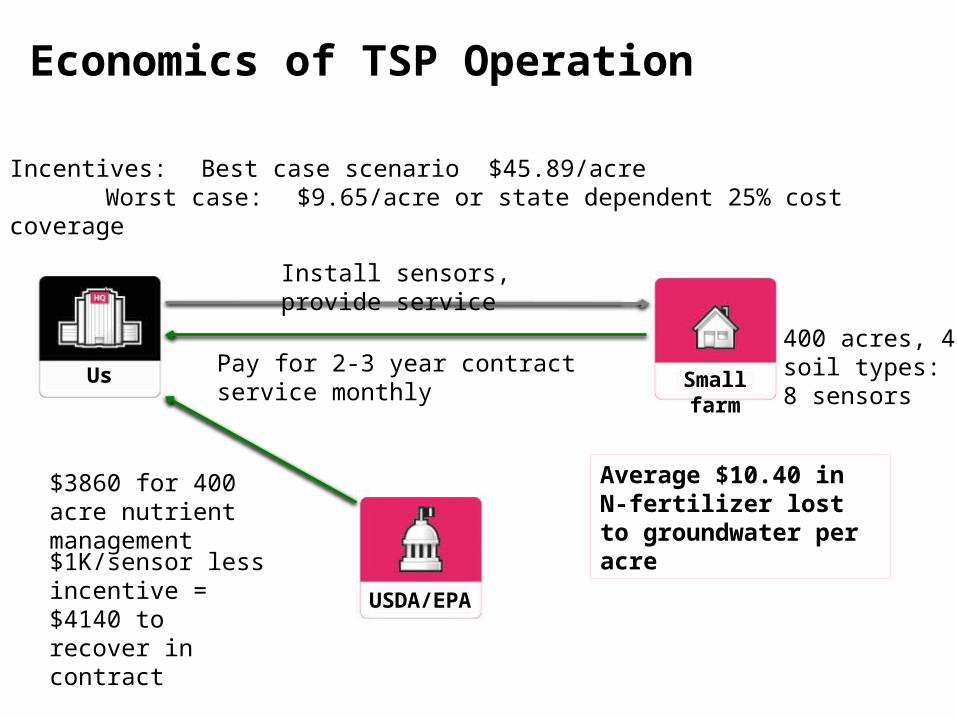
Us
USDA/EPA
Small farm
400 acres, 4 soil types: 8 sensors
Install sensors, provide service
$1K/sensor less incentive = $4140 to recover in contract
Incentives: Best case scenario $45.89/acreWorst case: $9.65/acre or state dependent 25% cost coverage
$3860 for 400 acre nutrient management
Average $10.40 in N-fertilizer lost to groundwater per acre
Pay for 2-3 year contract service monthly
Economics of TSP Operation
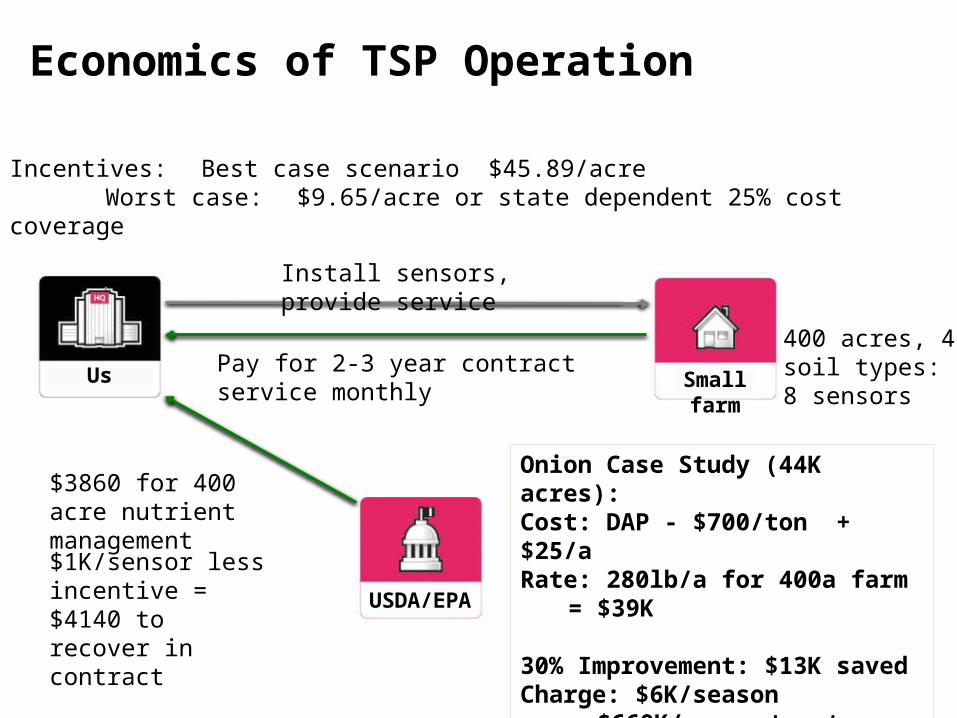
Us
USDA/EPA
Small farm
400 acres, 4 soil types: 8 sensors
Install sensors, provide service
$1K/sensor less incentive = $4140 to recover in contract
Incentives: Best case scenario $45.89/acreWorst case: $9.65/acre or state dependent 25% cost coverage
$3860 for 400 acre nutrient management
Onion Case Study (44K acres): Cost: DAP - $700/ton + $25/aRate: 280lb/a for 400a farm
= $39K
30% Improvement: $13K savedCharge: $6K/season
= $660K/yr contract revenue
Pay for 2-3 year contract service monthly
Economics of TSP Operation
Biofactories for TherapeuticsRevenue Model Example
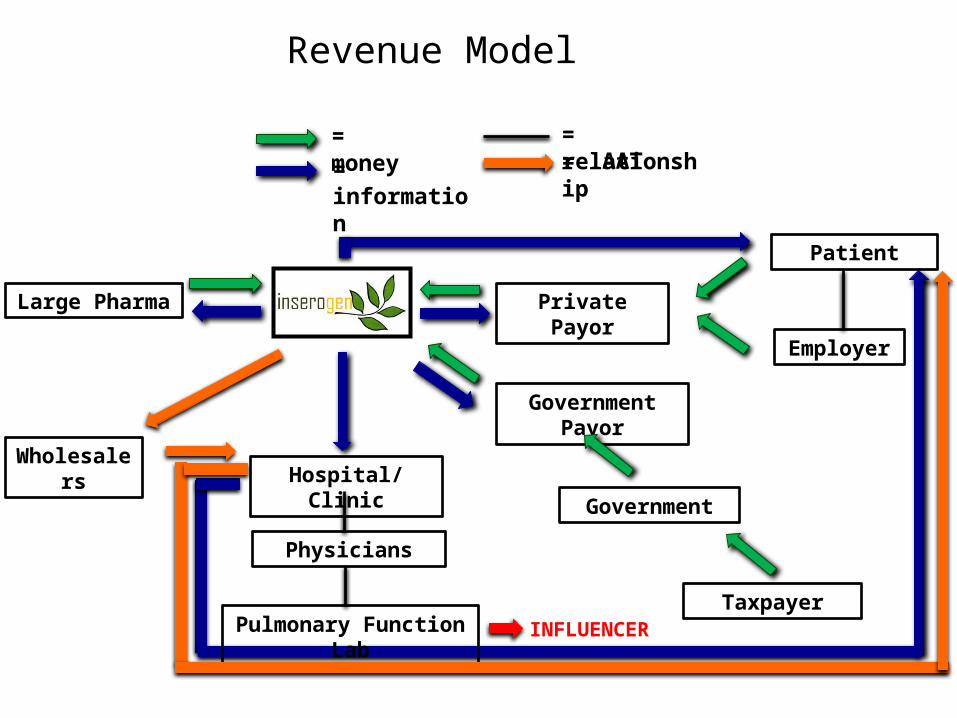
Revenue Model
= money= information
= relationship
Large Pharma
INFLUENCER
Hospital/Clinic
Physicians
Patient
Employer
Government
Taxpayer
Government Payor
Private Payor
Pulmonary Function Lab
Wholesalers
= AAT
Optics Design CompanyRevenue Model Example
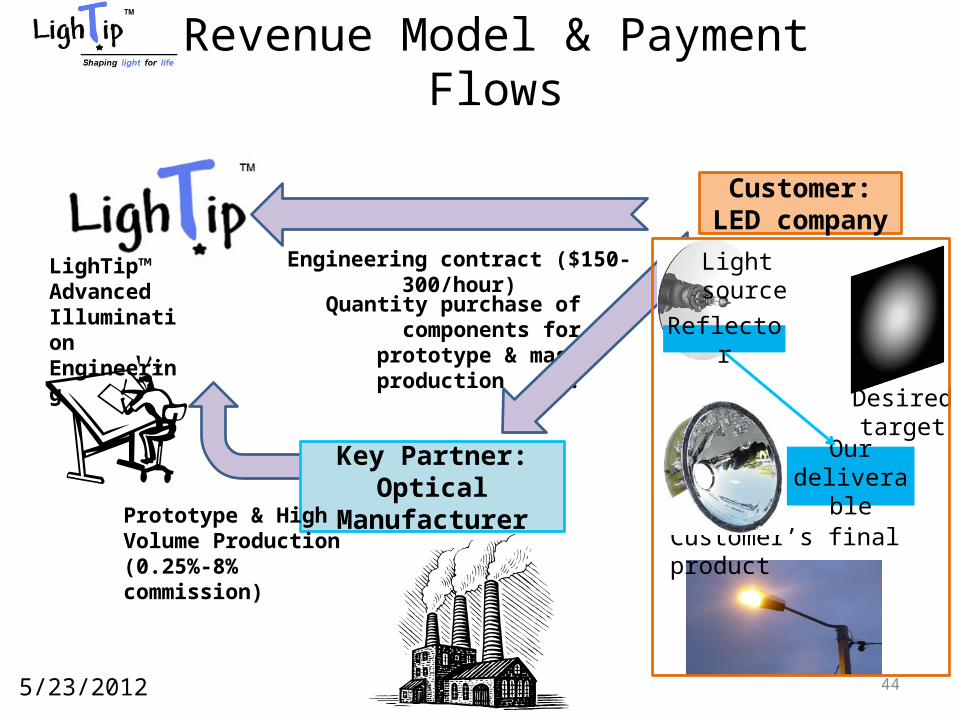
Quantity purchase of components for prototype &
mass production .
Revenue Model & Payment Flows
44
LighTip™ Advanced Illumination Engineering
™
Reflector
Desired target
Light source
Customer:LED company
Key Partner:Optical Manufacturer
Customer’s final product
Our deliverabl
ePrototype & High Volume Production (0.25%-8% commission)
Engineering contract ($150-300/hour)
5/23/2012
Complex Sensor NetworksRevenue Model Example
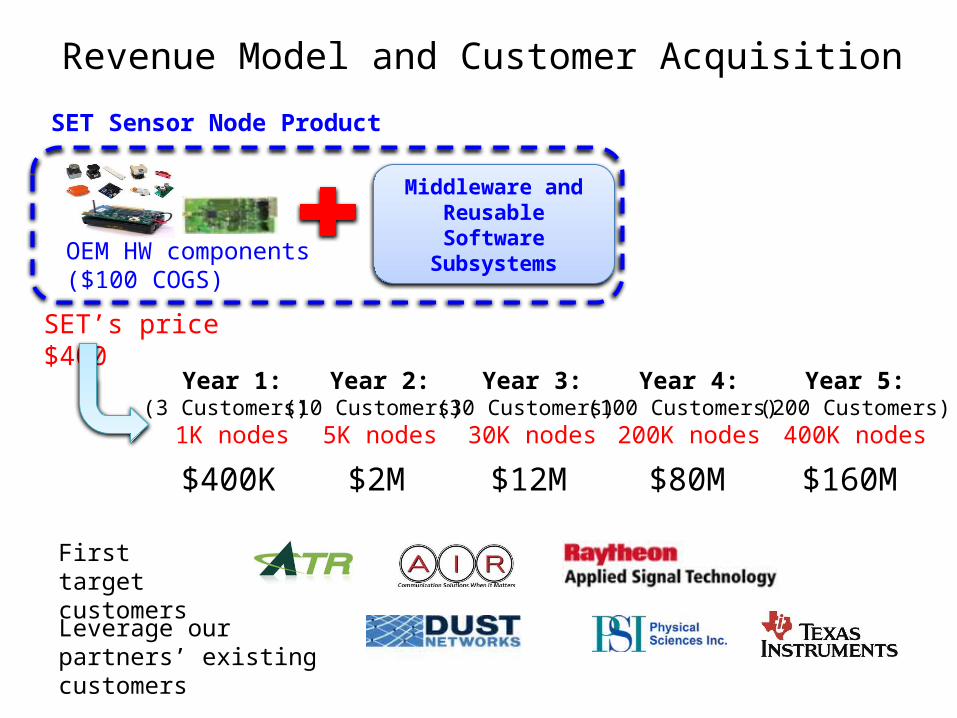
Revenue Model and Customer Acquisition
Year 1:(3 Customers)
1K nodes
Year 3:(30 Customers)
30K nodes
Year 4:(100 Customers)
200K nodes
SET’s price $400
$400K $12M $80M
Year 5:(200 Customers)
400K nodes
$160M
Middleware and Reusable Software
Subsystems
SET Sensor Node Product
OEM HW components ($100 COGS)
Year 2:(10 Customers)
5K nodes
$2M
First target customers
Leverage our partners’ existing customers
Healthcare SoftwareRevenue Model Example
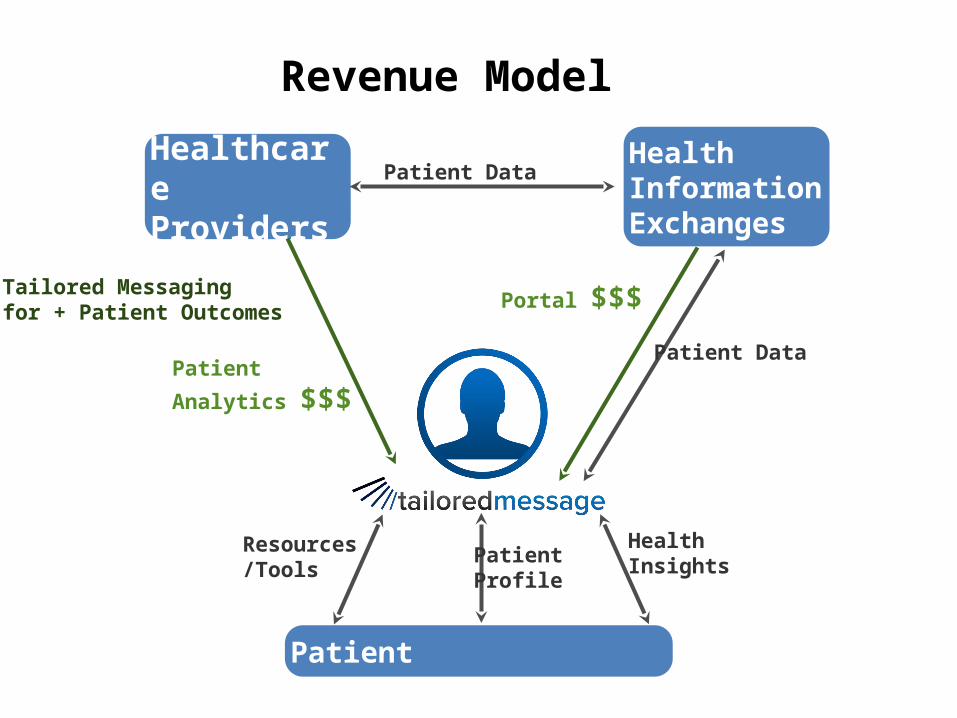
Revenue Model
Healthcare Providers
Health Information Exchanges
Patient
Patient Data
Patient Data
Portal $$$Tailored Messagingfor + Patient Outcomes
Patient Analytics $$$
Health Insights
Resources/Tools Patient Profile