prepared for: las vegas convention and visitors authority ......visitors in 2017 reported spending...
TRANSCRIPT

VISITOR PROFILE STUDYLAS VEGAS
2017

Prepared for:Las Vegas Convention and Visitors Authority
By: GLS Research425 Second Street, Suite 400, San Francisco, CA 94107
Telephone: (415) 974-6620 | Facsimile: (415) 947-0260 | www.glsresearch.com

2 0 1 7 L A S V E G A S V I S I T O R P R O F I L E
1
ACKNOWLEDGMENTSThe Las Vegas Convention and Visitors Authority and GLS Research extend thanks to the
Las Vegas community for its cooperation on this research project. Special appreciation is noted for cooperation and assistance received from the hotel, motel and casino industries. Appreciation is also
extended to the interviewers and Las Vegas visitors, without whose dedicated cooperation this study could not have been completed.
VISITOR PROFILE STUDY
LAS VEGAS CONVENTION AND VISITORS AUTHORITYSENIOR EXECUTIVE STAFF
DECEMBER 31, 2017
Chief Executive Officer — Rossi T. RalenkotterPresident/COO – Steven Hill
Chief Financial Officer – Edward FingerChief Human Resources Officer – Barbara Bolender
Chief Communications and Public Affairs Officer – Jacqueline PetersonChief Marketing Officer – Cathy Tull
Senior Vice President of Operations – Terry Jicinsky
RESEARCH CENTER
Executive Director — Kevin M. BaggerDirector — Scott Russell
Senior Research Analyst — Matt SeltzerResearch Analyst — Gina ZozayaResearch Analyst — Jill Reynolds
LAS VEGAS CONVENTION AND VISITORS AUTHORITY BOARD OF DIRECTORS
COMMISSIONER LAWRENCE WEEKLY — Chair MR. CHARLES BOWLING — Vice-Chair
MR. BILL NOONAN — SecretaryCOMMISSIONER LARRY BROWN — Treasurer
COUNCILWOMAN MICHELE FIORE • MAYOR CAROLYN G. GOODMANMR. TOM JENKIN • MAYOR PRO TEM PEGGY LEAVITT • MR. GREGORY LEE
MAYOR JOHN LEE • COUNCILMAN JOHN MARZ • COUNCILMAN GEORGE RAPSONMS. MARY BETH SEWALD • MR. MAURICE WOODEN
3150 Paradise Road, Las Vegas, NV 89109-9096 • 702-892-0711 | LVCVA.comVisitLasVegas.com • VegasMeansBusiness.com • VisitLaughlin.com • VisitMesquite.com

2 0 1 7 L A S V E G A S V I S I T O R P R O F I L E
2
TABLE OF CONTENTSEXECUTIVE SUMMARY 7INTRODUCTION 11METHODOLOGY 12SUMMARY OF FINDINGS 13
REASONS FOR VISITING 13 TRAVEL PLANNING 19
TRIP CHARACTERISTICS AND EXPENDITURES 29GAMING BEHAVIOR AND BUDGETS 41ENTERTAINMENT 45ATTITUDINAL INFORMATION 49VISITOR DEMOGRAPHICS 51
APPENDIXSummary Tables of Visitor CharacteristicsAggregate Results for Calendar Year

2 0 1 7 L A S V E G A S V I S I T O R P R O F I L E
3
TABLE OF FIGURESREASONS FOR VISITING
FIGURE 1: First Visit Versus Repeat Visit 13FIGURE 2: Frequency of Visits in Past Year (All Visitors) 14FIGURE 3: Frequency of Visits in Past Year (Repeat Visitors) 14FIGURE 4: Primary Purpose of Current Visit 15FIGURE 5: Primary Purpose of Current Visit (Repeat Visitors) 16FIGURE 6: Primary Purpose of Current Visit (First-Time Versus Repeat) 16FIGURE 7: Conventions/Trade Shows/Association/Corporate Meetings 17FIGURE 8: Interest in Attending Conventions or Corporate Meetings in Las Vegas 17FIGURE 9: Whether Brought Someone Else Who Did Not Attend Conventions or Meetings in Las Vegas 18
TRAVEL PLANNINGFIGURE 10: Advance Travel Planning 19FIGURE 11: Transportation to Las Vegas 19FIGURE 12: Local Transportation 20FIGURE 13: When Decided Where to Stay 20FIGURE 14: When Decided Where to Gamble 21FIGURE 15: When Decided Which Shows to See 21FIGURE 16: Travel Agent Assistance 22FIGURE 17: Travel Agent Influence and Use 22FIGURE 18: Tools Used in Planning Trip to Las Vegas 23FIGURE 19: Social Media and Travel Review Apps or Websites Used in Planning Trip to Las Vegas 23FIGURE 20: How Booked Flight to Las Vegas 24FIGURE 21: Website Used to Book Flight 24FIGURE 22: Website Used to Book Accommodations 25FIGURE 23: Social Media and Travel Review Apps Used During Current Trip to Las Vegas 26FIGURE 24: Whether Visited Downtown Las Vegas 26FIGURE 25: Main Reason for Visiting Downtown Las Vegas 27FIGURE 26: Main Reason for Not Visiting Downtown Las Vegas 27FIGURE 27: Visits to Nearby Places 28FIGURE 28: Other Nearby Places Visited 28

2 0 1 7 L A S V E G A S V I S I T O R P R O F I L E
4
TRIP CHARACTERISTICS AND EXPENDITURESFIGURE 29: Adults in Immediate Party 29FIGURE 30: Whether Had Persons in Immediate Party Under Age 21 29FIGURE 31: Nights Stayed 30FIGURE 32: Days Stayed 30FIGURE 33: Weekend Versus Weekday Arrival 31FIGURE 34: Type of Lodging 31FIGURE 35: Location of Lodging 32FIGURE 36: How Booked Accommodations in Las Vegas 32FIGURE 37: Advance Booking of Accommodations 33FIGURE 38: Type of Room Rate 34FIGURE 39: Package Purchases 34FIGURE 40: Room Rate by Booking Method 35FIGURE 41: Cost of Package Per Person 36FIGURE 42: Lodging Expenditures — Average Per Night 37FIGURE 43: How First Found Out About Room Rate 38FIGURE 44: Number of Room Occupants 38FIGURE 45: Average Trip Expenditures on Food and Drink — and on Local Transportation (Including Visitors Who Spent Nothing) 39FIGURE 46: Average Trip Expenditures on Food and Drink — and on Local Transportation (Among Spenders) 39FIGURE 47: Average Trip Expenditures on Shopping, Shows/Entertainment and Sightseeing (Including Visitors Who Spent Nothing) 40FIGURE 48: Average Trip Expenditures on Shopping, Shows/Entertainment, and Sightseeing (Among Spenders) 40
GAMING BEHAVIOR AND BUDGETSFIGURE 49: Whether Gambled While in Las Vegas 41FIGURE 50: Hours of Gambling — Average Per Day 41FIGURE 51: Number of Casinos Visited 42FIGURE 52: Number of Casinos Where Gambled 42FIGURE 53: Trip Gambling Budget 43FIGURE 54: Where Visitors Gambled 44

2 0 1 7 L A S V E G A S V I S I T O R P R O F I L E
5
ENTERTAINMENTFIGURE 55: Attended a Show 45FIGURE 56: Types of Entertainment 45FIGURE 57: Average Number of Shows Attended 46FIGURE 58: Main Reason for Not Attending Any Shows 47FIGURE 59: Whether Has Been to Other Paid Attractions 47FIGURE 60: Whether Has Been to Nightclubs, Bars and Lounges 48FIGURE 61: Whether Visited a Spa 48
ATTITUDINAL INFORMATION
FIGURE 62: Satisfaction with Visit 49FIGURE 63: Why Not Completely Satisfied with Visit 49FIGURE 64: Why Dissatisfied with Visit 50
VISITOR DEMOGRAPHICS
FIGURE 65: Gender 51 Marital Status 51 Employment 51 Education 51 Age 51FIGURE 66: Ethnicity 52 Household Income 52 Visitor Origin 52

2 0 1 7 L A S V E G A S V I S I T O R P R O F I L E
6

2 0 1 7 L A S V E G A S V I S I T O R P R O F I L E
7
EXECUTIVE SUMMARYAlthough the proportion of first-time visitors to Las Vegas in 2017 declined somewhat from the very high 2016 measure observed, a healthy influx of first-time visitors suggests that the destination continues to expand its appeal to new audiences.
Trip planning itself continued to evolve as well in 2017 with visitors using more internet based resources and less use of travel agents. This evolution portends the importance of social media and related apps in maintaining high levels of interest in visiting and the mechanics of booking travel to Las Vegas.
Las Vegas visitors in 2017 were on average more active within the destination than in recent years. Specifically, they were more likely to take part in a variety of activities such as seeing a show, visiting nightclubs, bars and lounges, and visiting Downtown Las Vegas. It is clear that the expanding array of entertainment options and venues available have resonated well with current visitors.
An improving economy in 2017 and overall greater confidence in one’s personal finances are reflected in various Las Vegas spending measures. Visitors in 2017 reported spending more on food and drink than in the past five years, and spending more on lodging, local transportation, and sightseeing since 2015. Similar to 2016, these visitors were more likely to pay a regular room rate or a package rate, and less likely to pay a casino or casino complimentary rate.
Gaming behavior continued to reflect the enhanced definition of Las Vegas as the “entertainment capital” of the world. Specifically, the proportion of Las Vegas visitors who gambled increased from last year to about three-quarters, while the amount of time they spent gambling was the lowest observed over the past five years, at just over one and a half hours. The amount budgeted for gambling decreased slightly from last year, but has been in the same range over the past five years. While most visitors who gambled said they did so on the Strip Corridor, there was a significant increase in the proportion of visitors who said they gambled Downtown.
Continuing a trend observed in 2016, visitors to Las Vegas in 2017 were younger and more diverse than in the recent past. This trend suggests relatively greater interest in “active” forms of entertainment and opportunities to create entertainments targeted to specific population segments.

2 0 1 7 L A S V E G A S V I S I T O R P R O F I L E
8
TRAVEL PLANNING Forty-six percent (46%) of Las Vegas visitors arrived by air, with 54% arriving via ground transportation, the same as last year.
Nearly one-half of visitors said they used their own vehicles while traveling around Las Vegas, while 14% said they used a rental car. About three in ten (29%) visitors reported taking a taxi, up from 26% last year. Nearly one in five (19%) said they used a ride-sharing service, up from 13% last year.
The proportion of visitors who reported using a travel agent to plan their current trip to Las Vegas (10%) decreased compared to 2013 – 2016 usage, while nearly seven in ten (69%) used websites, social media and/or apps. More than four in ten 2017 visitors who used a website, social media, or apps in planning their trip said they consulted reviews at online travel agencies in planning their trip, and about three in ten of these visitors said they consulted reviews at hotel or show venue sites.
Among those visitors who booked their flight using a website or app in 2017, more than six in ten visitors (62%) said they used an airline website, up from 56% last year. In terms of booking their accommodations, visitors were less likely than in the past to say that they booked by calling the property directly and more likely to say that they used a third party website (41%) or a hotel website (21%).
The proportion of visitors who said they visited Downtown Las Vegas increased significantly from past years to 57%. Nearly two-thirds of these visitors said the main reason they visited Downtown was to see the Fremont Street Experience.

2 0 1 7 L A S V E G A S V I S I T O R P R O F I L E
9
TRIP CHARACTERISTICS AND EXPENDITURESThe average adult party size in 2017 was 2.3 persons, up from 2.2 in 2015. Fewer 2017 visitors had children under the age of 21 in their immediate party than last year.
The average length of stay in 2017 was similar to last year, but up from 2013 – 2015 levels. As in past years, visitors were most likely to stay in a hotel and nearly three-quarters of them lodged within the Strip Corridor. Two-thirds of visitors in 2017 made their reservations for their accommodations more than one month in advance, a significant increase over past years.
In 2017, about one-half of visitors paid a regular room rate, similar to last year but a large increase from 2013 – 2015 results. Nearly one in five visitors (18%) reported paying either a package or a tour travel group rate, also similar to last year, but up from 13% in 2013 and 15% in 2015. Fewer visitors than in past years reported paying a casino rate.
The average cost of lodging did not increase significantly over last year, although the cost among those who paid a non-package rate and did not receive a complimentary rate was significantly higher than 2013 – 2015 costs. More than one-half (56%) of those visitors who paid a non-package rate and did not receive a complimentary rate said they first heard about their rate from a web site, a significant increase from past years, while they were less likely to say they heard about the rate through a reservation agent (9%).
Over the course of their entire stay in Las Vegas, 2017 visitors spent much more than in each of the past five years on food and drink. Indeed, the amount spent on food and drink (mean of $376.97) was over $50 higher than last year’s average. Visitors also spent more on average on local transportation and sightseeing than they had from 2013 – 2015.
GAMING BEHAVIOR AND BUDGETSNearly three-quarters (74%) of 2017 visitors said they gambled while in Las Vegas, an increase from about seven in ten (69%) last year. However, those visitors who gambled spent less time gambling on average than in any of the past five years. The average trip gambling budget ($541.18) was down from last year’s budget, but has remained in the same range over the recent past. About nine in ten (89%) visitors who gambled said they gambled on the Strip Corridor, while four in ten said they gambled Downtown, a significant increase from past year findings.

2 0 1 7 L A S V E G A S V I S I T O R P R O F I L E
10
ENTERTAINMENTNearly six in ten (59%) visitors in 2017 attended shows during their current stay, an increase from last year’s results. About one-half of all visitors who saw shows saw a lounge act (up from last year), while more than one in four saw a Broadway/production show (down from 2014 – 2016 results), and more than one in five saw big-name headliner shows.
The 2017 Las Vegas visitor was much more likely than recent past visitors to go to a bar without a cover charge, either those in hotels or free-standing. They were also more likely than 2013 – 2015 visitors to visit nightclubs with cover charges, pool parties or day clubs, or other paid attractions in Las Vegas, although less likely than in 2016. These findings are correlated with the increased number of first-time, younger visitors seen beginning in 2016, who were more likely than repeat and older visitors to engage in these activities and visit these types of venues.
ATTITUDINAL INFORMATION Just over three-quarters (76%) of visitors reported being “very satisfied” with their trip to Las Vegas in 2017, down from past years, while nearly one-quarter said they were “somewhat satisfied,” an increase from recent past year results. Only 2% of visitors said they were dissatisfied with their trip to Las Vegas, although this was an increase from less than 1% during the 2013 – 2015 time period.
NOTABLE VISITOR DEMOGRAPHICSAlmost three-quarters of 2017 Las Vegas visitors were married (down from 2013 – 2015, but up from last year). Visitors were more likely than in the 2013 to 2015 time frame to be employed, and less likely to be retired. Almost one-half of 2017 visitors were college graduates, down from 2015 and 2016. Nearly one-half of visitors were visiting from the western United States (down slightly from past years results), with about three in ten coming from California. About one in six visitors were from foreign countries, down from last year. The 2017 visitor base continued a trend beginning in 2016 of being more ethnically diverse, as three in ten identified themselves as non-white. More than eight in ten visitors reported earning $40,000 or more, and just over one-quarter reported earning $80,000 or more, both figures up from last year. The proportion of visitors who were 40 years old or older was just over one-half and the average age was 44.3. Both measures are similar to last year, but younger than 2013 – 2015 results.

2 0 1 7 L A S V E G A S V I S I T O R P R O F I L E
11
INTRODUCTIONThe Las Vegas Visitor Profile Study is reported annually, to provide an ongoing assessment of the Las Vegas visitor and trends in visitor behavior over time, based on ongoing intercept surveys of travelers to Las Vegas.
More specifically, the Las Vegas Visitor Profile aims to:
• Provide a profile of Las Vegas visitors in terms of socio-demographic and behavioral characteristics.
• Monitor trends in visitor behavior and visitor characteristics.
• Supply detailed information on the vacation and gaming habits of different visitor groups, particularly gaming and non-gaming expenditures.
• Allow the identification of market segments and potential target markets.
• Provide a basis for calculating the economic impact of different visitor groups.
• Determine visitor satisfaction levels.

2 0 1 7 L A S V E G A S V I S I T O R P R O F I L E
12
METHODOLOGYIn-person interviews were conducted with 3,600 randomly selected visitors. Approximately three-hundred (300) interviews were conducted each month for 12 months from January through December 2017. Qualified survey respondents were visitors to Las Vegas (excluding residents of Clark County, Nevada) who were at least 21 years of age. In addition, only visitors who planned to leave Las Vegas within 24 hours were asked to complete the survey.
The results of the Las Vegas Visitor Profile have been weighted to more accurately reflect actual visitors to Las Vegas in terms of mode of transportation, lodging location and month of visit. Specifically, the mode of transportation weight is derived from a compilation of data provided by the LVCVA, McCarran International Airport and the Nevada Department of Transportation. The lodging location weight is derived from geographic area specific occupancy rates from independent surveys conducted by the LVCVA. The month of visit weight is derived from monthly room nights occupied data, also from independent surveys conducted by the LVCVA as part of their ongoing room occupancy audit.
Visitors were intercepted in the vicinity of Las Vegas casinos, hotels, motels and RV Parks. To assure a random selection of visitors, different locations were utilized on each interviewing day, and interviewing was conducted at different times of the day. Upon completion of the interview, visitors were given souvenirs as “thank you’s.” Verification procedures were conducted throughout the project to assure accurate and valid interviewing.
Interviews were edited for completeness and accuracy, coded, and entered into a computerized database for analysis. The information was then analyzed using statistical software packages available to GLS Research. The questionnaire administered to visitors is appended to this report in the form of aggregate results.
Throughout this report, bar charts are used to illustrate the data. The data presented in these charts are based on the total sample of respondents for 2017 and the preceding years, unless otherwise specified. In charts using proportions, those proportions may not add to 100% because of rounding or because multiple responses were permitted.
When we note that a difference between subgroups on a particular measure is “significant” or “statistically significant,” we mean that there is a 95% or better chance that the difference is the result of true differences between the subgroup populations and is not due to sampling error alone. When we note that a difference between subgroups is “not significant” or “not statistically significant,” we mean that there is less than a 95% chance that the difference is the result of true differences between the subgroups.
This report presents the results of the 2017 study, as well as for the previous four calendar years (2013, 2014, 2015, and 2016). Statistically significant differences in the behavior, attitudes and opinions of visitors from year to year are pointed out in the text of the report. Throughout this report, if data is not presented for all five years, it is because the question was not asked in every year.
In order to maintain a questionnaire of reasonable length, some questions in the Las Vegas Visitor Profile Study were not asked in Calendar Year 2017. These questions will be rotated back into the questionnaire in Calendar Year 2018 and subsequently asked every other year. These questions are noted in the text accompanying the figures in the body of this report.
2 0 1 7 L A S V E G A S V I S I T O R P R O F I L E
13
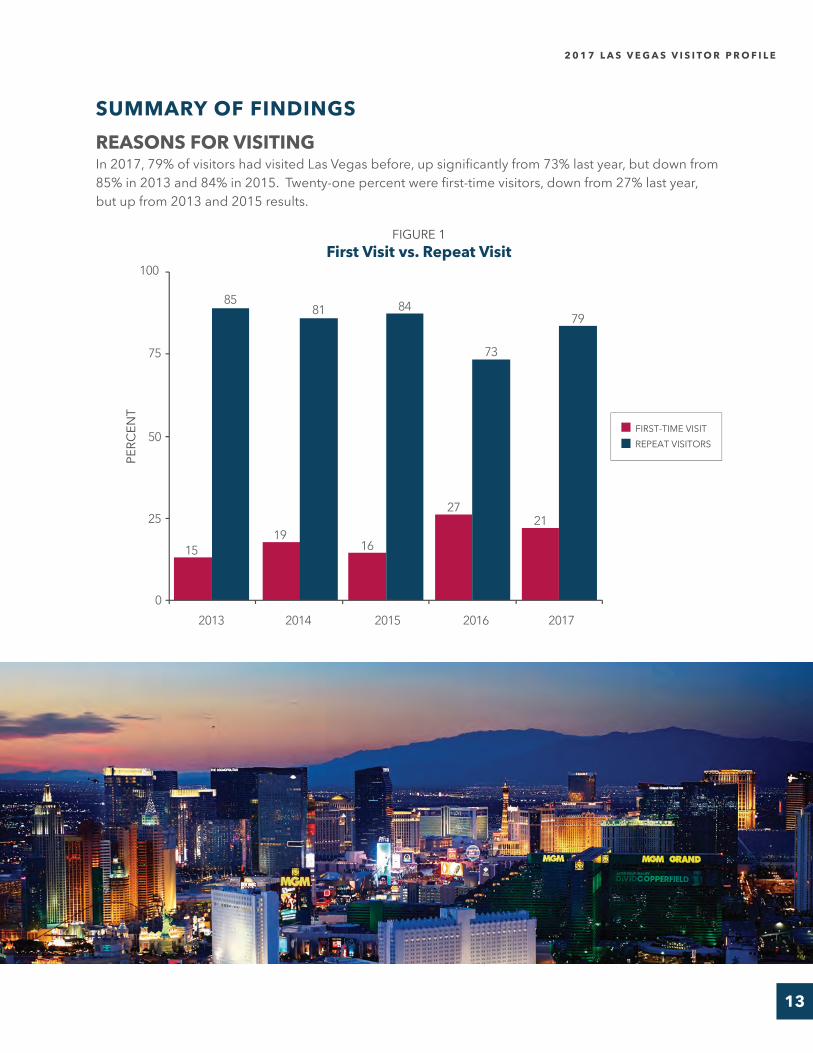
SUMMARY OF FINDINGSREASONS FOR VISITINGIn 2017, 79% of visitors had visited Las Vegas before, up significantly from 73% last year, but down from 85% in 2013 and 84% in 2015. Twenty-one percent were first-time visitors, down from 27% last year, but up from 2013 and 2015 results.
2013 20172014
15
2015
100
FIGURE 1First Visit vs. Repeat Visit
PERC
ENT
75
50
25
02016
85
1916
2721
81 84
73
79

2 0 1 7 L A S V E G A S V I S I T O R P R O F I L E
14
Among all Las Vegas visitors in 2017, the average number of visits in the past year was 1.6, down from 1.8 visits in 2015 and 1.7 visits last year. Seventy-four percent (74%) said they visited Las Vegas only once in the past year, up from 2013 – 2016 results. Just over one-fifth (22%) of Las Vegas visitors in 2017 said they visited Las Vegas between two to three times in the past year, down from 28% in 2015 and 26% last year.
In 2017, repeat visitors made an average of 1.8 trips to Las Vegas, down from 1.9 in 2015 and 2.0 in 2016. Among repeat visitors, 67% made only one trip, up from 54% in 2015 and 53% last year. Twenty-eight percent (28%) of repeat visitors reported making between two and three visits in 2017, down from 34% in 2015 and 36% last year.
64 64
54 53
67
28
7 7 86
4 4 3 4 52
3634
2525
2013 (MEAN=1.8; BASE=3076)
2014 (MEAN=1.8; BASE=2906)
2015 (MEAN=1.9; BASE=3024)
2016 (MEAN=2.0; BASE=2636)
2017 (MEAN=1.8; BASE=2839)
FIGURE 2
FIGURE 3
Frequency of Visits in Past Year (Among All Visitors)
Frequency of Visits in Past Year (Among Repeat Visitors)
PERC
ENT
PERC
ENT
6971
6265
74
22
6 6 75
3 3 3 3 41
2628
2022
2013 (MEAN=1.7)
2014 (MEAN=1.6)
2015 (MEAN=1.8)
2016 (MEAN=1.7)
2017 (MEAN=1.6)
0
0
MORE THAN FIVE
MORE THAN FIVE
FOUR TO FIVE
FOUR TO FIVE
TWO TO THREE
TWO TO THREE
ONE
ONE
80
80
60
60
20
20
40
40
2 0 1 7 L A S V E G A S V I S I T O R P R O F I L E
15
FIGURE 4Primary Purpose of Current Visit
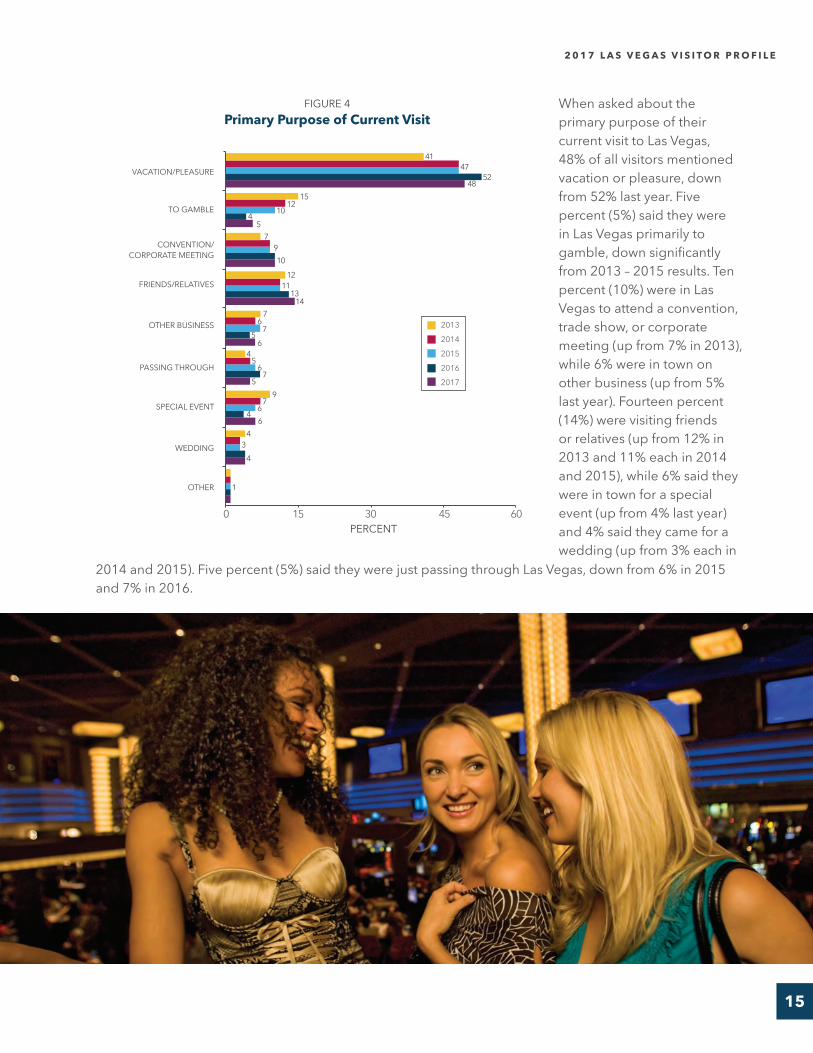
When asked about the primary purpose of their current visit to Las Vegas, 48% of all visitors mentioned vacation or pleasure, down from 52% last year. Five percent (5%) said they were in Las Vegas primarily to gamble, down significantly from 2013 – 2015 results. Ten percent (10%) were in Las Vegas to attend a convention, trade show, or corporate meeting (up from 7% in 2013), while 6% were in town on other business (up from 5% last year). Fourteen percent (14%) were visiting friends or relatives (up from 12% in 2013 and 11% each in 2014 and 2015), while 6% said they were in town for a special event (up from 4% last year) and 4% said they came for a wedding (up from 3% each in
2013
2014
2015
2016
2017
0 15 30 45 60
CONVENTION/ CORPORATE MEETING
FRIENDS/RELATIVES
TO GAMBLE
VACATION/PLEASURE
OTHER BUSINESS
PASSING THROUGH
WEDDING
SPECIAL EVENT
OTHER
PERCENT
41
15
7910
1211
1314
76
7
7
97
5
5
5
6
64
4
4
4
1
3
6
6
1210
45
4752
48
2014 and 2015). Five percent (5%) said they were just passing through Las Vegas, down from 6% in 2015 and 7% in 2016.

2 0 1 7 L A S V E G A S V I S I T O R P R O F I L E
16
SPECIAL EVENT
TO GAMBLE
OTHER BUSINESS
PASSING THROUGH
OTHER
VACATION/PLEASURE
CONVENTION/CORP. MTG.
FRIENDS/RELATIVES
WEDDING
56
44
712
7
5
6
7
5
4
1
12
FIRST-TIME VISITORS (BASE=761)
REPEAT VISITORS (BASE=2839)
16
6643
0 20 40 60 80PERCENT
The proportion of repeat visitors who said the primary purpose of their current visit to Las Vegas was vacation or pleasure was 43%, down from 48% last year. Six percent (6%) said they were in Las Vegas primarily to gamble, up from 5% last year, but down significantly from 2013 – 2015 results. Twelve percent (12%) were in Las Vegas to attend a convention, trade show, or corporate meeting (up from 7% in 2013 and 9% in 2015), while 7% were in town on other business. Sixteen percent (16%) were visiting friends or relatives, up from 12% in 2013 11% in 2014, and 13% in 2015. Six percent (6%) said they were in town for a special event (up from 5% last year), while 4% came for a
The primary purpose for the current visit among both first-time and repeat visitors is presented in Figure 6. First-time visitors were significantly more likely than repeat visitors to say they were visiting Las Vegas primarily for vacation or pleasure (66% vs. 43%). Repeat visitors were significantly more likely than first-time visitors to say that their current trip to Las Vegas was to visit friends or relatives (16% vs. 7%), to attend a convention or corporate meeting (12% vs. 7%), or to gamble (6% vs. 1%).
2013 (BASE=3076)
2014 (BASE=2906)
2015 (BASE=3024)
2016 (BASE=2636)
2017 (BASE=2839)
0 15 30 45 60
CONVENTION/ CORP. MEETING
FRIENDS/ RELATIVES
TO GAMBLE
VACATION/PLEASURE
OTHER BUSINESS
PASSING THROUGH
WEDDING
SPECIAL EVENT
OTHER
PERCENT
37
17
710
9
1211
11
1314
168
68
5
55
6
7
6
5
710
7
4
4
12
3
6
7
1412
12
56
4248
43
FIGURE 5Primary Purpose of Current Visit
(Among Repeat Visitors)
FIGURE 6Primary Purpose of Current Visit
(First-Time Versus Repeat Visitors - 2017)
wedding (up from 3% each in 2014 and 2015). Five percent (5%) said they were just passing through Las Vegas, down from 7% each in 2015 and 2016.
2 0 1 7 L A S V E G A S V I S I T O R P R O F I L E
17
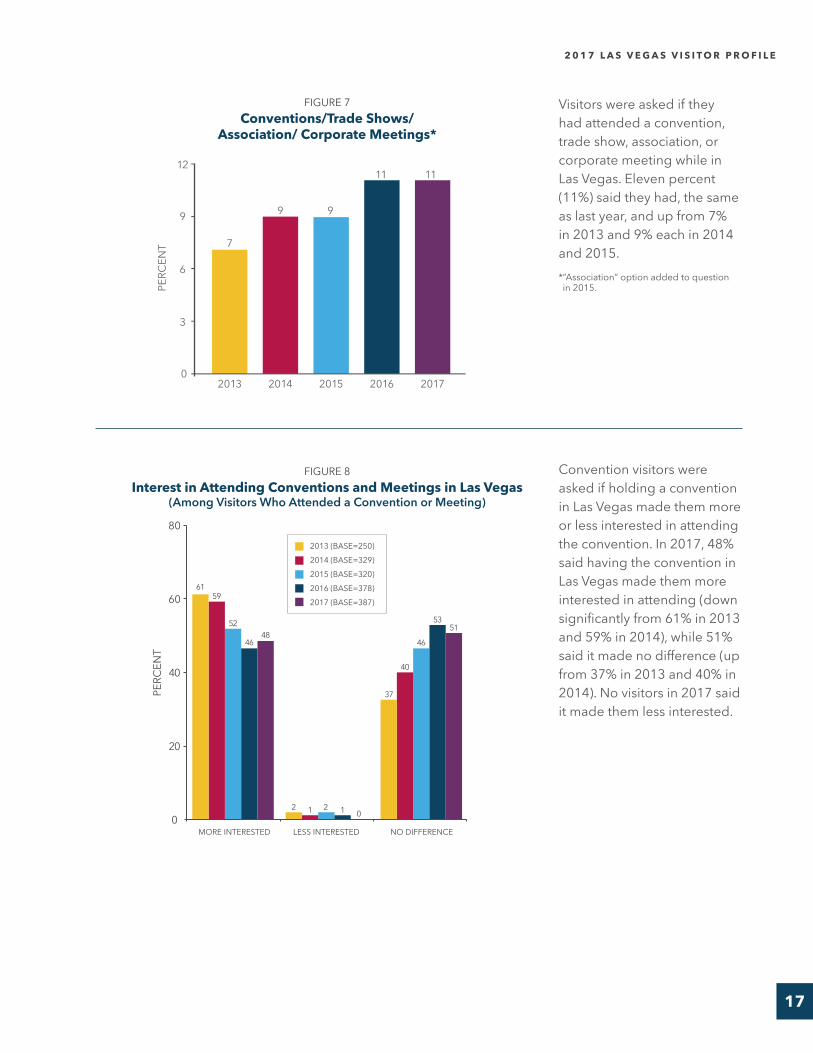
Convention visitors were asked if holding a convention in Las Vegas made them more or less interested in attending the convention. In 2017, 48% said having the convention in Las Vegas made them more interested in attending (down significantly from 61% in 2013 and 59% in 2014), while 51% said it made no difference (up from 37% in 2013 and 40% in 2014). No visitors in 2017 said it made them less interested.
Visitors were asked if they had attended a convention, trade show, association, or corporate meeting while in Las Vegas. Eleven percent (11%) said they had, the same as last year, and up from 7% in 2013 and 9% each in 2014 and 2015.* “Association” option added to question in 2015.
FIGURE 7Conventions/Trade Shows/
Association/ Corporate Meetings*
FIGURE 8Interest in Attending Conventions and Meetings in Las Vegas
(Among Visitors Who Attended a Convention or Meeting)
PERC
ENT
2013 20172014 2015 2016
7
9
11 11
9
0
3
6
9
12PE
RCEN
T
6159
52
4648
0
37
40
46
5351
1212
2013 (BASE=250)2014 (BASE=329)2015 (BASE=320)2016 (BASE=378)2017 (BASE=387)
0NO DIFFERENCELESS INTERESTEDMORE INTERESTED
80
60
20
40

2 0 1 7 L A S V E G A S V I S I T O R P R O F I L E
18
Convention visitors were asked if they had brought a spouse, family member, or friend who was not attending or working at the convention, trade show, association, or corporate meeting with them. Thirty-five percent (35%) said they had, down from 44% in 2013.* Only “yes” responses are reported in this chart.
PERC
ENT
2013 20172014 2015 2016
44
35 37 3541
0
15
30
45
60
2013 (BASE=250)2014 (BASE=329)2015 (BASE=320)2016 (BASE=378)2017 (BASE=387)
FIGURE 9Whether Brought Someone Else Who Did Not
Attend Conventions and Meetings in Las Vegas* (Among Visitors Who Attended a Convention or Meeting)

2 0 1 7 L A S V E G A S V I S I T O R P R O F I L E
19
TRAVEL PLANNING Seventy-one percent (71%) of visitors in 2017 planned their trip to Las Vegas more than one month in advance, up significantly from 2013 – 2016 findings. Twenty-four percent (24%) planned their trip from one week to one month in advance, down from 2013 – 2016 findings. Six percent (6%) planned their trip less than a week in advance, down from 14% last year.
Forty-six percent (46%) of visitors to Las Vegas in 2017 arrived by air, while 54% arrived by ground transportation, the same as last year’s results.
AIR AUTO/BUS/RV
FIGURE 11Transportation to Las Vegas
PERC
ENT
0
20
40
60
42 42 43
58 58 5754 54
46 46
SAME DAY
1 TO 3 DAYS
4 TO 6 DAYS
7 TO 14 DAYS
15 TO 30 DAYS
31 TO 60 DAYS
61 TO 90 DAYS
MORE THAN 90 DAYS
PERC
ENT
0
10
20
30
40
0 0 1 2
13
29
26
1314 14
2
19
25
20
6 5
14
20
23
14
3 3 3
10
14
21
26
24
1 1
15
27
24
17
3
FIGURE 10Advance Travel Planning*
2013
2014
2015
2016
2017
2013
2014
2015
2016
2017
* May reflect impacts of updated survey locations and cancellations and/or postponements of near-term bookers following the 1 October shooting in the destination.

2 0 1 7 L A S V E G A S V I S I T O R P R O F I L E
20
Forty-nine percent (49%) of visitors said that they used their own vehicle when traveling around Las Vegas, up from 43% last year. Nineteen percent (19%) said they used a ride sharing service*, up from 13% in 2016. Twenty-nine percent (29%) reported taking a taxi, up from 26% in 2016. Fourteen percent (14%) reported using a rental car (down from 16% in 2016), while 15% said they took a hotel shuttle (up from 12% in 2013 and 11% in 2014). Eleven percent (11%) reported using the Monorail, (down from 14% last year) while 13% reported taking a bus (similar to past results). Two percent (2%) said they took a limousine, similar to past years.
Almost all (98%) of Las Vegas visitors in 2016 decided where to stay in Las Vegas prior to their arrival, unchanged from 2014.* This question is asked every other year and was not asked in 2013, 2015, or 2017.
FIGURE 13When Decided Where to Stay*
(Among Those Who Stayed Overnight – Asked Every Other Year))
2014 (BASE=3586)
2016 (BASE=3597)
FIGURE 12Local Transportation*
BUS
SHUTTLE
TAXI
OWN VEHICLE
RENTAL CAR
LIMOUSINE
RIDE SHARING SERVICE
MONORAIL
0 15 30 45 60PERCENT
50
2732
28
1214
26
1213
1211
16
6
12
14
11
15
14
23
2
1
15
10
000
29
1319
4748
4943
2013
2014
2015
2016
2017PE
RCEN
T
BEFORE ARRIVAL AFTER ARRIVAL0
25
50
75
100 98 98
2 2
*Ride sharing option added in 2016.

2 0 1 7 L A S V E G A S V I S I T O R P R O F I L E
21
Over one half (56%) of visitors in 2016 decided where to gamble after arriving in Las Vegas, up from 52% in 2014. Forty-four percent (44%) of visitors decided where to gamble before leaving home, down from 48% in 2014.* This question is asked every other year and was not asked in 2013, 2015, or 2017.
Sixty-two percent (62%) of visitors in 2016 decided which shows to see after their arrival while 37% decided before leaving home, not significantly different from 2014 results.* This question is asked every other year and was not asked in 2013, 2015, or 2017.
FIGURE 14When Decided Where to Gamble*
(Among Those Who Gambled – Asked Every Other Year)
FIGURE 15When Decided Which Shows to See*
(Among Those Who Saw Shows – Asked Every Other Year)
2014 (BASE=2551)
2016 (BASE=2483)
2014 (BASE=2349)
2016 (BASE=1865)
PERC
ENT
PERC
ENT
BEFORE ARRIVAL
BEFORE ARRIVAL
AFTER ARRIVAL
AFTER ARRIVAL
0
0
20
20
40
40
60
60
80
48
38
44
37
52
61
56
62

2 0 1 7 L A S V E G A S V I S I T O R P R O F I L E
22
Ten percent (10%) of visitors reported using a travel agent to plan their trip to Las Vegas, the smallest proportion observed over the past five years.* Only “yes” responses are reported in this chart.
Among those visitors who used a travel agent to plan their trip to Las Vegas, 87% said the travel agent booked their accommodations (up from 82% last year), while 71% said the travel agent booked their transportation (down from past years).
Sixty-one percent (61%) of these visitors said their travel agent influenced their choice of accommodations in Las Vegas (down from past years), while 13% said the travel agent influenced their choice of destination (up from 5% each in 2013 and 2015 and 9% in 2014).* Only “yes” responses are reported in this chart.
FIGURE 16Travel Agent Assistance*
FIGURE 17Travel Agent Influence and Use*
(Among Those Who Used a Travel Agent)
PERC
ENT
2013 20172014 2015 2016
15 15
13
10
16
0
5
10
15
20
2013
2014
2015
2016
2017PE
RCEN
T
59
5
1113
61
83
88
838786
90
82
9087
7171
837977
2013 (BASE=533)2014 (BASE=566)2015 (BASE=542)2016 (BASE=458)2017 (BASE=355)
0INFLUENCED
ACCOMMODATIONSBOOKED
ACCOMMODATIONSBOOKED
TRANSPORTATIONINFLUENCED DESTINATION
100
75
25
50

2 0 1 7 L A S V E G A S V I S I T O R P R O F I L E
23
Beginning in 2017 visitors were asked what tools they used to plan their trip to Las Vegas. Over two-thirds said they used some type of online tool, either a website (66%), social media (40%), or an app (18%). Nearly one-half (47%) said they relied on word of mouth, 10% mentioned a travel agent, and 5% said they responded to an email offer.*Multiple responses permitted.
Visitors who said they used a website, social media, or apps in planning their trip (over two-thirds of all visitors) were asked which social media or travel review apps they used. Nearly three-quarters (73%) said they used Google. Over four in ten (43%) visitors said they consulted reviews at online travel agencies, and about three in ten each said they consulted reviews at hotel or show venue sites (31%) or used Facebook (29%). About one-quarter (26%) said they used Vegas.com, 16% said they used TripAdvisor, 6% used Snapchat, 5% each used Instagram or Lasvegas.com, and 4% used Twitter.
FIGURE 19Social Media and Travel Review Apps or Websites Used
in Planning Trip to Las Vegas
FIGURE 18Tools Used in Planning Trip to Las Vegas*
PRINTED BROCHURES/TRAVEL GUIDES
LASVEGAS.COM
YELP
OPENTABLE
OTHER
GOOGLEPLUS
TRAVEL AGENT
VEGAS.COM
EMAIL OFFERS
TRIPADVISOR
MAGAZINES/NEWSPAPERS
SNAPCHAT
CASINO/HOTEL HOSTS
WEBSITES
WORD OF MOUTH
REVIEWS AT ONLINE TRAVEL AGENCIES
REVIEWS AT HOTEL OR SHOW VENUE SITES
APPS
SOCIAL MEDIA
47
43
66
73
26
16
10
5
4
3
2
6
5
5
4
3
3
2
4
40
31
18
29
0
0
30
30
60
60
90
90
PERCENT
PERCENT
2017 (BASE=2488)

2 0 1 7 L A S V E G A S V I S I T O R P R O F I L E
24
Beginning in 2017, visitors who arrived in Las Vegas by air were asked how they booked their flight. Three-quarters (75%) said they used a website or an app. Sixteen percent (16%) said they used a travel agent, and 4% said they booked their flight by phone.
Among those visitors who booked their transportation to Las Vegas online, 62% said they used an airline website, up from 56% last year, but down from 2013 – 2015 results. Ten percent (10%) said they used Expedia, down from 14% in 2016. Four percent (4%) each used Priceline and Travelocity, while 3% each used Orbitz and Kayak.com (up from 2% in 2015).
FIGURE 20How Booked Flight to Las Vegas
FIGURE 21Website Used to Book Flight
(Among Those Who Booked Their Transportation to Las Vegas Online)
PERC
ENT
WEBSITE OR APP
TRAVEL AGENT
BY PHONE OTHER NO ANSWER
75
4 41
16
0
25
50
75
100
2017 (BASE=1671)
PRICELINE
ORBITZ
TRAVELOCITY
AIRLINE WEBSITE
KAYAK.COM
OTHER
EXPEDIA
HOTWIRE
0 20 40 60 80PERCENT
71
45
43
4
54
32
3
3
2
2
23
3
1
76
1412
4
3
1210
1410
6667
6256
2013 (BASE=946)2014 (BASE=1064)2015 (BASE=1093)2016 (BASE=1310)2017 (BASE=1249)

2 0 1 7 L A S V E G A S V I S I T O R P R O F I L E
25
Among those visitors who booked their accommodations online for their current trip to Las Vegas, 34% said they used a hotel website, down significantly from 38% in 2013 and 41% in 2014, but up from 29% in 2015 and 30% in 2016. Eleven percent (11%) each used Expedia (down from 15% 2015 and 18% in 2016) or Hotels.com (down from 2013 – 2015 results), 6% each used Booking.com, Travelocity (up from 4% in 2015), or Vegas.com (up from 2% in 2014, 1% in 2015 and 3% in 2016), 4% used Priceline (down from 9% in 2015), and 3% each used Hotwire (down from 6% last year), Orbitz (up from 1% in 2014), or an airline website. The remaining visitors used a variety of other websites.
FIGURE 22Website Used to Book Accommodations
(Among Those Who Booked Their Accommodations in Las Vegas Online)
PRICELINE
BOOKING.COM
HOTELS.COM
A HOTEL WEBSITE
HOTWIRE
VEGAS.COM
AIRLINE WEBSITE
ORBITZ
OTHER
EXPEDIA
TRAVELOCITY
0 12 24 36 48PERCENT
38
1314
4
4
3
159
95
0
6
6
4
42
64
5
2
1
15
1
2
13
3
11
6
3
3
13
6
4
2
13
3
3
1312
11
11
1518
4129
3430
2013 (BASE=1362)2014 (BASE=1503)2015 (BASE=1647)2016 (BASE=1791)2017 (BASE=2031)

2 0 1 7 L A S V E G A S V I S I T O R P R O F I L E
26
Beginning in 2016, visitors were asked which, if any, social media and travel review apps they used during their trip to Las Vegas. Fifty-four percent (54%) of visitors said they used Google (up from 31% last year), 22% used Vegas.com, 20% consulted reviews at hotel or show venue sites, 18% used Facebook (up from 8% in 2016), 11% used TripAdvisor (down from 14% last year), 5% consulted reviews from online travel agencies (down from 9% in 2016), 4% mentioned SnapChat (up from 2%), and 3% each used OpenTable or Instagram. Thirty percent (30%) of visitors said they did not use any of these websites or apps, down from 48% in 2016.
Fifty-seven percent (57%) of visitors said they had visited Downtown Las Vegas on their current trip, up significantly from 2013 – 2016 results.* Only “yes” responses are reported in this chart.
FIGURE 24Whether Visited Downtown Las Vegas*
FIGURE 23Social Media And Travel Review Apps Used During Current Trip to Las Vegas
YELP
OTHER
NONE OF THESE
TRIPADVISOR
CONSULTED REVIEWS AT ONLINE TRAVEL AGENCIES
SNAPCHAT
OPENTABLE
VEGAS.COM
CONSULTED REVIEWS AT HOTEL OR SHOW VENUE SITES
22
5431
0
21
8
14
9
2
4
3
3
18
48
11
5
4
3
3
2
8
30
20
18
0 20 40 60PERCENT
PERC
ENT
2013 20172014 2015 2016
30 32
5357
36
0
15
30
45
60
2016
2017

2 0 1 7 L A S V E G A S V I S I T O R P R O F I L E
27
Visitors who visited Downtown Las Vegas on their current trip were asked the primary reason why they had done so. More than six in ten (63%, up from 59% each in 2013 and 2015) said it was to see the Fremont Street Experience. Nine percent (9%) each said they visited Downtown primarily to sightsee (up from 6% in 2013), or to dine (up from 6% in 2013 and 2% in 2015), 7% said they were lodging downtown (down from 17% in 2013 and 16% in 2015), 6% said they went Downtown primarily to gamble (down from 8% in 2013), and 1% said they went Downtown to shop (down from 4% in 2015).
Visitors who had not visited Downtown Las Vegas on their current trip were asked the primary reason why they had not done so. Forty-one percent (41%) said it was because they did not have enough time (up from 23% in 2014 and 31% in 2016), 37% said it was because they were not interested in Downtown (down from 55% in 2014), while 14% said they were unfamiliar with Downtown, and 4% said they did not go Downtown because it was inconvenient.* This question was asked every other year and was not asked in 2013, or 2015. Beginning in 2017, this question is asked yearly.
* This question was asked every other year and was not asked in 2014, or 2016. Beginning in 2017 this question is asked yearly.
FIGURE 26Main Reason for Not Visiting Downtown Las Vegas*
(Among Those Who Did Not Visited Downtown)
3837
23
12
4
1
2
5
3
322
4
4
1
1
1714
3141
OTHER
TO GAMBLE
TO SHOP
FREMONT STREET EXPERIENCE
SIGHTSEE
LODGING DOWNTOWN
TO DINE
63
9
59
11
2
16
6
4
3
59
6
6
17
8
1
3
9
7
6
1
5
0 20 40 60 80PERCENT
FIGURE 25Main Reason for Visiting Downtown Las Vegas*
(Among Those Who Visited Downtown)
2014 (BASE=2295)
2016 (BASE=1680)
2017 (BASE=1528)
2013 (BASE=1084)
2015 (BASE=1158)
2017 (BASE=2070)
PERCENT0 15 30 45 60
NO INTEREST
INCONVENIENT
OTHER
NOT ENOUGH TIME
PREFER STRIP
UNFAMILIAR WITH
DOWNTOWN
DON’T LIKE DOWNTOWN/
BAD AREA
55

2 0 1 7 L A S V E G A S V I S I T O R P R O F I L E
28
Visitors were asked if they visited any nearby places before or after their trip to Las Vegas and 21% said they had, up from 16% in 2014.
* This question is asked every other year and was not asked in 2013, 2015, or 2017.
Visitors were asked what other nearby destinations they had visited or planned to visit. The most common responses were the Grand Canyon (65%), Hoover Dam (57%), Zion National Park (12%, down from 20% in 2014), and Lake Mead (11%). Eight percent (8%) each said Bryce Canyon (down from 15% in 2014), Mt. Charleston/Lee Canyon (up from 2% in 2014), and Red Rock. Six percent (6%) said Death Valley (down from 13% in 2014), 5% each mentioned the Valley of Fire (down from 10% in 2014) and Laughlin (up from 3% in 2014), and 2% mentioned Primm, NV (up from less than 1% in 2014).* This question is asked every other year and was not asked in 2013, 2015, or 2017.
FIGURE 27Visits to Nearby Places*
(Asked Every Other Year)
PERC
ENT
2014 2016
21
16
0
6
12
18
24
2014
2016
FIGURE 28Other Nearby Places Visited*
(Among Those Who Planned to Visit Other Places – Asked Every Other Year)
65
51
20
12
57
2014 (BASE=566)
2016 (BASE=746)
PERCENT0 20 40 60 80
GRAND CANYON
BRYCE CANYON
RED ROCK CANYON
LAKE MEAD
PRIMM
OTHER
HOOVER DAM
DEATH VALLEY
LAUGHLIN
ZION NATIONAL
PARK
VALLEY OF FIRE
MOUNT CHARLESTON
67
15
10
13
8
5
8
3
2
3
0
5
11
5
8
4
2
8
6

2 0 1 7 L A S V E G A S V I S I T O R P R O F I L E
29
TRIP CHARACTERISTICS AND EXPENDITURESVisitors were asked how many adults were in their immediate party. Seventy percent (70%) said there were two, up significantly from 67% each in 2013 and 2014. Four percent (4%) said they were in a party of three adults (down from past results), 10% said they were in a party of four (down from 12% each in 2013 and 2014, but up from 8% in 2015), and 5% said they were in a party of five or more (up from 3% in 2015). Eleven percent (11%) of visitors traveled alone, up from 9% each in 2013 and 2014. The average party size in 2017 was 2.3 persons, down from 2.4 each in 2013 and 2014, but up from 2.2 in 2015.
We asked visitors whether they had any people under the age of 21 traveling with them in their immediate party. Eight percent (8%) said they did, down from 10% each in 2013 and 2014 and 12% in 2016. * Only “yes” responses are reported
in this chart.
2013 (MEAN=2.4)
2014 (MEAN=2.4)
2015 (MEAN=2.2)
2016 (MEAN=2.4)
2017 (MEAN=2.3)
9 913 11 12
89
12 10
35 55
67 6771
69 70
57 7 6 64
11
0
15
30
45
60
75
ONE TWO THREE FOUR MORE THAN FIVE
PERC
ENT
FIGURE 29Adults in Immediate Party
FIGURE 30Whether Had Persons in Immediate Party Under Age 21*
(Among All Visitors)
PERC
ENT
2013 20172014 2015 2016
108
12
810
0
5
10
15

2 0 1 7 L A S V E G A S V I S I T O R P R O F I L E
30
In 2017, visitors stayed an average of 3.5 nights and 4.5 days in Las Vegas, up significantly from 3.3 nights and 4.3 days in 2013, 3.2 nights and 4.2 days in 2014, and 3.4 nights and 4.4 days in 2014.
FIGURE 31Nights Stayed
FIGURE 32Days Stayed
2013 (MEAN=3.3)
2014 (MEAN=3.2)
2015 (MEAN=3.4)
2016 (MEAN=3.4)
2017 (MEAN=3.5)
2013 (MEAN=4.3)
2014 (MEAN=4.2)
2015 (MEAN=4.4)
2016 (MEAN=4.4)
2017 (MEAN=4.5)
THREE
FOUR
TWO
NONE
FIVE OR MORE
ONE
0 15 30 45 60PERCENT
22
7
3022
3328
21
8
2932
2119
1822
21
242121
16
18
7
0
THREE
FOUR
TWO
FIVE
SIX OR MORE
ONE
22
7
3022
3328
21
8
2932
2119
1822
21
2421
16
18
7
0
0 15 30 45 60PERCENT

2 0 1 7 L A S V E G A S V I S I T O R P R O F I L E
31
Thirty-three percent (33%) of visitors arrived in Las Vegas on a weekend (up from 30% each in 2014, 2015, and 2016), while 67% arrived on a weekday, down from 70% each from 2014 – 2016. * Weekday is defined as Sunday through Thursday. Weekend is defined as Friday and Saturday.
Among visitors who stayed in Las Vegas overnight, 90% stayed in a hotel (down from 93% in 2013. 94% in 2014, and 92% in 2015) and 3% stayed in a motel (down from 4% each in 2015 and 2016). Less than 1% stayed in an RV park (down from past results) and 6% stayed with friends or relatives (up from 2013 – 2016 results).* Includes respondents who stayed in a time share.
FIGURE 34Type of Lodging
(Among Those Who Stayed Overnight)
WEEKDAY
WEEKEND
FIGURE 33Weekend Vs. Weekday Arrival*
PERC
ENT
2013 20172014 2015 2016
69 70 70 6770
31 30 30 3033
0
20
40
60
80
2013 (BASE=3592)
2014 (BASE=3586)
2015 (BASE=3600)
2016 (BASE=3597)
2017 (BASE=3596)
93 94 92 90
2 4 426
3 3 4 4 3 2 2 0 1 0
90
0
25
50
75
100
HOTEL* MOTEL RV PARK FRIENDS/RELATIVES
PERC
ENT

2 0 1 7 L A S V E G A S V I S I T O R P R O F I L E
32
In terms of lodging location (among those who stayed overnight), 73% stayed in a property on the Strip Corridor (down from 77% in 2013 and 76% in 2014), 5% stayed Downtown (down from 6% last year) and 2% stayed on the Boulder Strip (down from 3% each in 2013 and 2014). Thirteen percent (13%) stayed in outlying parts of Las Vegas and 7% stayed in other locations.* The Strip Corridor includes properties located directly on Las Vegas Boulevard South, as well as properties near the Strip, between Valley View Blvd. and Paradise Road.
Visitors who stayed at a hotel, motel or RV park were asked how they booked their accommodations in Las Vegas. In 2017, over six in ten (62%) overall said they used a website. Forty-one percent (41%, up from 2013 – 2016 results) said they used a third party website, while 21% said they used a hotel website (also up from 2013 – 2016 results). Twelve percent (12%) said they called the hotel, motel, or RV park directly (down significantly from past results) and 10% said they booked through a travel agent, down from 13% in 2013 and 14% each in 2014 and 2015.
FIGURE 35Location of Lodging*
(Among Those Who Stayed Overnight)
FIGURE 36How Booked Accommodations in Las Vegas
(Among Those Who Stayed in a Hotel/Motel/RV Park)
THIRD PARTY WEBSITE OR APP
HOTEL WEBSITE OR APP
TRAVEL AGENT
IN PERSON
PHONE, THIRD PARTY
SOMEONE ELSE BOOKED
2425
41
3536
1518
1416
13
2
2
1414
1110
3
6
12
122
1
21
CALLED PROPERTY DIRECTLY
3833
2618
12
0 15 30 45PERCENT
2013 (BASE=3592)
2014 (BASE=3586)
2015 (BASE=3600)
2016 (BASE=3597)
2017 (BASE=3596)
2013 (BASE=3478)
2014 (BASE=3572)
2015 (BASE=3367)
2016 (BASE=3405)
2017 (BASE=3284)
77 76 75 75
13
2
14
4
12
5
14
2
13
75 5 5 6 5 3 3 2 1 2
73
0
25
50
75
100
THE STRIPCORRIDOR
DOWNTOWN BOULDER STRIP OUTLYING AREAS
OTHER
PERC
ENT

2 0 1 7 L A S V E G A S V I S I T O R P R O F I L E
33
We asked those staying in a hotel, motel, or RV park how far in advance they had booked their accommodations. Twenty-two percent (22%) of these visitors booked one week to one month in advance, down significantly from 2013 – 2016 results. Two-thirds (67%) booked more than a month in advance, up significantly from past years. Nine percent (9%) reported making their reservations less than one week before arrival, down from 10% in 2014, 11% in 2015, and 18% in 2016. * May reflect impacts of updated survey locations and cancellations and/or postponements of near-term bookers following the 1 October shooting in the destination.
FIGURE 37Advance Booking of Accommodations*
(Among Those Who Stayed in a Hotel/Motel/RV Park)
2013 (BASE=3478)
2014 (BASE=3472)
2015 (BASE=3367)
2016 (BASE=3405)
2017 (BASE=3284)
0 15 30 45PERCENT
7 TO 14 DAYS
15 TO 30 DAYS
4 TO 6 DAYS
SAME DAY
31 TO 60 DAYS
MORE THAN 90 DAYS
NOT SURE/ NO ANSWER
1 TO 3 DAYS
61 TO 90 DAYS
46
22
9
28
5
13
4137
3320
13
2220
6
1613
1225
65
89
1322
21
7
0
12
3
4
3
7
23
26

2 0 1 7 L A S V E G A S V I S I T O R P R O F I L E
34
Visitors staying in a hotel or motel were shown a card describing various room rates and were asked which type of room rate they had received. One half (50%) of these visitors said they paid a regular room rate, up significantly from 32% in 2013, 33% in 2014, and 27% in 2015. Ten percent (10%) received a casino complimentary rate (down from 2013 – 2015 results), while 3% paid a casino rate (down from past results). Seventeen percent (17%) of visitors paid a package rate (up from 10% in 2013 and 14% in 2015), while 1% received a tour group rate
Eighteen percent (18%) of visitors purchased a package deal or were part of a tour group, up significantly from 13% in 2013, and 15% in 2015.
(down from 3% in 2013, 4% in 2014, and 2% in 2016). Six percent (6%) paid a convention rate (up from 3% in 2013). The remaining 13% paid some other kind of special rate, down from 25% in 2013, 21% in 2014, and 32% in 2015, but up from 10% last year.* For an exact description of the room rates as presented to respondents, see “Hotel/Motel Rates” card at the end of the aggregate results in the appendix to this report.
FIGURE 38Type of Room Rate*
(Among Those Staying in a Hotel or Motel)
32
19
1518
33
1010
1514
173
56
6
1
12
4
13
2521
3210
3
64
74
3
7
2749
50
0 15 30 45 60
PACKAGE
CONVENTION
CASINO COMPLIMENTARY
REGULAR RATE
CASINO RATE
TOUR GROUP
ANOTHER SPECIAL RATE
PERCENT
2013 (BASE=3418)
2014 (BASE=3404)
2015 (BASE=3356)
2016 (BASE=3355)
2017 (BASE=3290)
2013 (BASE=3418)
2014 (BASE=3404)
2015 (BASE=3356)
2016 (BASE=3355)
2017 (BASE=3290)
FIGURE 39Package Purchases
(Among Those Staying in a Hotel or Motel)
PERC
ENT
2013 20172014 2015 2016
1315
19 1818
0
10
20
30
2 0 1 7 L A S V E G A S V I S I T O R P R O F I L E
35
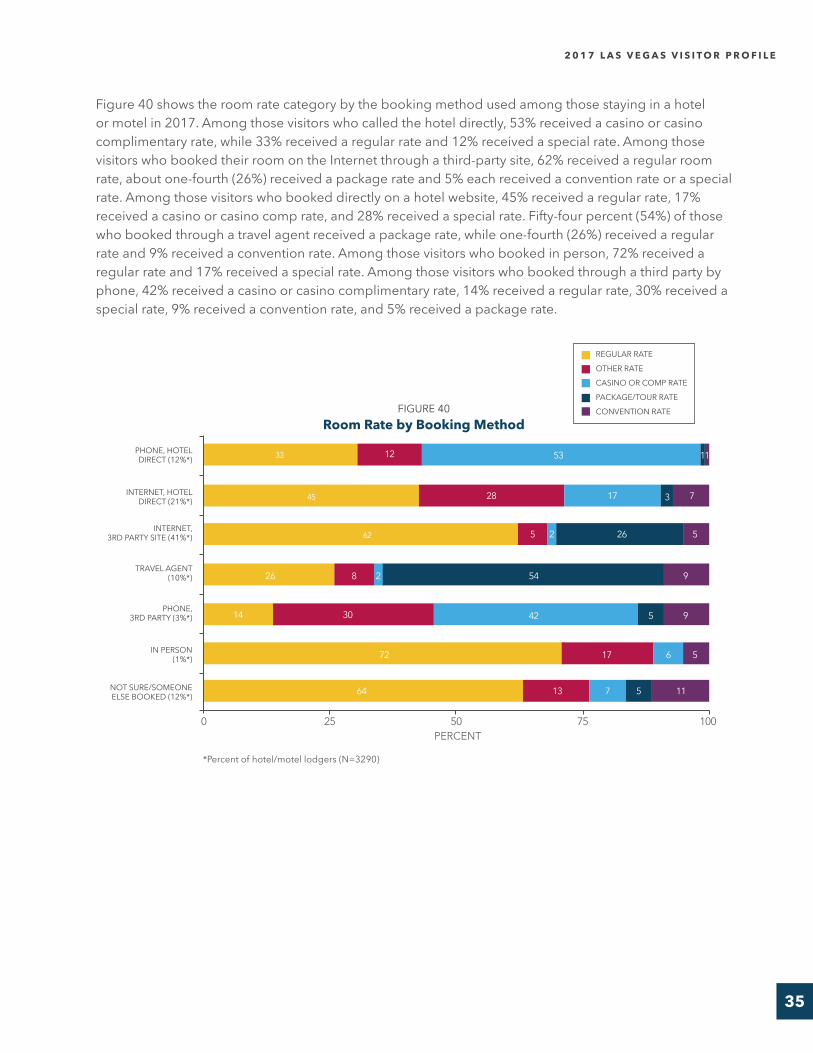
Figure 40 shows the room rate category by the booking method used among those staying in a hotel or motel in 2017. Among those visitors who called the hotel directly, 53% received a casino or casino complimentary rate, while 33% received a regular rate and 12% received a special rate. Among those visitors who booked their room on the Internet through a third-party site, 62% received a regular room rate, about one-fourth (26%) received a package rate and 5% each received a convention rate or a special rate. Among those visitors who booked directly on a hotel website, 45% received a regular rate, 17% received a casino or casino comp rate, and 28% received a special rate. Fifty-four percent (54%) of those who booked through a travel agent received a package rate, while one-fourth (26%) received a regular rate and 9% received a convention rate. Among those visitors who booked in person, 72% received a regular rate and 17% received a special rate. Among those visitors who booked through a third party by phone, 42% received a casino or casino complimentary rate, 14% received a regular rate, 30% received a special rate, 9% received a convention rate, and 5% received a package rate.
FIGURE 40Room Rate by Booking Method
PHONE, HOTEL DIRECT (12%*)
INTERNET, HOTEL DIRECT (21%*)
INTERNET, 3RD PARTY SITE (41%*)
TRAVEL AGENT (10%*)
PHONE, 3RD PARTY (3%*)
IN PERSON(1%*)
NOT SURE/SOMEONE ELSE BOOKED (12%*)
0 25 50 75 100PERCENT
53
17
7
2
2
12
28
5
8
3014
1364
72 17 6
26
33
45
62
1
3
26
5
5
54
42
1
9
9
11
7
5
5
*Percent of hotel/motel lodgers (N=3290)
REGULAR RATE
OTHER RATE
CASINO OR COMP RATE
PACKAGE/TOUR RATE
CONVENTION RATE

2 0 1 7 L A S V E G A S V I S I T O R P R O F I L E
36
We asked those who had purchased a hotel, airline, or a tour/travel group package how much their packages cost per person. The average cost of such a package in 2017 was $858.52, not significantly different from past years results.
$600 – $999
NO ANSWER
$1,000 OR MORE
$400 – $599
$1 – $399
13
25
28
32
19
27
27
28
28
31
22
27
2028
1422
298
1217
FIGURE 41Cost of Package Per Person
(Among Those Who Bought a Package)
0 15 30 45PERCENT
26
1015
13
2013 (MEAN=$868.24; BASE=459)
2014 (MEAN=$815.14; BASE=620)
2015 (MEAN=$857.43; BASE=494)
2016 (MEAN=$921.04; BASE=647)
2017 (MEAN=$858.52; BASE=586)

2 0 1 7 L A S V E G A S V I S I T O R P R O F I L E
37
We looked at lodging expenditures among those who did not purchase travel packages and were not comped for their stay. More than one-third (36%) of these non-package visitors paid between $50 and $99 per night for their room, down significantly from 2013 – 2015 results. Thirty-two percent (32%) paid between $100 and $149 per night, up from 2013 – 2016 results. Twenty-one percent (21%) paid a nightly rate of $150 or more, up significantly from 8% in 2013, 9% in 2014 and 16% in 2015. Three percent (3%) paid less than $50, down from 2013 –2016 figures. The average daily room rate for non-package visitors in 2017 was $114.85, similar to last year, and up significantly from $83.62 in 2013, $86.55 in 2014 and $102.64 in 2015.
$100 – $149
NOT SURE
$150 OR MORE
$50 – $99
$1 – $49
16
52
23
8
20
9
23
16
26
25
32
21
5153
3736
1656
3
FIGURE 42Lodging Expenditures – Average Per Night
(Among Those Staying in a Hotel/Motel/Non-Package and Non-Comp)
0 20 40 60PERCENT
34
378
2013 (MEAN=$83.62; BASE=2296)
2014 (MEAN=$86.55; BASE=2166)
2015 (MEAN=$102.64; BASE=2351)
2016 (MEAN=$116.15; BASE=2370)
2017 (MEAN=$114.85; BASE=2376)

2 0 1 7 L A S V E G A S V I S I T O R P R O F I L E
38
Non-package hotel or motel lodgers were asked how they first found out about the room rate they paid. Fifty-six percent (56%) mentioned a website, up from 2013 – 2016 results. Seventeen percent (17%) said it was through word of mouth, while 9% mentioned a reservation agent or call center (down from 2013 – 2016 results). Seven percent (7%) mentioned a search engine or hyperlink (up from past results), while 5% mentioned a travel agent (down from 7% in 2013 and 9% in 2015).
As in past years, the majority of visitors who stayed in a hotel or motel said two people stayed in their room (79%, up from 2013 – 2016 results). Twelve percent (12%) said they were lodging alone (down from 15% in 2015), 5% said three people stayed in their room (down from 8% each in 2013 and 2014 and 7% each in 2015 and 2016), while 4% said four or more people stayed in their room (down from 9% in 2013 and 8% each in 2014 and 2016). The mean (average) number of room occupants was 2.0, down from 2.2 in 2013, and 2.1 each in 2014 and 2016.
FIGURE 43How First Found Out About Room Rate
(Among Those Who Stayed in a Hotel or Motel/Non-Package)
2013 (BASE=2296)
2014 (BASE=2166)
2015 (BASE=2351)
2016 (BASE=2370)
2017 (BASE=2376)
0 15 30 45 60PERCENT
INTERNET AD
TRAVEL AGENT
WORD-OF-MOUTH
ANY WEBSITE
SEARCH ENGINE/ HYPERLINK
OTHER
NOT SURE
RES. AGT/ CALL CENTER
DIRECT MAIL
1716
9
0
1011
1717
8
76
96
5
57
3
00
31
52
35
3
32
2
0
1
1820
179
17
14
4442
3656
40
11 1115 13
94
884
71 73 74 73
79
8 8 7 75
12
0
20
40
60
80
ONE TWO THREE FOUR OR MORE
PERC
ENT
FIGURE 44Number of Room Occupants
(Among Those Staying in a Hotel or Motel)
2013 (MEAN=2.2; BASE=3470)
2014 (MEAN=2.1; BASE=3453)
2015 (MEAN=2.0; BASE=3439)
2016 (MEAN=2.1; BASE=3404)
2017 (MEAN=2.0; BASE=3363)

2 0 1 7 L A S V E G A S V I S I T O R P R O F I L E
39
Figure 45 shows the average trip expenditures on food and drink and on local transportation including visitors who said they spent nothing in that category. The average expenditure on food and drink in 2017 was $376.97, up significantly from $278.95 in 2013, $281.88 in 2014, $292.00 in 2015, and $318.09 last year. The average transportation expenditure for 2017 was $88.29, up from $59.68 in 2013, $68.83 in 2014, and $73.45 in 2015.
Among visitors who actually spent money in these categories, the average trip expenditure on food and drink in 2017 was $377.85, up significantly from $281.06 in 2013, $286.78 in 2014, $292.42 in 2015, and $319.93 last year. The average trip expenditure on local transportation for 2017 was $98.14, down from 2013 – 2016 results.
*Trip expenditures are calculated by multiplying respondents’ estimated daily expenditures by the number of days they had spent in Las Vegas on their most recent trip.
FIGURE 45
FIGURE 46
Average Trip Expenditures on Food & Drink – and On Local Transportation*
(Including Visitors Who Spent Nothing in that Category)
Average Trip Expenditures on Food & Drink – and On Local Transportation
(Including Visitors Who Spent Money in that Category)
2013
2014
2015
2016
2017
2013
2014
2015
2016
2017
FOOD & DRINK
FOOD & DRINK
LOCAL TRANSPORTATION
LOCAL TRANSPORTATION
$0
$0
$90
$90
$180
$180
$270
$270
$360
$360
$450
$450
AVERAGE DOLLARS PER TRIP
AVERAGE DOLLARS PER TRIP
$278.95
$281.06
$59.68
$107.26
$68.83
$114.55
$73.45
$118.26
$96.08
$119.76
$88.29
$98.14
$281.88
$286.78
$318.09
$319.93
$376.97
$377.85
$292.00
$292.42
2013 2014 2015 2016 2017
Food and Drink Base size Proportion of total
(3573)99.2%
(3538)98.3%
(3596)99.9%
(3579)99.4%
(3592)99.8%
Local Transportation Base size Proportion of total
(2004)56%
(2164)60%
(2241)62%
(2899)81%
(3239)90%
Percentages of respondents who spent money in each category are shown in the following table:

2 0 1 7 L A S V E G A S V I S I T O R P R O F I L E
40
Figure 47 shows average expenditures on shopping, shows, and sightseeing during the entire visit to Las Vegas — including visitors who said they spent nothing in these categories. The average trip expenditure on shopping was $143.13, up significantly from $122.66 in 2015. The average expenditure on shows was $60.22, up from $38.45 in 2013 and $47.56 in 2014. The average expenditure on sightseeing was $31.41, up from 2013 – 2015 figures.
Among spending visitors, the average trip shopping expenditure was $193.68, down from $237.41 in 2013, $246.12 in 2014 and $229.97 last year. The average trip total spent on shows was $139.77, up from $121.19 in 2013. The sightseeing total was $163.70, up from $126.17 in 2013 and $125.63 in 2014.
Percentages of respondents who spent money in each category are shown in the following table:
2013
2014
2015
2016
2017
2013
2014
2015
2016
2017
SHOPPING
SHOPPING
SHOWS & ENTERTAINMENT
SHOWS & ENTERTAINMENT
SIGHTSEEING
SIGHTSEEING
$0
$0
$75
$100
$150
$200
$225
$300
AVERAGE DOLLARS PER TRIP
AVERAGE DOLLARS PER TRIP
$140.90
$237.41
$9.29$14.49$14.86
$35.93$31.41
$149.77
$246.12
$122.66
$214.86
$38.45
$121.19$138.33$138.02
$142.66$139.77
$126.17$125.63
$180.97$172.39
$163.70
$47.56$61.95
$67.55$60.22
$156.91
$229.97
$143.13
$193.68
FIGURE 47Average Trip Expenditures on Shopping, Shows and Sightseeing
(Including Visitors Who Spent Nothing in That Category)
FIGURE 48Average Trip Expenditures on Shopping, Shows and Sightseeing
(Among Visitors Who Spent Money in That Category)
2013 2014 2015 2016 2017
Shopping Base size Proportion of total (2138)
59%(2192)61%
(2057)57%
(2473)69%
(2662)74%
Shows/Entertainment Base size Proportion of total (1143)
32%(1240)35%
(1617)45%
(1748)49%
(1556)43%
Sightseeing Base size Proportion of total (266)
7%(417)12%
(296)8%
(825)23%
(712)20%

2 0 1 7 L A S V E G A S V I S I T O R P R O F I L E
41
GAMING BEHAVIOR AND BUDGETSSeventy-four percent (74%) of all visitors said they gambled while in Las Vegas, up from 71% each in 2013 and 2014 and 69% last year.* Only “yes” responses are reported in this chart.
Among those who gambled while in Las Vegas, 77% gambled for two hours or less, up significantly from each of the past four years. Seventeen percent (17%) gambled for three to four hours, down significantly from 2013 – 2015 results. Seven percent (7%) gambled five or more hours, also down significantly from past results. The average amount of time spent gambling per day was 1.6 hours, down significantly from each of the past four years.
FIGURE 49Whether Gambled While in Las Vegas
PERC
ENT
2013 20172014 2015 2016
71 7369
7471
0
20
40
60
80
5 TO 6
MORE THAN EIGHT
7 TO 8
3 TO 4
2 OR LESS
50
30
13
6
11
6
12
11
7
3
5
1
2226
1817
6050
7177
FIGURE 50Hours of Gambling – Average Per Day
(Among Those Who Gambled)
0 20 40 60 80PERCENT
1
2013 (MEAN=2.9; BASE=2553)
2014 (MEAN=2.6; BASE=2551)
2015 (MEAN=2.9; BASE=2630)
2016 (MEAN=1.9; BASE=2483)
2017 (MEAN=1.6; BASE=2652)

2 0 1 7 L A S V E G A S V I S I T O R P R O F I L E
42
All visitors to Las Vegas were asked how many casinos they had visited, and in how many of those casinos they had gambled. The average number of casinos visited in 2016 was 6.3, (up from 5.7 in 2014), and the number of casinos at which visitors gambled was 2.0.*These questions are asked every other year and were not asked in 2013, 2015 or 2017.
2
31
8
23
27
18
24
9
25
15
12
4
1
0
29
10
22
24
17
31
11
29
18
6
3
2014 (MEAN=5.7)
2016 (MEAN=6.3)
2014 (MEAN=2.1)
2016 (MEAN=2.0)
FIGURE 51
FIGURE 52
Number of Casinos Visited*
Number of Casinos Where Gambled*
NONE
NONE
ONE
ONE
TWO TO FOUR
TWO
FIVE TO SIX
THREE
SEVEN TO TEN
FOUR TO SIX
ELEVEN OR MORE
SEVEN TO TEN
ELEVEN OR MORE
0 10 20 30 40PERCENT
0 10 20 30 40PERCENT
2 0 1 7 L A S V E G A S V I S I T O R P R O F I L E
43
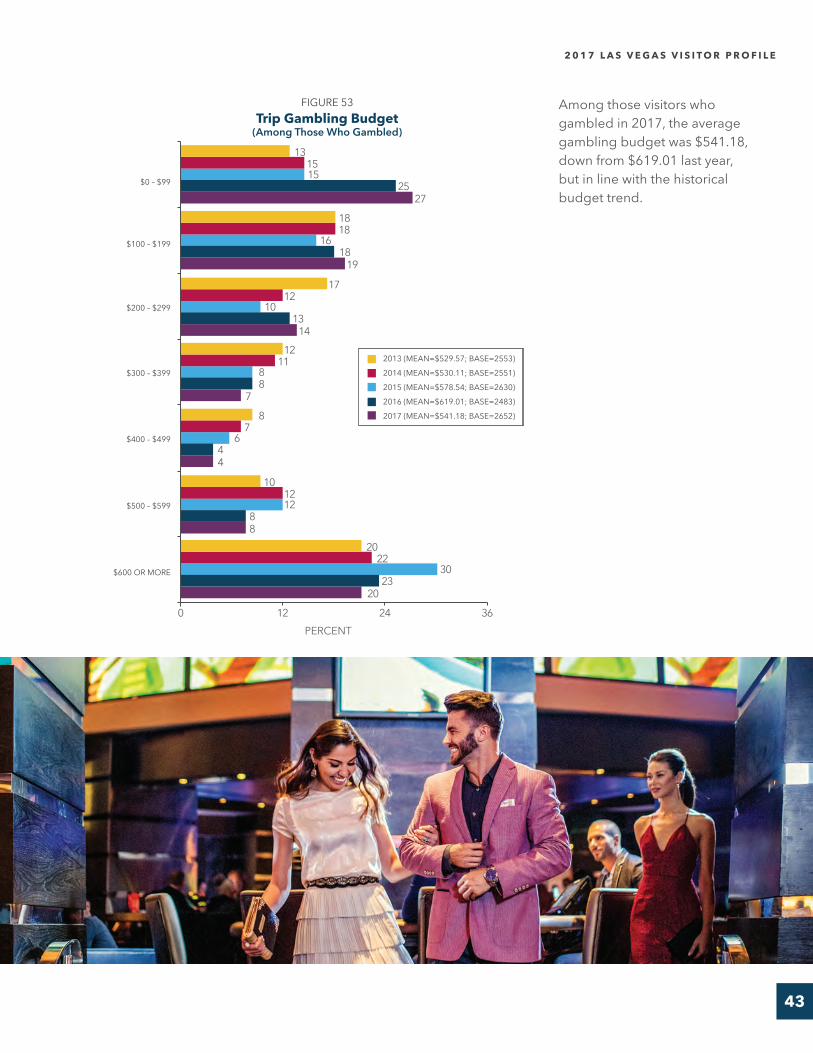
Among those visitors who gambled in 2017, the average gambling budget was $541.18, down from $619.01 last year, but in line with the historical budget trend.
$200 – $299
$500 – $599
$600 OR MORE
$400 – $499
$300 – $399
$100 – $199
$0 – $99
13
18
17
12
8
10
20
15
18
12
11
7
12
22
15
16
10
8
6
12
30
25
18
13
8
4
8
23
27
19
14
7
4
8
20
FIGURE 53Trip Gambling Budget
(Among Those Who Gambled)
0 12 24 36PERCENT
2013 (MEAN=$529.57; BASE=2553)
2014 (MEAN=$530.11; BASE=2551)
2015 (MEAN=$578.54; BASE=2630)
2016 (MEAN=$619.01; BASE=2483)
2017 (MEAN=$541.18; BASE=2652)

2 0 1 7 L A S V E G A S V I S I T O R P R O F I L E
44
Most visitors (89%) gambled on the Strip Corridor. Forty percent (40%) said they gambled Downtown (up from 27% in 2013 and 31% in 2015), 5% gambled in the Boulder Strip area, 2% gambled in North Las Vegas, and less than 1% gambled in outlying areas.* This question is asked every other year and was not asked in 2014 or 2016.
PERC
ENT
THE STRIP CORRIDOR
BOULDER STRIP
NORTH LAS VEGAS
OUTLYING OTHERDOWNTOWN
88
27
60
88
31
3 1 155
89
40
52 3
0
20
40
60
80
100
FIGURE 54Where Visitors Gambled*
(Among Those Who Gambled – Asked Every Other Year)
2013 (BASE=2553)
2015 (BASE=2630)
2017 (BASE=2652)

2 0 1 7 L A S V E G A S V I S I T O R P R O F I L E
45
ENTERTAINMENTFifty-nine percent (59%) of visitors attended shows during their stay, down from 72% in 2013 and 65% in 2014, but up from 52% last year.* Only “yes” responses are reported in this chart.
In 2017, 50% of visitors who saw a show in Las Vegas went to a lounge act, down from 2013 – 2015 results, but up from 43% last year. Twenty-seven percent (27%) went to a production or Broadway-type show, down from 34% in 2014, 41% in 2015, and 32% last year. Twenty-one percent (21%) saw a headliner, up from 13% in 2013, and 17% in 2014, but down from 26% in 2015. Thirteen percent (13%) saw a comedy show (up from 8% in 2013 and 10% in 2014, but down from 17% last year), 6% saw a magic show, 5% saw an impersonator/tribute show, 11% saw a celebrity DJ (up from 8% in 2016), and 6% went to a sporting event.* Celebrity DJ category added in 2016. Sporting Events category added in 2017.
FIGURE 55Attended a Show*
PERC
ENT
2013 20172014 2015 2016
72
61
5259
65
0
20
40
60
80
LOUNGE ACTS
MAGIC SHOWS
SPORTING EVENTS
CELEBRITY DJs
IMPERSONATORS/TRIBUTE SHOWS
COMEDY REVUES
PRODUCTION/BROADWAY
SHOWS
HEADLINERS
13
25
87
8
4
4
17
34
77
10
4
5
26
41
72
12
5
7
24
32
43
17
6
4
8
21
27
50
13
5
6
11
6
FIGURE 56Types of Entertainment*
(Among Those Who Attended Some Form of Entertainment)
0 30 60 90PERCENT
2013 (BASE=2607)
2014 (BASE=2349)
2015 (BASE=2195)
2016 (BASE=1865)
2017 (BASE=2120)

2 0 1 7 L A S V E G A S V I S I T O R P R O F I L E
46
Visitors who saw shows were asked how many shows of each type they saw. The average number of shows attended was highest for visitors who saw lounge acts (1.4, down significantly from 2.2 in 2013 and 1.7 in 2014). Visitors saw an average 1.1 production and Broadway-type shows (down from 1.2 last year), 1.1 comedy shows (down from 1.2 each in 2013 and 2014 and 1.4 last year), 1.1 celebrity DJ shows (down from 1.2 last year), 1.1 headliners (down from 1.2 in 2013), 1.0 each impersonators/tribute shows and magic shows, and 1.3 sporting events.* Celebrity DJ category added in 2016. Sporting Events category added in 2017.
LOUNGE ACTS
MAGIC SHOWS
SPORTING EVENTS
CELEBRITY DJs
IMPERSONATORS/TRIBUTE SHOWS
COMEDY REVUES
PRODUCTION/BROADWAY
SHOWS
HEADLINERS
1.2
1.2
2.2
1.2
1.0
1.1
1.1
1.2
1.7
1.2
1.1
1.0
1.3
1.2
1.4
1.1
1.0
1.0
1.1
1.2
1.4
1.4
1.1
1.0
1.2
1.1
1.1
1.4
1.1
1.0
1.0
1.1
1.3
FIGURE 57Average Number of Shows Attended*
(Among Those Who Attended Some Form of Entertainment)
0 1 2 3AVERAGE NUMBER OF SHOWS ATTENDED
2013 (BASE=2607)
2014 (BASE=2349)
2015 (BASE=2195)
2016 (BASE=1865)
2017 (BASE=2120)

2 0 1 7 L A S V E G A S V I S I T O R P R O F I L E
47
We asked all visitors if they had been to other Las Vegas attractions for which they had to pay, such as the theme parks, water parks or roller coasters. Twenty-six percent (26%) said yes, up from 15% in 2013, 19% in 2014, and 20% in 2015, but down from 30% last year.* Only “yes” responses are reported in this chart.
Visitors who did not attend any shows while in Las Vegas were asked why. Forty-three percent (43%) said it was because they were too busy (down from 61% in 2014). Thirty-six percent (36%) said they were not interested in shows (up from 25% in 2014), 10% said the shows were too expensive (up from 7% in 2014), 3% said they were visiting with children (up from 1% in 2014) and 2% each said they came to Las Vegas only to gamble or that they had already seen all the shows (up from 1% in 2014).* This question is asked every other year and was not asked in 2013, 2015, or 2017.
FIGURE 58Main Reason for Not Attending Any Shows*
(Among Those Who Attended No Shows– Asked Every Other Year)
43
25
7
10
36
2014 (BASE=1250)
2016 (BASE=1735)
PERCENT0 20 40 60 80
TOO BUSY/NOT ENOUGH TIME
SEEN EVERYTHING
ALREADY
OTHER
SHOW SOLD OUT/CLOSED
NOT INTERESTED IN SHOWS
VISITING WITH CHILDREN
TOO EXPENSIVE
CAME TO GAMBLE ONLY
61
1
2
1
2
2
1
2
1
2
3
FIGURE 59Whether Has Been to Other Paid Attractions*
PERC
ENT
2013 20172014 2015 2016
15
20
30
26
19
0
10
20
30
40

2 0 1 7 L A S V E G A S V I S I T O R P R O F I L E
48
Visitors were asked if they visited nightclubs, bars, or lounges while in Las Vegas. More than two-thirds (68%) said they had been to a no-cover hotel bar or lounge (up from 2013 – 2016 results), 13% had been to a hotel nightclub that charged a cover fee (up from 2013 – 2015 results, but down from 15% last year), 36% had been to a no-cover free-standing bar or lounge (up from 2013 – 2016 results), 7% had been to a free-standing nightclub that charged a cover fee (up from 2013 – 2015 results, but down from 13% last year), and 7% had been to a pool party or day club (up from 2013 – 2015 results, but down from 11% last year).* Only “yes” responses are reported in this chart.
Visitors were asked if they had visited a spa during this trip to Las Vegas. In 2016, 5% said they had, down from 7% in 2014.* This question is asked every other year and was not asked in 2013, 2015, or 2017.
HOTEL BAR OR LOUNGE,
NO COVER
FREESTANDING BAR OR LOUNGE,
NO COVER
FREESTANDING NIGHTCLUB
WITH COVER
HOTEL NIGHTCLUB WITH COVER
A POOL PARTY OR DAY CLUB
33
8
1
1
1
45
8
2
2
2
44
5
2
1
1
54
15
20
13
11
68
13
36
7
7
FIGURE 60
FIGURE 61
Whether Has Been to Nightclubs, Bars and Lounges*
Whether Visited a Spa*
0 30 60 90PERCENT
2013
2014
2015
2016
2017
PERC
ENT
2014 20160
2
4
6
8
5
7
2014
2016

2 0 1 7 L A S V E G A S V I S I T O R P R O F I L E
49
ATTITUDINAL INFORMATIONIn 2017, 99% of Las Vegas visitors said they were satisfied with their visit to Las Vegas, with 76% saying they were “very satisfied” (down from 2013 – 2016 results), and 23% saying they were “somewhat satisfied” with their Las Vegas visit, up from past results.
Visitors who were not completely satisfied with their visit were asked to volunteer why. Fourteen percent (14%) each said their trip was too short (down from 28% in 2014) or that it’s too hard to get around Las Vegas (up from 1% in 2014). Twelve percent (12%) said Las Vegas is too expensive and 10% had complaints about their hotel. Among other reasons given were that Las Vegas is too hot (7%, up from 3% in 2014), that the trip was a business trip and not a pleasure trip (7%), that Las Vegas is too crowded (6%), or that they simply don’t like Las Vegas (5%).* This question is asked every other year and was not asked in 2013, 2015, or 2017.
VERY SATISFIED
SOMEWHAT SATISFIED
FIGURE 62Satisfaction With Visit
PERC
ENT
2013 20172014 2015 2016
89 96 89 7689
10
4
11 10
23
0
25
50
75
100
FIGURE 63Why Not Completely Satisfied With Visit*
(Among Those Who Were “Somewhat” Satisfied - Asked Every Other Year)
14
1
1312
14
2014 (BASE=149)
2016 (BASE=369)
PERCENT0 10 20 30
TRIP WAS TOO SHORT
HOTEL COMPLAINTS
TOO CROWDED
TOO HOT
TOO HARD TOGET AROUND
NOT A PLEASURE TRIP
TOO EXPENSIVE
DON’T LIKE LAS VEGAS
SMOKING COMPLAINTS
OTHER
DON’T KNOW/ NO ANSWER
DIDN’T WIN ENOUGH
GAMBLING
28
16
4
7
10
5
3
3
3
10
9
0
7
6
4
3
17
1
7

2 0 1 7 L A S V E G A S V I S I T O R P R O F I L E
50
Very few visitors said they were dissatisfied with their visit to Las Vegas. These few dissatisfied visitors were asked to volunteer why they were not satisfied with their visit. The most frequently mentioned reasons for being dissatisfied were that they simply don’t like Las Vegas (17%), that it’s too hard to get around Las Vegas (14%), complaints about their hotel (13%), smoking complaints (9%), or that they think Las Vegas is too expensive or were in town on a business trip (8% each).* This question is asked every other year and was not asked in 2013, 2015, or 2017.
FIGURE 64Why Dissatisfied With Visit*
(Among Those Who Were Dissatisfied Satisfied - Asked Every Other Year)
17
0
1413
14
2014 (BASE=10)
2016 (BASE=44)
PERCENT0 20 40 60
DON’T LIKE LAS VEGAS
SMOKING COMPLAINTS
OTHER
NOT A PLEASURE TRIP
TOO HARD TOGET AROUND
TOO EXPENSIVE
HOTEL COMPLAINTS
SOMEONE IN PARTY GOT SICK
DON’T KNOW/NO ANSWER
0
0
8
29
9
5
0
49
0
8
26
0
8
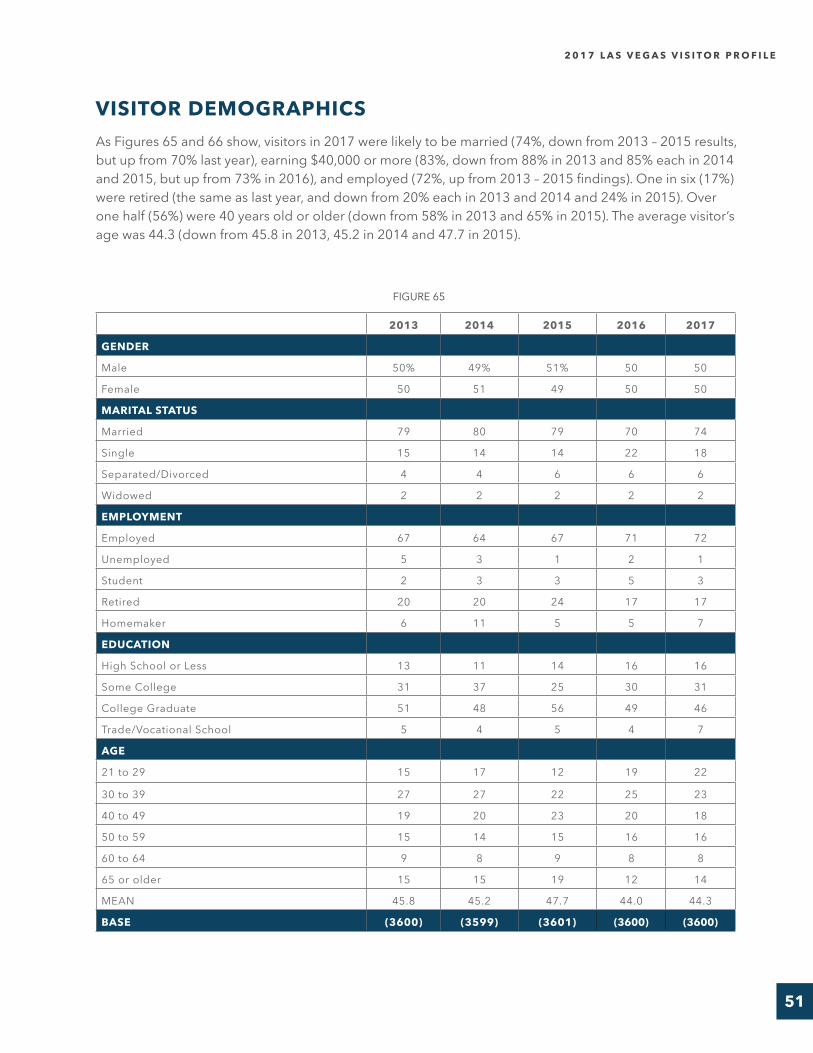
2 0 1 7 L A S V E G A S V I S I T O R P R O F I L E
51
VISITOR DEMOGRAPHICSAs Figures 65 and 66 show, visitors in 2017 were likely to be married (74%, down from 2013 – 2015 results, but up from 70% last year), earning $40,000 or more (83%, down from 88% in 2013 and 85% each in 2014 and 2015, but up from 73% in 2016), and employed (72%, up from 2013 – 2015 findings). One in six (17%) were retired (the same as last year, and down from 20% each in 2013 and 2014 and 24% in 2015). Over one half (56%) were 40 years old or older (down from 58% in 2013 and 65% in 2015). The average visitor’s age was 44.3 (down from 45.8 in 2013, 45.2 in 2014 and 47.7 in 2015).
2013 2014 2015 2016 2017
GENDER
Male 50% 49% 51% 50 50
Female 50 51 49 50 50
MARITAL STATUS
Married 79 80 79 70 74
Single 15 14 14 22 18
Separated/Divorced 4 4 6 6 6
Widowed 2 2 2 2 2
EMPLOYMENT
Employed 67 64 67 71 72
Unemployed 5 3 1 2 1
Student 2 3 3 5 3
Retired 20 20 24 17 17
Homemaker 6 11 5 5 7
EDUCATION
High School or Less 13 11 14 16 16
Some College 31 37 25 30 31
College Graduate 51 48 56 49 46
Trade/Vocational School 5 4 5 4 7
AGE
21 to 29 15 17 12 19 22
30 to 39 27 27 22 25 23
40 to 49 19 20 23 20 18
50 to 59 15 14 15 16 16
60 to 64 9 8 9 8 8
65 or older 15 15 19 12 14
MEAN 45.8 45.2 47.7 44.0 44.3
BASE (3600) (3599) (3601) (3600) (3600)
FIGURE 65

2 0 1 7 L A S V E G A S V I S I T O R P R O F I L E
52
Similar to 2016 results, the 2017 visitor base was more ethnically diverse than 2013 – 2015 visitors, as three in ten visitors identified themselves as non-white. Just over one half (52%, up from 49% last year) of visitors were from the western United States, with the bulk of them coming from California (31%). Sixteen percent (16%) of visitors were from foreign countries, down from 20% in 2013 and 19% each in 2014 and last year.
FIGURE 66
2013 2014 2015 2016 2017
ETHNICITY
White 73% 77% 85% 69% 69%
African-American/Black 5 4 4 9 12
Asian/Asian-American 12 10 4 5 4
Hispanic/Latino 8 8 7 14 14
Other 2 1 1 3 1
HOUSEHOLD INCOME
Less than $20,000 1 1 2 2 1
$20,000 to $39,999 5 6 4 9 4
$40,000 to $59,999 25 26 19 21 15
$60,000 to $79,999 28 27 23 24 23
$80,000 to $99,999 16 17 17 13 16
$100,000 or more 19 15 26 15 29
Not sure/no answer 6 7 10 16 12
VISITOR ORIGIN
USA 80 81 84 81 84
Eastern states1 6 7 7 7 7
Southern states2 12 12 13 15 15
Midwestern states3 10 9 11 10 9
Western states4 52 53 53 49 52
California 33 33 29 31 31
Southern California 26 27 25 27 26
Northern California 7 6 4 4 5
Arizona 6 6 9 6 7
Other Western states 13 14 15 12 13
Foreign 20 19 16 19 16
BASE (3600) (3599) (3601) (3600) (3600)
1 Eastern states: Connecticut, Delaware, District of Columbia, Maine, Maryland, Massachusetts, New Hampshire, New Jersey, New York, Pennsylvania, Rhode Island and Vermont.
2 Southern states: Alabama, Arkansas, Florida, Georgia, Kentucky, Louisiana, Mississippi, North Carolina, Oklahoma, South Carolina, Tennessee, Texas, Virginia and West Virginia.
3 Midwestern states: Illinois, Indiana, Iowa, Kansas, Michigan, Minnesota, Missouri, Nebraska, North Dakota, Ohio, South Dakota and Wisconsin.
4 Western states: Alaska, Arizona, California, Colorado, Hawaii, Idaho, Montana, Nevada (excluding Clark County), New Mexico, Oregon, Utah, Washington and Wyoming.

2 0 1 7 L A S V E G A S V I S I T O R P R O F I L E
53

2 0 1 7 L A S V E G A S V I S I T O R P R O F I L E
54
APP
END
IX A
Summary Table of Visitor Characteristics

2 0 1 7 L A S V E G A S V I S I T O R P R O F I L E
55
APPENDIX TABLESSUMMARY TABLE OF REASONS FOR VISITING AND VISITATION FREQUENCY
2013 2014 2015 2016 2017
Proportion of visitors who were first-time visitors 15% 19% 16% 27% 21%
Proportion of visitors whose primary purpose for current trip was vacation or pleasure
41% 47% 47% 52% 48%
Proportion of visitors whose primary purpose for current trip was to gamble
15% 12% 10% 4% 5%
Proportion of visitors whose primary purpose for current trip was to visit friends and relatives
12% 11% 11% 13% 14%
Proportion of repeat visitors whose primary purpose for current trip was vacation or pleasure
37% 42% 42% 48% 43%
Proportion of repeat visitors whose primary purpose for current trip was to gamble
17% 14% 12% 5% 6%
Proportion of repeat visitors whose primary purpose for current trip was to visit friends and relatives
12% 11% 13% 14% 16%
Proportion of first-time visitors whose primary purpose for current trip was vacation or pleasure
64% 68% 73% 65% 66%
Proportion of first-time visitors whose primary purpose for current trip was to gamble
4% 4% 1% 3% 1%
Proportion of first-time visitors whose primary purpose for current trip was to visit friends and relatives
13% 8% 5% 8% 7%
Average number of visits in past year 1.7 1.6 1.8 1.7 1.6

2 0 1 7 L A S V E G A S V I S I T O R P R O F I L E
56
SUMMARY TABLE OF TRAVEL PLANNING CHARACTERISTICS*
2013 2014 2015 2016 2017
Proportion of visitors who traveled to Las Vegas by ground transportation (automobile/bus/RV)
58% 58% 57% 54% 54%
Proportion of visitors who traveled to Las Vegas by air 42% 42% 43% 46% 46%
Proportion of visitors who used their own vehicle when traveling around Las Vegas
50% 47% 48% 43% 49%
Proportion of visitors who used taxis when traveling around Las Vegas
27% 32% 28% 26% 29%
Proportion of visitors who used the assistance of a travel agent in planning their trip to Las Vegas
15% 16% 15% 13% 10%
Proportion of visitors who used websites, social media, and or apps to plan trip (Revised Question in 2017)
NA NA NA NA 69%
Proportion of visitors who used a website or app on the internet to book accommodations in Las Vegas
39% 43% 49% 53% 62%
Proportion of visitors who arrived in Las Vegas by air who used a website or app to book their flight to Las Vegas (Revised Question in 2017)
NA NA NA NA 75%
Proportion of visitors who visited Downtown Las Vegas on their current trip
30% 36% 32% 53% 57%
*NA = Not asked in this year.

2 0 1 7 L A S V E G A S V I S I T O R P R O F I L E
57
SUMMARY TABLE OF TRIP CHARACTERISTICS AND EXPENDITURES
2013 2014 2015 2016 2017
Average number of adults in immediate party 2.4 2.4 2.2 2.4 2.3
Proportion of visitors with persons under 21 in their immediate party
10% 10% 8% 12% 8%
Proportion of visitors who stayed overnight 99.8% 99.6% 100% 99.9% 99.9%
Days stayed (average) 4.3 4.2 4.4 4.4 4.5
Nights stayed (average) 3.3 3.2 3.4 3.4 3.5
Proportion of visitors who stayed in a hotel or motel room (among those who stayed overnight)
96% 96% 96% 95% 93%
Number of room occupants (average — hotel/motel only) 2.2 2.1 2.0 2.1 2.0
Lodging expenditures (average per night — non-package and non-comp)
$83.62 $86.55 $102.64 $116.15 $114.85
Proportion of visitors who paid a regular room rate 32% 33% 27% 49% 50%
Proportion of visitors who bought a package or travel group trip
13% 18% 15% 19% 18%
Average cost of package per person (among package/tour group visitors)
$868.24 $815.14 $857.43 $921.04 $858.52
Average trip expenditures for food and drink $278.95 $281.88 $292.00 $318.09 $376.97
Average trip expenditures for local transport $59.68 $68.83 $73.45 $96.08 $88.29
Average trip expenditures for shopping $140.90 $149.77 $122.66 $156.91 $143.13
Average trip expenditures for shows/entertainment $38.45 $47.56 $61.95 $67.55 $60.22
Average trip expenditures for sightseeing $9.29 $14.49 $14.86 $35.93 $31.41
SUMMARY TABLE OF GAMING BEHAVIOR AND BUDGETS
2013 2014 2015 2016 2017
Proportion who gambled while visiting Las Vegas
71% 71% 73% 69% 74%
Average number of hours per day spent gambling (among those who gambled)
2.9 2.6 2.9 1.9 1.6
Average trip gambling budget (among those who gambled)
$529.57 $530.11 $578.54 $619.01 $541.18

2 0 1 7 L A S V E G A S V I S I T O R P R O F I L E
58
SUMMARY TABLE OF ENTERTAINMENT ACTIVITIES
2013 2014 2015 2016 2017
Proportion who attended any shows during their current stay in Las Vegas
72% 65% 61% 52% 59%
Proportion who attended lounge acts (among those who attended shows)
87% 77% 72% 43% 50%
Proportion who attended big-name headliner performances (among those who attended shows)
13% 17% 26% 24% 21%
Proportion who attended comedy shows (among those who attended shows/entertainment)
8% 10% 12% 17% 13%
Proportion who went to other paid attractions in Las Vegas
15% 19% 20% 30% 26%
SUMMARY TABLE OF ATTITUDINAL INFORMATION
2013 2014 2015 2016 2017
Proportion who were “very satisfied” with their current trip to Las Vegas
89% 96% 89% 89% 76%
Proportion who were “somewhat satisfied” with their current trip to Las Vegas
10% 4% 11% 10% 23%
SUMMARY TABLE OF VISITOR DEMOGRAPHICS
2013 2014 2015 2016 2017
Proportion of visitors who were married 79% 80% 79% 70% 74%
Proportion of visitors with a household income of $40,000 or more 88% 85% 85% 73% 83%
Proportion of visitors who were employed 67% 64% 67% 71% 72%
Proportion of visitors who were retired 20% 20% 24% 17% 17%
Proportion of visitors who were 40 years old or older 58% 57% 65% 56% 55%
Average age 45.8 45.2 47.7 44.0 44.3
Proportion of visitors with a college diploma 51% 48% 56% 49% 46%
Proportion of visitors from the West 52% 53% 53% 49% 52%
Proportion of visitors from California 33% 33% 29% 31% 31%
Proportion of visitors from a foreign country 20% 19% 16% 19% 16%

2 0 1 7 L A S V E G A S V I S I T O R P R O F I L E
59

2 0 1 7 L A S V E G A S V I S I T O R P R O F I L E
60
Aggregate Results for Calendar Year 2017
APP
END
IX B

2 0 1 7 L A S V E G A S V I S I T O R P R O F I L E
61
RESPONDENT ID# ____ ____ ____ ____
INTERVIEW DATE: ____ ____/____ ____/____ __
INTERVIEW DAY:SUNDAY .............................. 1MONDAY ............................. 2TUESDAY ............................ 3WEDNESDAY...................... 4THURSDAY ......................... 5FRIDAY ................................ 6SATURDAY.......................... 7
INTERVIEW LOCATION CODE ____ ____ ____ ___
TIME STARTED (USE 24-HOUR CLOCK)
____ ____:____ ____
TIME ENDED (USE 24-HOUR CLOCK)
____ ____:____ ____
INTERVIEW LENGTH ____ ____ MIN.
INTERVIEWER ID # ____ ____
RESPONDENT GENDER (BY OBSERVATION)MALE...............................50%
FEMALE ..........................50
Hello. I'm ________________ from GLS Research, a national marketing research firm. We are conducting a survey of visitors for the Las Vegas Convention and Visitors Authority. All answers are kept strictly confidential.
1. Are you a visitor to Las Vegas, or are you a resident of Clark County?
VISITOR................... ASK Q2
RESIDENT ............... TERMINATE
2. We are supposed to interview people who are 21 years old or older. Are you 21 years old or older?
YES .......................... ASK Q3
NO............................ TERMINATE
3. Will you be leaving Las Vegas within the next 24 hours?
YES .......................... ASK Q4
NO............................ TERMINATE
4. Have you been interviewed like this in Las Vegasat any other time in the past 12 months?
YES .......................... TERMINATE
NO............................ ASK Q5
5. Is this your first visit to Las Vegas, or have you visited before?
FIRST VISIT .....................21%
FILL IN “1” IN Q6, THEN SKIP TO Q7ON PAGE 2
VISITED BEFORE............79 ASK Q6
6. Including this trip, how many times have you visited Las Vegas in the past 12 months? (RECORD NUMBER BELOW AS 2 DIGITS.)
1....................................................74%2-3.................................................224-5...................................................36 OR MORE....................................11.6 MEAN1.0 MEDIAN

2 0 1 7 L A S V E G A S V I S I T O R P R O F I L E
62
7. What was the primary purpose of THIS trip to Las Vegas? (ASK AS AN OPEN-END. ACCEPT ONLY ONE RESPONSE. WRITE RESPONSE IN BLANK BELOW.)
_______________________________________
TO ATTEND OR WORK AT A CONVENTION/TRADE SHOW ..............9%TO ATTEND A CORPORATE MEETING .......................2TO GAMBLE...........................................5INCENTIVE TRAVEL PROGRAM(WON A TRIP AS A BONUS FROM EMPLOYER)...........................................0VACATION/PLEASURE .......................48VISIT FRIENDS/RELATIVES...............14TO ATTEND A SPECIAL EVENT (E.G., GOLF, RODEO, OR A FIGHT)..........................................6TO ATTEND/PARTICIPATE IN A CASINO TOURNAMENT ...............1OTHER BUSINESS PURPOSES............................................6JUST PASSING THROUGH ..................5TO ATTEND A WEDDING .....................3TO GET MARRIED.................................1SOME OTHER REASON .......................1NOT SURE/DK.......................................0REFUSED/NA ........................................0
8. While in Las Vegas, did you attend or work at a convention, trade show, association, or corporate meeting?
YES................................. 11% ASK Q9
NO .................................. 89
SKIP TO Q11NOT SURE/DK................. 0REFUSED/NA .................. 0
9. Were you MORE or LESS interested in attending this convention, trade show, association, or corporate meeting because it was held in Las Vegas, or did it make NO DIFFERENCE to you that it was held in Las Vegas? (N=387)
MORE INTERESTED ... 48%
LESS INTERESTED....... 0
NO DIFFERENCE ........ 51
NOT SURE/DK ............... 0
REFUSED/NA................. 1
10. Did you bring a spouse, family member, or friend with you who did NOT attend or work at a convention, trade show, association, or corporate meeting? (N=387)
YES.................................35%NO...................................65
11. Did you travel to Las Vegas by... (READ LIST. ACCEPT ONLY ONE RESPONSE.)
Air...........................................46%
Bus(IF “YES” ASK, “Do you mean…”:)Regularly scheduled bus service like Greyhound ........1
Or a chartered or escorted bus service or tour bus.........1
Automobile (IF “YES” ASK, “Do you mean…”:)Your own vehicle................47
Or a rental vehicle................4
Truck........................................0
Motorcycle................................0
Recreational Vehicle (RV)........0

2 0 1 7 L A S V E G A S V I S I T O R P R O F I L E
63
12. (ASK OF ALL RESPONDENTS.)Which of the following kinds of transportation have you used during your visit? (READ LIST. ACCEPT MULTIPLE RESPONSES.)A. Your own vehicle ............ 49%B. Rental car ....................... 14C. Limousine ....................... 2D. Bus ................................. 13E. Hotel/motel shuttle.......... 15H Monorail.......................... 11G. Taxi ................................. 29I Ride sharing service ....... 19
13. How far in advance did you plan this trip to Las Vegas? (ASK AS OPEN END.)SAME DAY .......................................... 1%1-3 DAYS BEFORE............................. 34-6 DAYS BEFORE............................. 37-14 DAYS BEFORE......................... 1015-30 DAYS BEFORE....................... 1431-60 DAYS BEFORE....................... 2161-90 DAYS BEFORE....................... 26MORE THAN 90 DAYS BEFORE ..... 24NOT SURE/DK.................................... 0REFUSED/NA ..................................... 0
14. Which of the following tools did you use in planning your trip to Las Vegas? (INTERVIEWER: READ LIST; ACCEPT MULTIPLE RESPONSES)A. Travel agent ........................ 10%B. Websites ............................. 66C. Social media........................ 40D. Apps .................................... 18E. Casino/Hotel hosts .............. 3F. Word of mouth..................... 47G. Magazines or newspapers .. 4H. Printed brochures or travel
guides.................................. 2I. Email offers ......................... 5J. Other (SPECIFY:)................ 1
15. Did the travel agent... (READ LIST)(N=355)
a. Influence your decision to visit Las Vegas .................. 13%
b. Influence your choice of accommodations ................... 61
c. Book your transportation ....... 71
16. (ASK ONLY OF THOSE WHO SAID “YES” TO SOCIAL MEDIA, WEBSITES OR APPS IN Q14.)
. Which, if any, of the following social media or travel review apps or websites did you use to help in planning your trip to Las Vegas? (INTERVIEWER: READ LIST; ACCEPT MULTIPLE RESPONSES) (N=2688)
A. Facebook............................. 29%B. Foursquare .......................... 0C. SnapChat............................. 6D. OpenTable........................... 2E. Pinterest............................... 1F. TripAdvisor .......................... 16G. Twitter .................................. 4H. Yelp...................................... 3I. Instagram............................. 5O GooglePlus.......................... 3J. Google ................................. 73K. Vegas.com........................... 26L. Lasvegas.com ..................... 5M. Consulted reviews at Online
Travel Agencies such as Expedia, Booking.com, etc. . 43
N. Consulted reviews at hotel or show venue sites ................. 31
O. Other (SPECIFY:) ................ 3
17. (ASK THOSE WHO TRAVELED TO LAS VEGAS BY AIR IN Q11) How did you book your flight to Las Vegas? (INTERVIEWER: READ LIST; ACCEPT ONE RESPONSE)(N=1671)
Travel agent ................................ 16%Website ....................................... 74App................................................ 1By phone ....................................... 4Other (SPECIFY:) ......................... 1NOT SURE/DK.............................. 4REFUSED/NA ............................... 0

2 0 1 7 L A S V E G A S V I S I T O R P R O F I L E
64
18. (ASK OF THOSE WHO BOOKED THEIR FLIGHT BY WEBSITE OR APP IN Q17) Which website or app did you use to book your flight? (ASK AS AN OPEN END. ACCEPT ONLY ONE RESPONSE). (N=1249)
a. AOL (AMERICA ONLINE) .......................0%
b. BOOKING.COM............3c. CHEAPTICKETS. .........2d. EXPEDIA.COM...........10e. HOTWIRE.COM ...........2f. MAPQUEST.COM ........0g. ORBITZ.........................3h. PRICELINE.COM .........4i. TRAVEL.COM ..............1j. TRAVELOCITY.............4k. YAHOO.........................0l. KAYAK.COM.................3
m. LASVEGAS.COM .........0n. AIRLINE WEBSITE
(ANY) ..........................62o. OTHER .........................6p. NOT SURE/DK .............0
INTERVIEWER!
IF YOU ARE CONDUCTING THE INTERVIEW AT A DOWNTOWN LOCATION, CIRCLE "YES" (1) IN Q19 AND
ASK Q20. IF YOU ARE NOT DOWNTOWN, READ THE FOLLOWING TO RESPONDENT BEFORE Q19 :
"There are two main areas where hotels, motels, and casinos are located in Las Vegas. One area is referred to as The Strip. The Strip includes all the properties on or near Las Vegas Boulevard. The other area is referred to as Downtown Las Vegas. Downtown includes all the properties on or near Fremont Street."
POINT OUT THE "DOWNTOWN" AND "STRIP" AREAS ON THE MAP AS YOU READ THE ABOVE EXPLANATION. IF IT HELPS THE RESPONDENT, ALSO POINT OUT WHERE ON THE MAP YOU ARE CURRENTLY LOCATED.
19. While in Las Vegas, have you visited the Downtown area? (POINT OUT THE DOWNTOWN AREA ON THE MAP.)
YES .................................57% ASK Q20
NO...................................43 SKIP TO Q21
20. (ASK ONLY IF “YES” IN Q19.)What is the MAIN REASON you [visited/are visiting] the Downtown area? (ASK AS AN OPEN-END. ACCEPT ONLY ONE RESPONSE. WRITE RESPONSE IN BLANK BELOW.)
(N=2063)
LODGING DOWNTOWN .............................7%TO SEE THE FREMONT STREET EXPERIENCE.............................................63TO GAMBLE.................................................6TO DINE .......................................................9TO SEE A SHOW .........................................3TO SHOP......................................................1TO SEE/ATTEND AN EVENT ......................0TO SIGHTSEE (OTHER THAN THE FREMONT ST. EXPERIENCE .....................9OTHER (SPECIFY): .....................................2NOT SURE/DK .............................................0REFUSED/NA...............................................0
21. (ASK ONLY IF "NO" IN Q19.)Is there any particular reason why you did not visit Downtown Las Vegas? (ASK AS AN OPEN-END. ACCEPT ONLY ONE RESPONSE. WRITE RESPONSE IN BLANK BELOW.)
(N=1680)
NOT ENOUGH TIME...............................41%UNFAMILIAR WITH DOWNTOWN.........14DON'T LIKE DOWNTOWN; IT'S A BAD AREA......................................1ONLY INTERESTED IN/PREFER THE STRIP. ...............................1NOT INTERESTED (GENERAL); DIDN'T WANT TO; NO REASON TO; SEEN IT ALREADY .................................37INCONVENIENT; OUT OF THE WAY ......4HAVE CHILDREN; DIDN'T WANT TO TAKE CHILDREN THERE ...................................0PREFER ANOTHER AREA (NOT THE STRIP) .....................................0TOO HOT/BAD WEATHER.......................1TOO CROWDED/TOO MUCH TRAFFIC..0OTHER (SPECIFY): ..................................0

2 0 1 7 L A S V E G A S V I S I T O R P R O F I L E
65
22. On this trip to Las Vegas, where did you lodge? (ASK AS OPEN END. ACCEPT ONLY ONE RESPONSE. CIRCLE CODE NUMBER. INTERVIEWER: A "LODGING" IS ANY PLACE THE RESPONDENT SLEPTOVERNIGHT. SOME PEOPLE COME TO LAS VEGAS AT NIGHT JUST TO GAMBLE THROUGH THE NIGHT AND LEAVE THE NEXT DAY. THESE PEOPLE DID NOT "LODGE" ANYWHERE.)
TYPE OF LODGING(ALL RESPONDENTS)HOTEL................................................... 90%MOTEL .................................................... 3RV PARK................................................. 0FRIENDS/RELATIVES ............................ 6DAYTRIP/NO LODGING......................... 0
TYPE OF LODGING(AMONG THOSE WHO STAYED OVERNIGHT)
(N=3596)
HOTEL................................................... 90%MOTEL .................................................... 3RV PARK................................................. 0FRIENDS/RELATIVES ............................ 6
LOCATION OF LODGING(ALL RESPONDENTS)STRIP CORRIDOR.................................73%
ON THE STRIP.................................57JUST OFF THE STRIP.....................17
DOWNTOWN ...........................................5BOULDER STRIP.....................................2OUTLYING AREAS ................................13OTHER .....................................................7
LOCATION OF LODGING(AMONG THOSE WHO STAYED OVERNIGHT) (N=3596)
STRIP CORRIDOR.................................73%ON THE STRIP.................................57JUST OFF THE STRIP.....................17
DOWNTOWN ...........................................5BOULDER STRIP.....................................2OUTLYING AREAS ................................13OTHER .....................................................7

2 0 1 7 L A S V E G A S V I S I T O R P R O F I L E
66
23. Which of the following [SHOW CARD] best describes how you, or someone in your party, booked your accommodations in Las Vegas? (ACCEPT ONLY ONE RESPONSE.) (N=3284)
Booked by phone, calling the hotel, motel, or RV park directly .........12%
SKIP TO Q25Booked through a travel agent (either in person or by phone).......10Booked by phone but not by calling the hotel directly and not through a travel agent ...................3
Booked through a website or appon the Internet using a desktop or laptop computer........................47
ASK Q24Booked through a website or app on the Internet using a smartphone....................11Booked through a website or app on the Internet using a tablet ......4Booked in person at the hotel, motel, or RV park..................................1
SKIP TO Q25
The trip was a gift, prize, or incentive, so the accommodations were booked for you ........1Not sure because someone else in your party booked the hotel and you don’t know how they did it ................11OTHER (SPECIFY:) ........1REFUSED/NA .................0
24. Which website or app did you use to book your accommodations? (ASK AS AN OPEN END. ACCEPT ONLY ONE RESPONSE).
(N=2031)
a. HOTEL WEBSITE (ANY)............. 34%b. BOOKING.COM............................. 6c. HOTELS.COM ............................. 11d. EXPEDIA.COM ............................ 11e. LAS VEGAS.COM.......................... 3f. TRAVELOCITY.............................. 6g. AIRLINE WEBSITE........................ 3h. ORBITZ.......................................... 3i. PRICELINE .................................... 4j. VEGAS.COM ................................. 6k. KAYAK.COM.................................. 3l. HOTWIRE...................................... 3m. OTHER .......................................... 7n. NOT SURE/DK .............................. 0
25. How far in advance did you make your reservations for your (hotel room/motel room/RV park space) for this trip to Las Vegas? (ASK AS OPEN END.) (N=2031)
SAME DAY.....................................2%1-3 DAYS BEFORE .......................44-6 DAYS BEFORE .......................37-14 DAYS BEFORE .....................915-30 DAYS BEFORE .................1331-60 DAYS BEFORE .................2061-90 DAYS BEFORE .................25MORE THAN 90 DAYS BEFORE............................22NOT SURE/DK...............................1REFUSED/NA ................................0

2 0 1 7 L A S V E G A S V I S I T O R P R O F I L E
67
26. Including yourself, how many people stayed in your room? (WRITE EXACT NUMBER IN THE BLANK BELOW.) (N=3404)
ONE .......................................12%TWO ......................................79THREE.....................................5FOUR.......................................4FIVE.........................................1SIX OR MORE.........................0REFUSED/NA..........................02.0 MEAN2.0 MEDIAN
27. Which of the following rate categories best describes your room rate? (SHOW ROOM RATE CARD. ACCEPT ONLY ONE RESPONSE.)
(N=3290)
HOTEL/TRANSPORTATIONPACKAGE DEAL............. 16%
ASK Q28HOTEL/AMENITIES PACKAGE DEAL............... 0TOUR/TRAVEL GROUP... 1
CONVENTION GROUP/COMPANY MEETING....... 6
SKIP TO Q29CASINO RATE.................. 3REGULAR FULL-PRICE ROOM RATE ...... 50
CASINOCOMPLIMENTARY......... 10 SKIP TO Q31
ANOTHER RATE ............ 13 SKIP TO Q29
VACATION RENTALRATE................................. 0 SKIP TO Q29
28. What was the total PER PERSON cost of your package? (ROUND TO NEAREST DOLLAR. WRITE AMOUNT IN BLANKS BELOW.)
(N=647)
$0-$399 ......................................... 17%$400-$599 ..................................... 22$600-$999 ..................................... 22$1000 OR MORE .......................... 27NOT SURE/REFUSED.................. 13$858.52 MEAN$635.00 MEDIAN
PACKAGE VISITORS SKIP TO Q31
29. (ASK ONLY OF NON-PACKAGE VISITORS)By the time you leave Las Vegas, how much will you have spent, on average per night, on your hotel or motel room? (ROUND TO NEAREST DOLLAR. WRITE AMOUNT IN BLANKS BELOW.) (N=2376)
$0-$49............................................... 3%$50-$99........................................... 36$100-$149....................................... 32$150 OR MORE.............................. 21NOT SURE/REFUSED ..................... 8$114.85 MEAN$100.00 MEDIAN
30. How did you first find out about the room rate you paid? (DO NOT READ LIST. ACCEPT ONLY ONE RESPONSE.) (N=2376)
NEWSPAPER .........................................0%TELEVISION...........................................0RADIO.....................................................0TRAVEL AGENT.....................................5WORD-OF-MOUTH..............................17OFFER RECEIVED IN THE MAIL ..........1BROCHURE............................................0E-MAIL OFFER.......................................3INTERNET AD (POP-UP OR BANNER AD)....................................0SEARCH ENGINE RESULT/HYPERLINK............................................7ANY WEB SITE ....................................56OUTDOOR BILLBOARD ........................0RESERVATION AGENT/CALL CENTER .......................................9SOCIAL MEDIA (e.g., Facebook, Twitter, LinkedIn, Google Plus, Instagram)..........0OTHER (SPECIFY):................................0NOT SURE/DK........................................2REFUSED/NA .........................................0

2 0 1 7 L A S V E G A S V I S I T O R P R O F I L E
68
31. (ASK OF ALL RESPONDENTS.)Including yourself, how many adults 21 years old or older are in your IMMEDIATE party (such as a spouse or friends who are traveling with you)? (IFRESPONDENT SAYS MORE THAN 8, EXPLAIN: "If you are part of a tour group, do notinclude all members of your tour group only those adult friends and relatives who are traveling with you.") 1......................................................11%2......................................................703........................................................44......................................................105 OR MORE .....................................52.3 MEAN2.0 MEDIAN
32. Are there any people under the age of 21 in your IMMEDIATE party?YES................................... 8%
NO .................................. 92
33. By the time you leave, how many nights will you have stayed in Las Vegas? (WRITE TWO-DIGIT NUMBER IN BLANKS BELOW.)0.................................................0%1.................................................72...............................................183...............................................324...............................................215 OR MORE ............................223.5 MEAN3.0 MEDIAN
34. By the time you leave, how many days will you have been in Las Vegas? 1.................................................0%2.................................................73...............................................184...............................................325...............................................216 OR MORE ............................224.5 MEAN4.0 MEDIAN
35. On what day of the week did you arrive in Las Vegas?SUNDAY .......................... 15%MONDAY ......................... 13TUESDAY ........................ 11WEDNESDAY.................. 12THURSDAY ..................... 17FRIDAY ............................ 24SATURDAY........................ 9
36. While in Las Vegas, which, if any, of the following social media or travel review apps or websites have you used to plan your activities? (INTERVIEWER: READ LIST; ACCEPT MULTIPLE RESPONSES)Facebook ................................... 18%Foursquare................................. 0SnapChat ................................... 4OpenTable ................................. 3Pinterest ..................................... 0TripAdvisor ................................. 11Twitter ........................................ 2Yelp ............................................ 2Instagram ................................... 3GooglePlus................................. 1Google........................................ 54Vegas.com ................................. 22Lasvegas.com............................ 4Consulted reviews at Online Travel Agencies such as Expedia, Booking.com, etc. ...................... 5Consulted reviews at hotel or show venue sites........................ 20Other (SPECIFY:) ...................... 1NONE OF THESE...................... 30

2 0 1 7 L A S V E G A S V I S I T O R P R O F I L E
69
37. Have you gambled during this visit to Las Vegas?
YES ................................ 74% ASK Q38
NO.................................. 26 SKIP TO Q41
38. On average, how many hours PER DAY did you spend gambling? (N=2652)
2 OR LESS .......................... 77%LESS THAN 1 HOUR....... 36ONE HOUR ...................... 24TWO HOURS................... 17
3 TO 4.................................. 175 TO 6.................................... 57 TO 8.................................... 1MORE THAN 8 ...................... 11.6 MEAN1.0 MEDIAN
39. Not including travel, food, or lodging, how much money did you budget for gambling on this trip? Include only your own, personal, gambling budget and not the gambling budgets of others who may have been with you. (N=2652)
$0-$99 .............................................. 27%$100-$199 ........................................ 19$200-$299 ........................................ 14$300-$399 .......................................... 7$400-$499 .......................................... 4$500-$599 .......................................... 8$600 OR MORE ............................... 20NOT SURE/REFUSED....................... 1$541.18 MEAN$200.00 MEDIAN
40. Where have you gambled during your visit to Las Vegas? (READ LIST. ACCEPT MULTIPLE RESPONSES.) (N=2652)
Downtown Las Vegas (that is, on or near Fremont Street)........................ 40%On the Strip (that is, on Las Vegas Boulevard)........................................ 81Just off the Strip (for example The Rio, Palms, Hard Rock Hotel) .......... 21Boulder Hwy & Henderson (Sam's Town, Boulder Station, Sunset Station, etc.) ..................................... 5North Las Vegas (Santa Fe, Texas Station, Fiesta, etc.) ......................... 2Outlying areas (Jean, Mesquite, Searchlight, etc.) .............................. 0OTHER (SPECIFY:)......................... 3

2 0 1 7 L A S V E G A S V I S I T O R P R O F I L E
70
41. Which of the following types of entertainment have you seen during this trip to Las Vegas? (IF RESPONDENT VOLUNTEERS "NONE," CIRCLE "2" IN Q41A-Q41F. ACCEPT MULTIPLE RESPONSES.)
42. (ASK FOR EVERY "YES" IN Q41.) And how many (INSERT EACH TYPE MENTIONED IN Q41) have you seen during this trip? (RECORD TWO-DIGIT NUMBER IN APPROPRIATE BLANKS.)
Q41 Q42YES NO DK NA MEAN
A. Celebrity DJs performing in a Las Vegas nightclub (for example, Calvin Harris, Tiesto (pronounced: Tee-ES-toe), Avicii (pronounced: Ah-VEE-chee), Steve Aoki, (pronounced: Ah-OH-kee), Skrillex, etc.)............................ 7% 93% 0% 0% 1.1 (N=236)
B. Big-name headliner performers in Las Vegas for a special concert (for example, Britney Spears, Reba, Brooks & Dunn, Jennifer Lopez, Elton John, etc.)................................ 12 88 0 0 1.1 (N=447)
C. Broadway/production shows ... 16 84 0 0 1.1 (N=570)
D. Comedy shows or revues (for example, Improv, Comedy Stop, etc.) ................................ 8 82 0 0 1.1 (N=280)
E. Lounge acts or other kinds of free entertainment provided at a location other than the "main" show room ................... 30 70 0 0 1.4 (N=1063)
F. Sporting events (such as a boxing match, UFC or mixed martial arts, hockey game, college football or basketball game, etc.) .............................. 3 97 0 0 1.3 (N=119)
43 (INTERVIEWER: IF RESPONDENT HAS NOTSEEN ANY SHOWS, CIRCLE “YES” HERE.)
YES (HAS NOTSEEN ANY SHOWS)
NO (HAS SEEN SHOWS)
41% 59%
44. On this trip to Las Vegas, have you been to, or do you plan to go to, other Las Vegas attractions for which you have to pay — for example, the Mandalay Bay Shark Reef, the Stratosphere Observation Tower and Rides, The High Roller Observation Wheel, New York-New York “Manhattan Express” rollercoaster, etc?
YES................................ 26%
NO.................................. 74
NOT SURE/DK ................ 0
REFUSED/NA.................. 0
45. On this trip, will you (or did you) visit... (READ LIST. ACCEPT MULTIPLE RESPONSES.)
A nightclub in a hotel with a cover charge? .......................... 13%
A free-standing nightclub with a cover charge? ....................... 7
A bar or lounge in a hotel without a cover charge? ........... 68
Any free-standing bar or lounge without a cover charge? .................................... 36
A pool party or day club?.......... 7

2 0 1 7 L A S V E G A S V I S I T O R P R O F I L E
71
46. By the time you leave Las Vegas, how much will you have spent ON AVERAGE PER DAY for...
a....... Food and drink. Please include only your own, personal expenses and not those of your entire party.
$376.97 MEAN (INCLUDING $0)$377.85 MEAN (EXCLUDING $0)
b. Local transportation (for example, car rental, taxi, limo, gas). Please include all your daily transportation expenses. (ROUND TO THE NEAREST DOLLAR. WRITE AMOUNT IN BLANKS BELOW.)
$88.29 MEAN (INCLUDING $0)$98.14 MEAN (EXCLUDING $0)
47. By the time you leave Las Vegas, how much will you have spent on each of the following items IN TOTAL FOR YOUR ENTIRE TRIP? Please include only your own, personal expenses and not those of your entire party. (READ EACH ITEM. ROUND TO THE NEAREST DOLLAR. WRITE AMOUNT IN BLANKS BELOW.)
A. Shopping (gifts, clothing, personal items) .....$143.13 MEAN (INCLUDING $0)$193.18 MEAN (EXCLUDING $0)
B. Shows/entertainment (not including gambling).......................................................
$60.22 MEAN (INCLUDING $0)$139.77 MEAN (EXCLUDING $0)
C. Sightseeing....................................................$31.41 MEAN (INCLUDING $0)$163.70 MEAN (EXCLUDING $0)
D. Parking/parking fees .....................................$10.68 MEAN (INCLUDING $0)$29.05 MEAN (EXCLUDING $0)
X. Other ............................................................$14.39 MEAN (INCLUDING $0)$219.52 MEAN (EXCLUDING $0)
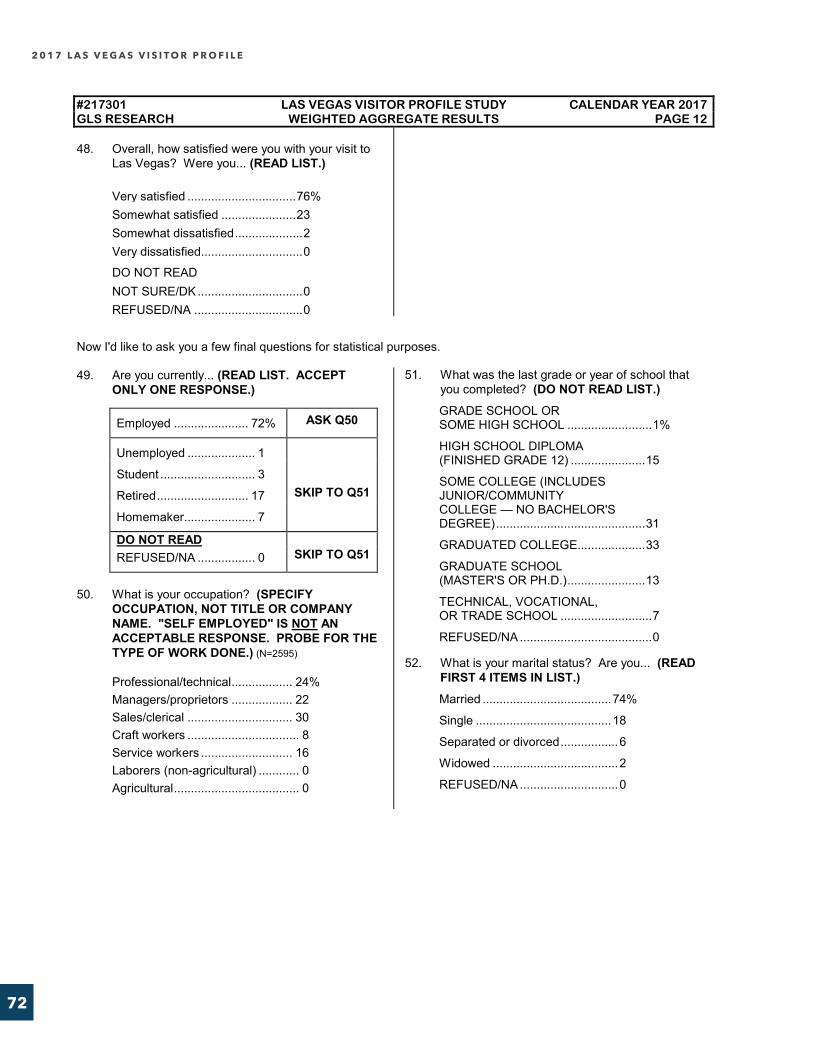
2 0 1 7 L A S V E G A S V I S I T O R P R O F I L E
72
48. Overall, how satisfied were you with your visit to Las Vegas? Were you... (READ LIST.)
Very satisfied ................................76%Somewhat satisfied ......................23Somewhat dissatisfied....................2Very dissatisfied..............................0
DO NOT READNOT SURE/DK...............................0REFUSED/NA ................................0
Now I'd like to ask you a few final questions for statistical purposes.
49. Are you currently... (READ LIST. ACCEPT ONLY ONE RESPONSE.)
Employed ...................... 72% ASK Q50
Unemployed .................... 1
Student ............................ 3
Retired........................... 17 SKIP TO Q51
Homemaker..................... 7
DO NOT READREFUSED/NA ................. 0 SKIP TO Q51
50. What is your occupation? (SPECIFY OCCUPATION, NOT TITLE OR COMPANY NAME. "SELF EMPLOYED" IS NOT AN ACCEPTABLE RESPONSE. PROBE FOR THE TYPE OF WORK DONE.) (N=2595)
Professional/technical.................. 24%Managers/proprietors .................. 22Sales/clerical ............................... 30Craft workers ................................. 8Service workers ........................... 16Laborers (non-agricultural) ............ 0Agricultural..................................... 0
51. What was the last grade or year of school that you completed? (DO NOT READ LIST.)GRADE SCHOOL OR SOME HIGH SCHOOL .........................1%
HIGH SCHOOL DIPLOMA (FINISHED GRADE 12) ......................15
SOME COLLEGE (INCLUDES JUNIOR/COMMUNITY COLLEGE — NO BACHELOR'S DEGREE)............................................31
GRADUATED COLLEGE....................33
GRADUATE SCHOOL (MASTER'S OR PH.D.).......................13
TECHNICAL, VOCATIONAL, OR TRADE SCHOOL ...........................7
REFUSED/NA .......................................0
52. What is your marital status? Are you... (READ FIRST 4 ITEMS IN LIST.)Married ......................................74%
Single ........................................18
Separated or divorced.................6
Widowed .....................................2
REFUSED/NA .............................0

2 0 1 7 L A S V E G A S V I S I T O R P R O F I L E
73
53. What country do you live in?
USA................................ 84% ASK Q54
FOREIGN....................... 16 SKIP TO Q55
54. (ASK ONLY OF VISITORS FROM THE USA)What is your ZIP code, please? REGION FROM ZIP CODEEAST .....................................................7%SOUTH................................................15MIDWEST .............................................9WEST ..................................................52
CALIFORNIA ....................................31NORTHERN CA. .............................5SOUTHERN CA. ...........................26
ARIZONA............................................7OTHER WEST .................................13
FOREIGN VISITORS ..........................16
55. (READ TO RESPONDENT:)Most people think of themselves as belonging to a particular ethnic or racial group. What ethnic or racial group are you a member of? (ASK ONLY IF NECESSARY: Are you white, Black or African American, Asian or Asian American, Hispanic or Latino — or of some other ethnic or racial background?)WHITE .............................................69%BLACK OR AFRICAN AMERICAN..12ASIAN OR ASIAN AMERICAN..........4HISPANIC/LATINO..........................14NATIVE AMERICAN..........................0MIXED RACE.....................................1OTHER (SPECIFY:)...........................0
56. What is your age, please? (RECORD IT EXACTLY AND CIRCLE APPROPRIATE CATEGORY BELOW.)44.3 MEAN42.0 MEDIAN
Which of the following categories does your age fall into? (READ LIST.)21 to 29 ........................................ 22%
30 to 39 ........................................ 23
40 to 49 ........................................ 18
50 to 59 ........................................ 16
60 to 64 .......................................... 8
65 and older ................................. 14
REFUSED/NA ................................ 0
57. Please tell me which one of these categories includes your total household income before taxes last year. (SHOW CARD.) Include your own income and that of any member of your household who is living with you.
A. Less than $20,000 ................1%
B. $20,000 to $29,999...............1
C. $30,000 to $39,999...............3
D. $40,000 to $49,999...............6
E. $50,000 to $59,999...............9
F. $60,000 to $69,999.............11
G. $70,000 to $79,999.............12
H. $80,000 to $89,999.............11
I. $90,000 to $99,999...............5
J. $100,000 or more ...............29
NOT SURE/DK............................0
REFUSED/NA ...........................12

2 0 1 7 L A S V E G A S V I S I T O R P R O F I L E
74
2 0 1 6 M E S Q U I T E V I S I T O R P R O F I L E
65
RESPONDENT SHOW CARDS
HOW ACCOMMODATIONS WERE BOOKED
A. PHONED DIRECTLY
Booked by phone, calling the hotel, motel, or RV park directly,
B. TRAVEL AGENT
Booked through a travel agent (either in person or by phone),
C. PHONED, BUT NOT DIRECTLY, NOT THROUGH AGENT
Booked by phone but not by calling the hotel directly and not through a travel agent,
D1. INTERNET – DESKTOP/LAPTOP
Booked through a website on the Internet using a desktop or laptop computer.
D2. INTERNET – SMARTPHONE
Booked through a website on the Internet using a smartphone.
D3. INTERNET – TABLET
Booked through a website on the Internet using a tablet.
E. IN PERSON
Booked in person at the hotel, motel, or RV park.
F. GIFT, PRIZE, OR INCENTIVE
The trip was a gift, prize, or incentive, so the accommodations were booked for you.
G. DON’T KNOW BECAUSE SOMEONE ELSE BOOKED
Not sure because someone else in your party booked the hotel and you don’t know how they did it.

2 0 1 7 L A S V E G A S V I S I T O R P R O F I L E
75
2 0 1 6 M E S Q U I T E V I S I T O R P R O F I L E
66
HOTEL/MOTEL RATES
1. HOTEL/TRANSPORTATION PACKAGE DEAL
One price that includes your hotel room and airfare or bus transportation to Las Vegas. The package may or may not also include other items such as shows or meals.
2. HOTEL/AMENITIES PACKAGE DEAL (NO TRANSPORTATION INCLUDED)
One price that includes your hotel room and other items such as shows, meals or other amenities, but does not include airfare or bus transportation to Las Vegas.
3. TOUR/TRAVEL GROUP
You are traveling as part of a tour or travel group. The tour/travel group package price includes room and airfare or bus transportation to Las Vegas. The package may or may not also include other items such as shows or meals.
4. CONVENTION GROUP/COMPANY MEETING
Arranged through an employer or convention.
5. CASINO RATE
Special reduced rate arranged through a casino host or casino employee.
6. REGULAR FULL-PRICE ROOM RATE
Full price, no discounts.
7. CASINO COMPLIMENTARY
Room is free of charge.
8. ANOTHER RATE
Any other special room rate not shown above.

2 0 1 7 L A S V E G A S V I S I T O R P R O F I L E
76
2 0 1 6 M E S Q U I T E V I S I T O R P R O F I L E
67
INCOME CATEGORIES
A. Less than $20,000
B. $20,000 to $29,999
C. $30,000 to $39,999
D. $40,000 to $49,999
E. $50,000 to $59,999
F. $60,000 to $69,999
G. $70,000 to $79,999
H. $80,000 to $89,999
I. $90,000 to $99,999
J. $100,000 to $109,999
K. $110,000 to $119,999
L. $120,000 to $129,999
M. $130,000 to $139,999
N. $140,000 to $149,999
O. $150,000 or more

Las Vegas Convention and Visitors Authority 3150 Paradise Road, Las Vegas, NV 89109-9096
VisitLasVegas.comFor fur ther information, please contact the LVCVA Research Center at 702-892-2805 or at [email protected].