preparation and characterisation of cellulose...
TRANSCRIPT
Australian Journal of Basic and Applied Sciences, 8(4) Special 2014, Pages: 577-592
AENSI Journals
Australian Journal of Basic and Applied Sciences
ISSN:1991-8178
Journal home page: www.ajbasweb.com
Corresponding Author: M. Martini M., Faculty of Innovative Design and Technology, Universiti Sultan Zainal Abidin,
21300 Kuala Terengganu, Terengganu.
Preparation and Characterisation of Cellulose Nanofibres Reinforced Polymer
Composites 1,2M. Martini M., 2P.R. Hornsby, 3E. Charmicheal, 3H.S.S. Sharma
1Faculty of Innovative Design and Technology, Universiti Sultan Zainal Abidin, 21300 Kuala Terengganu, Terengganu 2Polymer Cluster, School of Mechanical and Aerospcace Engineering, Ashby Building, Stranmillis Rd, BT9 5AH Belfast, United Kingdom. 3Applied Plant Science Division, Agri-Food and Bioscience Institute, Newforge Lane, Belfast, BT9 5PX United Kingdom. A R T I C L E I N F O A B S T R A C T
Article history:
Received 20 November 2013
Received in revised form 24 January 2014
Accepted 29 January 2014
Available online 5 April 2014
Key words:
nanocomposites; nanofibre;
mechanical properties; thermal properties
Optimised routes have been established to obtain high aspect ratio cellulose microfibrils
derived from plant feedstocks, involving a combination of a chemical and mechanical
treatment using a high pressure microfluidizer. By this means, nano-cellulose was produced from banana tree using following pretreatment protocol: (i) chemical
modification, involving mercerization and acid hydrolysis; (ii) mechanical treatment,
using a high speed (Turrax) mixer and high pressure microfluidisation and (iii) chemical and mechanical (chemo-mechanical) processes, by combining TEMPO-
oxidation and high pressure microfluidisation. The nanofibres produced were
characterised using microscopic procedures (scanning electron microscopy and transmission electron microscopy), particle size distribution measurement (static image
analysis and laser diffraction), chemical analysis (zeta potential analysis, fourier
transform infrared and x-ray diffraction), and thermal analysis (thermogravimetric analysis). Results obtained and subsequent trends observed in chemical, mechanical and
chemo-mechanical treated nanofibres were compared and contrasted. The chemo-
mechanical treatment (TEMPO-oxidation and high pressure microfluidisation) yielded higher aspect ratio nanofibrils than nanofibrils made by solely chemical or mechanical
treatment. Cellulose nanofibrils made by chemo-mechanical treatment also gave higher
yield and high degree of crystallinity. Cellulose nanofibres obtained were subsequently incorporated into polyvinyl alcohol (PVA) by a solution casting technique. Mechanical
properties of these systems were determined from tensile tests and DMTA. Large
increases in tensile modulus and strength were determined at fibre loadings up to 5wt%. However, mechanical properties of the composites were dependent on the applied
preparation route. From this work, a direct comparison between the nano and micron-scale fibres can be observed in terms of their relative reinforcing efficiency. For
instance, there was a 100% improvement in tensile modulus of conventional banana
fibre-reinforced polymer composite by 30 wt% loading of micron-sized banana fibres. On the other hand, there was 300% improvement has been recorded in tensile modulus
for cellulose nanofibre-reinforced polymer composite with only 5 wt% of cellulose
nanofibres.
© 2014 AENSI Publisher All rights reserved.
To Cite This Article: M. Martini M., P.R. Hornsby, E. Charmicheal, H.S.S. Sharma., Preparation and Characterisation of Cellulose
Nanofibres Reinforced Polymer Composites. Aust. J. Basic & Appl. Sci., 8(4): 577-592, 2014
INTRODUCTION
Recently, discussions about the preservation of natural resources and recycling have led to interest in
biomaterials, with the focus on renewable feedstocks. Since natural fibres are relatively cheap and
biodegradable, the composites containing biofibres often in association with biodegradable polymers are
considered to have an important role to play in addressing 21st century environmental concerns (Mohanty, A.,
M. Misra, and G. Hinrichsen, G., 2000). Accordingly, natural fibres have attracted the attention of scientists and
technologists because of advantages that these fibres can provide over conventional reinforcements resulting in
the development of a variety of natural fibre composites for industrial use in recent years (Schneider, J., Myers,
G., Clemons, C., and English, B., 1995). These natural fibres have relatively low cost with low density giving
high specific mechanical properties to the composite. There has been considerable interest in gaining increased
performance relative to conventional composites by a new class of material termed nanocomposite. This type of
material has attracted great interest from industry and academia due to the remarkable improvements in
properties achievable at very low addition levels compared to virgin polymer or conventional micro- and macro-
composites. Although the precise reasons for this improvement have been the subject of intense research, the
smaller size of the reinforcing phase undoubtedly increases the probability of structural perfection with less

578 M. Martini M. et al, 2014
Australian Journal of Basic and Applied Sciences, 8(4) Special 2014, Pages: 577-592
surface defects thereby contributing to a more efficient reinforcement compared to micron-sized alternatives
reinforcements (Lew, C., Murphy, W., and McNally, G., 2004). A major drawback of using natural fibres
(macro-fibres) for composite applications; large variation in properties inherent to natural products. The
properties could be impacted by climatic conditions, maturity, soil type and also disturbance during plant
growth. Therefore, the idea of decreasing the size of the natural fibre particles from micro to nanoscale has been
applied to overcome this problem. The major benefit of using cellulose nanofibres in reinforcing polymer
matrices is its high surface area which leads to a very large matrix-filler interfacial area, changing the molecular
mobility, relaxation behavior and ensuring thermal and mechanical properties.
Cellulose nanofibres has shown a great potential as a reinforecement agents in polymer nanocomposites
because of the high aspect ratio and excellent mechanical properties (modulus of ca. 150 GPa and tensile
strength of ca. 10 GPa) (Qua, E., et al., 2011). The cellulose nanofibres used in this study were derived from
banana fibres. For many years, the trunk of the banana tree has been considered as a waste-product and as a
result, research was started to evaluate the potential of utilizing the trunk for industrial purposes, in particular
after extraction of fibres from the banana trunk. Banana fibre is a ligno-cellulosic fibre, obtained from the
pseudo-stem of banana plant (Musa sepientum), which is classed as a bast fibre with relatively goo mechanical
properties (Mukhopadhyay, S., R, et al., 2008). The potential applications of cellulose nanofibres as a thickeners
in food products, as barrier coatings, a strengthening agent for packaging materials, and in lightweight ans
strong polymer nanocomposites (Reitzer, R., 2007).
In this study, work is presented and focused on the optimisation of the processing and derivation techniques
to achieve the optimum yield of stable nanofibre suspensions by applying various methodologies: chemical,
mechanical and chemo-mechanical treatments. Particular emphasis is given to the structural characterisation of
these fibres together with their thermal stability, in order to define their suitability as potential reinforcements
for polymers. The cellulose nanofibres obtained were subsequently incorporated into polyvinyl alcohol (PVA)
by a solution casting technique. The effect of different treated nanofibres on the mechanical, structural and
thermal properties of these composites was determined.
Experimental:
Materials: Raw banana fibre obtained from the superposed layers of banana trees pseudostem were produced from
COPLACA (Grupo Regional de Cooperativas Plataneros Del Archipielago) and then were processed into a long
fine fibres at University of Las Palmas, Canary Island. The long fibres then were cut into short fibres at Grupo
Antolin (Grupo Antolin Ingenieria S. A.) and then dried under shade. Average fineness of banana fibre is
2386Nm (4.1 dtex). Polyvinyl alcohol (PVA 363138-1) chosen in this study was supplied from Aldrich
Chemical Company, Inc. This was 98-99% hydrolyzed with an average molecular weight of 31 000 – 50 000
g/mol and a semi-crystalline polymer. PVA has a melting temperature of 200 °C and a relative density of 1269
kg/m3 and is soluble in water.
Preparation Of The Nanofibres: The preparation of the cellulose nanofibre suspensions were done using facilities and support from Agri
Food and Bioscience Institute (AFBI), Belfast, Northern Ireland, UK. The pre-processed banana fibres were
dry-milled and pre-treated with sodium hydroxide, NaOH (1 mol) for four hours at 80 °C. An important aim of
this pre-treatment was to increase the surface area of the lignocellulosic material to make polysaccharides more
susceptible to hydrolysis (Bhatnagar, A. and Sain, M., 2005). The fibres were then washed and freeze dried
before up taken for further 3different treatment methods.
Acid Hydrolysis:
Banana fibres were hydrolysed at different conditions. Pre-treated fibres were added to acid solution which
contains 60 wt% of water, 10 wt% of concentrated hydrochloric acid (HCl) and 30 wt% of concentrated
sulphuric acid (H2SO4). The mixture was heated to 80 °C for 16 hours with continuous stirring and then
neutralized using NaOH. The mixture was dialysed against running water for two days.
Mechanical Treatment:
The cellulose nanofibres were prepared from banana fibres using a homogenisation process. The pre-treated
fibres were first added to de-ionized water and turraxed for 20 minutes at 10 000 rpm. This procedure was
carried out by T25 Digital ULTRA-TURRAX® in an ice bath in order to break up the particle size of banana
fibres before going through in the microfluidizer. The microfluidizer M-110P was used to prepare cellulose
nanofibres due to higher shearing forces compared to the conventional homogeniser. Microfluidiser M-110P is a
laboratory unit machine that provides continuous high shear rate processing under high process pressure up to
2868 bar (30 000 psi), with a flow rate up to 120 ml/min and sample size of 50 ml.

579 M. Martini M. et al, 2014
Australian Journal of Basic and Applied Sciences, 8(4) Special 2014, Pages: 577-592
Chemo-Mechanical Treatment:
Cellulose nanofibres were prepared using a combination of TEMPO oxidation and microfluidizer. The pre-
treated fibres were added to an aqueous solution containing 0.000125 wt% of TEMPO (2, 2, 6, 6- Tetramethyl-
1-piperidinyloxy, free radical) and 0.00125 wt% sodium bromide. The reaction was initiated by adding 0.01
wt% sodium hypochlorite. The reaction was maintained at pH 10.5 by using sodium hydroxide. The reaction
was taken to have finished when no more sodium hydroxide was required in maintaining pH at 10.5. The
mixture was adjusted to pH 7 by using hydrochloric acid. All the procedures were held at room temperature.
The neutral mixture was then passed through into microfluidizer for 10 passes through 200 and 87 µm chamber
at 30 000 psi. The produced cellulose nanofibres then transferred into dialysis membrane tube having a
molecular weight cut-off 8000 Daltons and dialysed against running water for two days in order to remove
residual salts.
Preparation of the PVA film containing nanocellulose:
The composite films were prepared by using a solution casting technique. The cellulose suspensions used
for this purpose were obtained from the mentioned treatments; chemical, mechanical and combination of both
chemical and mechanical treatment. To obtain a nano-cellulose reinforced PVA film, a 10 wt% aqueous solution
of PVA powder was first prepared and stirred at 90°C for 1 hour. The PVA solution then continuously stirred
during cooling until its temperature reached room temperature. PVA solution was then mixed for 1 hour with
the cellulose nanofibres suspension to yield 1, 3 and 5 wt% concentrations of fibres, and then item placed in an
ultrasound bath for a further hour. The suspensions were then cast onto a Petri dish and dried at ambient
temperature for 3 days. The composite films were removed from Petri dish and placed in a dessicator with
saturated salt solution for 2 days before storage at 23°C and 50% relative humidity in humidity oven prior to
characterization in order to prevent excess absorption of atmospheric moisture. All of these systems were
compared with a control system containing only cast PVA.
Electron Microscopy: The size distribution of cellulose nanofibres was studied with a Philips transmission electron microscope
(Philips M100 TEM, Philips, Eindhoven, The Netherlands) at an acceleration voltage of 100 kV. Firstly, a
droplet of acitracin (0.01%) was put on a Cu-grid coated with a thin carbon film, as a wetting agent, and dried
under a study lamp for 5 seconds. After that, cellulose nanofibre suspension was put on the same Cu-grid, and
dried again for 5 seconds. A 2 wt% of uranyl acetate was used as stain to improve the contrast of the cellulose
nanofibres. The suspension was stained for 2 minutes and then was dipped in a droplet of distilled water for 2
seconds to remove the excess of uranyl acetate. It was then dried under a study lamp for 5 seconds. An
estimation of the aspect ratio of the nanofibres was made by image analysis of Transmission electron
microscopy (TEM) micrographs, using XT DOCU software. The number of particles measured was chosen
from the particle size distribution observed and the specified confidence limits (ISO 13322-1:2004). Average of
at least ten measurements for nanofibre lengths and diameters were taken.
The morphology of virgin fibres and fracture surface of the composites produced were examined using a
JEOL JSM-6500 FEG scanning electron microscope (SEM). In order to avoid build up of electrostatic charge,
the fractured and sectioned samples were sputter coated with gold (Qua, E., et al., 2011).
FTIR Analysis: FTIR spectroscopy is able to provide evidence of any new functional groups or chemical bonding of the
PVA composites, also investigate the chemical structure changes when treatments (chemical and mechanical)
are applied. FTIR analysis was performed onto raw materials and cellulose nanofibres in order to study their
changes in chemical structure by using attenuated total reflection (ATR) analysis. The FTIR spectra of all
specimens were performed using a Perkin Elmer spectrometer (Spectrum 1000) instrument with a universal
ATR sampling accessory. 64 scans were collected between 650 and 4000 cm-1
with 2 cm-1
resolution.
X-ray Analysis: All the x-ray diffraction studies were performed using x-ray diffractometer (X-pert Pro PANalytical) at 40
kV and 40 mA. All the samples were scanned using a Ni-filtered CuKα beam (wavelength, λ = 1.5406 Å) at a
rate of 0.03 step/0.6 s. An antiscattering slit of 0.6 mm was positioned before the detector to reduce beam
scattering. Again, the copper filter was positioned behind the scattering slit for the same reason (Qua, E. H.,
2008). In this study, raw fibres and cellulose nano-fibres were scanned for XRD analysis.
Thermal Analysis:
TGA:
Thermal stability and identification of decomposition product of virgin banana fibre and cellulose
nanofibres were determined by using a Mettler-Toledo TGA/SDTA 851 thermal analysis system. The samples
580 M. Martini M. et al, 2014
Australian Journal of Basic and Applied Sciences, 8(4) Special 2014, Pages: 577-592
size was approximately 5-10 mg, heated in alumina crucibles (150 µm) over a temperature range from 25 °C to
600 °C at a heating rate of 10 °C/min and nitrogen purge gas flow of 50 cm3/min. Mettler-STAR software was
used in recorded the weight loss and first derivative of weight loss.
DMA:
The PVA nano-composites were tested in the tensile mode using a Triton DMA 2000 (Friedberg,
Germany). The measurements were carried out at constant frequency of 1 Hz with 1 N pre-load, strain
amplitude of 0.1%, a heating rate of 5 °C/min and a gap distance of 5 mm. The samples were prepared by
cutting strips from the films and composites with a width of 5 mm.
Mechanical Properties: The modulus, yield and tensile strength of the nanocomposites were measured using INSTRON 5564
universal tensile testing machine with a 2kN load cell and a 50 mm/min crosshead speed according to ISO 527-
2:1996 ( ISO, E., 1996). Test specimens were prepared with the use of a punch die designed to cut a smooth and
stress free test piece into an ASTM standard shape; gauge length is 50 mm and 5 mm width.
RESULTS AND DISCUSSION
Microscopy, Size Distribution And Appearance Of The Nanofibre Composites:
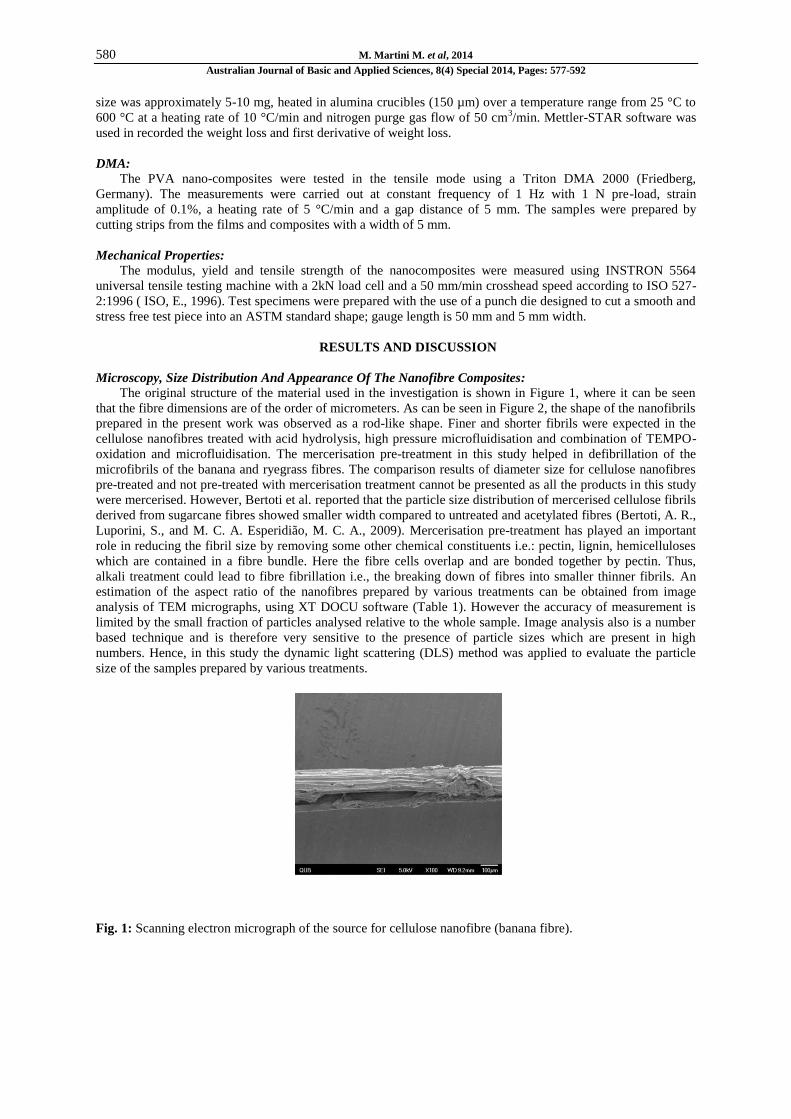
The original structure of the material used in the investigation is shown in Figure 1, where it can be seen
that the fibre dimensions are of the order of micrometers. As can be seen in Figure 2, the shape of the nanofibrils
prepared in the present work was observed as a rod-like shape. Finer and shorter fibrils were expected in the
cellulose nanofibres treated with acid hydrolysis, high pressure microfluidisation and combination of TEMPO-
oxidation and microfluidisation. The mercerisation pre-treatment in this study helped in defibrillation of the
microfibrils of the banana and ryegrass fibres. The comparison results of diameter size for cellulose nanofibres
pre-treated and not pre-treated with mercerisation treatment cannot be presented as all the products in this study
were mercerised. However, Bertoti et al. reported that the particle size distribution of mercerised cellulose fibrils
derived from sugarcane fibres showed smaller width compared to untreated and acetylated fibres (Bertoti, A. R.,
Luporini, S., and M. C. A. Esperidião, M. C. A., 2009). Mercerisation pre-treatment has played an important
role in reducing the fibril size by removing some other chemical constituents i.e.: pectin, lignin, hemicelluloses
which are contained in a fibre bundle. Here the fibre cells overlap and are bonded together by pectin. Thus,
alkali treatment could lead to fibre fibrillation i.e., the breaking down of fibres into smaller thinner fibrils. An
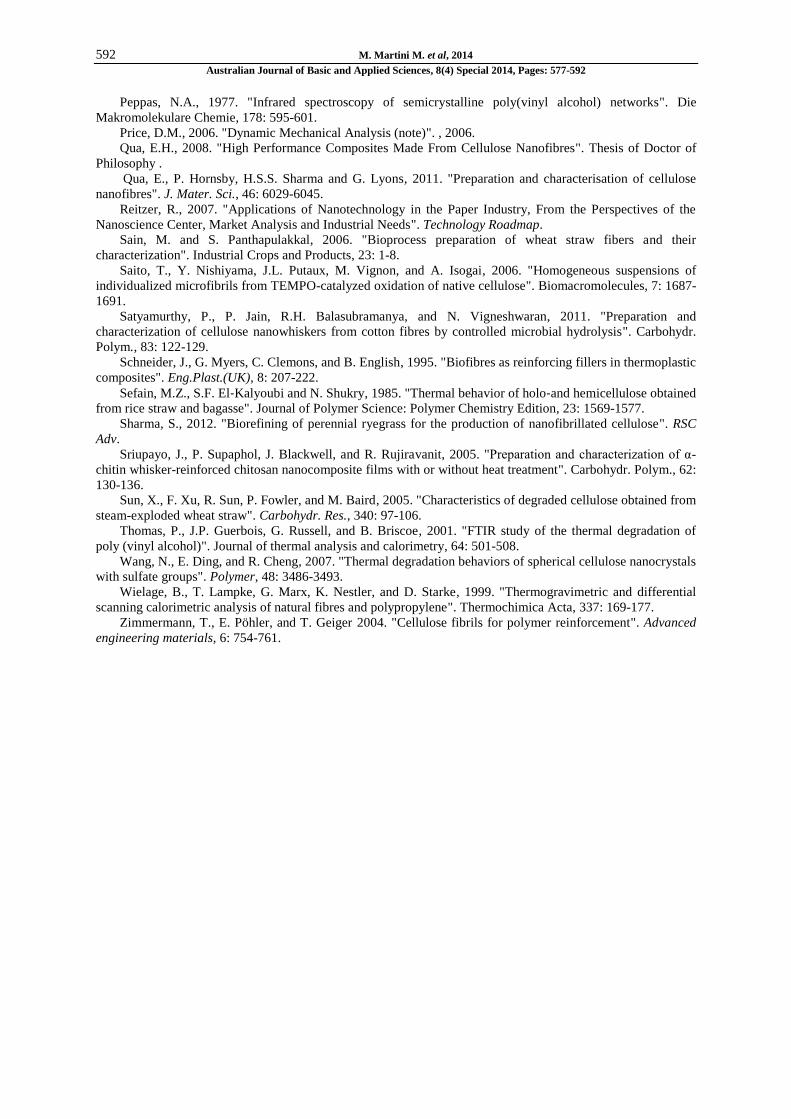
estimation of the aspect ratio of the nanofibres prepared by various treatments can be obtained from image
analysis of TEM micrographs, using XT DOCU software (Table 1). However the accuracy of measurement is
limited by the small fraction of particles analysed relative to the whole sample. Image analysis also is a number
based technique and is therefore very sensitive to the presence of particle sizes which are present in high
numbers. Hence, in this study the dynamic light scattering (DLS) method was applied to evaluate the particle
size of the samples prepared by various treatments.
Fig. 1: Scanning electron micrograph of the source for cellulose nanofibre (banana fibre).

581 M. Martini M. et al, 2014
Australian Journal of Basic and Applied Sciences, 8(4) Special 2014, Pages: 577-592
Fig. 2: Transmission electron micrographs of cellulose nanofibres derived from banana fibre: (a) acid
hydrolysis, (b) Ultra-Turrax and microfluidizer and (c) TEMPO-oxidation and microfluidizer.
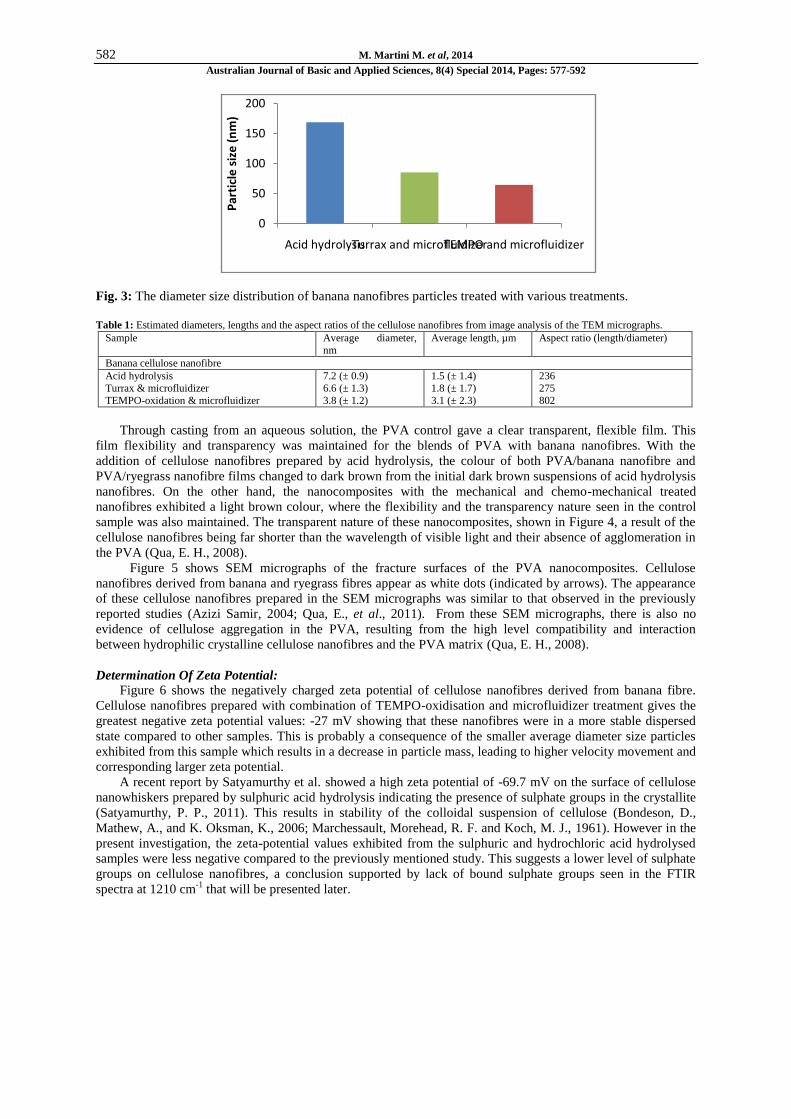
Results from DLS determinations are shown in Figure 3, in terms of Z-average diameter. The cellulose
nanofibres treated with acid hydrolysis shows a larger particle size compared to the other products, by means
that the nanofibres particles treated with acid hydrolysis aggregated in aqueous suspension rapidly compared to
other samples. These observations can be explained by higher hydrophobic characteristics of the particles i.e.
lower number of OH groups in these samples, leading to aggregation (Sharma, S., et al., 2012). The average
diameter size of cellulose nanofibres particles were 168.9 nm (acid hydrolysis), 85.4 nm (Ultra-Turrax and
microfluidizer) and 64.6 nm (TEMPO-oxidation and microfluidizer). Since the particle size was determined
from the Einstein-Stokes relation, thus the rod-like particles were treated as a spherical particle in the DLS
analysis (Lee, J. Y., et al., 2005). In the DLS study, it is evident that fibrils with diameters below 100 nm and
high aspect ratio could be isolated from banana fibre by mechanical treatment. The diameter distribution
obtained in this study is also in accordance with fibrils determined in other studies. Zimmerman reported that
high aspect ratio fibrils with a diameter below 100 nm can be obtained by using a high dispersing tool (Ultra-
Turrax) and microfluidizer (Zimmermann, T., Pöhler, E., and Geiger, T., 2004).
Banana nanofibres treated with a combination of chemical and mechanical treatment (treatment C) shows
the lowest average particle size diameter: 64.6 nm. The fibrils obtained from the combination of TEMPO-
oxidation and high pressure microfluidisation were much finer compared to the fibrils treated solely with
chemical or mechanical treatments. TEMPO-oxidation helps in separating the packed fibrils facilitating
subsequent breakdown due to the high shear experienced from microfluidisation. Furthermore, the fibres
swollen due to mercerisation treatment should cause higher friction and shear forces in the capillary during
microfluidisation, resulting in finer and shorter nanofibrils (Mohanty, A. K., Misra, M., and Drzal, L. T., 2005).
a
c
b
a b
582 M. Martini M. et al, 2014
Australian Journal of Basic and Applied Sciences, 8(4) Special 2014, Pages: 577-592
Fig. 3: The diameter size distribution of banana nanofibres particles treated with various treatments.
Table 1: Estimated diameters, lengths and the aspect ratios of the cellulose nanofibres from image analysis of the TEM micrographs.
Sample Average diameter,
nm
Average length, µm Aspect ratio (length/diameter)
Banana cellulose nanofibre
Acid hydrolysis
Turrax & microfluidizer
TEMPO-oxidation & microfluidizer
7.2 (± 0.9)
6.6 (± 1.3)
3.8 (± 1.2)
1.5 (± 1.4)
1.8 (± 1.7)
3.1 (± 2.3)
236
275
802
Through casting from an aqueous solution, the PVA control gave a clear transparent, flexible film. This
film flexibility and transparency was maintained for the blends of PVA with banana nanofibres. With the
addition of cellulose nanofibres prepared by acid hydrolysis, the colour of both PVA/banana nanofibre and
PVA/ryegrass nanofibre films changed to dark brown from the initial dark brown suspensions of acid hydrolysis
nanofibres. On the other hand, the nanocomposites with the mechanical and chemo-mechanical treated
nanofibres exhibited a light brown colour, where the flexibility and the transparency nature seen in the control
sample was also maintained. The transparent nature of these nanocomposites, shown in Figure 4, a result of the
cellulose nanofibres being far shorter than the wavelength of visible light and their absence of agglomeration in
the PVA (Qua, E. H., 2008).
Figure 5 shows SEM micrographs of the fracture surfaces of the PVA nanocomposites. Cellulose
nanofibres derived from banana and ryegrass fibres appear as white dots (indicated by arrows). The appearance
of these cellulose nanofibres prepared in the SEM micrographs was similar to that observed in the previously
reported studies (Azizi Samir, 2004; Qua, E., et al., 2011). From these SEM micrographs, there is also no
evidence of cellulose aggregation in the PVA, resulting from the high level compatibility and interaction
between hydrophilic crystalline cellulose nanofibres and the PVA matrix (Qua, E. H., 2008).
Determination Of Zeta Potential: Figure 6 shows the negatively charged zeta potential of cellulose nanofibres derived from banana fibre.
Cellulose nanofibres prepared with combination of TEMPO-oxidisation and microfluidizer treatment gives the
greatest negative zeta potential values: -27 mV showing that these nanofibres were in a more stable dispersed
state compared to other samples. This is probably a consequence of the smaller average diameter size particles
exhibited from this sample which results in a decrease in particle mass, leading to higher velocity movement and
corresponding larger zeta potential.
A recent report by Satyamurthy et al. showed a high zeta potential of -69.7 mV on the surface of cellulose
nanowhiskers prepared by sulphuric acid hydrolysis indicating the presence of sulphate groups in the crystallite
(Satyamurthy, P. P., 2011). This results in stability of the colloidal suspension of cellulose (Bondeson, D.,
Mathew, A., and K. Oksman, K., 2006; Marchessault, Morehead, R. F. and Koch, M. J., 1961). However in the
present investigation, the zeta-potential values exhibited from the sulphuric and hydrochloric acid hydrolysed
samples were less negative compared to the previously mentioned study. This suggests a lower level of sulphate
groups on cellulose nanofibres, a conclusion supported by lack of bound sulphate groups seen in the FTIR
spectra at 1210 cm-1
that will be presented later.
0
50
100
150
200
Acid hydrolysisTurrax and microfluidizerTEMPO and microfluidizerP
arti
cle
siz
e (
nm
)

583 M. Martini M. et al, 2014
Australian Journal of Basic and Applied Sciences, 8(4) Special 2014, Pages: 577-592
Fig. 4: Appearance of the produced films containing 5 wt% of cellulose nanofibres: (a) PVA, (b)
PVA/nanofibre (acid hydrolysis), (c) PVA/nanofibre (Ultra-Turrax and microfluidizer), and (d)
PVA/nanofibre (TEMPO and microfluidizer).
Fig. 5: Scanning electron micrograps of the prepared PVA films containing 5 wt% of cellulose nanofibres: (a)
PVA/nanofibre (acid hydrolysis), (b) PVA/nanofibre (Ultra-Turrax and microfluidizer) and (c)
PVA/nanofibre (TEMPO and microfluidizer)
a b c
d
a b
c

584 M. Martini M. et al, 2014
Australian Journal of Basic and Applied Sciences, 8(4) Special 2014, Pages: 577-592
Fig. 6: The zeta potential values of cellulose nanofibres derived from banana fibre treated with various
treatments.
FTIR Analysis:
Figure 7 shows the diffuse reflection FTIR spectra and results for untreated banana fibre and banana
nanofibres over 4000 to 650 cm-1
wavenumbers. With the nanofibres, there is a significant decrease in peak
intensity at 3340 and 2900 cm-1
, corresponding to vibration of OH...O hydrogen bonding and antisymmetric and
symmetric vibration of CH2 groups respectively (Alemdar, A. and Sain, M., 2008). The presence of peaks at
1445, 1370, 1160 to 1030 and 660 cm-1
corresponds to the in-plane deformation of CH2, in-plane deformation of
OH, C-O stretching from ether groups, rocking vibration of CH2 and out of plane deformation of OH...O
hydrogen bonding respectively (Qua, E., et al., 2011; Sun, X., et al., 2005). The presence of hemicellulose and
lignin are also evident in the region of 1060 to 1732 cm-1
respectively for banana fibre. The disappearance of the
small sharp band at 1732 cm-1
and general decrease in peak intensities in the region 1060 to 1733 cm-1
was
observed in banana nanofibres. This indicates that most of the hemicellulose was removed during the chemical
and mechanical treatments.
The peaks at 1733 and 1242 cm-1
in untreated fibre can be attributed to acetyl and uronic ester (C=O)
groups from pectin, hemicelluloses along with the ester linkage of carboxylic group of ferulic and ρ-coumaric
acids of lignin (Alemdar, A. and Sain, M., 2008; Sain, M. and Panthapulakkal, S., 2006; Sun, X., et al., 2005).
However the acid hydrolysis treated nanofibre showed no absorbance in this band and a general decrease in
peak intensities in the region of 1600 to 1750 cm-1
. This indicates that most of the hemicelluloses and lignin
have been extracted during hydrolysis process (Sharma, S., et al., 2012). The introduction of sulphate groups is
presented at 1210 cm-1
, however the acid hydrolysis treated naofibres in this study did not show absorptions
corresponding to sulphate groups at 1210 cm-1
resulting from neutralisation by NaOH (Sharma, S., et al., 2012).
FTIR spectra of the neat PVA film, PVA/banana nanofibre (acid hydrolysis), PVA/banana nanofibre
(Turrax and microfluidizer) and PVA/banana nanofibre (TEMPO and microfluidizer) nanocomposites films are
compared in Figure 8. Neat PVA film shows peaks at 3310 cm-1
(-OH stretching), 2930 cm-1
(alkyl CH
stretching), 1716 cm-1
(acetate C=O stretching), 1650 cm-1
(H – O – H deformation), 1565 cm-1
(CH bending),
1415 cm-1
(CH bending), 1238 cm-1
(acetate C – O bending), and 1086 cm-1
(C – O stretching). The presence of
peaks at 1716 cm-1
, 1375 cm-1
and 1238 cm-1
are attributed to the residual acetate groups in the PVA polymer
(Thomas, P., 2001). An absorption peak was verified at a frequency of 1142 cm-1
(C – O, wavenumbers of 1090
– 1150 cm-1
) (Mansur, H. S., Oréfice, and Mansur, 2004). This bond vibration is mostly attributed to the
crystallinity of the PVA, related to the carboxyl stretching band (C – O) (Peppas, N. A. and S. L. Wright, S. L.,
1996; Peppas, N. A., 1977).
The intensity of the broad band peaks in the region of 1086, 1238, and 1376 cm-1
increased with the
presence of cellulose nanofibres in the PVA matrix, as a result of the contribution of C – O and C – H stretching
from the cellulosic component. Addition of the cellulose nanofibres to the PVA matrix produced only a slight
effect on the intensity of OH stretching. This may due to the –OH groups on the surface of cellulose nanofibres
interacting with adjacent –OH groups in the PVA without affecting the bonding between OH groups in the PVA
matrix itself (Qua, E. H., 2008).
-30
-25
-20
-15
-10
-5
0
Acid hydrolysisTurrax and
microfluidizerTEMPO and
microfluidizer
Zeta
po
ten
tial
(m
V)

585 M. Martini M. et al, 2014
Australian Journal of Basic and Applied Sciences, 8(4) Special 2014, Pages: 577-592
Fig. 7: IR spectra of banana fibre and banana nanofibre made by using acid hydrolysis, Turrax and
microfluidizer and TEMPO and microfluidizer.
Fig. 8: IR spectra of the PVA and PVA nanocomposite films containing 5 wt% of cellulose nanofibres.
XRD Analysis: XRD diffractograms for the films produced, cellulose nanofibres and untreated fibres are shown in Figure 9
and 10. Three main reflections at 2θ = 11.7°, 16.4° and 22.6° were observed for the banana fibre and nanofibres,
corresponding to a cellulose I structure (Mathew, A.P., Oksman and Sain, 2005; Sharma, S., et al., 2012). There
was an increase in the intensity seen with banana nanofibres compared to its precursor. This suggests that the
resulting nanofibres are more crystalline than the untreated banana fibre. The intensity literally indicates the
degree of crystallinity of the samples. In this study, the degree of crystallinity also has been measured by an
empirical method developed by Segal and co-workers (1959). This method has been widely used for the study
of crystallinity of native cellulose where apparent crystallinity (%) of cellulose determined by XRD can be
calculated from the following equation:
C = I200 – Inon-cry
I200
Where;
C = crystallinity
100%

586 M. Martini M. et al, 2014
Australian Journal of Basic and Applied Sciences, 8(4) Special 2014, Pages: 577-592
I200 = maximum intensity of the peak corresponding to the plane in the sample with the Miller indices 200
at 2θ angle between 22-24°.
Inon-cry = intensity of diffraction of the non-crystalline material which is taken at an angle of about
18° 2θ in the valley between peaks.
As can be seen in Figure 9, the nanofibrils derived from the microfluidizer were much more crystalline that
the virgin banana fibres. Furthermore, the crystallinity of these microfibrillated banana fibres increased with the
added TEMPO-oxidation treatment before passing through the microfluidizer. The banana nanofibres treated
with combination of chemical and mechanical treatments showed highest intensity and degree of crystallinity
(Table 2) compared to other nanofibres treated with solely by chemical or mechanical treatment. This resulted
from the disintegration process by loosening the adhesion between microfibrils by TEMPO-mediated oxidation.
Thus TEMPO-oxidation has eased the removal process of amorphous regions where the lignin and polyose layer
such hemicellulose surround the banana fibres (Qua, E. H., 2008; Saito, T. Y., et al., 2006).
PVA film showed a single scattering peak at 2θ = 19.5° as accordance to previous studies (Figure 10) (Qua,
E., et al., 2011; Sriupayo, J. P., et al., 2005). The presence of the secondary peak at approximately 2θ = 22.4°
was observed in the PVA nanocomposites. This is obviously due to the contribution of the cellulose I from
cellulose nanofibre included in PVA composites. From the reflection intensity of the PVA and PVA
nanocomposites peak at 19.5°, the crystallinity of the PVA/nanofibre treated with acid hydrolysis was not
significantly changed by 5 wt% addition of cellulose nanofibre. Qua et al also reported the same phenomenon of
the prominent peak at 22.4° which indicative of cellulose crystallinity of PVA/flax nanofibre (with 5 wt% of the
acid hydrolyzed flax nanofibres) exhibiting a low intensity compared to the control PVA film (Qua, E., et al.,
2011). PVA/banana nanofibre treated with mechanical (Turrax and microfluidizer) and chemo-mechanical
treatments (TEMPO and microfluidizer) exhibited marked crystalline behaviour, where the reflection of the
peak at 19.5° has higher intensity compared to the neat PVA film. This is probably due from the reinforcement
in a PVA composite which may act as a nucleating site and may lead to the phenomenon called
transcrytallization (Karger-Kocsis, J., 2000). The peak at 2θ = 22.4° also clearly presented in PVA/banana
nanofibre (TEMPO and microfluidizer) results is due to the contribution of the highly crystalline cellulose I
structure from the cellulose nanofibres.
Fig. 9: XRD patterns for banana fibre and dried cellulose nanofibres
Fig. 10: XRD patterns of PVA films containing 5 wt% of cellulose nanofibres derived from chemical,
mechanical and chemo-mechanical treatment.

587 M. Martini M. et al, 2014
Australian Journal of Basic and Applied Sciences, 8(4) Special 2014, Pages: 577-592
Table 2: Degree of crystallinity (%) of cellulose source (banana fibre), banana nanofibres and PVA/banana nanofibres treated with acid
hydrolysis, Turrax, microfluidizer and TEMPO-oxidation respectively.
Sample Degree of crystallinity, %
Banana fibre 60
Nanofibres A (Acid hydrolysis) 68
Nanofibres B (Turrax and microfluidizer) 64
Nanofibres C (TEMPO and microfluidizer)
PVA film
PVA/Banana nanofibre A
PVA/Banana nanofibre B PVA/Banana nanofibre C
74
52
57
65 69
Thermal Analysis:
TGA:
TGA was undertaken in a nitrogen atmosphere to study the thermal stability of the materials produced.
From Figure 11 (a), it was clearly observed that all samples had a small weight loss at low temperature (<110
°C) which corresponds to the evaporation of absorbed water. After 200 °C, the thermal behaviour of the
cellulose nanofibres was totally different to the starting materials and decomposition of the fibre occurs
(Bledzki, A. K., Sperber, V. E. and Faruk, O., 2006). A single degradation peak was observed in the DTG curve
(Figure 11 (b)) of the parent source and the cellulose nanofibres. The onset decomposition temperature of
banana fibre was 290 °C respectively. This reflects the presence of the less thermally stable non-structural
hemicelluloses and pectin within the untreated fibres. Hemicellulose is generally thought to decompose first,
followed by cellulose and lignin (Byrne, C. and Nagle, D., 1997; Sefain, M. Z., et al., 1985; Wielage, B., et al.,
1999).
The pyrolysis of banana nanofibres treated with chemical and mechanical treatment show the same trend as
can be seen in Figures 11 (a). The onset degradation temperature of the nanofibres shifted to higher temperature
at 319 °C (acid hydrolysis), 303 °C (Turrax and microfluidizer) and 295 °C (TEMPO and microfluidizer)
respectively compared to the feedstock fibre (290 °C). It can be anticipated that the presence of hemicellulose,
lignin and other non-cellulosic constituents in untreated fibres which decompose at low temperature help to
cause early onset of degradation. Furthermore, this is thought to be influenced by the particle size, crystallinity,
metal ions and purity of the defibrillated banana (Qua, E. H., 2008). It is evident that the treatment by the
microfluidizer resulted in a decrease particle size distribution and together with an increase in both cellulose
purity and crystallinity, which is in accordance with the DLS, FTIR and XRD results. In the chemically treated
samples however, removal of all these non-cellulosic materials helps to make the cellulosic structure more dense
and compact and hence the rise of the onset temperature of degradation. Rearrangement and reorientation of the
crystals in cellulose can promote an increase in thermal stability (Mandal, A. and Chakrabarty, D., 2011).
Fig. 11: TGA curves under nitrogen for untreated banana fibres and cellulose nanofibres produced: (a) TG
weight loss and (b) DTG curves.

588 M. Martini M. et al, 2014
Australian Journal of Basic and Applied Sciences, 8(4) Special 2014, Pages: 577-592
DMA:
The DMA will measure the storage modulus (E’) being in-phase with the applied stress and, representing
the elastic component of a material’s behaviour, the loss modulus (E’’) corresponding to the viscous nature of a
material and mechanical damping factor (tan δ), which is the ratio between loss and storage modulus (E’’/E’),
providing a measure the amount of deformational energy that is dissipated as heat during each cycle (Price, D.
M., 2006). Storage modulus (E’) and tan δ behaviour of PVA nanocomposites, containing nanofibres prepared
by chemical means, are shown in Figures 12 and 13. All the DMTA results, including storage modulus at -20,
30 and 70 °C and the corresponding tan δ peak temperatures for the composites are listed in Table 3.
In this study, the samples were conditioned prior to characterisation at 23 °C and 50% relative humidity
(RH), and also after drying at 55 °C. The storage modulus of the PVA nanocomposites containing cellulose
nanofibres is higher over the entire temperature span compared to the neat PVA film. As can be seen in Figure
12 (a), the conditioned PVA nanocomposites (23 °C and 50% RH) showed an increase in storage modulus at -20
°C compared to the neat PVA film. At this temperature, there were 66% improvement in modulus for
PVA/banana nanofibres (acid hydrolysis) respectively. At 70 °C the PVA nanocomposites gave a significant
increase in storage modulus of 43, 17 and 28% for PVA/banana nanofibre (acid hydrolysis), PVA/banana
nanofibre (Turrax and microfluidizer) and PVA/banana nanofibre (TEMPO and microfluidizer). However, the
dried PVA nanocomposites (Figure 13 (a)) showed only a limited increase in their storage modulus at -20 °C,
compared to the neat PVA film although these storage modulus improvements were much higher at higher
temperatures (35 and 70 °C).
Meanwhile the PVA nanocomposites showed an overall large increase in tan δ, the latter reflecting an
increase in glass transition temperature (Tg) as shown in Figure 12 (b) and 13 (b). This indicates that the load
transfers from matrix to filler with due to good interfacial contact bonding in the nanocomposites. This was also
attributable to the homogenous dispersion of cellulose nanofibres in the matrix.
Fig. 12: DMTA analysis of the neat PVA and PVA nanocomposite films (conditioned at 23 °C and 50% RH):
(a) storage modulus curves and (b) tan δ peaks.

589 M. Martini M. et al, 2014
Australian Journal of Basic and Applied Sciences, 8(4) Special 2014, Pages: 577-592
Fig. 13: DMTA analysis of the neat PVA and PVA nanocomposite films (dried at 55 °C): (a) storage modulus
curves and (b) tan δ peaks.
Table 3: DMTA results of neat PVA film and PVA nanocomposites containing 5 wt% of cellulose nanofibres derived from chemical,
mechanical and chemo-mechanical treatments.
Materials Storage modulus (MPa)
23 °C, 50% RH
Storage modulus (MPa)
Dried at 55°C
-20°C 30°C 70°C Tan δ peak °C
-20°C 30°C 70°C Tan δ peak °C
PVA 5123 784 133 25 7129 4825 448 48
PVA/Acid hydrolysis
PVA/Turrax & microfluidizer
PVA/TEMPO & microfluidizer
8500
5381
5369
907
964
974
190
155
170
30
30
30
8029
7198
8075
6135
5714
6370
898
1673
1342
49
66
64
Mechanical Properties: Tensile modulus, tensile stress at yield and tensile stress at break (ultimate tensile strength) of the nano-
composite PVA films are compared with neat PVA in Figure 14. The tensile stress at yield values was recorded
from the tensile stress value (y-axis) at approximately 20% of strain (x-axis). The level of the mechanical
properties of PVA films prepared in this study differs from previously published reports. Typically PVA
exhibited 60 – 95 MPa for tensile strength and 2 – 4 GPa for tensile modulus (Bhatnagar, A. and Sain, M.,
2005; Cheng, Q., et al., 2009; Wang, N., Ding, E., and Cheng, R., 2007). This is probably due to the conditions
of the samples tested where in this work; the composites have been conditioned at 23 °C and 50% relative
humidity prior to characterisation, softening the resulting PVA films and causing pronounced changes in
mechanical properties. Therefore, the mechanical properties of the PVA supplied in this work were much
smaller than alternative forms of PVA reported in the literature.
Despite the differences in base material properties, PVA matrix reinforced by cellulose nanofibres derived
from banana fibre gave a significant improvement in tensile modulus. The tensile modulus increased

590 M. Martini M. et al, 2014
Australian Journal of Basic and Applied Sciences, 8(4) Special 2014, Pages: 577-592
approximately by 300% by adding only 5 wt% of cellulose nanofibres. With respect to the tensile stress at yield
(TSY), all the PVA nanocomposites obtained were 1.5 to 1.7 times higher compared to the neat PVA film.
There was also a greater improvement in TSB for the PVA nanocomposites reinforced by mechanical and
chemo-mechanical treated cellulose nanofibres compared to cellulose nanofibres prepared only with chemical
(see Figure 14). The tensile stress at break (TSB) values obtained show an improvement of approximately 42-
44% for PVA nanocomposite films except for the PVA/banana nanofibre treated with acid hydrolysis which
gave a 26% enhancement relative to the neat PVA. These promising results provide evidence for the strong
interaction between the cellulose nanofibres and PVA matrix via hydrogen bonds, resulting in the formation of a
rigid network, yielding improved mechanical properties. This is also attributed to the high level of compatibility
and interaction between the fibre and matrix aided by a high interfacial surface area (Qua, E. H., 2011).
As in shown in the TEM micrographs, all the nanofibres produced by these preparation methods had a rod-
like shape. From size analysis of these images (diameter and length), the banana nanofibres made by chemo-
mechanical treatment (TEMPO-oxidation and microfluidizer) gave a smaller diameters and longer lengths,
resulting in high aspect ratios. By having high aspect ratio, the fibres transferred stress more effectively under an
applied external load giving a higher stiffness and strength of the composite ( Nabi Saheb, D. and Jog, J. P.,
1999). Besides that, the smaller size will increase the fibre surface area, hence increasing interfacial interaction
between cellulose nanofibres and the matrix resulting in stronger bonding. This may also explain the better
improvement in the TSB for PVA nanocomposites reinforced by cellulose nanofibres prepared using the
microfluidizer and combination of TEMPO treatment and the microfluidizer compared to solely chemically
treated cellulose nanofibres. Moreover, the nanocomposites showed such a marked improvement in TSY
whereas only a modest improvement in TSB. This is probably due to the fibres creating stress concentrations at
very higher stress and strain levels causing premature failure (Hornsby, P. R., 2013).
Fig. 14: Mechanical properties analysis of PVA films containing 5 wt% of cellulose nanofibre: (a) tensile
modulus and (b) tensile stress at yield and break.
Conclusions:
The objective of this investigation was to determine an optimum methedology for biorefining of cellulose
nanofibres for the reinforcement of PVA. To this end, cellulose nanofibres were successfully derived from
banana fibe using three different strategies; chemical treatment (acid hydrolysis), mechanical shearing (high
dispersion Turrax mixer and high pressure microfluidizer) and combination of chemical and mechanical

591 M. Martini M. et al, 2014
Australian Journal of Basic and Applied Sciences, 8(4) Special 2014, Pages: 577-592
treatments (TEMPO-oxidation and high pressure microfluidizer). Combination of high pressure
microfluidisation with TEMPO-oxidation treatment gave the most promising results, resulting in finer cellulose
nanofibrils. TEMPO-oxidation was considered to facilitate the fibre breakdown process by reducing the strong
intermolecular interaction within microfibril bundles. The addition of only 5 wt% of cellulose nanofibres (made
by a combination of TEMPO-oxidation and microfluidisation) to PVA tripled the tensile modulus of polymer
and yielded optically transparent composites. DMTA results indicated that the use of cellulose nanofibres
induces a mechanical percolation phenomenon leaidng to higher mechanical properties over a wide temperature
range through the formation of a rigid filler network in the polymer matrix. Furthermore, the crsytallinity of the
PVA composites was increased compared to the neat PVA, influenced by a nucleating effect of the cellulose
nanofibres. The use of cellulose nanofibres is limited to only laboratory-scale production (solution casting
process). To scale up to an industrial level, it is important to incorporate these cellulose nanofibres into
polymers commercial production techniques, in particular melt compounding. The composite containing
cellulose nanofibres could be used for manufacturing high strength/value products, such as packaging, gutters
and drain pipes. This will require consideration of both extraction and injection-molding processes and means
for combining the fibres with polymer melts without degradation and aaggregation.
REFERENCES
Alemdar, A. and M. Sain, 2008. "Isolation and characterization of nanofibers from agricultural residues–
Wheat straw and soy hulls." Bioresour. Technol., 99: 1664-1671.
Azizi Samir, My Ahmed Said, F. Alloin, J. Sanchez, and A. Dufresne, 2004. "Cellulose nanocrystals
reinforced poly (oxyethylene)". Polymer, 45: 4149-4157.
Bertoti, A.R., S. Luporini and M.C.A. Esperidião, 2009. "Effects of acetylation in vapor phase and
mercerization on the properties of sugarcane fibers". Carbohydr. Polym., 77: 20-24.
Bhatnagar, A. and M. Sain, 2005. "Processing of Cellulose Nanofiber-reinforced Composites". Journal of
Reinforced Plastics and Composites, 24: 1259-1268.
Bledzki, A.K., V.E. Sperber and O. Faruk, 2002. "Natural and Wood Fibre Reinforcement in Polymers",13.
Bondeson, D., A. Mathew, and K. Oksman, 2006. "Optimization of the isolation of nanocrystals from
microcrystalline cellulose by acid hydrolysis". Cellulose, 13: 171-180.
Byrne, C. and D. Nagle, 1997. "Carbonization of wood for advanced materials applications". Carbon, 35:
259-266.
Cheng, Q., S. Wang and T.G. Rials, 2009. "Poly(vinyl alcohol) nanocomposites reinforced with cellulose
fibrils isolated by high intensity ultrasonication". Composites Part A: Applied Science and Manufacturing, 40:
218-224.
Hornsby, P.R., 2013. "Personal communication". ISO, E. 527-2: 1996. Plastics-Determination of Tensile
Properties-Part 2.
Karger-Kocsis, J., 2000. "Reinforced polymer blends". Polymer blends, 2, 395-428.
Lee, J.Y., J.S. Kim, K. Hyeok An, K. Lee, D.Y. Kim, D.J. Bae and Y.H. Lee, 2005. "Electrophoretic and
dynamic light scattering in evaluating dispersion and size distribution of single-walled carbon nanotubes".
Journal of nanoscience and nanotechnology, 5: 1045-1049.
Lew, C., W. Murphy and G. McNally, 2004. "Preparation and properties of polyolefin‐clay
nanocomposites". Polymer Engineering & Science, 44: 1027-1035.
Mandal, A. and D. Chakrabarty, 2011. "Isolation of nanocellulose from waste sugarcane bagasse (SCB) and
its characterization". Carbohydr. Polym., 86: 1291-1299.
Mansur, H.S., R.L. Oréfice and A.A.P. Mansur, 2004. "Characterization of poly(vinyl
alcohol)/poly(ethylene glycol) hydrogels and PVA-derived hybrids by small-angle X-ray scattering and FTIR
spectroscopy". Polymer, 45: 7193-7202.
Marchessault, R., F. Morehead, and M.J. Koch, 1961. "Some hydrodynamic properties of neutral
suspensions of cellulose crystallites as related to size and shape". J. Colloid Sci., 16: 327-344.
Mathew, A.P., K. Oksman and M. Sain, 2005. "Mechanical properties of biodegradable composites from
poly lactic acid (PLA) and microcrystalline cellulose (MCC)". J Appl Polym Sci., 97: 2014-2025.
Mohanty, A.K., M. Misra and L.T. Drzal, 2005. "Natural fibers, biopolymers, and biocomposites".
Mohanty, A., M. Misra, and G. Hinrichsen, 2000. "Biofibres, biodegradable polymers and biocomposites:
An overview". Macromolecular Materials and Engineering, 276: 1-24.
Mukhopadhyay, S., R. Fangueiro, Y. Arpac and U. Senturk, 2008. "Banana Fibres - Variability and Fracture
Behaviour". Journal of Engineered Fibres and Fabrics, 3: 39.
Nabi Saheb, D. and J.P. Jog, 1999. "Natural fiber polymer composites: A review". Adv. Polym. Technol.,
18: 351-363.
Peppas, N.A. and S.L. Wright, 1996. "Solute diffusion in poly (vinyl alcohol)/poly (acrylic acid)
interpenetrating networks". Macromolecules, 29: 8798-8804.
592 M. Martini M. et al, 2014
Australian Journal of Basic and Applied Sciences, 8(4) Special 2014, Pages: 577-592
Peppas, N.A., 1977. "Infrared spectroscopy of semicrystalline poly(vinyl alcohol) networks". Die
Makromolekulare Chemie, 178: 595-601.
Price, D.M., 2006. "Dynamic Mechanical Analysis (note)". , 2006.
Qua, E.H., 2008. "High Performance Composites Made From Cellulose Nanofibres". Thesis of Doctor of
Philosophy .
Qua, E., P. Hornsby, H.S.S. Sharma and G. Lyons, 2011. "Preparation and characterisation of cellulose
nanofibres". J. Mater. Sci., 46: 6029-6045.
Reitzer, R., 2007. "Applications of Nanotechnology in the Paper Industry, From the Perspectives of the
Nanoscience Center, Market Analysis and Industrial Needs". Technology Roadmap.
Sain, M. and S. Panthapulakkal, 2006. "Bioprocess preparation of wheat straw fibers and their
characterization". Industrial Crops and Products, 23: 1-8.
Saito, T., Y. Nishiyama, J.L. Putaux, M. Vignon, and A. Isogai, 2006. "Homogeneous suspensions of
individualized microfibrils from TEMPO-catalyzed oxidation of native cellulose". Biomacromolecules, 7: 1687-
1691.
Satyamurthy, P., P. Jain, R.H. Balasubramanya, and N. Vigneshwaran, 2011. "Preparation and
characterization of cellulose nanowhiskers from cotton fibres by controlled microbial hydrolysis". Carbohydr.
Polym., 83: 122-129.
Schneider, J., G. Myers, C. Clemons, and B. English, 1995. "Biofibres as reinforcing fillers in thermoplastic
composites". Eng.Plast.(UK), 8: 207-222.
Sefain, M.Z., S.F. El‐Kalyoubi and N. Shukry, 1985. "Thermal behavior of holo‐and hemicellulose obtained
from rice straw and bagasse". Journal of Polymer Science: Polymer Chemistry Edition, 23: 1569-1577.
Sharma, S., 2012. "Biorefining of perennial ryegrass for the production of nanofibrillated cellulose". RSC
Adv.
Sriupayo, J., P. Supaphol, J. Blackwell, and R. Rujiravanit, 2005. "Preparation and characterization of α-
chitin whisker-reinforced chitosan nanocomposite films with or without heat treatment". Carbohydr. Polym., 62:
130-136.
Sun, X., F. Xu, R. Sun, P. Fowler, and M. Baird, 2005. "Characteristics of degraded cellulose obtained from
steam-exploded wheat straw". Carbohydr. Res., 340: 97-106.
Thomas, P., J.P. Guerbois, G. Russell, and B. Briscoe, 2001. "FTIR study of the thermal degradation of
poly (vinyl alcohol)". Journal of thermal analysis and calorimetry, 64: 501-508.
Wang, N., E. Ding, and R. Cheng, 2007. "Thermal degradation behaviors of spherical cellulose nanocrystals
with sulfate groups". Polymer, 48: 3486-3493.
Wielage, B., T. Lampke, G. Marx, K. Nestler, and D. Starke, 1999. "Thermogravimetric and differential
scanning calorimetric analysis of natural fibres and polypropylene". Thermochimica Acta, 337: 169-177.
Zimmermann, T., E. Pöhler, and T. Geiger 2004. "Cellulose fibrils for polymer reinforcement". Advanced
engineering materials, 6: 754-761.