predictive habitat modelling to estimate petrel breeding ... · scott et al.—petrel colonies 291...
TRANSCRIPT

291Scott et al.—Petrel colonies
Predictive habitat modelling to estimate petrel breeding colony sizes: sooty shearwaters (Puffinus griseus) and mottled petrels (Pterodroma inexpectata) on Whenua Hou Island
Darren Scott1
Henrik Moller2,*
DaviD FletcHer3
JaMie newMan2
JagannatH aryal4
corey Bragg2
kriStin cHarleton1
1Zoology DepartmentUniversity of otagoBox 56Dunedin 9054, new Zealand
2centre for the Study of agriculture, Food and environment
University of otagoBox 56Dunedin 9054, new Zealand
3Department of Mathematics and StatisticsUniversity of otagoBox 56Dunedin 9054, new Zealand
4School of SurveyingUniversity of otagoBox 56Dunedin 9054, new Zealand
*corresponding author: [email protected]
Abstract Between 2001 and 2006, we system-atically sampled the entire coast of whenua Hou, a rugged offshore island in southern new Zea-land, to estimate the population densities of sooty shearwaters (Puffinus griseus) and mottled petrels (Pterodroma inexpectata) by counting the en-trances of breeding burrows. a two-step regression modelling process using binomial errors was used
to predict the presence of a colony, and a normal general linear model was used to predict the density of entrances within colonies. aerial photography, giS and a Digital elevation Model were used to extract relevant habitat and location variables, and a combination of both regression models was used to predict the density of breeding burrows within each 5.32 m2 pixel on the island. this complex giS and habitat prediction modelling approach gave population estimates very similar to a more tradi-tional simple area extrapolation method and gave no improvement in precision. However, correction for the slope of the land increased our simple area estimates of population size by 11%. we estimate populations of sooty shearwater and mottled petrel breeding pairs at 173 000 (162 000–190 000) and 160 000 (123 000–197 000) respectively. Based on this number of breeding pairs, we calculate that whenua Hou supports a total population of 868 000 (554 000–1 270 000) sooty shearwaters. our esti-mate of the total mottled petrel population 202 000 pairs (162 000–242 000) is comparable with the only published estimate, but could be an underestimate because mottled petrels are sometimes found in large burrows. More research for robust estimation of population trends is needed to assess the conserva-tion status of mottled petrels.
Keywords Digital elevation Model; giS; Puffinus griseus; Pterodroma inexpectata
IntroductIon
Reliable classification of the conservation status of seabirds depends on accurate and precise estimates of population size. estimation of seabird populations at the landscape scale is often difficult, because breeding attempts may be clustered within loose colonies, key relationships between seabird density and habitat variables are uncertain, and surveys of steep slope or cliff-dwelling species need to be corrected for slope inaccuracies (Schramm 1986;
Z08019; Online publication date 2 September 2009 Received 2 July 2008; accepted 5 November 2008
New Zealand Journal of Zoology, 2009, Vol. 36: 291–3061175-8821 (online); 0301-4223 (Print)/09/3603–0291 © the royal Society of new Zealand 2009

new Zealand Journal of Zoology, 2009, vol. 36292
cuthbert 2004). extensive surveys of burrow-nesting species are further hampered by the lack of reliable tools for detecting and identifying burrow occupants (ramos et al. 1997; Hamilton 1998; Mckechnie et al. 2007; rayner et al. 2007). this study compared the mean population esti-mates and statistical uncertainties of a traditional, simple planar area extrapolation approach with those obtained by combining geographic information Systems (giS), a Digital elevation Model (DeM), aerial photography and statistical modelling. the test cases required estimates of the number of breeding burrow entrances for sooty shearwater (Puffinus griseus) and mottled petrel (Pterodroma inexpec-tata) on Whenua Hou (Codfish Island), near Rakiura (Stewart island), southern new Zealand. whenua Hou is a large (1396 ha) and rugged island, so field sampling is exhausting and slow, and the breeding burrows are generally sparse and clumped. thus, our study system offers a strong test of whether or not more complex field surveying approaches can improve the accuracy and certainty of seabird breeding population estimates within challenging landscapes. the sooty shearwater (Puffinus griseus) also known in New Zealand as tītī or muttonbird) is a medium-sized burrow-nesting petrel that breeds on new Zealand’s mainland and on numerous offshore islands between September and May each year (war-ham & wilson 1982; Marchant & Higgins 1990). Sooty shearwaters are among the most common sea-birds in new Zealand (Heather & robertson 1996; taylor 2000), recently estimated at between 18 and 23 million individuals, but even this comprehensive survey had to include extrapolations and historical counts to cover unsurveyed breeding colonies (new-man et al. 2009a this issue). widespread declines in sooty shearwater numbers in recent decades have been inferred from counts at sea (veit et al. 1997), counts of beach-wrecked birds (Scofield & Christie 2002), chick harvest success (lyver et al. 1999; newman et al. 2008), and counts of occupied burrows and holes (lyver et al. 1999; Scott et al. 2008; Moller et al. 2009a this issue). the species is currently listed by the international Union for conservation of nature (iUcn) as “near threat-ened” (Birdlife international 2007a) although recent evidence points towards a decline great enough to justify reclassification as “vulnerable” (Scott et al. 2008). ongoing declines in sooty shearwater abun-dance could have substantial impacts on the ecology of seabird breeding islands, where their defecation and aeration of the soil makes these birds keystone
species and ecosystem engineers (Moller et al. 2000; Hawke & newman 2004, 2005; Mckechnie 2006; Mckechnie et al. 2008). Mottled petrels breed only on islands in south-ern new Zealand between october and May. the main colonies are thought to be on whenua Hou, the Snares and taukihepa (Big South cape), but reliable population estimates for this species are lacking (Heather & robertson 1996). Mottled pe-trels are also listed as near threatened by the iUcn (Birdlife international 2007b). Mottled petrels may nest in mixed colonies with sooty shearwaters on whenua Hou (imber 1996) or in exclusive areas in shallow soil and coastal tussock (warham 1985). in mixed breeding colonies, the burrows of sooty shearwaters and mottled petrels cannot always be distinguished. giS technology offers practical solutions to im-proving bird population estimates, especially when linked to a DeM to correct for undulating ground when estimating surface area of the colony. giS can also potentially produce more accurate estimates of breeding density if location and habitat vari-ables (e.g., distance to coast, elevation, vegetation characteristics) can successfully predict some of the natural spatial variation in distribution of nests (rayner et al. 2007). complete enumeration of the vegetation and location characteristics of an entire island using giS and aerial photography or remote sensing could then reduce uncertainty in population estimates based on samples from a small survey of field sites. We tested this expectation by comparing mean density estimates and the statistical uncer-tainty of the giS and habitat model approaches with estimates based on simple planar extrapolations from field plots.
MAterIAls And Methods
study areaWhenua Hou (Codfish Island; 46°45′S, 167°38′E) is a 1396 ha nature reserve separated by 3 km of water from the north-west coast of rakiura (Fig. 1). its highest peak is 280 m above sea level. Steep coastal cliffs flank much of the island, especial-ly on the western side (Fig. 2). it is covered with a diverse vegetation ranging from dense mature podocarp forest, to coastal scrub, dunes, and cush-ion bog (pākihi). The podocarp forest typically includes southern rātā (Metrosideros umbellata), kāmahi (Weinmannia racemosa), rimu (Dacrydium

293Scott et al.—Petrel colonies
Fig. 1 location of whenua Hou (Codfish Island) and Taukihepa (Big South cape) in southern new Zealand. Tītī density was studied at whenua Hou, but burrow entrance dimensions reported here were measured at taukihepa.
Fig. 2 whenua Hou and the 36 sections within the coastal Breed-ing Zone (white areas) that were surveyed to construct general linear models. the grey area represents the interior of the island. the sec-tions were further divided into five areas in the glMs.
cupressinum), miro (Prumnopitys ferruginea) and tōtara (Podocarpus cunninghamii), while the domi-nant species in the coastal scrub are “muttonbird scrub” (Senecio reinoldii and Olearia spp.), coastal
Hebe and mānuka (Leptospermum scoparium) shrub species and a diverse coastal understorey of Asple-nium spp. (Meurk & wilson 1989). a comprehensive track system has been cut over much of the island

new Zealand Journal of Zoology, 2009, vol. 36294
to facilitate conservation management of the kākāpō (Strigops habroptilus), a critically endangered flight-less and nocturnal parrot, although the steep coastal regions are mostly inaccessible. a short survey of burrow entrance dimensions in relation to species occupancy was conducted in the Paopuka area of taukihepa (Big South cape) island in 2004 (Scott et al. 2005; newman et al. 2008; Fig. 1). Details are summarised here because they are important for interpretation of our estimates of “small” compared to “large” burrow entrances on whenua Hou.
Field sampling methods on Whenua houThis analysis combines results from (a) field sur-veys in selected areas during 2001/02 and 2002/03, designed primarily to test traditional ecological Knowledge constructs of Rakiura Māori “mutton-birders” that harvest the chicks (charleton 2002; newman & Moller 2005; charleton et al. in press; Moller et al. 2009b this issue), and (b) additional surveys during the 2003/04 and 2004/05 seasons, designed to allow a better estimate of overall popu-lation size by covering sections of the island not surveyed earlier.
Defining sections, coastal breeding zone and areasthe perimeter of the island, the “coastal Breeding Zone” (cBZ), was divided into 36 “sections” for stratified sampling (Fig. 2). The first two seasons’ work had clearly demonstrated that most sooty shearwater burrows were found within this cBZ, and could be accessed directly from the island’s network of tracks. Sections were smaller where breeding burrows were concentrated, and larger (but still checked, less often) where burrows were scarce or absent. Coastal boundaries of the CBZ were defined by the 5–10 m elevation contour around the edge of the island, where vegetation typically stopped. each section extended inland perpendicular to the coast, to an internal boundary of the CBZ defined from: (1) vegetation change to a type where entrance density is known to be zero, as detected from an aerial pho-tograph; (2) known tracks and gPS points (where most of the sampling either started or finished) and beyond which no burrows had been found; (3) ridge-lines considered to be beyond the inland boundaries of potential colonies; or (4) repeated failure to find burrow entrances in survey plots. extensive recon-naissance failed to detect any burrows in the large central valley system in the middle of the island, or outside the CBZ defined as above.
the traditional ecological knowledge of the muttonbirders emphasised that geographical aspect affects colony density on some islands (Moller et al. 2009b,unpubl. data), so the 36 sections of the cBZ were further pooled into five geographical “areas” for analysis, defined as follows: (1) western cliffs: from the northern point of the west coast to the Big Bight promontory (Sections 19–31); (2) south coast: all southern areas between Big Bight and east Hut (Sections 12–18); (3) east coast: all areas between east Hut and alphonse peninsula (Sections 2–11); (4) north-west coast: from the eastern end of Sealers Bay to the northern point of knobbies Beach (Sec-tions 31–36); (5) north-east coast: from the eastern end of Sealers Bay to the alphonse peninsula (Sec-tion 1). in 34 of the 36 sections, survey protocols counted the number of entrances to petrel breeding burrows found within 10 circular plots of 3 m radius located at specified points along a single transect ranging in-land from the coast. two sections on the north-west coast area of the island with extreme slope (>52°) and high potential for damage to seabird habitat and field researchers were deemed impractical to survey without specialist equipment.
2001/02 and 2002/03 breeding seasonstransects perpendicular to the coastline were rough-ly positioned to cross the middle of each section, from as close to the edge of coastal vegetation as possible. in 2001/02 and 2002/03, circular plots were placed along each transect at 3, 15, 27, 45, 63, 93, 123, 174, 225, 324 m from the coast. Sampling along each transect was terminated either when all 10 plots had been completed, or if no burrow entrances were detected in two consecutive circular plots or while walking between those plots.
2003/04 and 2004/05 breeding seasonsthe method used in 2001/02 and 2002/03 proved far too time consuming and physically demanding, so in the 2003/04 and 2004/05 breeding seasons, a modified method was used to survey the remaining coastal areas. within each section, a single transect was established on a fixed bearing perpendicular to the coast from a random start point on the inland boundary of the cBZ. the end point of each transect was established when either the terrain became too steep to safely traverse (typically a slope of over 50°), or the edge of the vegetation was reached at the coastline. on average, six circular plots at 50 paces (c. 40 m) intervals were surveyed along each transect. gPS positions of the individual plots

295Scott et al.—Petrel colonies
and the start and end points of each transect were recorded where possible (except where high canopy cover or southerly aspects prevented adequate gPS coverage).
Entrance, location and habitat variables measured on circular plotswithin each circular plot we recorded the number of “large” (with both a maximum height and width greater than 80 mm) and “small” entrances. an en-trance wider than 80 mm was still classed “small” if its height was less than 80 mm, and vice versa. we counted only those entrances whose mid point fell within, or on, the boundary of the circular plot. the shortest distance from a burrow entrance to an egg or chick encountered in the Kia Mau Te Tītī Mo Ake Tōnu Atu research project (Moller et al. 1999, 2009c this issue) was 30 cm, so only holes leading to tun-nels >30 cm deep were scored as burrow entrances. Mottled petrel and sooty shearwater entrances are difficult to distinguish (Warham et al. 1977). For the purposes of this study, large entrances were assumed to be occupied by sooty shearwaters and small en-trances by mottled petrels. very small entrances are available only to mottled petrels because the larger sooty shearwaters are physically excluded. the traditional environmental knowledge of the muttonbirders (charleton 2002; Moller et al. b,d this issue, unpubl. data) was used to define variables predicting habitat and location preferences, which were measured within each circular plot:(i) % ground cover—the percentage of the plot
covered in dense understorey foliage (up to 1.2 m).
(ii) % canopy cover—the percentage of the plot covered with a canopy (over 1.2 m high).
(iii) % canopy species—split into one of 10 types Coprosma spp., Hebe, inaka (Dracophyllum longifolium), kāmahi, mānuka, Olearia, podo-carp, punga, rātā, other trees, and sky.
(iv) distance from coast(v) aspect—measured to the nearest 1° and later
grouped into four categories: north (315–44°), east (45–134°), south (135–234°) and west (235–314°)
(vi) slope—measured to the nearest 1° with a Sunn-tutM geological compass.
Differences in sampling methods between years meant that some variables were not measured in all plots. Missing values for “distance from coast”, “el-evation” and “slope” from the 2001/02 and 2002/03 survey were extracted for each plot from a DeM constructed for the island (see below for details).
Methods for estimating the total number of entrancestwo main approaches were used to estimate the total number of small and large entrances on the island; a traditional “area extrapolation” approach, and a giS/glM modelling approach as described in detail below.
Traditional stratified sampling approachwe estimated the planar area of all 36 sections within the cBZ on the island using a combination of gPS points from our surveying and an aerial photo of the island in arcgiS (version 9). next, a planar estimate of the total number of entrances in the study area was calculated as:
Ne ∑=j
jaNe eqn 1
where:aj = Aj × ej eqn 2and Aj is the total area of section j and ej is the mean entrance density (entrances per m2) over all plots in section j. a slope-corrected estimate of entrance numbers (Ne*) was calculated by modifying equation 2 as follows
j
jje s
eAa
×=*
eqn 3
where sj = cos(θj), and θj is the average slope for section j extracted from the DeM. variance estimates were calculated simply asV N A V ee j
jj( ) = × ( )∑ 2 eqn 4
where V(ej) is calculated as Vej/nej and Vej is the sample variance of the entrance density over all nej plots in section j. to approximate the burrow density in the two steep and fragile sections not surveyed, we used the estimates of entrance density from the nearest neighbouring sections.
GIS/GLM approacha more complex giS/generalised linear Model (glM) approach was performed in three stages: (1) we explored a candidate set of GLMs to find the one that best described burrow entrance density in terms of the habitat variables we had already recorded at each circular plot; (2) we used a giS and our DeM of the island to extract the relevant habitat variables for each 28.27 m2 pixel over the entire island; (3) we combined these estimated habitat variables and our best regression model to predict entrance density
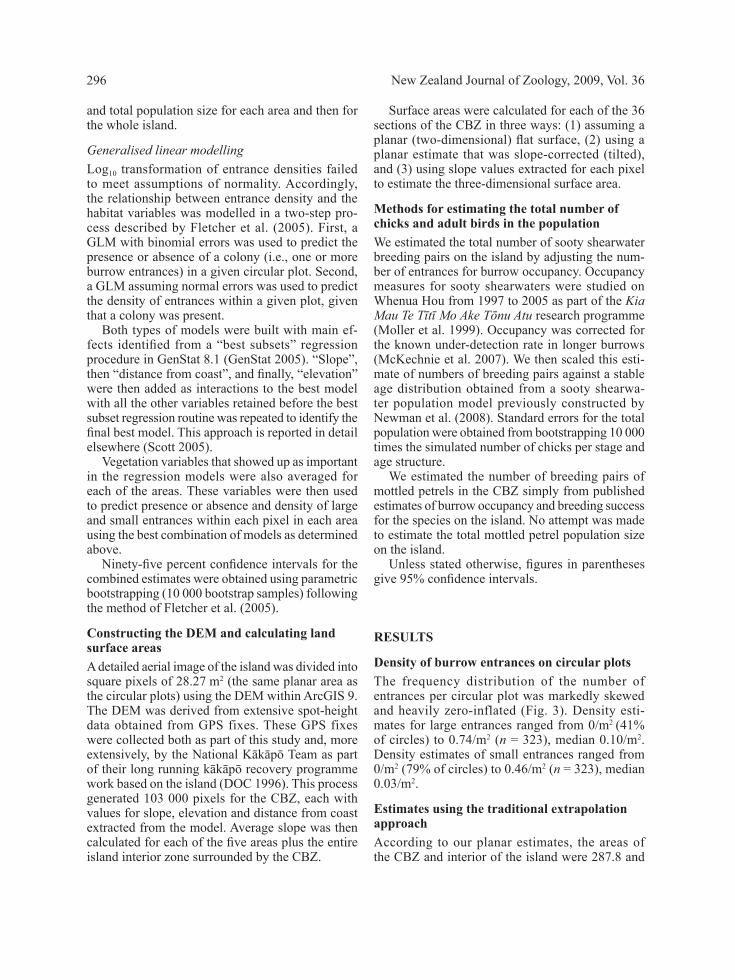
new Zealand Journal of Zoology, 2009, vol. 36296
and total population size for each area and then for the whole island.
Generalised linear m odellinglog10 transformation of entrance densities failed to meet assumptions of normality. accordingly, the relationship between entrance density and the habitat variables was modelled in a two-step pro-cess described by Fletcher et al. (2005). First, a glM with binomial errors was used to predict the presence or absence of a colony (i.e., one or more burrow entrances) in a given circular plot. Second, a glM assuming normal errors was used to predict the density of entrances within a given plot, given that a colony was present. Both types of models were built with main ef-fects identified from a “best subsets” regression procedure in genStat 8.1 (genStat 2005). “Slope”, then “distance from coast”, and finally, “elevation” were then added as interactions to the best model with all the other variables retained before the best subset regression routine was repeated to identify the final best model. This approach is reported in detail elsewhere (Scott 2005). vegetation variables that showed up as important in the regression models were also averaged for each of the areas. these variables were then used to predict presence or absence and density of large and small entrances within each pixel in each area using the best combination of models as determined above. Ninety-five percent confidence intervals for the combined estimates were obtained using parametric bootstrapping (10 000 bootstrap samples) following the method of Fletcher et al. (2005).
constructing the deM and calculating land surface areasa detailed aerial image of the island was divided into square pixels of 28.27 m2 (the same planar area as the circular plots) using the DeM within arcgiS 9. the DeM was derived from extensive spot-height data obtained from gPS fixes. these gPS fixes were collected both as part of this study and, more extensively, by the National Kākāpō Team as part of their long running kākāpō recovery programme work based on the island (Doc 1996). this process generated 103 000 pixels for the cBZ, each with values for slope, elevation and distance from coast extracted from the model. average slope was then calculated for each of the five areas plus the entire island interior zone surrounded by the cBZ.
Surface areas were calculated for each of the 36 sections of the cBZ in three ways: (1) assuming a planar (two-dimensional) flat surface, (2) using a planar estimate that was slope-corrected (tilted), and (3) using slope values extracted for each pixel to estimate the three-dimensional surface area.
Methods for estimating the total number of chicks and adult birds in the populationwe estimated the total number of sooty shearwater breeding pairs on the island by adjusting the num-ber of entrances for burrow occupancy. occupancy measures for sooty shearwaters were studied on whenua Hou from 1997 to 2005 as part of the Kia Mau Te Tītī Mo Ake Tōnu Atu research programme (Moller et al. 1999). occupancy was corrected for the known under-detection rate in longer burrows (Mckechnie et al. 2007). we then scaled this esti-mate of numbers of breeding pairs against a stable age distribution obtained from a sooty shearwa-ter population model previously constructed by newman et al. (2008). Standard errors for the total population were obtained from bootstrapping 10 000 times the simulated number of chicks per stage and age structure. we estimated the number of breeding pairs of mottled petrels in the cBZ simply from published estimates of burrow occupancy and breeding success for the species on the island. no attempt was made to estimate the total mottled petrel population size on the island. Unless stated otherwise, figures in parentheses give 95% confidence intervals.
results
density of burrow entrances on circular plotsthe frequency distribution of the number of entrances per circular plot was markedly skewed and heavily zero-inflated (Fig. 3). Density esti-mates for large entrances ranged from 0/m2 (41% of circles) to 0.74/m2 (n = 323), median 0.10/m2. Density estimates of small entrances ranged from 0/m2 (79% of circles) to 0.46/m2 (n = 323), median 0.03/m2.
estimates using the traditional extrapolation approachaccording to our planar estimates, the areas of the cBZ and interior of the island were 287.8 and

297Scott et al.—Petrel colonies
0
20
40
60
80
100
120
140
160
180
200
220
240
260
0 1 2 3 4 5 6 7 8 9 10 11 12 13 14 15 16 17 18 19 20 21
Number of entrances in circular plots
Cou
nt
Fig. 3 Histogram of large (black) and small (grey) entrance counts from circular plots.
table 1 the total number of large and small entrances to petrel breeding burrows on whenua Hou estimated using a traditional sampling approach (planar and planar slope-corrected) and a regression/giS model-based approach.
Methodestimatedentrances
95% Confidence interval
cvlower Upperlarge entrances Planar estimate 302 494 255 396 349 593 7.9 Planar estimate
(slope-corrected)334 486 283 285 385 686 7.8
regression/giS model 295 312 206 311 334 476 11.1Small entrances Planar estimate 148 396 120 123 176 668 9.7
Planar estimate(slope-corrected)
164 658 133 222 196 094 9.7
regression/giS model 188 189 140 577 227 221 11.7
1086 ha respectively. Slope for each extracted pixel ranged from 0 to 57°. Our slope-corrected surface area estimates for the cBZ and interior in-creased by 10.6 and 11.0% respectively, to 314.3 and 1130.0 ha. Slope-corrected estimates for the coastal area of the island using circular plot means were 334 000 (283 000–386 000) large entrances and 165 000 (133 000–196 000) small ones (table 1).
entrance estimates using regression and GIs models
Predictors of the presence/absence of coloniesthe distribution of large holes was best explained by nine variables in various combinations (table 2; R2 = 27%, n = 202). the western cliffs area had more colonies than all other areas, and the south coast had significantly fewer colonies than the western cliffs.

new Zealand Journal of Zoology, 2009, vol. 36298
table 2 Models used for estimating presence/absence and density (per m2) of large entrances on whenua Hou. Blank cells indicate factors dropped from the general linear model by the best subsets routines.
large entrances
Presence/absence entrance densityno. of samples 202 147aic 214.66 157.01R2 27.34 25.56
Parameter Coefficient Se P value Coefficient Se P valueconstant 3.63 3.02 0.229 0.6324 0.0885 < 0.001elevation 0.0155 0.0178 0.382 0.00353 0.0009 < 0.001Slope –0.263 0.142 0.064 Distance from coast –0.00929 0.0037 0.013 area 2 (south coast) –4.78 1.79 0.008 area 3 (east coast) –2 2.55 0.433 area 4 (north-west coast) 0 area 5 (north-east coast) –3.18 2.62 0.224 north aspect –0.121 0.105 0.251South aspect –0.06 0.141 0.669west aspect –0.08 0.179 0.658inaka 0.092 0.0408 0.024 0.00866 0.0025 < 0.001kamahi –0.0148 0.0905 0.102 –0.00715 0.0017 < 0.001Olearia –0.00273 0.0013 0.039rata –0.0409 0.0141 0.004 –0.00789 0.0028 0.006Manuka –0.0558 0.046 0.225 Podocarps –0.0695 0.024 0.004 Hebe elevation*distance from coast elevation*north aspect –0.00286 0.0012 0.02elevation*south aspect –0.00263 0.0012 0.026elevation*west aspect –0.0037 0.0013 0.005elevation*slope 0.001106 0.0007 0.113 area 2*slope 0.1703 0.0786 0.03 area 3*slope 0.189 0.114 0.097 area 4*slope 0 area 5*slope 0.242 0.124 0.051
The probability of finding a colony with large holes was greatest at sites with higher elevations or under an inaka canopy, and smallest at sites with greater slope, increasing distance from the coast and the presence of the tall canopy tree species (kāmahi, rātā, mānuka, or podocarps) (Table 2). the distribution of small holes was best explained by four variables (table 3; R2 = 55%, n = 202), again highest in the western area than the southern, eastern, north-west and north-eastern areas. the probability of finding a colony with small holes was greatest at sites with higher elevation, on steep slopes and under Hebe (Table 3). Significant interaction terms indicate that the effects of slope varied in different parts of the island.
Predictors of entrance density within coloniesDensity of large holes within colonies was best explained by six variables (table 2; R2 = 26%, n = 147). Higher densities were associated with increas-ing elevation, eastern aspects and more inaka in the canopy. lower entrance density was predicted by more kāmahi, Olearia, and rātā in the canopy. there was also an interaction between aspect and elevation. only 66 circular plots recorded one or more small entrances, so the models chosen by best subset re-gression had lower power compared with those for large entrances. Density of colonies with small holes was best explained by four variables (table 3; R2 = 35%, n = 66). Higher entrance density was
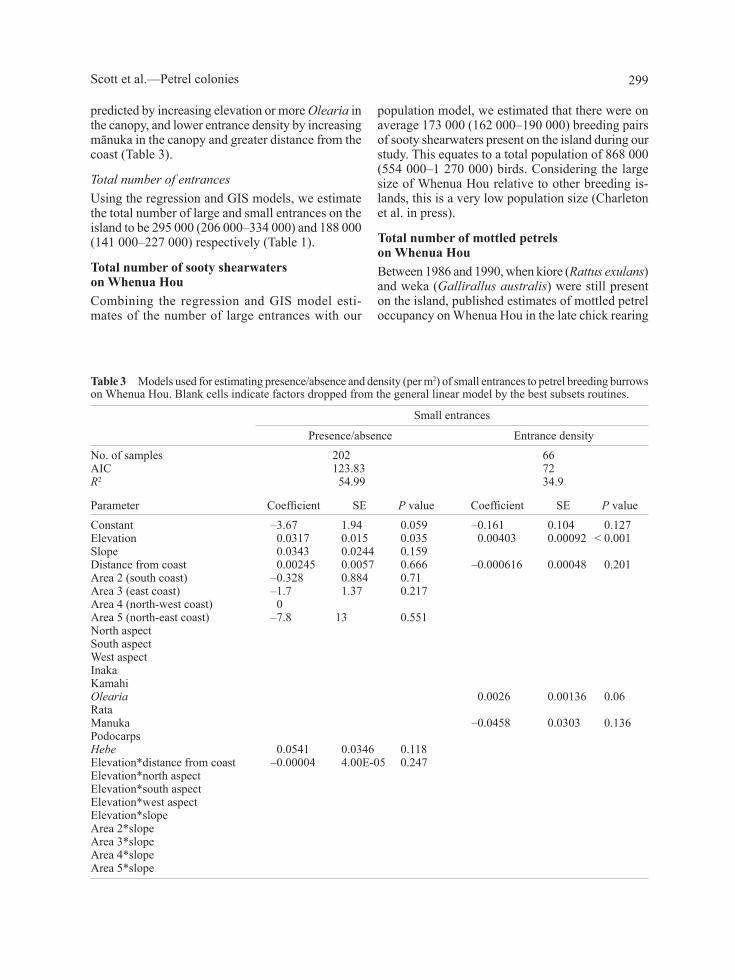
299Scott et al.—Petrel colonies
predicted by increasing elevation or more Olearia in the canopy, and lower entrance density by increasing mānuka in the canopy and greater distance from the coast (table 3).
Total number of entrancesUsing the regression and giS models, we estimate the total number of large and small entrances on the island to be 295 000 (206 000–334 000) and 188 000 (141 000–227 000) respectively (table 1).
total number of sooty shearwaters on Whenua houcombining the regression and giS model esti-mates of the number of large entrances with our
population model, we estimated that there were on average 173 000 (162 000–190 000) breeding pairs of sooty shearwaters present on the island during our study. this equates to a total population of 868 000 (554 000–1 270 000) birds. considering the large size of whenua Hou relative to other breeding is-lands, this is a very low population size (charleton et al. in press).
total number of mottled petrels on Whenua houBetween 1986 and 1990, when kiore (Rattus exulans) and weka (Gallirallus australis) were still present on the island, published estimates of mottled petrel occupancy on whenua Hou in the late chick rearing
table 3 Models used for estimating presence/absence and density (per m2) of small entrances to petrel breeding burrows on whenua Hou. Blank cells indicate factors dropped from the general linear model by the best subsets routines.
Small entrances
Presence/absence entrance densityno. of samples 202 66aic 123.83 72R2 54.99 34.9
Parameter Coefficient Se P value Coefficient Se P valueconstant –3.67 1.94 0.059 –0.161 0.104 0.127elevation 0.0317 0.015 0.035 0.00403 0.00092 < 0.001Slope 0.0343 0.0244 0.159 Distance from coast 0.00245 0.0057 0.666 –0.000616 0.00048 0.201area 2 (south coast) –0.328 0.884 0.71 area 3 (east coast) –1.7 1.37 0.217 area 4 (north-west coast) 0 area 5 (north-east coast) –7.8 13 0.551 north aspect South aspect west aspect inaka kamahi Olearia 0.0026 0.00136 0.06rata Manuka –0.0458 0.0303 0.136Podocarps Hebe 0.0541 0.0346 0.118 elevation*distance from coast –0.00004 4.00e-05 0.247 elevation*north aspect elevation*south aspect elevation*west aspect elevation*slope area 2*slope area 3*slope area 4*slope area 5*slope

new Zealand Journal of Zoology, 2009, vol. 36300
stage ranged from 0.3 to 0.48 chicks per entrance (west 1990). at that time, when many petrel eggs and chicks were probably lost to predators (M. imber 1999 pers. comm. cited in taylor 2000), imber (1996) used observations of similar species to estimate oc-cupancy to be 0.85 breeding attempts per entrance. a better comparison would be with the Snares, which has always been predator-free, as whenua Hou now is; there, warham et al. (1977) reported that 69% of mottled petrel burrows contained an egg and 65% of these eggs hatched successfully. applying imber’s point estimate of burrow occupancy to our estimated number of small entrances, we estimate that there were 160 000 (123 000–197 000) breeding pairs of mottled petrels on whenua Hou in 2001–06. Using warham’s point estimates of occupancy and breed-ing success suggests a slightly smaller number of breeding pairs present during our study i.e., 130 000 (99 000–160 000).
dIscussIon
reliability of burrow entrance counts and occupancy for estimating abundanceBreeding burrow entrances are conspicuous, and rapidly rebuilt after disturbance (Mckechnie et al. 2008). there is a demonstrable linear relationship between entrance density and population abundance once inter-annual variation in burrow occupancy has been measured (Mckechnie et al. in press). we are therefore confident that our use of entrance density counts to estimate population size is reliable. our use of a burrowscope (Hamilton 1998) and measured correction factors to account for failure to detect some eggs and chicks in deep burrows (Mckechnie et al. 2007) further improved our estimates of popu-lation density. on the other hand, our use of a popu-lation model to estimate the total number of breeding pairs from the density of chicks may have introduced some errors by underestimating the proportion of adults that skip breeding each year (newman et al. 2008). However, as the average breeding success of sooty shearwaters was measured over several years on whenua Hou itself, our extrapolation to the island’s overall population of breeding pairs from entrance density is likely to have been robust.
habitat predictors of presence of colonies and their densityBurrowing seabirds do not appear to place burrows at random (warham & wilson 1982; Furness 1991),
so we expected that specific habitat characteristics would partly govern the local distribution and abun-dance of sooty shearwaters and mottled petrels within a breeding colony. entrance density is related to veg-etation type: seabird breeding colonies are typically dominated by only a few species (warham 1960; Maesako 1985; warham & wilson 1982; warham 1990; walsh et al. 1997). there were too few plots with one or more small entrances within colonies to adequately test predictors of their density, so in the following discussion, most of our inferences about habitat and location effects pertain to large entrances. For them, our best models explained only 27% of the variation in the presence of a colony and 26% of the variation in entrance density within a colony. High altitude sites offer advantages for shearwa-ters such as ascending air currents along cliffs, coast-al slopes and large rocks. Sooty shearwaters have difficulty taking off from level ground and have the highest wing loadings of all Puffinus species (war-ham 1977), so prefer to nest on high, windy sites that allow take-offs from near breeding entrances even if located a long way from the coast. these advantages explain why elevation, slope and distance from coast emerged as the most significant positive predictors of the presence and density of burrow entrances for both sooty shearwaters and mottled petrels. oka et al. (1996) found high aggregations of short-tailed shearwaters (Puffinus tenuirostris) on coastal cliffs and coastal hill habitat types. Similarly rayner et al. (2007) could best explain the distribution of cook’s petrels (Pterodroma cookii) by slope, distance to ridgelines and altitude. Brandt et al. (1995) sug-gested that large-scale geomorphological features such as cliffs, high points on islands or proximity to large boulders might serve as aids in nest loca-tion. Some of the highest density nesting areas on whenua Hou, particularly the western cliffs and Deceit creek areas, are elevated to approximately 210 m.a.s.l., suggesting that elevation is a surrogate measure for windy or cliff sites. However, several cliff areas of whenua Hou remain unoccupied even though such sites are densely populated in other tītī islands and at the Snares, so proximity to take-off sites seems to be an insufficient explanation alone for the relatively low density of sooty shearwaters found on whenua Hou compared with other breed-ing islands (charleton et al. in press). Mottled petrel entrances were more likely to be encountered on steeper slopes and in the western cliffs area. advantages of steep terrain are rapid drainage, a wide field of view and ease of take-off and landing, as well as reduced risk of burrow

301Scott et al.—Petrel colonies
collapse or flooding and ease of excavation (Stokes & Boersma 1991; Brandt et al. 1995). inaka was a strong positive predictor of the distribution of large entrances. this was unexpected, but relatively unimportant because inaka comprises only about 4–6% of the average canopy cover for each of the five areas on the island. Conversely, other significant vegetation predictors (kāmahi, Olearia, rātā and podocarps, between 4 and 15% of canopy species in all five areas) were negatively associated with distribution of large entrances. aspect was a weak predictor of sooty shearwater entrance density when considered on its own, but was retained in the models primarily because it had a strong interaction with elevation (table 2). elevated eastern aspects with higher percentage canopy cover of inaka had significantly more entrances than other aspects. This study confirmed the finding by Charleton et al. (in press) that increasing distance from the coast is a significant negative predictor of sooty shearwater colonies, and a negative predictor of small entrance density. this also corroborates the traditional eco-logical knowledge of the muttonbirders (Moller et al. 2009b,unpubl. data). in contrast, the presence of mottled petrel colonies increases with distance from the coast.
Biases in population estimatesWe identified a number of possible biases in our results.(1) we had to rely on the assessment of entrances
as small (<80 mm diameter) or large sizes to indicate probable species occupancy. other stud-ies have found that the same nest cavity is often used by different species overlapping in breeding phenology (Schramm 1986; ramos et al. 1997; Fischer & Griffin 2000). After a recent burrow-scoping study on taukihepa, Scott et al. (2005) emphasised that entrance size is not adequate on its own to decide conclusively whether an entrance as being used by sooty shearwaters or mottled petrels. in this study, Scott et al. re-ported that 65% of all mottled petrels positively identified by burrowscope on Taukihepa were in burrows with entrances classed as “large”. if the same distribution of the mottled petrels between small and large holes that was seen on taukihepa was also true on whenua Hou, our calculations will have underestimated by a factor of 2.2 the population of mottled petrels present.
(2) nine percent of sooty shearwaters were found in entrances that were classed as small, even though
it is a physical impossibility for sooty shearwa-ters to pass through them. However, there are interconnections with nearby large entrances which allow the bigger species to use the bur-row behind a small entrance. therefore, we do not believe our estimate of the sooty shearwater population to be biased. Similarly, the presence of mottled petrels in some large-entranced bur-rows could affect sooty shearwater population estimation only if they were able to disrupt egg-laying by sooty shearwaters. we consider this very unlikely, because sooty shearwaters are larger, very aggressive and arrive back at the colony to establish their nests slightly earlier than do mottled petrels (warham 1990).
(3) the degree of entrance sharing revealed by a sample of entrances burrowscoped on tauki-hepa shows that the burrow systems are very complex. clearly there is a need for an extensive study of mottled petrel breeding success linked to measures of entrance dimensions, entrance density, degree of burrow sharing and occupancy (measured with the burrowscope).
(4) We could not sample very steep slopes (>50°), some of which accommodate breeding burrows, so had to extrapolate from flanking sections. extremely steep cliffs on the edge of the island have been excluded altogether because they are predominantly rocky and can support only oc-casional burrows in ledges.
(5) in the 2001/02 and 2002/03 surveys, we dis-continued transects once no burrows had been encountered in two successive plots, or when walking between the last two circular plots. Some isolated inland colonies might thereby have been missed, and the simple area extrapola-tion method would be affected by truncation of the number of zero-counts in circular plots. on the other hand, extensive movement over the areas by the tītī researchers and kākāpō manage-ment teams makes us confident that few colonies were missed; and our giS modelling approach fitted a continuous function of declining entrance density with greater distance from the coast, thereby reducing any bias from premature ter-mination of transects.
separating prediction of density from probability of encountering a colonythe high frequency of zero counts within circular plots (Fig. 3) strongly skewed the distribution of data and prevented an analysis in a single model,

new Zealand Journal of Zoology, 2009, vol. 36302
except potentially by Poisson or negative binomial methods such as those employed by rayner et al. (2007). therefore, we chose a two-step process allowing modelling of the presence/absence of a colony separately from that of entrance density within a colony (Fletcher et al. 2005). Broadly simi-lar habitat and location variables predict both colony density and colony distribution (tables 2, 3). this suggests that sooty shearwaters and mottled petrels choose their breeding site partly on the basis of local ecology and landscape features, and partly on prox-imity to other breeding birds. there is an extensive literature in behavioural ecology that emphasises the adaptive value of aggregating into groups, which naturally reflects the loosely colonial nature of petrel breeding colonies (krebs & Davis 1978; warham 1990).
Potential spatial auto-correlation effects on population estimationthe colonial nesting behaviour of petrels leads to patchiness in entrance density, on a scale that may not correspond with the spatial scale of habitat variables. this disjunction could lead to pseudo-replication and spatial autocorrelation between neighbouring sample plots, and consequent over-parameterisation of the glM models (lichstein et al. 2002). there are no measures of the spatial scales of habitat variables and petrel colonies on whenua Hou, and our study was not designed to discover them post hoc from our data. nevertheless, we think any pseudo-replication must have been slight, for three reasons. (1) there was a close correspondence between population estimates from the simple area extrapolation method (which does not attempt to link habitat variability to entrance density) and the glM method (table 1) i.e., spatial autocorrelation would be one of several potential explanations had differences been found between the methods. (2) Scale differences are not exacerbated by our sampling method (cf. lichstein et al. 2002), because habitat predictors were measured on exactly the same 3 m radius circular plots as were entrance counts. (3) our two-step modelling proce-dure helped to minimise risk of this auto-correlation, though it will not necessarily have eliminated it altogether in glMs predicting entrance density within a colony. if there has been any pseudo-replication, it would lead to underestimation of uncertainty in our glMs, and some of the habitat variables might really be weaker predictors of burrow entrance density than suggested by tables 2 and 3. only modest levels of variance were explained by the glMs, and much
of that explanatory power was related to variables describing the landscape rather than the local habi-tat, so are less likely to have been inflated by any pseudo-replication. in summary, we think that pseudo-replication from spatial autocorrelation has not deflected the use of the GLMs for our purpose of population estimation, but we do urge caution in interpreting the specific details of the GLM as prov-ing association between habitat variables and the density of petrel burrow entrances. Future studies to examine spatial autocorrelation of petrels and habitat variables will help guide conservation management of new Zealand seabirds.
comparison of population estimation approachesClassification of remotely sensed data points into habitat variables, and incorporating them into the two-step model approach adopted in this paper, was considered to improve prediction of entrance den-sity and estimation of population size. rayner et al. (2007) noted such an improvement when they com-pared the utility of simple area models, habitat area models and giS predictive modelling. However, we and they also noted that the process of building and running giS models is very time consuming, com-plex and requires considerable technical support. Few bird conservation research and management teams have this capacity. it is therefore encourag-ing that our population estimates agreed closely with each other once a slope correction had been incorporated (compare planar slope-corrected and regression/giS model in table 1). without the slope modification, our estimation of density would have been too low by around 11%. this degree of error may be unusually extreme, because whenua Hou is a rugged island compared with many of the lower and flatter tītī islands where sooty shearwaters predomi-nate. even a simple correction for average slopes at field monitoring sites, rather than the complex DEM modelling approach we used, would go a long way to correcting this obvious underestimation. incorporation of habitat and location information to enumerate the variation of each predictor vari-able should explain some of the spatial variation in distribution of breeding burrow entrances, and re-duce uncertainty in population estimates, especially where, as in this study, it can be coupled with giS, DeM and aerial photography. in practice our mod-elling approach actually gave slightly higher coef-ficients of variation for total entrance estimates (see comparison of slope-corrected planar estimate with giS model in table 1). improvements enabled by

303Scott et al.—Petrel colonies
the more sophisticated approach might be obtained in other studies, especially where more variation was explained overall by the habitat and location predictors (27–55% in our four component models, Tables 2, 3). More detailed classification of vegeta-tion at finer spatial scales might have improved our model fits. So why did Rayner et al. (2007) find improvement in estimates from spatial modelling whereas we did not? Possible explanations include ecological and social differences, or differences in crowding between the study populations, but more studies employing similar spatial modelling techniques are required before any generalisations about their efficacy will emerge. Nevertheless, the close correspondence in the aggregated population estimates from the very different approaches we used in our study suggests that many other cruder historical seabird population estimates may still be reliable compared with newer and more complicated procedures.
conservation implications and population monitoring needsthe population of sooty shearwaters on whenua Hou is large, though only around a fifth of the number breeding on taukihepa where chicks are harvested annually by Rakiura Māori (Newman et al. 2008). whenua Hou represents the largest reservoir of un-harvested sooty shearwater colonies in the rakiura region, and is the second largest unharvested colony in new Zealand after that on the Snares. there are several indications that the whenua Hou population is affected by different factors and is acting dif-ferently from the population on the Snares. chick production is sometimes very low on whenua Hou and the nearby Rakiura Tītī Islands in years when chicks on the Snares were numerous and well grown (unpubl. data). average breeding success is much lower on the Snares than on whenua Hou (newman et al. 2009b). Density dependence acts differently on movement and/or juvenile survival (Moller et al. 2009a), so lower density on whenua Hou affects vital rates and population dynamics. clearly, oceanic or climate fluctuations affect populations on The Snares and on whenua Hou in markedly different ways and at different times. Human impacts (the presence of a Māori village, cattle, weka and rats) precludes use of historical data on Whenua Hou’s absolute tītī density to indicate harvest impacts, but relative trends in tītī population size at harvested colonies compared with those at whenua Hou will be informative. For this reason we recommend the use of whenua Hou as a “non-treatment” (i.e., unharvested) reference area,
to assist efforts to partition the long-term impacts of muttonbirding from those of climate and marine ecosystems. our estimate for the mottled petrel is only slightly lower than previous estimates of between 200 000 and 400 000 breeding pairs, when based on estimates by imber (1996) of breeding success of grey-faced petrels (Pterodroma macroptera) and cook’s petrels (Pterodroma cookii) (imber 1996). From occupancy measures of mottled petrel chicks observed with the burrowscope on taukihepa (Scott et al. 2005), we es-timate that there were 32 000 (18 000–47 000) breed-ing pairs on taukihepa in the 2005 season. when these estimates are combined with 10 000 pairs on the Snares (warham et al. 1977) and 160 000 (123 000–197 000) pairs from whenua Hou (this study), we estimate the total population of mottled petrels to be 202 000 pairs (162 000–242 000). obviously, some uncertainty around these and previous estimates (robertson & Bell 1984; imber 1996; taylor 2000) is inevitable, considering the limitations of the methods (use of historic surveys; extrapolation of occupancy from limited information collected at different times and places; limited use of burrowscopes). compared with these higher-level uncertainties, the more subtle differences in accuracy and precision of simple area extrapolation compared to giS and regression methods become trivial. all the evidence points to a population of over 200 000 pairs of mottled shearwaters spread between three large islands (the Snares, taukihepa and whenua Hou) and several smaller unsurveyed offshore islands of new Zealand (taylor 2000). this population is smaller by two orders of magnitude than that of sooty shearwaters, which has declined in abundance over the past 4 decades (Scott et al. 2008; Moller et al. 2009a). longitudinal monitoring of the major colonies, and updated population estimates at the other main islands is necessary to assess whether mottled petrels are at risk of similar declines as have been observed for sooty shearwaters.
AcKnoWledGMents
We thank other members of the Kia Mau Te Tītī Mo Ake Tōnu Atu Research team and other fieldworkers who helped collect data: natasha Fijn, Mitch Bartlett, Pete lei, and the Department of conservation staff on whenua Hou. the new Zealand Foundation for research, Science and technology and the University of otago provided financial support. We are grateful to the Rakiura Tītī islands administrating Body, Southland Department of conservation and the whenua Hou Management

new Zealand Journal of Zoology, 2009, vol. 36304
committee for allowing access to restricted areas of the island. Jessica lach and Ben knight, two anonymous referees and then wonderful editing by carolyn king greatly improved earlier drafts of the manuscript.
reFerences
Birdlife international 2007a. Puffinus griseus. in: iUcn 2006. 2006 iUcn red list of threatened species. available online at <www.iucnredlist.org> (ac-cessed on 31 July 2007).
Birdlife international 2007b. Pterodroma inexpectata. in: iUcn 2006. 2006 iUcn red list of threatened species. available online from www.iucnredlist.org (accessed on 31 July 2007).
Brandt ca, Parrish Jk, Hodges cn 1995. Predictive ap-proaches to habitat quantification: dark-rumped petrels on Haleakala, Maui. auk 112: 571–579.
charleton kJ 2002. variation in sooty shearwater burrow entrance density, burrow use and chick emergence: science and traditional environmental knowledge approaches. Unpublished MSc University of otago, Dunedin.
charleton k, Bragg c, knight B, Fletcher D, Moller H, newman J, Scott D in press. Spatial variation in burrow entrance density of sooty sheawater Puffinus griseus. notornis 56.
cuthbert r 2004. Breeding biology of the atlantic petrel, Pterodroma incerta, and a population estimate of this and other burrowing petrels on gough island, South atlantic ocean. emu 104: 221–228.
Department of conservation (Doc) 1996. kakapo recovery plan 1996–2005. threatened Species recovery Plan no. 21. Department of conserva-tion, wellington.
Fletcher D, Mackenzie D, villouta e 2005. Modelling skewed data with many zeros: a simple approach combining ordinary and logistic regression. envi-ronmental and ecological Statistics 12: 45–54.
Fischer JB, Griffin CR 2000. Can burrow-nesting seabirds be identified from their burrow dimensions? Wild-life Society Bulletin 28(3): 586–591.
Furness rw 1991. the occurrence of burrow-nesting among birds and its influence on soil fertility and stability. Symposia of the Zoological Society of london 63: 53–67.
genStat 2005. genStat. 8th ed. release 8.1. oxford, Uk, vSn international ltd.
Hamilton SA 1998. Determining burrow occupancy, fledg-ing success and land-based threats to mainland and near-shore island sooty shearwater (Puffinus griseus) colonies. new Zealand Journal of Zool-ogy 25: 443–453.
Hawke DJ, newman J 2004. inventories and elemental accumulation in peat soils of forested seabird breeding islands, southern new Zealand. austra-lian Journal of Soil research 42: 45–48.
Hawke DJ, newman J 2005. Using isotope analysis to identify incorporation of marine nutrients in ter-restrial birds at the Snares islands. notornis 52: 108–111.
Heather B, robertson H 1996. Field guide to the birds of new Zealand. new Zealand, viking.
Imber MJ 1996. Report of petrel surveys on Codfish Island, 26 March to 9 april 1996. Unpublished report to the Department of conservation.
krebs Jr, Davies nB ed. 1978. Behavioural ecology: an evolutionary approach. 1st ed. oxford, Black-well.
lichstein Jw, Simons tr, Shriner Sa, Franzreb ke 2002. Spatial autocorrelation and autoregressive models in ecology. ecological Monographs 72: 445–463.
lyver Po’B, Moller H, thompson c 1999. changes in sooty shearwater Puffinus griseus chick produc-tion and harvest precede enSo events. Marine ecology Progress Series 188: 237–248.
Marchant S, Higgins PJ ed. 1990. Puffinus griseus. in: Handbook of australian, new Zealand & antarctic birds. Melbourne, oxford University Press.
Maesako y 1985. community structure of Machilus thun-bergii forests disturbed by birds (Calonectris leu-comelas: streaked shear-water) on kanmurijima island, kyoto prefecture, Japan. Japan Journal of ecology 35: 387–400.
Mckechnie S 2006. Biopedturbation by an island eco-system engineer: burrowing volumes and litter deposition by sooty shearwaters (Puffinus griseus). new Zealand Journal of Zoology 33: 259–265.
Mckechnie S, Fletcher D, Moller H, Scott D, newman J, Bragg c 2007. estimating and correcting for bias in population assessments of sooty shear-waters. Journal of wildlife Management 71(4): 1325–1335.
Mckechnie S, Moller H, Bragg c, newman J, Scott DS, cruz JB 2008. recovery of a sooty shearwater (Puffinus griseus) breeding area after artificial disturbance. new Zealand Journal of ecology 32: 34–40.
Mckechnie S, Bragg c, newman J, Scott D, Fletcher D, Moller H in press. assessing and monitoring of sooty shearwater (Puffinus griseus) abundance in southern new Zealand. wildlife research.
Meurk CD, Wilson HD 1989. Codfish Island. Department of conservation, wellington. Biological Survey of reserves 18: 46–49.

305Scott et al.—Petrel colonies
Moller H, cruz JB, Fletcher D, garrett k, Hunter c, Jones cJ, kitson J, lyver P, newman J, russell B, Scofield P, Scott D 1999. Kia Mau Te Tïtï Mo Ake tönu atu: goals, design and methods. University of otago wildlife Management report 117, te whare wananaga o otago (University of otago), Dunedin. 76 p.
Moller H, Frampton c, Hocken ag, Mclean ig, Saffer v, Sheridan l 2000. the importance of seabird research for new Zealand. new Zealand Journal of Zoology 27: 255–260.
Moller H, Fletcher D, Johnson Pn, Bell BD, Flack D, Bragg c, Scott D, newman J, Mckechnie S, lyver Po’B 2009a. changes in sooty shearwater (Puffinus griseus) abundance and harvesting on the rakiura titi islands. new Zealand Journal of Zoology 36: 325–341, this issue.
Moller H, charleton k, knight B, lyver Po’B 2009b. Traditional ecological knowledge and scientific inference of prey availability: harvests of sooty shearwater (Puffinus griseus) chicks by raki-ura Maori. new Zealand Journal of Zoology 36: 259–274, this issue.
Moller H, lyver Po’B, Bragg c, newman J, clucas r, Fletcher D, kitson J, Mckechnie S, Scott D, rakiura titi islands administering Body 2009c. guidelines for cross-cultural participatory action research partnerships: a case study of a customary seabird harvest in new Zealand. new Zealand Journal of Zoology 36: 211–241, this issue.
Moller H, kitson Jc, Downs tM 2009d. knowing by doing: learning for sustainable muttonbird har-vesting. new Zealand Journal of Zoology 36: 243–258, this issue.
newman J, Moller H 2005. Use of Matauranga (Maori tra-ditional knowledge) and science to guide a seabird harvest: getting the best of both worlds. in: indig-enous use and management of marine resources. Senri ethnological Studies 67: 303–321.
newman J, Scott D, Fletcher D, Moller H, Mckechnie S 2008. a population and harvest intensity estimate for sooty shearwater (Puffinus griseus) on tauki-hepa (Big South cape), new Zealand. Papers and Proceedings of the royal Society of tasmania 142: 177–184.
newman J, Scott D, Bragg c, Mckechnie S, Moller H, Fletcher D 2009a. estimating regional popula-tion size and annual harvest intensity of the sooty shearwater in new Zealand. new Zealand Journal of Zoology 36: 307–323, this issue.
newman J, Fletcher D, Moller H, Harper g, Bragg c, Scott D, Mckechnie S 2009b. estimates of productivity and detection probabilities of breeding attempts in the sooty shearwater (Puffinus griseus) a burrow nesting petrel.wildlife research 36: 159–168.
oka n, Maruyama n, kuroda n, Skira i 1996. colony site selection of short-tailed shearwaters in tasmania. Journal of the yamashina institute for ornithology 28: 35–41.
ramos Ja, Monteiro lr, Sola e, Moniz Z 1997. char-acteristics and competition for nest cavities in burrowing procellariiformes. condor 99(3): 634–641.
rayner MJ, clout Mn, Stamp rk, imber MJ, Brunton DH, Hauber Me 2007. Predictive habitat modelling for the population census of a burrowing seabird: a study of the endangered cook’s petrel. Biological conservation 138: 235.
robertson cJr, Bell BD 1984. Seabird status and con-servation in the new Zealand region. in: croxall JP, evans PgH, Schreiber rw ed. Status and conservation of the world’s seabirds. cambridge, Uk, international council for Bird Preservation technical Publication 2. Pp. 573–586.
Schramm M 1986. Burrow densities and nest site prefer-ences of petrels (Procellariidae) at the Prince edward islands. Polar Biology 6: 63–70.
Scofield RP, Christie D 2002. Beach patrol records indicate a substantial decline in sooty shearwater, Puffinus griseus numbers. notornis 49: 158–165.
Scott DS 2005. Burrow entrance densities of sooty shearwaters and mottled petrels on whenua Hou. Unpublished thesis, University of otago. 64 p.
Scott D, newman J, Fletcher D, Blackwell g, Mckechnie S, Moller H, Bragg c, nevins H 2005. a survey of titi and mottled petrel abundance on Paopuka, taukihepa. Unpublished wildlife Management report no. 801–2. te whare wananaga o otago (University of otago), Dunedin. 20 p.
Scott D, Scofield P, Hunter C, Fletcher D 2008. Decline of sooty shearwaters Puffinus griseus on the Snares, new Zealand. Papers and Proceedings of the royal Society of tasmania. 142: 185–196.
Stokes Dl, Boersma PD 1991. effects of substrate on distribution of magelanic penguins (Sheniscus magellanicus) burrows. auk 108: 923–933.
taylor ga 2000. action plan for seabird conservation in new Zealand. Part B, non-threatened seabirds. wellington, Department of conservation, threat-ened Species occasional Publication 17.
veit r, Mcgowan J, ainley D, wahls t, Pyle P 1997. apex marine predators declines ninety percent in association with changing oceanic climate. global change Biology 3: 23–28.
walsh D, kirkpatrick JB, Skira iJ 1997. vegetation pat-terns, environmental correlates and vegetation change in a Puffinus tenuirostris breeding colony at cape Queen elizabeth, tasmania. australian Journal of Botany 45: 71–79.

new Zealand Journal of Zoology, 2009, vol. 36306
warham J 1960. Some aspects of breeding behaviour in the short-tailed shearwater. emu 60: 75–87.
Warham J 1977. Wing loadings, wing shapes, and flight capabilities of Procellariformes. new Zealand Journal of Zoology 4: 73–83.
warham J 1985. Mottled petrel Pterodroma inexpectata (Forster, 1944). P. 76. in: robertson cJr ed. the reader’s digest complete book of new Zealand birds. Surry Hills, australia, reader’s Digest Services Pty ltd.
warham J 1990. the petrels: their ecology and breeding systems. london, academic Press ltd. 440 p.
warham J, keeley Br, wilson gJ 1977. Breeding of the mottled petrel. auk 94: 1–7.
warham J, wilson gJ 1982. the size of the sooty shearwa-ter population at the Snares islands, new Zealand. notornis 29: 29–30.
West JA 1990. Codfish Island petrel survey: 28 March–9 april 1990. Science and research internal report 85. Department of conservation.