prediction of human activity intensity using the
TRANSCRIPT
Full Terms & Conditions of access and use can be found athttps://www.tandfonline.com/action/journalInformation?journalCode=tgis20
International Journal of Geographical InformationScience
ISSN: (Print) (Online) Journal homepage: https://www.tandfonline.com/loi/tgis20
Prediction of human activity intensity using theinteractions in physical and social spaces throughgraph convolutional networks
Mingxiao Li, Song Gao, Feng Lu, Kang Liu, Hengcai Zhang & Wei Tu
To cite this article: Mingxiao Li, Song Gao, Feng Lu, Kang Liu, Hengcai Zhang & Wei Tu (2021):Prediction of human activity intensity using the interactions in physical and social spaces throughgraph convolutional networks, International Journal of Geographical Information Science, DOI:10.1080/13658816.2021.1912347
To link to this article: https://doi.org/10.1080/13658816.2021.1912347
Published online: 20 Apr 2021.
Submit your article to this journal
View related articles
View Crossmark data

RESEARCH ARTICLE
Prediction of human activity intensity using the interactions in physical and social spaces through graph convolutional networksMingxiao Li a,b,c, Song Gao c, Feng Lub,d,e, Kang Liub,f, Hengcai Zhang b
and Wei Tu a
aGuangdong Key Laboratory of Urban Informatics, Guangdong Laboratory of Artificial Intelligence and Digital Economy (SZ), Shenzhen Key Laboratory of Spatial Information Smart Sensing and Services, and Research Institute of Smart Cities, Shenzhen University, Shenzhen China; bState Key Laboratory of Resources and Environmental Information System, Institute of Geographic Sciences and Natural Resources Research, Chinese Academy of Sciences, Beijing China; cGeospatial Data Science Lab, Department of Geography, University of Wisconsin-Madison, Madison, WI USA; dThe Academy of Digital China, Fuzhou University, Fuzhou China; eJiangsu Center for Collaborative Innovation in Geographical Information Resource Development and Application, Nanjing China; fShenzhen Institute of Advanced Technology, Chinese Academy of Sciences, Shenzhen China
ABSTRACTDynamic human activity intensity information is of great impor-tance in many location-based applications. However, two limita-tions remain in the prediction of human activity intensity. First, it is hard to learn the spatial interaction patterns across scales for pre-dicting human activities. Second, social interaction can help model the activity intensity variation but is rarely considered in the exist-ing literature. To mitigate these limitations, we proposed a novel dynamic activity intensity prediction method with deep learning on graphs using the interactions in both physical and social spaces. In this method, the physical interactions and social interactions between spatial units were integrated into a fused graph convolu-tional network to model multi-type spatial interaction patterns. The future activity intensity variation was predicted by combining the spatial interaction pattern and the temporal pattern of activity intensity series. The method was verified with a country-scale anonymized mobile phone dataset. The results demonstrated that our proposed deep learning method with combining graph con-volutional networks and recurrent neural networks outperformed other baseline approaches. This method enables dynamic human activity intensity prediction from a more spatially and socially inte-grated perspective, which helps improve the performance of mod-eling human dynamics.
ARTICLE HISTORY Received 10 February 2020 Accepted 23 March 2021
KEYWORDS Human activity intensity prediction; graph convolutional networks; social interaction; mobile phone data; human mobility
1. Introduction
Dynamic population distribution, as one of the core indicators showing the pattern of where people live and move, plays an important role in many geographical studies. Capturing the variation of population across space over time has been a fundamental requirement of
CONTACT Song Gao [email protected]; Wei Tu [email protected]
INTERNATIONAL JOURNAL OF GEOGRAPHICAL INFORMATION SCIENCE https://doi.org/10.1080/13658816.2021.1912347
© 2021 Informa UK Limited, trading as Taylor & Francis Group

many advanced location-based services, such as intelligent traffic management, personal recommendation, and emergency evacuation (Small and Cohen 2004, Linard et al. 2012, Deville et al. 2014, Li et al. 2020; Chen et al., 2018a). Example applications include adjusting the load of cell phone towers based on the number of service users, estimation of the air pollution exposure levels for residents, spatiotemporal modeling of infectious disease spread, and early warning of crowd stampedes and crushes (Wang et al. 2019, Li et al. 2019b; Li et al., 2020b; Chen et al., 2018a). Accurate population activity prediction would improve the performance of such applications and benefit many domains (e.g. geography, urban planning, disaster response, traffic engineering, and population health).
With the developments of information and communication technologies (ICT), posi-tioning technologies and ubiquitous digital devices, a huge number of individual-level tracking data have been accumulated for business intelligence and accessible for research use (Gonzalez et al. 2008, Gao 2015, Xu et al. 2016, Yuan and Raubal 2016, Liu et al. 2017, Feng et al. 2019). It has transformed the ways we capture human mobility in multiscale space and place, and then impacted the dynamic population estimate methods (Deville et al. 2014, Yue et al. 2014, Liu et al. 2019, Li et al. 2019a). With the huge amount of tracking data, inferring population distribution by counting human activity intensity has become an important research area (Deville et al. 2014, Wang et al. 2018). Thus, detailed human activity intensity prediction has become a key component in the dynamic population prediction problem. Although the human activity intensity prediction problem has been widely studied (Li et al., 2012; Liang et al. 2016; J. Chen et al., 2018b), there are two limitations remaining. First, human activities are often aggregated to spatial statistical units such as census blocks, census tracts or cell tower catchment areas (Deville et al. 2014, Li et al. 2019a; Gao et al, 2019b). These spatial units have different numbers of adjacent neighbors, which may conflict with the fixed-length input format of some downstream machine learning models. Also, the scale transformation between different units may introduce additional statistical errors. It is hard to learn the spatial patterns of human activity variations comprehensively, especially regarding different distance ranges of spatial interactions (Zhu et al. 2020). Second, the social relationship of people between different spatial units can help explain the human movements, especially periodic beha-viors (Cho et al. 2011, Guo et al. 2015, Shi et al. 2015); and reverse causality may also exist as spatial proximity may facilitate the formation of social and community links (Johnson and Gilles 2003, Crandall et al. 2010, Ratti et al. 2010, Wang et al. 2015). For example, one may make a phone call to book seats in advance before she or he goes to a restaurant or a mother may call her daughter’s school from her workplace before heading to the school. It means that the social interactions, especially the phone call behaviors, may influence human activity intensity variation. Previous research also found that the similarity between two individuals’ movements or mobility characteristics within the communities positively correlates with their proximity in social networks (Wang et al. 2011, Shi et al. 2015). In the past decade of geography and GIScience research, there has been a recent trend of integrating social network connections to the space-time analytical framework and into GISystems (Yu and Shaw 2008, Shaw and Yu 2009, Luo et al. 2011, Andris 2016, Ye et al. 2016). However, as far as we know, most existing prediction models have mainly focused on the movement interactions between spatial units or the periodicity of the activity intensity time series, which ignored the influence of integrated spatial social interactions in the models.
2 M. LI ET AL.

To tackle these limitations, this study proposed a novel human Activity Intensity Prediction method using the Interactions in Physical and Social spaces, called ‘AIP-IPS’ with deep learning methods on graphs, to predict the future activity intensity variation. Considering the characteristics of huge volume, comprehensive stratified population coverage, and high correlation with population distribution (Deville et al. 2014; Chen et al., 2018b, Li et al. 2019a, Kang et al. 2012), the phone call volume in a region at certain time, was selected as the indicator of human activity intensity in this study. The main contributions of this research are summarized as follows:
(1) The spatial statistical units (as nodes) as well as their relationships (as edges) were represented in the form of graphs to overcome the conflict between the hetero-geneous distribution of spatial units and the fixed-length input format of some downstream machine learning models, which can help model the spatial pattern of activity intensity variation more accurately.
(2) The impacts of integrated physical and social interactions on activity intensity estimation were comprehensively considered with a graph fusion technique, which can significantly improve the accuracy and interpretability of dynamic activity intensity prediction.
(3) A human activity intensity prediction model was constructed by utilizing a graph convolutional network (GCN) for modeling the spatial interaction patterns between different spatial units and a long short-term memory neural network (LSTM) for modeling the tendency and periodicity of the temporal pattern of activity intensity series.
(4) The proposed method was evaluated with a large-scale anonymized mobile phone dataset in the country of Senegal, involving the call detail records (CDRs) of one hundred thousand individuals with a period of one year. The results demonstrated that our proposed deep learning method outperformed other baseline approaches.
The remaining parts of this study are organized as follows. Section 2 presents the literature review on dynamic activity intensity mapping and spatial activity intensity prediction. Section 3 provides the mathematical statement of this problem. Section 4 explains the particulars of our proposed human activity intensity prediction method using deep learning techniques, and other baseline methods with performance evaluation metrics. Section 5 presents a case study with experiment analysis and performance comparison. Section 6 discusses broad implications of this work and our vision for future work. Finally, section 7 presents the conclusion of this study.
2. Literature review
2.1. Dynamic human activity intensity mapping
Dynamic human activity intensity mapping has been widely used in fine-grain population estimation. Existing human activity intensity mapping methods can be divided into two categories based on data sources: remote sensing data-based methods, and movement tracking data-based methods. The remote sensing data-based methods present indicators or proxies which are significantly related to the human activity intensity distribution from
INTERNATIONAL JOURNAL OF GEOGRAPHICAL INFORMATION SCIENCE 3
remote sensing images, and can derive the human activity intensity variation by modeling the relationship between the extracted indicators and the underlying population (Zhuo et al. 2009, Levin and Duke 2012, Gao et al. 2019a). Nightlight satellite images and extracted built-up areas are the most widely used indicators (Azar et al., 2013, Yu et al. 2018, Lloyd et al. 2019). For example, Tripathy et al. (2017) used the indicators of night light area and light volume derived from nighttime satellite imagery to estimate human activity intensity distribution through a regression model. Robinson et al. (2017) created high resolution human activity intensity estimations from composite Landsat images with a trained convolutional neural network model. Recently, Xing et al. (2020) proposed an end-to-end deep learning framework (Neighbor-ResNet) to estimate human activity volumes from remote sensing imagery, which is good for regional population and activity intensity estimations. However, limited by the acquisition period of the remote sensing images and the impact of weather factors such as clouds and fog, the human activity intensity variation inferred by these methods are not continuous in a fine-granular temporal resolution (e.g. hourly) and often have the data missing phenomenon.
The increasingly available location-based services provide data support to further improve the accuracy and granularity of dynamic human activity intensity mapping. Emerging techniques to obtain dynamic human activity intensity information mainly rely on GPS-equipped taxi trajectories (Liu et al. 2012, Kang et al. 2013, Wang et al. 2018), smart card data (Ma et al. 2017), and geotagged social media data (Huang & Wong, 2016; Liu and Wang 2015, Hipp et al. 2019, Zhang et al. 2020a). For example, Hipp et al. (2019) used geocoded Twitter data to construct activity intensity variations at different times of a day. Ma et al. (2017) modeled the hourly changes in population at the community level based on the number of people swiping in and out of the subway stations. Whereas, the representativeness problem of these methods leads to the sam-pling bias (Mellon and Prosser 2017).
With the characteristics of wide coverage and fine spatiotemporal scale, mobile phone data has become an advanced data source for mapping human activity intensity and human dynamics as well as land-use inference (Deville et al. 2014, Pei et al. 2014, Jiang et al. 2017, Liu et al. 2018, Sakarovitch et al. 2018). Kang et al. (2012) analyzed the relationships between the population and the phone call intensity Erlang value, the number of calls, and the number of active mobile users using mobile phone CDR data, and found that there is a linear relationship between the number of calls and mobile active users. Douglass et al. (2015) fitted the relationship between CDR data and demo-graphic data with a piecewise log-linear function, and then used the land use data to estimate the urban population distribution through a random forest model. Jiang et al. (2017) demonstrated how the large-scale CDR data can be used to infer population residential distribution and activity-based mobility patterns in Singapore. Alongside the great success from existing works, there are still several issues that need to be addressed, such as the data missing problem and the oscillation distortion problem when using such data (Fiadino et al. 2012, Chen et al. 2019, Li et al. 2019a).
2.2. Spatio-temporal prediction methods
The basic goal of spatio-temporal prediction methods is to learn the mapping relationship from independent variables to dependent variables (Li and Shahabi 2018). It can be
4 M. LI ET AL.

divided into two categories: statistics-based parametric methods and machine learning- based nonparametric methods (Deng et al. 2018). The statistics-based parametric methods are mostly extended from the classic spatial statistical methods. They were constituted by further considering the temporal information on the basis of spatial information, such as the space-time autoregressive integrated moving average methods (STARIMA) (Min and Wynter 2011, Cheng et al. 2014) and the geographical and temporal weighted regression methods (GTWR) (Huang et al. 2010, Ma et al. 2018, Wu et al. 2019), etc. For example, Cheng et al. (2014) introduced a dynamic spatial weight matrix into a localized STARIMA model to capture the heterogeneity and nonstationary of traffic network data; Ma et al. (2018) used the GTWR model to explore the spatio-temporal impact of the built environment on passenger traffic flow. However, the spatio-temporal relationships in the existing parametric methods were usually expressed in a simple functional manner, which was insufficient to describe more complex nonlinear relationships.
With the recent progress in computer sciences, machine learning-based nonparametric methods have become a mainstream in this research area. The popular classical models used in spatio-temporal prediction include the K-nearest neighbor model (Zhang et al. 2013, Cheng et al. 2020), the hidden Markov model (Qi and Ishak 2014, Xu et al. 2015), and the support vector machine model (Feng et al. 2018). To account for the highly non-linear spatio-temporal dependence, deep learning methods offer new promise for spatio- temporal prediction researches (Wu and Tan 2016, Li et al. 2017, Ren et al. 2020, Jin et al. 2020). For example, Zhang et al. (2017) modeled the transportation network as an image and used convolutional neural networks to capture the spatial dependency of the traffic. Zhang et al. (2020b) and Cui et al. (2019) represented the traffic network as graphs and forecasted the short-term traffic conditions with graph convolutional networks to consider the topology of the underlying network. Chai et al. (2018) proposed a multi- graph convolutional neural network model to predict citywide bike-sharing flows at station-level and the model significantly reduced prediction error in their experiments. However, these methods are mostly used in the fields of transportation (Zhang et al. 2019, Cui et al. 2019, Yao et al. 2020), ecology (Yi et al. 2018), and economics (Zhou et al. 2019). Research on dynamic population mapping and human activity intensity prediction are still insufficient. Moreover, how to improve the prediction performance by considering the domain knowledge and integrating interactions in both physical and social spaces is still a problem worth exploring.
2.3. Spatial activity intensity prediction
Since there exists strong spatial regularity and predictability in human movements, previous literatures have attempted to predict the rhythm and variation of spatial activity intensity (Song et al. 2010, Xu et al. 2016, Barbosa et al. 2018). The existing methods can be divided into two categories according to different topics of interest. The first category focuses on the tendency and periodicity of the activity intensity series (Li et al., 2012; Liang et al. 2016; Cheng et al., 2020). For example, Li et al. (2012) discovered the temporal patterns of taxi passengers using an adaptive watershed algorithm from taxi tracking data, and then predicted the activity intensity variation with an improved ARIMA model. Liang et al. (2016) proposed a human activity intensity prediction framework based on an advanced recurrent neural network and a parallel streaming computing technique, which
INTERNATIONAL JOURNAL OF GEOGRAPHICAL INFORMATION SCIENCE 5
was efficient for real-world requirements from activity intensity prediction. However, the fundamental causes of activity intensity variation are human movements and various types of spatial interaction flows between regions (Shaw and Yu 2009, Andris 2016, Zhen et al. 2019). Therefore, it is less effective to model the activity intensity variation with only considering the activity intensity time series.
To deal with the problems abovementioned, researchers started focusing on the movement interactions between spatial units (Zhang et al. 2017; J. Chen et al., 2018b; Crivellari & Beinat, 2019). For example, Crivellari and Beinat (2019) embedded the location into multidimensional vectors from the human movement activities and provided a meaningful way to represent locations. Fan et al. (2015) clustered the individuals with similar movement behaviors by the Markov Chain Monte Carlo method, and then fore-casted future activity intensity variation via a random walk model. Chen et al. (2018b) modeled the flows and spatial correlation of activity intensity using artificial neural net-work to predict the activity intensity variation at a large metropolitan area. Whereas, the influence of integrated spatial social interactions was often ignored in the existing models, and thus the prediction performance of these methods was not completely satisfactory and needed further improvement.
3. Problem statement
The problem of dynamic human activity intensity prediction can be summarized as predicting the future activity intensities of certain spatial units over time. Given a set of spatial units S ¼ U1;U2; . . . ;Un½ � and corresponding activity intensity time sequences ActUi ¼ Ai;1;Ai;2; . . . ;Ai;m
� �, the problem of interest is to predict the value of Ai;mþ1 for
each spatial unit, where Ui indicates the ith spatial unit, and Ai;t indicates the activity intensity of the spatial unit Ui at time t. To solve this problem, the tendency and periodicity of the activity intensity time series and the multi-layer spatial interaction patterns of those spatial units are required to explore, and the most likely activity intensity values are predicted based on prior samples.
4. Methodology
In this section, we presented the particulars of our human activity intensity prediction method using deep learning models, which includes the following three parts. First, we explained how graphs were constructed from physical and social interactions using the mobile phone dataset. Second, we developed an algorithm to integrate the multiple graphs for model training. Third, we introduced the details of constructing prediction models by integrating GCN and LSTM. The flow chart of our prediction method is shown in Figure 1. Finally, the evaluation metrics and other baseline methods for comparison are introduced at the end of this section.
4.1. Graph construction
Extracting complex spatial relationships into the form of graphs is a key step of GCN. The constructed graphs should be able to represent the relationships between the nodes and
6 M. LI ET AL.

be related to the problem of interest. Overall, nodes with stronger connections should be assigned with higher edge weights. In order to quantify the relationships between spatial interaction and human activity intensity, two types of relationships (geographical dis-tance and human movement) are selected to model the interactions in physical space and the phone call behavior is selected to model the interaction in social space.
Based on the idea of Tobler’s first law of geography, the geographical distance affects the similarity of two different places (Tobler 1970, Zhu et al., 2018a). As for the human activity intensity prediction problem, places with shorter geographical distances are more likely to have more similar activity intensity change patterns. Therefore, the geographical distance was used to construct one of the graphs. In this graph, the nodes represent the cell phone towers and the geographical distance between two nodes is taken as edge weight. An illustration of the distance graph is shown as Figure 2 (a), where GD i;jð Þ represents the geographical distance between cell phone tower ci and cj . It is worth noting that the farther stations are linked with higher weights in this graph, which conflicts with the intuitive idea of geographical graph generation. Thus, further processing of the distance graph is needed in the graph transformation step.
The human movements between spatial units can cause activity intensity changes (Zhang et al. 2017, Zhu et al. 2018, Peng et al. 2019). The more movement records between two places mean that the activity intensity changes in these two places are more relevant. Thus, the movement interaction can be a key aspect to predict human activity intensity variation. Following this idea, we construct the movement interaction graph according to their historical human movement records. An illustration of the movement interaction graph is shown in Figure 2 (b), where GM i;jð Þ represents the total number of human movement records between two cell phone towers ci and cj , and a movement is detected when the two adjacent call detail records of one individual linked to different cell phone towers (Gao et al. 2013).
Figure 1. The prediction process of the AIP-IPS model.
INTERNATIONAL JOURNAL OF GEOGRAPHICAL INFORMATION SCIENCE 7

As discussed in the introduction, the social relationship, especially the phone call behavior, can help explain the human movements and have influence on human activity. Like movement interaction, the more social interaction records between two places may indicate that the greater correlation of human activities between these two places (Gao et al. 2013). Therefore, the social interaction graph was constructed based on their historical phone call interaction records. An illustration of the phone call graph is shown in Figure 2 (c), where represents the total number of phone call records between cell phone tower ci and cj, and a phone call interaction is detected when one individual makes a phone call to another individual in this study.
It is worth noting that, considering that the purpose of graph construction is to model the connection strengths between places (Zhu et al. 2020), the edge weights in the movement interaction graph and social interaction graph are the sum of bidirectional values (See more discussions in section 6.2). This procedure helps to make the matrix symmetric (one requirement in the spectral-based GCN models using graph Laplacian, Kipf and Welling (2016)), which is convenient for downstream neural network solutions.
4.2. Graph transformation
As we want to consider the impacts of geographical distance, movement interaction and social interaction on human activity intensity variations comprehensively, there are still
Figure 2. Illustrations of the three types of graphs including (a) distance graph GD, (b) movement graphGM, and (c) phone call graph GS. Each of the graphs was represented as a symmetric matrix.
8 M. LI ET AL.

two problems that need to be dealt with before feeding the graphs into the prediction model. First, the graphs generated from the mobile phone dataset should be transformed into characteristic matrices which fit the input of GCN (Kipf and Welling 2016). Second, since the edge weights between graphs vary widely, each graph should be normalized separately before integration. Therefore, a symmetric normalized Laplacian matrix is adopted to tackle these problems (Defferrard et al. 2016, Geng et al. 2019, Zhu et al. 2020).
To generate the Laplacian matrix, we first transform the constructed graph G into an adjacency matrix A. As the values in generated graphs are continuous variables, which need to be converted into binary variables to represent adjacent or not by setting a threshold. The values that satisfy the threshold in the constructed graph will be converted to 1 and the unsatisfied will be converted to 0 to form the adjacency matrix. Then, the degree matrix D is calculated by adding each column element of the adjacency matrix and putting the summation values on the diagonal (other places are zero). In other words, the degree matrix represents the connectivity weights of each point in the adjacent matrix. Finally, the corresponding symmetric normalized Laplacian matrix can be defined as follows:
L ¼ I � D�12AD�
12 (1)
where L denotes the Laplacian matrix, I denotes the unit matrix, A denotes the adjacency matrix, and D denotes the degree matrix. An illustration of Laplacian matrix generation is shown as Figure 3.
Based on the Laplacian matrix generation result, the geographical distance graph, the movement interaction graph and the social interaction graph are converted into three characteristic matrices with same dimension and same value range. Thus, the character-istic matrix of the fusion graph can be combined by the weighted summation of the three Laplacian matrices at the element level. To keep the weighted summation result
Figure 3. An illustration of the graph transformation process.
INTERNATIONAL JOURNAL OF GEOGRAPHICAL INFORMATION SCIENCE 9

normalized, we define the sum of weights as 1. Therefore, the graph fusion operator can be defined as follows:
F ¼XN
i¼1Wi � Li (2)
XN
i¼1Wi ¼ 1 (3)
where F indicates the fusion graph, N indicates the number of Laplacian matrices, which equals to 3 in this study, Li indicates the ith Laplacian matrix and Wi indicates the corresponding weight.
Noting that the thresholds may play different roles in different graphs. To fit the requirement that nodes with stronger connection intensity should be with higher edge weights, the values in the distance graph which are smaller than the distance threshold are marked as connective. Besides, the values in the movement interaction graph and social interaction graph which are larger than the corresponding thresholds are marked as connective. Moreover, the optimal weighting coefficients assigned for each graph were determined by a grid search approach in the parameter space based on the validation dataset performance with the strategy of lowest root mean square error. Advanced heuristic techniques to determine the weights automatically may further improve the prediction efficiency.
4.3. Prediction model with the GCN and LSTM network
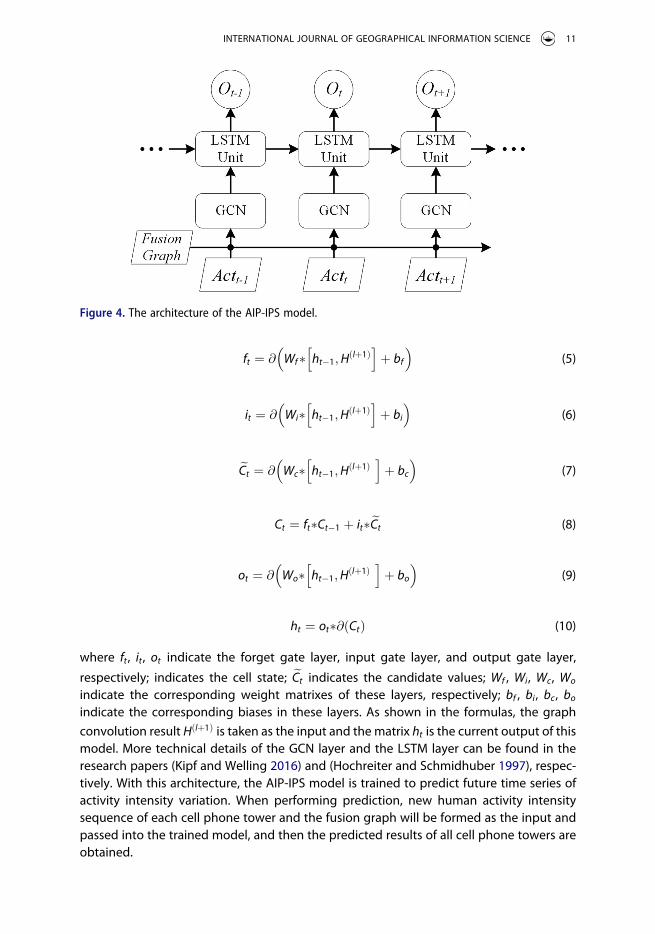
We construct the AIP-IPS model to predict the human activity intensity from both spatial and temporal aspects. It mainly includes two parts: a GCN layer for modeling the multi-type spatial interaction patterns between different units and a LSTM network used as an encoding-decoding framework for modeling the tendency and periodicity of human activity intensity variation. The architecture of the AIP-IPS model is shown in Figure 4.
As shown in Figure 4, the inputs can be summarized into two parts. First, the current human activity intensity distribution (Actt) and the fusion graph (which is described in Section 4.2) are used as inputs to the GCN layer to consider the impact of the interactions in both physical space and social space comprehensively. This procedure can be imple-mented as formula 4:
H lþ1ð Þ ¼ @ F � H lð Þ �W lð Þ� �
(4)
where l indicates the number of convolutions, @ indicates the activation function, F indicates the fusion graph which has been introduced in Section 4.2. H lð Þ indicates the characteristic matrix, which is the historical human activity intensity distribution when l equals to 1. W lð Þ indicates the weight matrix, which is randomly initialized for model training.
Then, the LSTM network was used as the encoding-decoding framework to model the temporal pattern of the human activity intensity variations. This procedure can be implemented as formulas 5–10:
10 M. LI ET AL.
ft ¼ @ Wf� ht� 1;H lþ1ð Þh i
þ bf
� �(5)
it ¼ @ Wi� ht� 1;H lþ1ð Þh i
þ bi
� �(6)
eCt ¼ @ Wc� ht� 1;H lþ1ð Þh i
þ bc
� �(7)
Ct ¼ ft�Ct� 1 þ it�eCt (8)
ot ¼ @ Wo� ht� 1;H lþ1ð Þh i
þ bo
� �(9)
ht ¼ ot�@ Ctð Þ (10)
where ft , it , ot indicate the forget gate layer, input gate layer, and output gate layer,
respectively; indicates the cell state; eCt indicates the candidate values; Wf , Wi, Wc, Wo
indicate the corresponding weight matrixes of these layers, respectively; bf , bi, bc, bo
indicate the corresponding biases in these layers. As shown in the formulas, the graph convolution result H lþ1ð Þ is taken as the input and the matrix ht is the current output of this model. More technical details of the GCN layer and the LSTM layer can be found in the research papers (Kipf and Welling 2016) and (Hochreiter and Schmidhuber 1997), respec-tively. With this architecture, the AIP-IPS model is trained to predict future time series of activity intensity variation. When performing prediction, new human activity intensity sequence of each cell phone tower and the fusion graph will be formed as the input and passed into the trained model, and then the predicted results of all cell phone towers are obtained.
Figure 4. The architecture of the AIP-IPS model.
INTERNATIONAL JOURNAL OF GEOGRAPHICAL INFORMATION SCIENCE 11

4.4. Performance evaluation
4.4.1. Evaluation metricsWe used the metrics of root mean square error (RMSE) and mean absolute error (MAE) to evaluate the performance of the proposed activity intensity prediction model.
Given the human activity intensity distribution of all the cell phone towers at time t Actt ¼ Ac1;t ;Ac2;t ; . . . ;Acn;t and the corresponding predicted human activity intensity distribution Act0t ¼ A0c1;t
; A0c2;t; . . . ;A0cn;t
, the two metrics are defined as follows:
RMSE ¼
ffiffiffiffiffiffiffiffiffiffiffiffiffiffiffiffiffiffiffiffiffiffiffiffiffiffiffiffiffiffiffiffiffiffiffiffiffiffiffiffiffiffiffiffiffiffiffiffiffiffiPN
i¼1PT
t¼1 A0ci;t� Aci;t
� �2
N � T
vuut
(11)
MAE ¼
PNi¼1PT
t¼1 A0ci;t� Aci;t
���
���
N � T(12)
where the Aci;t indicates the activity intensity at cell phone tower ci at time t, N represents the total number of the cell phone towers involved in the processing, and T represents the total number of time slots that need to be predicted.
4.4.2. BaselinesTo demonstrate the superiority of our proposed AIP-IPS method compared with other prediction models for human activity intensity prediction, the following methods were selected as baselines:
● ARIMA: The autoregressive integrated moving average is a popular time series analysis method which can predict future time series values by learning the effects of the lagged value, error term combination, and non-stationarity (Li et al., 2012).
● KNN: The k-nearest neighbors model finds the k closest training samples and out-puts the average value or the weighted average value of the k closest neighbors as the predicted result (Smith et al. 2002).
● GBDT: The gradient boosting decision tree, also known as multiple additive regres-sion tree, is an iterative decision tree generation algorithm consisting of multiple decision trees as weak learners. The results of all trees are added up to make the final decision (Friedman 2001).
● LSTM: The LSTM is an advanced recurrent neural network architecture. It is well- suited to making predictions based on time series data and has been widely adopted in recent studies such as traffic flow prediction (Huang et al. 2019, Ren et al. 2020).
● AIP-PM: The original GCN-based model on physical movement interaction only is the foundation of our proposed method. The movement graph introduced in section 4.1 was used to learn the spatial interaction. A similar architecture was also used for short-term traffic prediction (Zhao et al. 2019).
● AIP-PGM: To measure the influence of different interaction expressions on the prediction performance, a gravity-based interaction intensity expression was also used as the edge weight of graph to construct the prediction model AIP-PGM. Different from using the bi-directional movement summation as the edge weight in our proposed method, the edge weight in AIP-PGM was defined as M i;jð Þ�M j;ið Þ
Popi�Popj, where
12 M. LI ET AL.

M i;jð Þ and M j;ið Þ represented the total number of human movement records from place i to place j and from place j to place i in the study period, respectively; and Popi
and Popj represented the number of mobile phone users of place i and place j, respectively. Other network settings were similar with AIP-PM.
● ASTGCN: The attention-based spatiotemporal GCN model utilizes a spatial-temporal attention mechanism to learn the dynamic spatial-temporal correlations in data, and employs graph convolutions to capture the spatial interaction patterns and common standard convolutions to describe the temporal features (Guo et al. 2019).
The features extracted for model training of the baseline models were classified into three categories. For the ARIMA model, the entire human activity time sequence in training dataset was formatted as the features to learn the periodicity and tendency of the overall time series. As for the KNN, GBDT, and LSTM models, the human activity time sequence was split into fixed length subsequences (with a subsequence length of six) and the corresponding activity intensity values in the subsequences were organized as features for training (except for the last dimension used as outcome label). In terms of the AIP-PM, AIP-PGM, and ASTGCN models, the feature organizations were similar to our proposed AIP-IPS method that was introduced above. For all models, the parameters were tuned with a grid search method based on the validation dataset performance, and the performance on the testing dataset was reported in Section 5.3.
5. Case Study
5.1. Data and processing
The anonymized mobile phone call detail records (CDRs) used in this study was provided by a major telecommunications carrier covering over 9 million users in Senegal and was accessed through the ‘Data for Development’ Senegal challenge (De Montjoye et al. 2014). The mobile phone data was collected for a year in 2013. In order to improve the data performance, the users having less than 25% days with interactions per given period and having an average of more than 1000 interactions per week were marked as noise/outlier and removed from the dataset. After the data cleaning, two types of mobile phone datasets were provided: a tower-to-tower call frequency data for all cell phone towers on an hourly basis of the whole population, and a tower level call detail record data at the individual level of 10% sampled users. For privacy concerns, all personal information was removed before the telecommunication carrier provided the data. Examples of the two data struc-tures are shown in Tables 1 and 2 and the map of the study area is shown in Figure 5.
Corresponding to the two mobile phone datasets, two types of human activity intensity data were generated in the data processing step to evaluate the perfor-mance of our proposed method. For the first one, we aggregated the hourly tower-to- tower call frequency to each tower to represent the human activity intensity variation of the whole population (abbreviated as Whole-data). For the second one, the individual call detail records were aggregated to each tower at an hourly time interval to represent the activity intensity variation of sampled users (abbreviated as Sample- data). The two datasets showed a high coefficient of correlation (with a value of 0.784) but with differences in detail, which helps evaluate the prediction performance
INTERNATIONAL JOURNAL OF GEOGRAPHICAL INFORMATION SCIENCE 13

comprehensively. In order to split the data into training and testing sets, the last 10% days’ data of each dataset were chosen as test data and the others were chosen as training data. All the methods were coded in the Python programming language. The experiments were performed on a server with six Intel(R) Xeon(R) Gold 6140 CPU Processors clocked at 2.30 GHz, one NVIDIA Tesla P100 GPU computing processor and 372 GB main memory, running on the Ubuntu operating system. The parameters used in this case study are shown in Table 3, which were tuned with a grid search method in the parameter space based on the validation dataset performance with the strategy of lowest root mean square error (Chai et al. 2018).
Table 1. An example of tower-to-tower call frequency data.Date Time (t) Outflow_TowerID Inflow_TowerID Call number
01–01 00:00 2 3 1401–01 01:00 2 5 22. . . . . . . . . . . .12–31 23:00 1659 1653 2
Table 2. An example of an individual’s call detail record data.Individual ID Date Time (t) TowerID Longitude (x) Latitude (y)
5842***** 01–07 10:30 385 −17.35** 14.75**5842***** 01–07 12:19 313 −17.40** 14.75**5842***** . . . . . . . . . . . .5842***** 01–13 21:40 386 −17.36** 14.75**
Figure 5. Map of the study area.
14 M. LI ET AL.

5.2. Verification of spatial interaction fusion technique
As previously mentioned, we applied a graph convolutional neural network fusion tech-nique to model the impact of interactions in physical and social spaces on human activity intensity. To verify its effectiveness, we evaluated the performance by comparing four strategies: (1) model with considering all above aspects (abbreviated as AIP-IPS), (2) model with geographical distance only (abbreviated as AIP-PD), (3) model with movement interaction only (abbreviated as AIP-PM), and (4) model with social interaction only (abbreviated as AIP-S).
Figure 6 showed the comparison results of graph fusion technique verification. It could be seen that the AIP-IPS model had the best performance on both two datasets using two evaluation metrics, which indicated that the graph fusion technique significantly improved prediction performance and robustness. Moreover, as the impact of movement interaction was widely used in human activity intensity prediction and showed the best performance in three single graph convolution models, we chose the AIP-PM model as one of the baselines to further demonstrate the superiority of our method.
5.3. Comparison with existing prediction methods
The detailed experimental result is shown in Table 4. The RMSE/MAE values of our proposed AIP-IPS method were 413.62/189.88 and 30.93/17.11 for the Whole-Data and the Sample-Data, respectively, which were lower than those for the other baseline methods. We found that the deep learning-based methods, such as AIP-IPS, AIP-PM, AIP- PGM, ASTGCN and LSTM, outperform others, which was possibly due to the fact that the deep learning models perform better in modeling the non-linear and comprehensive
Table 3. Parameters used in this case study.Parameter Value Parameter Value
Distance threshold 30,000 Distance graph weight 0.3Movement threshold 20 Movement graph weight 0.1Social threshold 20 Social graph weight 0.6LSTM layers 1 Time sequence length 6GCN layers 1 Num of hidden units 64Graph convolution kernel size 1 Time step 6
Figure 6. Verification of the Graph fusion technique using (a) RMSE and (b) MAE.
INTERNATIONAL JOURNAL OF GEOGRAPHICAL INFORMATION SCIENCE 15

spatiotemporal relationships. The performance of AIP-PM and AIP-PGM were roughly similar, which indicated the different interaction intensity expression didn’t cause a huge change on the prediction performance. Considering the prediction errors do not conform to a normal distribution, the nonparametric K-S test (Smirnov 1948) was applied to test whether the improvement on accuracy is significant. The results were shown in Table 5. It shows that all the compared pairs have larger K-S statistics than the expected values under null hypothesis and with very small p-values, which indicates that the predicted errors of AIP-IPS are significantly different from those of the others. Moreover, the ARIMA method shows a bad performance in this case. It mainly because the ARIMA method learns the temporal patterns from the entire training dataset and generates the entire test sequences at a time, which introduces more uncertainty for the prediction result. Therefore, the ARIMA method won’t be included in the following sensitivity test experiments.
To further evaluate the sensitivity of our proposed method, we analyzed the prediction errors with different population sizes and activity intensity entropy. As the RMSE is more sensitive to outliers and is widely used in prediction tasks, it is selected as the evaluation metric in the following analysis. Figure 7 shows the maps of the AIP-IPS model prediction error (RMSE) in each cell for the whole population dataset and the aforementioned sampled dataset (in Section 5.1), respectively.
The prediction errors with different population sizes are quite different. To evaluate the prediction errors under different population sizes, we grouped all the cell phone towers into four classes regarding their population size using the quartile method (as we only concern about the grouping result, the population size can be simplified as average human activity intensity here.). The results are shown in Figure 8. It could be seen that there was an increase in the prediction error of the six methods with an increase in the population size. It was expected because a larger population size led to more complex
Table 4. A performance comparison with the baselines.
Category Method
Whole-data Sample-data
RMSE MAE RMSE MAE
Deep Learning AIP-IPS 413.62 189.88 30.93 17.11AIP-PM 482.22 215.27 34.36 18.32AIP-PGM 488.41 219.68 33.01 17.87ASTGCN 518.56 251.02 37.79 20.56LSTM 522.10 271.19 39.24 19.57
Classical Machine Learning KNN 536.71 192.80 50.62 19.18GBDT 538.51 203.71 49.12 19.10
Time series ARIMA 1529.88 823.03 120.21 67.53
Table 5. The K-S test results for prediction performance comparison.
Compared pairs
Whole-data Sample-data
K-S statistics p-value K-S statistics p-value
AIP-IPS & AIP-PM 0.2009 p < 0.0001 0.0327 p < 0.0001AIP-IPS & AIP-PGM 0.2640 p < 0.0001 0.0122 p < 0.0001AIP-IPS & ASTGCN 0.1944 p < 0.0001 0.4764 p < 0.0001AIP-IPS & LSTM 0.3052 p < 0.0001 0.0505 p < 0.0001AIP-IPS & KNN 0.1454 p < 0.0001 0.0500 p < 0.0001AIP-IPS & GBDT 0.1820 p < 0.0001 0.0319 p < 0.0001AIP-IPS & ARIMA 0.2749 p < 0.0001 0.5036 p < 0.0001
16 M. LI ET AL.

population interactions and higher prediction difficulty. It should be noted that although our proposed method got the best performance at each group and in each dataset, the predicted performance differences in the micro population size were small. It indicated that the classical machine learning methods could get acceptable prediction perfor-mances in places with small population sizes. Moreover, the movement interaction and social interaction showed high correlation with population distribution. The Pearson product-moment correlation coefficients (Pearson 1894) between population size and movement interaction size, and between population size and social interaction size were 0.97 and 0.94, respectively. Therefore, the comparison results were also applicable to comparing the prediction error variations of different social interaction size and move-ment interaction size.
In addition, the information entropy can be used as an effective index to evaluate the stability and complexity of a time series (Song et al. 2010, Li et al. 2020). We defined the activity intensity entropy as follows to evaluate the heterogeneity of activity intensity variation:
Figure 7. The maps of the AIP-IPS model prediction error (RMSE) in each cell (a) for the whole dataset and (b) for the sampled dataset.
Figure 8. The effect of population size on the RMSE (a) for the whole dataset, and (b) for the sampled dataset.
INTERNATIONAL JOURNAL OF GEOGRAPHICAL INFORMATION SCIENCE 17

Enti ¼ �Xn
j¼1p jð Þlog2p jð Þ (13)
where Enti indicates the entropy of activity intensity variation of cell phone tower ci, p jð Þindicates the probability that the activity intensity within the jth group, and n indicates the number of groups that the activity intensity variation can be divided. To calculate p jð Þ, the value range of the activity intensity series is divided into several groups based on a predefined threshold. Then, the frequency of those values associated with each group j, freq jð Þ, and the length of the activity intensity series of cell phone tower ci, len ið Þ, are calculated. Thus, the
probability p jð Þ equals to freq jð Þlen ið Þ . In this study, the division thresholds were selected as 10 for
the sampled dataset and 100 for the whole dataset, respectively. It is worth noting that the entropy absolute values themselves had less meaning, and what made more sense were their comparison. Therefore, the division threshold was decided by the size and variation pattern of data we used. The activity intensity entropy not only revealed the heterogeneity of the activity intensity variation patterns, but also revealed its regularity and repeatability. A larger entropy value indicated that the activity intensity had a more complex variation pattern. In this study, we divided cell phone towers into three classes using thresholds of Ent values of 4.19 and 5.30 for the sampled dataset and 4.33 and 5.71 for the whole dataset, corresponding to the cumulative distribution values of 60% and 90% in the activity intensity entropy statistical distribution of each dataset, respectively. The results are shown in Figure 9. In general, all the methods showed good performance when the population entropy was small. With the increase of the entropy value, the RMSE values of the AIP-IPS method increased from 174.12 to 840.19 on the whole dataset and from 9.62 to 38.29 on the sampled dataset. Nevertheless, our method still showed the lowest mean prediction error for each class of population entropy values.
6. Discussion
6.1. The effect of social ties on human movements
Studies on the intersection of social networks and human movements are exciting topics in the research on human mobility and movement data science (Cho et al. 2011, Andris 2016, Dodge et al. 2020). Several fundamental hypotheses, such as that social connection
Figure 9. The effect of activity intensity entropy on the RMSE (a) for the whole dataset and (b) for the sampled dataset.
18 M. LI ET AL.
strength between different spatial units can help explain the human movement patterns, have previously been studied (Guo et al. 2015, Shi et al. 2015, Zhou et al. 2018). In this study, the social interaction based on phone calls, was used as one of the indicators for modelling the variation of the human activity intensity. The results demonstrated that the consideration of social interaction was effective to improve the prediction performance. This study was an attempt to quantitatively study the impact of social connections on human activity intensity prediction. More related researches using other types of social connection data (e.g. Facebook users’ friendship network) have also been investigated in recent studies on COVID-19 human behavior responses (Charoenwong et al. 2020, Holtz et al. 2020). With the increasing development of social network applications and the popularity of mobile phone devices, more and more activities that once had to be completed in the physical space were associated with social network interactions, such as online shopping, food delivery, and video chat. The exploration of these social activities that include both geographical locations and social ties would provide an important insight for understanding human behavior more comprehensively.
6.2. The usage of symmetric matrices for interaction measurement
Extracting complex spatial relationships into the form of graphs is a key step of GCN. The constructed graphs should be able to represent the relationships between the nodes and be related to the problem of interest. In this study, two types of interaction relationships, the movement interaction in physical space and the phone call interaction in social space were selected as indicators and the interaction strength between two places was mea-sured by the sum of bidirectional interaction values. The following descriptions further explain the rationale behind our use of these interaction measurements.
From the methodology perspective, the spectral-based graph convolution network, which was used in our purposed method, requires a symmetric matrix (based on graph Laplacian) as the model input. Therefore, we used the sum of bidirectional values to represent the connection strengths to meet the Laplacian matrix requirement. This expression indicated that the more interaction records between two places, the more relevant the changes in the activity intensity of these two places. It is worth noting that our intent was not directly using the bidirectional flow traffic between two places as features nor as outcome labels. A similar undirected spatial interaction representation approach has also been used in recent graph-based neural network researches such as Zhu et al. (2020) and Chai et al. (2018). Furthermore, a prediction method AIP-PGM, which uses a gravity-based interaction expression as the edge weight, was used as one of the baselines to understand the effect of interaction expression on human activity intensity prediction. The results indicate that the proposed method with two types of interaction expressions have similar performance and outperformed other baselines. It shows the validity of using undirected connection strength to quantify the spatial interactions in our problem of interest. Other kinds of undirected movement interaction modeling approaches (e.g. gravity model) have also been used in other domains such as in economy growth estimation (Li et al., 2020a; Oberhofer and Pfaffermayr 2018) and population migration (Ramos and Suriñach 2017).
From the empirical observation perspective, an asymmetry test is applied to the origin- to-destination (OD) physical interaction matrix in this study. The indicator Asy is defined as
INTERNATIONAL JOURNAL OF GEOGRAPHICAL INFORMATION SCIENCE 19

the volume from placeA to placeB divided by the volume from placeB to placeA. The statistical result of the average value is 1.18, the median value is 1.0, and the standard deviation is 0.92. The results showed that the overall asymmetry is distributed around the value 1 and the distribution is relatively concentrated in our dataset.
Finally, the main focus of this work is to demonstrate the importance of integrating deep learning models with multiple types of interactions (e.g. mobility and social con-nectiveness) on improving the performance of predicting human activity intensity. An existing research (Liu et al. 2012) showed that the temporal variation of human activity in each cell can reveal the traffic source-sink areas. In this work, the temporal periodicity and variation of human activity intensities was modeled by the LSTM model, which implicitly characterized this aspect. The fused graph-based model (capturing connection strength between places) and LSTM model (capturing temporal periodicity and variability of human activity intensity) together in the proposed approach already well served our purpose. We consider that using an asymmetrical directed graph along with spatial graph convolutional models (Zhang et al. 2019), attention-based models (Veličković et al. 2017, Monti et al. 2018), and redefined Laplacians (Ma et al. 2019), may further improve the prediction performance, which will be explored in our future work.
6.3. Limitations and future work
In addition to the abovementioned usage of symmetric matrices for interaction measure-ment, several other limitations of this work should be noted and further explored in future work. First, in the current AIP-IPS method, we only use the number of phone calls to quantify the social interaction. Dependent upon data availability, more social interaction indices, such as the call duration, can be used to evaluate whether the performance is stable or can be improved. Second, the graph fusion technique applied in the proposed AIP-IPS method was at the element level. That is to say, the characteristic matrix of a fusion graph was the weighted summation of three single graphs. In such a way, the complex network structure is ignored to some degree. How to merge the characteristics intelligently at a network level would be another important research direction. Third, the weighting coefficients assigned for each graph were determined by a grid search in the parameter space. Advanced heuristic techniques to determine the optimal weights automatically may improve the prediction efficiency. Fourth, the proposed AIP-IPS method only considered the interaction characteristics and spatial distribution of the cell phone towers, which ignored the impact of contexts. Considering the environmental and semantic contexts such as points of interest distribution (Yuan et al. 2014) and road density (Kotavaara et al. 2011) can be an extension of the human activity intensity prediction methods. Last but not least, how to overcome the sampling bias for inferring the dynamic distribution of whole population from the distribu-tion of human activity intensity is another scientific problem worth solving. Our future work will explore these issues.
7. Conclusions
This study has proposed a novel human activity intensity prediction method using the interactions in physical and social spaces, called AIP-IPS, to predict the future activity intensity distribution in a country. In this method, we present the spatial units and their
20 M. LI ET AL.

interactions in the form of graphs to overcome the conflict between the heterogeneous distribution of these units and the regular input format of downstream machine learning models. We develop a deep learning-based graph fusion technique to consider the impact of interactions in both physical and social spaces on activity intensity distribution compre-hensively with the aim of improving the accuracy and stability of human activity intensity prediction. Based on the prior techniques, we construct the activity intensity prediction model with integrating GCN and LSTM neural networks to model the spatiotemporal characteristics of activity intensity variation. By evaluating the prediction results with several baseline methods using a large-scale anonymized mobile phone dataset with hourly temporal resolution and at the spatial resolution of cell tower coverage in Senegal, the superiority of our proposed method was demonstrated. The case study results indicated that our proposed AIP-IPS method was preferable among those competing spatiotemporal prediction methods regarding both prediction error and stability.
By using the graph convolutional neural network model to simultaneously considering the impacts of the interactions in both physical and social spaces, our proposed method presents an effective human activity intensity prediction method in a fine spatiotemporal scale. The method allows us to more accurately predict future time series of activity intensity variation across the space, which is of great importance in many location based-services such as intelligent transportation and emergency evacuation. Moreover, the fine-scale activity intensity variation information may help reveal the underlying characteristics of human mobility patterns, thus providing support for other social science researches and practices. This study also contributes to the emerging trend of GeoAI research in the GIScience communities (Janowicz et al. 2020).
Acknowledgments
Feng Lu acknowledges support from the National Key Research and Development Program (No. 2016YFB0502104). Mingxiao Li acknowledges support from the Guangdong Province Basic and Applied Basic Research Fund Project (No. 2020A1515111166) and a grant from State Key Laboratory of Resources and Environmental Information System. Hengcai Zhang acknowledges support from the National Natural Science Foundation of China (No. 41771436). Kang Liu acknowledges support from National Natural Science Foundation of China (No. 41901391) and Shenzhen Basic Research Program (No. JCYJ20190807163001783). Wei Tu acknowledges support from National Natural Science Foundation of China (No. 42071360). Song Gao acknowledges support from the National Science Foundation of United States (No. 1940091) and the Wisconsin Alumni Research Foundation. Any opinions, findings, and conclusions or recommendations expressed in this material are those of the authors and do not necessarily reflect the views of the funders.
Disclosure statement
No potential conflict of interest was reported by the author(s).
Data and codes availability statement
The data and codes that used in this research are available in figshare.com with the unique identifier at the link https://doi.org/10.6084/m9.figshare.11829306.v1. The data were packaged using the pickle package in Python. It included five parts: the human activity intensity array with a dimension of [8760,1614] and four kinds of interaction array with a dimension of [1614,1614],
INTERNATIONAL JOURNAL OF GEOGRAPHICAL INFORMATION SCIENCE 21

where 8760 indicates the length of human activity intensity series and 1614 indicates the number of cell phone towers. Since we signed a confidentiality agreement, we multiplied all the values by a random number from 0 to 1 to ensure that the original data were not revealed but could be used to demonstrate our method. The codes included our proposed AIP-IPS method and the founda-tion single-layer models of our proposed method. Our codes were based on Urban Computing Toolbox developed by Di Chai (https://uctb.github.io/UCTB/). The graph fusion technique was revised in the basic code to enable our model to consider the impact of integrated physical and social interactions on human activity intensity comprehensively.
Funding
This work was supported by the National Key Research and Development Program [2016YFB0502104]; National Natural Science Foundation of China [41771436,41901391,42071360]; National Science Foundation [1940091]; Shenzhen Basic Research Program [JCYJ20190807163001783]; Guangdong Province Basic and Applied Basic Research Fund Project [2020A1515111166]; Wisconsin Alumni Research Foundation.
Notes on contributors
Mingxiao Li is a Postdoctoral Researcher at Shenzhen University. He received his Ph.D degree from the Institute of Geographic Sciences and Natural Resources Research, Chinese Academy of Sciences. His research interests focus on urban computing and spatiotemporal data mining.
Song Gao is an Assistant Professor in GIScience at the Department of Geography, University of Wisconsin-Madison. He holds a Ph.D. in Geography at the University of California Santa Barbara. His main research interests include Place-Based GIS, Geospatial Data Science, Human Mobility and Social Sensing.
Feng Lu is a Professor with the Institute of Geographic Sciences and Natural Resources Research, Chinese Academy of Sciences. His research interests cover trajectory data mining, computational transportation science and location-based services.
Kang Liu is currently an Associate Professor in the Shenzhen Institute of Advanced Technology, Chinese Academy of Sciences. She obtained her Ph.D. degree in Geographic Information Science (GIS) from the State Key Laboratory of Resource and Environmental Information Systems (LREIS), Institute of Geographic Sciences and Natural Resources Research (IGSNRR), Chinese Academy of Sciences (CAS) in 2018. Her research interests mainly focus on geographic big data and urban computing.
Hengcai Zhang is currently the Associate Professor at the Institute of Geographical Sciences and Natural Resources Research, Chinese Academy of Sciences. He received his Ph.D. degree from the Institute of Geographical Sciences and Natural Resources Research, Chinese Academy of Sciences in 2013. His research interest mainly focuses on moving objects database, urban computing and spatial-temporal data mining.
Wei Tu is currently an Associate Professor in the department of urban spatial information engineer-ing, Shenzhen University. His research interests include automatics recognition of human activity- mobility from multi-source urban data, trajectory modeling, and analysis and optimization.
ORCID
Mingxiao Li http://orcid.org/0000-0003-0779-4432Song Gao http://orcid.org/0000-0003-4359-6302Hengcai Zhang http://orcid.org/0000-0002-5004-9609Wei Tu http://orcid.org/0000-0002-0255-4037
22 M. LI ET AL.

References
Andris, C., 2016. Integrating social network data into GISystems. International Journal of Geographical Information Science, 30 (10), 2009–2031.
Azar, D., et al., 2013. Generation of fine-scale population layers using multi-resolution satellite imagery and geospatial data. Remote Sensing of Environment, 130, 219–232. doi:10.1016/j. rse.2012.11.022
Barbosa, H., et al., 2018. Human mobility: models and applications. Physics Reports, 734, 1–74.Chai, D., Wang, L., and Yang, Q. (2018). Bike flow prediction with multi-graph convolutional
networks. In Proceedings of the 26th ACM SIGSPATIAL international conference on advances in geographic information systems, 397–400, Washington, DC.
Charoenwong, B., Kwan, A., and Pursiainen, V., 2020. Social connections to COVID-19-affected areas increase compliance with mobility restrictions. Science Advances, 6 (47), eabc3054. doi:10.1126/ sciadv.abc3054
Chen, B., et al., 2018a. Real-time estimation of population exposure to PM2. 5 using Mobile-and station-based big data. International Journal of Environmental Research and Public Health, 15 (4), 573. doi:10.3390/ijerph15040573
Chen, G., et al., 2019. Complete trajectory reconstruction from sparse mobile phone data. EPJ Data Science, 8 (1), 30. doi:10.1140/epjds/s13688-019-0206-8
Chen, J., et al., 2018b. Fine-grained prediction of urban population using mobile phone location data. International Journal of Geographical Information Science, 32 (9), 1770–1786. doi:10.1080/ 13658816.2018.1460753
Cheng, S., Lu, F., and Peng, P., 2020. Short-term traffic forecasting by mining the non-stationarity of spatiotemporal patterns. IEEE Transactions on Intelligent Transportation Systems, 1–19. doi:10.1109/TITS.2020.2991781
Cheng, T., et al., 2014. A dynamic spatial weight matrix and localized space–time autoregressive integrated moving average for network modeling. Geographical Analysis, 46 (1), 75–97. doi:10.1111/gean.12026
Cho, E., Myers, S.A., and Leskovec, J. (2011). Friendship and mobility: user movement in location-based social networks. In Proceedings of the 17th ACM SIGKDD international conference on Knowledge discovery and data mining (pp. 1082–1090). San Diego, CA: ACM.
Crandall, D.J., et al., 2010. Inferring social ties from geographic coincidences. Proceedings of the National Academy of Sciences, 107 (52), 22436–22441. doi:10.1073/pnas.1006155107
Crivellari, A., and Beinat, E., 2019. From motion activity to geo-embeddings: Generating and exploring vector representations of locations, traces and visitors through large-scale mobility data. ISPRS International Journal of Geo-Information, 8 (3), 134.
Cui, Z., et al., 2019. High-order graph convolutional recurrent neural network: a deep learning framework for network-scale traffic learning and forecasting. IEEE Transactions on Intelligent Transportation Systems, PP(99), 1–12.
De Montjoye, Y.A., et al. (2014). D4D-Senegal: the second mobile phone data for development challenge arXiv preprint. arXiv:1407.4885.
Defferrard, M., Bresson, X., and Vandergheynst, P., 2016. Convolutional neural networks on graphs with fast localized spectral filtering. In: 30th Conference on Neural Information Processing Systems (NIPS 2016), Barcelona, Spain. 3844–3852.
Deng, M., et al., 2018. Heterogeneous space–time artificial neural networks for space–time series prediction. Transactions in GIS, 22 (1), 183–201. doi:10.1111/tgis.12302
Deville, P., et al., 2014. Dynamic population mapping using mobile phone data. Proceedings of the National Academy of Sciences, 111 (45), 15888–15893. doi:10.1073/pnas.1408439111
Dodge, S., et al., 2020. Progress in computational movement analysis–towards movement data science. International Journal of Geographical Information Science, 34 (12), 2395–2400. doi:10.1080/13658816.2020.1784425
Douglass, R.W., et al., 2015. High resolution population estimates from telecommunications data. EPJ Data Science, 4 (1), 4. doi:10.1140/epjds/s13688-015-0040-6
INTERNATIONAL JOURNAL OF GEOGRAPHICAL INFORMATION SCIENCE 23

Fan, Z., et al., 2015. Citymomentum: an online approach for crowd behavior prediction at a citywide level. In Proceedings of the 2015 ACM International Joint Conference on Pervasive and Ubiquitous Computing, 559–569.
Feng, M., et al., 2019. Relative space-based GIS data model to analyze the group dynamics of moving objects. ISPRS Journal of Photogrammetry and Remote Sensing, 153, 74–95. doi:10.1016/j. isprsjprs.2019.05.002
Feng, X., et al., 2018. Adaptive multi-kernel SVM with spatial–temporal correlation for short-term traffic flow prediction. IEEE Transactions on Intelligent Transportation Systems, 20 (6), 2001–2013. doi:10.1109/TITS.2018.2854913
Fiadino, P., et al., 2012. Steps towards the Extraction of Vehicular Mobility Patterns from 3G Signaling Data. In: A. Pescapè, L. Salgarelli, X. Dimitropoulos, eds. Traffic Monitoring and Analysis. TMA 2012. Lecture Notes in Computer Science, vol 7189. Berlin, Heidelberg: Springer. https://doi.org/10.1007/ 978-3-642-28534-9_7 , .
Friedman, J.H., 2001. Greedy function approximation: a gradient boosting machine. Annals of Statistics, 29 (5), 1189–1232.
Gao, N., et al., 2019a. Can more accurate night-time remote sensing data simulate a more detailed population distribution? Sustainability, 11 (16), 4488. doi:10.3390/su11164488
Gao, S., et al., 2013. Discovering spatial interaction communities from mobile phone data. Transactions in GIS, 17 (3), 463–481. doi:10.1111/tgis.12042
Gao, S., 2015. Spatio-temporal analytics for exploring human mobility patterns and urban dynamics in the mobile age. Spatial Cognition and Computation, 15 (2), 86–114. doi:10.1080/ 13875868.2014.984300
Gao, S., et al., 2019b. Predicting the spatiotemporal legality of on-street parking using open data and machine learning. Annals of GIS, 25 (4), 299–312. doi:10.1080/19475683.2019.1679882
Geng, X., et al. (2019). Spatiotemporal multi-graph convolution network for ride-hailing demand forecasting. In 2019 AAAI Conference on Artificial Intelligence (AAAI’19), Honolulu, HI.
Gonzalez, M.C., Hidalgo, C.A., and Barabasi, A.L., 2008. Understanding individual human mobility patterns. Nature, 453 (7196), 779–782. doi:10.1038/nature06958
Guo, B., et al., 2015. Mobile crowd sensing and computing: the review of an emerging human-powered sensing paradigm. ACM Computing Surveys (CSUR), 48 (1), 7. doi:10.1145/ 2794400
Guo, S., et al. (2019). Attention based spatial-temporal graph convolutional networks for traffic flow forecasting. In Proceedings of the AAAI Conference on Artificial Intelligence, Honolulu, HI, 33, 922–929.
Hipp, J.R., et al., 2019. Using social media to measure temporal ambient population: does it help explain local crime rates? Justice Quarterly, 36 (4), 718–748. doi:10.1080/07418825.2018.1445276
Hochreiter, S. and Schmidhuber, J., 1997. Long short-term memory. Neural Computation, 9 (8), 1735–1780. doi:10.1162/neco.1997.9.8.1735
Holtz, D., et al., 2020. Interdependence and the Cost of Uncoordinated Responses to COVID-19. Proceedings of the National Academy of Sciences, 117 (33), 19837–19843. doi:10.1073/ pnas.2009522117
Huang, B., Wu, B., and Barry, M., 2010. Geographically and temporally weighted regression for modeling spatio-temporal variation in house prices. International Journal of Geographical Information Science, 24 (3), 383–401. doi:10.1080/13658810802672469
Huang, H., et al. (2019). Predicting urban rail traffic passenger flow based on LSTM. In 2019 IEEE 3rd Information Technology, Networking, Electronic and Automation Control Conference, Chengdu, China: IEEE, 616–620.
Huang, Q. and Wong, D.W., 2016. Activity patterns, socioeconomic status and urban spatial struc-ture: what can social media data tell us? International Journal of Geographical Information Science, 30 (9), 1873–1898. doi:10.1080/13658816.2016.1145225
Janowicz, K., et al., 2020. GeoAI: spatially explicit artificial intelligence techniques for geographic knowledge discovery and beyond. International Journal of Geographical Information Science, 34 (4), 625–636. doi:10.1080/13658816.2019.1684500
24 M. LI ET AL.

Jiang, S., Ferreira, J., and Gonzalez, M.C., 2017. Activity-based human mobility patterns inferred from mobile phone data: a case study of Singapore. IEEE Transactions on Big Data, 3 (2), 208–219. doi:10.1109/TBDATA.2016.2631141
Jin, G., et al., 2020. Urban ride-hailing demand prediction with multiple spatio-temporal information fusion network. Transportation Research Part C Emerging Technologies, 117, 102665. doi:10.1016/j. trc.2020.102665
Johnson, C. and Gilles, R.P., 2003. Spatial Social Networks. In: B. Dutta, M. O. Jackson, eds. Networks and Groups. Studies in Economic Design. Berlin, Heidelberg: Springer. https://doi.org/10.1007/978- 3-540-24790-6_4 .
Kang, C., et al., 2012. Towards estimating urban population distributions from mobile call data. Journal of Urban Technology, 19 (4), 3–21. doi:10.1080/10630732.2012.715479
Kang, C., et al. (2013). Exploring human movements in Singapore: a comparative analysis based on mobile phone and taxicab usages. In Proceedings of the 2nd ACM SIGKDD international work-shop on urban computing (p. 1). New York, NY: ACM.
Kipf, T.N. and Welling, M., 2016. Semi-supervised classification with graph convolutional networks. arXiv Preprint. arXiv:1609.02907.
Kotavaara, O., Antikainen, H., and Rusanen, J., 2011. Population change and accessibility by road and rail networks: GIS and statistical approach to Finland 1970–2007. Journal of Transport Geography, 19 (4), 926–935. doi:10.1016/j.jtrangeo.2010.10.013
Levin, N. and Duke, Y., 2012. High spatial resolution night-time light images for demographic and socio-economic studies. Remote Sensing of Environment, 119, 1–10. doi:10.1016/j.rse.2011.12.005
Li, B., et al., 2020a. Estimation of regional economic development indicator from transportation network analytics. Scientific Reports, 10 (1), 1–15. doi:10.1038/s41598-019-56847-4
Li, M., et al., 2019a. Reconstruction of human movement trajectories from large-scale low-frequency mobile phone data. Computers, Environment and Urban Systems, 77, 101346. doi:10.1016/j. compenvurbsys.2019.101346
Li, M., et al., 2019b. Dynamic estimation of individual exposure levels to air pollution using trajectories reconstructed from mobile phone data. International Journal of Environmental Research and Public Health, 16 (22), 4522. doi:10.3390/ijerph16224522
Li, M., luet al., 2020. Predicting future locations of moving objects with deep fuzzy-LSTM networks. Transportmetrica A: Transport Science, 16(1), 119–136.
Li, M., Shi, X., and Li, X., 2020b. Integration of spatialization and individualization: the future of epidemic modelling for communicable diseases. Annals of GIS, 26 (3), 219–226.
Li, X., et al., 2012. Prediction of urban human mobility using large-scale taxi traces and its applications. Frontiers of Computer Science, 6 (1), 111–121.
Li, Y., et al. (2017). Diffusion convolutional recurrent neural network: data-driven traffic forecasting. arXiv preprint arXiv:1802.07007.
Li, Y. and Shahabi, C., 2018. A brief overview of machine learning methods for short-term traffic forecasting and future directions. SIGSPATIAL Special, 10 (1), 3–9. doi:10.1145/3231541.3231544
Liang, V.C., et al. (2016). Mercury: metro density prediction with recurrent neural network on streaming CDR data. In 2016 IEEE 32nd International Conference on Data Engineering (ICDE) (pp. 1374–1377). Helsinki, Finland: IEEE.
Linard, C., et al., 2012. Population distribution, settlement patterns and accessibility across Africa in 2010. PloS One, 7 (2), e31743. doi:10.1371/journal.pone.0031743
Liu, K., et al., 2017. Road2vec: measuring traffic interactions in urban road system from massive travel routes. ISPRS International Journal of Geo-Information, 6 (11), 321. doi:10.3390/ ijgi6110321
Liu, K., Gao, S., and Lu, F., 2019. Identifying spatial interaction patterns of vehicle movements on urban road networks by topic modelling. Computers, Environment and Urban Systems, 74, 50–61. doi:10.1016/j.compenvurbsys.2018.12.001
Liu, X. and Wang, J., 2015. The geography of Weibo. Environment & Planning A, 47 (6), 1231–1234. doi:10.1177/0308518X15594912
INTERNATIONAL JOURNAL OF GEOGRAPHICAL INFORMATION SCIENCE 25

Liu, Y., et al., 2012. Urban land uses and traffic ‘source-sink areas’: evidence from GPS-enabled taxi data in Shanghai. Landscape and Urban Planning, 106 (1), 73–87. doi:10.1016/j. landurbplan.2012.02.012
Liu, Z., et al., 2018. Mapping hourly dynamics of urban population using trajectories reconstructed from mobile phone records. Transactions in GIS, 22 (2), 494–513. doi:10.1111/tgis.12323
Lloyd, C.T., et al., 2019. Global spatio-temporally harmonised datasets for producing high-resolution gridded population distribution datasets. Big Earth Data, 3 (2), 108-139.
Luo, W., et al. (2011). Spatial-social network visualization for exploratory data analysis. In Proceedings of the 3rd ACM SIGSPATIAL International Workshop on Location-Based Social Networks, Chicago, USA, 65–68.
Ma, X., et al., 2018. A geographically and temporally weighted regression model to explore the spatiotemporal influence of built environment on transit ridership. Computers, Environment and Urban Systems, 70, 113–124. doi:10.1016/j.compenvurbsys.2018.03.001
Ma, Y., et al., 2017. Modeling the hourly distribution of population at a high spatiotemporal resolution using subway smart card data: a case study in the central area of Beijing. ISPRS International Journal of Geo-Information, 6 (5), 128. doi:10.3390/ijgi6050128
Ma, Y., et al. (2019). Spectral-based graph convolutional network for directed graphs. arXiv preprint arXiv:1907.08990.
Mellon, J. and Prosser, C., 2017. Twitter and Facebook are not representative of the general population: political attitudes and demographics of British social media users. Research & Politics, 4 (3), 2053168017720008. doi:10.1177/2053168017720008
Min, W. and Wynter, L., 2011. Real-time road traffic prediction with spatio-temporal correlations. Transportation Research Part C: Emerging Technologies, 19 (4), 606–616. doi:10.1016/j. trc.2010.10.002
Monti, F., Otness, K., and Bronstein, M.M., 2018. Motifnet: a motif-based graph convolutional network for directed graphs. In: 2018 IEEE Data Science Workshop (DSW). IEEE, Lausanne, Switzerland, 225–228.
Oberhofer, H. and Pfaffermayr, M. (2018). Estimating the trade and welfare effects of Brexit: a panel data structural gravity model. CESifo Working Paper Series No. 6828, Available at SSRN: https:// ssrn.com/abstract=3129951
Pearson, K., 1894. Contributions to the mathematical theory of evolution. Philosophical Transactions of the Royal Society of London. A, 185, 71–110.
Pei, T., et al., 2014. A new insight into land use classification based on aggregated mobile phone data. International Journal of Geographical Information Science, 28 (9), 1988–2007. doi:10.1080/ 13658816.2014.913794
Peng, H., et al., 2019. Uncovering patterns of ties among regions within metropolitan areas using data from mobile phones and online mass media. GeoJournal, 84 (3), 685–701. doi:10.1007/ s10708-018-9885-0
Qi, Y. and Ishak, S., 2014. A Hidden Markov Model for short term prediction of traffic conditions on freeways. Transportation Research Part C. Emerging Technologies, 43, 95–111. doi:10.1016/j. trc.2014.02.007
Ramos, R. and Suriñach, J., 2017. A gravity model of migration between the ENC and the EU. Tijdschrift Voor Economische En Sociale Geografie (Journal of Economic and Human Geography), 108 (1), 21–35. doi:10.1111/tesg.12195
Ratti, C., et al., 2010. Redrawing the map of Great Britain from a network of human interactions. PloS One, 5, 12. doi:10.1371/journal.pone.0014248
Ren, Y., et al., 2020. A hybrid integrated deep learning model for the prediction of citywide spatio-temporal flow volumes. International Journal of Geographical Information Science, 34 (4), 802–823. doi:10.1080/13658816.2019.1652303
Robinson, C., Hohman, F., and Dilkina, B. (2017). A deep learning approach for population estimation from satellite imagery. Proceedings of the Proceedings of the 1st ACM SIGSPATIAL Workshop on Geospatial Humanities, Redondo Beach, CA, 47–54.
Sakarovitch, B., et al., 2018. Estimating the Residential Population from Mobile Phone Data, an Initial Exploration. Economie et Statistique, 505 (1), 109–132.
26 M. LI ET AL.
Shaw, S.L. and Yu, H., 2009. A GIS-based time-geographic approach of studying individual activities and interactions in a hybrid physical–virtual space. Journal of Transport Geography, 17 (2), 141–149. doi:10.1016/j.jtrangeo.2008.11.012
Shi, L., et al., 2015. Human mobility patterns in different communities: a mobile phone data-based social network approach. Annals of GIS, 21 (1), 15–26. doi:10.1080/19475683.2014.992372
Small, C. and Cohen, J., 2004. Continental physiography, climate, and the global distribution of human population. Current Anthropology, 45 (2), 269–277. doi:10.1086/382255
Smirnov, N., 1948. Table for estimating the goodness of fit of empirical distributions. The Annals of Mathematical Statistics, 19 (2), 279–281. doi:10.1214/aoms/1177730256
Smith, B.L., Williams, B.M., and Oswald, R.K., 2002. Comparison of parametric and nonparametric models for traffic flow forecasting. Transportation Research Part C: Emerging Technologies, 10 (4), 303–321. doi:10.1016/S0968-090X(02)00009-8
Song, C., et al., 2010. Limits of predictability in human mobility. Science, 327 (5968), 1018–1021. doi:10.1126/science.1177170
Tobler, W.R., 1970. A computer movie simulating urban growth in the Detroit region. In: Economic geography, 46(sup1). San Diego, CA, 234–240.
Tripathy, B.R., et al. 2017. Estimation of urban population dynamics using DMSP-OLS night-time lights time series sensors data. IEEE Sensors Journal, 17 (4), 1013–1020. doi:10.1109/ JSEN.2016.2640181
Veličković, P., et al. (2017). Graph attention networks. arXiv preprint arXiv:1710.10903.Wang, D., et al. (2011). Human mobility, social ties, and link prediction. In Proceedings of the 17th
ACM SIGKDD international conference on Knowledge discovery and data mining, San Diego, CA, 1100–1108.
Wang, H., et al., 2019. Early warning of burst passenger flow in public transportation system. Transportation Research Part C: Emerging Technologies, 105, 580–598. doi:10.1016/j.trc.2019.05.022
Wang, H., Liu, F., and Tang, J., 2018. Exploring intra-urban travel mobility using large-scale taxi global positioning system trajectories. International Journal of Vehicle Structures & Systems (IJVSS), 10 (2), 150–159.
Wang, Y., et al., 2015. Linked Activity Spaces: Embedding Social Networks in Urban Space. In: M. Helbich, J. Jokar Arsanjani, M. Leitner, eds. Computational Approaches for Urban Environments. Geotechnologies and the Environment, vol 13. Cham: Springer. doi:10.1007/978-3-319-11469-9_13.
Wu, C., et al., 2019. Multiscale geographically and temporally weighted regression: exploring the spatiotemporal determinants of housing prices. International Journal of Geographical Information Science, 33 (3), 489–511. doi:10.1080/13658816.2018.1545158
Wu, Y. and Tan, H. (2016). Short-term traffic flow forecasting with spatial-temporal correlation in a hybrid deep learning framework. arXiv preprint arXiv:1612.01022.
Xing, X., et al., 2020. Mapping human activity volumes through remote sensing imagery. IEEE Journal of Selected Topics in Applied Earth Observations and Remote Sensing, 13, 5652–5668. doi:10.1109/ JSTARS.2020.3023730
Xu, J., et al., 2015. Mining the situation: spatiotemporal traffic prediction with big data. IEEE Journal of Selected Topics in Signal Processing, 9 (4), 702–715. doi:10.1109/JSTSP.2015.2389196
Xu, Y., et al., 2016. Estimating potential demand of bicycle trips from mobile phone data—an anchor-point based approach. ISPRS International Journal of Geo-Information, 5 (8), 131. doi:10.3390/ijgi5080131
Yao, X., et al., 2020. Spatial origin-destination flow imputation using graph convolutional networks. IEEE Transactions on Intelligent Transportation Systems, 1–11.
Ye, X., Huang, Q., and Li, W., 2016. Integrating big social data, computing and modeling for spatial social science. Cartography and Geographic Information Science, 43 (5), 377–378. doi:10.1080/ 15230406.2016.1212302
Yi, X., et al. (2018). Deep distributed fusion network for air quality prediction. In Proceedings of the 24th ACM SIGKDD International Conference on Knowledge Discovery & Data Mining, London, UK, 965–973.
INTERNATIONAL JOURNAL OF GEOGRAPHICAL INFORMATION SCIENCE 27

Yu, H. and Shaw, S.L., 2008. Exploring potential human activities in physical and virtual spaces: a spatio-temporal GIS approach. International Journal of Geographical Information Science, 22 (4), 409–430. doi:10.1080/13658810701427569
Yu, S., Zhang, Z., and Liu, F., 2018. Monitoring population evolution in China using time-series DMSP/OLS nightlight imagery. Remote Sensing, 10 (2), 194. doi:10.3390/rs10020194
Yuan, N.J., et al., 2014. Discovering urban functional zones using latent activity trajectories. IEEE Transactions on Knowledge and Data Engineering, 27 (3), 712–725. doi:10.1109/ TKDE.2014.2345405
Yuan, Y. and Raubal, M., 2016. Analyzing the distribution of human activity space from mobile phone usage: an individual and urban-oriented study. International Journal of Geographical Information Science, 30 (8), 1594–1621. doi:10.1080/13658816.2016.1143555
Yue, Y., lan, et al., 2014. Zooming into individuals to understand the collective: a review of trajectory-based travel behaviour studies. Travel Behaviour and Society, 1, 69–78. doi:10.1016/j. tbs.2013.12.002
Zhang, F., zuet al., 2020a. Uncovering inconspicuous places using social media check-ins and street view images. Computers, Environment and Urban Systems, 81, 101478. doi:10.1016/j. compenvurbsys.2020.101478
Zhang, J., Zheng, Y., and Qi, D. (2017). Deep spatio-temporal residual networks for citywide crowd flows prediction. In Thirty-First AAAI Conference on Artificial Intelligence, San Francisco, CA, 1655–1661.
Zhang, L., et al., 2013. An improved k-nearest neighbor model for short-term traffic flow prediction. Procedia-Social and Behavioral Sciences, 96, 653–662. doi:10.1016/j.sbspro.2013.08.076
Zhang, Y., chen,et al., 2020b. A novel residual graph convolution deep learning model for short-term network-based traffic forecasting. International Journal of Geographical Information Science, 34 (5), 969–995. doi:10.1080/13658816.2019.1697879
Zhang, Y., Cheng, T., and Ren, Y., 2019. A graph deep learning method for short-term traffic forecasting on large road networks. Computer-Aided Civil and Infrastructure Engineering, 34 (10), 877–896. doi:10.1111/mice.12450
Zhao, L., et al., 2019. T-GCN: a temporal graph convolutional network for traffic prediction. IEEE Transactions on Intelligent Transportation Systems, 21 (9), 3848–3858.
Zhen, F., et al., 2019. Analyzing urban development patterns based on the flow analysis method. Cities, 86, 178–197. doi:10.1016/j.cities.2018.09.015
Zhou, J., Pei, H., and Wu, H., 2018. Early Warning of Human Crowds Based on Query Data from Baidu Maps: Analysis Based on Shanghai Stampede. In: Z. Shen, M. Li, eds. Big Data Support of Urban Planning and Management. Advances in Geographic Information Science. Cham: Springer. doi:10.1007/978-3-319-51929-6_2
Zhou, X., Tong, W., and Li, D., 2019. Modeling housing rent in the Atlanta metropolitan area using textual information and deep learning. ISPRS International Journal of Geo-Information, 8 (8), 349. doi:10.3390/ijgi8080349
Zhu, A.X., et al., 2018a. Spatial prediction based on Third Law of Geography. Annals of GIS, 24 (4), 225–240. doi:10.1080/19475683.2018.1534890
Zhu, D., et al., 2018. Inferring spatial interaction patterns from sequential snapshots of spatial distributions. International Journal of Geographical Information Science, 32 (4), 783–805. doi:10.1080/13658816.2017.1413192
Zhu, D., et al., 2020. Understanding place characteristics in geographic contexts through graph convolutional neural networks. Annals of the American Association of Geographers, 110 (2), 408–420. doi:10.1080/24694452.2019.1694403
Zhuo, L., et al., 2009. Modelling the population density of China at the pixel level based on DMSP/ OLS non-radiance-calibrated night-time light images. International Journal of Remote Sensing, 30 (4), 1003–1018. doi:10.1080/01431160802430693
28 M. LI ET AL.