prediction of inhibitory activity of epidermal growth...
TRANSCRIPT

Prediction of Inhibitory Activity of Epidermal GrowthFactor Receptor Inhibitors Using Grid Search-ProjectionPursuit Regression MethodHongying Du1,2, Zhide Hu3, Andrea Bazzoli1, Yang Zhang1*
1 Center for Computational Medicine and Bioinformatics, University of Michigan, Ann Arbor, Michigan, United States of America, 2 Department of Public Health, Lanzhou
University, Lanzhou, China, 3 Department of Chemistry, Lanzhou University, Lanzhou, China
Abstract
The epidermal growth factor receptor (EGFR) protein tyrosine kinase (PTK) is an important protein target for anti-tumor drugdiscovery. To identify potential EGFR inhibitors, we conducted a quantitative structure–activity relationship (QSAR) study onthe inhibitory activity of a series of quinazoline derivatives against EGFR tyrosine kinase. Two 2D-QSAR models weredeveloped based on the best multi-linear regression (BMLR) and grid-search assisted projection pursuit regression (GS-PPR)methods. The results demonstrate that the inhibitory activity of quinazoline derivatives is strongly correlated with theirpolarizability, activation energy, mass distribution, connectivity, and branching information. Although the presentinvestigation focused on EGFR, the approach provides a general avenue in the structure-based drug development ofdifferent protein receptor inhibitors.
Citation: Du H, Hu Z, Bazzoli A, Zhang Y (2011) Prediction of Inhibitory Activity of Epidermal Growth Factor Receptor Inhibitors Using Grid Search-ProjectionPursuit Regression Method. PLoS ONE 6(7): e22367. doi:10.1371/journal.pone.0022367
Editor: Ying Xu, University of Georgia, United States of America
Received January 31, 2011; Accepted June 27, 2011; Published July 21, 2011
Copyright: � 2011 Du et al. This is an open-access article distributed under the terms of the Creative Commons Attribution License, which permits unrestricteduse, distribution, and reproduction in any medium, provided the original author and source are credited.
Funding: Funding was provided by the Alfred P. Sloan Foundation (http://www.sloan.org/), a NSF Career Award (DBI 1027394; http://www.nsf.gov), and theNational Institute of General Medical Sciences (GM083107, GM084222; http://www.nigms.nih.gov/). The funders had no role in study design, data collection andanalysis, decision to publish, or preparation of the manuscript.
Competing Interests: The authors have declared that no competing interests exist.
* E-mail: [email protected]
Introduction
The epidermal growth factor receptor (EGFR) is a transmem-
brane glycoprotein belonging to the human epidermal receptor
(HER) family [1]. It is a type I tyrosine kinase receptor which plays a
vital role in signal transduction pathways, regulating key cellular
functions such as cell proliferation, survival, adhesion, migration,
and differentiation [2–4]. The binding of a ligand to EGFR induces
conformational changes within the receptor which increase its
intrinsic catalytic activity of a tyrosine kinase and result in
autophosphorylation, which is necessary for biological activity
[5–7]. Mutations that lead to EGFR overexpression or overactivity
have been associated with a variety of human tumors, including
lung, bladder, colon, brain, and neck tumors [8–11]. Therefore,
inhibitors of EGFR — inhibiting EGFR’s kinase activity by
competing with its cognate ligands — may potentially constitute a
new class of effective drugs in clinical use or cancer therapy [12–14].
There are presently two main classes of EGFR inhibitors that
can be used in cancer therapy. Both classes — the quinazoline
derivatives [15–17] and the pyrimidin derivatives [18–20] —
consist of ATP-competitive small molecules. To discover new
effective EGFR inhibitors, investigators usually need to synthesize
many compounds and test their corresponding activities by cell-
based biological assay experiments, which is usually time-
consuming and manpower expensive [21,22]. Consequently, it is
of practical interest to develop reliable tools to predict biological
activities before synthesis.
Quantitative structure–activity relationship (QSAR) is the most
popular theoretical method for modeling a compound’s biological
activity from its chemical structure [23–28]. Using this approach,
scientists could predict the activities of series of newly designed
drugs before making the final decision on whether or not to
synthesize and assay them. The prediction is based on the
structural descriptors of the molecular features that most account
for the variations in biological activity. Furthermore, this method
also can identify and describe the most important structural
features of the compounds which are relevant to the variations in
molecular properties, thus, it also gains an insight into the
structural factors which affect the molecular properties. QSAR
models of EGFR inhibitors have been recently investigated with
encouraging results [29–33]. However, it is still vital to find faster
and more reliable methods to assess the capability of EGFR
inhibitors.
The exceedingly high dimension of the space of descriptors is a
major problem in developing QSAR models. For this reason,
increasing attention in the past several years has been devoted to
QSAR models developed by projection pursuit regression (PPR)
[34,35]. This is a general statistical technique that seeks the
‘‘interesting’’ projections of data from high-dimensional to lower-
dimensional space, with the purpose of extracting the intrinsic
structural information hidden in the high-dimensional data [36].
In the current investigation, two QSAR models were construct-
ed from a set of known quinazoline-derivative EGFR inhibitors
using multi-linear and non-linear regression approaches. The
stability and accuracy of the regression models were assessed
through an independent test set of EGFR inhibitors and a 5-fold
cross validation approach. The study sheds light on the structure–
activity relationship of this class of EGFR inhibitors and has the
PLoS ONE | www.plosone.org 1 July 2011 | Volume 6 | Issue 7 | e22367
potential prediction ability to identify new EGFR inhibitors. In
addition, the explored structural features of the chemicals
described here may facilitate the design of further new inhibitors
with high pIC50 activities without any biological assay. Since the
prediction relies exclusively on structural descriptors, the approach
is expected to be of general use in drug design and discovery
research.
Materials and Methods
Data setThe present investigation considered 128 quinazoline deriva-
tives with known anti-cancer EGFR inhibitory activities
[20,30,37–41]. The structures and activities of these compounds
are listed in Table S1. The activities are expressed as pIC50
( = 2log (IC50)) values, where IC50 (nM) represents the concen-
tration of these compounds that produces 50% inhibition of the
kinase activity of EGFR. Our aim was to exploit these known
experimental activities to develop a QSAR model that would
predict, based on selected chemo-physical molecular descriptors,
the EGFR inhibitory activity of potential hits from the virtual
screening of a compound library. To this purpose, the set of
known EGFR inhibitors was randomly divided into two subsets: a
training set of 103 compounds and a test set of 25 compounds
(marked by asterisks in Table S1). The training set served to
construct the QSAR models, while the test set was used for the
model validation.
Generation of the molecular descriptorsTwo-dimensional structures of the compounds were drawn by
using ISIS Draw 2.3 [42]. All the structures were fed into
HyperChem 7.0 [43] and pre-optimized with the MM+molecular-mechanics force field. The structures were then
minimized in energy with the more precise semi-empirical AM1
method in MOPAC. After these steps, the DRAGON 5.4 [44] and
CODESSA [45] programs were used to calculate the molecular
descriptors from the structures, including 0D, 1D, 2D, and 3D
descriptors from DRAGON [46], and constitutional, topological,
geometrical, electrostatic, and quantum-chemical descriptors from
CODESSA. 0D descriptors contain constitutional descriptors; 1D
descriptors include functional-group counts and atom-centered
fragments; 2D descriptors contain topological descriptors, con-
nectivity indices, information indices, and eigenvalue-based
indices; 3D descriptors represent some novel exclusive DRAGON
descriptors and geometrical descriptors. There remained a total of
982 molecular descriptors after eliminating the constant and the
highly-correlated descriptors. Then the generated descriptors were
used to construct the regression models to predict the activities of
the compounds. In order to clarify the whole procedure, its
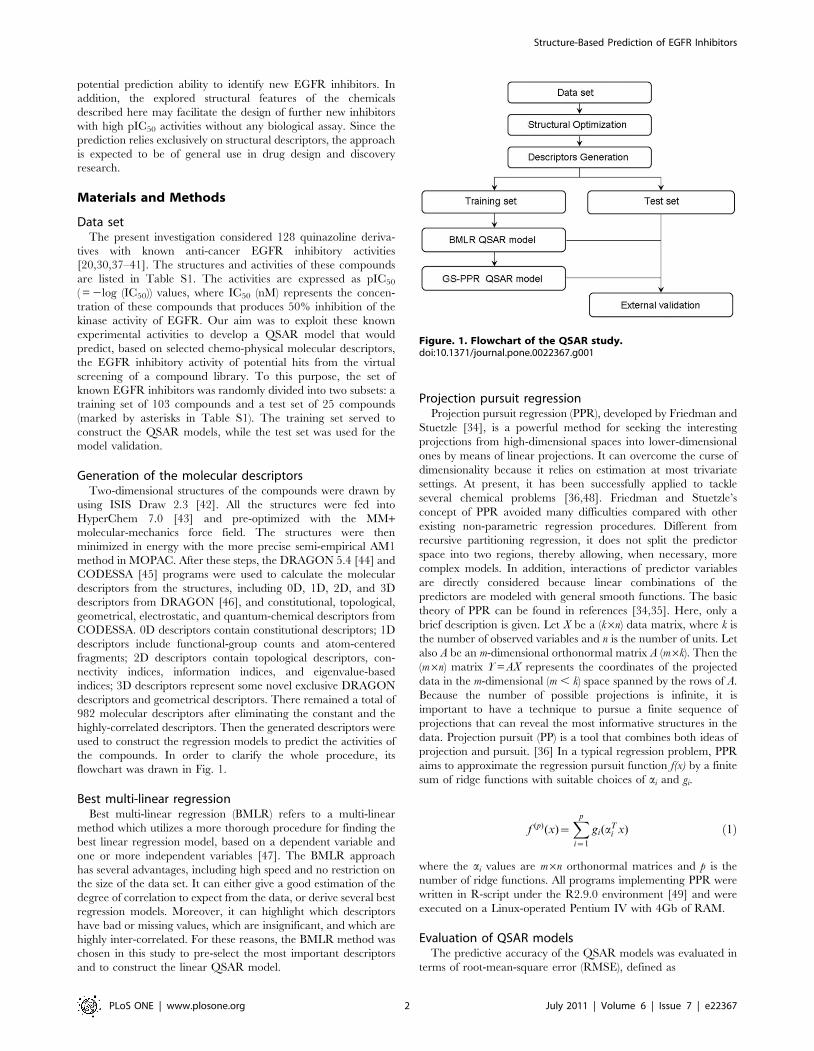
flowchart was drawn in Fig. 1.
Best multi-linear regressionBest multi-linear regression (BMLR) refers to a multi-linear
method which utilizes a more thorough procedure for finding the
best linear regression model, based on a dependent variable and
one or more independent variables [47]. The BMLR approach
has several advantages, including high speed and no restriction on
the size of the data set. It can either give a good estimation of the
degree of correlation to expect from the data, or derive several best
regression models. Moreover, it can highlight which descriptors
have bad or missing values, which are insignificant, and which are
highly inter-correlated. For these reasons, the BMLR method was
chosen in this study to pre-select the most important descriptors
and to construct the linear QSAR model.
Projection pursuit regressionProjection pursuit regression (PPR), developed by Friedman and
Stuetzle [34], is a powerful method for seeking the interesting
projections from high-dimensional spaces into lower-dimensional
ones by means of linear projections. It can overcome the curse of
dimensionality because it relies on estimation at most trivariate
settings. At present, it has been successfully applied to tackle
several chemical problems [36,48]. Friedman and Stuetzle’s
concept of PPR avoided many difficulties compared with other
existing non-parametric regression procedures. Different from
recursive partitioning regression, it does not split the predictor
space into two regions, thereby allowing, when necessary, more
complex models. In addition, interactions of predictor variables
are directly considered because linear combinations of the
predictors are modeled with general smooth functions. The basic
theory of PPR can be found in references [34,35]. Here, only a
brief description is given. Let X be a (k6n) data matrix, where k is
the number of observed variables and n is the number of units. Let
also A be an m-dimensional orthonormal matrix A (m6k). Then the
(m6n) matrix Y = AX represents the coordinates of the projected
data in the m-dimensional (m , k) space spanned by the rows of A.
Because the number of possible projections is infinite, it is
important to have a technique to pursue a finite sequence of
projections that can reveal the most informative structures in the
data. Projection pursuit (PP) is a tool that combines both ideas of
projection and pursuit. [36] In a typical regression problem, PPR
aims to approximate the regression pursuit function f(x) by a finite
sum of ridge functions with suitable choices of ai and gi.
f (p)(x)~Xp
i~1
gi(aTi x) ð1Þ
where the ai values are m6n orthonormal matrices and p is the
number of ridge functions. All programs implementing PPR were
written in R-script under the R2.9.0 environment [49] and were
executed on a Linux-operated Pentium IV with 4Gb of RAM.
Evaluation of QSAR modelsThe predictive accuracy of the QSAR models was evaluated in
terms of root-mean-square error (RMSE), defined as
Figure. 1. Flowchart of the QSAR study.doi:10.1371/journal.pone.0022367.g001
Structure-Based Prediction of EGFR Inhibitors
PLoS ONE | www.plosone.org 2 July 2011 | Volume 6 | Issue 7 | e22367

RMSE~
ffiffiffiffiffiffiffiffiffiffiffiffiffiffiffiffiffiffiffiffiffiffiffiffiffiffiffiffiffiffiffiffiffiffiffiXns
i~1(yie{yip)2
ns
sð2Þ
where ns is the number of known EGFR inhibitory compounds,
and yie and yip are, respectively, the experimental and predicted
EGFR inhibitory activities for the ith compound.
Results and Discussion
Best multi-linear regression modelThe best multi-linear regression (BMLR) method was utilized to
develop a multi-linear QSAR model and select the most relevant
molecular descriptors based on the training set. A variety set of
descriptors have been tested for the selection of descriptors in
different linear regression models. To avoid model ‘‘over-
parameterization’’, an increase of the squared Pearson correlation
coefficient (R2) by less than 0.02 was chosen as the breakpoint
criterion. Fig. 2 shows the number of descriptors versus the values of
R2, the leave-one-out (LOO) cross-validation (RCV2), and Fisher’s
F-test. It can be seen that nine descriptors are sufficient to optimize
the regression model of the pIC50 of EGFR inhibitors. The
optimum model is:
pIC50~{183:56z4:501MEERCH{143:52PMIC
{22:246(R4Uz)z2:569HATS3uz11:265SIC1
{3:621HATS5u{1072:7ANRICz25:826LP1
{1:161EEig09d
N~103,R2~0:7835,R2CV~0:7335,S2~0:3087,F~37:39
8>>>>>>>><>>>>>>>>:
ð3Þ
where N is the number of compounds in the training set, R2 is the
squared Pearson correlation coefficient, RCV2 is the squared cross-
validation correlation coefficient, S2 is the squared standard
deviation, and F is the Fisher F-test function. There are nine
molecular descriptors selected. Three were calculated from
CODESSA: MEERCH (Min e-e repulsion for a C-H bond),
PMIC (Principal moment of inertia C), and ANRIC (Avg nucleoph.
react. index for a C atom); the other five descriptors were obtained
from DRAGON: R4U+, HATS3u, SIC1, HATS5u, LP1, and
EEig09d.
The descriptor MEERCH is a quantum mechanical energy-
related descriptor, used to characterize the total energy of the
molecule at different energy scales and intramolecular energy
distribution using different partitioning schemes. It is calculated as
follows:
Eee(CH)~P
m,n[C
Pl,s[H
PmvPlsSmvjlsT ð4Þ
where Pmv and Pls are the density matrix elements and SmvjlsTare the electron repulsion integrals on the atomic basis fmvlsg.This descriptor refers to the electron repulsion-driven process in
the molecule and can be related to the conformational (rotational,
inversional) changes or atomic reactivity in the molecule [50]. The
descriptor PMIC is a geometrical descriptor which related with
their 3D-coordinates information of the atoms in the molecule. It
is equal toP
i
miriz2, where mi is the mass of the ith atom and riz
denotes the distance of the ith atomic nucleus from the main
rotational z-axis of the molecule [51]. As an expression of the
principal moment of inertia, this descriptor characterizes the
distribution of mass in the molecule. The descriptor ANRIC is a
quantum chemical descriptor of the average value of the atom C
nucleophilic (NA) Fukui reactivity indices [52] for carbon in the
molecule, which are defined as follows:
NA~Xi[A
CiHOMO2=(1{eHOMO) ð5Þ
where, CiCHOMO denotes the ith AO coefficient for the highest
occupied molecular orbital (HOMO), and eHOMO is the energy of
these orbitals. The reactivity indices estimate the relative reactivity
of carbon in the molecule for the given series of compounds and
are related to the activation energy of the corresponding chemical
reaction. The descriptor R4U+, which belongs to the GETAWAY
(GEometry, Topology and Atom-Weights AssemblY) descriptors,
is the R maximal autocorrelation coefficient of lag 4/unweighted
and R autocorrelation coefficient of lag 5/unweighted, respec-
tively. The R and R+ descriptors are analogously obtained from
the leverage/geometry matrix [53]. The descriptors HATS3u and
HATS5u are GETAWAY descriptors defined by the leverage-
weighted autocorrelation of lag 3 and lag5/unweighted, respec-
tively. They take into account 3D molecular geometry by using the
leverage values as atom weights [53]. The descriptor SIC1 is one of
the information indices of the molecule, the name standing for
Structural Information Content index (neighborhood symmetry of
1-order). It is defined by the application of information theory to
the chemical and bonding neighborhood of the atoms in the
molecule [54]; thus it might reflect molecular polarity and
polarizability. LP1 is the Lovasz–Pelikan index or leading eigen
value, and is a topological descriptor. It has been suggested as an
index of molecular branching, the smallest values corresponding to
chin graphs and the highest to the most branched graphs. In
equation (3) the LP1 contribution has a positive sign, which
indicates that the IC50 is inversely related to this descriptor;
therefore, increasing the branching of molecules leads to a
decrease in their IC50. The last descriptor, EEig09d, is a
topological molecular descriptor. It is defined as Eigenvalue 09
from the edge adj. matrix weighted by dipole moments, and
encodes the connectivity between graph edges.
Figure. 2. Influence of the number of descriptors on the squareof Pearson correlation coefficient (R2), leave one out (LOO)cross-validation coefficient (Rcv
2), and F-values of the BMLRmodels.doi:10.1371/journal.pone.0022367.g002
Structure-Based Prediction of EGFR Inhibitors
PLoS ONE | www.plosone.org 3 July 2011 | Volume 6 | Issue 7 | e22367

From the above presentation, it is concluded that the selected
descriptors can be interpreted reasonably, and the inhibition
ability of quinazoline derivatives mainly depends on the following
properties: polarizability, activation energy, mass distribution,
connectivity, and branching information. In order to facilitate our
understanding of the main features of EGFR inhibitors, we also
investigated one of the existing X-ray crystal structures of ligand-
bound EGFR [55]. As shown in Fig. 3, an amide nitrogen donor
of the ligand together with the carboxyl group of MET769 form a
hydrogen bond in the EGFR hinge region. Hydrogen-bond
interactions play a crucial role in ligand–protein binding; however
polarizability was one of the critical factors in forming the
interaction in a broader sense, involving both the hydrophilic and
hydrophobic regions of the receptor. In fact, the polarizability of
the ligand is essential to stabilize any generated hydrogen bonds.
Consistently with our QSAR study, Vema et al. [30], who docked
the selected drugs to the active binding site of the same EGFR
kinase domain, found that the regions of the receptor surface
around different branching places exhibited different electronic
properties, either electronegative or electropositive. Thus the
connectivity and branching information contributed greatly to the
docking and interaction of the ligands with EGFR. Such
information was helpful to clarify the mechanisms of molecular
docking encountered in drug-discovery studies.
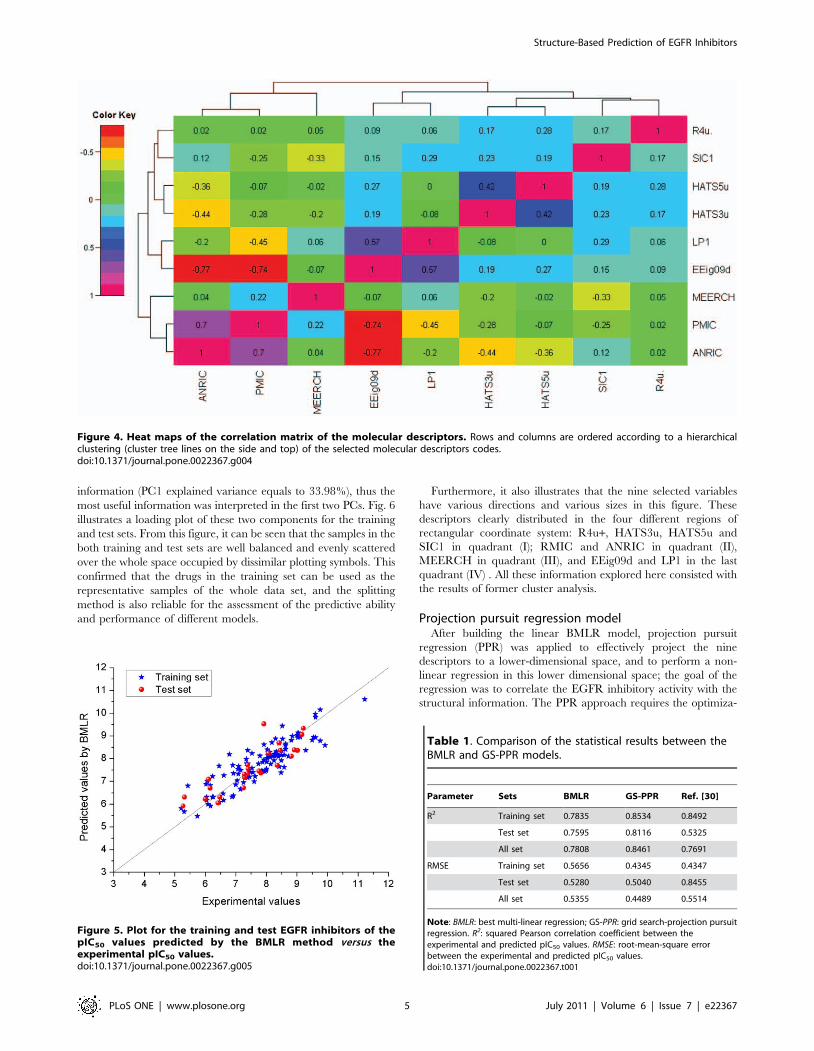
The correlation matrix of these selected descriptors is shown by
a heat map in Fig. 4, produced with the R-package gplots [57].
The linear correlation coefficients of all descriptor pairs are at
most equal to 0.80 and the majority of them are below 0.3, which
demonstrates the relative independence of the selected descriptors.
Furthermore, the hierarchical clustering reveals noteworthy
contributions of the nature of the different selected molecular
descriptors. For example, descriptors EEig09d and LP1, accounting
primarily for the connectivity and branching information of the
molecule, cluster together. Similarly, descriptors HATS3u, HATS5u
and R4u belong to GETEWAY descriptors, and they are in the
same cluster, by representing the information of different atoms in
the molecules, and all related with the Cartesian coordinates of the
molecule atoms (including hydrogen) in a chosen conformation
[58]. Finally, the six descriptors which were calculated from
DRAGON were clustered together; and they can be viewed as
describing the intrinsic property of the molecules. Descriptors
ANRIC and MEERCH are clustered together. They were
calculated from quantum chemistry methods, and represent their
electron and nucleoph properties in the molecules. They related
with the activation energy and electronegativity of the molecule,
respectively, and simulated the interactions with other molecules.
The predicted pIC50 activity values for all the known EGFR
inhibitors, including the training and test sets are given in Table
S1, where the experimental pIC50 values are also listed. Fig. 5
shows the predicted versus the experimental pIC50 values for the
training and test sets, respectively. There is an obvious correlation
between the predicted and experimental values of pIC50, with the
square of Pearson correlation coefficients 0.7835 and 0.7595 for
the training and test sets, respectively. The whole statistical
parameters of the BMLR model are given in Table 1. There is no
notable difference in the correlation coefficient for the test and
training data, confirming that the model was indeed not ‘‘over-
trained’’.
Principal component analysis of the selected descriptorsPrincipal component analysis (PCA) is always used to reduce the
dimensionality of multidimensional variables and analyze complex
intrinsic features among variables. In the current research, PCA
method was performed using the selected nine descriptors with the
aim to show the spatial location of every drug, and also check the
distribution of the drugs in the training and test sets. The two
major principal components were given here. The explained
variance of these two components is 50.38% of the total
Figure 3. Crystal structure of EGFR bound to the 4-anilinoquinazoline inhibitor Erlotinib (PDB ID: 1M17). EGFR is represented by acartoon model, with the side chains of the binding site wire-framed in cyan and labeled. The inhibitor is represented by a stick-and-ball model, wherecarbons are colored in yellow, nitrogens in blue, oxygens in red, and hydrogens in light grey. The hydrogen bond between an amide nitrogen donorof the ligand and the carboxyl group of MET769 in the receptor is plotted as a red dotted line. Figure produced with the PyMOL program [56].doi:10.1371/journal.pone.0022367.g003
Structure-Based Prediction of EGFR Inhibitors
PLoS ONE | www.plosone.org 4 July 2011 | Volume 6 | Issue 7 | e22367
information (PC1 explained variance equals to 33.98%), thus the
most useful information was interpreted in the first two PCs. Fig. 6
illustrates a loading plot of these two components for the training
and test sets. From this figure, it can be seen that the samples in the
both training and test sets are well balanced and evenly scattered
over the whole space occupied by dissimilar plotting symbols. This
confirmed that the drugs in the training set can be used as the
representative samples of the whole data set, and the splitting
method is also reliable for the assessment of the predictive ability
and performance of different models.
Furthermore, it also illustrates that the nine selected variables
have various directions and various sizes in this figure. These
descriptors clearly distributed in the four different regions of
rectangular coordinate system: R4u+, HATS3u, HATS5u and
SIC1 in quadrant (I); RMIC and ANRIC in quadrant (II),
MEERCH in quadrant (III), and EEig09d and LP1 in the last
quadrant (IV) . All these information explored here consisted with
the results of former cluster analysis.
Projection pursuit regression modelAfter building the linear BMLR model, projection pursuit
regression (PPR) was applied to effectively project the nine
descriptors to a lower-dimensional space, and to perform a non-
linear regression in this lower dimensional space; the goal of the
regression was to correlate the EGFR inhibitory activity with the
structural information. The PPR approach requires the optimiza-
Figure 4. Heat maps of the correlation matrix of the molecular descriptors. Rows and columns are ordered according to a hierarchicalclustering (cluster tree lines on the side and top) of the selected molecular descriptors codes.doi:10.1371/journal.pone.0022367.g004
Figure 5. Plot for the training and test EGFR inhibitors of thepIC50 values predicted by the BMLR method versus theexperimental pIC50 values.doi:10.1371/journal.pone.0022367.g005
Table 1. Comparison of the statistical results between theBMLR and GS-PPR models.
Parameter Sets BMLR GS-PPR Ref. [30]
R2 Training set 0.7835 0.8534 0.8492
Test set 0.7595 0.8116 0.5325
All set 0.7808 0.8461 0.7691
RMSE Training set 0.5656 0.4345 0.4347
Test set 0.5280 0.5040 0.8455
All set 0.5355 0.4489 0.5514
Note: BMLR: best multi-linear regression; GS-PPR: grid search-projection pursuitregression. R2: squared Pearson correlation coefficient between theexperimental and predicted pIC50 values. RMSE: root-mean-square errorbetween the experimental and predicted pIC50 values.doi:10.1371/journal.pone.0022367.t001
Structure-Based Prediction of EGFR Inhibitors
PLoS ONE | www.plosone.org 5 July 2011 | Volume 6 | Issue 7 | e22367

tion of several parameters, including ‘nterms’ and ‘max.terms’,
which represent the number of ridge terms included in the final
model and the maximum number of ridge terms for building the
model, respectively; the parameter ‘df’ defines the smoothness of
each ridge term by the requested equivalent degrees of freedom;
the levels of optimization (parameter ‘optlevel’) differ in how
thoroughly the models are refitted. At level 0 the existing ridge
terms are not refitted. At level 1 the projection directions are not
refitted, but the ridge functions and the regression coefficients are.
Levels 2 and 3 refit all of the terms and are equivalent for one
response; level 3 is more careful to re-balance the contributions
from each regression at each step and so is slightly less likely to
converge to a saddle point of the sum of squares criterion. Since
the traditional PPR method usually adopts a single-fact correction
analysis, the models they produce tend to be only local optima.
Here, the grid-search (GS) method was employed, which relies
instead on multi-fact correction analysis, thereby producing a final
model that is generally closer to the global optimum [59]. The
results indicate that the ‘optlevel’ and ‘df’ parameters influenced
the optimization only slightly. Figures 7(a) and 7(b) show the values
of R2 and RMSE, respectively, as a function of ‘max.terms’ and
‘nterms’, the two most important optimization parameters. The
optimum values of ‘nterms’, ‘max.terms’, ‘df’, and ‘optlevel’ are
determined as 3, 7, 8, and 1, respectively. In order to assess the
internal predictability of the training set, a 5-fold cross validation is
typically used, providing an estimate for the mean performance of
a model. The values of the statistical parameters of the 5-fold cross
validation were Rcv2 = 0.7709, and RMSE = 0.6186. Furthermore,
the results of the test set prediction were confirmed by the external
prediction of the regression model. These data suggest that the
model we proposed has a robust prediction power.
Figure 6. Principal component analysis of the nine selecteddescriptors. Arrows indicate the directions of the variable vectors inthe principal component space. Black circles denote compounds fromthe training set, blue circles those from the test set.doi:10.1371/journal.pone.0022367.g006
Figure 7. Statistical parameters of the training set and the test set during the optimization process of the PPR parameters by thegrid search method. (a): R2, (b): RMSE.doi:10.1371/journal.pone.0022367.g007
Figure 8. Plot for the training and test EGFR inhibitors of thepIC50 values predicted by the GS–PPR method versus theexperimental pIC50 values.doi:10.1371/journal.pone.0022367.g008
Structure-Based Prediction of EGFR Inhibitors
PLoS ONE | www.plosone.org 6 July 2011 | Volume 6 | Issue 7 | e22367

The predicted results and the statistical parameters of the
optimal PPR model are shown in Tables S1 and 1, respectively.
The scatter plot of the predicted versus the experimental pIC50
values is given in Fig. 8. From Fig. 8 and Table S1 it can be seen
that the predicted values are in good agreement with the
experimental values for almost all the compounds.
Comparison of results of obtained by different modelsIn order to check the superiority of these two different models
(BMLR and GS-PPR), the predicted results and the statistical
parameters for the training and the test sets were collected together
and shown in Tables S1 and 1, separately. As it can be seen from
this table, the improved non-linear regression method GS-PPR
outperforms the BMLR model according to the R2 and RMSE,
and it shows much better predictive ability, and its corresponding
predicted results indicate an appropriate fit of the model.
Previously, Vema et al. [30] used the 3D-QSAR method
molecular field analysis (MFA) and receptor surface analysis
(RSA) to investigate the inhibitory activities of the same data set.
The squared Pearson correlation coefficient (R2) of their best
model (RSA) is 0.8492 for the training set and 0.5325 for the test
set. All of the other statistical parameters were collected in Table 1.
By comparing these results, it can be concluded that the GS-PPR
method is a simple but with powerful predictive capability tool as
to the inhibitory activity of potential anti-EGFR drugs.
ConclusionsWe have explored the features of potential inhibitors of
epidermal growth factor receptor, a vital protein target involved
in clinical anticancer therapies, based on linear and non-linear
QSAR models. A new non-linear QSAR method for the
prediction of EGFR inhibitory activity was developed, which
combines the grid search (GS) and projection pursuit regression
(PPR) techniques to infer biological activity from a set of molecular
descriptors; these were selected by the best multi-linear regression
(BMLR) exclusively from structural information. The GS-PPR
model showed a better predictive ability than the traditional linear
QSAR model, demonstrating that the combination of PPR and
GS is a valuable strategy for QSAR model building, at least for the
prediction of EGFR inhibitors. In addition, this investigation
shows that the structural features of quinazoline derivatives are
most relevant to quinazoline derivatives inhibition — namely,
polarizability, activation energy, mass distribution, connectivity,
and branching. The set of EGFR inhibitors, real or hypothetical,
which can possibly be examined by such studies, is large and
heterogeneous, due to the purely structural nature of the
molecular descriptors. The approach can be easily extended to
other cheminformatic and bioinformatics investigations, since the
small number of parameters to be optimized makes the training
procedure generally simple.
Supporting Information
Table S1 Structures and EGFR inhibitory activities of 128
known EGFR inhibitors.
(PDF)
Author Contributions
Conceived and designed the experiments: HYD YZ. Performed the
experiments: HYD. Analyzed the data: HYD ZDH AB YZ. Contributed
reagents/materials/analysis tools: HYD ZDH YZ. Wrote the paper: HYD
AB YZ.
References
1. Ullrich A, Schlessinger J (1990) Signal transduction by receptors with tyrosinekinase activity. Cell 61: 203–212.
2. Verbeek BS, Adriaansen-Slot SS, Vroom TM, Beckers T, Rijksen G (1998)
Overexpression of EGFR and c-erbB2 causes enhanced cell migration in humanbreast cancer cells and NIH3T3 fibroblasts. Febs Letters 425: 145–150.
3. Wells A (1999) EGF receptor. International Journal of Biochemistry & CellBiology 31: 637–643.
4. Yarden Y, Sliwkowski MX (2001) Untangling the ErbB signalling network.Nature Reviews Molecular Cell Biology 2: 127–137.
5. Hsuan JJ (1993) Oncogene regulation by growth-factors. Anticancer Research
13: 2521–2532.6. Soler C, Beguinot L, Carpenter G (1994) Individual epidermal growth-factor
receptor autophosphorylation sites do not stringently define association motifsfor several SH2-containing proteins. Journal of Biological Chemistry 269:
12320–12324.
7. Voldborg BR, Damstrup L, Spang-Thomsen M, Poulsen HS (1997) Epidermalgrowth factor receptor (EGFR) and EGFR mutations, function and possible role
in clinical trials. Annals of Oncology 8: 1197–1206.8. Toyoshima E, Ohsaki Y, Nishigaki Y, Fujimoto Y, Kohgo Y, et al. (2001)
Expression of syndecan-1 is common in human lung cancers independent ofexpression of epidermal growth factor receptor. Lung Cancer 31: 193–202.
9. Gross ME, Zorbas MA, Danels YJ, Garcia R, Gallick GE, et al. (1991) Cellular
growth-response to epidermal growth-factor in colon-carcinoma cells with anamplified epidermal growth-factor receptor derived from a familial adenomatous
polyposis patient. Cancer Research 51: 1452–1459.10. Damstrup L, Rygaard K, Spangthomsen M, Poulsen HS (1992) Expression of
the epidermal growth-factor receptor in human small-cell lung-cancer cell-lines.
Cancer Research 52: 3089–3093.11. van der Veeken J, Oliveira S, Schiffelers RM, Storm G, Henegouwen P, et al.
(2009) Crosstalk between epidermal growth factor receptor- and insulin-likegrowth factor-1 receptor signaling: implications for cancer therapy. Current
Cancer Drug Targets 9: 748–760.12. Bridges AJ (1999) The rationale and strategy used to develop a series of highly
potent, irreversible, inhibitors of the epidermal growth factor receptor family of
tyrosine kinases. Current Medicinal Chemistry 6: 825–843.13. Boschelli DH (1999) Small molecule inhibitors of receptor tyrosine kinases.
Drugs of the Future 24: 515–537.14. Ma XH, Wang R, Tan CY, Jiang YY, Lu T, et al. (2010) Virtual screening of
selective multitarget kinase inhibitors by combinatorial support vector machines.
Molecular Pharmaceutics 7: 1545–1560.
15. Abouzid K, Shouman S (2008) Design, synthesis and in vitro antitumor activityof 4-aminoquinoline and 4-aminoquinazoline derivatives targeting EGFR
tyrosine kinase. Bioorganic & Medicinal Chemistry 16: 7543–7551.
16. Wissner A, Overbeek E, Reich MF, Floyd MB, Johnson BD, et al. (2003)Synthesis and structure-activity relationships of 6,7-disubstituted 4-anilinoquino-
line-3-carbonitriles. The design of an orally active, irreversible inhibitor of thetyrosine kinase activity of the epidermal growth factor receptor (EGFR) and the
human epidermal growth factor receptor-2 (HER-2). Journal of MedicinalChemistry 46: 49–63.
17. Pawar VG, Sos ML, Rode HB, Rabiller M, Heynck S, et al. (2010) Synthesis
and biological evaluation of 4-anilinoquinolines as potent inhibitors of epidermalgrowth factor receptor. Journal of Medicinal Chemistry 53: 2892–2901.
18. Klutchko SR, Hamby JM, Boschelli DH, Wu ZP, Kraker AJ, et al. (1998) 2-substituted aminopyrido 2,3-d pyrimidin-7(8H) ones. Structure-activity relation-
ships against selected tyrosine kinases and in vitro and in vivo anticancer activity.
Journal of Medicinal Chemistry 41: 3276–3292.19. Solca FF, Baum A, Langkopf E, Dahmann G, Heider KH, et al. (2004)
Inhibition of epidermal growth factor receptor activity by two pyrimidopyr-imidine derivatives. Journal of Pharmacology and Experimental Therapeutics
311: 502–509.20. Thompson AM, Bridges AJ, Fry DW, Kraker AJ, Denny WA (1995) Tyrosine
kinase inhibitors .7. 7-amino-4-(phenylamino)pyrido 4,3-d pyrimidines and 7-
amino-4- (phenylmethyl)amino pyrido 4,3-d pyrimidines - a new class ofinhibitors of the tyrosine kinase-activity of the epidermal growth-factor receptor.
Journal of Medicinal Chemistry 38: 3780–3788.21. Ding K, Lu YP, Nikolovska-Coleska Z, Wang GP, Qiu S, et al. (2006) Structure-
based design of spiro-oxindoles as potent, specific small-molecule inhibitors of
the MDM2-p53 interaction. Journal of Medicinal Chemistry 49: 3432–3435.22. Li N, Thompson S, Schultz DC, Zhu WL, Jiang HL, et al. (2010) Discovery of
selective inhibitors against EBNA1 via high throughput in silico virtualscreening. Plos One 5: e10126–e10129.
23. Nunez MB, Maguna FP, Okulik NB, Castro EA (2004) QSAR modeling of theMAO inhibitory activity of xanthones derivatives. Bioorganic & Medicinal
Chemistry Letters 14: 5611–5617.
24. Hansch C, Verma RP (2009) Overcoming tumor drug resistance with C2-modified 10-deacetyl-7-propionyl cephalomannines: A QSAR study. Molecular
Pharmaceutics 6: 849–860.25. Mandal AS, Roy K (2009) Predictive QSAR modeling of HIV reverse
transcriptase inhibitor TIBO derivatives. European Journal of Medicinal
Chemistry 44: 1509–1524.
Structure-Based Prediction of EGFR Inhibitors
PLoS ONE | www.plosone.org 7 July 2011 | Volume 6 | Issue 7 | e22367

26. Liu FP, Liang YZ, Cao CZ (2006) QSPR modeling of thermal conductivity
detection response factors for diverse organic compound. Chemometrics and
Intelligent Laboratory Systems 81: 120–126.
27. Liu HX, Gramatica P (2007) QSAR study of selective ligands for the thyroid
hormone receptor beta. Bioorganic & Medicinal Chemistry 15: 5251–5261.
28. Verma RP, Hansch C (2010) QSAR modeling of taxane analogues against colon
cancer. Eur J Med Chem 45: 1470–1477.
29. Pasha FA, Muddassar M, Srivastava AK, Cho SJ (2010) In silico QSAR studies
of anilinoquinolines as EGFR inhibitors. Journal of Molecular Modeling 16:
263–277.
30. Vema A, Panigrahi SK, Rambabu G, Gopalakrishnan B, Sarma J, et al. (2003)
Design of EGFR kinase inhibitors: A ligand-based approach and its confirmation
with structure-based studies. Bioorganic & Medicinal Chemistry 11: 4643–4653.
31. Szantai-Kis C, Kovesdi I, Eros D, Banhegyi P, Ullrich A, et al. (2006) Prediction
oriented QSAR modelling of EGFR inhibition. Current Medicinal Chemistry
13: 277–287.
32. La Motta C, Sartini S, Tuccinardi T, Nerini E, Da Settimo F, et al. (2009)
Computational studies of epidermal growth factor receptor: Docking reliability,
three-dimensional quantitative structure-activity relationship analysis, and
virtual screening studies. Journal of Medicinal Chemistry 52: 964–975.
33. Shi WM, Shen Q, Kong W, Ye BX (2007) QSAR analysis of tyrosine kinase
inhibitor using modified ant colony optimization and multiple linear regression.
European Journal of Medicinal Chemistry 42: 81–86.
34. Friedman JH, Stuetzle W (1981) Projection pursuit regression. Journal of the
American Statistical Association 76: 817–823.
35. Huber PJ (1985) Projection pursuit. Annals of Statistics 13: 435–475.
36. Donoho D, Johnstone I, Rousseeuw P, Stahel W (1985) Projection pursuit -
Discussion. Annals of Statistics 13: 496–500.
37. Rewcastle GW, Denny WA, Bridges AJ, Zhou HR, Cody DR, et al. (1995)
Tyrosine kinase inhibitors .5. synthesis and structure - activity - relationships for
4- (phenylmethyl)amino - quinazolines and 4-(phenylamino)quinazolines as
potent adenosine 5’-triphosphate binding-site inhibitors of the tyrosine kinase
domain of the epidermal growth-factor receptor. Journal of Medicinal
Chemistry 38: 3482–3487.
38. Bridges AJ, Zhou H, Cody DR, Rewcastle GW, McMichael A, et al. (1996)
Tyrosine kinase inhibitors .8. An unusually steep structure-activity relationship
for analogues of 4-(3-bromoanilino)-6,7-dimethoxyquinazoline (PD 153035), a
potent inhibitor of the epidermal growth factor receptor. Journal of Medicinal
Chemistry 39: 267–276.
39. Rewcastle GW, Palmer BD, Thompson AM, Bridges AJ, Cody DR, et al. (1996)
Tyrosine kinase inhibitors .10. Isomeric 4- (3-bromophenyl)amino pyrido d -
pyrimidines are potent ATP-binding site inhibitors of the tyrosine kinase
function of the epidermal growth factor receptor. Journal of Medicinal
Chemistry 39: 1823–1835.
40. Rewcastle GW, Bridges AJ, Fry DW, Rubin JR, Denny WA (1997) Tyrosine
kinase inhibitors .12. Synthesis and structure-activity relationships for 6-
substituted 4-(phenylamino)pyrimido 5,4-d pyrimidines designed as inhibitors
of the epidermal growth factor receptor. Journal of Medicinal Chemistry 40:
1820–1826.41. Thompson AM, Murray DK, Elliott WL, Fry DW, Nelson JA, et al. (1997)
Tyrosine kinase inhibitors .13. Structure-activity relationships for soluble 7-
substituted 4- (3-bromophenyl)amino pyrido 4,3-d pyrimidines designed asinhibitors of the tyrosine kinase activity of the epidermal growth factor receptor.
Journal of Medicinal Chemistry 40: 3915–3925.42. ISIS Draw2. 3 (1990–2000) MDLInformation Systems, Inc.
43. HyperChem, Release 6.0 for Windows, Hypercube, Inc., 2000.
44. Todeschini R, Consonni V, Mauri A, Pavan M (2006) DRAGONs Software forthe calculation of molecular descriptors, version 5.4 for Windows. Milan, Italy:
Talete srl.45. Katritzky AR, Lobanov VS, Karelson M (1995) CODESSA Version 2.0
Reference Manual Gainesville Florida: University of Florida.46. Todeschini R, Consonni V (2000) Handbook of Molecular Descriptors; Wiley-
VCH. Weinheim, Germany.
47. Katritzky AR, Lobanov VS, Karelson M (1995) CODESSA: Training Manual.Gainesville, Florida: University of Florida.
48. Du HY, Wang J, Hu ZD, Yao XJ, Zhang XY (2008) Prediction of fungicidalactivities of rice blast disease based on least-squares support vector machines and
project pursuit regression. Journal of Agricultural and Food Chemistry 56:
10785–10792.49. Birattari M, Bontempi G (2003) R manuals, The R Development Core Team.
50. Strouf O (1986) Chemical Pattern Recognition New York: Wiley.51. Weast RC (1974) Handbook of Chemistry and Physics. Cleveland OH: CRC
Press. pp F-112.52. Fukui K (1975) Theory of Orientation nad Stereoselection Berlin: Springer-
Verlag.
53. Consonni V, Todeschini R, Pavan M (2002) Structure/response correlationsand similarity/diversity analysis by GETAWAY descriptors. 1. Theory of the
novel 3D molecular descriptors. Journal of Chemical Information andComputer Sciences 42: 682–692.
54. Basak SC, Mills D, Hawkins DM (2008) Predicting allergic contact dermatitis: a
hierarchical structure-activity relationship (SAR) approach to chemical classifi-cation using topological and quantum chemical descriptors. Journal of
Computer-Aided Molecular Design 22: 339–343.55. Stamos J, Sliwkowski MX, Eigenbrot C (2002) Structure of the epidermal
growth factor receptor kinase domain alone and in complex with a 4-anilinoquinazoline inhibitor. Journal of Biological Chemistry 277: 46265–46272.
56. Delano WL (2002) The PyMol Molecular Graphics System Delano Scientific.
San Carlos, CA, USA: DeLano Scientific.57. The R Project for Statistical Computing. http://www.r-project.org/(Accessed
May 21, 2010).58. Puzyn T, Leszczynski J, Cronin MT (2010) Recent Advances in QSAR Studies
Methods and Applications: Springer Dordrecht Heidelberg London New York.
59. Du HY, Wang J, Zhang XY, Hu ZD (2008) A novel quantitative structure-activity relationship method to predict the affinities of MT3 melatonin binding
site. European Journal of Medicinal Chemistry 43: 2861–2869.
Structure-Based Prediction of EGFR Inhibitors
PLoS ONE | www.plosone.org 8 July 2011 | Volume 6 | Issue 7 | e22367