predicting the clinical impact of human mutation with deep
TRANSCRIPT

Articleshttps://doi.org/10.1038/s41588-018-0167-z
1Illumina Artificial Intelligence Laboratory, Illumina Inc, San Diego, CA, USA. 2Department of Computer Science, Stanford University, Stanford, CA, USA. 3National Science Foundation Center for Big Learning, University of Florida, Gainesville, FL, USA. 4Analytic and Translational Genetics Unit (ATGU), Department of Medicine, Massachusetts General Hospital and Harvard Medical School, Boston, MA, USA. 5Toyota Technological Institute at Chicago, Chicago, IL, USA. 6These authors contributed equally: Laksshman Sundaram, Hong Gao. *e-mail: [email protected]
The clinical actionability of diagnostic sequencing is limited by the difficulty of interpreting rare genetic variants in human populations and inferring their impact on disease risk1,2.
Because of their deleterious effects on fitness, clinically significant genetic variants tend to be extremely rare in the population and, for the vast majority, their effects on human health have not been deter-mined3. The large number and rarity of these variants of uncertain clinical significance present a formidable obstacle to the adoption of sequencing for individualized medicine and population-wide health screening4.
Most penetrant mendelian diseases have very low prevalence in the population, hence the observation of a variant at high fre-quencies in the population is strong evidence in favor of benign consequence5. Assaying common variation across diverse human populations is an effective strategy for cataloguing benign variants6, but the total amount of common variation in present-day humans is limited due to bottleneck events in our species’ recent history, dur-ing which a large fraction of ancestral diversity was lost7. Population studies of present-day humans show a remarkable inflation from an effective population size (Ne) of less than 10,000 individuals within the last 15,000–65,000 years, and the small pool of common poly-morphisms traces back to the limited capacitance for variation in a population of this size8. Out of more than 70 million potential pro-tein-altering missense substitutions in the reference genome, only roughly 1 in 1,000 are present at greater than 0.1% overall popula-tion allele frequency6,9.
Outside of modern human populations, chimpanzees comprise the next closest extant species, and share 99.4% amino acid sequence identity10. The near-identity of the protein-coding sequence in humans and chimpanzees suggests that purifying selection operat-ing on chimpanzee protein-coding variants might also model the consequences on fitness of human mutations that are identical-by-state. Because the mean time for neutral polymorphisms to persist
in the ancestral human lineage (~4Ne generations) is a fraction of the species’ divergence time (~6 million years ago)11, naturally occurring chimpanzee variation explores mutational space that is largely non-overlapping except by chance, aside from rare instances of haplotypes maintained by balancing selection12,13. If polymor-phisms that are identical-by-state similarly affect fitness in the two species, the presence of a variant at high allele frequencies in chim-panzee populations should indicate benign consequence in human, expanding the catalog of known variants whose benign conse-quence has been established by purifying selection.
ResultsCommon variants in other primates are largely benign in human. The recent availability of aggregated exome data, comprising 123,136 humans collected in the Exome Aggregation Consortium (ExAC) and Genome Aggregation Database (gnomAD), allows us to measure the impact of natural selection on missense and syn-onymous mutations across the allele frequency spectrum6. Rare singleton variants that are observed only once in the cohort closely match the expected 2.2/1 missense/synonymous ratio predicted by de novo mutation after adjusting for the effects of trinucleotide context on mutational rate (Fig. 1a and Supplementary Figs. 1, 2)14, but at higher allele frequencies the number of observed missense variants decreases due to the purging of deleterious mutations by natural selection. The gradual decrease of missense/synonymous ratios with increasing allele frequency is consistent with a substan-tial fraction of missense variants of population frequency < 0.1% having a mildly deleterious consequence despite being observed in healthy individuals15. These findings support the widespread empir-ical practice by diagnostic laboratories of filtering out variants with greater than 0.1% to ~1% allele frequency as probably benign for penetrant genetic disease, aside from a handful of well-documented exceptions due to balancing selection and founder effects16,17.
Predicting the clinical impact of human mutation with deep neural networksLaksshman Sundaram 1,2,3,6, Hong Gao1,6, Samskruthi Reddy Padigepati 1,3, Jeremy F. McRae 1, Yanjun Li 3, Jack A. Kosmicki1,4, Nondas Fritzilas1, Jörg Hakenberg 1, Anindita Dutta1, John Shon1, Jinbo Xu5, Serafim Batzloglou1, Xiaolin Li 3 and Kyle Kai-How Farh 1*
Millions of human genomes and exomes have been sequenced, but their clinical applications remain limited due to the diffi-culty of distinguishing disease-causing mutations from benign genetic variation. Here we demonstrate that common missense variants in other primate species are largely clinically benign in human, enabling pathogenic mutations to be systematically identified by the process of elimination. Using hundreds of thousands of common variants from population sequencing of six non-human primate species, we train a deep neural network that identifies pathogenic mutations in rare disease patients with 88% accuracy and enables the discovery of 14 new candidate genes in intellectual disability at genome-wide significance. Cataloging common variation from additional primate species would improve interpretation for millions of variants of uncertain significance, further advancing the clinical utility of human genome sequencing.
NAtuRe GeNeticS | www.nature.com/naturegenetics

Articles NaTUre GeNeTiCs
We identified common chimpanzee variants that were sampled two or more times in a cohort of 24 unrelated individuals18; we esti-mate that 99.8% of these variants are common in the general chim-panzee population (allele frequency (AF) > 0.1%), indicating that these variants have already passed through the sieve of purifying selection (see Methods). We examined the human allele frequency spectrum for the corresponding identical-by-state human variants (Fig. 1b), excluding the extended major histocompatibility complex
region as a known region of balancing selection19, along with vari-ants lacking a one-to-one mapping in the multiple sequence align-ment. For human variants that are identical-by-state with common chimpanzee variants, the missense/synonymous ratio is largely constant across the human allele frequency spectrum (P > 0.5 by χ 2 test), which is consistent with the absence of negative selec-tion against common chimpanzee variants in the human popula-tion and concordant selection coefficients on missense variants in
a
Singleton Singleton ~ 0.01% 0.01% ~ 0.1% > 0.1%
All human SNPs in 123,136 exomes
Human population allele frequency
Human population allele frequency Human population allele frequency
Human population allele frequency
Mis
sens
e/sy
nony
mou
s co
unts
Mis
sens
e/sy
nony
mou
s co
unts
0.0 0.0
0.5
0.51.0
1.01.5
1.5
2.0
2.0
Mis
sens
e/sy
nony
mou
s co
unts
0.0
0.5
1.0
1.5
2.0
Mis
sens
e/sy
nony
mou
s co
unts
0.0
0.5
1.0
1.5
2.0
2.5
3.0
927 K
2,162 K
2.1/1
923 K
1,794 K2.0/1
142 K
217 K1.6/1
76 K84 K
1.1/1
SynonymousMissense
SynonymousMissense
SynonymousMissense
SynonymousMissense
Expected missense :synonymous ratio
Singleton Singleton ~ 0.01% 0.01% ~ 0.1% > 0.1%
Human SNPs IBS with chimpanzee common SNPs
4 K
2 K
0.63/113 K
8 K
0.58/13 K
2 K
0.63/12 K
958
0.58/1
Not significant,P > 0.5
2.5%missensedepletion
b
Singleton Singleton ~ 0.01% 0.01% ~ 0.1% > 0.1%
Human SNPs IBS with chimpanzee singleton SNPs
2.2 K
1.8 K
0.82/17.7 K
6.6 K
0.86/11.6 K
1.4 K
0.89/1747
486
0.65/1
P < 5.8 × 10⁻⁶
23.9%missensedepletion
Singleton Singleton ~ 0.01% 0.01% ~ 0.1% > 0.1%
Human SNPs IBS with variants in six primate species
20 K
13 K
0.68/160 K
39 K
0.66/113 K
9 K
0.69/17 K
4 K
0.61/1
8.8%missensedepletion
prim
ates
30 h
ealth
yhu
man
sC
linV
ar
Fraction of missense variants found in ClinVar
0.0 0.2 0.4 0.6 0.8 1.0
123.7 13.5
247.7 11.8
14,782 27,656
ClinVar benignClinVar pathogenic
NotsignificantP = 0.07
dc
e
Fig. 1 | Missense/synonymous ratios across the human allele frequency spectrum. a, All missense and synonymous variants observed in 123,136 humans from the ExAC/gnomAD database were divided into four categories by allele frequency. Shaded grey bars represent counts of synonymous variants in each category; dark green bars represent missense variants. The height of each bar is scaled to the number of synonymous variants in each allele frequency category and the missense/synonymous counts and ratios are displayed after adjusting for mutation rate. b,c, Allele frequency spectrum for human missense and synonymous variants that are identical-by-state (IBS) with chimpanzee common (b) and chimpanzee singleton (c) variants. The depletion of chimpanzee missense variants at common human allele frequencies (> 0.1%) compared to rare human allele frequencies (< 0.1%) is indicated by the red box, along with accompanying χ 2 test P values. d, As in b and c, but using human variants that are observed in at least one of the non-human primate species. e, Counts of benign and pathogenic missense variants in the overall ClinVar database (top row), compared to ClinVar variants in a cohort of 30 humans sampled from ExAC/gnomAD allele frequencies (middle row), compared to variants observed in primates (bottom row). Conflicting benign and pathogenic assertions and variants annotated only with uncertain significance were excluded.
NAtuRe GeNeticS | www.nature.com/naturegenetics

ArticlesNaTUre GeNeTiCs
the two species. The low missense/synonymous ratio observed in human variants that are identical-by-state with common chimpan-zee variants is consistent with the larger effective population size in chimpanzee (Ne ~ 73,000), which enables more efficient filtering of mildly deleterious variation20,21.
In contrast, for singleton chimpanzee variants (sampled only once in the cohort), we observe a significant decrease in the missense/ synonymous ratio at common allele frequencies (P < 5.8 × 10⁻⁶; Fig. 1c), indicating that 24% of singleton chimpanzee missense variants would be filtered by purifying selection in human populations at allele frequencies greater than 0.1%. This depletion indicates that a significant fraction of the chimpanzee singleton variants are rare deleterious mutations whose damaging effects on fitness have pre-vented them from reaching common allele frequencies in either spe-cies. We estimate that only 69% of singleton variants are common (AF > 0.1%) in the general chimpanzee population (see Methods).
We next identified human variants that are identical-by-state with variation observed in at least one of six non-human primate species. Variation in each of the six species was ascertained from either the great ape genome project (chimp, bonobo, gorilla, and orangutan)18 or were submitted to the Single Nucleotide Polymorphism Database (dbSNP) from the primate genome projects (rhesus, marmoset)22–25, and largely represent common variants based on the limited number of individuals sequenced and the low missense:synonymous ratios observed for each species (Supplementary Table 1). Similar to chim-panzee, we found that the missense/synonymous ratios for variants from the six non-human primate species are roughly equal across the human allele frequency spectrum, other than a mild depletion of mis-sense variation at common allele frequencies (Fig. 1d, Supplementary Fig. 3 and Supplementary Data File 1), which is expected due to the inclusion of a minority of rare variants (~16% with under 0.1% allele frequency in chimpanzee, and less in other species due to fewer
Branch length between humanand other vertebrates (log scale)
Dep
letio
n of
mis
sens
eva
riant
s fr
om o
ther
spe
cies
at
com
mon
hum
an a
llele
freq
uenc
ies
0 0.01 0.05 0.1 0.2 0.5 1 1.5 2
0%
10%
20%
30%
40%
50%
60%
0%
10%
20%
30%
40%
50%
60%
Primate (singleton)Primate (all)Primate (common)MammalBirdFish
Goa
t (0.
388)
Chi
cken
(1.
166)
Zeb
rafis
h (2
.068
)
Chi
mpa
nzee
(0.
013)
Bon
obo
(0.0
14)
Gor
illa
(0.0
197)
Ora
ngut
an (
0.03
94)
Rhe
sus
(0.0
796)
Mar
mos
et (
0.10
7)
Pig
(0.
339)
Cow
(0.
388)
Mou
se (
0.50
2)
Primate
Catarrhini
Mammalia
Platyrrhini
Tetrapoda
Singleton Singleton~ 0.01%
0.01% to ~ 0.1% > 0.1%
Human SNPs IBS with variants in four mammal species
Human population allele frequency
Mis
sens
e/sy
nony
mou
s co
unts
0.0
0.5
1.0
1.5
2.0
a c
db
21 K
11 K
0.54/138 K
21 K
0.56/17 K
4 K
0.55/13 K
1 K
0.40/1
P < 3.6 × 10⁻²²
27.3%missensedepletion
SynonymousMissense
Mam
mal
sP
rimat
es30
hea
lthy
hum
ans
Fraction of missense variants found in ClinVar
0.0 0.2 0.4 0.6 0.8 1.0
60.2 22.2
123.7 13.5
247.7 11.8
P =0.00168
P =1.298 × 10⁻⁸
ClinVar benignClinVar pathogenic
Mean branch length of a pair ofvertebrates from human (log scale)
Dep
letio
n of
mis
sens
esu
bstit
utio
ns fr
om o
ther
spe
cies
pairs
at c
omm
on h
uman
alle
le fr
eque
ncie
s
0 0.01 0.05 0.1 0.2 0.5 1 1.5 2
PrimateMammalBirdReptile
Dav
id-m
yotis
bat
~ M
icro
bat (
0.08
25)
Chi
nese
ham
ster
~ G
olde
n ha
mst
er (
0.08
)
Mou
se ~
Rat
(0.
176)
She
ep ~
Goa
t (0.
1)
Chi
nchi
lla ~
Bru
sh-t
aile
d ra
t (0.
16)
Gre
en s
eatu
rtle
~ P
aint
ed tu
rtle
(0.
2)
Chi
cken
~ T
urke
y (0
.127
)
Hor
se ~
Whi
te r
hino
cero
s (0
.084
)
Dol
phin
~ K
iller
wha
le (
0.07
4)
Bab
oon
~ G
reen
mon
key
(0.0
46)
Pro
bosc
is m
onke
y ~
Gol
den
snub
-nos
ed m
onke
y (0
.013
4)
Mar
mos
et ~
Squ
irrel
mon
key
(0.0
68)
Chi
mp
~ B
onob
o (0
.007
8)
Rhe
sus
~ C
rab-
eatin
g m
acaq
ue (
0.00
58)
Chi
nese
sof
tshe
ll tu
rtle
~ S
piny
sof
tshe
ll tu
rtle
(0.
2)
Fig. 2 | Purifying selection on missense variants identical-by-state with other species. a, Allele frequency spectrum for human missense and synonymous variants that are identical-by-state with variants present in four non-primate mammalian species (mouse, pig, goat, and cow). The depletion of missense variants at common human allele frequencies (> 0.1%) is indicated by the red box, along with the accompanying χ 2 test P value. b, Scatter plot showing the depletion of missense variants observed in other species at common human allele frequencies (> 0.1%) versus the species’ evolutionary distance from human, expressed in units of branch length (mean number of substitutions per nucleotide position). The total branch length between each species and human is indicated next to the species’ name. Depletion values for singleton and common variants are shown for species where variant frequencies were available, with the exception of gorilla, which contained related individuals. c, Counts of benign and pathogenic missense variants in a cohort of 30 humans sampled from ExAC/gnomAD allele frequencies (top row), compared to variants observed in primates (middle row), and compared to variants observed in mouse, pig, goat, and cow (bottom row). Conflicting benign and pathogenic assertions and variants annotated only with uncertain significance were excluded. d, Scatter plot showing the depletion of fixed missense substitutions observed in pairs of closely related species at common human allele frequencies (> 0.1%) versus the species’evolutionary distance from human (expressed in units of mean branch length).
NAtuRe GeNeticS | www.nature.com/naturegenetics

Articles NaTUre GeNeTiCs
c
d e f Classification performance for DDDversus controls
Withheld primate variants versusmatched control variants
De novo missense variants in DDDcases versus controls
a b
0 500 1,000 1,500 2,000
0
0.5
1
SCN2A amino acid sequence (2006 AA)
PrimateAI score at eachamino acid position
Intracellular domain
ExAC variants in healthy individuals
Extracellular domainTransmembrane domainPore-forming domainS4−S5 linker domain
ClinVar pathogenic variants
SIFT
PolyPhe
n-2
CADD
REVEL
Primat
eAI
hum
an o
nly
Primat
eAI
hum
an+p
rimat
es
Fra
ctio
n of
var
iant
s pr
edic
ted
as b
enig
n
0.3
0.4
0.5
0.6
0.7
0.8
0.9
1.010,000 withheld primate variants10,000 randomly selected variants
PrimateAI score
Fre
quen
cy
0.0 0.2 0.4 0.6
P = 1.463 × 10⁻²⁹
0.8 1.0
0
50
100
150
200 3,512 variants from affected patients1,208 variants from unaffected controls
SIFT
PolyPhe
n–2
CADD
REVEL
Primat
eAI
hum
an o
nly
Primat
eAI
hum
an+p
rimat
es
Affe
cted
ver
sus
unaf
fect
ed –
log(
P v
alue
)
0
5
10
15
20
25
30
35
Secondary structure prediction model Solvent accessibility prediction model
PrimateAI:variant pathogenicity prediction model
Benign Pathogenic
PrimateAI score forchr12: 103246653 C>T(PAH gene R>Q)
1D convolution
1D convolution
+
Six residualblocks
+
Frequency
0.1 0.2 0.3 0.4 0.5 0.6 0.7 0.8 0.9 1.0
Information fromsecondary structureprediction model
Human referenceHuman alternativePWM from 11 primatesPWM from 50 mammalsPWM from 38 vertebrates
Information fromsolvent accessibilityprediction model
PAH
NH2
COOHp.Arg261Gln
51 AA sequencecentered around the variant
+
Six layers +
Softmax
+
+
+Six layers
p.Arg261Gln
COOH
51 AA sequencecentered around the variant
NH2
PAH
PWM from 99 vertebrates
Predictions for pathogenicityprediction model
Predictions for pathogenicityprediction model
1D convolution
1D convolution
1D convolution
1D convolution
Softmax
Fig. 3 | Deep learning network for classification of missense variants. a, Architecture of the deep residual network for pathogenicity prediction, PrimateAI. Predicted pathogenicity is on a scale from 0 (benign) to 1 (pathogenic). The network takes as input the human amino acid (AA) reference and alternate sequence (51 AAs) centered at the variant, the position weight matrix (PWM) conservation profiles calculated from 99 vertebrate species, and b, the outputs of secondary structure and solvent accessibility prediction deep learning networks, which predict three-state protein secondary structure (helix—H, beta sheet—B, and coil—C) and three-state solvent accessibility (buried—B, intermediate—I, and exposed—E). c, Predicted pathogenicity score at each amino acid position in the SCN2A gene, annotated for key functional domains. Plotted along the gene is the average PrimateAI score for missense substitutions at each amino acid position. d, Comparison of classifiers at predicting benign consequence for a test set of 10,000 common primate variants that were withheld from training. The y axis represents the percentage of primate variants correctly classified as benign, after normalizing the threshold of each classifier to its 50th percentile score on a set of 10,000 random variants that were matched for mutational rate. e, Distributions of PrimateAI prediction scores for de novo missense variants occurring in DDD patients compared to unaffected siblings, with corresponding Wilcoxon rank-sum P value. f, Comparison of classifiers at separating de novo missense variants in DDD cases versus controls. Wilcoxon rank-sum test P values are shown for each classifier. 1D, 1-dimensional convolutional layer; PAH, phenylalanine hydroxylase; NH2, amino-terminus; COOH, carboxyl-terminus .
NAtuRe GeNeticS | www.nature.com/naturegenetics

ArticlesNaTUre GeNeTiCs
individuals sequenced; see Methods and Supplementary Note). These results suggest that the selection coefficients on identical-by-state missense variants are concordant within the primate lineage at least out to New World monkeys, which are estimated to have diverged from the human ancestral lineage ~35 million years ago26.
We found that human missense variants that are identical-by-state with observed primate variants are strongly enriched for benign consequence in the ClinVar database27. After excluding vari-ants of uncertain significance and those with conflicting annota-tions, ClinVar variants that are present in at least one non-human primate species are annotated as benign or likely benign 90% of the time on average, compared to 35% for ClinVar missense variants in general (P < 10−40; Fig. 1e). The pathogenicity of ClinVar anno-tations for primate variants is slightly greater than that observed from sampling a similarly sized cohort of healthy humans (~95% benign or likely benign consequence, P = 0.07; see Methods and Supplementary Note) excluding human variants with greater than 1% allele frequency to reduce curation bias.
The field of human genetics has long relied on model organ-isms to infer the clinical impact of human mutations28,29, but the long evolutionary distance to most genetically tractable ani-mal models raises concerns about the extent to which findings on model organisms are generalizable back to human30. We extended our analysis beyond the primate lineage to include largely common variation from four additional mammalian spe-cies (mouse, pig, goat, and cow) and two species of more distant vertebrates (chicken and zebrafish). We selected species with suf-ficient genome-wide ascertainment of variation in the dbSNP, and confirmed that these are largely common variants, based on missense/synonymous ratios being much lower than 2.2/1 (see Methods and Supplementary Note). In contrast to our primate analyses, human missense mutations that are identical-by-state with variation in more distant species are markedly depleted at common allele frequencies (Fig. 2a), and the magnitude of this depletion increases at longer evolutionary distances (Fig. 2b and Supplementary Tables 2 and 3).
SIFT
CADD
REVEL
Primat
eAI
0.5
0.6
0.7
0.8
0.9
1.0
0.5
0.6
0.7
0.8
0.9
1.0
Cla
ssfic
atio
n ac
cura
cy
AU
C
Maximum AUC = 0.837
De novo missense variantsin 605 DDD disease genes
De novo variants in 605 DDD disease genes
Classification performancewithin 605 DDD disease genes
Synon
ymou
s
Miss
ense
Miss
ense
with
Primat
eAI s
core
s
≥ 0.80
3
Obs
erve
dco
unts
/ ex
pect
ed c
ount
s
0
1
2
3
4
5
6
n = 59excess = 3
n = 59excess = 249
n = 249excess = 205
P = 4.938 × 10⁻¹⁶
PrimateAI score
Fre
quen
cy0.0 0.2 0.4 0.6 0.8 1.0
0
10
20
30
40
a
d e
b c
362 variants from affected patients65 variants from unaffected controls
SIFT
PolyPhe
n–2
Polyph
en–2
CADD
REVEL
Primat
eAl
hum
an o
nly
Primat
eAI
hum
an+p
rimat
es
Affe
cted
ver
sus
unaf
fect
ed –
log(
P v
alue
)
0
5
10
15
20
1.0
0.8
65%
14%
0.6
0.4
Tru
e po
sitiv
e ra
te
0.2
0.0
0.0 0.2 0.4
PrimateAI, AUC = 0.8155SIFT, AUC = 0.6904Polyphen-2, AUC = 0.7431
CADD, AUC = 0.7088REVEL, AUC = 0.7393
0.6
False positive rate
0.8 1.0
Fig. 4 | classification accuracy within 605 DDD genes with P < 0.05. a, Enrichment of de novo missense mutations over expectation in affected individuals from the DDD cohort within 605 associated genes that were significant for de novo protein truncating variation (P < 0.05). b, Distributions of PrimateAI prediction scores for de novo missense variants occurring in DDD patients versus unaffected siblings within the 605 associated genes, with corresponding Wilcoxon rank-sum P value. c, Comparison of various classifiers at separating de novo missense variants in cases versus controls within the 605 genes. The y axis shows the P values of the Wilcoxon rank-sum test for each classifier. d, Comparison of various classifiers, shown on a receiver operator characteristic curve, with AUC indicated for each classifier. e, Classification accuracy and AUC for each classifier. The classification accuracy shown is the average of the true positive and true negative error rates, using the threshold where the classifier would predict the same number of pathogenic and benign variants as expected based on the enrichment in a. To take into account the fact that 33% of the DDD de novo missense variants represent background, the maximum achievable AUC for a perfect classifier is indicated with a dotted line.
NAtuRe GeNeticS | www.nature.com/naturegenetics

Articles NaTUre GeNeTiCs
The missense mutations that are deleterious in human, yet toler-ated at high allele frequencies in more distant species, indicate that the coefficients of selection for identical-by-state missense muta-tions have diverged substantially between humans and more distant species. Nonetheless, the presence of a missense variant in more dis-tant mammals still increases the likelihood of benign consequence, as the fraction of missense variants depleted by natural selection at common allele frequencies is less than the ~50% depletion observed for human missense variants in general (Fig. 1a). Consistent with these results, we found that ClinVar missense variants that have been observed in mouse, pig, goat, and cow are 73% likely to be annotated with benign or likely benign consequence, compared to 90% for primate variation (P < 2 × 10⁻⁸; Fig. 2c), and 35% for the ClinVar database overall.
To confirm that evolutionary distance, and not domestication artifact, is the primary driving force for the divergence of the selec-tion coefficients, we repeated the analysis using fixed substitutions between pairs of closely related species in lieu of intra-species poly-morphisms across a broad range of evolutionary distances (Fig. 2d, Supplementary Table 4 and Supplementary Data File 2). We found that the depletion of human missense variants that are identical-by-state with inter-species fixed substitutions increases with evolution-ary branch length, with no discernable difference for wild species
compared to those exposed to domestication. This concurs with earlier work in fly and yeast31, which found that the number of iden-tical-by-state fixed missense substitutions was lower than expected by chance in divergent lineages.
A deep learning network for variant pathogenicity classification. The importance of variant classification for clinical applications has inspired numerous attempts to use supervised machine learn-ing to address the problem, but these efforts have been hindered by the lack of an adequately sized truth dataset containing confidently labeled benign and pathogenic variants for training32–42. Existing databases of human expert curated variants do not represent the entire genome, with ~50% of the variants in the ClinVar database coming from only 200 genes (~1% of human protein-coding genes). Moreover, systematic studies identify that many human expert annotations have questionable supporting evidence6,43, underscor-ing the difficulty of interpreting rare variants that may be observed in only a single patient. Although human expert interpretation has become increasingly rigorous1,5, classification guidelines are largely formulated around consensus practices and are at risk of reinforcing existing tendencies. To reduce human interpretation biases, recent classifiers have been trained on common human polymorphisms or fixed human–chimpanzee substitutions44–47, but these classifiers
50,0
00
100,
000
150,
000
200,
000
250,
000
300,
000
350,
000
Effect of size of training dataseta b
c d
Number of missensevariants in benign training set
20
25
30
35
0.8
0.85
0.9
0.95
1D
DD
cas
e ve
rsus
cont
rol −
log(
P v
alue
)
Cla
ssifi
catio
n ac
cura
cy fo
r10
,000
with
held
prim
ate
varia
nts
Effect of adding variants fromeach species to the training dataset
Cla
ssifi
catio
n ac
cura
cy fo
r10
,000
with
held
prim
ate
varia
nts
0.8
0.82
0.84
0.86
0.88
0.9
Human
Human
+ C
himp
Human
+ B
onob
o
Human
+ G
orilla
Human
+ O
rang
utan
Human
+ R
hesu
s
Human
+ M
arm
oset
Human
+ P
ig
Human
+ C
ow
Human
+ G
oat
Human
+ M
ouse
Effect of adding variants fromeach species to the training dataset
DD
D c
ase
vers
usco
ntro
l −lo
g(P
val
ue)
19
21
23
25
27
Human
Human
+ C
himp
Human
+ B
onob
o
Human
+ G
orilla
Human
+ O
rang
utan
Human
+ R
hesu
s
Human
+ M
arm
oset
Human
+ P
ig
Human
+ C
ow
Human
+ G
oat
Human
+ M
ouse
0 100 200 300 400 500
0.0
0.2
0.4
0.6
0.8
1.0
Saturation of human missensevariation with primate variation
Number of primate species sequenced
Fra
ctio
n of
hum
an m
isse
nse
varia
nts
pres
ent a
s a
com
mon
varia
nt in
a p
rimat
e sp
ecie
s
All trinucleotide contextsCpG contexts
Fig. 5 | impact of data used for training on classification accuracy. a, Deep learning networks trained with increasing numbers of primate and human common variants up to the full dataset (385,236 variants). Classification performance for each of the networks is benchmarked on accuracy for the 10,000 withheld primate variants (as in Fig. 3d) and de novo variants in DDD cases versus controls (as in Fig. 3f). b,c, Performance of networks trained using datasets consisting of 83,546 human common variants plus 23,380 variants from a single primate or mammal species. Results are shown for each network trained with different sources of common variation, benchmarked on 10,000 withheld primate variants (b), and on de novo missense variants (c) in DDD cases versus controls. d, Expected saturation of all possible human benign missense positions by identical-by-state common variants ( > 0.1%) in the 504 extant primate species. The y axis shows the fraction of human missense variants observed in at least one primate species, with CpG missense variants indicated in green, and all missense variants indicated in blue. To simulate the common variants in each primate species, we sampled from the set of all possible single nucleotide substitions with replacement, matching the trinucleotide context distribution observed for common human variants (> 0.1% allele frequency) in ExAC.
NAtuRe GeNeticS | www.nature.com/naturegenetics

ArticlesNaTUre GeNeTiCs
also use as their input the prediction scores of earlier classifiers that were trained on human curated databases. Objective benchmarking of the performance of these various methods has been elusive in the absence of an independent, bias-free truth dataset48.
Variation from the six non-human primates (chimpanzee, bonobo, gorilla, orangutan, rhesus, and marmoset) contributes over 300,000 unique missense variants that are non-overlapping with common human variation, and largely represent common variants of benign consequence that have been through the sieve of puri-fying selection, greatly enlarging the training dataset available for machine learning approaches. On average, each primate species contributes more variants than the whole of the ClinVar database (~42,000 missense variants as of November 2017, after excluding variants of uncertain significance and those with conflicting anno-tations). Additionally, this content is free from biases in human interpretation.
Using a dataset consisting of common human variants (AF > 0.1%) and primate variation (Supplementary Table 5), we trained a novel deep residual network, PrimateAI, which takes as input the amino acid sequence flanking the variant of interest and the orthologous sequence alignments in other species (Fig. 3a and Supplementary Fig. 4)49. Unlike existing classifiers that employ human-engineered features, our deep learning network learns to extract features directly from the primary sequence. To incorporate information about protein structure, we trained separate networks to predict the secondary structure and solvent accessibility from the sequence alone50,51, and then included these as subnetworks in the full model (Fig. 3b and Supplementary Fig. 5). Given the small number of human proteins that have been successfully crystallized, inferring structure from the primary sequence has the advantage of avoiding biases due to incomplete protein structure and functional domain annotation. The total depth of the network, with protein structure included, was 36 layers of convolutions, consisting of roughly 400,000 trainable parameters.
To train a classifier using only variants with benign labels, we framed the prediction problem as whether a given mutation is likely to be observed as a common variant in the population. Several factors
influence the probability of observing a variant at high allele fre-quencies, of which we are interested only in deleteriousness; other factors include mutation rate, technical artifacts such as sequencing coverage, and factors impacting neutral genetic drift such as gene conversion52. We matched each variant in the benign training set with a missense mutation that was absent in 123,136 exomes from the ExAC database, controlling for each of these confounding fac-tors, and trained the deep learning network to distinguish between benign variants and matched controls (Supplementary Fig. 6)14. As the number of unlabeled variants greatly exceeds the size of the labeled benign training dataset, we trained eight networks in parallel, each using a different set of unlabeled variants matched to the benign training dataset, to obtain a consensus prediction.
Using only the primary amino acid sequence as its input, the deep learning network accurately assigns high pathogenicity scores to residues at critical protein functional domains, as shown for the voltage-gated sodium channel SCN2A (Fig. 3c), a major disease gene in epilepsy, autism, and intellectual disability. The structure of SCN2A consists of four homologous repeats, each containing six transmembrane helixes (S1–S6)53,54. On membrane depolarization, the positively charged S4 transmembrane helix moves towards the extracellular side of the membrane, causing the S5/S6 pore-forming domains to open via the S4–S5 linker. Mutations in the S4, S4–S5 linker, and S5 domains, which are clinically associated with early onset epileptic encephalopathy55, are predicted by the network to have the highest pathogenicity scores in the gene, and are depleted for variants in the healthy population (Supplementary Table 6). We also found that the network recognizes important amino acid posi-tions within domains, and assigns the highest pathogenicity scores to mutations at these positions, such as the DNA-contacting resi-dues of transcription factors and the catalytic residues of enzymes (Supplementary Fig. 7). To better understand how the deep learn-ing network derives insights into protein structure and function from the primary sequence, we visualized the trainable parameters from the first three layers of the network. Within these layers, we observed that the network learns correlations between the weights of different amino acids that approximate existing measurements
Table 1 | Additional genes achieving genome-wide significance in intellectual disability when considering only missense de novo mutations (DNMs) with PrimateAi scores ≥0.803
HGNc symbol
Protein-truncating variants
Missense P value Phenotypic abnormalities observed in multiple individuals
PrimateAi score ≥ 0.803
All missense PrimateAi score ≥ 0.803
All missense
ACTL6B 0 3 3 1.5 × 10⁻⁷ 2.4 × 10⁻⁶ Microcephaly
EBF3 3 3 3 5.2 × 10⁻⁸ 5.4 × 10⁻⁶ Growth delay, eye abnormality, strabismus, ataxia
EFTUD2 2 4 4 1.5 × 10⁻⁷ 1.5 × 10⁻⁵ Microcephaly, low-set ears, microtia, choanal atresia
HECW2 1 8 8 2.8 × 10⁻¹⁰ 6.7 × 10⁻⁷ Seizures, myopathy, abnormal calvarium
KDM6A 2 3 3 2.3 × 10⁻⁷ 9.8 × 10⁻⁶ Eyelid, dental abnormalities, hypotonia
KIF5C 0 3 3 3.0 × 10⁻⁷ 2.8 × 10⁻⁶ Cerebral hypoplasia
MAP2K1 0 5 5 3.1 × 10⁻⁸ 2.7 × 10⁻⁶ Hypertelorism, low-set ears, polyhydramnois
PPP1CB 0 6 6 1.5 × 10⁻⁸ 1.6 × 10⁻⁶ Abnormality of the forehead, short stature
PRKD1 0 6 6 8.6 × 10⁻⁸ 1.7 × 10⁻⁵ Skin, digital, and cardiac abnormalities; sparse hair
SOX11 1 3 3 3.1 × 10⁻⁷ 2.4 × 10⁻⁵ Hypermetropia, nail hypoplasia
TBR1 4 4 4 1.3 × 10⁻¹⁰ 4.2 × 10⁻⁷ Autistic behavior
TLK2 3 5 5 4.7 × 10⁻⁹ 6.3 × 10⁻⁷ Nose, eyelid abnormalities, slanted palpebral fissure
TRIP12 6 2 4 1.4 × 10⁻⁷ 5.4 × 10⁻⁷ Joint laxity
U2AF2 0 4 4 2.6 × 10⁻⁷ 1.2 × 10⁻⁵ Seizures; eye, palatal, philtrum abnormalities
Counts of protein truncating and missense DNMs are provided. P values for gene enrichment are shown when the statistical test was run only with missense mutations with PrimateAI score ≥ 0.803, and when it was repeated for all missense mutations.
NAtuRe GeNeticS | www.nature.com/naturegenetics
Articles NaTUre GeNeTiCs
of amino acid distance such as Grantham score (Supplementary Fig. 8)56–58. The outputs of these initial layers become the inputs for later layers, enabling the deep learning network to construct pro-gressively higher order representations of the data59.
We compared the performance of our network with existing clas-sification algorithms, using 10,000 common primate variants that were withheld from training (Supplementary Data File 3). Because ~50% of all newly arising human missense variants are filtered by purifying selection at common allele frequencies (Fig. 1a), we deter-mined the 50th-percentile score for each classifier on a set of 10,000 randomly selected variants that were matched to the 10,000 common primate variants by mutational rate and sequencing coverage, and evaluated the accuracy of each classifier at that threshold (Fig. 3d, Supplementary Fig. 9a and Supplementary Data File 4). Our deep learning network (91% accuracy) surpassed the performance of other classifiers (80% accuracy for the next best model) at assigning benign consequence to the 10,000 withheld common primate variants. Roughly half the improvement over existing methods comes from using the deep learning network and half comes from augmenting the training dataset with primate variation, as compared to the accu-racy of the network trained with human variation data only (Fig. 3d).
To test the classification of variants of uncertain significance in a clinical scenario, we evaluated the ability of the deep learn-ing network to distinguish between de novo mutations occurring in patients with neurodevelopmental disorders versus healthy controls. By prevalence, neurodevelopmental disorders consti-tute one of the largest categories of rare genetic diseases60, and recent trio sequencing studies have implicated the central role of de novo missense and protein truncating mutations61–64. We classified each confidently called de novo missense variant in 4,293 affected individuals from the Deciphering Developmental Disorders (DDD) cohort65 versus de novo missense variants from 2,517 unaffected siblings in the Simon’s Simplex Collection (SSC) cohort66, and assessed the difference in prediction scores between the two distributions with the Wilcoxon rank-sum test (Fig. 3e and Supplementary Fig. 10). The deep learning network clearly
outperforms other classifiers on this task (P < 10−28; Fig. 3f and Supplementary Fig. 9b). Moreover, the performance of the various classifiers on the withheld primate variant dataset and the DDD cases versus controls dataset was correlated (Spearman ρ = 0.57, P < 0.01), indicating good agreement between the two datasets for evaluating pathogenicity, despite using entirely different sources and methodologies (Supplementary Fig. 11a).
We next sought to estimate the accuracy of the deep learning network at classifying benign versus pathogenic mutations within the same gene. Given that the DDD population largely consists of index cases of affected children without affected first degree rela-tives, it is essential to show that the classifier has not inflated its accuracy by favoring pathogenicity in genes with de novo domi-nant modes of inheritance. We restricted the analysis to 605 genes that were nominally significant for disease association in the DDD study, calculated from protein-truncating variation only (P < 0.05)65. Within these genes, de novo missense mutations are enriched 3/1 compared to expectation (Fig. 4a), indicating that ~67% are pathogenic. The deep learning network was able to dis-criminate pathogenic and benign de novo variants within the same set of genes (P < 10−15; Fig. 4b), outperforming other methods by a large margin (Fig. 4c and Supplementary Fig. 9c). At a binary cutoff of ≥ 0.803 (Fig. 4d and Supplementary Fig. 11b), 65% of de novo missense mutations in cases are classified by the deep learning net-work as pathogenic, compared to 14% of de novo missense muta-tions in controls, corresponding to a classification accuracy of 88% (Fig. 4e and Supplementary Fig. 11c). Given frequent incomplete penetrance and variable expressivity in neurodevelopmental disor-ders67, this figure probably underestimates the accuracy of our clas-sifier due to the inclusion of partially penetrant pathogenic variants in controls. We caution that data from a greater diversity of disease genes are needed before generalizing these conclusions out to all mendelian disorders.
Novel candidate gene discovery. Applying a threshold of ≥ 0.803 to stratify pathogenic missense mutations increases the enrichment of de novo missense mutations in DDD patients from 1.5-fold to 2.2-fold, close to protein-truncating mutations (2.5-fold), while relinquishing less than one-third of the total number of variants enriched above expectation. This substantially improves statistical power, enabling discovery of 14 additional candidate genes in intel-lectual disability, which had previously not reached the genome-wide significance threshold in the original DDD study (Table 1). Additional clinical validation will be necessary to confirm these candidates and understand the spectrum of their genotype–pheno-type relationships.
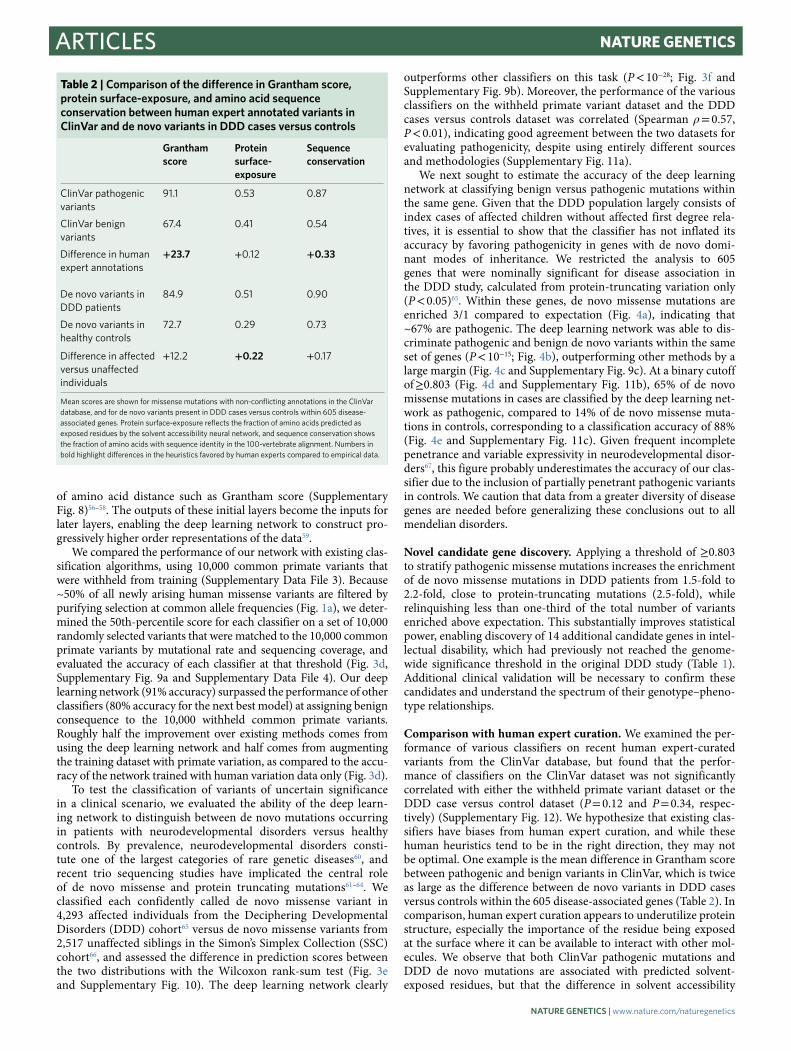
Comparison with human expert curation. We examined the per-formance of various classifiers on recent human expert-curated variants from the ClinVar database, but found that the perfor-mance of classifiers on the ClinVar dataset was not significantly correlated with either the withheld primate variant dataset or the DDD case versus control dataset (P = 0.12 and P = 0.34, respec-tively) (Supplementary Fig. 12). We hypothesize that existing clas-sifiers have biases from human expert curation, and while these human heuristics tend to be in the right direction, they may not be optimal. One example is the mean difference in Grantham score between pathogenic and benign variants in ClinVar, which is twice as large as the difference between de novo variants in DDD cases versus controls within the 605 disease-associated genes (Table 2). In comparison, human expert curation appears to underutilize protein structure, especially the importance of the residue being exposed at the surface where it can be available to interact with other mol-ecules. We observe that both ClinVar pathogenic mutations and DDD de novo mutations are associated with predicted solvent-exposed residues, but that the difference in solvent accessibility
Table 2 | comparison of the difference in Grantham score, protein surface-exposure, and amino acid sequence conservation between human expert annotated variants in clinVar and de novo variants in DDD cases versus controls
Grantham score
Protein surface-exposure
Sequence conservation
ClinVar pathogenic variants
91.1 0.53 0.87
ClinVar benign variants
67.4 0.41 0.54
Difference in human expert annotations
+23.7 + 0.12 +0.33
De novo variants in DDD patients
84.9 0.51 0.90
De novo variants in healthy controls
72.7 0.29 0.73
Difference in affected versus unaffected individuals
+ 12.2 +0.22 + 0.17
Mean scores are shown for missense mutations with non-conflicting annotations in the ClinVar database, and for de novo variants present in DDD cases versus controls within 605 disease-associated genes. Protein surface-exposure reflects the fraction of amino acids predicted as exposed residues by the solvent accessibility neural network, and sequence conservation shows the fraction of amino acids with sequence identity in the 100-vertebrate alignment. Numbers in bold highlight differences in the heuristics favored by human experts compared to empirical data.
NAtuRe GeNeticS | www.nature.com/naturegenetics
ArticlesNaTUre GeNeTiCs
between benign and pathogenic ClinVar variants is only half that seen for DDD cases versus controls. These findings are suggestive of ascertainment bias in favor of factors that are more straightforward for a human expert to interpret, such as Grantham score and con-servation. Machine learning classifiers trained on human curated databases would be expected to reinforce these tendencies.
DiscussionOur results suggest that systematic primate population sequencing is an effective strategy to classify the millions of human variants of uncertain significance that currently limit clinical genome interpre-tation. The accuracy of our deep learning network on both with-held common primate variants and clinical variants increases with the number of benign variants used to train the network (Fig. 5a). Moreover, training on variants from each of the six non-human pri-mate species independently contributes to an increase in the perfor-mance of the network (Fig. 5b,c), whereas training on variants from more distant mammals negatively impacts the performance of the network. These results support the assertion that common primate variants are largely benign in human with respect to penetrant men-delian disease, while the same cannot be said of variation in more distant species.
Although the number of non-human primate genomes exam-ined in this study is small compared to the number of human genomes and exomes that have been sequenced, it is important to note that these additional primates contribute a dispropor-tionate amount of information about common benign variation. Simulations with ExAC show that discovery of common human variants (> 0.1% allele frequency) plateaus quickly after only a few hundred individuals (Supplementary Fig. 13), and further healthy population sequencing into the millions mainly contributes addi-tional rare variants. Unlike common variants, which are known to be largely clinically benign based on allele frequency, rare vari-ants in healthy populations may cause recessive genetic diseases or dominant genetic diseases with incomplete penetrance. Because each primate species carries a different pool of common variants, sequencing several dozen members of each species is an effective strategy to systematically catalog benign missense variation in the primate lineage. Indeed, the 134 individuals from six non-human primate species examined in this study contribute nearly four times as many common missense variants as the 123,136 humans from the ExAC study (Supplementary Table 5). Primate population sequenc-ing studies involving hundreds of individuals may be practical even with the relatively small numbers of unrelated individuals residing in wildlife sanctuaries and zoos, thus minimizing the disturbance to wild populations, which is important from the standpoint of con-servation and ethical treatment of non-human primates.
Present-day human populations carry much lower genetic diver-sity than most non-human primate species68, with roughly half the number of single nucleotide variants per individual as chimpanzee, gorilla, and gibbon, and one-third as many variants per individual as orangutan18. Although genetic diversity levels for the majority of non-human primate species are not known, the large number of extant non-human primate species allows us to extrapolate that the majority of possible benign human missense positions are likely to be covered by a common variant in at least one primate species, enabling pathogenic variants to be systematically identified by the process of elimination (Fig. 5d). Even with only a subset of these species sequenced, increasing the training data size will enable more accurate prediction of missense consequence with machine learning. Finally, while our findings in this paper focus on missense variation, this strategy may also be applicable for inferring the con-sequences of non-coding variation, particularly in conserved regu-latory regions where there is sufficient alignment between human and primate genomes to unambiguously determine whether a vari-ant is identical-by-state.
Of the 504 known non-human primate species, roughly 60% face extinction due to poaching and widespread habitat loss69. The reduction in population size and potential extinction of these spe-cies represents an irreplaceable loss in genetic diversity, motivating urgency for a worldwide conservation effort that would benefit both these unique and irreplaceable species and our own.
URLs. Data downloaded from University of California Santa Cruz (UCSC) genome browser: http://hgdownload.soe.ucsc.edu/goldenPath/hg19/multiz100way/alignments/knownCanoni-cal.exonNuc.fa.gz, http://hgdownload.soe.ucsc.edu/goldenPath/hg19/multiz100way/hg19.100way.commonNames.nh; ExAC/gno-mAD data: http://gnomad.broadinstitute.org/; ClinVar database released on 02-Nov-2017: ftp://ftp.ncbi.nlm.nih.gov/pub/clinvar/clinvar_20171029.vcf.gz; dbNSFP: https://sites.google.com/site/jpopgen/dbNSFP; PrimateAI scores of 70 million variants: https://basespace.illumina.com/s/cPgCSmecvhb4.
MethodsMethods, including statements of data availability and any asso-ciated accession codes and references, are available at https://doi.org/10.1038/s41588-018-0167-z.
Received: 29 January 2018; Accepted: 29 May 2018; Published: xx xx xxxx
References 1. MacArthur, D. G. et al. Guidelines for investigating causality of sequence
variants in human disease. Nature 508, 469–476 (2014). 2. Rehm, H. L. et al. ClinGen- -the Clinical Genome Resource. N. Engl. J. Med.
372, 2235–2242 (2015). 3. Bamshad, M. J. et al. Exome sequencing as a tool for Mendelian disease gene
discovery. Nat. Rev. Genet. 12, 745–755 (2011). 4. Rehm, H. L. Evolving health care through personal genomics. Nat. Rev.
Genet. 18, 259–267 (2017). 5. Richards, S. et al. Standards and guidelines for the interpretation of sequence
variants: a joint consensus recommendation of the American College of Medical Genetics and Genomics and the Association for Molecular Pathology. Genet. Med. 17, 405–424 (2015).
6. Lek, M. et al. Analysis of protein-coding genetic variation in 60,706 humans. Nature 536, 285–291 (2016).
7. Mallick, S. et al. The Simons Genome Diversity Project: 300 genomes from 142 diverse populations. Nature 538, 201–206 (2016).
8. Genomes Project Consortium. et al. A global reference for human genetic variation. Nature 526, 68–74 (2015).
9. Liu, X., Jian, X. & Boerwinkle, E. dbNSFP: a lightweight database of human nonsynonymous SNPs and their functional predictions. Human. Mutat. 32, 894–899 (2011).
10. Chimpanzee Sequencing Analysis Consortium. Initial sequence of the chimpanzee genome and comparison with the human genome. Nature 437, 69–87 (2005).
11. Takahata, N. Allelic genealogy and human evolution. Mol. Biol. Evol. 10, 2–22 (1993).
12. Asthana, S., Schmidt, S., & Sunyaev, S. A limited role for balancing selection. Trends Genet. 21, 30–32 (2005).
13. Leffler, E. M. et al. Multiple instances of ancient balancing selection shared between humans and chimpanzees. Science 339, 1578–1582 (2013).
14. Samocha, K. E. et al. A framework for the interpretation of de novo mutation in human disease. Nat. Genet. 46, 944–950 (2014).
15. Ohta, T. Slightly deleterious mutant substitutions in evolution. Nature 246, 96–98 (1973).
16. Reich, D. E. & Lander, E. S. On the allelic spectrum of human disease. Trends Genet. 17, 502–510 (2001).
17. Whiffin, N. et al. Using high-resolution variant frequencies to empower clinical genome interpretation. Genet. Med. 19, 1151–1158 (2017).
18. Prado-Martinez, J. et al. Great ape genome diversity and population history. Nature 499, 471–475 (2013).
19. Klein, J., Satta, Y., O’HUigin, C., & Takahata, N. The molecular descent of the major histocompatibility complex. Annu. Rev. Immunol. 11, 269–295 (1993).
20. Kimura, M. The Neutral Theory of Molecular Evolution (Cambridge Univ. Press, Canbridge, UK, 1983).
21. de Manuel, M. et al. Chimpanzee genomic diversity reveals ancient admixture with bonobos. Science 354, 477–481 (2016).
NAtuRe GeNeticS | www.nature.com/naturegenetics

Articles NaTUre GeNeTiCs
22. Locke, D. P. et al. Comparative and demographic analysis of orang-utan genomes. Nature 469, 529–533 (2011).
23. Rhesus Macaque Genome Sequencing Analysis Consortium. Evolutionary and biomedical insights from the rhesus macaque genome. Science 316, 222–234 (2007).
24. Worley, K. C. et al. The common marmoset genome provides insight into primate biology and evolution. Nat. Genet. 46, 850–857 (2014).
25. Sherry, S. T. et al. dbSNP: the NCBI database of genetic variation. Nucleic Acids Res. 29, 308–311 (2001).
26. Schrago, C. G., & Russo, C. A. Timing the origin of New World monkeys. Mol. Biol. Evol. 20, 1620–1625 (2003).
27. Landrum, M. J. et al. ClinVar: public archive of interpretations of clinically relevant variants. Nucleic Acids Res. 44, D862–868 (2016).
28. Brandon, E. P., Idzerda, R. L. & McKnight, G. S. Targeting the mouse genome: a compendium of knockouts (Part II). Curr. Biol. 5, 758–765 (1995).
29. Lieschke, J. G. & Currie, P. D. Animal models of human disease: zebrafish swim into view. Nat. Rev. Genet. 8, 353–367 (2007).
30. Sittig, L. J. et al. Genetic background limits generalizability of genotype-phenotype relationships. Neuron 91, 1253–1259 (2016).
31. Bazykin, G. A. et al. Extensive parallelism in protein evolution. Biol. Direct 2, 20 (2007).
32. Ng, P. C., & Henikoff, S. Predicting deleterious amino acid substitutions. Genome Res. 11, 863–874 (2001).
33. Adzhubei, I. A. et al. A method and server for predicting damaging missense mutations. Nat. Methods 7, 248–249 (2010).
34. Chun, S. & Fay, J. C. Identification of deleterious mutations within three human genomes. Genome Res. 19, 1553–1561 (2009).
35. Schwarz, J. M., Rödelsperger, C., Schuelke, M. & Seelow, D. MutationTaster evaluates disease-causing potential of sequence alterations. Nat. Methods 7, 575–576 (2010).
36. Reva, B., Antipin, Y., & Sander, C. Predicting the functional impact of protein mutations: application to cancer genomics. Nucleic Acids Res. 39, e118 (2011).
37. Dong, C. et al. Comparison and integration of deleteriousness prediction methods for nonsynonymous SNVs in whole exome sequencing studies. Hum. Mol. Genet. 24, 2125–2137 (2015).
38. Carter, H., Douville, C., Stenson, P. D., Cooper, D. N., & Karchin, R. Identifying Mendelian disease genes with the variant effect scoring tool. BMC Genom. 14 Suppl 3, S3 (2013).
39. Choi, Y., Sims, G. E., Murphy, S., Miller, J. R., & Chan, A. P. Predicting the functional effect of amino acid substitutions and indels. PLoS One 7, e46688 (2012).
40. Gulko, B., Hubisz, M. J., Gronau, I., & Siepel, A. A method for calculating probabilities of fitness consequences for point mutations across the human genome. Nat. Genet. 47, 276–283 (2015).
41. Shihab, H. A. et al. An integrative approach to predicting the functional effects of non-coding and coding sequence variation. Bioinformatics 31, 1536–1543 (2015).
42. Quang, D., Chen, Y., & Xie, X. DANN: a deep learning approach for annotating the pathogenicity of genetic variants. Bioinformatics 31, 761–763 (2015).
43. Bell, C. J. et al. Comprehensive carrier testing for severe childhood recessive diseases by next generation sequencing. Sci. Transl. Med. 3, 65ra64 (2011).
44. Kircher, M. et al. A general framework for estimating the relative pathogenicity of human genetic variants. Nat. Genet. 46, 310–315 (2014).
45. Smedley, D. et al. A whole-genome analysis framework for effective identification of pathogenic regulatory variants in mendelian disease. Am. J. Hum. Genet. 99, 595–606 (2016).
46. Ioannidis, N. M. et al. REVEL: an ensemble method for predicting the pathogenicity of rare missense variants. Am. J. Hum. Genet. 99, 877–885 (2016).
47. Jagadeesh, K. A. et al. M-CAP eliminates a majority of variants of uncertain significance in clinical exomes at high sensitivity. Nat. Genet. 48, 1581–1586 (2016).
48. Grimm, D. G. The evaluation of tools used to predict the impact of missense variants is hindered by two types of circularity. Human. Mutat. 36, 513–523 (2015).
49. He, K., Zhang, X., Ren, S., & Sun, J. Deep residual learning for image recognition. in Proc. IEEE Conf. Comput. Vis. Pattern Recognit. 770–778 (2016).
50. Heffernan, R. et al. Improving prediction of secondary structure, local backbone angles, and solvent accessible surface area of proteins by iterative deep learning. Sci. Rep. 5, 11476 (2015).
51. Wang, S., Peng, J., Ma, J. & Xu, J. Protein secondary structure prediction using deep convolutional neural fields. Sci. Rep. 6, 18962–18962 (2016).
52. Harpak, A., Bhaskar, A., & Pritchard, J. K. Mutation rate variation is a primary determinant of the distribution of allele frequencies in humans. PLoS Genet. 12 e1006489 (2016).
53. Payandeh, J., Scheuer, T., Zheng, N. & Catterall, W. A. The crystal structure of a voltage-gated sodium channel. Nature 475, 353–358 (2011).
54. Shen, H. et al. Structure of a eukaryotic voltage-gated sodium channel at near-atomic resolution. Science 355, eaal4326 (2017).
55. Nakamura, K. et al. Clinical spectrum of SCN2A mutations expanding to Ohtahara syndrome. Neurology 81, 992–998 (2013).
56. Henikoff, S. & Henikoff, J. G. Amino acid substitution matrices from protein blocks. Proc. Natl. Acad. Sci. USA 89, 10915–10919 (1992).
57. Li, W. H., Wu, C. I. & Luo, C. C. Nonrandomness of point mutation as reflected in nucleotide substitutions in pseudogenes and its evolutionary implications. J. Molec. Evol. 21, 58–71 (1984).
58. Grantham, R. Amino acid difference formula to help explain protein evolution. Science 185, 862–864 (1974).
59. LeCun, Y., Bottou, L., Bengio, Y., & Haffner, P. Gradient based learning applied to document recognition. Proc. IEEE 86, 2278–2324 (1998).
60. Vissers, L. E., Gilissen, C., & Veltman, J. A. Genetic studies in intellectual disability and related disorders. Nat. Rev. Genet. 17, 9–18 (2016).
61. Neale, B. M. et al. Patterns and rates of exonic de novo mutations in autism spectrum disorders. Nature 485, 242–245 (2012).
62. Sanders, S. J. et al. De novo mutations revealed by whole-exome sequencing are strongly associated with autism. Nature 485, 237–241 (2012).
63. De Rubeis, S. et al. Synaptic, transcriptional and chromatin genes disrupted in autism. Nature 515, 209–215 (2014).
64. Deciphering Developmental Disorders Study. Large-scale discovery of novel genetic causes of developmental disorders. Nature 519, 223–228 (2015).
65. Deciphering Developmental Disorders Study. Prevalence and architecture of de novo mutations in developmental disorders. Nature 542, 433–438 (2017).
66. Iossifov, I. et al. The contribution of de novo coding mutations to autism spectrum disorder. Nature 515, 216–221 (2014).
67. Zhu, X., Need, A. C., Petrovski, S. & Goldstein, D. B. One gene, many neuropsychiatric disorders: lessons from Mendelian diseases. Nat. Neurosci. 17, 773–781, https://doi.org/10.1038/nn.3713 (2014).
68. Leffler, E. M. et al. Revisiting an old riddle: what determines genetic diversity levels within species? PLoS Biol. 10, e1001388 (2012).
69. Estrada, A. et al. Impending extinction crisis of the world’s primates: why primates matter. Sci. Adv. 3, e1600946 (2017).
AcknowledgementsThe authors would like to thank J. K. Pritchard, M. E. Hurles, J. W. Belmont, and R. E. Green for insightful discussions. The authors would like to thank the Genome Aggregation Database (gnomAD) and the groups that provided exome and genome variant data to this resource. A full list of contributing groups can be found at http://gnomad.broadinstitute.org/about. The DDD study presents independent research commissioned by the Health Innovation Challenge Fund (grant number HICF-1009-003), a parallel funding partnership between Wellcome and the Department of Health, and the Wellcome Sanger Institute (grant number WT098051). The views expressed in this publication are those of the authors and not necessarily those of Wellcome or the Department of Health. The study has UK Research Ethics Committee approval (10/H0305/83, granted by the Cambridge South REC, and GEN/284/12 granted by the Republic of Ireland REC). The research team acknowledges the support of the National Institute for Health Research, through the Comprehensive Clinical Research Network. L.S., S.R.P., Y.L. and X.L. were partially supported by R01GM110240 from the National Institute of General Medical Sciences and National Science Foundation (grant number CNS-1747783, CNS-1624782, and OAC-1229576).
Author contributionsK.K.F., L.S., H.G., S.R.P., and J.F.M. designed the study and wrote the manuscript. L.S., S.R.P., Y.L., N.F., J.H., A.D., J.S., J.X., S.B., X.L., and K.K.F. performed the deep learning analysis. H.G., J.F.M., L.S., S.R.P., J.A.K., and K.K.F. performed the genetics analysis. L.S. and H.G. are co-first authors.
competing interestsAuthors with Illumina affiliations were employees of Illumina, Inc., at the time of this work.
Additional informationSupplementary information is available for this paper at https://doi.org/10.1038/s41588-018-0167-z.
Reprints and permissions information is available at www.nature.com/reprints.
Correspondence and requests for materials should be addressed to K.K.-H.F.
Publisher’s note: Springer Nature remains neutral with regard to jurisdictional claims in published maps and institutional affiliations.
NAtuRe GeNeticS | www.nature.com/naturegenetics

ArticlesNaTUre GeNeTiCs
MethodsData generation and alignment. Coordinates in the paper refer to human genome build UCSC hg19/GRCh37, including the coordinates for variants in other species mapped to hg19 using multiple sequence alignments. Canonical transcripts for protein-coding DNA sequence and multiple sequence alignments of 99 vertebrate genomes and branch length were downloaded from the UCSC genome browser70,71 (see URLs).
We obtained human exome polymorphism data from the Exome Aggregation Consortium (ExAC)/Genome Aggregation Database (gnomAD exomes) v2.06 (see URLs). We obtained primate variation data from the great ape genome sequencing project18, which consisted of whole genome sequencing data and genotypes for 24 chimpanzees, 13 bonobos, 27 gorillas, and 10 orangutans. We also included variation from 35 chimpanzees from a separate study of chimpanzee and bonobos21, but because of differences in variant calling methodology, we excluded these from the population analysis, and used them only for training the deep learning model. In addition, 16 rhesus individuals and 9 marmoset individuals were used to assay variation in the original genome projects for these species, but individual-level information was not available23,24. We obtained variation data for rhesus, marmoset, pig, cow, goat, mouse, chicken, and zebrafish from dbSNP25. dbSNP also included additional orangutan variants, which we only used for training the deep learning model, since individual genotype information was not available for the population analysis. To avoid effects due to balancing selection, we also excluded variants from within the extended major histocompatability complex region (chr6: 28,477,797-33,448,354) for the population analysis.
We used the multiple species alignment of 99 vertebrates to ensure orthologous one-to-one mapping to human protein-coding regions and prevent mapping to pseudogenes. We accepted variants as identical-by-state if they occurred in either reference/alternative orientation. To ensure that the variant had the same predicted protein-coding consequence in both human and the other species, we required that the other two nucleotides in the codon were identical between the species, for both missense and synonymous variants. Polymorphisms from each species included in the analysis are listed in Supplementary Data File 1 and detailed metrics are shown in Supplementary Table 1.
For each of the four allele frequency categories (Fig. 1a), we used variation in intronic regions to estimate the expected number of synonymous and missense variants in each of 96 possible trinucleotide contexts and correct for mutational rate (Supplementary Fig. 1 and Supplementary Tables 7,8). We also separately analyzed identical-by-state CpG dinucleotide and non-CpG dinucleotide variants, and verified that the missense/synonymous ratio was flat across the allele frequency spectrum for both classes, indicating that our analysis holds for both CpG and non-CpG variants, despite the large difference in their mutation rate (Supplementary Fig. 2 and Supplementary Note).
Depletion of human missense variants that are identical-by-state with polymorphisms in other species. To evaluate whether variants present in other species would be tolerated at common allele frequencies (> 0.1%) in human, we identified human variants that were identical-by-state with variation in the other species. For each of the variants, we assigned them to one of the four categories based on their allele frequencies in human populations (singleton, more than singleton ~0.01%, 0.01% to ~0.1%, > 0.1%), and estimated the decrease in missense/synonymous ratios (MSR) between the rare (< 0.1%) and common (> 0.1%) variants. The depletion of identical-by-state missense variants at common human allele frequencies (> 0.1%) indicates the fraction of variants from the other species that are sufficiently deleterious that they would be filtered out by natural selection at common allele frequencies in human:
=−
% depletionMSR MSR
MSRrare comm
rare
The missense/synonymous ratios and the percentages of depletion were computed per species and are shown in Fig. 2b and Supplementary Table 2. In addition, for chimpanzee common variants (Fig. 1b), chimpanzee singleton variants (Fig. 1c), and mammal variants (Fig. 2a), we performed the χ 2 test of homogeneity on the 2× 2 contingency table to test if the differences in missense/synonymous ratios between rare and common variants were significant.
Because sequencing was only performed on limited numbers of individuals from the great ape genome project, we used the human allele frequency spectrum from ExAC to estimate the fraction of sampled variants that were rare (< 0.1%) or common (> 0.1%) in the general chimpanzee population. We sampled a cohort of 24 humans based on the ExAC allele frequencies and identified missense variants that were observed either once, or more than once, in this cohort. Variants that were observed more than once had a 99.8% chance of being common (> 0.1%) in the general population, whereas variants that were observed only once in the cohort had a 69% chance of being common in the general population.
To verify that the observed depletion for missense variants in more distant mammals was not due to a confounding effect of genes that are better conserved, and hence more accurately aligned, we repeated the above analysis, restricting only to genes with > 50% average nucleotide identity in the multiple sequence alignment of 11 primates and 50 mammals compared with human (see Supplementary Table 3).
This removed ~7% of human protein-coding genes from the analysis, without substantially affecting the results. Additionally, to ensure that our results were not affected by issues with variant calling, or domestication artifacts (since most of the species selected from dbSNP were domesticated), we repeated the analyses using fixed substitutions from pairs of closely related species in lieu of intra-species polymorphisms (Fig. 2d, Supplementary Table 4, Supplementary Note, and Supplementary Data File 2).
ClinVar analysis of polymorphism data for human, primates, mammals, and other vertebrates. To examine the clinical impact of variants that are identical-by-state with other species, we downloaded the the ClinVar database (see URLs)27, excluding those variants that had conflicting annotations of pathogenicity or were only labeled as variants of uncertain significance. Following the filtering steps shown in Supplementary Table 9, there are a total of 24,853 missense variants in the pathogenic category and 17,775 missense variants in the benign category.
We counted the number of pathogenic and benign ClinVar variants that were identical-by-state with variation in humans, non-human primates, mammals, and other vertebrates. For human, we simulated a cohort of 30 humans, sampled from ExAC allele frequencies. The numbers of benign and pathogenic variants for each species are shown in Supplementary Table 10.
Generation of benign and unlabeled variants for model training. We constructed a benign training dataset of largely common benign missense variants from human and non-human primates for machine learning. The dataset consisted of common human variants (> 0.1% allele frequency; 83,546 variants), and variants from chimpanzee, bonobo, gorilla, and orangutan, rhesus, and marmoset (301,690 unique primate variants). The number of benign training variants contributed by each source is shown in Supplementary Table 5.
We trained the deep learning network to discriminate between a set of labeled benign variants and an unlabeled set of variants that were matched to control for trinucleotide context, sequencing coverage, and alignability between the species and human. To obtain an unlabeled training dataset, we started with all possible missense variants in canonical coding regions. We excluded variants that were observed in the 123,136 exomes from ExAC, and variants in start or stop codons. In total, 68,258,623 unlabeled missense variants were generated. This was filtered to correct for regions of poor sequencing coverage, and regions where there was not a one-to-one alignment between human and primate genomes when selecting matched unlabeled variants for the primate variants. We obtained a consensus prediction by training eight models that use the same set of labeled benign variants and eight randomly sampled sets of unlabeled variants, and taking the average of their predictions. We also set aside two randomly sampled sets of 10,000 primate variants for validation and testing, which we withheld from training (Supplementary Data File 3). For each of these sets, we sampled 10,000 unlabeled variants that were matched by trinucleotide context, which we used to normalize the threshold of each classifier when comparing between different classification algorithms (Supplementary Data File 4).
We assessed the classification accuracy of two versions of the deep learning network, one trained with common human variants only, and one trained with the full benign labeled dataset including both common human variants and primate variants.
Architecture of the deep learning network. For each variant, the pathogenicity prediction network takes as input the 51-length amino acid sequence centered at the variant of interest, and the outputs of the secondary structure and solvent accessibility networks (Fig. 3a and Supplementary Fig. 4) with the missense variant substituted in at the central position. Three 51-length position frequency matrices are generated from multiple sequence alignments of 99 vertebrates, including one for 11 primates, one for 50 mammals excluding primates, and one for 38 vertebrates excluding primates and mammals.
The secondary structure deep learning network predicts a three-state secondary structure at each amino acid position: alpha helix (H), beta sheet (B), and coils (C) (Supplementary Table 11). The solvent accessibility network predicts a three-state solvent accessibility at each amino acid position: buried (B), intermediate (I), and exposed (E) (Supplementary Table 12). Both networks only take the flanking amino acid sequence as their inputs, and were trained using labels from known non-redundant crystal structures in the Protein DataBank (Supplementary Note and Supplementary Table 13). For the input to the pre-trained three-state secondary structure and three-state solvent accessibility networks, we used a single length position frequency matrix generated from the multiple sequence alignments for all 99 vertebrates, also with length 51 and depth 20. After pre-training the networks on known crystal structures from the Protein DataBank, the final two layers for the secondary structure and solvent models were removed and the output of the network was directly connected to the input of the pathogenicity model. The best testing accuracy achieved for the three-state secondary structure prediction model was 79.86% (Supplementary Table 14). There was no substantial difference when comparing the predictions of the neural network when using DSSP-annotated (Define Secondary Structure of Proteins)72,73 structure labels for the approximately ~4,000 human proteins that had crystal structures versus using predicted structure labels only (Supplementary Table 15).
NAtuRe GeNeticS | www.nature.com/naturegenetics

Articles NaTUre GeNeTiCs
Both our deep learning network for pathogenicity prediction (PrimateAI) and deep learning networks for predicting secondary structure and solvent accessibility adopted the architecture of residual blocks49,74. The detailed architecture for PrimateAI is described in Supplementary Fig. 4 and Supplementary Table 16. The detailed architecture for the networks for predicting secondary structure and solvent accessibility is described in Supplementary Fig. 5 and Supplementary Tables 11 and 12.
Benchmarking of classifier performance on a withheld test set of 10,000 primate variants. We used the 10,000 withheld primate variants in the test dataset to benchmark the deep learning network as well as the other 20 previously published classifiers32–39,41,42,44,46,47,75–79, for which we obtained prediction scores from the database dbNSFP80 (see URLs). The performance for each of the classifiers on the 10,000 withheld primate variant test set is provided in Supplementary Fig. 9a. Because the different classifiers had widely varying score distributions, we used 10,000 randomly selected unlabeled variants that were matched to the test set by trinucleotide context to identify the 50th percentile threshold for each classifier. We benchmarked each classifier on the fraction of variants in the 10,000 withheld primate variant test set that were classified as benign at the 50th percentile threshold for that classifier, to ensure fair comparison between the methods.
For each of the classifiers, the fraction of withheld primate test variants predicted as benign using the 50th percentile threshold is shown in Supplementary Fig. 9a and Supplementary Table 17. We also show that the performance of PrimateAI is robust with respect to the number of aligned species at the variant position, and generally performs well as long as sufficient conservation information from mammals is available, which is true for most protein-coding sequence (Supplementary Fig. 14).
Analysis of de novo variants from the DDD study. We obtained published de novo variants from the DDD study64,65, and de novo variants from the healthy sibling controls in the SSC autism study66. The DDD study provides a confidence level for de novo variants, and we excluded variants from the DDD dataset with a threshold of < 0.1 as potential false positives due to variant calling errors. In total, we had 3,512 missense de novo variants from DDD affected individuals and 1,208 missense de novo variants from healthy controls. The canonical transcript annotations used by UCSC for the 99-vertebrate multiple-sequence alignment differed slightly from the transcript annotations used by DDD, resulting in a small difference in the total counts of missense variants. We evaluated the classification methods on their ability to discriminate between de novo missense variants in the DDD affected individuals versus de novo missense variants in unaffected sibling controls from the autism studies. For each classifier, we reported the P value from the Wilcoxon rank-sum test of the difference between the prediction scores for the two distributions (Supplementary Fig. 9b,c and Supplementary Table 17).
To measure the accuracy of various classifiers at distinguishing benign and pathogenic variation within the same disease gene, we repeated the analysis on a subset of 605 genes that were enriched for de novo protein-truncating variation in the DDD cohort (P < 0.05, Poisson exact test) (Supplementary Table 18). Within these 605 genes, we estimated that two-thirds of the de novo variants in the DDD dataset were pathogenic and one-third were benign, based on the 3/1 enrichment of de novo missense mutations over expectation. We assumed minimal incomplete penetrance and that the de novo missense mutations in the healthy controls were benign. For each classifier, we identified the threshold that produced the same number of benign or pathogenic predictions as the empirical proportions observed in these datasets, and used this threshold as a binary cutoff to estimate the accuracy of each classifier at distinguishing de novo mutations in cases versus controls.
To construct a receiver operator characteristics curve, we treated pathogenic classification of de novo DDD variants as true positive calls, and treated classification of de novo variants in healthy controls as pathogenic as being false positive calls. Because the DDD dataset contains one-third benign de novo variants, the area under the curve (AUC) for a theoretically perfect classifier is less than one81. Hence, a classifier with perfect separation of benign and pathogenic variants would classify 67% of de novo variants in the DDD patients as true positives, 33% of de novo variants in the DDD patients as false negatives, and 100% of de novo variants in controls as true negatives, yielding a maximum possible AUC of 0.837 (Supplementary Fig. 10, Supplementary Table 19, and Supplementary Note).
Novel candidate gene discovery. We tested enrichment of de novo mutations in genes by comparing the observed number of de novo mutations to the number expected under a null mutation model14. We repeated the enrichment analysis performed in the DDD study, and report genes that are newly genome-wide significant when only counting de novo missense mutations with a PrimateAI score of > 0.803. We adjusted the genome-wide expectation for de novo damaging missense variation by the fraction of missense variants that meet the PrimateAI threshold of > 0.803 (roughly one-fifth of all possible missense mutations genome-wide). As per the DDD study, each gene required four tests, one testing protein truncating enrichment and one testing enrichment of protein-altering de novo mutations, and both tested for just the DDD cohort65 and for a larger meta-analysis of neurodevelopmental trio sequencing cohorts62,63,66,82–89. The enrichment
of protein-altering de novo mutations was combined by Fisher’s method with a test of the clustering of missense de novo mutations within the coding sequence (Supplementary Tables 20, 21). The P value for each gene was taken from the minimum of the four tests, and genome-wide significance was determined as P < 6.757 × 10⁻⁷ (α = 0.05, 18,500 genes with four tests).
ClinVar classification accuracy. Since most of the existing classifiers are either trained directly or indirectly on ClinVar content, such as using prediction scores from classifiers that are trained on ClinVar, we limited analysis of the ClinVar dataset so that we only used ClinVar variants that had been added since 2017. There was substantial overlap among the recent ClinVar variants and other databases, and hence we further filtered to remove variants found at common allele frequencies (> 0.1%) in ExAC, or present in HGMD (Human Gene Mutation Database), LOVD (Leiden Open Variation Database), or Uniprot (Universal Protein Resource)90–92. After excluding variants annotated only as uncertain significance and those with conflicting annotations, we were left with 177 missense variants with benign annotation and 969 missense variants with pathogenic annotation. We scored these ClinVar variants using both the deep learning network and the other classification methods. For each classifier, we identified the threshold that produced the same number of benign or pathogenic predictions as the empirical proportions observed in these datasets, and used this threshold as a binary cutoff to estimate the accuracy of each classifier (Supplementary Fig. 12).
Impact of increasing training data size and using different sources of training data. To evaluate the impact of training data size on the performance of the deep learning network, we randomly sampled a subset of variants from the labeled benign training set of 385,236 primate and common human variants, and kept the underlying deep learning network architecture the same. To show that variants from each individual primate species contributes to classification accuracy whereas variants from each individual mammal species lower classification accuracy, we trained deep learning networks using a training dataset consisting of 83,546 human variants plus a constant number of randomly selected variants for each species, again keeping the underlying network architecture the same. The constant number of variants we added to the training set (23,380) was the total number of variants available in the species with the lowest number of missense variants, i.e. bonobo. We repeated the training procedures five times to get the median performance of each classifier.
Saturation of all possible human missense mutations with increasing number of primate populations sequenced. We investigated the expected saturation of all ~70 million possible human missense mutations by common variants present in the 504 extant primate species, by simulating variants based on the trinucleotide context of human common missense variants (> 0.1% allele frequency) observed in ExAC. For each primate species, we simulated four times the number of common missense variants observed in human (~83,500 missense variants with allele frequency > 0.1%), because humans have roughly half the number of variants per individual as other primate species13, and about ~50% of human missense variants have been filtered out by purifying selection at > 0.1% allele frequency (Fig. 1a and Supplementary Note).
To model the fraction of human common missense variants (> 0.1% allele frequency) discovered with increasing size of human cohorts surveyed (Supplementary Fig. 13), we sampled genotypes according to ExAC allele frequencies and report the fraction of common variants that were observed at least once in these simulated cohorts.
Data and code availability. Prediction scores for all ~70 million human missense variants on the hg19/GRCh37 genome build with the human + primate deep learning network (PrimateAI) are publicly hosted (https://basespace.illumina.com/s/cPgCSmecvhb4). For practical application of PrimateAI scores, we recommend a threshold of > 0.8 for likely pathogenic classification, < 0.6 for likely benign, and 0.6–0.8 as intermediate in genes with dominant modes of inheritance, on the basis of the enrichment of de novo variants in cases as compared to controls (Fig. 3d), and a threshold of > 0.7 for likely pathogenic and < 0.5 for likely benign in genes with recessive modes of inheritance.
To reduce problems with circularity that have become a concern for the field, the authors explicitly request that the prediction scores from the method are not incorporated as a component of other classifiers and instead ask that interested parties employ the provided source code and data to directly train and improve on their own deep learning models. Similarly, the authors request that the 10,000 withheld primate variants (Supplementary Data 3) are not used for training future classifiers, to provide the community with an independent truth dataset for benchmarking.
References 70. Kent, W. J. et al. The human genome browser at UCSC. Genome Res. 12,
996–1006 (2002). 71. Tyner, C. et al. The UCSC Genome Browser database: 2017 update. Nucleic
Acids Res. 45, D626–D634 (2017).
NAtuRe GeNeticS | www.nature.com/naturegenetics
ArticlesNaTUre GeNeTiCs
72. Kabsch, W., & Sander, C. Dictionary of protein secondary structure: pattern recognition of hydrogen-bonded and geometrical features. Biopolymers 22, 2577–2637 (1983).
73. Joosten, R. P. et al. A series of PDB related databases for everyday needs. Nucleic Acids Res. 39, D411–419 (2011).
74. He, K., Zhang, X., Ren, S., & Sun, J. Identity mappings in deep residual networks. in 14th European Conference on Computer Vision – ECCV 2016. ECCV 2016. Lecture Notes in Computer Science, vol 9908; 630–645 (Springer, Cham, Switzerland; 2016).
75. Ionita-Laza, I., McCallum, K., Xu, B., & Buxbaum, J. D. A spectral approach integrating functional genomic annotations for coding and noncoding variants. Nat. Genet. 48, 214–220 (2016).
76. Li, B. et al. Automated inference of molecular mechanisms of disease from amino acid substitutions. Bioinformatics 25, 2744–2750 (2009).
77. Lu, Q. et al. A statistical framework to predict functional non-coding regions in the human genome through integrated analysis of annotation data. Sci. Rep. 5, 10576 (2015).
78. Shihab, H. A. et al. Predicting the functional, molecular, and phenotypic consequences of amino acid substitutions using hidden Markov models. Human. Mutat. 34, 57–65 (2013).
79. Davydov, E. V. et al. Identifying a high fraction of the human genome to be under selective constraint using GERP+ + . PLoS Comput. Biol. 6, e1001025 (2010).
80. Liu, X., Wu, C., Li, C., & Boerwinkle, E. dbNSFPv3.0: a one-stop database of functional predictions and annotations for human nonsynonymous and splice-site SNVs. Human. Mutat. 37, 235–241 (2016).
81. Jain, S., White, M., Radivojac, P. Recovering true classifier performance in positive-unlabeled learning. in Proceedings Thirty-First AAAI Conference on Artificial Intelligence. 2066–2072 (AAAI Press, San Francisco; 2017).
82. de Ligt, J. et al. Diagnostic exome sequencing in persons with severe intellectual disability. N. Engl. J. Med. 367, 1921–1929 (2012).
83. Iossifov, I. et al. De novo gene disruptions in children on the autistic spectrum. Neuron 74, 285–299 (2012).
84. O’Roak, B. J. et al. Sporadic autism exomes reveal a highly interconnected protein network of de novo mutations. Nature 485, 246–250 (2012).
85. Rauch, A. et al. Range of genetic mutations associated with severe non-syndromic sporadic intellectual disability: an exome sequencing study. Lancet 380, 1674–1682 (2012).
86. Epi, K. C. et al. De novo mutations in epileptic encephalopathies. Nature 501, 217–221 (2013).
87. EuroEPINOMICS-RES Consortium, Epilepsy Phenome/Genome Project, Epi4K Consortium. De novo mutations in synaptic transmission genes including DNM1 cause epileptic encephalopathies. Am. J. Hum. Genet. 95, 360–370 (2014).
88. Gilissen, C. et al. Genome sequencing identifies major causes of severe intellectual disability. Nature 511, 344–347 (2014).
89. Lelieveld, S. H. et al. Meta-analysis of 2,104 trios provides support for 10 new genes for intellectual disability. Nat. Neurosci. 19, 1194–1196 (2016).
90. Famiglietti, M. L. et al. Genetic variations and diseases in UniProtKB/Swiss-Prot: the ins and outs of expert manual curation. Human. Mutat. 35, 927–935 (2014).
91. Horaitis, O., Talbot, C. C.Jr., Phommarinh, M., Phillips, K. M., & Cotton, R. G. A database of locus-specific databases. Nat. Genet. 39, 425 (2007).
92. Stenson, P. D. et al. The Human Gene Mutation Database: building a comprehensive mutation repository for clinical and molecular genetics, diagnostic testing and personalized genomic medicine. Hum. Genet. 133, 1–9 (2014).
NAtuRe GeNeticS | www.nature.com/naturegenetics

1
nature research | reporting summ
aryApril 2018
Corresponding author(s): Kyle Kai-How Farh
Reporting SummaryNature Research wishes to improve the reproducibility of the work that we publish. This form provides structure for consistency and transparency in reporting. For further information on Nature Research policies, see Authors & Referees and the Editorial Policy Checklist.
Statistical parametersWhen statistical analyses are reported, confirm that the following items are present in the relevant location (e.g. figure legend, table legend, main text, or Methods section).
n/a Confirmed
The exact sample size (n) for each experimental group/condition, given as a discrete number and unit of measurement
An indication of whether measurements were taken from distinct samples or whether the same sample was measured repeatedly
The statistical test(s) used AND whether they are one- or two-sided Only common tests should be described solely by name; describe more complex techniques in the Methods section.
A description of all covariates tested
A description of any assumptions or corrections, such as tests of normality and adjustment for multiple comparisons
A full description of the statistics including central tendency (e.g. means) or other basic estimates (e.g. regression coefficient) AND variation (e.g. standard deviation) or associated estimates of uncertainty (e.g. confidence intervals)
For null hypothesis testing, the test statistic (e.g. F, t, r) with confidence intervals, effect sizes, degrees of freedom and P value noted Give P values as exact values whenever suitable.
For Bayesian analysis, information on the choice of priors and Markov chain Monte Carlo settings
For hierarchical and complex designs, identification of the appropriate level for tests and full reporting of outcomes
Estimates of effect sizes (e.g. Cohen's d, Pearson's r), indicating how they were calculated
Clearly defined error bars State explicitly what error bars represent (e.g. SD, SE, CI)
Our web collection on statistics for biologists may be useful.
Software and codePolicy information about availability of computer code
Data collection Custom software and data used for the paper are publicly hosted.
Data analysis Python v2.7.13, Keras v2.0.5, Tensorflow v1.2.0
For manuscripts utilizing custom algorithms or software that are central to the research but not yet described in published literature, software must be made available to editors/reviewers upon request. We strongly encourage code deposition in a community repository (e.g. GitHub). See the Nature Research guidelines for submitting code & software for further information.
DataPolicy information about availability of data
All manuscripts must include a data availability statement. This statement should provide the following information, where applicable: - Accession codes, unique identifiers, or web links for publicly available datasets - A list of figures that have associated raw data - A description of any restrictions on data availability
We have included a data availability statement with the manuscript, which provides the raw data, source code, and prediction scores for all 70M human missense variants on the hg19 / GRCh37 genome build with the deep learning network (PrimateDL) at: https://basespace.illumina.com/s/cPgCSmecvhb4.

2
nature research | reporting summ
aryApril 2018
Field-specific reportingPlease select the best fit for your research. If you are not sure, read the appropriate sections before making your selection.
Life sciences Behavioural & social sciences Ecological, evolutionary & environmental sciences
For a reference copy of the document with all sections, see nature.com/authors/policies/ReportingSummary-flat.pdf
Life sciences study designAll studies must disclose on these points even when the disclosure is negative.
Sample size N/A
Data exclusions N/A
Replication Methods are laid out to be precisely reproducible. For convenience, intermediate results are provided as supplementary tables. Source code is provided.
Randomization N/A
Blinding N/A
Reporting for specific materials, systems and methods
Materials & experimental systemsn/a Involved in the study
Unique biological materials
Antibodies
Eukaryotic cell lines
Palaeontology
Animals and other organisms
Human research participants
Methodsn/a Involved in the study
ChIP-seq
Flow cytometry
MRI-based neuroimaging