predicting plant species diversity in a longleaf pine ... · pdf filepredicting plant species...
TRANSCRIPT
Predicting plant species diversity in a longleaf pine landscape'
L. Katherine KIRKMAN*, P. Charles GOEBEL~ & Brian J. PALIK~, Jt)scpl~ W. Jones Ecologicill Rcsearclr Ccntcr, Routc 2, &)x 2324, Newton, Gcorpi;~ 30870. IJ .S. A., e-niail: kkirkrna~l@jorwsc~r.org
Larry T. WEST. Departl\lcnl of Crop awl Soil Science, U~iiversity of Gcorgia, Atlw~a, (korgiit 3M42. U .S.A.
Absrrrrc?: In this study, we uscd a hierarchical, multifactor ecological classification system lo emtnine how spatial patterns of biodiversity develop in onc of the most spccics-rich ecosystems in North America, the fire-maintained longleaf pine-wiregrass ecosystem and asscxiatcd depressional wetlands and riparian forests. Our goal was to determine which landscape features iirc inlportimt controls on species richncss, to establish how thcse constraints are expressed at different lcvcls of organization, and lo idcntify hotspots of biological diversity for a pariicular locality. We examine the following questions: I) I-low is the variancc in patterns of plant species richness and diversity partitioned at different scales, or classification units, of the liierarchical ecosystem classification developed for the study area? 2) What are the comp<)sitional siniilaritics among ecosystem types? 3) For our study area, what are the sites expected to harbour highest species richncss? We uscd a spatially explicit map of biodiversity to project abundance of species-rich communities in the laiwlscapc based on a previously developed ecological classification system for a lower Gulf Coastal Plain landscape. The data indicate that high species richness in this ecosystem was found in sites with frequent fire and high soil moisture. Sites in fire-maintained landscapes wit11 lower frequency of fire were associated with geomorphological characteristics, suggesting a depenclcnce of the diversity-disturbance relationship with soil type. With more frequent fire on some sites, high diversity sllifts from canopy component to ground flora, with an overall increase in total species richness. Our approach dernonstratcs how poteritiitl specics richness can be identified as a restoration goal and that multiple vegetation endpoints may be approprialc vegetation objectives. We identify basic management needs for the maintenance of biodiversity in this ecosystem that can he derived from an understanding of the combination of factors that most strongly predict diverse plant communities. Kqvrru>rds: benchmark sitc, biorlivcrsity, fire, longleaf pine, reference site, restoration. species richness.
Rksrlmi : Nous avons utilisi: un sys&nte dc classification 6cologique hZrarchique ii facteurs n~ultipks pour vCrifier comment se d6gi1gent Ics patrons spatiaux cle hidiversit6 dans un &osy&me nord-amkricain parliculi&rement riche en es@ces. Nous nous sonlmes dotr concentr6s sur les for6ts cktires de pins des marais et dlaristi&s assujetties ii un cycle de feux ainsi qu'aux ~i~ilieux humides a s w i b que I'on trouve dans les dkpressions et aux for6t.s rivemines avoisinantes. Nous voulions ccrncr quclles sola les caractkristiques du paysage qui influencent la richesse en e@s. ddenniner comment ces caritbistiques s'cxpriment A diff6rents niveaux d'organisation et identifier les points cliauds de diversit6 biologique au scin d'unc r6gion. Dins cette Ctude, nous avons tent6 de rdpondrc aux questions suivantcs : 1) Comment la variance des patrons de ricliessc en es$ccs et de diversit6 se partage-t-elle selon differentes 6chelles ou selon les diverses unit& de classenicnl &finics par la chssification hiirarchiquc? 2) Quelles son1 les sinlilitudes dans la composition des diffbrents types d'6cosyst~mes? 3) Dills InMre aire d'etude. quels wnt les sites susceptibles d'avoir une richesse en e+s particulPrcment C.lcv6e? Nous avons utilise une carte dc biodivemi3 pour extrapoler dans Ic paysage I'abonda~re des communaut6s riches en esp&ccs, cette ahondance Ctant bake sur un syst&me ant6rieur & classification kologique dCvelopp6 pour un paysage des plaines cc^,ti&res du golfe. Selon les dondes, dans cet &osyst&me, les sites riches en esp5ces sont ceux oii les feux solit frCquents et oh I'humiditC du sol est Clcv&. Les sites qui se tmuvent dans les paysages assujettis ii des feux moins fr6quents son1 a s ~ x i b A certaines caractkristiques gihmorphologiques, ce qui sugg&re ['existence d'une d6pendance entre la rclation divcrsi3-perturbation el le type de sol. Dans les sites 05 les feux sont particul2rement frequents, la diversite la plus blevk se trouve non plus dans la voQte foresti&re, mais plutbt au niveau du sol. On y observe Cgalement, de f ~ o n gk>bale, un plus grand no~iibre d'espkces. Ndre approchc montre que la determination de la richesse potenlielle en csp&ces d'un site p u t scrvir ii d6finir des objectifs de restauration. Dans ce travail, nous identifions les mesures d'amCnagement niininlalcs qui devraient &re appliqu6es pour maintenir la bidiversit6 d'un Ccosyst&me griice A la compr~hcnsion d'une con~binaison de facteurs qui sont particuli&remcnt utiles pour pr6dire la diversitf des communautCs vCgCtalcs cn prCsence. Mors-c1k.v : biodiversit6, feu, pins des marais, restauration, richesse en csptkes, site de reference.
'Rcc. 2002-o9-M: ;~cc. 2(M).1-(r& 17. A ~ u ~ i i ~ t c Editor: D,lvnl Curric.
Introduction 'Autln)r libr C ~ B I . ~ C ~ ~ I ~ C I X C . Predictive modeling is a relevant tool for manage- 'Prcscl)~ ;~cldrcss: Scluwl of Natu~ll Rcsourccs, OARDC, TIE Oi~io State University.
1680 M;*lisol~ Avcnuc. Wtw)srcr, Ohio 4401 -4096. 1I.S.A. ment planning and conservation prioritization when it can "rescnl ;~clclrcss: I1.S. Dcp;tr;lrlt~ic~lt ol. Agriculture Forest Scrvicc, Nortl~ Central be applied to a specific locality (Kerr* 1996). A key to Rcse;lrcl~ Station. 1831 IIigIiw;ty 169 E. GIXIMI Rapids, Minnesota 55744, U.S.A. predicting sites of high species richness at a scale relevant
for miinagcnlcnt is to identify environmental correlates and their relationships to landscape hierarcllies (Palik el crl., 2000). Although an understanding of the basic factors controlling spccics richness is an obvious need in the" tlcvclopr~lcrit of broad-scale strategic plans, it is through r tic integration of gcoreferenced enviro~lnlental correlates of sixties richncss that extrapolation at a scale useful for miinilgcmcnt occurs. Based on the environmental parame- tcrs associated with high species richness, areas that har- bour high 11i11nbers of species can be predicted (Dumortier
(11. , 2002). Predictions of geographic patterns in plant species
tliversity require kriowledge of mu1 ti-scale variation in richness (Wiens, 1989; White & Walker, 1997). Most cnipirici~l stndies of bicdiversily have focused on fine-scale investigations of complex environniental gradients at sin- glc sites or linlited spatial scales (see review in Huston, 1994) or brc~ad-scale biogeographical studies (Glenn-Lewin, 1977; Curric & Paquin, 1987; Currie, 1991). Few studies Ilave exanlirlcd scales of environmental variation on plant diversity in a landscape (Heikkinen, 1996; Jobbagy, P;lnieIo 8L Ixon, 1996; Pollock, Nairnan & Hanley, 1998; 1-lutcllinson ut rrl., 1999; Chipman & Johnson, 2002). Lrtndscape rnodels of species diversity-environmental rela- tionships are needed to dcvelop conceptual frameworks for identifying appropriate reference conditions for natural arca resloration, and for the management of these ecosys- tems. This is particularly true in species-rich landscapes, where nlaintcnance of plant species diversity is a primary conservation objective.
111 longleaf pine-wiregrass (Pinus pal~is1ri.s - Aristidu srric-ta) landscapes of the southeastern United States, the devclopnient of vegetation coinnlunities is controlled by a. conlplcx inicraction of soil characteristics, fire frequency, topograpllic position, and past land uses. Floristically, high grou nd cover species richness has been recognized as a pro~nincnt feature of long leaf pine-w iregrass savan- nas regardless of sample scale (Lemon, 1949; Walker & Pect, 1983). This high richness is apparent at the local scales and at landscape scales (Drew, Kirkman & Gl~olson. 1998; Kirknlan el a/. , 2001). Although these fire-nlaintaincd ecosystenis were oncc the dominant plant comnlunitics in the southeastern U.S.A., today only a suiall percentage remains. Thus, there is widespread interest in thc conservation and restoration of these specics-rich habitats. More broadly, high diversity at large spatial scales results from a landscape mosaic of open-canopied longleaf pine stands occurring across a wicic e~lvironmental gradient, interspersed with depres- sional wetlands (Kirkman et csl., 2000) and linkages with riparian forests (Gocbcl et ccl., 2001).
Wc have becn examining variation in community composition and structure along with patterns of diversity a~id richncss across environmental and disturbance gradi- ents in a longleaf pine-dominated landscape (Kirkman el ul. , 200 1). We use the tern1 landscape as a nlosaic of het- erogcncous landforms, vegetation types, and land uses (Urban, O'Neill Rr. Shugart, 1987; Noss, 1990). As part of this work. wc developed a multifactor ecological clas- sification nod el for upland. riparian, and wetland systems (Kirknlarl er ul., 2000; Goebel el a/ . . 200 1 .). Multifactor
ecological classification systems (ECS) provide an orga- nizing framework for examining biodiversity at multiple scales. These systems delineate landscape segments based on nested, hierarchically arrayed physiographic, geomor- phic , edaphic, and vegetative characteristics (Lapin & Barnes, 1995; Pregitzer, Goebel & Wigley, 2000). Multiple and hierarchical factors (e.g., climate, geology, plants, animals, and time) that mediate the development of ecosystems are expressed in the spatial arrangement of geologic parent materials, surficial topography, land- forms, soil morphology, natural disturbances, and the composition and relative abundance of plant and animal species (Barnes el al., 1982; Host et al., 1989; Host & Pregitzer, 1992; Hutchinson et al., 1999).
Our goal is to determine which landscape features are important controls on species richness, to establish how these constraints are expressed at different levels of organization, and to identify hotspots of biological diver- sity for a particular locality. In this study, we examine the following questions: 1) How is the variance in pat- terns of plant species richness and diversity partitioned at different scales, or classification units, of the hierarchical ecosystem classification developed for the study area? 2) What are the compositional similarities among ecosystem types? 3) For our study area, what are the sites expected to harbour highest species richness? Finally, to predict species richness based on gradients of historical fire fre- quency and soil moisture, we incorporate fire history information into our general model as an additional pre- dictive variable.
STUDY SITE
The study site is located at Ichauway, a 1 15-km2 eco- logical reserve in the Coastal Plain of southwestern Georgia, U.S.A. The climate of this region is character- ized as humid subtropical (Christensen, 1981), with an average annual precipitation of 131 cm, evenly distributed throughout the year. Mean daily temperatures range from 21 "C to 34 OC in summer and from 5 OC to 17 "C in winter (National Climate Data Center, Asheville, North Carolina). Ichauway is located within the Dougherty Plain physiographic region in the Gulf Coastal Plain Province of Walker and Coleman (1987) or the Lower Coastal Plain and Flatwoods (LCPF) section (Plains and Wiregrass Plains subsections) of McNab and Avers (1994). The LCPF Province is a karst landscape, characterized by flat, weakly dissected alluvial deposits over Ocala Limestone (Hodler & Schretter, 1986). Parent materials are marine and continental sand and clay deposits formed during the Mesozoic (65 to 225 x lo6 y BP) and Cenozoic Eras (pre- sent to 65 x lo6 y BP) (Keys et a1.,1995). Most upland soils are paleudults and hapludults, with some localized quartzipsammnents.
Ichauway has one of the largest contiguous tracts of second-growth longleaf pine-wiregrass woodlands in the Southeast. Over the past several decades, Ichauway has been managed with low intensity, dormant-season pre- scribed fires with a return interval of 1-3 y. Frequent fire has resulted in floristically diverse savanna-like forests in
the uplands (Wells & Shunk, 1931 ; Wahlenberg, 1946; Walker & Peel, 1983). The flora of Ichauway is extrenlely clivcrse. w it11 over 1,000 vascular plants documented (Drcw. Kirkllian & Gholson, 1998). In contrast to the regional la~idscapc, rnany of the embedded wetlands at Ichauway are relatively undisturbed by agricultural prac- tices, rcccnt timber harvest, or altered hydrology, and as such, providc a unique setting to describe patterns. Wetland vegetation types iriclucic grass-sedge marshes, cypress savannas, and cypress-gum swamps (Kirkman et (11.. 2000). Two nl:~.jor streams dissect the karst topogra- phy: tlic Flint River, a strea~rl originating in the Piedmont of tiorthcrri (ieorgia, and Ichawaynochaway Creek, a (loastal Plain stre:im with headwaters originatirlg in a large wctlalicl colnplex. Along the riparian corridors, soutlicrn niixctl hardwood forests, locally known as ham- niocks, are the dominallt vegetation type (Quarterman & Kcevcr. 1962: Myers, 19'90).
ECOI,O(;I<'AC. SITE C:LASSIF:ICATION
111 prior work, we developed a hierarchical classifica- t ion of Ichauway reference ecosystems through several intcgratcd steps. The steps included reconnaissance to develop an initial classification, plot sampling (soils, physiography, and vegetation), multivariate analysis, and refincrncrlt of the classitkation (K irkman et al., 2000; Palik et ul., 2000; Goebel et al., 2001). An assumption of our i~pprc'ach is that rninin~ally disturbed ecosystems are the basis for the reference classification. Although the current plant corr~mur~ities of these ecosystems may not be wholly representative of pre-European-settlement condi- tions, thcy represent the best examples of the longleaf pirie landscape available regionally (Palik et a/., 2000).
To develop the classification, overstory and ground cover vegetation were sanlpled in a total of 104 minimally disturhcd stands. In each stand, fluvial and upland sample plots consisted of four 800-m2 circular plots, each with two ~iestcd 0.5-m2 quadrats centred at 5 m and 10 m from the plot cc11tre at an azimuth of 0". Because the size of wetland ccosystcms varied considerably, wetland (hydric dcpressious) sainple plots included a single 500-m2 circu- lar plot and Sour nested 0.5-n12 quadrats placed 5 m from the plot ccntre in each cardinal direction (N, E, s, and w).
Pli ysiography , soils, and vegetat ion were determined in each plot. Physiographic ~neasurenlents included land- li~rnl class, topographic relief class, and slope percent. Landfornl classes included sand ridges, terraces (both nlarinc and alluvial in origin), floodplains, hillslopes, depression margins, and shallow, non-wetland depres- sions. Topograpllic relief classes included steeply sloping (> 8%), undulating (> 3-8%), or nearly level (1-3%). Basins of wetlands were surveyed, and volume develop- ment. total area, anci elevation above sea level were cleternlincd. A bucket auger was used to sample soil to a depth of 3.4 111 (or to a restrictive layer) at the centre plot of each sample area. A complete soil description was 1n;ldc fc)llowing Soil Conservation Service procedures (Soil Survey Division StalT, 1993), and bulk soil samples wcre collected from each horizon for the entire profile. Sand (> 0.1 mm), silt (0.1-0.001 mm), and clay (< 0.001 mln) fractions wcrc determined after air drying using the pipette n~etllod.
The diameter at breast height (DBH, 1.4 m) of all living overstory trees (> 2.5 cm DBH) was recorded by species in 2.5-cm-diameter classes in each 800-m2 fluvial and upland plot and in each 500-m2 wetland plot. The ground cover (woody and herbaceous species < 30 cm tall) coverage was recorded by visual estimation in each of the 0.5-m2 quadrats using the following six coverage classes: < 1%, 1-5%, 6-15%, 16-30%, 31-60%, and 61- 100%. Few, if any, plants fell into a category of > 30 cm tall with a diameter < 2.5 cm DBH, and therefore this stratum was not analyzed for this study.
Our approach was iterative, including reconnaissance, plot sampling, and multivariate analysis. Specifically, prin- cipal components analysis (PCA) was used to summarize variation in the physiographic and soil variables among the sample areas and identify outliers or sample areas that occurred in transitional zones between ecosystem types. The ecosystem classification incorporated factors of land- form, soil texture, and vegetative cover associated into eco- logical species groups identified by Two Way Indicator Species Analysis (TWINSPAN). Canonical correspondence analysis, which measures the degree of distinctness among ecosystems using different combinations of physiographic, soil, and vegetation datasets, was used to verify the classi- fication (see Kirkman er al., 2000 and Goebel el al., 2001 for details of the analyses and classification procedures). The final iteration included 21 ecosystem types (Table I).
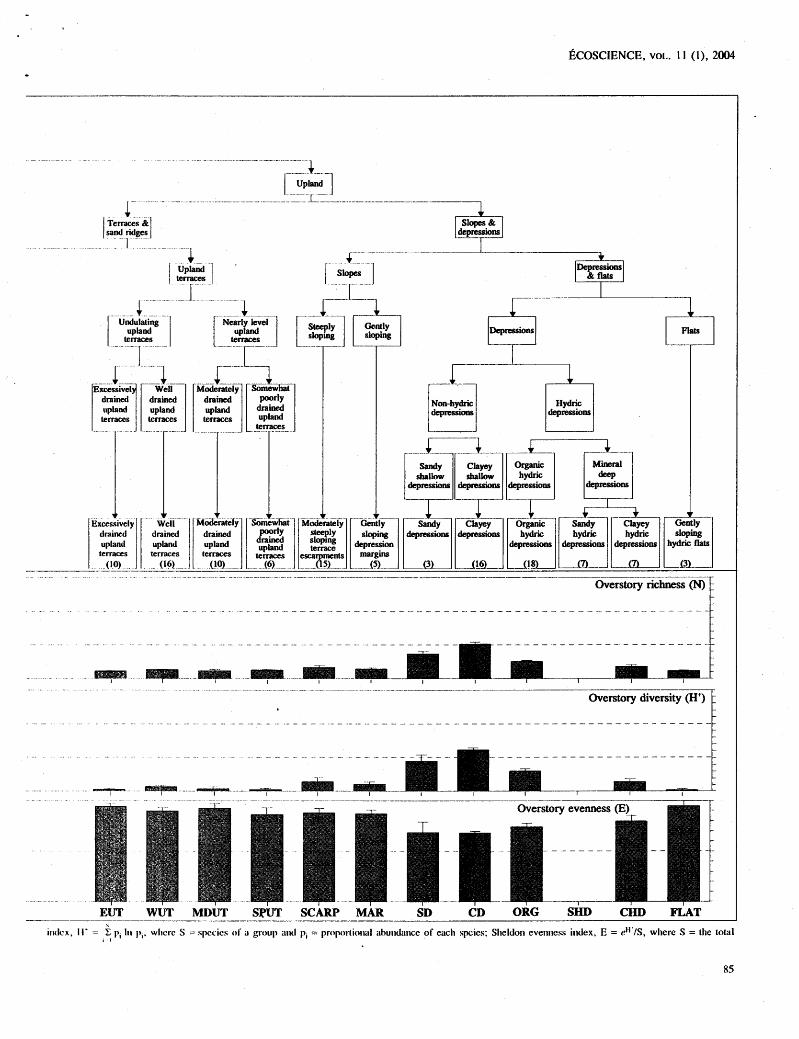
We identified 17 non-wetland ecosystem types and four wetland (hydric) types. For two rarely occurring ecosystem types of fluvial terraces (somewhat poorly drained and well drained fluvial terraces), vegetation data were not obtained (Table I), and thus these ecosystem types are excluded from the analysis presented in this paper. The multifactor classification has a hierarchical structure consisting of six levels (Table I). The first level of the hierarchy differentiates major physiographic zones (fluvial \7tDrsus upland) (Figures 1 and 2). The next two levels separate landscape units by landform complexes and landforms (10s-100s ha). The fourth level differenti- ates terrain shapes (e.g., undulating versus flat). The fifth level separates units by several soil characteristics that reflect moisture regime. The final two levels identify ecosystems based on overstory and ground cover plant communities.
DATA ANALYSES
From the prior ecological site classification (ESC) plant composition dataset (104 stands), we calculated two sets of diversity statistics: 1) species richness (number of species), Shannon's index of diversity (Ludwig & Reynolds, 1988), and Sheldon's index of evenness (Sheldon, 1969 in Ludwig & Reynolds, 1988) in herba- ceous ground cover (data from 0.5-m2 subplots); and 2) species richness, diversity, and evenness in overstory stratum (data from 500- or 800-m2 plots). Sheldon's index refers to how the species abundances are distributed anlong the species and is not strongly sensitive to the most minor species (see equation in Figure 1 legend). Shannon's index (see equation in Figure 1 legend) incor- porates both species richness and evenness into a single value and, as such, describes heterogeneity (Peet, 1974).

TABLE I. Ecosystem types of Ichauway, Baker County, Georgia.
Ecosystctn type name Landform Terrain Soil drainage Overstory Ground cover complex shape class species group species group
Somewhat p r l y drained fluvial terrace sand to .sandy loam over longleaf pine-loblolly fluvial terraces (SPFT)' sandy clay loam to clay pine-water oak
Modcrarcly clrained fluvial terrace sandy clay loam over sand longleaf pine-loblolly Vaccinium-Ruellia fluvial terraces (MDFT) pinswater oak
Well drnind fluvial fluvial terrace loamy sand over sandy longleaf pine lcrraces (WFT)* loam to sandy clay loam
Excessively driined fluvial lerraccs (EFT)
Mcsic hardwmni ham~nocks (HAM)
fluvial terrace sand and loamy sand longleaf pine .
fluvial terrace sand
Fluvii~l sand ridgcs (FSR) fluvial sand ridge sand
laurel oak-pignut hickory- Parthenocissus-Bignonia Southern magnolia
longleaf pine-turkey A ristida-Andropogon oak-.sand post oak
Filtx~ipl;~ies alo~ig fluvial floodplain sandy clay loam over live oak-sweetgum- Parthenocissus-Bignonia the I:litit River (FTR) sandy loam Florida sugar maple
Fl(xxlpl;~ins i~long the fluvial floodplain sandy loam over loamy sand live oak-sweetgum- Parthenocissus-Bignonia 1chawiy11~ll;rwiiy Creek (FTC) Florida sugar maple
So~newhat poorly drained upland terrace sandy loam over sandy longleaf pine upland terraces (SPUT) clay loam to clay
Mtdcrately drained upland upland terrace loamy sand over longleaf pine terraces (MDUT) sandy clay loam to clay
Well drained upland terraces (W UT)
upland terrace loamy sand over sandy longleaf pine loam to sandy clay loam
Excessively drained upland terrace loamy sand to sandy loam longleaf pine upla~~d lerraccs (EUT) 4
Ariwida-Dyschoriste
Upland sand ridges (USR) upland sand ridge sand longleaf pine-turkey oak- Aristida-Dyschoriste sand post oak
Dcprcssioti margins (MAR) upland slope loamy sand over longleaf pine-slash pine Aristida-Dyschoriste sandy loam to clay
Terracc escarpments (SCARP) fluvial slope loamy sand over sandy longleaf pine-sand post oak Aristida-Andropogon loam to sandy clay loam
Clayey dcprcssions (CD) upland depression sand to sandy loam over live oak-water oak- Quercus- Campsis sandy clay loam to clay swamp laurel oak
Sandy depressions (SD) upland depression sand over .sandy clay loan1 sand live oak- Aristida-Dyschoriste longleaf pine-live oak
Organic llydric depressions (ORG) upland depression organics over clay pond cypress-blackgum Nyssa- Taxodium
Cl~~yey llytlric depressions (CHD) upland depression loamy sand over pond cypress Panicum-Andropogon sandy clay to clay
Sa~uly hydric depressions (SHD) upla~xl depression loamy sand over sandy none clay loam to sandy clay
Hytlric flats (FLAT) upland flat loamy sand over slash pine
Panicum-Leersia
Sporobolus-Pityopsis sandy clay loam to clay
* Dcndcs an ecosystem r ~ ) t sampled.
We compared mean species richness, diversity, and even- ncss arnong ecosystem types. To examine how total varia- tion in each of the vegetation parameters is distributed among hierarchical levels (Page1 & Harvey, 1988), we estirrlated the variance components for each variable using the SAS PROC MIXED nested variance components model with REMYL (Version 9.0, SAS Institute Inc., Cary , North Carolina, U. S. A .). (For purposes of report- ing, we re-scaled the evenness variable x 100 and the diversity variable x 10.)
Mean species richness (ground layer only) per ecosys- tem type was used to develop a spatially explicit biodiver- sity map derived fronl a potential ecosystem type map for thc study area (Palik ut al., 2000). Four categories of
species richness (0-3 species, >3-9 species, >9-15 species, > 15 species per 0.5 m2) were utilized to develop the map based on plot-richness frequency distributions. The category breaks of species richness were obtained through Jenk's Optimization, a default algorithm that min- imizes the sum of the variance within each of the classes (ArcView GIs 3.2, Environmental Systems Research Institute, Redlands, California, U .S. A.), and then round- ed to the nearest integer.
An empirically derived graphic depicting the interac- tions of soil moisture and fire regime on species richness was created with a three-dimensional smoothing function (Jandel, 1995). Ranked soil moisture categories were based on soil texture characteristics from the ESC (ranked

Gcology (Physiographic mne)
Landform complex
--
Landform
Terrain shape
Soil drainage class
Soil characteristics
Vegetation
Local ecosystem types (n plots)
15
(The plains & wiregrass 1 pk5:;ml 1
Terraces & 1 sand ridgal
A Well
drained fluvial terraces
--r-
Ed fluvial
/ 1 $: ilkE7-l 1 River T ~ Y Y
FSR HAM EFT WlV* MDFI' SPFI'* FTR FI'C USR
F;I(;oHI: I . Ilicri~rcl~ical strtrcture ancl comparisons of ovcrstory flora alrlong ecosystenl types. Species richness, N = number of species; Shannon diversity riurnhcr of spccics. * indicatcs 1 1 0 data.
ECOSCIENCE, VOL. 1 1 ( I ) , 2004
. -, Upland
... L . I
Depnssiohc Flats
1 Hydric
depressions
Mined deep
depressions
n .....-.... - ..... -- . - -. .... -- ..... - -- - -- - .. -- - - - - - -
Overstory richness (N)
I --- Overstory diversity (H*n I
Overstory evenness
. . . . . . . . .
. - . . . . . . . . . . -. .
EUT WUT MDUT SPUT SCARP MAR SD CD ORG SHD CHD FLAT I - -- - - - - - -- - - -
isclcx. l i e = t p, I I I pl. wllerc S = spccics of r group i ~ ~ l p, = pnyu>rtio~ial abu~idilnce of each spies; Slieldon eveniicss i~dex , E = eH'IS, where S = the total I I

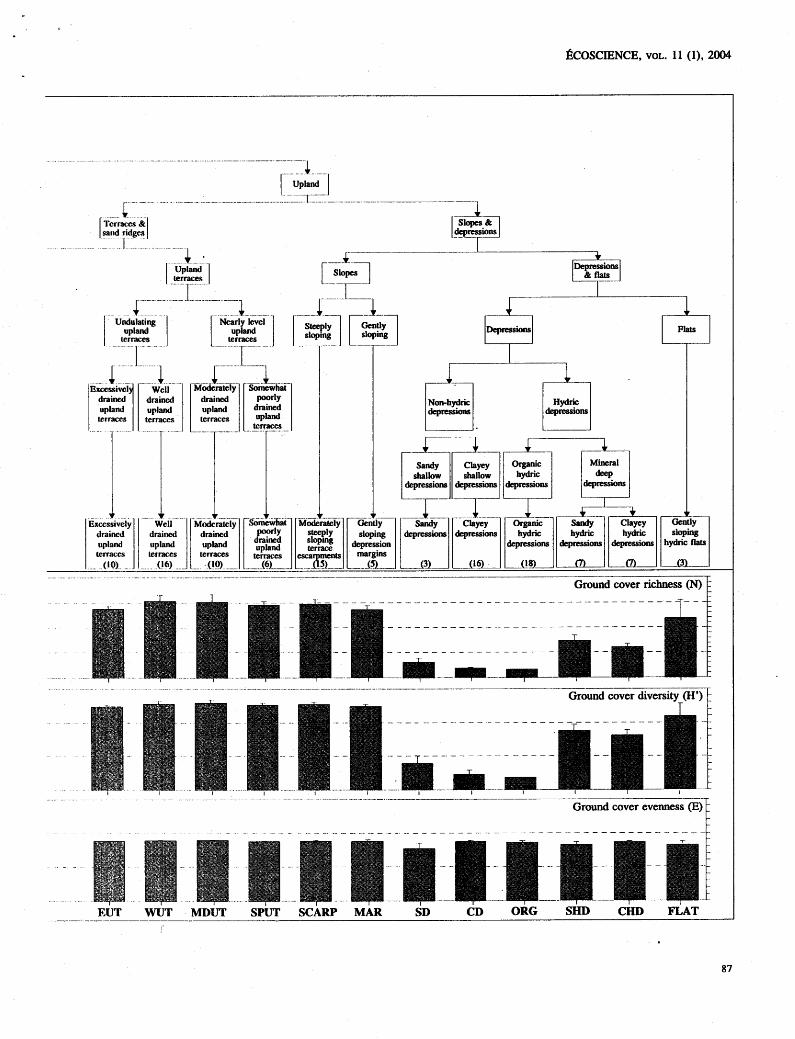
Rc;uurr 2. Hierarchical structure and comparisotis of ground cover flora among ecosystem types. See legend of Figure 1 for explanation of indices.
86
h 3 a
0
a 'Q, s
&
8
om
8 - a -
E * 0T.- 1 5
-
- - -- --- 1--
-- - - - --
-- FSR HAM EFI' WFI* MDm ~dm*
--
Landform complex
-
Lancirom~
Terrain shape
Soil drainage class
Soil characteristics
Vegetation
Lacal ecosystem t w s (n PI@)
20
.C Floodplains
___T - -+-I-- --
Well - Moderately !Somewhat
terraces te- - fluvial terracw
v v
- - -- -- - - - -- - - - - - - ---- - -- -- - - - --
I 15 .a0 -c 10 - 3 .m
g 5 m 0
- - - - - - - - - - - - - - - - - - - - - - - - - - - - - - - - - - - - - - - - - - - - -
- - - -- - - - - - - - - - .- - - - - - - - - - - - - - -- - - - - - - - -
-- . . - - - - - -
.-- 3 3 --- -- - - - - - - - - - -- ----
9 * 5 - .m m
& b 2 0% a 8 1 -
- - - - - - - - -
- - - - - - -
Upland
. . ... Undulating Nearly kvel
terraces Depressions '3
r
Gently
(n - - - - - - - - - - ---- ---- _-- . - -- - -
Ground cover richness (N) T
. . . . . . . . . . . . . . . . . . . . . . .. - - -. --
Ground cover e v e n n e s s ~ ~ ~

K I R K M A N 11' AI.. : I'I<III)I("~IN<; SI'WIIJS K I ~ I I N I 3 S
in asce~lcii~ig ortler: cxccssively drained, somewhat exces- sively dri~incd. well drai~ied, moderately well drained, sonlewhat poorly drainctl, poorly drailied, and very poorly drai~lcd). Relative fire return intervals were based on a pr-iori observations and estimates in tlie literature for the various cct~syslcrn types in the study area (Lemon, 1949; Walker & Peet, 1983; Myers, 1985; Abrahamson & Flartnctt, 1990; Ewel, 1990; Myers, 1990; Platt & Schwartz. 1930; Rcbertus, Williamson & Platt, 1993; Ware. IZrost Kr Dcxrr, 1993). Fire return intervals were assigned to one of tlic following class variables: < 3 y, 3-10 y, 1 I - 20 y, > 20 y.
Results
A lotal of 350 species were sarnpled in tlie overstory and ground covcr strata. As a group, the fluvial ecosys- ten1 ty11eshha the greatest nurnber of taxa in the overstory (66) and the ground covcr (298) because both longleaf pine ecosyste~ns and mesic hardwood ham~nocks develop on this landform (Table I); this combination inflates num- bers of species because these ecosystem types do not share Inany species.
The Ilicrarchical partitioning of variance in richness, evenness, and diversity of the ground cover suggests that the total variance was Jriorc unifornily distributed for richness and divcrsity than for evenness (Table 11). For gt-ou~d cover specics richness, approximately 30% of the total variance in species richness was attributable to land- fc>r~il. Iiowcver, a similar percentage of variance occurred at tlic stand level, indicating substarltial variance in stand ricllness that is indepe~ldent of differences in landform. For evenllcss, differences among the stmds accounted for ovcr 80% of the total variation. A different pattern of variance partitioning occurred lor the overstory tlora vari- ables. For spccics richness and diversity, nearly 75% of the total variance was attributable to differences in land- form complex or landforms (Table 11)- suggesting that species ricllness and diversity of the overstory flora is no re strongly driven by landform than that of ground covcr flora. However, for these measures, noteworthy variancc independent of latidfornl also occurred at the ecosyslem Icvcl. Most of the variance in overstory even- ness values was attributable to differences in hierarchical lcvels i~lclcpcndent of landforni and was due primarily to (lifferc~~ccs ;it thc s~ancl level.
Greatest overstory richness in the landscape was associatetl with floodplairls (mean + SE: 12.0 + 1.4 specics-800 w2). Striking differences in mean species richncss of ~ h c canopy occurred on similar soil types of cxccssivcly tlrained fluvial terraccs (Figure I ) , with the dcvelopnlent of longlcaf pine-wiregrass (2.1 + 0.38 specics -800 111-9 ~~ct-,su,s hardwood hanilnock vegetation ( 1 0.1 _+ 0.4 species- 800 111-~). This difference in vegcta- tiorl co~llposition most likely reflects cliffere~lces in a dis- turbance 1;tctor. such a s fire. In hardwood dominated si tcs, many specics co-dominate in the canopy; thus, divcrsity is l~igilcr with higher richness arid evenness.
Tior groutid covcr, evenness was high regardless of ecosystclm type, rellectitig tlic lack of dominance by any singlc grourld cover species. Therefore, the diversity
index of ground cover was largely determined by species richness. A pattern of decreasing ground cover richness occurred with increasing overstory richness at the ecosys- tem type level (Figures 1 and 2). Within the fluvial land- form complex, terraces and sand ridges had greater ground cover richness than the floodplains, due to the existence of a welldeveloped herbaceous ground flora in the longleaf pine woodlands of some ecosystem types. However, if nlesic hardwood forests (hammocks) developed on the flu- vial terraces (HAM), ground cover richness was reduced as overstory richness increased (Figures 1 and 2).
The spatial distribution of species richness can be illustrated using a reference ground cover richness map predicted by correlations of physiography, soils, and plant communities obtained through the site classification (Figure 3). The matrix of the Iandscape (greater than 65 percent of the 11,400-ha site) falls into the highest potential richness category (> 15 ground cover species.0.5 m-2). The role of landform is particularly emphasized by the devel- opment of hardwood forests along riparian corridors that are relatively species-poor in ground cover. Alternatively, throughout the landscape, species richness in depressions varies from extremely low to extremely high and may be related to other features such as hydrologic conditions of these wetland and upland sites or to fire regimes.
Figure 4 (derived from mean species richness, estimat- ed fire frequency score, and soil moisture gradient) indicates the role of fire and its interaction with soil moisture. The highest species richness is found in mesic communities where fire frequency is greatest. The importance of fire is illustrated by the fact that species richness can drastically differ on similar landforms and soil conditions depending on fire regime. The apparent role of disturbance thus may explain the degree of variance in richness that was shown to be independent of landform. Nevertheless, these patterns do suggest how landform may influence natural disturbance regimes or, in the current landscape, limit the potential for prescribed fire. For example, less frequent fire may be associated with riparian corridors as a result of floodplain conditions or with extremely xeric conditions in which low productivity results in low fuel loadings. The abrupt trough associated with poorly drained soils (Figure 4) reflects the near absence of ground cover species in clayey depressions that seldom burn and are don~inated by a canopy of live oak. A hump-shape species richness curve may be associat- ed with disturbance frequency in poorly drained soils. This pattern is likely a hnction of the absence of sites represent- ing the combination of very high fire frequency and the wettest depressional sites.
Discussion
This study demonstrates the interacting influences of soil, topography, and disturbance with plant diversity relationships. Landscape configuration not only influences community structure through soil moisture controls on vegetative composition and fuel production, but it also may modify the development of fire regimes. This com- plexity has implications for interpretation of ecosystem development pathways and patterns of species richness. For example, plant communities of the longleaf pine ecosystem may shift types and diversity patterns with the

TAIU.~: 11. Variill~ce col~tporietits al Iiierarchical levels of classification for species richness, diversity, and evenness. - - - - - - - - - --- --- - -
Vi1rii11)I~ Spccies richncss (N) Sliannon divcrsily i~idcx (H') Sheldon evenness indcx (E) -- - --- - -
Viu I;IIICC Varialu-c % lolal Nun~crator Error Varii~nce % total Numerator Error Variance X told1 Nulncrator Error C ~ I I ~ ~ H I I ~ C I I I est iniiitc (IT df
- -- -- -- -- - eslirliiate df df estimate df df
A. <;ROIINO ( ' o v t - ~ I'I.OHA
I,i~tldli)r~tt C O I I I ~ ~ C X O.CM07 3.6 1 5.08 0 0 1 5.05 0 0 1 5.06 Iatulli~~ 111 witllin
li111tllh~111 C O I I I ~ ~ C X 7.8 1 16 20.0 5 4.36 11.3950 22.9 5 4.78 2.6364 10.9 5 5.30 l'crnlit~ sllalw witl~ir~
la~~titor~ji 4.4074 16.9 4 8.70 10.0059 20.1 4 8.21 0 0 4 9.69 Fictltypt witlli~~
1crrai81 sl~itpc 5.1204 19.6 8 I I I 18.7389 37.7 8 I l l 1.5444 6.4 8 I l l Stiltul 7.X232 30.0 l l I 9.5895 19.3 1 1 1 19.9200 82.7 l l l
l'ofl i11 26.1033 10Cl.O 49.7293 100.0 24.1008 100.0
H. OVI!U~IT)KY I:I.OUA
I,;wlli)ta~ ctmlplcx 11.8367 51.55 1 4.83 40.4105 49.19 I 4.97 45.7993 20.02 1 5.40 IJi~~~(lf<)r~t1 wit11i11
la~ulli\t~i~ C O I I I I ~ C X 5. 1047 22.23 5 8.72 1 1.2083 13.64 5 5.20 0 0 5 4.36 'rcrribit~ shaiw within
li~~ullitr~r 0 0 4 5.03 0 0 4 7.10 30.5232 13.53 4 7.94 Ikol ypc witl~ill
lerri~i~~ shilpc 5.0597 22.04 5 87 25.6090 31.17 7 105 35.9562 15.72 7 105 St;~~ul 0.9593 4.18 87 4.9200 6.04 105 116.4700 50.92 105
Tot:~l 22.9604 IOO.00 82.1478 100.00 228.7487
renloval or addition of fire. On lower slopes of riparian corridors, frcquercy of fire may be suppressed by the duration of soil saturation or proximity to natural fire barri- crs ( i .a . , adjacent streiims or less fire-prone vegetation). Altcrllatively. hecause the origin of natural fire in these lard.scalws was prirr~arily in surrourrding upland longleaf pine stands, fire could be carried downslope into riparian Iiiirdwood Ibrests under dry fuel and low hunridity condi- tions (Konrarek, 1974), and a vety different plant commu- ~iity could develop. Along a gradient of increasing fire frequency, high diversity would shift from canopy com- p)tic~lt to the ground flora, with an overall increase in total species richness. Similarly, the grountf cover rich- ness in cicpressional wetlands is related to fire frequency, which lliiiy be driven by hydrologic regime, but it is also depctrdcrit on the use of prescribed fire in the immediate area or surrounding upland (Kirkman el al., 2000).
Wlrilc fire frequcncy (natural as well as human-ignit- etl fires) m;ly be lillkcd to landscape features, it appears that frcqt~c~rtly recurririg fire is a pri~trary determinant of higll species richness at the landscape level. Although spccics richrrcss is often postulated as a peaked function of disturl~a~rce (Huston, 1W4), the interpretation of our firdings in view of such widely held ecological concepts is a~nbiguous for many reasons (Mackey & Currie, 2000; 200 I ). In particular. the detlnition of an interniediate level of' tlisturbancc for a particular locality is elusive because the axcs of thcorcticirl nlodels are not parameterized. For cx;~~nplc. the low-intensity fires characteristic of the fire reginlc of the longleaf pine ecosystem could be consid- ered an irrtcrn~ediate level of disturbance relative to the clegrcc of biomass rc~noval that occurs in stand-replacing fires of' other conifer forests (Franklin er nl. , 2002). Aliernativcly, within tlie range of potential fire frequen- cies for l l~e IongIeaf pine ecosystem. a return interval of 1 or 2 y night bc consic-lcred to be an cxtrcme level of dis- til rha~ice I'rccluelicy, hccausc more frequent fires are not
even possible due to lack of fuel accumulation (Glitzenstein, Platt & Streng , 1995). Regardless of these conceptual enigmas, fire disturbance is an important fac- tor affecting species diversity in this landscape because of its role in decreasing hardwoods that otherwise competi- tively exclude herbaceous species.
As a tool for targeting hot spots of diversity, the ESC can be part of a larger predictive model that includes biot- ic indicators of land use. It may be possible to use infor- mation about the life history of indicator species to link their occurrence with landscape-scale variables such as land use and fire history (Caro & O'Doherty, 1999; MacNally & Fleishman, 2002). For example, abundant wiregrass in the ground cover of longleaf pine stands is recognized as an indicator of a history of frequent fire and absence of agricultural soil cultivation, as well as high species richness (Noss, 1989; Hedman, Grace & King, 2000). The presence of this species can be combined with maps of potential species richness in longleaf pine ecosys- tems to further discern species-rich sites in a particular locality. Future predictive models of species richness com- bining environmental factors and biotic indicators may be hindered by some past land use activities in the longleaf pine ecosystem. Prior disturbances such as grazing proba- bly could reduce species richness without negatively affecting wiregrass, if the site was frequently burned. As additional biotic indicators of such past legacies become evident, these can be used to extract those sites with the greatest probability of exceptionally high numbers of species versus those in need of species reintroductions.
In a broader conservation management context of the longleaf pine-wiregrass ecosystem, the importance of fire frequency in maintaining high species richness is often overlooked in management planning (Hiers, Wyatt & Mitchell, 2000). Even though prescribed fire is widely accepted as critical to the maintenance of biodiversity of

a) Potential ground cover richness b) Landform com~lexes
Water Somewhat poorly drained
fluvial terraces Moderately drained fluvial terraces Well drained fluvial terraces Excessively drained fluvial terraces Mesic hardwood hammocks Fluvial sand ridges Floodplain terraces along
the F l i t River Floodplains along
Ichawaynochaway Creek Somewhat poorly drained upland terraces
Moderately drained upland terraces
Well drained upland terraces Excessively drained upland terraces Upland sand ridges Depression margins Terrace escarpments Clayey depressions Sandy depressions Organic hydric depressions Clayey hydric depressions Sandy hydric depressions Hydric flats
I:I<;I~uI: 3. a ) r'o~c~~tiitl Incan grounrl covcr plrint spcics richllcss (0.5 n ~ - ~ ) of lclrauway based on ecosyste~n classificalion. b) LII~~OIWIS of Icl~auw;~y. c) I~cosyste~a typcs of Icllituwiiy based on ecosystcln classification.
the longleaf pine-wiregrass ecosystem (Wells & Shunk, 193 I ; Lemon, 1949), emcrging management philosophies not adtlressed in this study (such as rigid application of a particular season of fire) may, in fact, jeopardize the opportir riitics for application of frequcnt fire to a particu- lar sitc . We rcco~nmenct that conservation efforts should focus I ~ O I - e co~~ccrtcdly on fire frequency (and less on season o f fil-c) ;is a priority mar~agenlcnt tool.
While this study addresses questions about distur- bance-diversity relationships in a particular ecosystem of considerable conservation concern in the southeastern U. S. A., the methodological framework is applicable to other ecosystems with high biological diversity. For sites where most or all native vegetation has been eliminated, determining appropriate reference conditions to use as a restoration guide can be problematic without adequate

ED: Excessively drained SED: Somewhat excessively drained WD: Well drained MWD: Moderately well drained SPD: Somewhat poorly drained PD: Poorly drained VPD: k r y poorly drained
FIGURE 4. Three-dimensional graphic representation for species richness from ecosystem classification data (mean ground cover species richness 10.5 m-2] and soil moisture conditions) and estimated fire return interval. a) Smodhtd surface. b) Data points.
knowledge of potential communities associated with dif- ferent soil types and their spatial context (Ful6, Covington & Moore, 1997; White & Walker, 1997; Palik et al., 2000). Our approach illustrates how potential species richness can be identified as a restoration goal and demonstrates that multiple vegetation endpoints may be appropriate vegetation objectives. It also suggests how sites that are the most likely to support especially high species abundances can be identified and selected for restoration priority.
Acknowledgements Support for this study was provided by the R. W. Woodruff
Foundation. S. Chapal assisted with data management; J. Brock provided GIS technical support. A. Brown, K. Coffey, M. Drcw, S. Entrekin, A. Fussell, B. J. Harris, C. Helton, K. Hiers, M. Mosner, D. Ngo, P. Parker, N. Pederson, D. Pederson, G. Phillips, M. Varner, and K. Watt assisted with data collection. A. K. Gholson and L. A. Anderson provided botanical identification support. K. Coffey provided graphical assistance. Comments provided by R. Mitchell, D. Currie, and other reviewers improved the manuscript.
Literature cited
Chipman, S. J. & E. A. Johnson, 2002. Understory vascular plant species diversity in the mixed wood boreal forest of western Canada. Ecological Applications, 12: 588-601.
Christensen, N. L., 1981. Fire regimes in southeastern ecosys- tems. Pages 1 12-136 in H. A. Mooney, T. M. Bo~icksen, N. L. Christensen, J. E. Lotan & W. A. Reiners (eds.). Fire Regimes and Ecosystem Properties. U.S. Department of Agriculture Forest Service General Technical Report WO-26, Washington, D.C.
Currie, D. J., 1991. Energy and large-scale patterns of animal and plant-species richness. American Naturalist, 137: 27-49.
Currie, D. J. & V. Paquin, 1987. Large-scale biogeographical patterns of species richness of trees. Nature, 329: 326-327.
Drew, M. B., L. K. Kirkman & A. K. Gholson, 1998. The vas- cular flora of Ichauway, Baker County, Georgia: A remnant longleaf pinelwiregrass ecosystem. Castanea, 63: 1-24.
Dumortier, M. J., J. Butaye, H. Jacquemyn, N. Van Camp, N. Lust & M. Henny, 2002. Predicting vascular plant species richoess of fragmented forests in agricultural landscapes in cen- tral Belgium. Forest Ecology and Management, 158: 85-102.
Ewel, K. C., 1990. Swamps. Pages 381-323 in R. L. Myers & J. J. Ewel (eds.). Ecosystems of Florida. University of Central Florida Press, Orlando, Florida.
Frauklin, J. F., T. A. Spies, R. van Pelt, A. B. Carey, D. A.
Abrahamson, W. G . & D. C. Ha*ett, 1990. Pine flatwoods Thornburgh, D. R. Berg* D. B. Lindenma~er* M' E-
and dry prairies. Pages 103-149 in R. L. Myers & J. J. Ewel Hmon* W. S. Kectons D. C. K. 8r J-
(cds.). Pmsystems of Florida. University of Central Florida 2002. Disturbances and of Prcss, Orlando, Florida. forest ecosystems with silvicultural implications, using
Barnes, B. V., K. S. Pregitzer, T. A. Spies & V. H. Spooner, Douglas-fir forests as an example. Forest Ecology and 1982. Ecolonical forest site classification. Journal of Management, 155: 399-423. Forestry, 80: 493-498. FulC, P. Z., W. W. Covington & M. M. Moore, 1997.
Caro, T. M. & G. O'Doherty, 1 999. On the use of surrogate Determining reference conditions for ecosystem management species in conservation biology. Conservation Biology, 13: of southwestern ponderosa pine forests. Ecological 805-8 14. Applications, 7: 895-908.

KIKKMAN El' AL.. : PHI:.I~I~TING SPECIES RICHNFS!
Glenn-Lewin, D. C., 1977. Species diversity in North American ternperate forests. Vegetatio, 33: 153- 162.
Glitzenstein, J. S., J. W. Platt & D. R. Streng, 1995. Effects of lire reginlc and habitat on tree dynamics in north Florida lon- gleaf pine savannas. Ecological Monographs, 65: 44 1 -476.
Gc~bcl. P. C., Il. J. Palik, L. K. Kirkman & M. B. Drew, 2001. Forest ecosystems of a lower Gulf Coastal Plain land- scape: Mult ifactor classification and analysis. Journal of the Torrey Rotanical Society, 128: 47-75.
tletinian. C. W., S. L. Grace & S. E. King, 2000. Vegetation conlposition and structure of southern coastal plain pine forcsts: An ecological comparison. Forest Ecology and Management, 1 34: 233-247.
tleikkinen, R. K., 1996. Predicting patterns of vascular plant species richness with composite variables: A meso-scale study in Finnish Lapland. Vegetatio, 126: 15 1 - 165.
l-liers, J. K., R. Wyatt & R. J. Mitchell, 2000. The effects of tire regitlie on legurne reproduction in longleaf pine savan- nas: Is a season selective'? Oecologia, 1 25: 52 1 -530.
Ilodler, T. W. & 11. A. Schretter, 1986. Atlas of Georgia. Institute of Community and Area Development, University of Georgia, Athens, Georgia.
)lost, G. E. & K. S. Pregitzcr, 1992. Geomorphic influences on ground-flora and overstory cornposition in upland forests of norttiwestern lower Michigan. Canadian Journal of Forest Research, 22: 1547- 1555.
Host, G . E., C. W. Ranitn, E. A. Padley, K. S. Pregitzer, J. B. Hart & D. T. Cleland, 1989. Field sampling and data analysis rnethtxis for development of ecological land classifi- cations: An application on the Manistee National Forest. 1I.S. Ilepartment of Agriculture Forest Service General Technical Report NC- 162. St. Paul, Minnesota.
Iluston, M. A., 1994. Biological Diversity: The Coexistence of Specics on Changing L.andscapes. Cambridge University Press, Camhridgc.
Ilutcliinson, T. I;., R. E. J. Boerner, L. R. Iverson, S. Sutlicrlantl & 13. K. Sutlierland. 1999. Landscape patterns of understory composition arid ricliness acmss a moisture and nitroget1 minerali7alion gradient in Ohio (lJ.S.A.) Qrcercus forests. Plant Ecology, 144: 177- 189.
Jarltlel Corporation, 1995. User's Manual. Revision SPW 3.0. San Rafael, California.
Jobhagy, 12. G . , J . M . Paruelo & R . J. C. Leon, 1996. Vegetation I~eterogeneity and diversity in tlat and mountain landscapes of F'atagonia (Argentina). Journal of Vegetation Science, 7: 599-608.
Kerr, J. 'T.. 1996. Species riclincss, endemism, and the choice of arcas for conservation. Conservation Biology, 1 1 : 1094-1 100.
Keys, Jr., J. , C. Carpenter, S. I-Iooks, F. Koenig, W. F. McNab. W. Russell & M. L. Smith, 1995. Ecological units of Ihc eastern United States - first approxiniation (map and h<~)klct of rnap unit tables). U.S. Department of Agriculture Forest Service, Atlanta. Georgia.
Kirknian, 1,. K., P. C. Gc~bel, L. West, M. B. Drew & B. J. Palik, 2000. Dcpressional wetland vegetation types: A question of pl;ttil cotnniunity tleveloptnent. Wetlands, 20: 373-385.
Kirkt11i111, I,. K.. R. J. ~itcllell, R. C. llelton & M. B. Drew, 2001. I'ro(luc1ivity and species ricllt~css across an environ- ~nci~tal gratlicnt in a Sire-dependent ecosystem. American Journal of Botany, 88: 2 1 19-2 128.
Komarek, Sr., E. V., 1974. Effects of fire on temperate forests and related ecosystems: southeastern U .S. Pages 25 1-277 in C. E. Ahlgren & T. T. Kozlowski (eds.). Fire and Ecosystems. Academic Press, New York, New York.
Lapin, M. & B. V. Barnes, 1995. Using the landscape ecosys- tem approach to assess species and ecosystem diversity. Conservation Biology, 9: 1 148-1 158.
Lemon, P. C., 1949. Successional responses of herbs in the lon- gleaf-slash pine forest after fire. Ecology, 30: 135- 145.
Ludwig, J. A. & J. F. Reynolds, 1988. Statistical Ecology. '
John Wiley & Sons, New York, New York. Mackey, R. L. & D. J. Currie, 2000. A re-examination of the
expxtd effects of disturbance on diversity. Oikos, 88: 483-493. Mackey, R. L. & D. J. Currie, 2001. The diversitydisturbance
relationship: Is it generally strong or peaked? Ecology, 82: 3479- 3492.
MacNally. R. & E. Fleishman, 2002. Using indicator species to model species richness: Model development and predictions. Ecological Applications, 1 2: 79-92.
McNab, W. H. & P. E. Avers, 1994. Ecological subregions of the United States: Section descriptions. Administrative Publication WO-WSA-5. U .S. Department of Agriculture Forest Service, Washington, D.C.
Myers, R. L., 1985. Fire and the dynamic relationship between Florida sandhill and sand pine scrub vegetation. Bulletin of the Torrey Botanical Club, 1 12: 241 -252.
Myers, R. L., 1990. Scrub and high pine. Pages 150- 193 in R. L. Myers & J. J. Ewel (eds.). Ecosystems of Florida. University of Central Florida Press, Orlando, Florida.
Noss, R. F., 1 989. Longleaf pine and wiregrass: Keystone com- ponents of an endangered ecosystem. Natural Areas Journal, 9: 21 1-213.
Noss, R. F., 1990. Indicators for monitoring biodiversity: A hierarchical approach. Conservation Biology, 4: 355-364.
Pagel, M. D. & P. H. Harvey, 1988. Recent developinents in the analysis of comparative data. Quarterly Review of Biology, 63: 4 13-440.
Palik, B. J., P. C. Goebel, L. K. Kirkman & L. West, 2000. Using landscape hierarchies to guide restoration of disturbed ecosystems. Ecological Applications, 10: 189-202.
Peet, R. K., 1974. The measurement of species diversity. Annual Review of Ecology and Systematics, 5: 285-308.
Platt , W. J. & M. W. Schwartz, 1990. Temperate hardwood foresks. Pages 194-229 in R. L. Myers & J. J. Ewel (eds.). Ecosystems of Florida. University of Central Florida Press, Orlando, Florida.
Pollock, M. M., R. J. Naiman & T.. A. Hanley, 1998. Plant species richness in riparian wetlands - A test of biodiversity theory. Ecology, 79: 94-105.
Pregitzer, K. S., P. C. Goebel & T. B. Wigley, 2000. Evaluating forestland classification schemes as tools for maintaining biodiversity. Journal of Forestry, 99: 33-40.
Quarterman, E. & C. Keever, 1962. Southern mixed hardwood forest: Climax in the southeastern Coastal Plain, U .S. A. Ecological Monographs, 32: 167-1 85.
Rebertus, A. J., G. B. Williamson & W. J. Platt, 1993. Impact of temporal variation in fire regime on savanna oaks and pines. Pages 215-225 in Proceedings of the 18th Tall Timbers Fire Ecology Conference. Tat l Timbers Research Station, Tallahassee, Florida.
Sheldon, A. L., 1969. Equitability indices: Dependence on the species count. Ecology, 50: 466-467.

Soil Survey Division Staff, 1993. Soil Survey Manual. U.S. Ilcparttncnt of Agriculture, Agricultural Handbook 1 8, Hcvisctl eciition. Washington, D.C.
Ilrhati, D. I,.. K. V. O'Neill & 1-1. H . Shugart, 1987. 1,itntlscapc ecology. DioScicncc, 37: 1 19-127.
Walilcnherg, W. G.. I9&. Longleaf pine: Its use, ecology, regen- el- tio on. protection, growth, ant1 managelnent. Charles Lanthrop Pitch Forestry Fountlation, Washington, D.C., in cooperation with tlic Forest Service, U.S. Dcparttrlent of Agriculture.
Walkcr. t l . J . '9 J. M. Coleman, 1987. Atlantic and Gulf Coastal Province. Pages 105-126 in W. L. Graf (ed.). C;coniorl~hic Systems in North America. Geological Society of Arnerici~, Ce~itcnnial Special Volurile 2. Boulder, Colorado.
Walker, J. & R. K . Peet, 1983. Cotnposition and species diver- sily of pine-wiregrzlss savannas of the Green Swamp, North Carolina. Vegetatio, 44: 163-1 79.
Ware, S., C. Frost & P. D. Doerr, 1993. Southern mixed hard- wood forest: The former longleaf pine forest. Pages 447-494 in W. H. Martin, S. G. Boyce & A. C. Echtemacht (eds.). Bio- diversity of the Southeastern United States: Lowland Terrestrial Communities. John Wiley & Sons, New York, New York.
Wells, B. W. & 1. V. Shunk, 1931. The vegetation and habitat factors of the coarser sands of the North Carolina coastal plain. Ecological Monographs, 1 : 465-520.
White, P. S. & J. L. Walker, 1997. Approximating nature's variation: Selecting and using reference information in restoration ecology. Restoration Ecology, 5: 338-349.
Wiens, J . A., 1989. Spatial scaling in ecology. Functional Ecology, 3: 385-397.
Wunderlin, R. P., 1998. Guide to the Vascular Plants of Florida. University Press of Florida. Gainesville, Florida.