quantifying species similarity and species diversity … species similarity and... · quantifying...
TRANSCRIPT
QUANTIFYING SPECIES SIMILARITY AND SPECIES DIVERSITY OF SMALL MAMMALS IN IPEN AND CLOSED HABITATS
Siti Hasmah Binti Taha
middot
Master of Science 2011
QUANTIFYING SPECIES SIMILARITY AND SPECIES
DIVERSITY OF SMALL MAMMALS IN OPEN AND
CLOSED HABIT A TS PKHIDMAT MAKLUMAT AKADEMIK
111111111 rli~ii 111111111 1000246306
SITI HASMAH BINTI T AHA
A thesis submitted in fulfillment of the requirements for the degree of
Master of Science (Quantitative Ecology)
Faculty of Resource Science and Technology UNIVERSITI MALAYSIA SARA W AK
2010
Declaration
I hereby declare that except as acknowledge in the text the work presented in the thesis is entirely my own work and has not been submitted eitherin part or in whole for another degree or qualification at this or any other university or institutions of higher learning
Siti Hasmah Binti Taha November 2010
DEDICATION
I dedicate my work to my wonderful family friends and mentors and to those who know me and make my life worth living for
11
I
Acknowledgments
There had been wonderful opportunity for me in past two years to learn many things that I never
exposed during my undergraduate studies The statistic ecology is interested scope to discovered
since the lack studies conducted about statistic ecology in Malaysia especially in Borneo itself
Million thanks to my principle supervisor Mr Charlie Justin Mergie Laman (Mf Charlie) who
was willing to give me opportunity and believe in me to conduct a great study Without his
support advice and full of guidance probably I could never manage to complete my master
thesis during these two years studies I would like to thank his kindness by assign me as research
assistant for ten months before I register my master study under his supervision Thousand
thanks to my beloved co-supervisor Professor Dr Mohd Tajuddin Abdullah (Mr T) who never
failed to give me full support guidance and scientific experiences to share with me as I can
finished my master thesis I am so grateful since Mr T becoming my second times co-supervisor
after my degree studies in past 3 years Again thousand thanks to him for sharing his valuable
scientific knowledge and for being a good teacher to me
Thousand thanks to UNIMAS which give me strong financial support This research funding
from this study came from UNIMAS fundamental grant FRGS06(05)6542007(l9) In addition
I would like to thank UNIMAS for the ZAMALAH scholarship given from November 2008
until October 20 I O
I would also like to express my personal gratitude to the foHowing Park Warden of Sarna Jaya
Nature Reserve and Kubah National Park for granting pennission and assisting me in getting my
III
fieldwork at Sarna Jaya Nature Reserve (SJNR) and Kubah National Park (KNP) The pennit
number for this study is No NNC9074 (lV)-29 and No 272009
Individual gratitude expressed to Mr Mike Meredith who conducted a good workshop in
statistical methodology to use for my master thesis BeSS workshop on 24 February 2009 until 5
March 2009 which held at Sarna Jaya Nature Reserve gives me more valuable infonnation about
statistical method and an opportunity to apply some of statistical method in my scope of study
Special thanks to the wonderful laboratory assistants Mr Besar Ketol Mr Raymond Patrick ak
Atet Mr Nasron Ahmad and Mr Mohamad Norazlan Bujang Belly from UNIMAS two
important porters from Serian Mr Kevin ak Egoh and Mr Robin ak Jejin for helping me in
making my fieldwork a successful trip Thanks to all of them because willing to help and stay in
national parks for several months Also thanks to the Faculty of Resource Science and
Technology (FRST) UNIMAS administrative staffs for administrative support
Thanks to my loving parents Mr Taha Usup and Mrs Rabiah Johari my brothers sisters and
the special one Mr Mohd Aliy Muhaimin who gives me full moral support and encouragement
during my two years of master study Also not forgotten to the best friends ever from Department
of Zoology (especially to LKULK member PGs from Level 3 Zoonoses room and Museum
room) who always give me support and constructive criticisms about my studies and special
thanks to my colleague Miss Siti Mariam Jamaluddin who shared with me her knowledge
experience and friendship during our field sampling together I will never forget our strong
bonding and good times together
IV
shy
Abstract
( Research on species similarity and species diversity of small mammals in 10 repetitive sampling
occasions (500 trap nights) was conducted in two different habitats an open and closed habitat
The first sampling were carried out in Sarna Jaya Nature Reserve (SJNR) from April to
September 2008 and second sampling conducted in Kubah National Park (KNP) from February
to June 2009 Closed model was chosen where sampling was conducted for five consecutive trap
days in 10 repetitive sessions each session has about five days to one week rest A hundred of
cage traps were set up and placed in grid system at each study site respectively and markshy
recapture method were used to capture the small mammals l
Sarna Jaya Nature Reserve situated in Kuching Sarawak can be classified as geographically
closed habitat or an island habitat A total of 330 individuals of small mammals been trapped in
5000 trapnights consist of six species namely Calloscuirus notatus C prevostii borneensis
Sundamys muelleri Tupaia tana T minor and Rhinoscuirus lauticaudatlls from three families
(Tupaiidae Scuiridae and Muridae) and from two orders (Scandentia and Rodentia) Species
similarities of small mammals species composition on 10 repetitive sampling occasions from
SJNR were calculated and analysed Jaccard similarity coefficient and Sorensen similarity
coefficient indicated a value of 1 in seven tested sampling occasions (3 vs 4 3 vs 5 4 vs 5 3 vs
9 4 vs 9 5 vs 9 and 2 vs 10) Occasion 7 vs occasion 10 noted high values for Morisita-Hom
similarity coefficient (0991) and 0909 is the highest value for Bray-Curtis similarity coefficient
(occasion 9 vs occasion 10) The differences of value for four similarity coefficient indices may
he influenced by factors like sample size and abundance of most abundant species
v
Kubah National Park is classified as a geographically open habitat for this study A total of 98
small mammals were captured in a total of 5000 trapnights consisting of 10 species namely
Maxomys rajah M surifer M whiteheadi Leopoldamys sabanus Lariscus insignis
Sundascuirus lowi Tupaia tana T dorsalis T glis and Echinosorex gymnlllUs from four
families (Erinaceidae Scuiridae Tupaiidae and Muridae) of orders (Rodentia Scandentia and
Insectivora) Species similarity of small mammals in 10 repetitive sampling occasions showed
differences in term of similarity value for four similarity indices All similarity indices noted 0
value for three tested sampling occasions (1 vs 8 5 vs 8 and 8 vs 9) which indicates that there
are no shared species between two tested sampling occasions Occasion 9 vs occasion 10 noted
high value for Jaccard similarity coefficient (075) and Sorensen similarity coefficient (0857)
0982 is the highest value for Morista-Hom similarity coefficient noted from occasion 4 vs
occasion 5 while two tested sampling occasions (4 vs 10 and 6 vs 10) indicate high value for
Bray-Curtis similarity coefficient (075)
The species diversity of small mammals in Kubah National Park (080) is higher than Sarna Jaya
Nature Reserve (046) In conclusion Sarna Jaya Nature Reserve which classified as small
island area comprise of a smaller number in terms of animal species composition due to limited
resources in various aspects (food shelter area) compared to a much wider area which
surrounded by large forested area (Kubah National Park)
KEY WORDS- small mammals similarity indices diversity indices repetitive sampling open
and closed habitat
vi
Abstrak-Kajian tentang persamaan spesies dan kepelbagaian spesies mamalia kedl dalam 10
ulangan ambilan sampel (500 perangkaplmalam) telah di jalankan di dua habitat yang
berlainan habitat yang terbuka dan habitat yang tertlltup Pengambilan sampel yang pertama
telah di jalankan di Hutan Simpan Sama Jaya (SJNR) pada April hingga September 2008 dan
pengambilan sam pel yang kedua di lakukan di Taman Negara Kubah (KNP) pada Februari
hingga Jun 2009 model tertutup telah di pilih di mana pengambilan sampel dyalankan untuk
lima hari berturut-turnt dalam 10 ulangan ambilan sampel setiap ambilan sampel mempllnyai
masa rehat lima hari ke satll minggu Sebanyak seratus perangkap telah di pasang dan di
letakkan mengikut sistem grid di setiap kawasan kajian dan kaedah tanda-tangkap semula
digunakan untllk menangkap mamalia keci
Hman Simpan Sama Jaya terletak di Kuching Sarawak diklasifikasikan sebagai geograji habitat
yang tertutup juga di kenali sebagai habitat pulau Sebanyak 330 ekor mamalia kedl telah di
perangkap dalam 5000 perangkaplmalam mengandungi enam spesies yang dinamakan sebagai
Calloscuirus notatus C prevostii borneensis Sundamys muelleri Tupaia tana I minor dan
Rhinoscuirlls lauticaudatus daripada tiga lamili (Tupaiidae Scuiridae dan Muridae) dan
daripada dua order (Scandentia dan Rodentia) Persamaan dalam komposisi spesies mamalia
kedl dalam 10 ulangan ambilan sampel dari SJNR telah di kira dan di analisa Persamaan
koefisien Jaccard dan persaman koefisien Sorensen menlll1jukkan nilai 1 dalam tujuh lIjian
ulangan ambilan sampel (3 antara 4 3 antara 5 4 antara 5 3 antara 9 4 antara 9 5 antara 9
dan 2 antaJa 10) Antara peristiwa ke 7 dan ke 10 menunjllkkan nilai bagi persamaan koefiesin
Morisita-Horn yang tinggi (0991) dan 0909 merupakan nilai yang tertinggi bagi persaman
k~efisien Bray-Curtis (peristiwa 9 dan 10) Perbezaan pada nilai untllk empat persamaan
Vll
koefzsien indeks mungkin di perngaruhi oleh beberapa Jaktor seperti saiz sam pel danbanyaknua
spe ies yang amat banyak
Taman Negara Kubah (KNP) diklasifikasikan sebagai geograji habitat yang terbuka untuk kajian
ini Sebanyak 98 ekor mamalia kecil telah berjaya di tangkap dalam sejumlah 500
perangkaplmalam mengandungi 10 spesies yang dinamakan sebagai Maxomys rajah M
surikr M whiteheadi Leopoldamys sabanus Larisclis ins ignis Sundascuirus lowi Tupaia tana
T dorsalis I glis dan Echinosorex gymnurLts daripada empat Jamili (Erinaceidae Scuiridae
Tilpaiidae dan Muridae) daripada tiga order (Rodentia Scandentia dan lnsectivora)
Persamaan spesies mamalia kecil dalam 10 ulangan ambilan sampel menunjukkan perbezaan
dari segi nilai persamaan untuk empat persamaan indeks Semua persamaan inde~
menunjukkan nilai 0 untuk tiga ujian ulangan ambilan sampel (1 antara 8 5 antara 8 dan 8
antara 9) yang mana menunjukkan tidak terdapat perkongsian spesies antara dua ujian ulangan
ambilan sampel Ujian antara peristiwa 9 dan 10 menllnjukkan nilai yang tinggi untuk
persamaan koejisien Jaccard (075) dan persamaan koejisien Sorensen (0857 0982
merupakan nilai yang tertinggi bagi persamaan koejisien Morisita-Horn daripada ambilan
sampel 4 dan 5 manakala dua ujaina ambilan sampel (4 antara 10 dan 6 antara 10)
menunjukkan niali yang tinggi bagi persamaan koejisien Bray-Curtis (075)
Kepelbagaian spesies diveristi bagi mamalia kecil di Taman Negara Kubah (080) adalah tinggi
daripada Hutan Simpan Sama Jaya (SJNR) SecQa kesimpulannya Hutan Simpan Sama Jaya
yang juga diklasifikasi sebagai kawasan pulau yang kecil mengandungi jumlah komposisi
mamalia kecil ynag sedikit disebabkan oleh sumber ynag terhad dari pelbagai aspek (makanan
Vlll
~~--~~~------------------------------------------~~-===-----------------~~----
perlidungan dan kawasan) berbanding dengan Taman Negara Kubah yang mempunyai kawasan
yang [lias yang di kelilingi oleh kawasan yang berhutan
KATA KUNCI- mamalia kedl persamaan indeks diversiti indeks ulangan ambilan sampel
habitat terbuka dan tertutup
IX
Pusat Khidmat M klVMERSm MA ya umatAJcademik
uuolY lA SAJUWAJ(
Table of Contents
Title Page
Declaration
Dedication
Acknowledgement
Abstract
Abstrak
Table of Contents
List of Figures
List of Tables
Chapter 1 Introduction
11 General Introduction
12 Species Similarity
13 Species Diversity
14 Cluster Analysis
15 Closure Concepts and Closed Population Model
151 Closure Concepts
152 Closed Population Model
16 Open Habitat and Closed Habitat
17 Small Mammals
171 Biology and Ecology
172 Related Study on Small Mammals
18 Justification
19 Objectives and Hypothesis
191 Objectives
192 Hypothesis
110 Outline ofThesis
X
Page
11
III
IV
VI
Vll
x
XIV
XVI
2
5
10
11
12
12
13
20
26
27
28
28
Chapter 2
21
22
23
24
25
Chapter 3
31
Methodology
Study Sites
211 Sarna Jaya Nature Reserve 29
212 Kubah National Park 31
Field Methods
221 Sampling Protocol 33
Repetitive Sampling 35
Processing of Specimens
241 Handling and Identification 36
242 Measurements 36
Data Analysis
251 Relative Abundance 36
252 Species Diversity 37
25 21 Shannon Index 37
252 2 Simpson Index 37
253 Species Similarity 39
2521 Jaccards Similarity Coefficients 39
2522 Sorensens Similarity Coefficients 40
25 23 Morisita-Hom Similarity Coefficients 40
25 24 Bray-Curtis Similarity Coefficients 40
254 Cluster Analysis 41
255 Zar t-test 41
Results
Species Composition 43
311 Sarna Jaya Nature Reserve
3111 Species List 43
3112 Cumulative Graph 45
312 Kubah National Park
3121 Species List 47
Xl
I 3122 Cumulative Graph 49
313 Sarna Jaya Nature Reserve and Kubah National Park
3131 Species List 51
3132 Cumulative Graph 54
32 Species Similarity
321 Sarna Jaya Nature Reserve 58
322 Kubah National Park 63
33 Cluster Analysis
331 Sarna Jaya Nature Reserve 68
332 Kubah National Park 72
34 Species Diversity
341 Sarna Jaya Nature Reserve 76
342 Kubah National Park 79
35 Zar t-test
351 Sarna Jaya Nature Reserve 82
352 Kubah National Park 83
36 Previous Study
36l Sarna Jaya Nature Reserve 84
362 Kubah National Park 86
Chapter 4 Discussion
41 General Discussion
411 Species Composition 88
412 Factors Affected Capture Probabilities 91
42 Species Similarity 103
43 Cluster Analysis 107
44 Species Diversity 108
45 Open Habitat and Closed Habitat 111
Xll
Chapter 5 Conclusions and Recommendations
51 Conclusions 114
52 Recommendation for Future Studies 116
References 117
List of publications 132
List of Appendices
Appendix A 134
Appendix 8 154
Appendix C 160
Appendix D 162
Appendix E 167
Appendix F 174
Appendix G 177
Xlll
List of Figures
Page
1 Maps of Sarna Jaya Nature Reserve 30
2 Maps of Kubah National Park 32
3 Grid sampling design 34
4 Comparison of total individual caught and number of species of small 46 mammals in Sarna Jaya Nature Reserve
5 Total number of small mammals captured in Sarna Jaya Nature Reserve in 47 overall 10 occasions
6 Comparison of total individual caught and number of speCles of small 50 mammals in Kubah National Park
7 Total number of small mammals captured in Kubah National Park in overall 10 51 occaSlons
8 Comparison number of individuals captured in two different sites (Sarna Jaya 56 Nature Reserve and Kubah National Park)
9 Comparison number of species captured ill two different sites (Sarna Jaya 57 Nature Reserve and Kubah National Park)
10 Species accumulation curve in Sarna Jaya Nature Reserve and Kubah National 58 Park
II Jaccards similarity coefficients dendrogram of small mammals in Sarna Jaya 69 Nature Reserve
12 Sorensens similarity coefficients dendrogram of small mammals in Sarna Jaya 70 Nature Reserve
13 Modified Morisitas similarity dendrogram of small mammals in Sarna Jaya 71 Nature Reserve
14 Bray-Curtis similarity dendrogram dendrogram of small mammals ill Sarna 72 Jaya Nature Reserve
XlV
15 Jaccard s similarity coefficients dendrogram of small mammals III Kubah 73 National Park
16 Sorensens similarity coefficients dendrogram of small mammals III Kubah 74 National Park
17 Modified Morisitas similarity coefficients dendrogram of smaH mammals in 75 Kubah National Park
18 Bray-Curtis similarity coefficients dendrogram of small mammals in Kubah 76 National Park
19 Singletons doubletons unique and duplicates of small mammals in Sarna Jaya 79 Nature Reserve
20 Singletons doubletons umque and duplicates of small mammals in Kubah 82 National Park
xv
List of Tables
Page
1 Total sampling efforts for Sama Jaya Nature Reserve and Kubah National Park 35
2 Species composition of small mammals captured in Sama Jaya Nature Reserve 44
3 Species composition of small mammals captured in Kubah National Park 48
4 Comparison of the number of captures and species counts of small mammals at 53 Sama Jaya Nature Reserve and Kubah National Park by using family
5 Number of individuals and relative abundance for small mammals captured at 54 Sama Jaya Naturee Reserve and Kubah National Park
6 Jaccard similarity coefficient index for small mammals at 10 repetitive 60 sampling occasions in Sama Jaya Nature Reserve
7 Sorensen similarity coefficient index for small mammals at 10 repetitive 6 t sampling occasions in Sama Jaya Nature Reserve
8 Morisita-Horn similarity coefficient index for small mammals at 10 repetitive 62 sampling occasions in Sama Jaya Nature Reserve
9 Bray-Curtis similarity coefficient index for small mammals at 10 repetitive 63 sampling occasions in Sama Jaya Nature Reserve
10 Jaccard similarity coefficient index for small mammals at 10 repetitive 64 sampling occasions in Kubah National Park
11 Sorensen similarity coefficient index for small mammals at 10 repetitive 65 sampling occasions in Kubah National Park
12 Morisita-Horn similarity coefficient index for small mammals at 10 repetitive 66 sampling occasions in Kubah National Park
13 Bray-Curtis similarity coefficient index for small mammals at 10 repetitive 67 sampling occasions in Kubah National Park
14 Species diversity of small mammals at 10 repetitive sampling occasions 10 77 Sama Jaya Nature Reserve (EstimateS)
15 Species diversity of small mammals at 10 repetitive sampling occasions 10 80 Kubah National Park (EstimateS)
XVI
16 Value of Zar t-test for small mammals captured in Sarna Jaya Nature Reserve 83
17 Value of Zar t-test for small mammals captured in Kubah National Park 84
18 Previous studies of small mammals in Sarna Jaya Nature Reserve 86
19 Previous studies of small mammals in Kubah National Park 88
20 Summary number of individuals captured and species composition of small 90 mammals at Sarna Jaya Nature Reserve and Kubah National Park
21 Shannon index and Simpson index for Sarna Jaya Nature Reserve and Kubah 91 National Park
22 Summary of similarity indices for small mammals captured III Sarna Jaya 104 Nature Reserve
23 Summary of similarity indices for small mammals captured in Kubah National 106 Park
XVll
CHAPTER ONE
Introduction
11 General Introduction
Ecological studies can be divided into two components extensive studies and intensive studies
According to Southwood and Henderson (2000) extensive studies frequently carried out to
present an infonnation on distribution and abundance for supplementary conservation and
management program in which the samples area are much larger than intensive studies Intensive
studies generate infonnation about the spatial pattern of populations and it is often possible to
relay the level of the population to oceanographic or climatic factors (Southwood amp Henderson
2000) In many communities studies ecologists acquire a list of the species composition that
occurs in each of several communities and if the quantitative sampling has been conducted some
measure of the relative abundance of each species (Krebs 1999)
Mostly research which been carried out is more focused on species diversity only and just a little
previous tudy been done to quantify the species similarity in addition to species diversity
Quantifying similarity and diversity of animals in tenn of species composition and abundance
will provide useful information about the population of the animal species at the particular study
sites (Magurran 2004)
Species similarity signify the similarity of each study or sample or sampling unit to each other
while the diversity of each unit to one another been signify as species diversity (Krebs 1999) It
is the intension of this study to address both species similarity and species diversity analysis
simultaneously on repetitive sampling of small mammals done on an open and closed habitat
12 Species Diversity
Krebs (1999) noted that a biological community has an attribute of species diversity and recently
there are many different ways have been suggested for measuring the species diversity Basically
it depends on the objective for the study conducted and the information that we want to see from
the samples collected Diversity measures require an estimate of species importance in the
community (Krebs 1999)
Species diversity for this aspect can be defined as the number of different species in a particular
area (species richness) weighted by some measure of abundance such as number of individuals or
biomass (Magurran 1998) Species evenness is part of the measures of species diversity which is
the relative abundance with which each species is represented in the particular area Species
evenness is a measure of biodiversity which qualifies how equal the community is numerically
Evenness is also a part of species diversity measure which compares the similarity of the
population size of each of the species present
Species richness and species evenness are probably the most frequently used measures of the
total biodiversity of the region (Magurran 1998 2004) Species richness noted that the observed
2
species number increases non-linearly with sampling effort Species richness and evenness are
component of biodiversity that mayor may not be correlated with one another and with pattern of
species abundance Gotelli and Colwell (2001) stated that standardising by the number of
individual collected and standardising by area or sampling effort can lead to the different
conclusions regarding species richness
According to Southwood and Henderson (2000) diversity can be divided into three categories
(a) a diversity- the diversity of species within a community or habitat
(b) f3 diversity- the measure of the rate and extent of change in species along a gradient from
one habitat to others and
(c) y diversity- the richness in species of a range of a habitats in a geographical area which
is a consequence of the a diversity of the habitats together with the extent of the (3 diversity
between them
Shannon index is one of several diversity indices used to measure diversity in categorical data
According to Krebs (1999) Shannon index is used for rare species while Simpson index is used
which emphasize the common species The advantage of Shannon index is it takes into account
the number of species and the evenness of the species index is increased either by having
additional unique species or by having better species evenness The Shannon index is the
measure of infonnation content should be used only on random samples drawn from a large
community in which the total number of species is known (Krebs 1999)
3
Shannon index is the most popular measures of the species diversity which based on infonnation
theory According to Krebs (1999) there are four types of infonnation that might be collected
regarding order in the community
(8) The number of species
(b) The number of individuals in each species
(c) The places occupied by individuals of each species and
(d) The places occupied by the individuals as separate individuals
Simpson index also been used to quantify species diversity of small mammals derived by
Simpson (1943) The basis of this index is the probability of two individuals being conspecifics
Here Simpsons Reciprocal Index (110) is used where the values start 1 ([owest possible
figures) and it represents a community containing only one species to the maximum number
which represent the total number of species caught
According to Lande (1996) the species richness Shannon infonnation and Simpson diversity are
the most commonly used nonparametric measures of species diversity The proportion of the total
diversity found within communities provides a natural measure of similarity among multiple
communities The expected similarity among multiple random samples from the same depends
on the number of samples and on the underlying measures of diversity Measures of species
divers~ play a central role in ecology and conservation biology which giving the number of
species composition and the abundance of animals at the particular area
4
uSiJt hidmal MakJumal Akad~rrlliI UMVERsm MALAYSIA SA WAf(
13 Species Similarity
Krebs (1999) noted that resemblance measure can be expressed either (a) similarity degree of
resemblance or (b) dissimilarity degree of difference Magurran (2004) stated that similarity or
dissimilarity indices provide quantitative bases of assessment in comparing species composition
and biodiversity of two or more assemblages in taxonomic and ecological research Krebs (1999)
stated that we need to use similarity coefficients or similarity indices that give some measure of
the relative abundance of each species in the two samples if we are dealing to quantify the
similarity oftwo such samples or community
Similarity matrix is the opposite concept to the distance matrix The elements of a similarity
matrix measure pairwise similarities of objects The greater similarity of two objects will
produced the high value of the measure Each similarity measures has its own properties and
generally gives different perspectives of the data turning the matter of choice not trivial
(Laurenco et al 2004)
According to Boyce and Ellison (2001) and Krebs (1999) similarity indices can be divided into
two major classes first is those that include joint absences or zero-zero matches (species that are
in neither of the two samples for which a similarity is being computed but are present in at least
one other plot in the study) and second class is those that do not include the zero-zero matches
5

Declaration
I hereby declare that except as acknowledge in the text the work presented in the thesis is entirely my own work and has not been submitted eitherin part or in whole for another degree or qualification at this or any other university or institutions of higher learning
Siti Hasmah Binti Taha November 2010
DEDICATION
I dedicate my work to my wonderful family friends and mentors and to those who know me and make my life worth living for
11
I
Acknowledgments
There had been wonderful opportunity for me in past two years to learn many things that I never
exposed during my undergraduate studies The statistic ecology is interested scope to discovered
since the lack studies conducted about statistic ecology in Malaysia especially in Borneo itself
Million thanks to my principle supervisor Mr Charlie Justin Mergie Laman (Mf Charlie) who
was willing to give me opportunity and believe in me to conduct a great study Without his
support advice and full of guidance probably I could never manage to complete my master
thesis during these two years studies I would like to thank his kindness by assign me as research
assistant for ten months before I register my master study under his supervision Thousand
thanks to my beloved co-supervisor Professor Dr Mohd Tajuddin Abdullah (Mr T) who never
failed to give me full support guidance and scientific experiences to share with me as I can
finished my master thesis I am so grateful since Mr T becoming my second times co-supervisor
after my degree studies in past 3 years Again thousand thanks to him for sharing his valuable
scientific knowledge and for being a good teacher to me
Thousand thanks to UNIMAS which give me strong financial support This research funding
from this study came from UNIMAS fundamental grant FRGS06(05)6542007(l9) In addition
I would like to thank UNIMAS for the ZAMALAH scholarship given from November 2008
until October 20 I O
I would also like to express my personal gratitude to the foHowing Park Warden of Sarna Jaya
Nature Reserve and Kubah National Park for granting pennission and assisting me in getting my
III
fieldwork at Sarna Jaya Nature Reserve (SJNR) and Kubah National Park (KNP) The pennit
number for this study is No NNC9074 (lV)-29 and No 272009
Individual gratitude expressed to Mr Mike Meredith who conducted a good workshop in
statistical methodology to use for my master thesis BeSS workshop on 24 February 2009 until 5
March 2009 which held at Sarna Jaya Nature Reserve gives me more valuable infonnation about
statistical method and an opportunity to apply some of statistical method in my scope of study
Special thanks to the wonderful laboratory assistants Mr Besar Ketol Mr Raymond Patrick ak
Atet Mr Nasron Ahmad and Mr Mohamad Norazlan Bujang Belly from UNIMAS two
important porters from Serian Mr Kevin ak Egoh and Mr Robin ak Jejin for helping me in
making my fieldwork a successful trip Thanks to all of them because willing to help and stay in
national parks for several months Also thanks to the Faculty of Resource Science and
Technology (FRST) UNIMAS administrative staffs for administrative support
Thanks to my loving parents Mr Taha Usup and Mrs Rabiah Johari my brothers sisters and
the special one Mr Mohd Aliy Muhaimin who gives me full moral support and encouragement
during my two years of master study Also not forgotten to the best friends ever from Department
of Zoology (especially to LKULK member PGs from Level 3 Zoonoses room and Museum
room) who always give me support and constructive criticisms about my studies and special
thanks to my colleague Miss Siti Mariam Jamaluddin who shared with me her knowledge
experience and friendship during our field sampling together I will never forget our strong
bonding and good times together
IV
shy
Abstract
( Research on species similarity and species diversity of small mammals in 10 repetitive sampling
occasions (500 trap nights) was conducted in two different habitats an open and closed habitat
The first sampling were carried out in Sarna Jaya Nature Reserve (SJNR) from April to
September 2008 and second sampling conducted in Kubah National Park (KNP) from February
to June 2009 Closed model was chosen where sampling was conducted for five consecutive trap
days in 10 repetitive sessions each session has about five days to one week rest A hundred of
cage traps were set up and placed in grid system at each study site respectively and markshy
recapture method were used to capture the small mammals l
Sarna Jaya Nature Reserve situated in Kuching Sarawak can be classified as geographically
closed habitat or an island habitat A total of 330 individuals of small mammals been trapped in
5000 trapnights consist of six species namely Calloscuirus notatus C prevostii borneensis
Sundamys muelleri Tupaia tana T minor and Rhinoscuirus lauticaudatlls from three families
(Tupaiidae Scuiridae and Muridae) and from two orders (Scandentia and Rodentia) Species
similarities of small mammals species composition on 10 repetitive sampling occasions from
SJNR were calculated and analysed Jaccard similarity coefficient and Sorensen similarity
coefficient indicated a value of 1 in seven tested sampling occasions (3 vs 4 3 vs 5 4 vs 5 3 vs
9 4 vs 9 5 vs 9 and 2 vs 10) Occasion 7 vs occasion 10 noted high values for Morisita-Hom
similarity coefficient (0991) and 0909 is the highest value for Bray-Curtis similarity coefficient
(occasion 9 vs occasion 10) The differences of value for four similarity coefficient indices may
he influenced by factors like sample size and abundance of most abundant species
v
Kubah National Park is classified as a geographically open habitat for this study A total of 98
small mammals were captured in a total of 5000 trapnights consisting of 10 species namely
Maxomys rajah M surifer M whiteheadi Leopoldamys sabanus Lariscus insignis
Sundascuirus lowi Tupaia tana T dorsalis T glis and Echinosorex gymnlllUs from four
families (Erinaceidae Scuiridae Tupaiidae and Muridae) of orders (Rodentia Scandentia and
Insectivora) Species similarity of small mammals in 10 repetitive sampling occasions showed
differences in term of similarity value for four similarity indices All similarity indices noted 0
value for three tested sampling occasions (1 vs 8 5 vs 8 and 8 vs 9) which indicates that there
are no shared species between two tested sampling occasions Occasion 9 vs occasion 10 noted
high value for Jaccard similarity coefficient (075) and Sorensen similarity coefficient (0857)
0982 is the highest value for Morista-Hom similarity coefficient noted from occasion 4 vs
occasion 5 while two tested sampling occasions (4 vs 10 and 6 vs 10) indicate high value for
Bray-Curtis similarity coefficient (075)
The species diversity of small mammals in Kubah National Park (080) is higher than Sarna Jaya
Nature Reserve (046) In conclusion Sarna Jaya Nature Reserve which classified as small
island area comprise of a smaller number in terms of animal species composition due to limited
resources in various aspects (food shelter area) compared to a much wider area which
surrounded by large forested area (Kubah National Park)
KEY WORDS- small mammals similarity indices diversity indices repetitive sampling open
and closed habitat
vi
Abstrak-Kajian tentang persamaan spesies dan kepelbagaian spesies mamalia kedl dalam 10
ulangan ambilan sampel (500 perangkaplmalam) telah di jalankan di dua habitat yang
berlainan habitat yang terbuka dan habitat yang tertlltup Pengambilan sampel yang pertama
telah di jalankan di Hutan Simpan Sama Jaya (SJNR) pada April hingga September 2008 dan
pengambilan sam pel yang kedua di lakukan di Taman Negara Kubah (KNP) pada Februari
hingga Jun 2009 model tertutup telah di pilih di mana pengambilan sampel dyalankan untuk
lima hari berturut-turnt dalam 10 ulangan ambilan sampel setiap ambilan sampel mempllnyai
masa rehat lima hari ke satll minggu Sebanyak seratus perangkap telah di pasang dan di
letakkan mengikut sistem grid di setiap kawasan kajian dan kaedah tanda-tangkap semula
digunakan untllk menangkap mamalia keci
Hman Simpan Sama Jaya terletak di Kuching Sarawak diklasifikasikan sebagai geograji habitat
yang tertutup juga di kenali sebagai habitat pulau Sebanyak 330 ekor mamalia kedl telah di
perangkap dalam 5000 perangkaplmalam mengandungi enam spesies yang dinamakan sebagai
Calloscuirus notatus C prevostii borneensis Sundamys muelleri Tupaia tana I minor dan
Rhinoscuirlls lauticaudatus daripada tiga lamili (Tupaiidae Scuiridae dan Muridae) dan
daripada dua order (Scandentia dan Rodentia) Persamaan dalam komposisi spesies mamalia
kedl dalam 10 ulangan ambilan sampel dari SJNR telah di kira dan di analisa Persamaan
koefisien Jaccard dan persaman koefisien Sorensen menlll1jukkan nilai 1 dalam tujuh lIjian
ulangan ambilan sampel (3 antara 4 3 antara 5 4 antara 5 3 antara 9 4 antara 9 5 antara 9
dan 2 antaJa 10) Antara peristiwa ke 7 dan ke 10 menunjllkkan nilai bagi persamaan koefiesin
Morisita-Horn yang tinggi (0991) dan 0909 merupakan nilai yang tertinggi bagi persaman
k~efisien Bray-Curtis (peristiwa 9 dan 10) Perbezaan pada nilai untllk empat persamaan
Vll
koefzsien indeks mungkin di perngaruhi oleh beberapa Jaktor seperti saiz sam pel danbanyaknua
spe ies yang amat banyak
Taman Negara Kubah (KNP) diklasifikasikan sebagai geograji habitat yang terbuka untuk kajian
ini Sebanyak 98 ekor mamalia kecil telah berjaya di tangkap dalam sejumlah 500
perangkaplmalam mengandungi 10 spesies yang dinamakan sebagai Maxomys rajah M
surikr M whiteheadi Leopoldamys sabanus Larisclis ins ignis Sundascuirus lowi Tupaia tana
T dorsalis I glis dan Echinosorex gymnurLts daripada empat Jamili (Erinaceidae Scuiridae
Tilpaiidae dan Muridae) daripada tiga order (Rodentia Scandentia dan lnsectivora)
Persamaan spesies mamalia kecil dalam 10 ulangan ambilan sampel menunjukkan perbezaan
dari segi nilai persamaan untuk empat persamaan indeks Semua persamaan inde~
menunjukkan nilai 0 untuk tiga ujian ulangan ambilan sampel (1 antara 8 5 antara 8 dan 8
antara 9) yang mana menunjukkan tidak terdapat perkongsian spesies antara dua ujian ulangan
ambilan sampel Ujian antara peristiwa 9 dan 10 menllnjukkan nilai yang tinggi untuk
persamaan koejisien Jaccard (075) dan persamaan koejisien Sorensen (0857 0982
merupakan nilai yang tertinggi bagi persamaan koejisien Morisita-Horn daripada ambilan
sampel 4 dan 5 manakala dua ujaina ambilan sampel (4 antara 10 dan 6 antara 10)
menunjukkan niali yang tinggi bagi persamaan koejisien Bray-Curtis (075)
Kepelbagaian spesies diveristi bagi mamalia kecil di Taman Negara Kubah (080) adalah tinggi
daripada Hutan Simpan Sama Jaya (SJNR) SecQa kesimpulannya Hutan Simpan Sama Jaya
yang juga diklasifikasi sebagai kawasan pulau yang kecil mengandungi jumlah komposisi
mamalia kecil ynag sedikit disebabkan oleh sumber ynag terhad dari pelbagai aspek (makanan
Vlll
~~--~~~------------------------------------------~~-===-----------------~~----
perlidungan dan kawasan) berbanding dengan Taman Negara Kubah yang mempunyai kawasan
yang [lias yang di kelilingi oleh kawasan yang berhutan
KATA KUNCI- mamalia kedl persamaan indeks diversiti indeks ulangan ambilan sampel
habitat terbuka dan tertutup
IX
Pusat Khidmat M klVMERSm MA ya umatAJcademik
uuolY lA SAJUWAJ(
Table of Contents
Title Page
Declaration
Dedication
Acknowledgement
Abstract
Abstrak
Table of Contents
List of Figures
List of Tables
Chapter 1 Introduction
11 General Introduction
12 Species Similarity
13 Species Diversity
14 Cluster Analysis
15 Closure Concepts and Closed Population Model
151 Closure Concepts
152 Closed Population Model
16 Open Habitat and Closed Habitat
17 Small Mammals
171 Biology and Ecology
172 Related Study on Small Mammals
18 Justification
19 Objectives and Hypothesis
191 Objectives
192 Hypothesis
110 Outline ofThesis
X
Page
11
III
IV
VI
Vll
x
XIV
XVI
2
5
10
11
12
12
13
20
26
27
28
28
Chapter 2
21
22
23
24
25
Chapter 3
31
Methodology
Study Sites
211 Sarna Jaya Nature Reserve 29
212 Kubah National Park 31
Field Methods
221 Sampling Protocol 33
Repetitive Sampling 35
Processing of Specimens
241 Handling and Identification 36
242 Measurements 36
Data Analysis
251 Relative Abundance 36
252 Species Diversity 37
25 21 Shannon Index 37
252 2 Simpson Index 37
253 Species Similarity 39
2521 Jaccards Similarity Coefficients 39
2522 Sorensens Similarity Coefficients 40
25 23 Morisita-Hom Similarity Coefficients 40
25 24 Bray-Curtis Similarity Coefficients 40
254 Cluster Analysis 41
255 Zar t-test 41
Results
Species Composition 43
311 Sarna Jaya Nature Reserve
3111 Species List 43
3112 Cumulative Graph 45
312 Kubah National Park
3121 Species List 47
Xl
I 3122 Cumulative Graph 49
313 Sarna Jaya Nature Reserve and Kubah National Park
3131 Species List 51
3132 Cumulative Graph 54
32 Species Similarity
321 Sarna Jaya Nature Reserve 58
322 Kubah National Park 63
33 Cluster Analysis
331 Sarna Jaya Nature Reserve 68
332 Kubah National Park 72
34 Species Diversity
341 Sarna Jaya Nature Reserve 76
342 Kubah National Park 79
35 Zar t-test
351 Sarna Jaya Nature Reserve 82
352 Kubah National Park 83
36 Previous Study
36l Sarna Jaya Nature Reserve 84
362 Kubah National Park 86
Chapter 4 Discussion
41 General Discussion
411 Species Composition 88
412 Factors Affected Capture Probabilities 91
42 Species Similarity 103
43 Cluster Analysis 107
44 Species Diversity 108
45 Open Habitat and Closed Habitat 111
Xll
Chapter 5 Conclusions and Recommendations
51 Conclusions 114
52 Recommendation for Future Studies 116
References 117
List of publications 132
List of Appendices
Appendix A 134
Appendix 8 154
Appendix C 160
Appendix D 162
Appendix E 167
Appendix F 174
Appendix G 177
Xlll
List of Figures
Page
1 Maps of Sarna Jaya Nature Reserve 30
2 Maps of Kubah National Park 32
3 Grid sampling design 34
4 Comparison of total individual caught and number of species of small 46 mammals in Sarna Jaya Nature Reserve
5 Total number of small mammals captured in Sarna Jaya Nature Reserve in 47 overall 10 occasions
6 Comparison of total individual caught and number of speCles of small 50 mammals in Kubah National Park
7 Total number of small mammals captured in Kubah National Park in overall 10 51 occaSlons
8 Comparison number of individuals captured in two different sites (Sarna Jaya 56 Nature Reserve and Kubah National Park)
9 Comparison number of species captured ill two different sites (Sarna Jaya 57 Nature Reserve and Kubah National Park)
10 Species accumulation curve in Sarna Jaya Nature Reserve and Kubah National 58 Park
II Jaccards similarity coefficients dendrogram of small mammals in Sarna Jaya 69 Nature Reserve
12 Sorensens similarity coefficients dendrogram of small mammals in Sarna Jaya 70 Nature Reserve
13 Modified Morisitas similarity dendrogram of small mammals in Sarna Jaya 71 Nature Reserve
14 Bray-Curtis similarity dendrogram dendrogram of small mammals ill Sarna 72 Jaya Nature Reserve
XlV
15 Jaccard s similarity coefficients dendrogram of small mammals III Kubah 73 National Park
16 Sorensens similarity coefficients dendrogram of small mammals III Kubah 74 National Park
17 Modified Morisitas similarity coefficients dendrogram of smaH mammals in 75 Kubah National Park
18 Bray-Curtis similarity coefficients dendrogram of small mammals in Kubah 76 National Park
19 Singletons doubletons unique and duplicates of small mammals in Sarna Jaya 79 Nature Reserve
20 Singletons doubletons umque and duplicates of small mammals in Kubah 82 National Park
xv
List of Tables
Page
1 Total sampling efforts for Sama Jaya Nature Reserve and Kubah National Park 35
2 Species composition of small mammals captured in Sama Jaya Nature Reserve 44
3 Species composition of small mammals captured in Kubah National Park 48
4 Comparison of the number of captures and species counts of small mammals at 53 Sama Jaya Nature Reserve and Kubah National Park by using family
5 Number of individuals and relative abundance for small mammals captured at 54 Sama Jaya Naturee Reserve and Kubah National Park
6 Jaccard similarity coefficient index for small mammals at 10 repetitive 60 sampling occasions in Sama Jaya Nature Reserve
7 Sorensen similarity coefficient index for small mammals at 10 repetitive 6 t sampling occasions in Sama Jaya Nature Reserve
8 Morisita-Horn similarity coefficient index for small mammals at 10 repetitive 62 sampling occasions in Sama Jaya Nature Reserve
9 Bray-Curtis similarity coefficient index for small mammals at 10 repetitive 63 sampling occasions in Sama Jaya Nature Reserve
10 Jaccard similarity coefficient index for small mammals at 10 repetitive 64 sampling occasions in Kubah National Park
11 Sorensen similarity coefficient index for small mammals at 10 repetitive 65 sampling occasions in Kubah National Park
12 Morisita-Horn similarity coefficient index for small mammals at 10 repetitive 66 sampling occasions in Kubah National Park
13 Bray-Curtis similarity coefficient index for small mammals at 10 repetitive 67 sampling occasions in Kubah National Park
14 Species diversity of small mammals at 10 repetitive sampling occasions 10 77 Sama Jaya Nature Reserve (EstimateS)
15 Species diversity of small mammals at 10 repetitive sampling occasions 10 80 Kubah National Park (EstimateS)
XVI
16 Value of Zar t-test for small mammals captured in Sarna Jaya Nature Reserve 83
17 Value of Zar t-test for small mammals captured in Kubah National Park 84
18 Previous studies of small mammals in Sarna Jaya Nature Reserve 86
19 Previous studies of small mammals in Kubah National Park 88
20 Summary number of individuals captured and species composition of small 90 mammals at Sarna Jaya Nature Reserve and Kubah National Park
21 Shannon index and Simpson index for Sarna Jaya Nature Reserve and Kubah 91 National Park
22 Summary of similarity indices for small mammals captured III Sarna Jaya 104 Nature Reserve
23 Summary of similarity indices for small mammals captured in Kubah National 106 Park
XVll
CHAPTER ONE
Introduction
11 General Introduction
Ecological studies can be divided into two components extensive studies and intensive studies
According to Southwood and Henderson (2000) extensive studies frequently carried out to
present an infonnation on distribution and abundance for supplementary conservation and
management program in which the samples area are much larger than intensive studies Intensive
studies generate infonnation about the spatial pattern of populations and it is often possible to
relay the level of the population to oceanographic or climatic factors (Southwood amp Henderson
2000) In many communities studies ecologists acquire a list of the species composition that
occurs in each of several communities and if the quantitative sampling has been conducted some
measure of the relative abundance of each species (Krebs 1999)
Mostly research which been carried out is more focused on species diversity only and just a little
previous tudy been done to quantify the species similarity in addition to species diversity
Quantifying similarity and diversity of animals in tenn of species composition and abundance
will provide useful information about the population of the animal species at the particular study
sites (Magurran 2004)
Species similarity signify the similarity of each study or sample or sampling unit to each other
while the diversity of each unit to one another been signify as species diversity (Krebs 1999) It
is the intension of this study to address both species similarity and species diversity analysis
simultaneously on repetitive sampling of small mammals done on an open and closed habitat
12 Species Diversity
Krebs (1999) noted that a biological community has an attribute of species diversity and recently
there are many different ways have been suggested for measuring the species diversity Basically
it depends on the objective for the study conducted and the information that we want to see from
the samples collected Diversity measures require an estimate of species importance in the
community (Krebs 1999)
Species diversity for this aspect can be defined as the number of different species in a particular
area (species richness) weighted by some measure of abundance such as number of individuals or
biomass (Magurran 1998) Species evenness is part of the measures of species diversity which is
the relative abundance with which each species is represented in the particular area Species
evenness is a measure of biodiversity which qualifies how equal the community is numerically
Evenness is also a part of species diversity measure which compares the similarity of the
population size of each of the species present
Species richness and species evenness are probably the most frequently used measures of the
total biodiversity of the region (Magurran 1998 2004) Species richness noted that the observed
2
species number increases non-linearly with sampling effort Species richness and evenness are
component of biodiversity that mayor may not be correlated with one another and with pattern of
species abundance Gotelli and Colwell (2001) stated that standardising by the number of
individual collected and standardising by area or sampling effort can lead to the different
conclusions regarding species richness
According to Southwood and Henderson (2000) diversity can be divided into three categories
(a) a diversity- the diversity of species within a community or habitat
(b) f3 diversity- the measure of the rate and extent of change in species along a gradient from
one habitat to others and
(c) y diversity- the richness in species of a range of a habitats in a geographical area which
is a consequence of the a diversity of the habitats together with the extent of the (3 diversity
between them
Shannon index is one of several diversity indices used to measure diversity in categorical data
According to Krebs (1999) Shannon index is used for rare species while Simpson index is used
which emphasize the common species The advantage of Shannon index is it takes into account
the number of species and the evenness of the species index is increased either by having
additional unique species or by having better species evenness The Shannon index is the
measure of infonnation content should be used only on random samples drawn from a large
community in which the total number of species is known (Krebs 1999)
3
Shannon index is the most popular measures of the species diversity which based on infonnation
theory According to Krebs (1999) there are four types of infonnation that might be collected
regarding order in the community
(8) The number of species
(b) The number of individuals in each species
(c) The places occupied by individuals of each species and
(d) The places occupied by the individuals as separate individuals
Simpson index also been used to quantify species diversity of small mammals derived by
Simpson (1943) The basis of this index is the probability of two individuals being conspecifics
Here Simpsons Reciprocal Index (110) is used where the values start 1 ([owest possible
figures) and it represents a community containing only one species to the maximum number
which represent the total number of species caught
According to Lande (1996) the species richness Shannon infonnation and Simpson diversity are
the most commonly used nonparametric measures of species diversity The proportion of the total
diversity found within communities provides a natural measure of similarity among multiple
communities The expected similarity among multiple random samples from the same depends
on the number of samples and on the underlying measures of diversity Measures of species
divers~ play a central role in ecology and conservation biology which giving the number of
species composition and the abundance of animals at the particular area
4
uSiJt hidmal MakJumal Akad~rrlliI UMVERsm MALAYSIA SA WAf(
13 Species Similarity
Krebs (1999) noted that resemblance measure can be expressed either (a) similarity degree of
resemblance or (b) dissimilarity degree of difference Magurran (2004) stated that similarity or
dissimilarity indices provide quantitative bases of assessment in comparing species composition
and biodiversity of two or more assemblages in taxonomic and ecological research Krebs (1999)
stated that we need to use similarity coefficients or similarity indices that give some measure of
the relative abundance of each species in the two samples if we are dealing to quantify the
similarity oftwo such samples or community
Similarity matrix is the opposite concept to the distance matrix The elements of a similarity
matrix measure pairwise similarities of objects The greater similarity of two objects will
produced the high value of the measure Each similarity measures has its own properties and
generally gives different perspectives of the data turning the matter of choice not trivial
(Laurenco et al 2004)
According to Boyce and Ellison (2001) and Krebs (1999) similarity indices can be divided into
two major classes first is those that include joint absences or zero-zero matches (species that are
in neither of the two samples for which a similarity is being computed but are present in at least
one other plot in the study) and second class is those that do not include the zero-zero matches
5
Abstract
( Research on species similarity and species diversity of small mammals in 10 repetitive sampling
occasions (500 trap nights) was conducted in two different habitats an open and closed habitat
The first sampling were carried out in Sarna Jaya Nature Reserve (SJNR) from April to
September 2008 and second sampling conducted in Kubah National Park (KNP) from February
to June 2009 Closed model was chosen where sampling was conducted for five consecutive trap
days in 10 repetitive sessions each session has about five days to one week rest A hundred of
cage traps were set up and placed in grid system at each study site respectively and markshy
recapture method were used to capture the small mammals l
Sarna Jaya Nature Reserve situated in Kuching Sarawak can be classified as geographically
closed habitat or an island habitat A total of 330 individuals of small mammals been trapped in
5000 trapnights consist of six species namely Calloscuirus notatus C prevostii borneensis
Sundamys muelleri Tupaia tana T minor and Rhinoscuirus lauticaudatlls from three families
(Tupaiidae Scuiridae and Muridae) and from two orders (Scandentia and Rodentia) Species
similarities of small mammals species composition on 10 repetitive sampling occasions from
SJNR were calculated and analysed Jaccard similarity coefficient and Sorensen similarity
coefficient indicated a value of 1 in seven tested sampling occasions (3 vs 4 3 vs 5 4 vs 5 3 vs
9 4 vs 9 5 vs 9 and 2 vs 10) Occasion 7 vs occasion 10 noted high values for Morisita-Hom
similarity coefficient (0991) and 0909 is the highest value for Bray-Curtis similarity coefficient
(occasion 9 vs occasion 10) The differences of value for four similarity coefficient indices may
he influenced by factors like sample size and abundance of most abundant species
v
Kubah National Park is classified as a geographically open habitat for this study A total of 98
small mammals were captured in a total of 5000 trapnights consisting of 10 species namely
Maxomys rajah M surifer M whiteheadi Leopoldamys sabanus Lariscus insignis
Sundascuirus lowi Tupaia tana T dorsalis T glis and Echinosorex gymnlllUs from four
families (Erinaceidae Scuiridae Tupaiidae and Muridae) of orders (Rodentia Scandentia and
Insectivora) Species similarity of small mammals in 10 repetitive sampling occasions showed
differences in term of similarity value for four similarity indices All similarity indices noted 0
value for three tested sampling occasions (1 vs 8 5 vs 8 and 8 vs 9) which indicates that there
are no shared species between two tested sampling occasions Occasion 9 vs occasion 10 noted
high value for Jaccard similarity coefficient (075) and Sorensen similarity coefficient (0857)
0982 is the highest value for Morista-Hom similarity coefficient noted from occasion 4 vs
occasion 5 while two tested sampling occasions (4 vs 10 and 6 vs 10) indicate high value for
Bray-Curtis similarity coefficient (075)
The species diversity of small mammals in Kubah National Park (080) is higher than Sarna Jaya
Nature Reserve (046) In conclusion Sarna Jaya Nature Reserve which classified as small
island area comprise of a smaller number in terms of animal species composition due to limited
resources in various aspects (food shelter area) compared to a much wider area which
surrounded by large forested area (Kubah National Park)
KEY WORDS- small mammals similarity indices diversity indices repetitive sampling open
and closed habitat
vi
Abstrak-Kajian tentang persamaan spesies dan kepelbagaian spesies mamalia kedl dalam 10
ulangan ambilan sampel (500 perangkaplmalam) telah di jalankan di dua habitat yang
berlainan habitat yang terbuka dan habitat yang tertlltup Pengambilan sampel yang pertama
telah di jalankan di Hutan Simpan Sama Jaya (SJNR) pada April hingga September 2008 dan
pengambilan sam pel yang kedua di lakukan di Taman Negara Kubah (KNP) pada Februari
hingga Jun 2009 model tertutup telah di pilih di mana pengambilan sampel dyalankan untuk
lima hari berturut-turnt dalam 10 ulangan ambilan sampel setiap ambilan sampel mempllnyai
masa rehat lima hari ke satll minggu Sebanyak seratus perangkap telah di pasang dan di
letakkan mengikut sistem grid di setiap kawasan kajian dan kaedah tanda-tangkap semula
digunakan untllk menangkap mamalia keci
Hman Simpan Sama Jaya terletak di Kuching Sarawak diklasifikasikan sebagai geograji habitat
yang tertutup juga di kenali sebagai habitat pulau Sebanyak 330 ekor mamalia kedl telah di
perangkap dalam 5000 perangkaplmalam mengandungi enam spesies yang dinamakan sebagai
Calloscuirus notatus C prevostii borneensis Sundamys muelleri Tupaia tana I minor dan
Rhinoscuirlls lauticaudatus daripada tiga lamili (Tupaiidae Scuiridae dan Muridae) dan
daripada dua order (Scandentia dan Rodentia) Persamaan dalam komposisi spesies mamalia
kedl dalam 10 ulangan ambilan sampel dari SJNR telah di kira dan di analisa Persamaan
koefisien Jaccard dan persaman koefisien Sorensen menlll1jukkan nilai 1 dalam tujuh lIjian
ulangan ambilan sampel (3 antara 4 3 antara 5 4 antara 5 3 antara 9 4 antara 9 5 antara 9
dan 2 antaJa 10) Antara peristiwa ke 7 dan ke 10 menunjllkkan nilai bagi persamaan koefiesin
Morisita-Horn yang tinggi (0991) dan 0909 merupakan nilai yang tertinggi bagi persaman
k~efisien Bray-Curtis (peristiwa 9 dan 10) Perbezaan pada nilai untllk empat persamaan
Vll
koefzsien indeks mungkin di perngaruhi oleh beberapa Jaktor seperti saiz sam pel danbanyaknua
spe ies yang amat banyak
Taman Negara Kubah (KNP) diklasifikasikan sebagai geograji habitat yang terbuka untuk kajian
ini Sebanyak 98 ekor mamalia kecil telah berjaya di tangkap dalam sejumlah 500
perangkaplmalam mengandungi 10 spesies yang dinamakan sebagai Maxomys rajah M
surikr M whiteheadi Leopoldamys sabanus Larisclis ins ignis Sundascuirus lowi Tupaia tana
T dorsalis I glis dan Echinosorex gymnurLts daripada empat Jamili (Erinaceidae Scuiridae
Tilpaiidae dan Muridae) daripada tiga order (Rodentia Scandentia dan lnsectivora)
Persamaan spesies mamalia kecil dalam 10 ulangan ambilan sampel menunjukkan perbezaan
dari segi nilai persamaan untuk empat persamaan indeks Semua persamaan inde~
menunjukkan nilai 0 untuk tiga ujian ulangan ambilan sampel (1 antara 8 5 antara 8 dan 8
antara 9) yang mana menunjukkan tidak terdapat perkongsian spesies antara dua ujian ulangan
ambilan sampel Ujian antara peristiwa 9 dan 10 menllnjukkan nilai yang tinggi untuk
persamaan koejisien Jaccard (075) dan persamaan koejisien Sorensen (0857 0982
merupakan nilai yang tertinggi bagi persamaan koejisien Morisita-Horn daripada ambilan
sampel 4 dan 5 manakala dua ujaina ambilan sampel (4 antara 10 dan 6 antara 10)
menunjukkan niali yang tinggi bagi persamaan koejisien Bray-Curtis (075)
Kepelbagaian spesies diveristi bagi mamalia kecil di Taman Negara Kubah (080) adalah tinggi
daripada Hutan Simpan Sama Jaya (SJNR) SecQa kesimpulannya Hutan Simpan Sama Jaya
yang juga diklasifikasi sebagai kawasan pulau yang kecil mengandungi jumlah komposisi
mamalia kecil ynag sedikit disebabkan oleh sumber ynag terhad dari pelbagai aspek (makanan
Vlll
~~--~~~------------------------------------------~~-===-----------------~~----
perlidungan dan kawasan) berbanding dengan Taman Negara Kubah yang mempunyai kawasan
yang [lias yang di kelilingi oleh kawasan yang berhutan
KATA KUNCI- mamalia kedl persamaan indeks diversiti indeks ulangan ambilan sampel
habitat terbuka dan tertutup
IX
Pusat Khidmat M klVMERSm MA ya umatAJcademik
uuolY lA SAJUWAJ(
Table of Contents
Title Page
Declaration
Dedication
Acknowledgement
Abstract
Abstrak
Table of Contents
List of Figures
List of Tables
Chapter 1 Introduction
11 General Introduction
12 Species Similarity
13 Species Diversity
14 Cluster Analysis
15 Closure Concepts and Closed Population Model
151 Closure Concepts
152 Closed Population Model
16 Open Habitat and Closed Habitat
17 Small Mammals
171 Biology and Ecology
172 Related Study on Small Mammals
18 Justification
19 Objectives and Hypothesis
191 Objectives
192 Hypothesis
110 Outline ofThesis
X
Page
11
III
IV
VI
Vll
x
XIV
XVI
2
5
10
11
12
12
13
20
26
27
28
28
Chapter 2
21
22
23
24
25
Chapter 3
31
Methodology
Study Sites
211 Sarna Jaya Nature Reserve 29
212 Kubah National Park 31
Field Methods
221 Sampling Protocol 33
Repetitive Sampling 35
Processing of Specimens
241 Handling and Identification 36
242 Measurements 36
Data Analysis
251 Relative Abundance 36
252 Species Diversity 37
25 21 Shannon Index 37
252 2 Simpson Index 37
253 Species Similarity 39
2521 Jaccards Similarity Coefficients 39
2522 Sorensens Similarity Coefficients 40
25 23 Morisita-Hom Similarity Coefficients 40
25 24 Bray-Curtis Similarity Coefficients 40
254 Cluster Analysis 41
255 Zar t-test 41
Results
Species Composition 43
311 Sarna Jaya Nature Reserve
3111 Species List 43
3112 Cumulative Graph 45
312 Kubah National Park
3121 Species List 47
Xl
I 3122 Cumulative Graph 49
313 Sarna Jaya Nature Reserve and Kubah National Park
3131 Species List 51
3132 Cumulative Graph 54
32 Species Similarity
321 Sarna Jaya Nature Reserve 58
322 Kubah National Park 63
33 Cluster Analysis
331 Sarna Jaya Nature Reserve 68
332 Kubah National Park 72
34 Species Diversity
341 Sarna Jaya Nature Reserve 76
342 Kubah National Park 79
35 Zar t-test
351 Sarna Jaya Nature Reserve 82
352 Kubah National Park 83
36 Previous Study
36l Sarna Jaya Nature Reserve 84
362 Kubah National Park 86
Chapter 4 Discussion
41 General Discussion
411 Species Composition 88
412 Factors Affected Capture Probabilities 91
42 Species Similarity 103
43 Cluster Analysis 107
44 Species Diversity 108
45 Open Habitat and Closed Habitat 111
Xll
Chapter 5 Conclusions and Recommendations
51 Conclusions 114
52 Recommendation for Future Studies 116
References 117
List of publications 132
List of Appendices
Appendix A 134
Appendix 8 154
Appendix C 160
Appendix D 162
Appendix E 167
Appendix F 174
Appendix G 177
Xlll
List of Figures
Page
1 Maps of Sarna Jaya Nature Reserve 30
2 Maps of Kubah National Park 32
3 Grid sampling design 34
4 Comparison of total individual caught and number of species of small 46 mammals in Sarna Jaya Nature Reserve
5 Total number of small mammals captured in Sarna Jaya Nature Reserve in 47 overall 10 occasions
6 Comparison of total individual caught and number of speCles of small 50 mammals in Kubah National Park
7 Total number of small mammals captured in Kubah National Park in overall 10 51 occaSlons
8 Comparison number of individuals captured in two different sites (Sarna Jaya 56 Nature Reserve and Kubah National Park)
9 Comparison number of species captured ill two different sites (Sarna Jaya 57 Nature Reserve and Kubah National Park)
10 Species accumulation curve in Sarna Jaya Nature Reserve and Kubah National 58 Park
II Jaccards similarity coefficients dendrogram of small mammals in Sarna Jaya 69 Nature Reserve
12 Sorensens similarity coefficients dendrogram of small mammals in Sarna Jaya 70 Nature Reserve
13 Modified Morisitas similarity dendrogram of small mammals in Sarna Jaya 71 Nature Reserve
14 Bray-Curtis similarity dendrogram dendrogram of small mammals ill Sarna 72 Jaya Nature Reserve
XlV
15 Jaccard s similarity coefficients dendrogram of small mammals III Kubah 73 National Park
16 Sorensens similarity coefficients dendrogram of small mammals III Kubah 74 National Park
17 Modified Morisitas similarity coefficients dendrogram of smaH mammals in 75 Kubah National Park
18 Bray-Curtis similarity coefficients dendrogram of small mammals in Kubah 76 National Park
19 Singletons doubletons unique and duplicates of small mammals in Sarna Jaya 79 Nature Reserve
20 Singletons doubletons umque and duplicates of small mammals in Kubah 82 National Park
xv
List of Tables
Page
1 Total sampling efforts for Sama Jaya Nature Reserve and Kubah National Park 35
2 Species composition of small mammals captured in Sama Jaya Nature Reserve 44
3 Species composition of small mammals captured in Kubah National Park 48
4 Comparison of the number of captures and species counts of small mammals at 53 Sama Jaya Nature Reserve and Kubah National Park by using family
5 Number of individuals and relative abundance for small mammals captured at 54 Sama Jaya Naturee Reserve and Kubah National Park
6 Jaccard similarity coefficient index for small mammals at 10 repetitive 60 sampling occasions in Sama Jaya Nature Reserve
7 Sorensen similarity coefficient index for small mammals at 10 repetitive 6 t sampling occasions in Sama Jaya Nature Reserve
8 Morisita-Horn similarity coefficient index for small mammals at 10 repetitive 62 sampling occasions in Sama Jaya Nature Reserve
9 Bray-Curtis similarity coefficient index for small mammals at 10 repetitive 63 sampling occasions in Sama Jaya Nature Reserve
10 Jaccard similarity coefficient index for small mammals at 10 repetitive 64 sampling occasions in Kubah National Park
11 Sorensen similarity coefficient index for small mammals at 10 repetitive 65 sampling occasions in Kubah National Park
12 Morisita-Horn similarity coefficient index for small mammals at 10 repetitive 66 sampling occasions in Kubah National Park
13 Bray-Curtis similarity coefficient index for small mammals at 10 repetitive 67 sampling occasions in Kubah National Park
14 Species diversity of small mammals at 10 repetitive sampling occasions 10 77 Sama Jaya Nature Reserve (EstimateS)
15 Species diversity of small mammals at 10 repetitive sampling occasions 10 80 Kubah National Park (EstimateS)
XVI
16 Value of Zar t-test for small mammals captured in Sarna Jaya Nature Reserve 83
17 Value of Zar t-test for small mammals captured in Kubah National Park 84
18 Previous studies of small mammals in Sarna Jaya Nature Reserve 86
19 Previous studies of small mammals in Kubah National Park 88
20 Summary number of individuals captured and species composition of small 90 mammals at Sarna Jaya Nature Reserve and Kubah National Park
21 Shannon index and Simpson index for Sarna Jaya Nature Reserve and Kubah 91 National Park
22 Summary of similarity indices for small mammals captured III Sarna Jaya 104 Nature Reserve
23 Summary of similarity indices for small mammals captured in Kubah National 106 Park
XVll
CHAPTER ONE
Introduction
11 General Introduction
Ecological studies can be divided into two components extensive studies and intensive studies
According to Southwood and Henderson (2000) extensive studies frequently carried out to
present an infonnation on distribution and abundance for supplementary conservation and
management program in which the samples area are much larger than intensive studies Intensive
studies generate infonnation about the spatial pattern of populations and it is often possible to
relay the level of the population to oceanographic or climatic factors (Southwood amp Henderson
2000) In many communities studies ecologists acquire a list of the species composition that
occurs in each of several communities and if the quantitative sampling has been conducted some
measure of the relative abundance of each species (Krebs 1999)
Mostly research which been carried out is more focused on species diversity only and just a little
previous tudy been done to quantify the species similarity in addition to species diversity
Quantifying similarity and diversity of animals in tenn of species composition and abundance
will provide useful information about the population of the animal species at the particular study
sites (Magurran 2004)
Species similarity signify the similarity of each study or sample or sampling unit to each other
while the diversity of each unit to one another been signify as species diversity (Krebs 1999) It
is the intension of this study to address both species similarity and species diversity analysis
simultaneously on repetitive sampling of small mammals done on an open and closed habitat
12 Species Diversity
Krebs (1999) noted that a biological community has an attribute of species diversity and recently
there are many different ways have been suggested for measuring the species diversity Basically
it depends on the objective for the study conducted and the information that we want to see from
the samples collected Diversity measures require an estimate of species importance in the
community (Krebs 1999)
Species diversity for this aspect can be defined as the number of different species in a particular
area (species richness) weighted by some measure of abundance such as number of individuals or
biomass (Magurran 1998) Species evenness is part of the measures of species diversity which is
the relative abundance with which each species is represented in the particular area Species
evenness is a measure of biodiversity which qualifies how equal the community is numerically
Evenness is also a part of species diversity measure which compares the similarity of the
population size of each of the species present
Species richness and species evenness are probably the most frequently used measures of the
total biodiversity of the region (Magurran 1998 2004) Species richness noted that the observed
2
species number increases non-linearly with sampling effort Species richness and evenness are
component of biodiversity that mayor may not be correlated with one another and with pattern of
species abundance Gotelli and Colwell (2001) stated that standardising by the number of
individual collected and standardising by area or sampling effort can lead to the different
conclusions regarding species richness
According to Southwood and Henderson (2000) diversity can be divided into three categories
(a) a diversity- the diversity of species within a community or habitat
(b) f3 diversity- the measure of the rate and extent of change in species along a gradient from
one habitat to others and
(c) y diversity- the richness in species of a range of a habitats in a geographical area which
is a consequence of the a diversity of the habitats together with the extent of the (3 diversity
between them
Shannon index is one of several diversity indices used to measure diversity in categorical data
According to Krebs (1999) Shannon index is used for rare species while Simpson index is used
which emphasize the common species The advantage of Shannon index is it takes into account
the number of species and the evenness of the species index is increased either by having
additional unique species or by having better species evenness The Shannon index is the
measure of infonnation content should be used only on random samples drawn from a large
community in which the total number of species is known (Krebs 1999)
3
Shannon index is the most popular measures of the species diversity which based on infonnation
theory According to Krebs (1999) there are four types of infonnation that might be collected
regarding order in the community
(8) The number of species
(b) The number of individuals in each species
(c) The places occupied by individuals of each species and
(d) The places occupied by the individuals as separate individuals
Simpson index also been used to quantify species diversity of small mammals derived by
Simpson (1943) The basis of this index is the probability of two individuals being conspecifics
Here Simpsons Reciprocal Index (110) is used where the values start 1 ([owest possible
figures) and it represents a community containing only one species to the maximum number
which represent the total number of species caught
According to Lande (1996) the species richness Shannon infonnation and Simpson diversity are
the most commonly used nonparametric measures of species diversity The proportion of the total
diversity found within communities provides a natural measure of similarity among multiple
communities The expected similarity among multiple random samples from the same depends
on the number of samples and on the underlying measures of diversity Measures of species
divers~ play a central role in ecology and conservation biology which giving the number of
species composition and the abundance of animals at the particular area
4
uSiJt hidmal MakJumal Akad~rrlliI UMVERsm MALAYSIA SA WAf(
13 Species Similarity
Krebs (1999) noted that resemblance measure can be expressed either (a) similarity degree of
resemblance or (b) dissimilarity degree of difference Magurran (2004) stated that similarity or
dissimilarity indices provide quantitative bases of assessment in comparing species composition
and biodiversity of two or more assemblages in taxonomic and ecological research Krebs (1999)
stated that we need to use similarity coefficients or similarity indices that give some measure of
the relative abundance of each species in the two samples if we are dealing to quantify the
similarity oftwo such samples or community
Similarity matrix is the opposite concept to the distance matrix The elements of a similarity
matrix measure pairwise similarities of objects The greater similarity of two objects will
produced the high value of the measure Each similarity measures has its own properties and
generally gives different perspectives of the data turning the matter of choice not trivial
(Laurenco et al 2004)
According to Boyce and Ellison (2001) and Krebs (1999) similarity indices can be divided into
two major classes first is those that include joint absences or zero-zero matches (species that are
in neither of the two samples for which a similarity is being computed but are present in at least
one other plot in the study) and second class is those that do not include the zero-zero matches
5
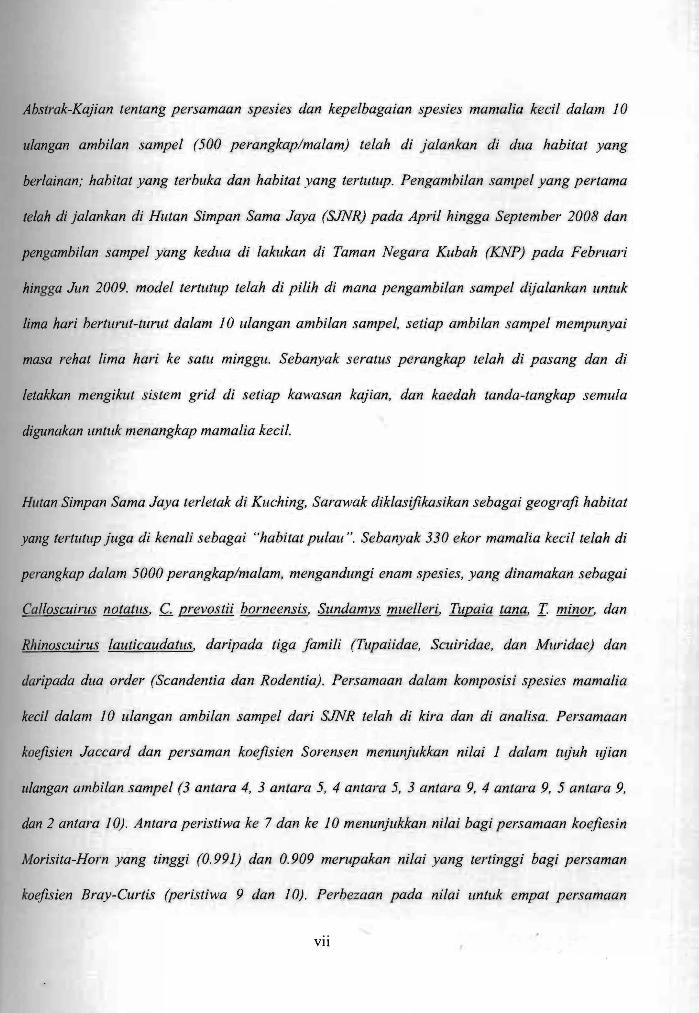
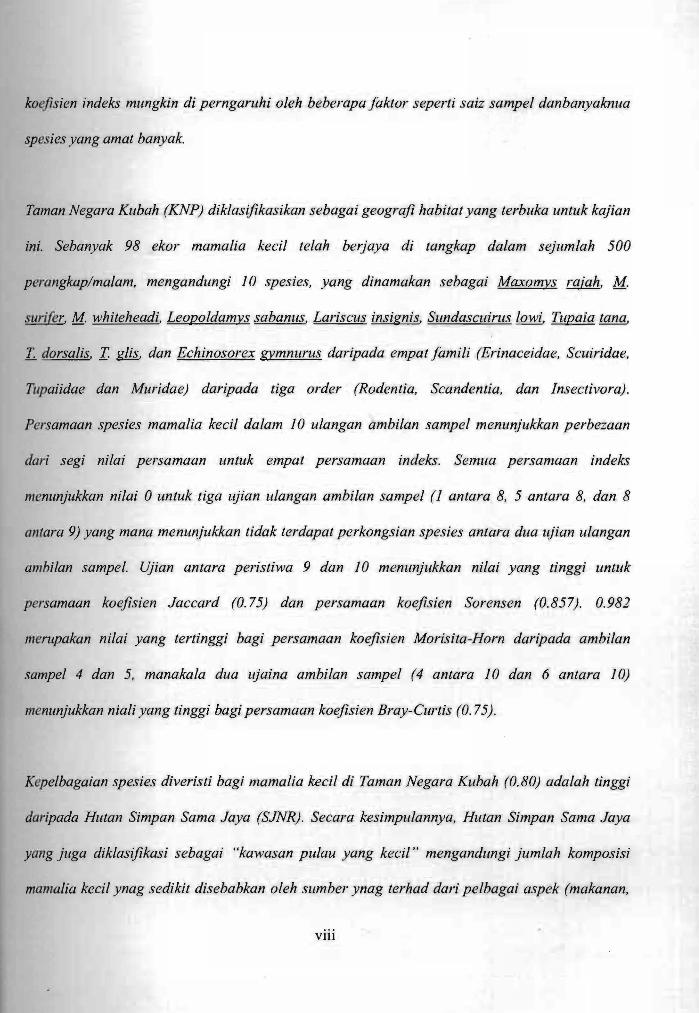
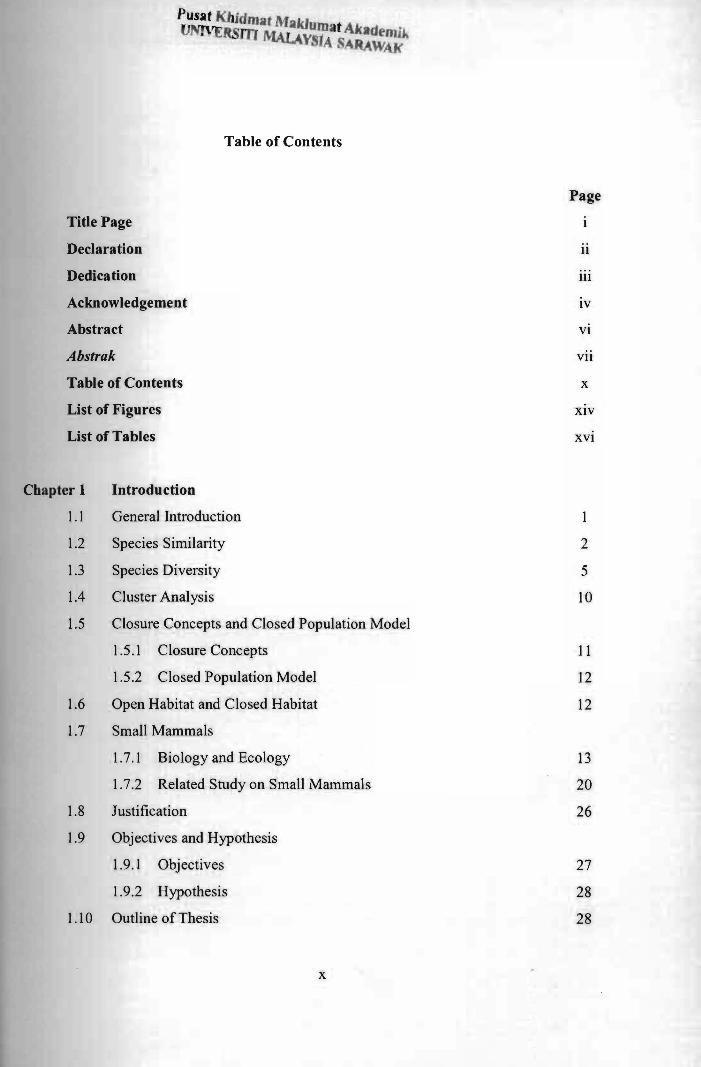
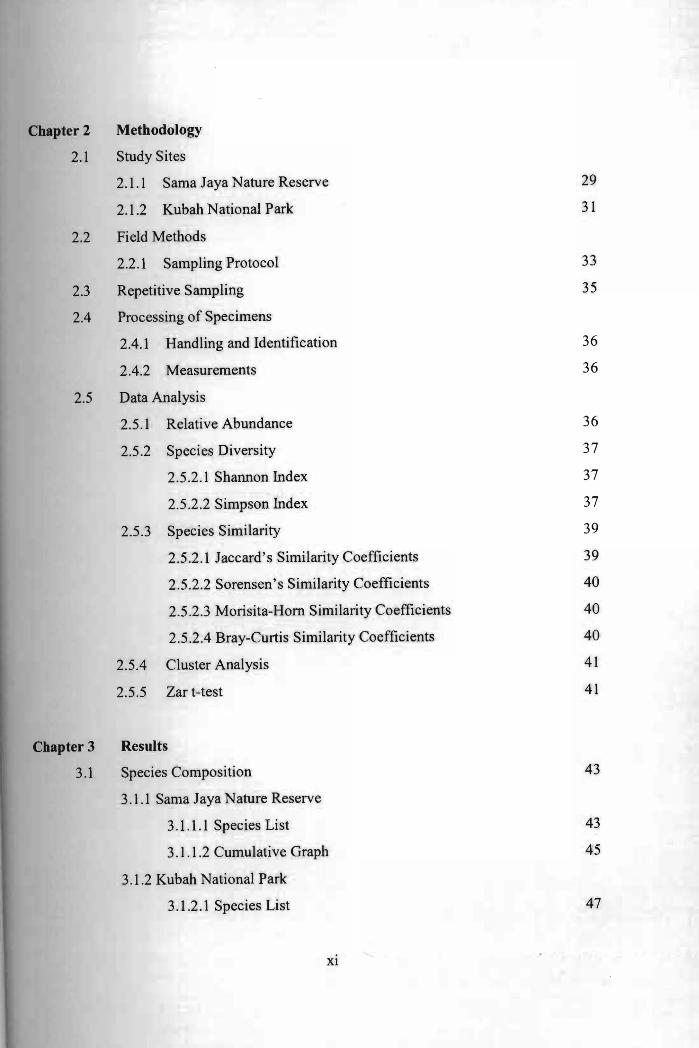
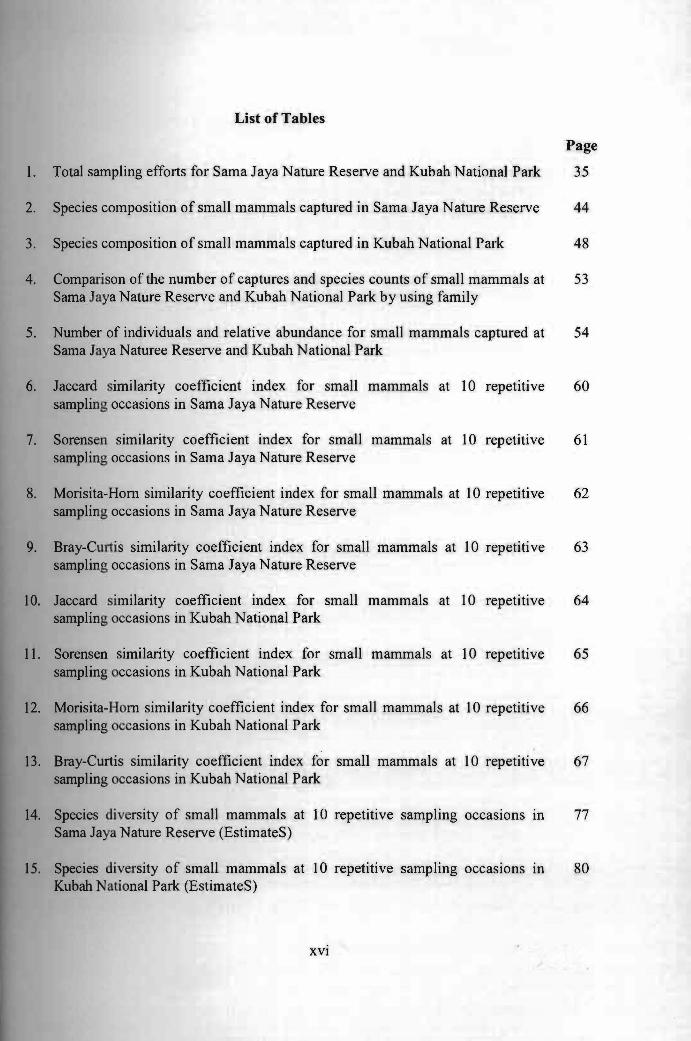
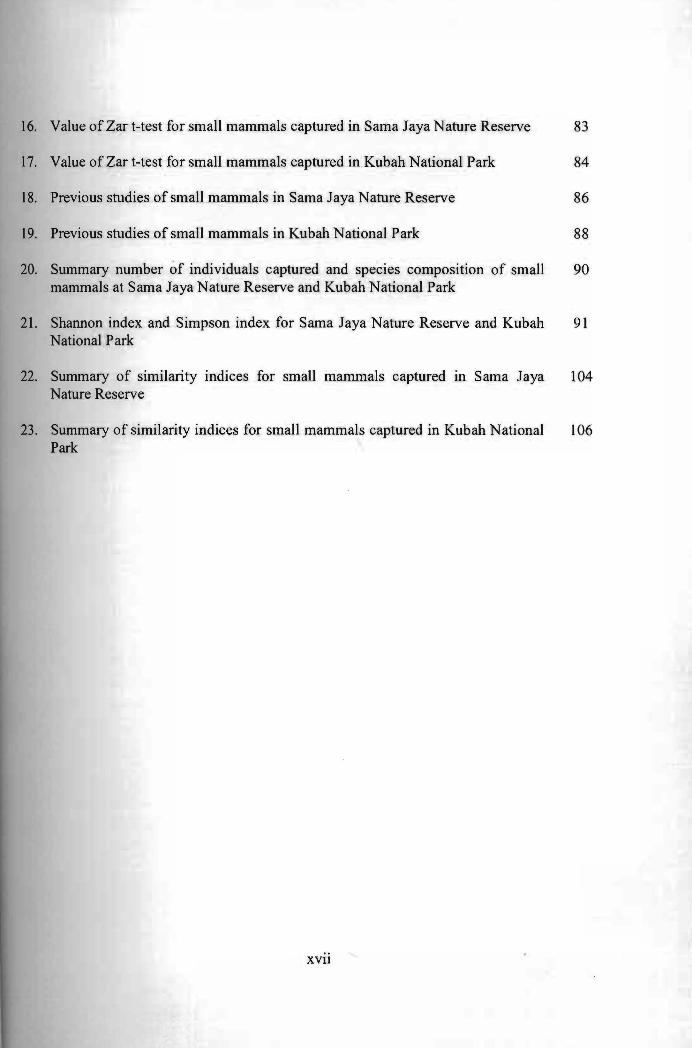