precision phosphorus application for the lake...
TRANSCRIPT

Tom Bruulsema, Director, Northeast Region, IPNI
Precision Phosphorus Application for the Lake Erie Watershed
St. Louis, MO 30-31 July 2014

Formed in 2007 from the Potash & Phosphate Institute, the International Plant Nutrition Institute is supported by leading fertilizer manufacturers. Its mission is to promote scientific information on responsible management of plant nutrition.

Ancaster, Ontario – 26 June 2009 – tilled corn
SOIL EROSION IS A REAL RISK

Ponsonby, Ontario – 6 April 2014 – no-till
SURFACE RUNOFF HAPPENS

Essex County, Ontario, 30 July 2009
BMPs that limit soil erosion don’t limit dissolved P runoff.
Outline
1. Lake Erie P loading trends
2. Soil P balance in the watershed
3. Precision P application options
4. 4R certification
5. 4R research
• Slides: available at http://nane.ipni.net
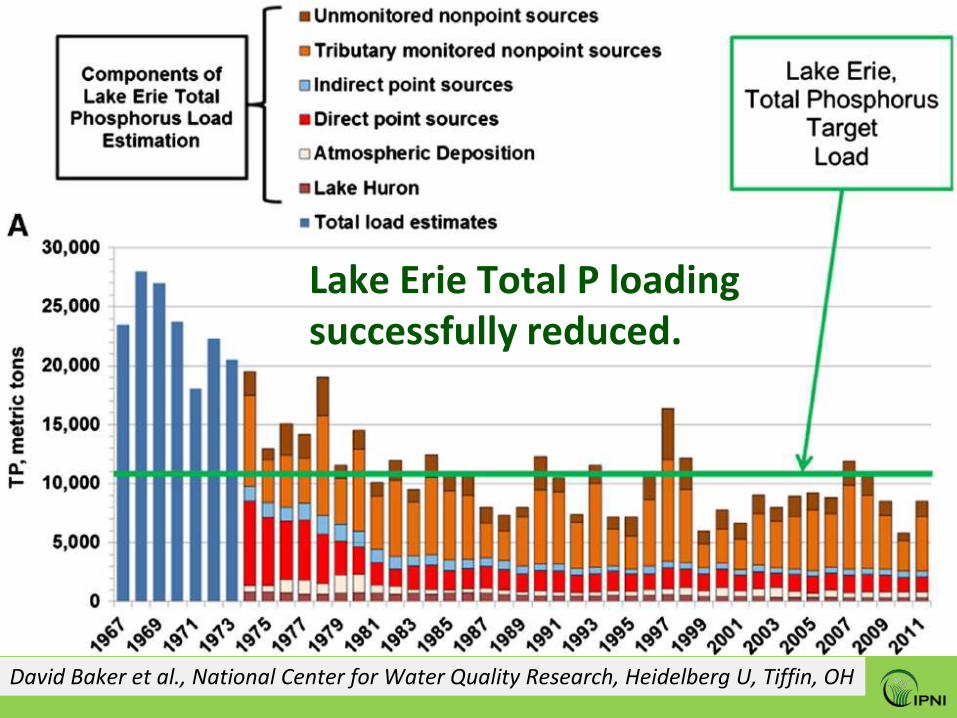
Lake Erie Total P loading successfully reduced.
David Baker et al., National Center for Water Quality Research, Heidelberg U, Tiffin, OH

Western Lake Erie: DRP trends worsening since 1992
David Baker et al., National Center for Water Quality Research, Heidelberg U, Tiffin, OH
0.03

So what could be causing the trend of increased losses of dissolved P?
• Weather patterns
• Tillage trends
• P application
– Source?
– Rate?
– Time?
– Place?
USGS monitoring gauge, Waterville, Ohio, 31 July 2012
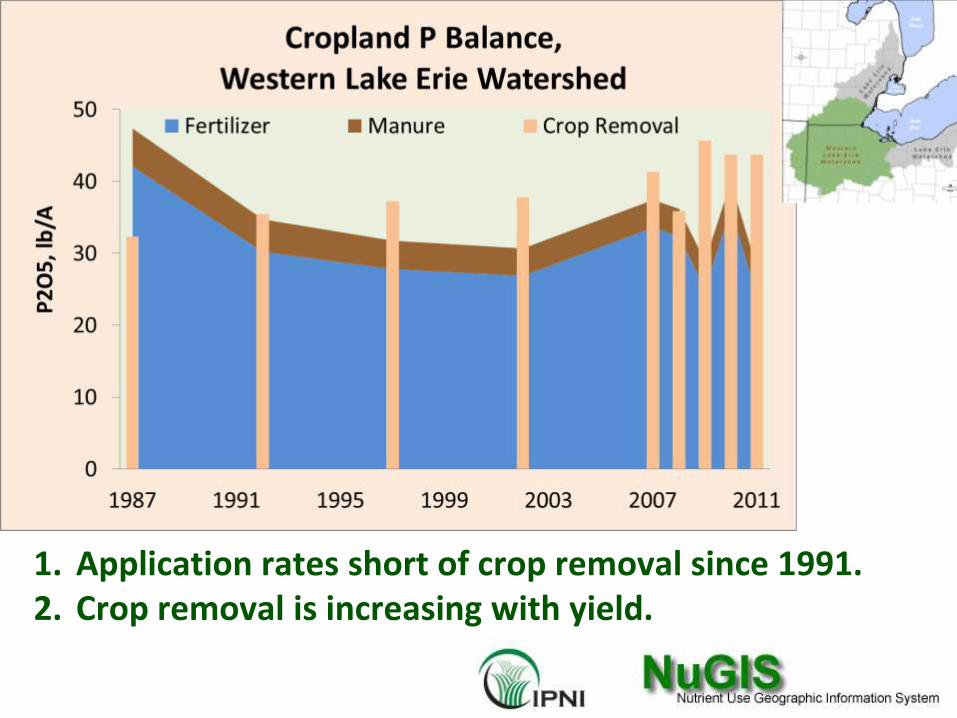
1. Application rates short of crop removal since 1991. 2. Crop removal is increasing with yield.

1. Application rates short of crop removal since 1991. 2. Crop removal is increasing with yield.
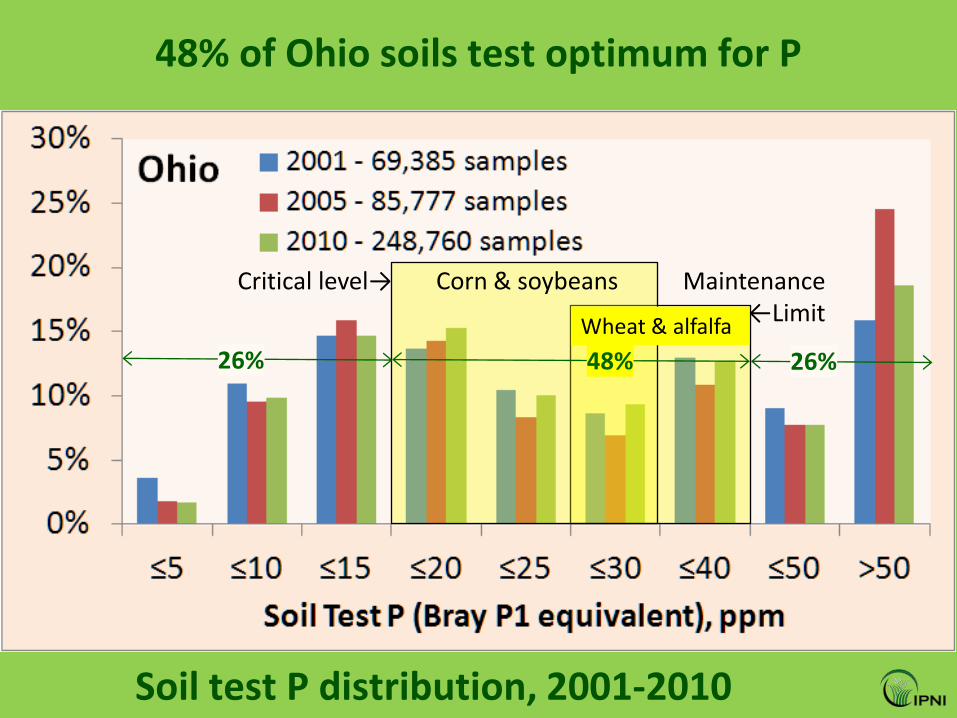
Soil test P distribution, 2001-2010
Critical level→ Corn & soybeans Maintenance ←Limit
Wheat & alfalfa
26% 48% 26%
48% of Ohio soils test optimum for P

Soil test P distribution with depth in a long-term tillage experiment on a poorly drained Chalmers silty clay loam soil near West Lafayette, Indiana. Moldboard and chisel plots were plowed annually to a depth of 8”. Data from Gál (2005) and Vyn (2000). Fertilizer P applied broadcast.
Soil test P stratifies without moldboard plowing
0 30 60 90 120 150 180
Moldboard
Chisel
No-till
Soil test P (Mehlich-3), ppm
0-2"
0-4"
4-8"

Ohio Ag Retailer survey – Lake Erie basin March 2013
Soil testing: Grid (2.5 A) 25% Soil type 11% Management zone 6% Variable Rate Application 33%
Placement: Planter band 30% Strip-till band 4% Incorporation <7 days 16% Timing: Fall 41% Spring 41%
Greg LaBarge, Ohio State University Extension

Kevin King, USDA-ARS, Columbus, OH
Northwest Ohio Soils –
most are poorly drained
and flat

Honey Creek: comparing two runoff events in fall 2011 14 Nov., after 6d field activity 5 Dec., after 2 further rainstorms
Mean DRP concentration 0.64 mg/L 0.18 mg/L
David Baker, Heidelberg University
6 d

Honey Creek: comparing two runoff events in fall 2011 14 Nov., after 6d field activity 5 Dec., after 2 further rainstorms
Mean DRP concentration 0.64 mg/L 0.18 mg/L
David Baker, Heidelberg University
DRP load/A of watershed 0.31 lb P2O5/A 0.16 lb P2O5/A
6 d

Honey Creek: comparing two runoff events in fall 2011 14 Nov., after 6d field activity 5 Dec., after 2 further rainstorms
Mean DRP concentration 0.64 mg/L 0.18 mg/L
David Baker, Heidelberg University
DRP load/A of watershed 0.31 lb P2O5/A 0.16 lb P2O5/A
1. Intense rainstorms following broadcast of P can generate high P concentrations in runoff but the direct agronomic or economic importance can be minimal.
2. As the time intervals increase between surface broadcast P applications and runoff-producing rainfall events, DRP concentrations spike less.
6 d

Precision P Application Options
• Right Place
• Planter band
• Fall strip-till band
• Variable rate application
• Right Time
• Avoid periods just before runoff
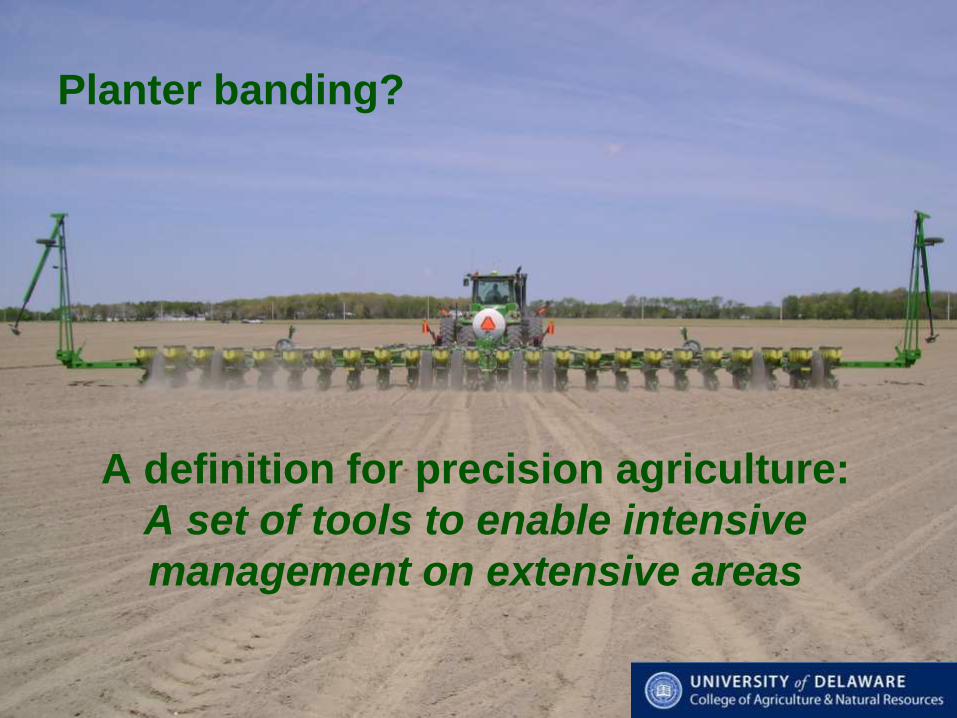
Planter banding?
A definition for precision agriculture:
A set of tools to enable intensive
management on extensive areas

Idealized effect of placement on crop
response
Yie
ld in
cre
ase
fro
m P
fe
rtili
zer
0
VL L M H VH Soil test P
Randall and Hoeft, 1988

Idealized effect of placement on crop
response
Yie
ld in
cre
ase
fro
m P
fe
rtili
zer
0
VL L M H VH Soil test P
Randall and Hoeft, 1988
<15 ppm Bray P1
OH – 26%

Placing P in the soil reduces P loss from a single immediate runoff event
Concentration of dissolved and total P in runoff from a clay
loam soil in North Carolina, from artificial rainfall immediately
following application of superphosphate fertilizer. Incorporation
was to a depth of 5 inches by rotary tillage following
application. Data from Tarkalson and Mikkelson (2004).

Eila Turtola & Antti Jaakkola (1995) Loss of Phosphorus by Surface Runoff and Leaching from a Heavy Clay Soil under Barley and Grass Ley in Finland, Acta Agriculturae Scandinavica, Section B — Soil & Plant Science, 45:3, 159-165
• Silty clay soil, 2% slope
• Plots 100’x100’
• Soil test P low
• Tile drain depth 40”
• Grass 2 cuts • Barley straw
retained
Loss of P (as P2O5) in surface runoff and tile drains
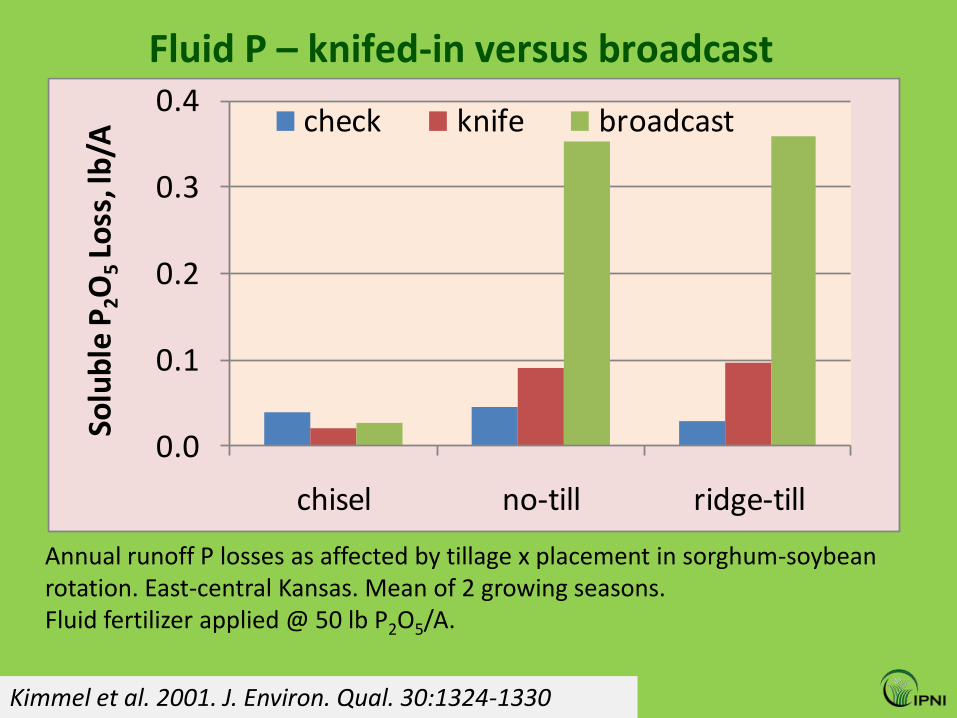
Kimmel et al. 2001. J. Environ. Qual. 30:1324-1330
0.0
0.1
0.2
0.3
0.4
chisel no-till ridge-till
Solu
ble
P2O
5Lo
ss, l
b/A
check knife broadcast
Fluid P – knifed-in versus broadcast
Annual runoff P losses as affected by tillage x placement in sorghum-soybean rotation. East-central Kansas. Mean of 2 growing seasons. Fluid fertilizer applied @ 50 lb P2O5/A.

Fall
Strip-till
Banding
Greg LaBarge, Ohio State University Extension
• Puts the P in the soil
• Keeps residue on the soil
• RTK GPS for precision
planting

Grid sampling for variable rate application
74 acres, 2.5-acre grid, November 2011

Chagrin silt loam, rarely flooded
Soil map for variable rate application
Occasionally flooded ~ higher risk of runoff?

Soil test P from grid, ppm (Mehlich-3)
50-90
24 30-40
Soil test P is high in zone of occasional flooding…

Variable rate P application map
Zero rate where P is high, in zone of flooding…
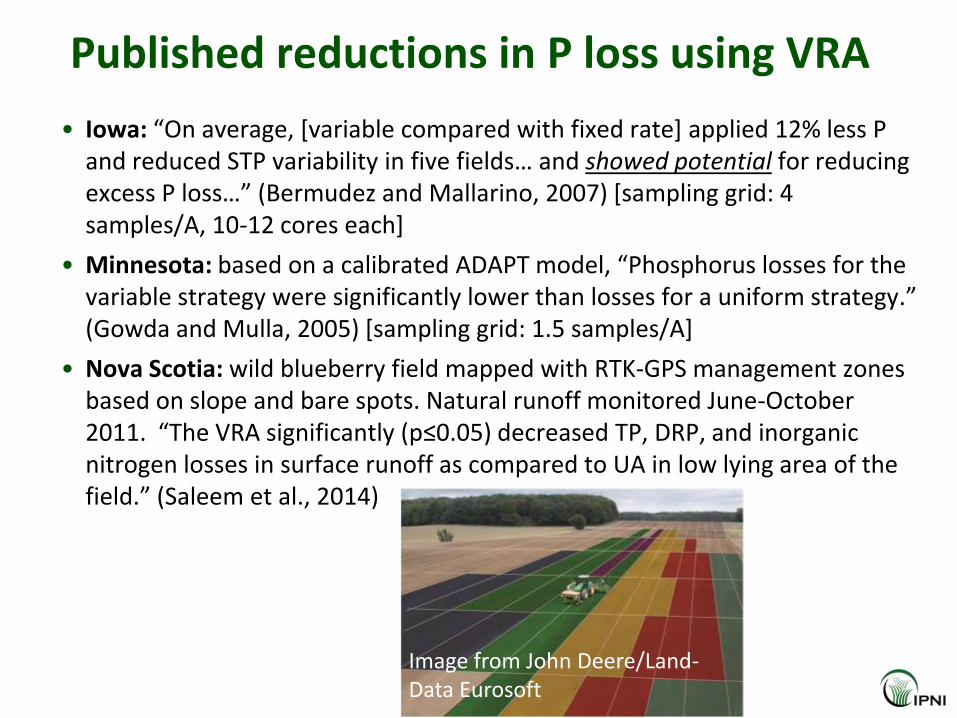
Published reductions in P loss using VRA
• Iowa: “On average, [variable compared with fixed rate] applied 12% less P and reduced STP variability in five fields… and showed potential for reducing excess P loss…” (Bermudez and Mallarino, 2007) [sampling grid: 4 samples/A, 10-12 cores each]
• Minnesota: based on a calibrated ADAPT model, “Phosphorus losses for the variable strategy were significantly lower than losses for a uniform strategy.” (Gowda and Mulla, 2005) [sampling grid: 1.5 samples/A]
• Nova Scotia: wild blueberry field mapped with RTK-GPS management zones based on slope and bare spots. Natural runoff monitored June-October 2011. “The VRA significantly (p≤0.05) decreased TP, DRP, and inorganic nitrogen losses in surface runoff as compared to UA in low lying area of the field.” (Saleem et al., 2014)
Image from John Deere/Land-Data Eurosoft

Less P is lost with more time between application and runoff
Concentration of dissolved P in surface runoff from plots
cropped to tall fescue during rainfall simulations that occurred
1 to 29 days after broadcast application of triple
superphosphate fertilizer (Smith et al., 2007).

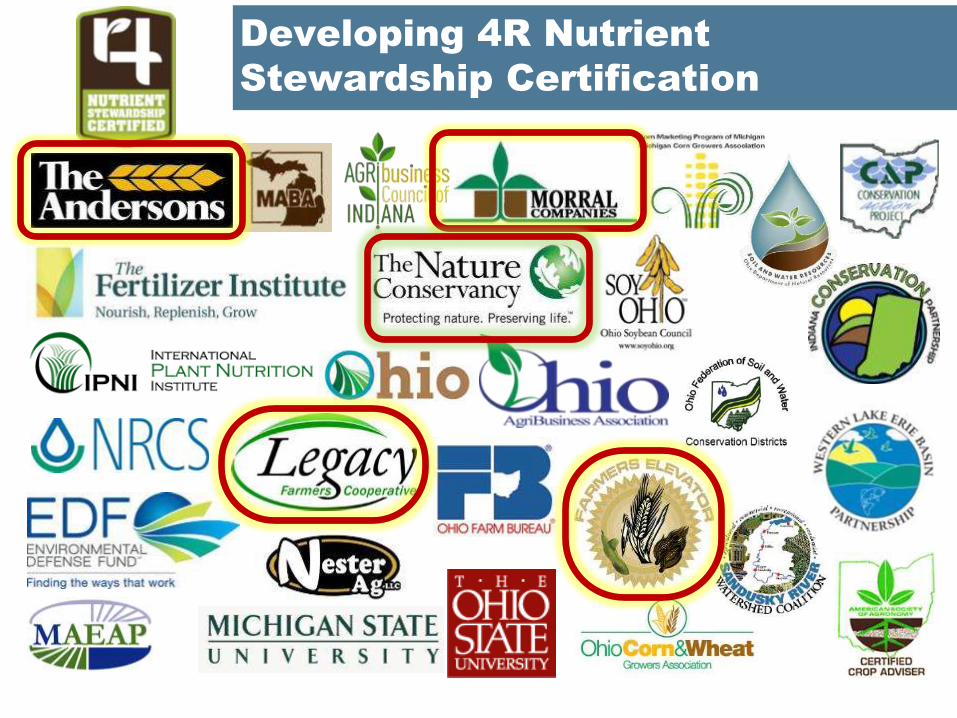


4R Certification for Agri-retailers in the Lake Erie Watershed
Key criteria: – Recommendations are consistent with the land-grant
university, allowing for adaptive management.
– A certified professional reviews the nutrient recommendations made for the grower customers.
– Source: All sources of fertilizer are accounted for in the nutrient recommendation.
– Rate: Soil tests are less than four years old; application equipment is calibrated annually.
– Time: Avoids spreading on frozen or snow-covered fields; no broadcast prior to a predicted heavy rainfall.
– Place: Phosphorus is applied below the soil surface whenever possible; nutrient application setbacks are followed in sensitive areas.
http://4Rcertified.org/

4R Research Fund environmental, social, economic impacts
• Established by the fertilizer industry to support research on 4R sustainability impact across North America – aiming for $7M over 5 years.
• Meta-analysis: 5 projects, 2014-2015.
• Measurement: 4 projects, 2014-2019.
• For additional information: www.nutrientstewardship.com/funding

4R Research Fund –
Lake Erie Watershed Project
• Evaluating the 4R Nutrient Stewardship Concept and
Certification Program in the Western Lake Erie Basin
• GOAL: to evaluate the specific impacts of the adoption of
practices associated with 4R Nutrient Stewardship, and
the impact of the 4R Certification Program, on crop
productivity and profitability, water quality, and
perceptions of growers, nutrient service providers, and
residents in the western Lake Erie watershed.
• 10 collaborators… land-river-lake continuum.

1. Kevin King
USDA-ARS,
Columbus, OH
• Project lead
• Edge-of-field
research on
rate, time and
place of P
application
2. Mark Williams
USDA-ARS,
Columbus, OH
• Edge-of-field
research on rate,
time and place of
P application
4R Research Fund –
Lake Erie Watershed Project
Monitoring impacts on Lake Erie from 4R practices and the 4R program
3. Laura Johnson
Heidelberg
University,
Tiffin, OH
• Watershed scale

5. Rem Confesor
Heidelberg
University,
Tiffin, OH
• Soil and Water
Assessment Tool
(SWAT)
6. Joe DePinto
LimnoTech,
Ann Arbor, MI
• Western Lake Erie
Ecosystem Model
(WLEEM) & SWAT
4R Research Fund –
Lake Erie Watershed Project Modeling impacts on Lake Erie from 4R practices
and the
4R program
4. Carrie Vollmer-Sanders
The Nature Conservancy
Angola, IN
• Integration
• Outreach
• Triple bottom line
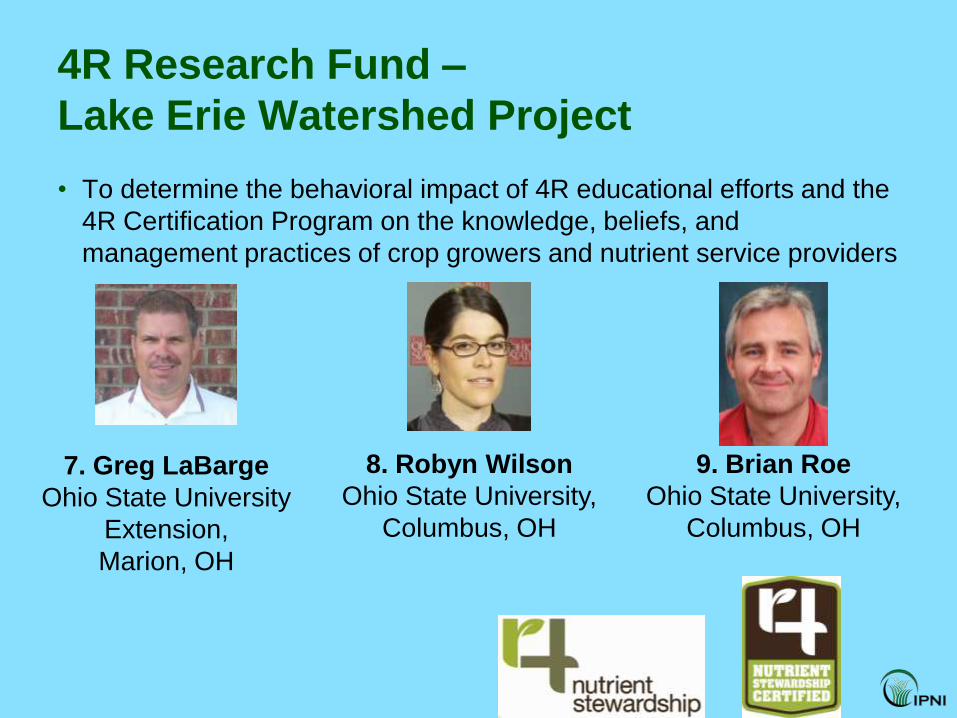
• To determine the behavioral impact of 4R educational efforts and the
4R Certification Program on the knowledge, beliefs, and
management practices of crop growers and nutrient service providers
7. Greg LaBarge
Ohio State University
Extension,
Marion, OH
8. Robyn Wilson
Ohio State University,
Columbus, OH
9. Brian Roe
Ohio State University,
Columbus, OH
4R Research Fund –
Lake Erie Watershed Project
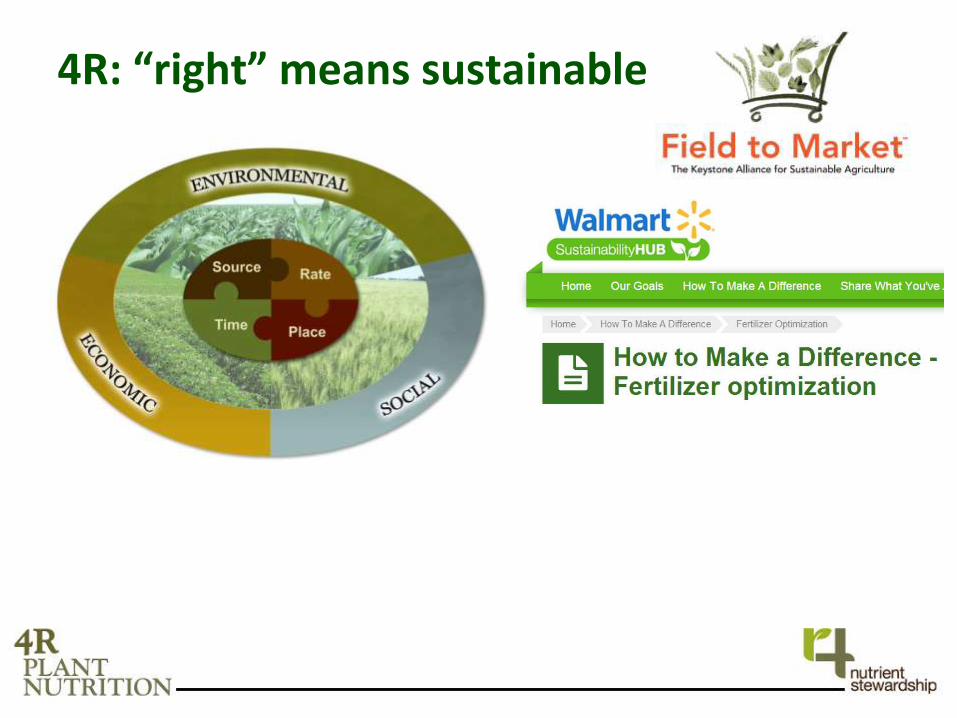
4R: “right” means sustainable


4R: “right” means sustainable
“Building public trust in food and farming”

Summary – Precision P for Lake Erie
• Lake Erie P – we all play a role, and we need to sustainably intensify crop production while countering the trend to increasing DRP in runoff
• Crop P balances for every grower, matching surpluses to low soil tests and deficits to high soil tests
• Precision technology, research, and adaptive management needs to focus on placement, timing, and tillage, preventing loss of BOTH particulate and dissolved forms of P
• 4R certification – recognizing lake-friendly practitioners and building public trust
• 4R Research – quantifying the 4R effect on dissolved P runoff as well as social and eocnomic productivity
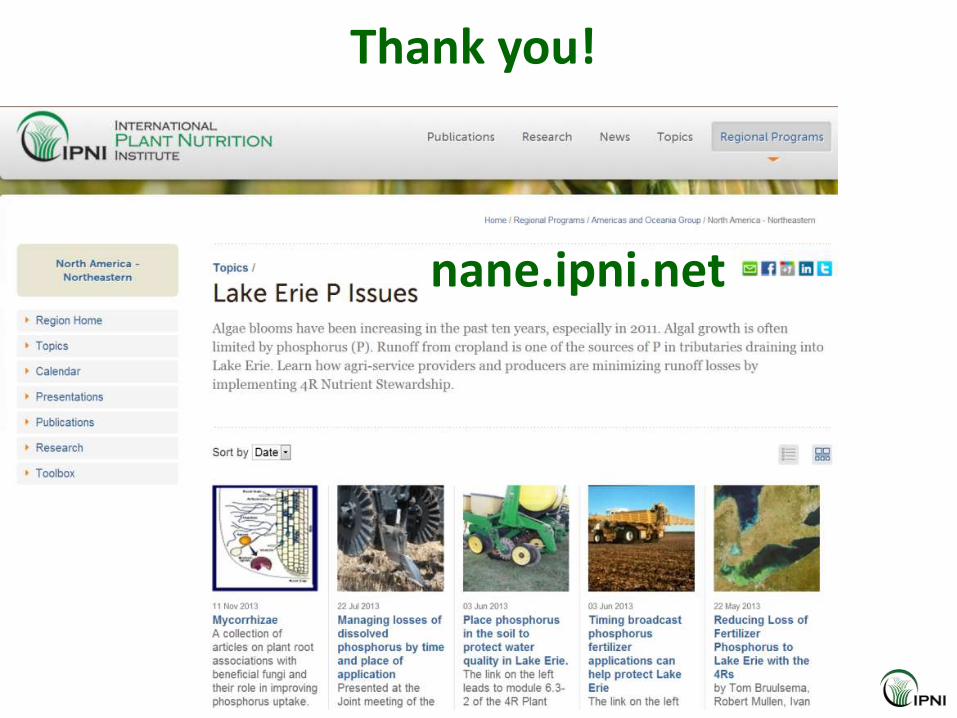
Thank you!
nane.ipni.net