ppx january 2016 le
TRANSCRIPT

Operational Capacity Analysis to Support
Healthcare Outcomes
for Veterans
(or the unintended effects of asking simple questions…)
PERFORMANCE AND PLANNING EXCHANGE (PPX)
January 26, 2016
1

Presentation Outline
• About VAC
• Context
• Scope of work
• Samples
• Future steps
2

About VAC
• VAC = Department of Veterans Affairs, Veterans Review and Appeals
Board, Ombudsman
• Responsibility for pensions/benefits and services for war veterans, retired
and still-serving members of the Canadian Forces and Royal Canadian
Mounted Police, their families, as well as some civilians.
• 3555 personnel
• 4 Branches ( Service Delivery, Strategic Policy and Commemoration,
Strategic Oversight and Communications, Human Resources and
Corporate Services)
3
Service Delivery
• 4 Divisions Field Operations (District Offices and client services), Central
Operations (Adjudications), Program Management (Treatment and
Benefits), Health Professionals)
• 1550 personnel

4
Total Department Workforce Service Delivery Workforce
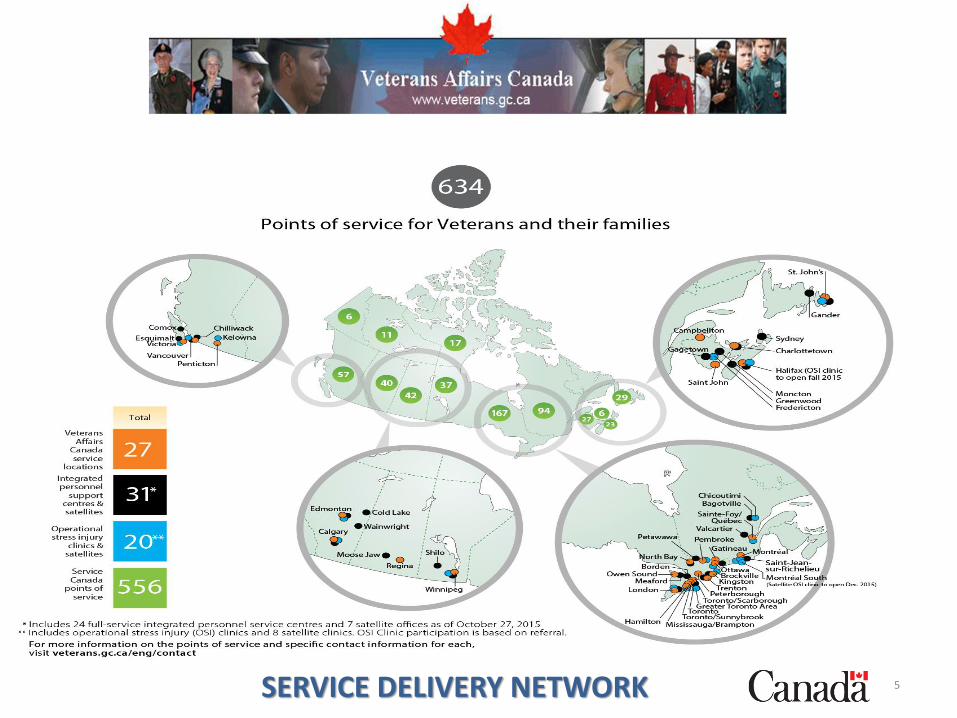
5SERVICE DELIVERY NETWORK

Health Professionals Division
• Admin Staff (6)
• Field Staff
– Medical Officers (41)
– Nurses (55)
– Occupational Therapists ( 60-all contractors)
• Directorate of Mental Health (23)
– Psychologists
– Social Workers
– Other occupations
6
HPD Context
• New Health Professionals
Division formed in 2012
• New DG Fall 2014
• New Departmental Strategy
• New DM, New Min VA
• Performance Measurement
7
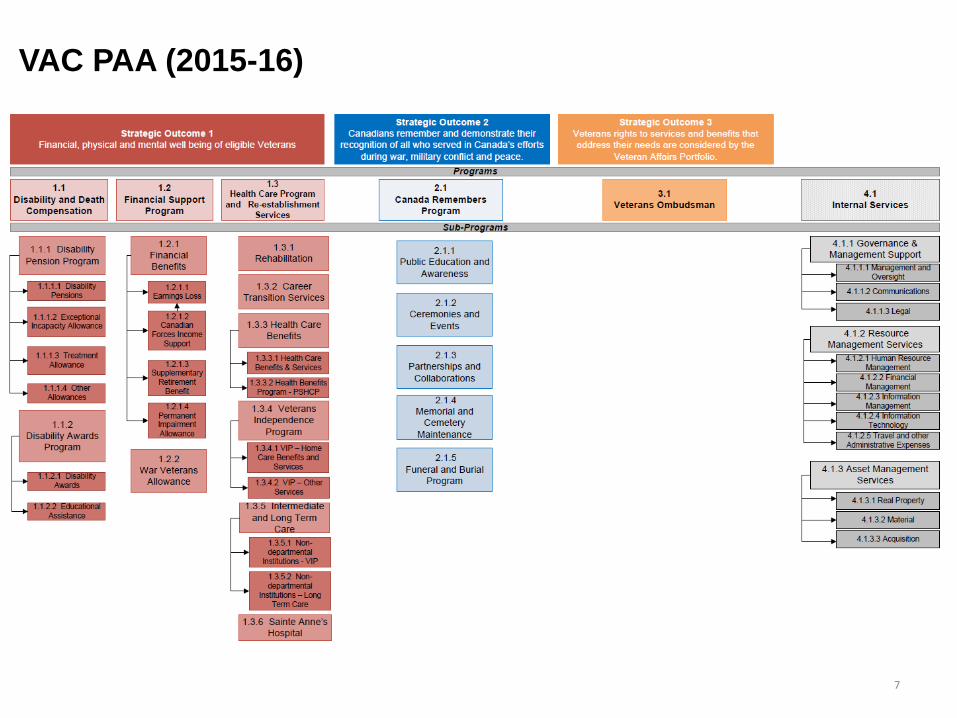
VAC PAA (2015-16)

Scope of HPD Workload Project
• Inventory activities
– (what are we doing?)
• Workload analysis
– (how busy are we?)
• Logic Model
– (are we doing the right things?)
• Performance Measurement framework
– ( are we achieving the right outcomes?)
8

Inventory of HPD activities

Workload Analysis – Data Collection

Workload Analysis – Data Comparisons and Validation

Activity Flow (Inputs to Outputs)
Nurses OTs

Workload Analysis Forecasting Model / Tool

Workload Analysis Forecasting Model / Tool
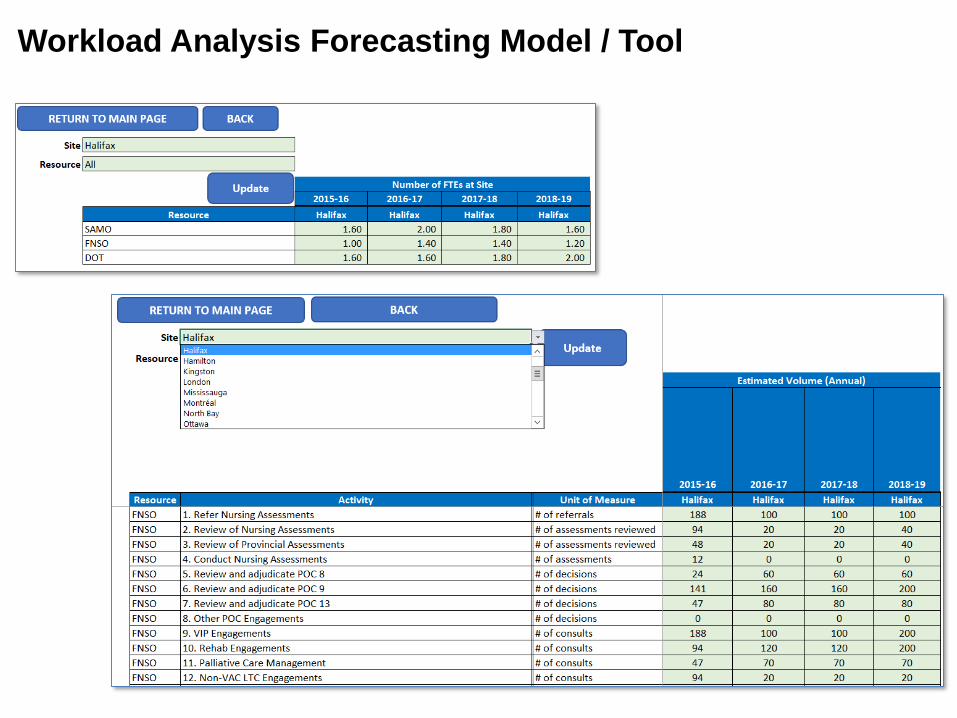
Workload Analysis Forecasting Model / Tool

Workload Analysis Forecasting Model / Tool

17
Summary and Analysis of Capacity/Utilization Results
• Workloads can vary significantly from region to region
• Activities can vary significantly from province to province
• Analysis of “outliers” provides potential opportunities for process
improvement
• HPD staff continue to go “above and beyond” to help meet
Healthcare Outcomes for Veterans

HPD Engagement
HPD Support to Strategic Outcome 1

HPD Support Various PMF IndicatorsHPD Engagement
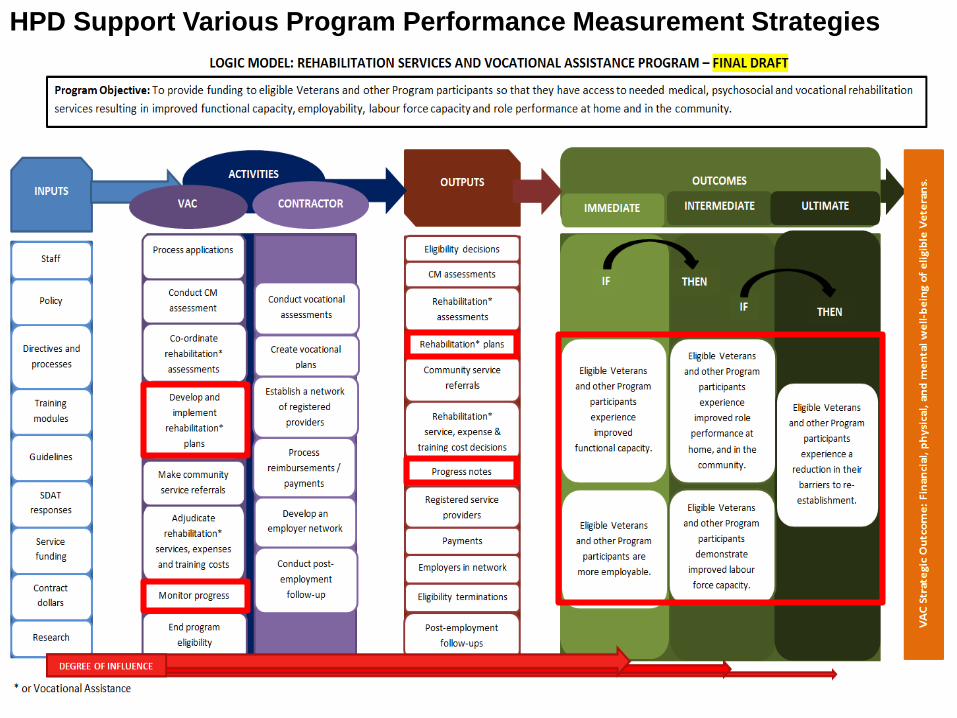
HPD Support Various Program Performance Measurement Strategies

Linking Activities and Outputs to Outcomes and Performance

22
Benefits and Lessons Learned
• Validation
• Information for decision making
• Communication
• Need to implement and sustain

Next Steps
• Validate workload nationwide ( all offices)
• Extract workload volumes from existing databases
• Deploy scenario-playing model nationwide
• Report and forecast
23


Costing Centre of ExpertiseCosting Benchmarking Framework
Planning & Performance Exchange Learning Event
Operational Costing & Capacity Management: Their Links to Planning, Performance, and Efficiency
January 26, 2016
1

2
Purpose
• Background
• High level findings
• Cost Factors Manual

3
CCE Major Activities
The CCE proactively supports:• Deputy Head and CFO accountabilities
• Program Sectors as the primary performers of the TBS challenge function
• The current roles and responsibilities of EMS
Key activities of the CCE include:• Supporting an enhanced diligence function within TBS for
consideration of funding requests
• Supporting “deep dives” and “horizontal reviews”
• Developing strategies for provision of training on cost containment and cost estimation for TBS program sector analysts
• Developing policy and guidance on cost estimation, cost containment, and the management of user fees
• Rolling out guidance on CFO attestation and provision of support to departments
Developing a cost factors manual to inform and
support resourcing decisions

4
Cost Factors Manual
• Is it possible to estimate incremental resource requirements for new initiatives?
• Can the Treasury Board assess the reasonableness of funding requests?
• Can we determine which metrics (cost factors) fairly represent efficiency in Internal Services?

5
Work to Date
Approach:
• Attempt to establish standard cost factors for comparable organizations
CCE went to work:
• What are other jurisdictions doing with their “internal services”?
• What are appropriate cost drivers for the different functions in internal services?

6
Open Data
Hypothesis being tested:
• Without adding to the reporting burden of organizations, what can we find out from publically available data?
Organizations have attested to this data and it has been tabled in Parliament:
• RPP, Public Accounts and DPR

7
Proof of Concept
Key Assumptions and Limitations:
• Expenditure was used as proxy for cost and capacity
• The IS Program was analyzed in the aggregate, not by sub-category of internal services
• IS Program effectiveness was not considered
Scope:
• Analysed the data for the following fiscal years:• 2010-11
• 2011-12
• 2012-13
• 2013-14
Ongoing evolution of approach

8
Clustering of Organizations
Preliminary Analysis:
• Size on its own may not be sufficient to explain fluctuations in IS expenditures; other factors must be considered to measure the complexity
• Type of activities performed (i.e. G&C and Capital) and the amount of resources dedicated to specific types of activities impact IS expenditures, as does the geographic reach (number of regions with employees)
o However Capital expenditures have limited publically available data
Organizational context is key to understanding the whole story!

9
Hypothetical Clustering of Organizations

10
What to measure?
• Analyze the behaviour of expenditures in groups of “like” organizations (or internally between programs) based on Cost Estimating Relationships
• One measure does not “tell the whole story”, multiple measures are needed to give a better understanding of an organization
• Based on preliminary analysis of publicly available data, 3 cost factors are being tested to see how they “tell the story”:
1) IS Program FTEs/All Other Programs FTEs
2) IS Program Gross Voted Operating Expenditures/ All Other Programs Gross Voted Operating Expenditures
3) IS Program Gross Voted Operating Expenditures/ Total Organizational FTEs
11
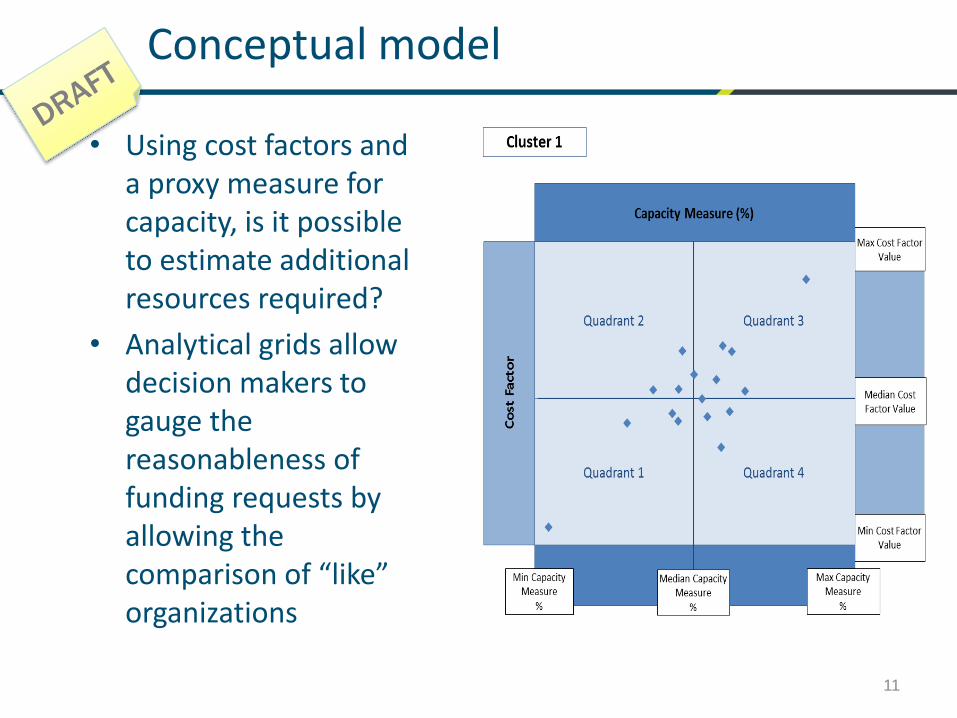
Conceptual model
• Using cost factors and a proxy measure for capacity, is it possible to estimate additional resources required?
• Analytical grids allow decision makers to gauge the reasonableness of funding requests by allowing the comparison of “like” organizations

12
Common Data and Clusters
• Our work to group organizations into appropriate clusters will enable:
o Reasonableness testing for Internal Services by providing a range of existing expenditures for similar organizations
o EMS can leverage these same cost factors and clustering methodology to measure performance
Common
Data Points
Clustering(size and
complexity)Performance Measures
(Efficiency and Effectiveness):
• Internal Services
• Transfer Payment Programs
• External Services
Reasonableness Measures for
expenditures and FTEs:
• Internal Services Program
• IS by function
• Type of G&C or Program
Collect data and analyse
Standardize Treatment
and Context
Review Results
Continuous Improvement

13
Similar but different
• EMS could leverage and evaluate the work by the CCE to consider the clustering and cost factors to look at efficiency metrics
• CCE is leveraging the EMS work on efficiency metrics and program tagging.
Thus far, common data can be leveraged by both and will not cause undue reporting burden to organizations.

14
Contact Information
Greg Steele
A/Director Costing Policy
Office of the Controller General, Treasury Board of Canada Secretariat
Government of [email protected]
Tel: 613-697-0863 / TTY: 613-957-9090
Directeur par intérim sur l’établissement des coûts,
Bureau du contrôleur général, Secrétariat du Conseil du Trésor du Canada
Gouvernement du [email protected]
Tél. : 613-697-0863 / ATS : 613-957-9090

Operational Costing and
Capacity Management
CBSA’s Cost Factor Manual
PERFORMANCE AND PLANNING EXCHANGE
(PPX)
January 26, 2016

Outline
• Context
• CBSA Cost Factor Manual
• The Step-variable approach applied
• Sample data extracts
• "Demo"
2

GoC Context
• TB President has been directed to
ensure more oversight on costing
and to ground decisions on
“best available information”
• TBS moving forward on
– Step-variable approach
– Benchmarking of internal services
costing / comparative data
– Internal Service efficiency and
performance indicators being
introduced
• CBSA proactively moving forward
with costing centre of expertise to
strengthen costing and implement /
apply step-variable approach

CBSA Context
• Like other departments, CBSA
facing a tight fiscal environment,
with significant pressure to
justify resourcing needs
with evidence
• In 2014, at the direction of the Deputy, the Agency initiated a
“Tooth-to-Tail” (TTT) analysis of Agency front-line versus internal
services resources
• The TTT architecture and data set was then transformed and
expanded to incorporate core front-line operational activities and
associated volumetrics to lay the foundation for the Agency’s
Cost Factor Manual (CFM)4
A A1-1 Front-line Program-Service Delivery Risk Assessment 1 Intelligence in the regions
A A1-2 Front-line Program-Service Delivery Risk Assessment 2 Security Screening
A A1-3 Front-line Program-Service Delivery Risk Assessment 3 Targeting
A A2-1 Front-line Program-Service Delivery Secure and Trusted Partnership 1 Trusted traveller … in the regions
A A2-2 Front-line Program-Service Delivery Secure and Trusted Partnership 2 Trusted trader … in the regions
A A3-1 Front-line Program-Service Delivery Admissibility determination 1 Front-line Ops - Traveller
CBSA CFM Objectives
• Improve accuracy, reliability and quality of Agency financial data
• Link data to core program volumetrics to enable stepped variable
costing in accordance with TBS / OCG costing directions
• Comply with TBS / OCG Internal Services costing guidance
• Create foundational data set to determine unit cost standards across
all common functions
• Strengthen rigour and quality of financial advice into budget allocation
decision making
5

The CFM – What Precisely Is it?• The CFM is a strategic resource management, costing, and management accounting
tool designed to support program analysis and resourcing decision-making
• It is essentially an off-line, enterprise data warehouse that links
– Financial expenditure data, to
– Program volumetric data,
– At the PoE level of analysis (in the regions), and
– At the Directorate level of analysis (at HQ).
• The scope of the database includes:
– Expenditure data, based on CAS, manually adjusted and validated by business owners
through multiple iterations since 2013
– Linkages to all financial data in the coding block, including Cost Centre data, Program Activity
data, Activity Type data, GL, Fund Code, etc
– Linkages to program volume data from core systems / data cubes, including ACROSS,
CRMS,G11, FOSS, ICES, etc..)
• As it contains manually adjusted financial data, it is not and should not be used for
system of record financial accounting requirements.
6

• The CFM architecture captures expenditures on multiple analytical levels,
through a series of data tags, including:
– “Tooth-to-Tail”, which captures
• Front-line Program Delivery, distinct from
• Direct Support to Front-line Program Delivery, distinct from
• Internal Services (in accordance with TBS guidance on coding for internal services)
– CBSA program architecture, specifically wrt
• The Agency’s current PAA, approved by TB Ministers in 2010, as distinct from
• The Agency’s new PAA, as approved by EC October 22, 2015
• The CFM is comprised of three main costing components:
– Regional Data
– Headquarters Data
– Costing by application
7
The CFM – What Precisely Is it?

Key Principles / Methodology
• CFM Key principles
– Account for 100% of expenditures
– No double counting
– Balance to public accounts / system of record
• To build / update the database, the data is pulled from source
systems and adjusted based on the attribution formulas that
have been validated over the past 2 years
– Mapped by POE/division to enable the alignment of resources and volumes
– Resources and volumes are attributed by function based on the CFM
architecture
– The data is then compared by “cluster” to further validate the allocation /
attributions by function at the most granular level (to identify anomolies /
variances and challenge the attributions and enable further refinement of
the quality of the data)
8

Using the CFMThe Agency is looking to use the CFM as a core analytical tool for
costing and resource allocation. Uses include:
• Costing for TB submissions
• Stepped-variable approach for budget allocations / resource management
decision-making
• Tool for targeted reviews (e.g. OT)
• Identification and assessment of variances in unit costs within a program
and between PoE
• Development of efficiency indicators for the new Agency
Performance Measurement framework
• X-walk for implementation of a new PAA
• Mapping of data pathways for the Agency Enterprise Data Warehouse
• Engaging the financial and program analyst user community to proto-type
business requirements and functionality for future reporting tools
9

10
• However, unlike true variable costs that vary directly with the level of activity; the stepped-variable approach
incurs increases at certain discrete points that involve changes in the number of FTEs required at the POE.
• Once we get to large POEs, the costs become truly variable depending on volumes.
Step-Variable Approach
Large
Tota
l Cos
t ($)
Small POEs
Small/Medium
Medium
Number of POEs :107Travellers : 4,463,023Commercial Releases: 319,065
Number of POEs: 28Travellers: 18,276,980Commercial Releases: 1,632,462
Number of POEs: 37Travellers : 5,647,045Commercial Releases: 2,009,161
Number of POEs: 20Travellers: 68,250,348Commercial Releases: 10,721,106

CFM Visualization ToolPrograms Branch – 2014-15
11
(under development)

12
Costing Centre of Expertise: Mandate
Vision:
• CBSA recognized as one of the best in costing in government
Mandate:
• Build and implement a fully integrated costing capability that strengthens the
Agency’s ability to deliver value-for-money across programs
Role / Position within Comptrollership:
• Centralized unit providing specialised cost estimation services
• Services to include:
– A core costing capability
– Capacity building, guidance and training to FMAs (targeting FI-02s and FI-03s)
– Costing tools for FMAs, to support their work
– Enterprise costing (I.e. CBSA costing template, IS costing model, SAF etc…)
12

Demo
13

Next Steps
• Confirm scope and limitations on use of CFM data
• Use CFM as an input factor in budget allocation decision-making
• Deploy visualization tool and directions and scope and limitations to
financial and program analyst community
• Use tool to support engagement and proto-typing of functionality desired
from user community in support of Enterprise Data Warehouse
• Continue to build a more accurate historical dataset by incorporating
periodic updates (until enterprise data warehouse is complete)
14