powerpoint-presentatie · pdf file30% concentrates (trt) ... day 1 2 3 4 5 6 7 8 9 10 11 12 13...
TRANSCRIPT

03/03/2016
1
Low Emission Animal Feed
Effect of feed additives on methane emission from dairy cows
02-03-2016 – Geronda Klop
Feed additives in the LEAF project
Two main aspects:
1. Interaction between feed additives
In vivo experiment
2. Adaptation to feed additives
Stepwise approach
Additives and mode of action
Nitrate (NO3) and docosahexaenoic acid (DHA)
- Different mode of action
NO3
- Alternative H2 sink in the rumen
- Persistently lowers CH4
- Shift towards higher acetate proportion in rumen fluid
DHA
- Affects microbial metabolism in the rumen
- Lower CH4 production in vitro
- Shift towards higher propionate proportion in rumen fluid
Why interested in testing interaction?
Same effect on CH4 at lower dose of additives
Alleviate potential adverse effects – e.g.:
● NO3 methemoglobinemia
● DHA reduced feed intake
4
Materials and Methods
2x2 factorial arrangement of treatments:
7 blocks of 4 cows
20 multiparous and 8 primiparous
(26 cows included in analyses – feeding error)
NO3 No Yes No Yes
DHA No No Yes Yes
Diets and feeding
Fed as total mixed ration (TMR)
NO3: 21 g/kg DM
DHA: 3.0 g/kg DM
On DM basis:
20% Grass silage
50% Corn silage
30% Concentrates (TRT)
03/03/2016
2
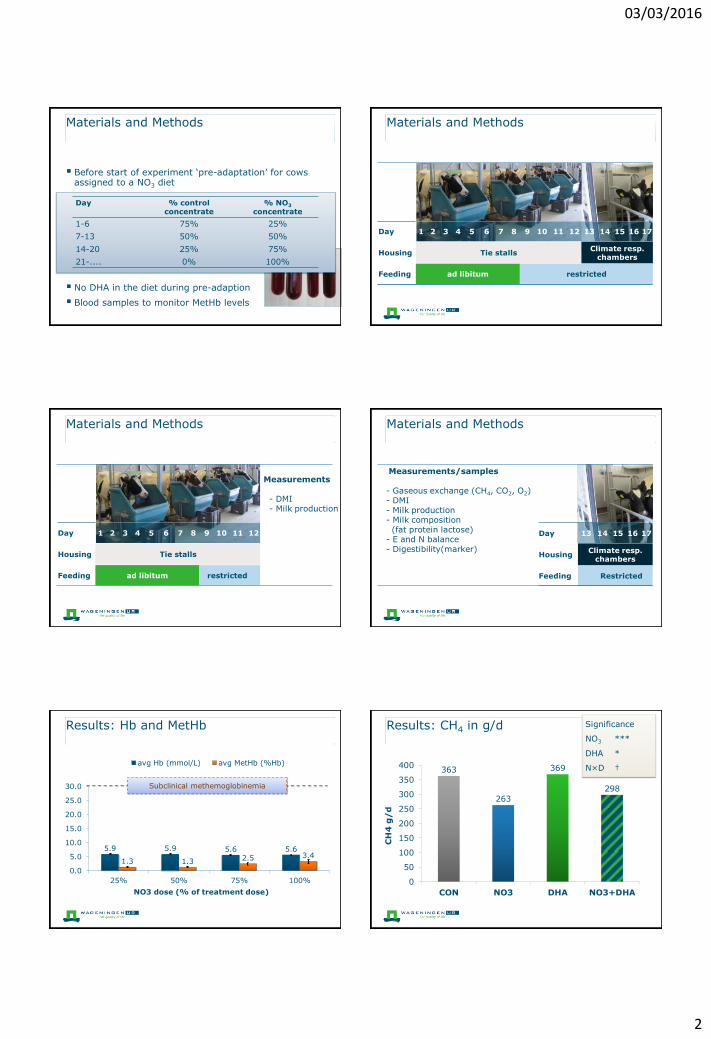
Materials and Methods
Before start of experiment ‘pre-adaptation’ for cows assigned to a NO3 diet
No DHA in the diet during pre-adaption
Blood samples to monitor MetHb levels
Day % control concentrate
% NO3
concentrate
1-6 75% 25%
7-13 50% 50%
14-20 25% 75%
21-.... 0% 100%
Day 1 2 3 4 5 6 7 8 9 10 11 12 13 14 15 16 17
Housing Tie stalls Climate resp.
chambers
Feeding ad libitum restricted
Materials and Methods
Day 1 2 3 4 5 6 7 8 9 10 11 12 13 14 15 16 17
Housing Tie stalls Climate resp.
chambers
Feeding ad libitum restricted
Measurements
- DMI - Milk production
Materials and Methods
Measurements/samples
- Gaseous exchange (CH4, CO2, O2) - DMI - Milk production - Milk composition (fat protein lactose) - E and N balance - Digestibility(marker)
Day 13 14 15 16 17
Housing Climate resp.
chambers
Feeding Restricted .
Materials and Methods
5.9 5.9 5.6 5.6
1.3 1.3 2.5 3.4
0.0
5.0
10.0
15.0
20.0
25.0
30.0
25% 50% 75% 100%
NO3 dose (% of treatment dose)
avg Hb (mmol/L) avg MetHb (%Hb)
Results: Hb and MetHb
Subclinical methemoglobinemia
363
263
369
298
0
50
100
150
200
250
300
350
400
CON NO3 DHA NO3+DHA
CH
4 g
/d
Results: CH4 in g/d Significance
NO3 ***
DHA *
N×D †

03/03/2016
3
22.0
16.9
22.4
18.2
0
10
20
30
40
CON NO3 DHA NO3+DHA
CH
4 (
g/
kg
DM
I)
Results: CH4 in g/kg DMI Significance
NO3 ***
DHA †
N×D NS
13.1
10.8
15.4
12.6
0
5
10
15
20
25
CON NO3 DHA NO3+DHA
CH
4 (
g/
kg
FP
CM
)
Results: CH4 in g/kg FPCM Significance
NO3 ***
DHA **
N×D NS
Results: Feed intake and milk yield
Protein g/kg
31.2 30.4 31.0 29.5 * NS NS
Item CON NO3 DHA NO3+DHA
Significance
NO3 DHA NO3×DHA
Milk kg/d
27.8 25.1 28.0 28.0 NS NS NS
FPCM kg/d
27.9 24.7 24.2 23.8 NS † NS
Fat g/kg
40.9 39.5 29.8 29.4 NS *** NS
DMI kg/d
16.5 15.7 16.5 16.4 * * †
Conclusions
CH4 emission lowered by dietary NO3, but not by DHA
In this trial both additives affected milk composition
DHA – reduced milk fat%
NO3 – reduced milk protein%
No apparent interaction effects on output parameters of interest (with restricted feeding)
For more details.... Feed additives in the LEAF project
Two main aspects:
1. Interaction between feed additives
In vivo experiment
2. Adaptation to feed additives
Stepwise approach

03/03/2016
4
Adaptation to feed additives: Background
Problem: Adaptation to feed additives with potential to reduce CH4
Alternating use of feed additives Solution?
Required:
● Two suitable additives (rumen adaptation)
● Info on duration of the effect of each additive on CH4
● Indication for mitigation potential and adaptive effects needed
Alternating use of feed additives
Three steps required for adequate testing of the concept:
1 •1st step: In vitro screening
2
•2nd step: In vitro/In vivo (adaptation) experiment
3
•3rd step: In vivo experiment using climate respiration chambers (CRC)
1st step: In vitro screening
Activated Charcoal (2.5% of DM)
Activated Charcoal (5% of DM)
Vitamin C (ascorbic acid) (5% of DM)
Coconut Oil (5% of DM)
Krabok Oil (5% of DM)
Lauric acid (C12:0) (5% of DM)
Myristic acid (C14:0) (5% of DM)
Agolin Ruminant® (0.01% of DM)
BES (positive control) (3% of DM)
Alternating use of feed additives
Three steps required for adequate testing of the concept:
1 •1st step: In vitro screening
2
•2nd step: In vitro/In vivo (adaptation) experiment
3
•3rd step: In vivo experiment using climate respiration chambers (CRC)
2nd step: In vitro / in vivo
9 fistulated cows
3 experimental diets
CON Control (no additive)
AR Agolin Ruminant®
~1 g/cow/d
C12:0 Lauric acid ~3% of total DM
In vitro measurements of adaptation in vivo
2nd step: In vitro / in vivo
Inoculum Substrate
Cow Diet
1 CON CON, AR, C12:0, -
2 AR CON, AR, C12:0, -
3 C12:0 CON, AR, C12:0, -
4 CON CON, AR, C12:0, -
5 AR CON, AR, C12:0, -
6 C12:0 CON, AR, C12:0, -
7 CON CON, AR, C12:0, -
8 AR CON, AR, C12:0, -
9 C12:0 CON, AR, C12:0, -
9 cows
3 exp. diets
3 substrates (similar to exp. diets) + 1 blank
Duplicate CH4
measurements
Gas production
measurements in triplicate
90 bottles
03/03/2016
5
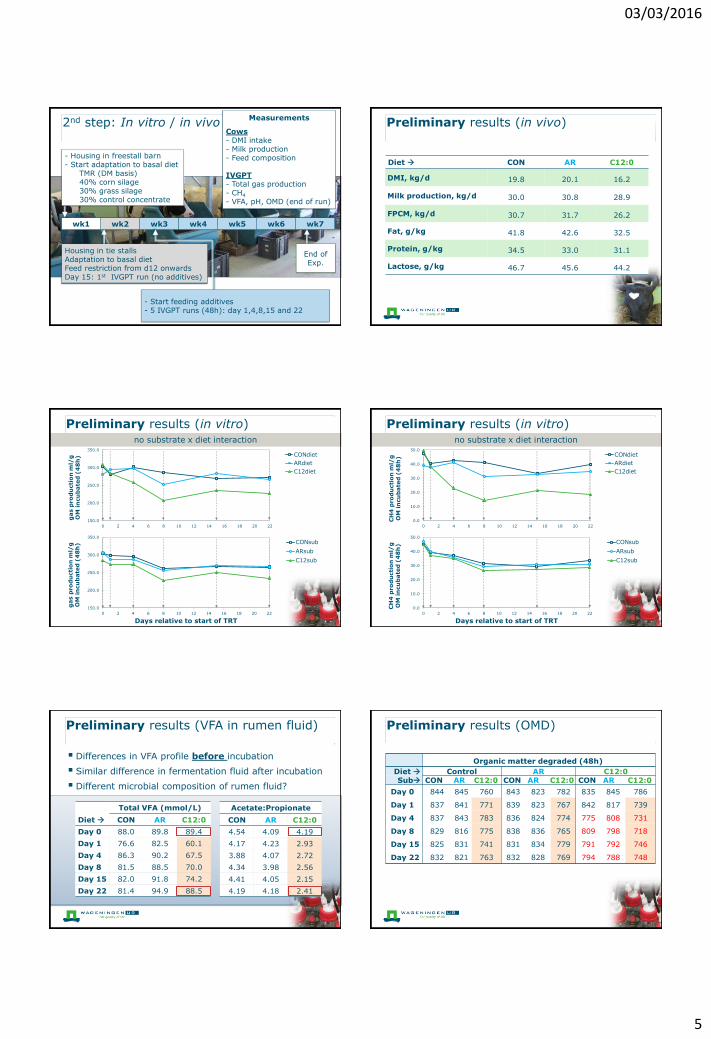
2nd step: In vitro / in vivo Measurements
Cows - DMI intake - Milk production - Feed composition IVGPT - Total gas production - CH4
- VFA, pH, OMD (end of run)
wk1 wk2 wk3 wk4 wk5 wk6 wk7
End of Exp.
- Housing in freestall barn - Start adaptation to basal diet
TMR (DM basis) 40% corn silage 30% grass silage 30% control concentrate
Housing in tie stalls Adaptation to basal diet Feed restriction from d12 onwards Day 15: 1st IVGPT run (no additives)
- Start feeding additives - 5 IVGPT runs (48h): day 1,4,8,15 and 22
Preliminary results (in vivo)
Diet CON AR C12:0
DMI, kg/d 19.8 20.1 16.2
Milk production, kg/d 30.0 30.8 28.9
FPCM, kg/d 30.7 31.7 26.2
Fat, g/kg 41.8 42.6 32.5
Protein, g/kg 34.5 33.0 31.1
Lactose, g/kg 46.7 45.6 44.2
Preliminary results (in vitro)
150.0
200.0
250.0
300.0
350.0
0 2 4 6 8 10 12 14 16 18 20 22
gas p
ro
du
cti
on
ml/
g
OM
in
cu
bate
d (
48
h) CONdiet
ARdiet
C12diet
150.0
200.0
250.0
300.0
350.0
0 2 4 6 8 10 12 14 16 18 20 22
gas p
ro
du
cti
on
ml/
g
OM
in
cu
bate
d (
48
h)
Days relative to start of TRT
CONsub
ARsub
C12sub
no substrate x diet interaction
Preliminary results (in vitro)
0.0
10.0
20.0
30.0
40.0
50.0
0 2 4 6 8 10 12 14 16 18 20 22
CH
4 p
ro
du
cti
on
ml/
g
OM
in
cu
bate
d (
48
h) CONdiet
ARdiet
C12diet
0.0
10.0
20.0
30.0
40.0
50.0
0 2 4 6 8 10 12 14 16 18 20 22
CH
4 p
ro
du
cti
on
ml/
g
OM
in
cu
bate
d (
48
h)
Days relative to start of TRT
CONsub
ARsub
C12sub
no substrate x diet interaction
Preliminary results (VFA in rumen fluid)
Differences in VFA profile before incubation
Similar difference in fermentation fluid after incubation
Different microbial composition of rumen fluid?
Total VFA (mmol/L)
Diet CON AR C12:0
Day 0 88.0 89.8 89.4
Day 1 76.6 82.5 60.1
Day 4 86.3 90.2 67.5
Day 8 81.5 88.5 70.0
Day 15 82.0 91.8 74.2
Day 22 81.4 94.9 88.5
Acetate:Propionate
CON AR C12:0
4.54 4.09 4.19
4.17 4.23 2.93
3.88 4.07 2.72
4.34 3.98 2.56
4.41 4.05 2.15
4.19 4.18 2.41
Preliminary results (OMD)
Organic matter degraded (48h)
Diet Control AR C12:0
Sub CON AR C12:0 CON AR C12:0 CON AR C12:0
Day 0 844 845 760 843 823 782 835 845 786
Day 1 837 841 771 839 823 767 842 817 739
Day 4 837 843 783 836 824 774 775 808 731
Day 8 829 816 775 838 836 765 809 798 718
Day 15 825 831 741 831 834 779 791 792 746
Day 22 832 821 763 832 828 769 794 788 748

03/03/2016
6
Summary
C12:0 at inclusion level of 3% of DM reduced intake and milk- and milk fat yield
Indications for adaptive response to AR
Effects of donor diet on VFA profile in rumen and fermentation fluid
Effects of donor diet on OM digestibility
Alternating use of feed additives
Three steps required for adequate testing of the concept:
1 •1st step: In vitro screening
2
•2nd step: In vitro/In vivo (adaptation) experiment
3
•3rd step: In vivo experiment using climate respiration chambers (CRC)
3rd step: In vivo experiment
Feed additive treatment
CON Only Agolin Ruminant® (AR) ~1 g/cow/d
ALT Weekly rotation of Agolin Ruminant® (AR) ~1 g/cow/d and lauric acid (C12:0) ~2% of total DMI
Again basal diet composed of 30% grass silage, 40% corn silage and 30% concentrates (treatments) on a DM basis.
Fistulated cows (group 1)
Non-fistulated cows (group 2)
3rd step: In vivo experiment
Cow Block (pair)
1 1
2 1
3 2
4 2
5 3
6 3
7 4
8 4
TRT
CON
ALT
CON
ALT
CON
ALT
CON
ALT
Experimental setup
Alternate use repeated 5 times (10 weeks)
“Background” CH4 production was measured on a similar basal diet without TRT additives
Thereafter setup as follows (per block):
TRT CRC Tie stalls CRC Tie stalls CRC
Wk 1 2 3 4 5 6 7 8 9 10
CON AR AR AR AR AR AR AR AR AR AR
ALT AR C12 AR C12 AR C12 AR C12 AR C12
Materials and Methods
Housing CRC Tie stalls
Week 1 2 3 4
CON AR AR AR AR
ALT AR C12 AR C12
• Gaseous exchange (CO2, O2, CH4) • DMI • Milk production and composition • Digestibility (marker)
• DMI • Milk production
• Rumen fluid (pH, vfa) on days 1 and 2 after each diet switch
03/03/2016
7
Preliminary results
CH4
g/d
408 405 378 336 386 328 386 316
g/kg FPCM
14.5
17.2 13.2 12.1 13.6 12.9 14.1 13.1
Basal diet (no additives)
Week 1+2 Week 5+6 Week 7+8
CON ALT CON ALT CON ALT CON ALT
... To be continued ...
Thank you!