copper concentrates
TRANSCRIPT
Copper concentrates classification briefing note – 30 October 2014 1/22
Copper Concentrates
Environmental and Human Health hazard classification.
Application to the assessment of substances “Harmful to the Marine Environment” (HME) as set out under the 2012 Annex V
MARPOL Convention amendments.
October 2014
Drafted by:
Dr. Katrien Delbeke,
European Copper Institute, Belgium
and
Dr. Patricio H. Rodriguez,
Center of Ecotoxicology and Chemistry of Metals, Universidad Adolfo Ibañez, Chile
Copper concentrates classification briefing note – 30 October 2014 2/22
Ownership
This Report is the property of the European Copper Institute (ECI), a member of the Copper Alliance. Company members of the International Copper Association and/or the European Copper Institute, plus fully paid up members of ECI’s IMO business venture, http://www.copperalliance.eu/industry/regulatory-framework/initiatives-and-regulations/imo-marpol-ghs – have full rights to use this report. As of July 1st 2014, those companies are listed below. Other companies wishing to use this report, to support their own compliance with IMO MARPOL Annex V, can contact ECI to agree terms of access.
Member companies of ECI’s IMO business venture
Companies (either through direct membership in the International Copper Association, or through participation
in the European Copper Institute’s IMO Business Venture) who have legitimate rights to make use of ECI’s
model to determine the classification (HME or not) of copper concentrates under MARPOL Annex V – list valid
as of July 1st 2014.
Company Address City Country
Anglo American 291 Pedro de Valdivia Ave Providence
75005, Santiago Chile
Antofogasta Minerals SA Avda. Apoquindo 4001, Piso 18. Las Condes
8340424, Santiago Chile
Aurubis Hovestrasse 50 20539, Hamburg Germany
BHP Billiton Plc Avenida Américo Vespucio Sur Nr. 100 Piso 9
Las Condes, Santiago Chile
Boliden AB Klarabergsviadukten 90 A, P.O. Box 44
SE-101 20, Stockholm Sweden
Buenavista del Cobre, S.A. de C.V. Campos Elíseos N° 400, Colonia Lomas de Chapultepec -
11000 C. P. Mexico
Compaňia Minera Doňa Inez Collahuasi
Avenida Andres Bello, 2687, Piso 11. Las Condes
7550611, Santiago Chile
Compaňia Minera Zaldivar Av. Richardo Lyon 222, Piso 8, Providencia
Santiago Chile
CODELCO-Chile Huerfanos 1270, Piso 11 Santiago Chile
Freeport McMoRan Copper & Gold 333 N. Central Ave. 85004, Phoenix Arizona
Glencore Baarermattstrasse 3 CH-6340 Baar Switzerland
Kennecott Utah Copper Corp. 2 Eastbourne Terrace W2 6LG, London United Kingdom
KGHM Polska Miedtz S.A. ul. M. Skłodowskiej-Curie 48 59-301 Lubin Poland
LS-Nikko Copper Inc. 20Fl., ASEM Tower, 159, Samseong- 1dong
Gangnam-gu, Seoul, 135-798, Korea
China
Mexicana de Cobre, S.A. de C.V. Campos Eliseos # 400.Colonia Lomas de Chapultepec
DF, 11560 Mexico
Minera Alumbrera Ltd. 4139 Distrito de Hualfín epartamento Belén
Catamarca Aregentina
Minera Antamina S.A. Av. El Derby 055, Torre 1, oficina 801 Santiago de Surco
Lima 34 Peru
Minera Escondida Limitada BHP Billiton Plc., Neathouse Place SW1V 1LH, London United Kingdom
Minera Esperanza Av. Aquindo 4001 Piso 13 7550162, Las Condes, Santiago
Chile
Minera Los Pelambres Av. Aquindo 4001 Piso 18 7550162, Las Condes, Santiago
Chile
Copper concentrates classification briefing note – 30 October 2014 3/22
Minera El Tesoro Av. Aquindo 4001 Piso 18 7550162, Las Condes, Santiago
Chile
Mitsubishi Materials Corporation 3-2, Otemachi 1-chome, Chiyoda-ku
100-8117, Tokyo Japan
Palabora PO BOX 65, 1 Copper Road, 1389 Phalaborwa South Africa
Pan Pacific Copper 7th Floor Shin-JX Building, 6-3
Otemachi
2-Chome Chiyoda-ku
105-0004 Tokyo Japan
Rio Tinto Plc 2 Eastbourne Terrace W2 6LG, London United Kingdom
Sociedad Contractual Minera el Abra
333 N. Central Ave. 85004, Phoenix Arizona
Sociedad Minera Cerro Verde S.A.A. 333 N. Central Ave. 85004, Phoenix Arizona
Southern Copper Corporation Campos Elíseos N° 400, Colonia Lomas de Chapultepec - Delegación Miguel Hidalgo
11000 C. P. Mexico
Sumitomo Metal Mining Co., Ltd. 11-3, Shimbashi 5-chome Minato-ku (Shimbashi Sumitomo Building)
105-8716, Tokyo Japan
Teck Suite 3300, Bentall 5, 550 Burrard Street
V6C 0B3, Vancouver, B.C.
Canada
Tenke Fungurume 333 N. Central Ave. 85004, Phoenix Arizona
Yunnan Copper Industry (Group) Ltd.
No. 111, Renmin East Road 650051, Kunming, China
Huckelbery Mines Ltd Suite 1030, 999 West Hastings
Street
Vancouver BC V6C 2W2 Canada
Lundin Mining Corporation
150 King Street W. Suite 1500 Toronto ON M1P 5H5 Canada
Gold Fields La Cima SA Av El Derby 055 Oficina 1001 Santiago de Sucro - Lima Perú
Trafigura Pte Ltd 10 Collyer Quay – 29-00 Ocran
Finanacial Centre
Singapore 049315 Singapore
Çayeli Bakir Hollanda Cad. No: 3/5 - Çankaya Ankara 06550 Turkey
Louis Dreyfus Commodities Metals Suisse SA
Swiss Air Centre – 29 route de
l’Aéroport PO Box 236
1215 Geneva 15 Switzerland
Newmont Mining Corporation Suite 800, 6363 S Fiddlers Green
Circle
Greenwood Village CO 80111
USA
New Gold Inc. 1800-555 Burrard Street Vancouver BC V7X 1M9 Canada
Ok Tedi Lining Limited 1 Dakon Road Tabubil – Western Province
Papua New Guinea
Ellazite MED AD 2086 Mirkovo-Sofia
Region
Bulgaria
Ocean Partners UK Limited 30-36 King Street Maidenhead SL6 1EF, United Kingdom
Imperial Metals Corporation
Mount Polley Mining Corporation 200 - 580 Hornby Street
Vancouver, BC V6C 3B6
Canada
Copper concentrates classification briefing note – 30 October 2014 4/22
CONTENT
Abstract
In 2012, the International Maritime Organization (IMO), adopted resolution MEPC 219(63). This establishes the hazard classification criteria for solid substances, transported as bulk cargo, to be considered as “harmful to the marine environment” (HME) for the purposes of restricting the disposal of solid bulk cargo residues under the amended Annex V of the MARPOL Convention.
Copper concentrates are solid mining products transported in bulk. The need for classifications of these materials, for the human health and environmental hazard categories set out in the HME criteria, was assessed following the UN-GHS 4th revision and the ICMM guidance (2013)1 on HME assessment of ores and concentrates.
The results are summarized as follows:
1 ICMM 2013. Assessment of HME criteria of mineral ores and concentrates: the international mining and metals industry approach
Abstract 5 6
1. Introduction to MARPOL Annex V 6
1.1 Amendments to Annex V of the MARPOL 73/78 Convention 6
1.2 The Global Harmonized System of Classification and Labeling (GHS) 6
1.3 Overview of Hazard Classification 6
2. Introduction to Copper concentrates 7
2.1 Production process 7
2.2 Copper concentrates - substance identity 8
3. Hazard classification of Copper concentrates 11
3.1 Environmental degradability assessment 11
3.2 Bioaccumulation assessment 11
3.3 Aquatic hazard identification 12
3.4. Human health hazard identification 19
4. Conclusions 22
Copper concentrates classification briefing note – 30 October 2014 5/22
- The elemental and mineral compositions of 119 copper concentrates, considered as representative of world-wide production, were collected. Elemental compositions are dominated by copper, iron and sulfur. These elements are incorporated in sulfidic minerals, such as chalcopyrite (CuFeS2), bornite (Cu5FeS4), diginite (Cu9S5), covellite (CuS) and chalcocite (Cu2S). Other major elemental constituents (Al, Ca, Mg, K, Si, Mn) are incorporated in minerals, usually defined as ‘gange”, such as calcite, dolomite, hornblende, quartz, chlinochlore, feldspar, kaolinite and biotite. Copper concentrates may also contain small amounts of zinc, lead, arsenic, nickel, cobalt and silver. These metals are incorporated in distinct minerals.
- To assess the environmental criteria, short and long term transformation/dissolution tests (7 and 28 days, pH 6, loading of
1 mg/L in the standard aqueous medium), in accordance to a standard protocol (UN GHS annex 9 and 10), were carried out on 13 copper concentrates, as well as on important pure copper minerals (chalcopyrite, chalcocite, digenite, bornite, covellite, enargite and tennantite). The environmental degradability of the released metal ions were assessed following the principles and recommendations of the metals GHS guidance and the EU’s European Chemicals Agency workshop.
o The results demonstrate low metal releases from the minerals. Comparison between the metal releases from the copper minerals and ecotoxicity reference values, obtained from CLP and REACH dossiers2, demonstrates that among the copper minerals, chalcocite merits classification as HME. The other copper minerals (chalcopyrite, bornite , diginite, covellite, enargite and tennantite) do not meet the environmental HME criteria.
o Comparison between the metal releases from the copper concentrates and ecotoxicity reference values, obtained from CLP and REACH2 dossiers, indicates that only concentrates with high chalcocite content merit HME classification. Such copper concentrates are rare - only 3 to 4% of the copper concentrates assessed trigger an HME classification entry.
- To assess the human health criteria, information on the bio-accessibility of the metal-ions, tested in accordance to a
standard protocol (ASTM 5517 test)3, their classification for mutagenicity, carcinogenicity, reproductive toxicity and STOT-RE, as well as their potential for bio-magnification, bio-accumulation and “rapid degradability”, were combined. The assessment demonstrates that the human health criteria do not lead to HME classification of copper concentrates.
2 Compiled from the multi-metal Meclas database - http://www.meclas.eu/ 3 ASM D5517-07: Standard Test Method for Determining Extractability of Metals from Art Materials, Philadelphia, PA: American Society for Testing and
Materials, 2007
Copper concentrates classification briefing note – 30 October 2014 6/22
1. Introduction to MARPOL Annex V
1.1 Amendments to the Annex V of the MARPOL 73/78 Convention
In 2012, the International Maritime Organization (IMO), adopted resolution MEPC 219(63). This establishes the hazard classification criteria for solid substances, transported as bulk cargo, to be considered as “harmful to the marine environment” (HME) for the purposes of restricting the disposal of solid bulk cargo residues under the amended Annex V of the MARPOL Convention.
The criteria4 5 encompass six hazard classes/categories relevant to inorganic substances. The hazard classification rules of the GHS, 4th revision, 20116 are used:
Criteria to classify as Harmful to the Marine Environment are: 1. Acute Aquatic Toxicity Category 1; and/or 2. Chronic Aquatic Toxicity Category 1 or 2; and/or 3. Carcinogenicity Category 1A or 1B, combined with not being rapidly degradable and having high
bioaccumulation; and/or 4. Mutagenicity Category 1A or 1B, combined with not being rapidly degradable and having high
bioaccumulation; and/or 5. Reproductive Toxicity Category 1A or 1B, combined with not being rapidly degradable and having high
bioaccumulation; and/or 6. Specific Target Organ Toxicity Repeated Exposure Category 1, combined with not being rapidly degradable
and having high bioaccumulation.
Copper concentrates are solid mining products transported in bulk. It is therefore necessary to determine the classifications for the human health and environmental hazard categories set out in the HME criteria.
1.2 The Global Harmonized System of Classification and Labeling (GHS)
The GHS is a methodology for standardizing and harmonizing the classification and labeling of chemicals. It defines a set of physical, health and environmental hazard classes and provides criteria for hazard classification, as well as a consistent method for communicating hazard information, including protective measures on labels and Safety Data Sheets (SDS).
The purpose of the GHS is to serve as a worldwide reference system, on matters of chemical management, which should be implemented in different regulatory jurisdictions and as the basis for worldwide regulatory frameworks (international legal instruments, recommendations, codes and guidelines). The GHS section of the UNECE web site7 provides the latest progress on implementation.
1.3 Overview of Hazard Classification
The steps involved in hazard classification can be summarized as follows. First, it is necessary to determine, as accurately as possible, the identity of the substance (its composition at both the compound and elemental level). Second, all the compounds and elements, which pose a hazard, must be accounted for, considering the percentages that trigger classification. Third, the hazard classification is determined following the GHS criteria and rules. A detailed flowchart of the approach can be found in “Assessment of HME criteria of mineral ores and concentrates: the international mining and metals industry approach” (ICMM, 2013).
4 The criteria are based on UN GHS, fourth revised edition (2011). For specific products (e.g. metals and inorganic metal compounds), guidance available in UN GHS, annexes 9 and 10, are essential for proper interpretation of the criteria and classification and should be followed 5 Products that are classified for Carcinogenicity, Mutagenicity, Reproductive toxicity or Specific Target Organ Toxicity Repeated Exposure for oral and dermal hazards or without specification of the exposure route in the hazard statement 6 http://www.unece.org/trans/danger/publi/ghs/ghs_rev04/04files_e.html 7 http://www.unece.org/trans/danger/publi/ghs/implementation_e.html#c25755
Copper concentrates classification briefing note – 30 October 2014 7/22
Scheme 1 - General classification scheme
2. Introduction to copper concentrates
2.1 Production process
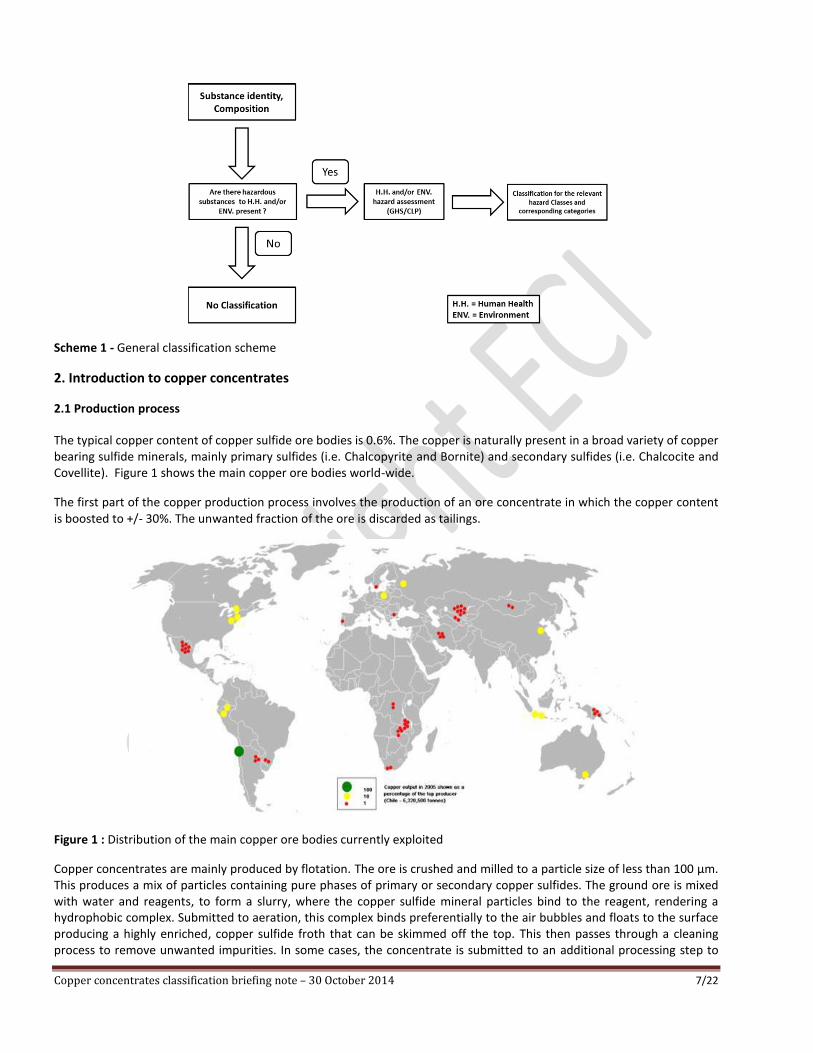
The typical copper content of copper sulfide ore bodies is 0.6%. The copper is naturally present in a broad variety of copper bearing sulfide minerals, mainly primary sulfides (i.e. Chalcopyrite and Bornite) and secondary sulfides (i.e. Chalcocite and Covellite). Figure 1 shows the main copper ore bodies world-wide.
The first part of the copper production process involves the production of an ore concentrate in which the copper content is boosted to +/- 30%. The unwanted fraction of the ore is discarded as tailings.
Figure 1 : Distribution of the main copper ore bodies currently exploited
Copper concentrates are mainly produced by flotation. The ore is crushed and milled to a particle size of less than 100 µm. This produces a mix of particles containing pure phases of primary or secondary copper sulfides. The ground ore is mixed with water and reagents, to form a slurry, where the copper sulfide mineral particles bind to the reagent, rendering a hydrophobic complex. Submitted to aeration, this complex binds preferentially to the air bubbles and floats to the surface producing a highly enriched, copper sulfide froth that can be skimmed off the top. This then passes through a cleaning process to remove unwanted impurities. In some cases, the concentrate is submitted to an additional processing step to
Copper concentrates classification briefing note – 30 October 2014 8/22
extract a by-product (e.g. molybdenum sulfide). Finally, the copper concentrate is dried ready for transportation to the next step (smelting).
The concentrates from primary sulfides (Chalcopyrite rich) contain, on average, 20 to 30% copper, whereas the secondary sulfide concentrates (Chalcocite rich) can reach copper concentrations of up to 40%.
It is important to note that the copper concentrate production process does not involve any chemical modification of the original ore body.
2.2 Copper Concentrates - Substance Identity
As can be envisaged from the production process, outlined above, copper concentrates are made up of primary and/or secondary copper sulfide minerals, containing small amounts of impurities. The variability of the mineral content and composition depends mainly on the geographical location and age of the mine site. Concentrates are therefore considered to be naturally occurring substances of variable composition.
Within the current GHS, these are considered as complex mixtures or complex substances. In its European version, the Regulation on Classification, Labelling and Packaging of substances and mixtures (EC 1272/2008 (CLP)), copper concentrates are considered as UVCB8 substances.
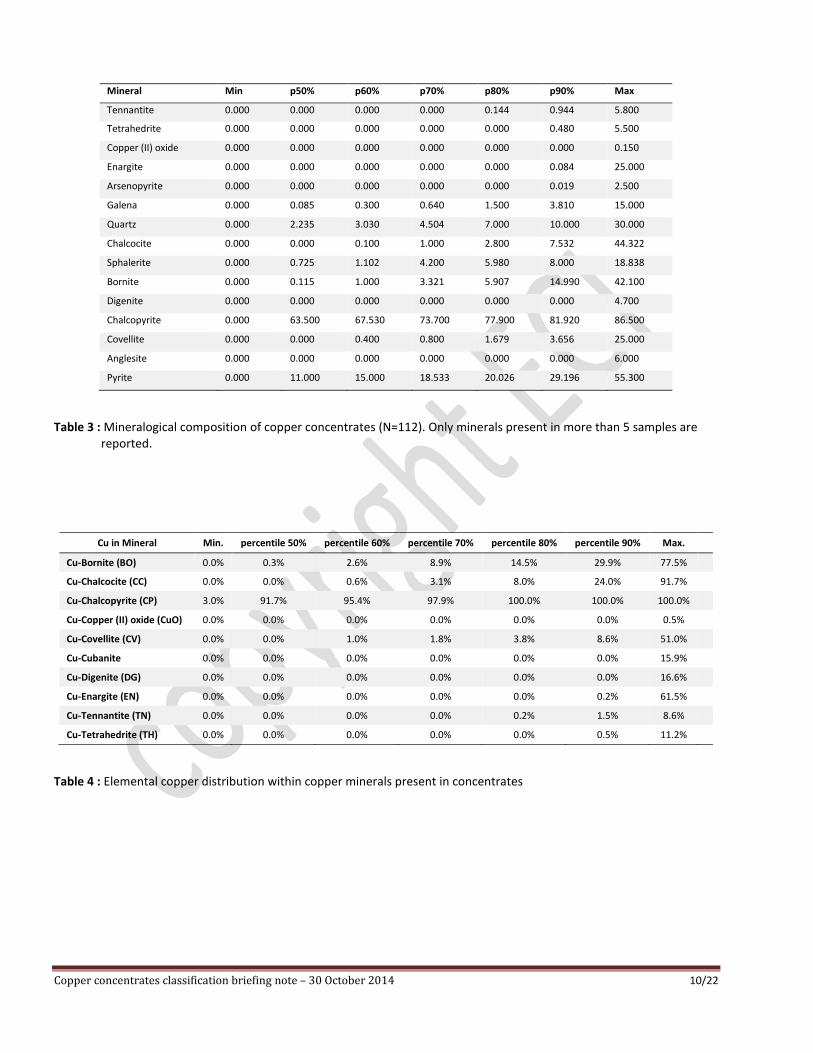
The European Copper Institute has collected a database of 119 copper concentrates, containing elemental/mineralogical
compositions, which represents most of the product that is transported globally (See Table 1 – 3). Table 4 further
demonstrates the primary importance of chalcopyrite, as a copper containing mineral, as well as the possible presence of other copper minerals, especially chalcocite, bornite and covellite, in some copper concentrates.
Additionally, a detailed characterization was carried out on representative samples (hereafter called reference materials/reference concentrates) by an independent, specialized laboratory.
The elemental composition was analyzed using several techniques and methodologies including, inductively coupled plasma atomic emission spectroscopy (ICP-AES), or inductively coupled plasma mass spectrometry (ICP-MS) after total dissolution. The amount of silicon oxide, SiO2, was analyzed colorimetrically. Sulfur and carbon contents were determined in automatic analyzers (i.e. ELTRA CS2000) and the amount of sulfate, SO4, by ion exchange chromatography.
The mineralogy was determined using methodologies of Scanning Electron Microscopy with Energy Dispersive X-Ray
Spectrometer (SEM/EDS) and X-ray diffraction (XRD), also using integrated methodologies like QEMSCAN (Quantitative
Evaluation of Minerals by SCANning electron microscopy).
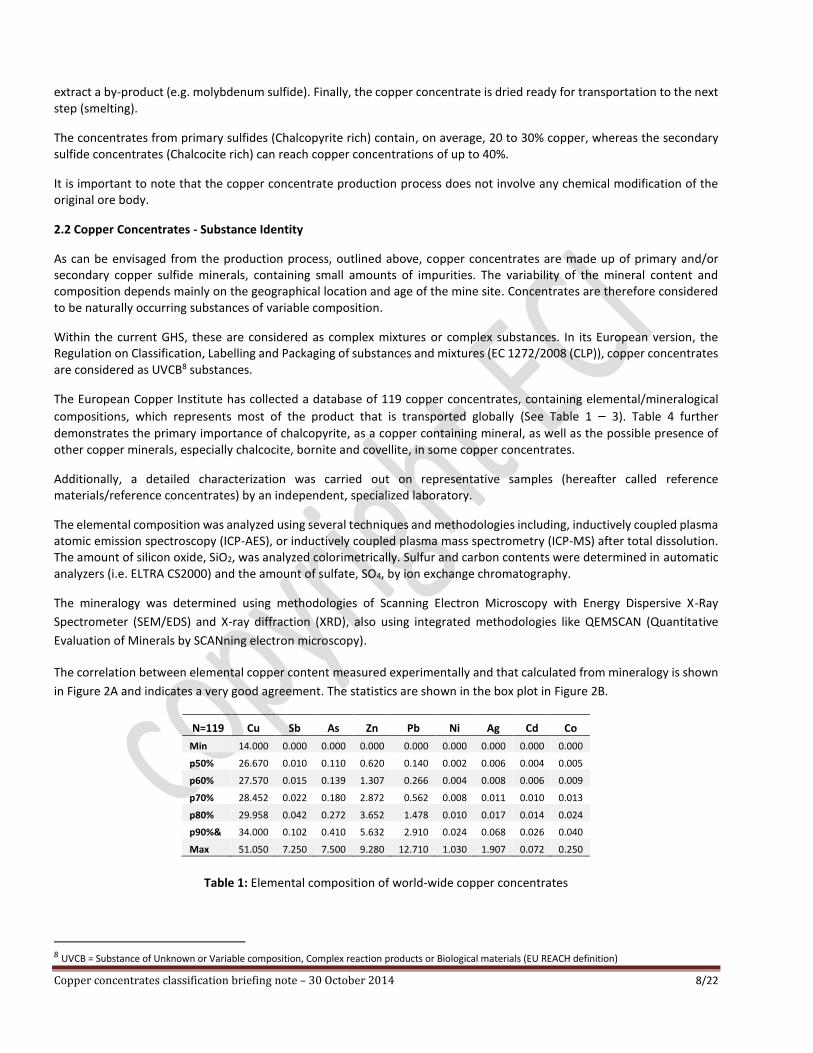
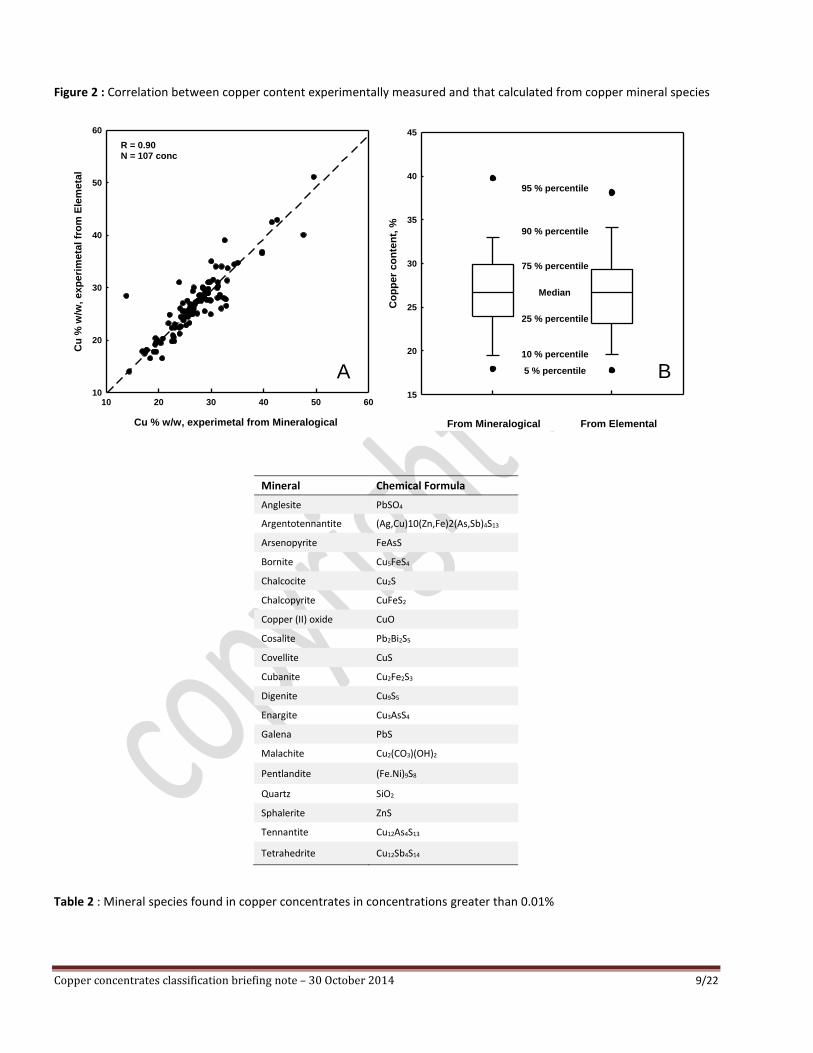
The correlation between elemental copper content measured experimentally and that calculated from mineralogy is shown
in Figure 2A and indicates a very good agreement. The statistics are shown in the box plot in Figure 2B.
N=119 Cu Sb As Zn Pb Ni Ag Cd Co
Min 14.000 0.000 0.000 0.000 0.000 0.000 0.000 0.000 0.000
p50% 26.670 0.010 0.110 0.620 0.140 0.002 0.006 0.004 0.005
p60% 27.570 0.015 0.139 1.307 0.266 0.004 0.008 0.006 0.009
p70% 28.452 0.022 0.180 2.872 0.562 0.008 0.011 0.010 0.013
p80% 29.958 0.042 0.272 3.652 1.478 0.010 0.017 0.014 0.024
p90%& 34.000 0.102 0.410 5.632 2.910 0.024 0.068 0.026 0.040
Max 51.050 7.250 7.500 9.280 12.710 1.030 1.907 0.072 0.250
Table 1: Elemental composition of world-wide copper concentrates
8 UVCB = Substance of Unknown or Variable composition, Complex reaction products or Biological materials (EU REACH definition)
Copper concentrates classification briefing note – 30 October 2014 9/22
Figure 2 : Correlation between copper content experimentally measured and that calculated from copper mineral species
Mineral Chemical Formula
Anglesite PbSO4
Argentotennantite (Ag,Cu)10(Zn,Fe)2(As,Sb)4S13
Arsenopyrite FeAsS
Bornite Cu5FeS4
Chalcocite Cu2S
Chalcopyrite CuFeS2
Copper (II) oxide CuO
Cosalite Pb2Bi2S5
Covellite CuS
Cubanite Cu2Fe2S3
Digenite Cu9S5
Enargite Cu3AsS4
Galena PbS
Malachite Cu2(CO3)(OH)2
Pentlandite (Fe.Ni)9S8
Quartz SiO2
Sphalerite ZnS
Tennantite Cu12As4S13
Tetrahedrite Cu12Sb4S14
Table 2 : Mineral species found in copper concentrates in concentrations greater than 0.01%
Cu % w/w, experimetal from Mineralogical
10 20 30 40 50 60
Cu
% w
/w,
exp
eri
meta
l fr
om
Ele
meta
l
10
20
30
40
50
60
R = 0.90N = 107 conc
From Mineralogical From Elemental
Co
pp
er
co
nte
nt,
%15
20
25
30
35
40
45
A B5 % percentile
10 % percentile
25 % percentile
Median
75 % percentile
90 % percentile
95 % percentile
Copper concentrates classification briefing note – 30 October 2014 10/22
Mineral Min p50% p60% p70% p80% p90% Max
Tennantite 0.000 0.000 0.000 0.000 0.144 0.944 5.800
Tetrahedrite 0.000 0.000 0.000 0.000 0.000 0.480 5.500
Copper (II) oxide 0.000 0.000 0.000 0.000 0.000 0.000 0.150
Enargite 0.000 0.000 0.000 0.000 0.000 0.084 25.000
Arsenopyrite 0.000 0.000 0.000 0.000 0.000 0.019 2.500
Galena 0.000 0.085 0.300 0.640 1.500 3.810 15.000
Quartz 0.000 2.235 3.030 4.504 7.000 10.000 30.000
Chalcocite 0.000 0.000 0.100 1.000 2.800 7.532 44.322
Sphalerite 0.000 0.725 1.102 4.200 5.980 8.000 18.838
Bornite 0.000 0.115 1.000 3.321 5.907 14.990 42.100
Digenite 0.000 0.000 0.000 0.000 0.000 0.000 4.700
Chalcopyrite 0.000 63.500 67.530 73.700 77.900 81.920 86.500
Covellite 0.000 0.000 0.400 0.800 1.679 3.656 25.000
Anglesite 0.000 0.000 0.000 0.000 0.000 0.000 6.000
Pyrite 0.000 11.000 15.000 18.533 20.026 29.196 55.300
Table 3 : Mineralogical composition of copper concentrates (N=112). Only minerals present in more than 5 samples are reported.
Cu in Mineral Min. percentile 50% percentile 60% percentile 70% percentile 80% percentile 90% Max.
Cu-Bornite (BO) 0.0% 0.3% 2.6% 8.9% 14.5% 29.9% 77.5%
Cu-Chalcocite (CC) 0.0% 0.0% 0.6% 3.1% 8.0% 24.0% 91.7%
Cu-Chalcopyrite (CP) 3.0% 91.7% 95.4% 97.9% 100.0% 100.0% 100.0%
Cu-Copper (II) oxide (CuO) 0.0% 0.0% 0.0% 0.0% 0.0% 0.0% 0.5%
Cu-Covellite (CV) 0.0% 0.0% 1.0% 1.8% 3.8% 8.6% 51.0%
Cu-Cubanite 0.0% 0.0% 0.0% 0.0% 0.0% 0.0% 15.9%
Cu-Digenite (DG) 0.0% 0.0% 0.0% 0.0% 0.0% 0.0% 16.6%
Cu-Enargite (EN) 0.0% 0.0% 0.0% 0.0% 0.0% 0.2% 61.5%
Cu-Tennantite (TN) 0.0% 0.0% 0.0% 0.0% 0.2% 1.5% 8.6%
Cu-Tetrahedrite (TH) 0.0% 0.0% 0.0% 0.0% 0.0% 0.5% 11.2%
Table 4 : Elemental copper distribution within copper minerals present in concentrates
Copper concentrates classification briefing note – 30 October 2014 11/22
3. Hazard identification of Copper Concentrates
3.1 Environmental degradability assessment
Toxic substances that persist in the environment are considered more hazardous than substances that are readily degradable. Therefore, more severe chronic hazard classes are assigned to non-degradable substances (GHS, 2011 Table 4.1.1.).
While it has been recognized that “rapid degradability”, as defined for organic substances, does not apply to metals (GHS, Annex 9, A9.7.3.1, 2011), the concept is critical to the environmental classification of metals and metal compounds.
Through multi-metal co-operation, in accordance with the principles outlined in the GHS and EU CLP guidance (ECHA, 2011), the potential for ‘rapid loss from the environment’ of metal ions (e.g. Cu, Zn, Pb, Ni, As, Cd) has been evaluated by assessing the removal rates of metal ions through partitioning and their subsequent potential for sediment mineralization/remobilization9 , 10 and 11. The assessments have been done using a weight of evidence approach based on laboratory/mesocosm studies, field data and/or metal fate model.
The model assessment is based on The Tableau Input Coupled Kinetics Equilibrium Transport Unit World Model for Metals in Lakes (hereafter referred to as TICKET-UWM and available from http://blog.unitworldmodel.net), developed to assess the complexities and fate of metal speciation and its influence on effects of metals in the environment.
The principles and methodologies were discussed at the European Chemicals Agency (ECHA) in a workshop carried out on February 8th, 2012. The following conclusions were drawn:
Metals that methylate, such as Hg, are not rapidly degraded;
Metals that quickly hydrolyze and form different species that precipitate in the water column (Fe, Al, Sb, Sn, Mo, Cr...) are considered rapidly degraded;
For the third group of metals (Cu, Zn, Ni, Pb), where the partitioning as well as the binding to Acid Volatile Sulfides are important factors for determining the rate of substance removal from the aquatic compartment, a consensus was not reached. Different views were expressed as to what extent the intrinsic properties of metals drive partitioning and binding to the sediment and what are the parameters (type of information) required to determine irreversibility under different environmental conditions. Further discussions are needed.
ECI, Eurometaux, ICMM and consultants have since provided additional evidence to the ECHA working group. Copper-specific reports are available (Rader 2012 and 2013). A multi-metal report, assessing the third group, is
available (Rader et al., 2013) 11.
From this assessment, Cd, Cu, Ni, Pb, Sb and Zn are considered as rapidly degraded. This is integrated in this assessment.
3.2 Bioaccumulation Assessment
The copper Risk Assessment Report (2008)12 and REACH Chemical Safety Report (2010) have provided detailed information on (1) the essentiality of copper; (2) the homeostatic control of copper; (3) the mechanisms of action of copper ions; (4) the comparison between copper toxicity from dietary versus waterborne exposures. From this information, it has been concluded that the bio-accumulation criterion does not apply to the essential element
9 Rader, K et al., 2013. ASSESSMENT OF TIME-VARIABLE SOLUTIONS FOR COPPER IN THE UNIT WORLD MODEL FOR METALS IN LAKES – Report
001, available at ECI, submitted to the European Chemicals Agency (ECHA) 10 Rader, K et al., 2012. Assessing Copper Concentrates in TICKET-UWM. Report, available at ECI 11 Rader, K et al., 2013. Metal Classification using a Unit World Model. Eurometaux report, available at ECI, submitted to the European
Chemicals Agency (ECHA) 12 http://echa.europa.eu/copper-voluntary-risk-assessment-reports
Copper concentrates classification briefing note – 30 October 2014 12/22
copper. Similarly, in the zinc risk assessment and chemical safety report (2010)13, it has been concluded that the bio-accumulation criterion does not apply to the essential element zinc.
The bio-accumulation potential of lead and nickel has been assessed in the lead and nickel risk assessments and under the EU Water Framework Directive14. These assessments concluded that both lead and nickel are not bio- magnified and do not pose a secondary poisoning concern.
This assessment therefore concludes that copper and zinc are not bio-accumulative and that lead and nickel do not bio-magnify.
3.3. Aquatic Hazard Identification
Principles for the assessment
Copper concentrates exhibit a broad range of elemental and mineralogical compositions (Table 1 - 4). In order to
assess the hazards and classifications for such a varied family of materials, without engaging in an extremely extensive and expensive testing campaign, a read across approach, aligned with the GHS and CLP metal-specific guidance and ICMM’s hazard assessment guidance on ores and concentrates, was developed. This is briefly described below.
Copper concentrates are complex, sparingly soluble inorganic materials. In accordance with the GHS, their environmental classification is done by comparing the environmental soluble metal ions, measured after Transformation/Dissolution (TD), with their ecotoxicity reference values. The Transformation/Dissolution protocol (TDp) is the outcome of an international effort, under the OECD, to develop a standard operating procedure to assess the rate and extent of metal-ion releases from metals and sparingly soluble inorganic metal compounds (Skeaff et al., 2006)15.
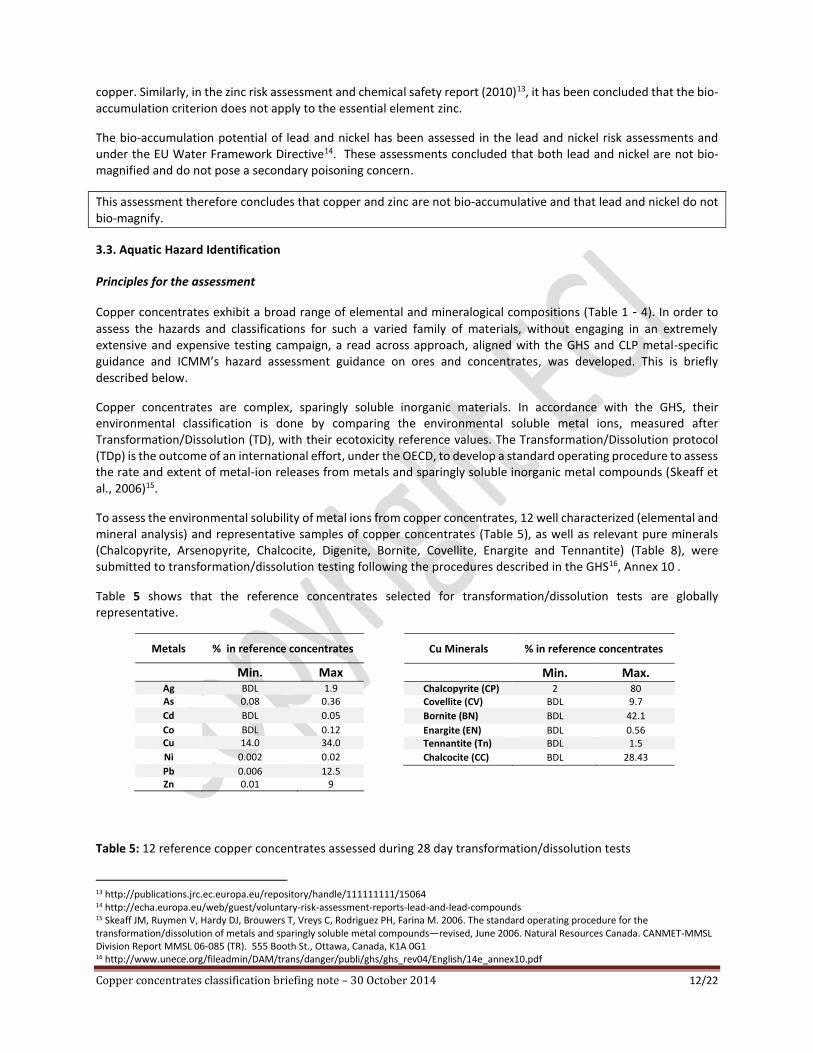
To assess the environmental solubility of metal ions from copper concentrates, 12 well characterized (elemental and mineral analysis) and representative samples of copper concentrates (Table 5), as well as relevant pure minerals (Chalcopyrite, Arsenopyrite, Chalcocite, Digenite, Bornite, Covellite, Enargite and Tennantite) (Table 8), were submitted to transformation/dissolution testing following the procedures described in the GHS16, Annex 10 .
Table 5 shows that the reference concentrates selected for transformation/dissolution tests are globally representative.
Metals % in reference concentrates
Min. Max Ag BDL 1.9 As 0.08 0.36
Cd BDL 0.05
Co BDL 0.12 Cu 14.0 34.0
Ni 0.002 0.02
Pb 0.006 12.5 Zn 0.01 9
Cu Minerals % in reference concentrates
Min. Max. Chalcopyrite (CP) 2 80 Covellite (CV) BDL 9.7
Bornite (BN) BDL 42.1
Enargite (EN) BDL 0.56 Tennantite (Tn) BDL 1.5
Chalcocite (CC) BDL 28.43
Table 5: 12 reference copper concentrates assessed during 28 day transformation/dissolution tests
13 http://publications.jrc.ec.europa.eu/repository/handle/111111111/15064 14 http://echa.europa.eu/web/guest/voluntary-risk-assessment-reports-lead-and-lead-compounds 15 Skeaff JM, Ruymen V, Hardy DJ, Brouwers T, Vreys C, Rodriguez PH, Farina M. 2006. The standard operating procedure for the transformation/dissolution of metals and sparingly soluble metal compounds—revised, June 2006. Natural Resources Canada. CANMET-MMSL Division Report MMSL 06-085 (TR). 555 Booth St., Ottawa, Canada, K1A 0G1 16 http://www.unece.org/fileadmin/DAM/trans/danger/publi/ghs/ghs_rev04/English/14e_annex10.pdf
Copper concentrates classification briefing note – 30 October 2014 13/22
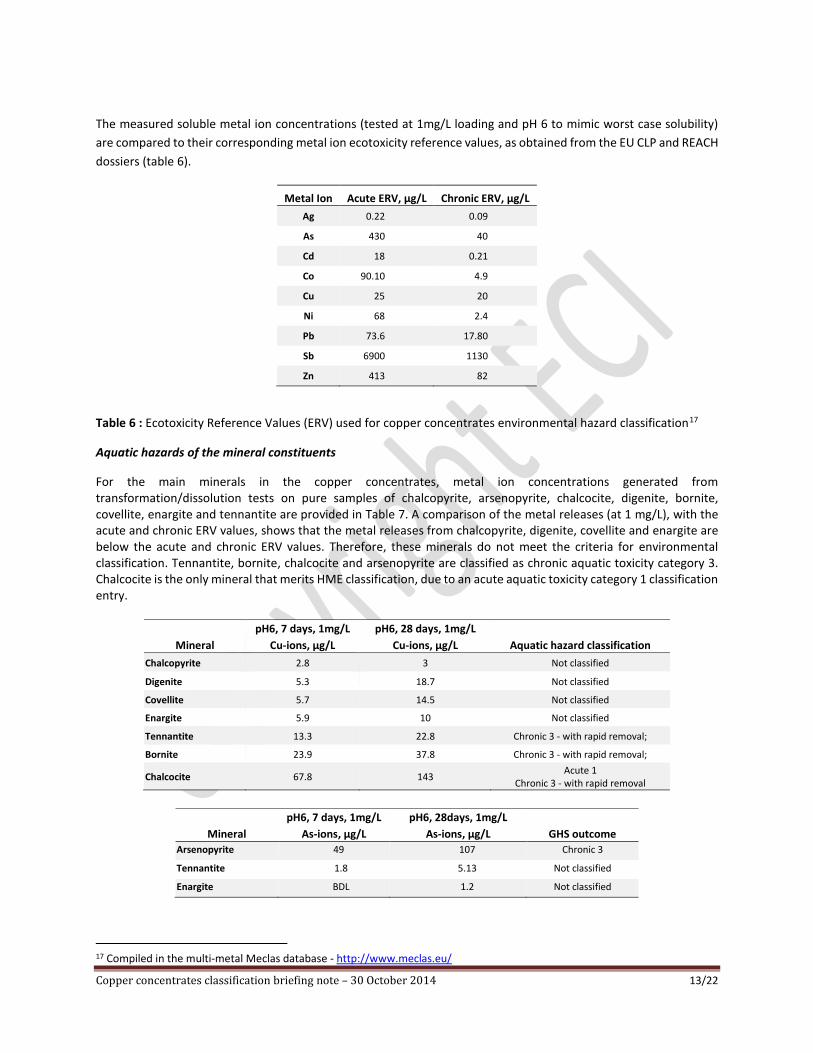
The measured soluble metal ion concentrations (tested at 1mg/L loading and pH 6 to mimic worst case solubility)
are compared to their corresponding metal ion ecotoxicity reference values, as obtained from the EU CLP and REACH
dossiers (table 6).
Metal Ion Acute ERV, µg/L Chronic ERV, µg/L
Ag 0.22 0.09
As 430 40
Cd 18 0.21
Co 90.10 4.9
Cu 25 20
Ni 68 2.4
Pb 73.6 17.80
Sb 6900 1130
Zn 413 82
Table 6 : Ecotoxicity Reference Values (ERV) used for copper concentrates environmental hazard classification17
Aquatic hazards of the mineral constituents
For the main minerals in the copper concentrates, metal ion concentrations generated from transformation/dissolution tests on pure samples of chalcopyrite, arsenopyrite, chalcocite, digenite, bornite, covellite, enargite and tennantite are provided in Table 7. A comparison of the metal releases (at 1 mg/L), with the acute and chronic ERV values, shows that the metal releases from chalcopyrite, digenite, covellite and enargite are below the acute and chronic ERV values. Therefore, these minerals do not meet the criteria for environmental classification. Tennantite, bornite, chalcocite and arsenopyrite are classified as chronic aquatic toxicity category 3. Chalcocite is the only mineral that merits HME classification, due to an acute aquatic toxicity category 1 classification entry.
pH6, 7 days, 1mg/L pH6, 28 days, 1mg/L
Mineral Cu-ions, µg/L Cu-ions, µg/L Aquatic hazard classification
Chalcopyrite 2.8 3 Not classified
Digenite 5.3 18.7 Not classified
Covellite 5.7 14.5 Not classified
Enargite 5.9 10 Not classified
Tennantite 13.3 22.8 Chronic 3 - with rapid removal;
Bornite 23.9 37.8 Chronic 3 - with rapid removal;
Chalcocite 67.8 143 Acute 1
Chronic 3 - with rapid removal
pH6, 7 days, 1mg/L pH6, 28days, 1mg/L
Mineral As-ions, µg/L As-ions, µg/L GHS outcome
Arsenopyrite 49 107 Chronic 3
Tennantite 1.8 5.13 Not classified
Enargite BDL 1.2 Not classified
17 Compiled in the multi-metal Meclas database - http://www.meclas.eu/
Copper concentrates classification briefing note – 30 October 2014 14/22
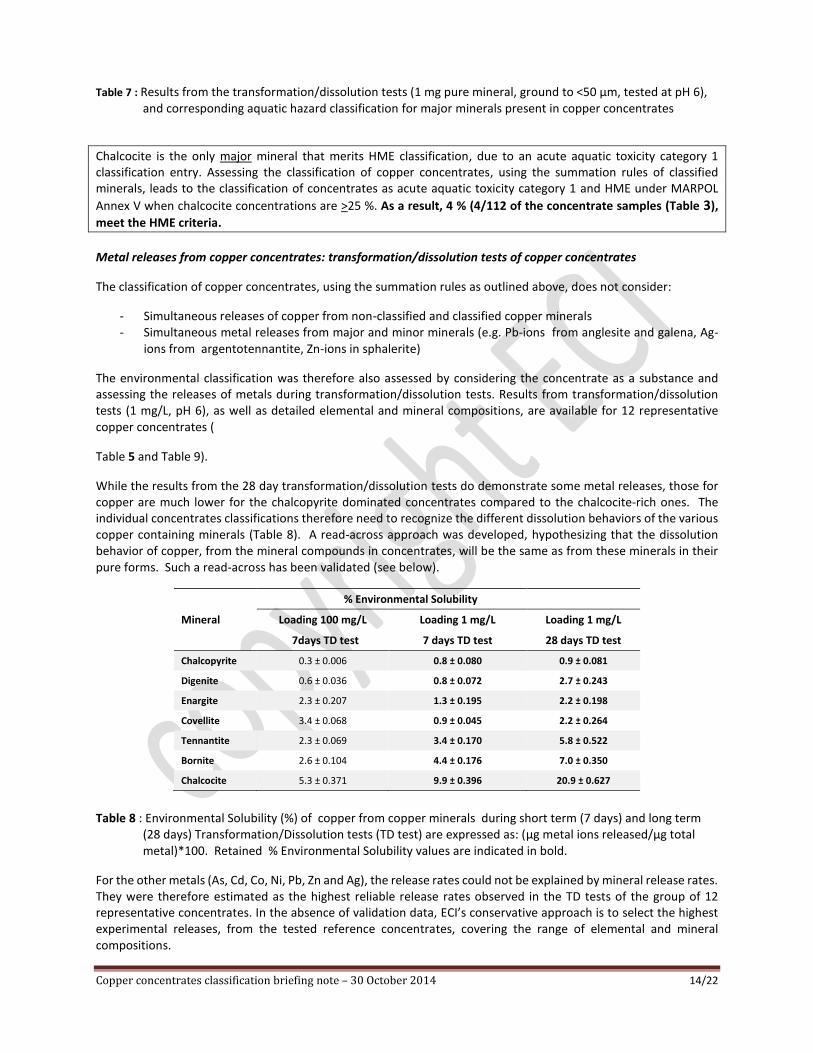
Table 7 : Results from the transformation/dissolution tests (1 mg pure mineral, ground to <50 µm, tested at pH 6), and corresponding aquatic hazard classification for major minerals present in copper concentrates
Chalcocite is the only major mineral that merits HME classification, due to an acute aquatic toxicity category 1 classification entry. Assessing the classification of copper concentrates, using the summation rules of classified minerals, leads to the classification of concentrates as acute aquatic toxicity category 1 and HME under MARPOL
Annex V when chalcocite concentrations are >25 %. As a result, 4 % (4/112 of the concentrate samples (Table 3),
meet the HME criteria.
Metal releases from copper concentrates: transformation/dissolution tests of copper concentrates
The classification of copper concentrates, using the summation rules as outlined above, does not consider:
- Simultaneous releases of copper from non-classified and classified copper minerals - Simultaneous metal releases from major and minor minerals (e.g. Pb-ions from anglesite and galena, Ag-
ions from argentotennantite, Zn-ions in sphalerite)
The environmental classification was therefore also assessed by considering the concentrate as a substance and assessing the releases of metals during transformation/dissolution tests. Results from transformation/dissolution tests (1 mg/L, pH 6), as well as detailed elemental and mineral compositions, are available for 12 representative copper concentrates (
Table 5 and Table 9).
While the results from the 28 day transformation/dissolution tests do demonstrate some metal releases, those for copper are much lower for the chalcopyrite dominated concentrates compared to the chalcocite-rich ones. The individual concentrates classifications therefore need to recognize the different dissolution behaviors of the various copper containing minerals (Table 8). A read-across approach was developed, hypothesizing that the dissolution behavior of copper, from the mineral compounds in concentrates, will be the same as from these minerals in their pure forms. Such a read-across has been validated (see below).
Mineral
% Environmental Solubility
Loading 100 mg/L Loading 1 mg/L Loading 1 mg/L
7days TD test 7 days TD test 28 days TD test
Chalcopyrite 0.3 ± 0.006 0.8 ± 0.080 0.9 ± 0.081
Digenite 0.6 ± 0.036 0.8 ± 0.072 2.7 ± 0.243
Enargite 2.3 ± 0.207 1.3 ± 0.195 2.2 ± 0.198
Covellite 3.4 ± 0.068 0.9 ± 0.045 2.2 ± 0.264
Tennantite 2.3 ± 0.069 3.4 ± 0.170 5.8 ± 0.522
Bornite 2.6 ± 0.104 4.4 ± 0.176 7.0 ± 0.350
Chalcocite 5.3 ± 0.371 9.9 ± 0.396 20.9 ± 0.627
Table 8 : Environmental Solubility (%) of copper from copper minerals during short term (7 days) and long term (28 days) Transformation/Dissolution tests (TD test) are expressed as: (µg metal ions released/µg total metal)*100. Retained % Environmental Solubility values are indicated in bold.
For the other metals (As, Cd, Co, Ni, Pb, Zn and Ag), the release rates could not be explained by mineral release rates. They were therefore estimated as the highest reliable release rates observed in the TD tests of the group of 12 representative concentrates. In the absence of validation data, ECI’s conservative approach is to select the highest experimental releases, from the tested reference concentrates, covering the range of elemental and mineral compositions.
Copper concentrates classification briefing note – 30 October 2014 15/22
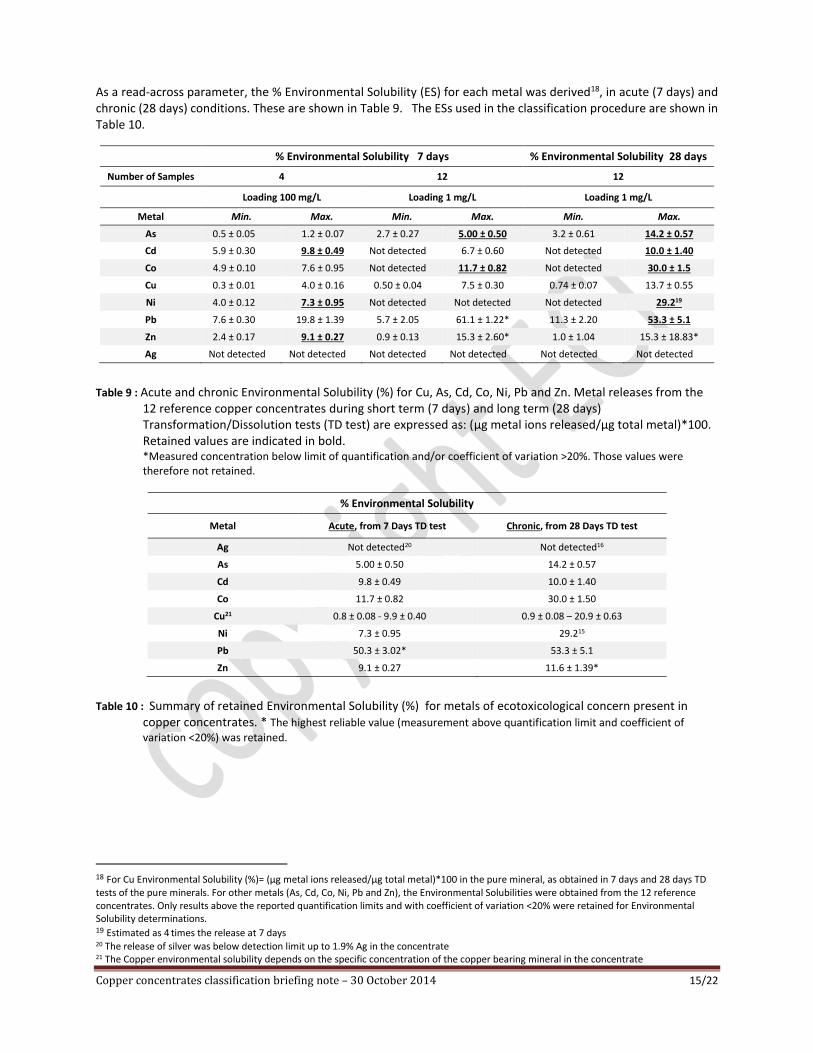
As a read-across parameter, the % Environmental Solubility (ES) for each metal was derived18, in acute (7 days) and chronic (28 days) conditions. These are shown in Table 9. The ESs used in the classification procedure are shown in Table 10.
% Environmental Solubility 7 days % Environmental Solubility 28 days
Number of Samples 4 12 12
Loading 100 mg/L Loading 1 mg/L Loading 1 mg/L
Metal Min. Max. Min. Max. Min. Max.
As 0.5 ± 0.05 1.2 ± 0.07 2.7 ± 0.27 5.00 ± 0.50 3.2 ± 0.61 14.2 ± 0.57
Cd 5.9 ± 0.30 9.8 ± 0.49 Not detected 6.7 ± 0.60 Not detected 10.0 ± 1.40
Co 4.9 ± 0.10 7.6 ± 0.95 Not detected 11.7 ± 0.82 Not detected 30.0 ± 1.5
Cu 0.3 ± 0.01 4.0 ± 0.16 0.50 ± 0.04 7.5 ± 0.30 0.74 ± 0.07 13.7 ± 0.55
Ni 4.0 ± 0.12 7.3 ± 0.95 Not detected Not detected Not detected 29.219
Pb 7.6 ± 0.30 19.8 ± 1.39 5.7 ± 2.05 61.1 ± 1.22* 11.3 ± 2.20 53.3 ± 5.1
Zn 2.4 ± 0.17 9.1 ± 0.27 0.9 ± 0.13 15.3 ± 2.60* 1.0 ± 1.04 15.3 ± 18.83*
Ag Not detected Not detected Not detected Not detected Not detected Not detected
Table 9 : Acute and chronic Environmental Solubility (%) for Cu, As, Cd, Co, Ni, Pb and Zn. Metal releases from the 12 reference copper concentrates during short term (7 days) and long term (28 days) Transformation/Dissolution tests (TD test) are expressed as: (µg metal ions released/µg total metal)*100. Retained values are indicated in bold. *Measured concentration below limit of quantification and/or coefficient of variation >20%. Those values were therefore not retained.
% Environmental Solubility
Metal Acute, from 7 Days TD test Chronic, from 28 Days TD test
Ag Not detected20 Not detected16
As 5.00 ± 0.50 14.2 ± 0.57
Cd 9.8 ± 0.49 10.0 ± 1.40
Co 11.7 ± 0.82 30.0 ± 1.50
Cu21 0.8 ± 0.08 - 9.9 ± 0.40 0.9 ± 0.08 – 20.9 ± 0.63
Ni 7.3 ± 0.95 29.215
Pb 50.3 ± 3.02* 53.3 ± 5.1
Zn 9.1 ± 0.27 11.6 ± 1.39*
Table 10 : Summary of retained Environmental Solubility (%) for metals of ecotoxicological concern present in copper concentrates. * The highest reliable value (measurement above quantification limit and coefficient of
variation <20%) was retained.
18 For Cu Environmental Solubility (%)= (µg metal ions released/µg total metal)*100 in the pure mineral, as obtained in 7 days and 28 days TD tests of the pure minerals. For other metals (As, Cd, Co, Ni, Pb and Zn), the Environmental Solubilities were obtained from the 12 reference concentrates. Only results above the reported quantification limits and with coefficient of variation <20% were retained for Environmental Solubility determinations. 19 Estimated as 4 times the release at 7 days 20 The release of silver was below detection limit up to 1.9% Ag in the concentrate 21 The Copper environmental solubility depends on the specific concentration of the copper bearing mineral in the concentrate
Copper concentrates classification briefing note – 30 October 2014 16/22
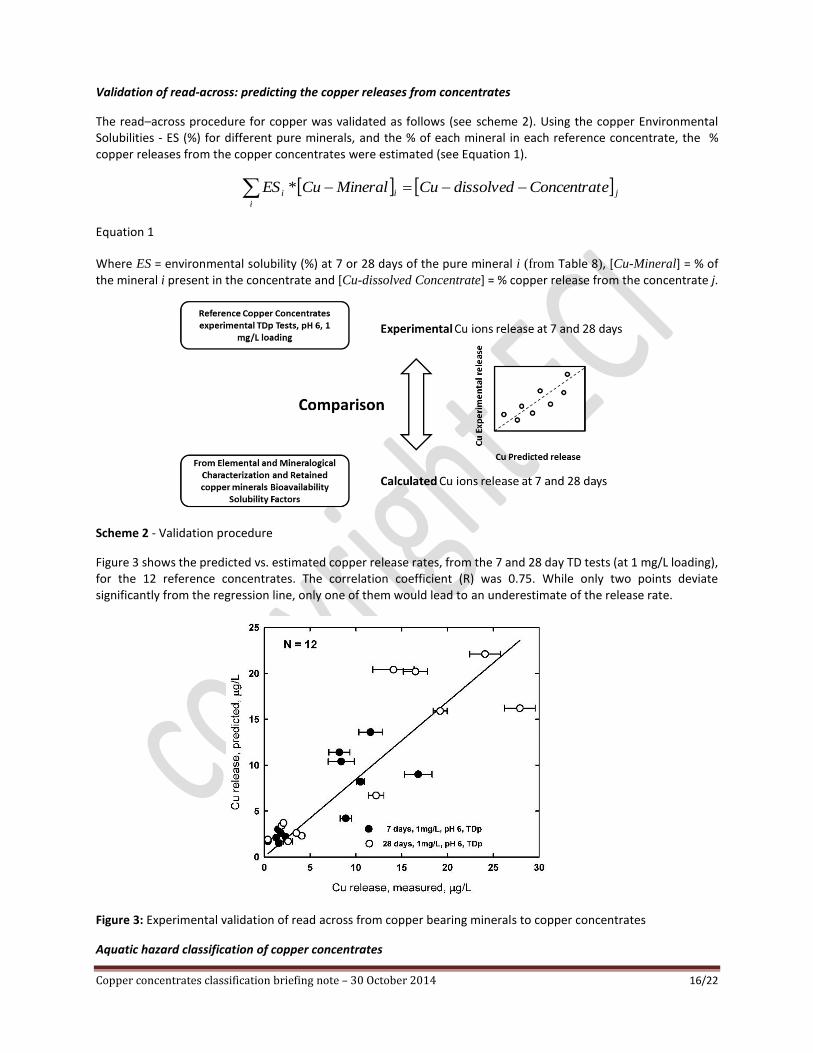
Validation of read-across: predicting the copper releases from concentrates
The read–across procedure for copper was validated as follows (see scheme 2). Using the copper Environmental Solubilities - ES (%) for different pure minerals, and the % of each mineral in each reference concentrate, the % copper releases from the copper concentrates were estimated (see Equation 1).
j
i
ii eConcentratdissolvedCuMineralCuES *
Equation 1
Where ES = environmental solubility (%) at 7 or 28 days of the pure mineral i (from Table 8), [Cu-Mineral] = % of the mineral i present in the concentrate and [Cu-dissolved Concentrate] = % copper release from the concentrate j.
Scheme 2 - Validation procedure
Figure 3 shows the predicted vs. estimated copper release rates, from the 7 and 28 day TD tests (at 1 mg/L loading), for the 12 reference concentrates. The correlation coefficient (R) was 0.75. While only two points deviate significantly from the regression line, only one of them would lead to an underestimate of the release rate.
Figure 3: Experimental validation of read across from copper bearing minerals to copper concentrates
Aquatic hazard classification of copper concentrates
Copper concentrates classification briefing note – 30 October 2014 17/22
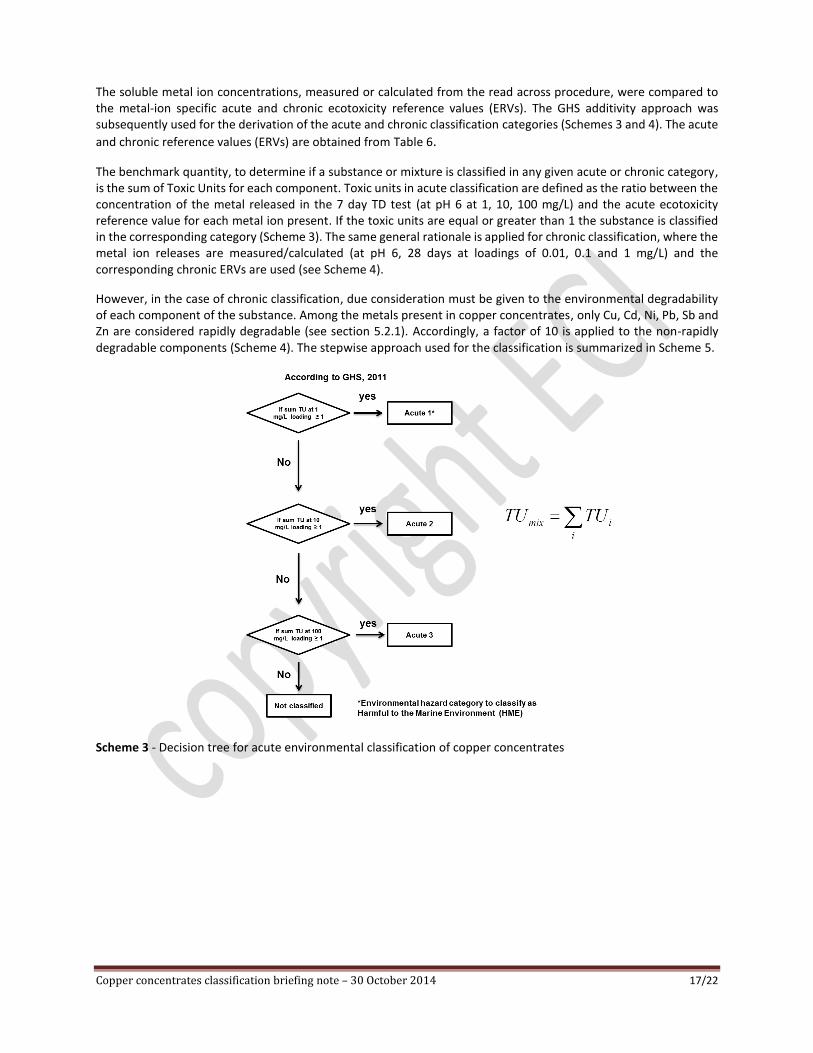
The soluble metal ion concentrations, measured or calculated from the read across procedure, were compared to the metal-ion specific acute and chronic ecotoxicity reference values (ERVs). The GHS additivity approach was subsequently used for the derivation of the acute and chronic classification categories (Schemes 3 and 4). The acute
and chronic reference values (ERVs) are obtained from Table 6.
The benchmark quantity, to determine if a substance or mixture is classified in any given acute or chronic category, is the sum of Toxic Units for each component. Toxic units in acute classification are defined as the ratio between the concentration of the metal released in the 7 day TD test (at pH 6 at 1, 10, 100 mg/L) and the acute ecotoxicity reference value for each metal ion present. If the toxic units are equal or greater than 1 the substance is classified in the corresponding category (Scheme 3). The same general rationale is applied for chronic classification, where the metal ion releases are measured/calculated (at pH 6, 28 days at loadings of 0.01, 0.1 and 1 mg/L) and the corresponding chronic ERVs are used (see Scheme 4).
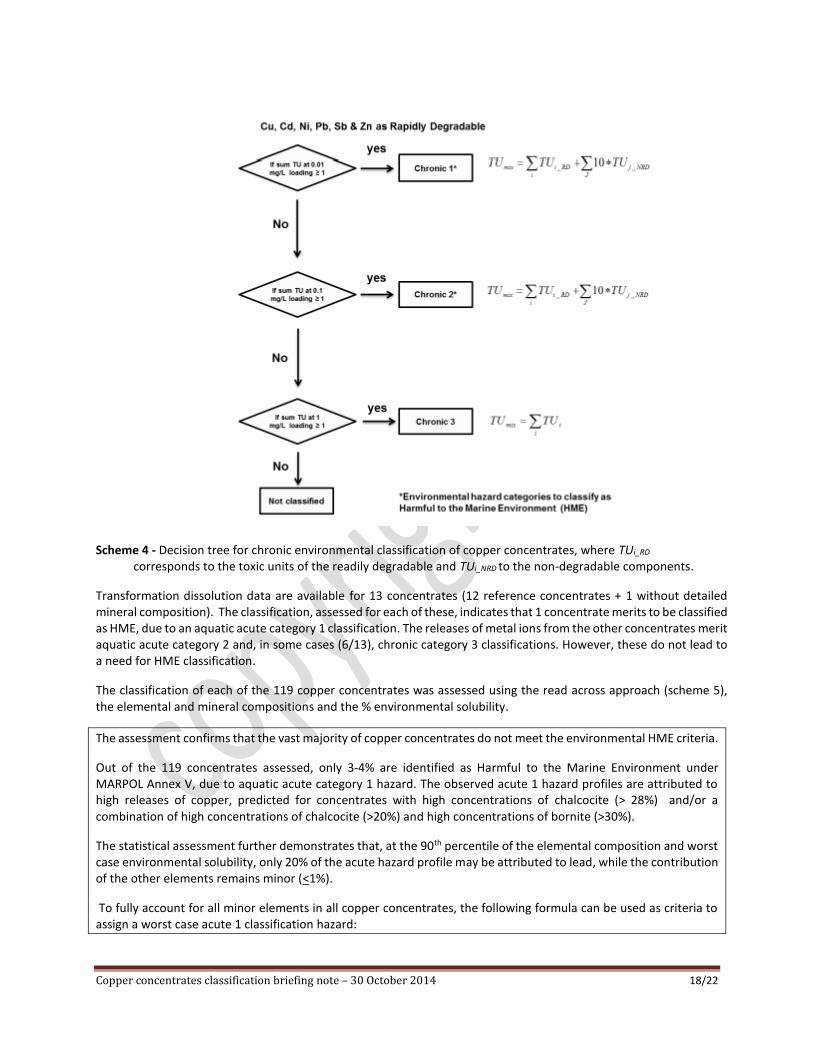
However, in the case of chronic classification, due consideration must be given to the environmental degradability of each component of the substance. Among the metals present in copper concentrates, only Cu, Cd, Ni, Pb, Sb and Zn are considered rapidly degradable (see section 5.2.1). Accordingly, a factor of 10 is applied to the non-rapidly degradable components (Scheme 4). The stepwise approach used for the classification is summarized in Scheme 5.
Scheme 3 - Decision tree for acute environmental classification of copper concentrates
Copper concentrates classification briefing note – 30 October 2014 18/22
Scheme 4 - Decision tree for chronic environmental classification of copper concentrates, where TUi_RD
corresponds to the toxic units of the readily degradable and TUi_NRD to the non-degradable components.
Transformation dissolution data are available for 13 concentrates (12 reference concentrates + 1 without detailed mineral composition). The classification, assessed for each of these, indicates that 1 concentrate merits to be classified as HME, due to an aquatic acute category 1 classification. The releases of metal ions from the other concentrates merit aquatic acute category 2 and, in some cases (6/13), chronic category 3 classifications. However, these do not lead to a need for HME classification.
The classification of each of the 119 copper concentrates was assessed using the read across approach (scheme 5), the elemental and mineral compositions and the % environmental solubility.
The assessment confirms that the vast majority of copper concentrates do not meet the environmental HME criteria.
Out of the 119 concentrates assessed, only 3-4% are identified as Harmful to the Marine Environment under MARPOL Annex V, due to aquatic acute category 1 hazard. The observed acute 1 hazard profiles are attributed to high releases of copper, predicted for concentrates with high concentrations of chalcocite (> 28%) and/or a combination of high concentrations of chalcocite (>20%) and high concentrations of bornite (>30%).
The statistical assessment further demonstrates that, at the 90th percentile of the elemental composition and worst case environmental solubility, only 20% of the acute hazard profile may be attributed to lead, while the contribution of the other elements remains minor (<1%).
To fully account for all minor elements in all copper concentrates, the following formula can be used as criteria to assign a worst case acute 1 classification hazard:
Copper concentrates classification briefing note – 30 October 2014 19/22
SUM(%As*0.0012+%Zn*0.0022+%Pb*0.068+%Ni*0.011+%Cd*0.054+%Co*0.013+%Chalcocite*0.032+%Bornite*0.011+% chalcopyrite*0.0011+% tennantite*0.0065+ % sum other minerals *0.0025) >1. 22
Note: Several concentrates are classified under GHS as acute 2 and aquatic chronic 3, but these categories are not relevant to HME.
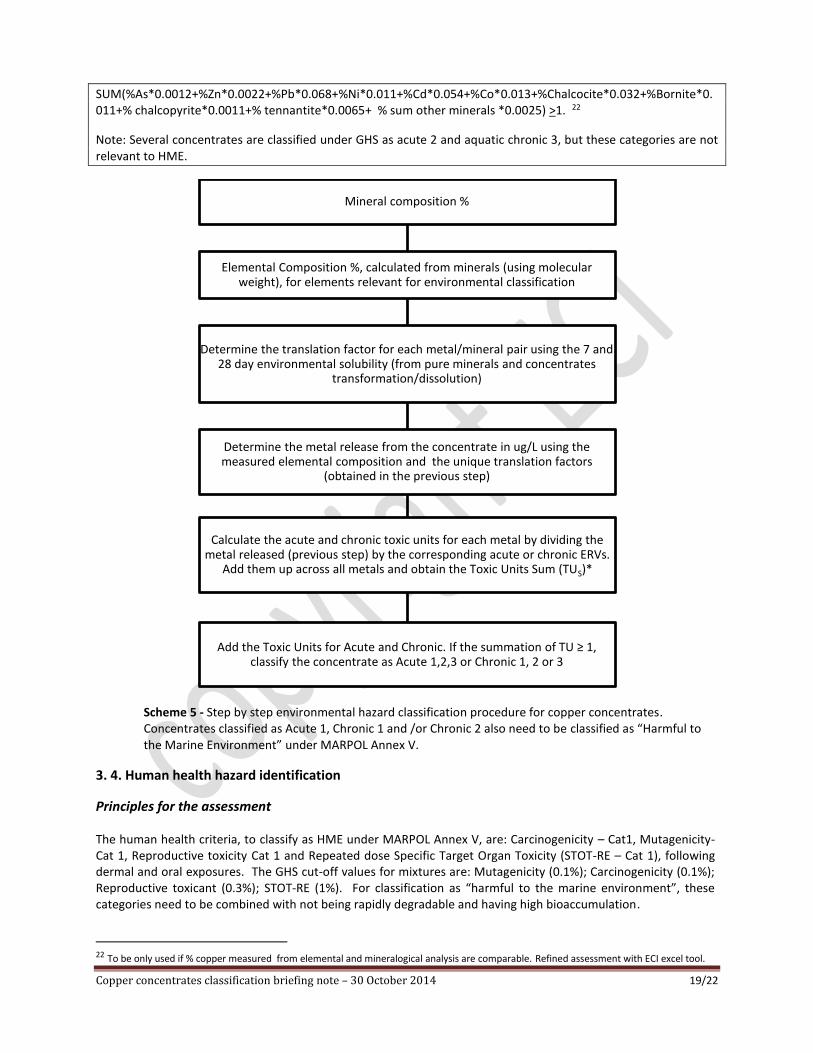
Scheme 5 - Step by step environmental hazard classification procedure for copper concentrates. Concentrates classified as Acute 1, Chronic 1 and /or Chronic 2 also need to be classified as “Harmful to the Marine Environment” under MARPOL Annex V.
3. 4. Human health hazard identification
Principles for the assessment
The human health criteria, to classify as HME under MARPOL Annex V, are: Carcinogenicity – Cat1, Mutagenicity- Cat 1, Reproductive toxicity Cat 1 and Repeated dose Specific Target Organ Toxicity (STOT-RE – Cat 1), following dermal and oral exposures. The GHS cut-off values for mixtures are: Mutagenicity (0.1%); Carcinogenicity (0.1%); Reproductive toxicant (0.3%); STOT-RE (1%). For classification as “harmful to the marine environment”, these categories need to be combined with not being rapidly degradable and having high bioaccumulation.
22 To be only used if % copper measured from elemental and mineralogical analysis are comparable. Refined assessment with ECI excel tool.
Mineral composition %
Elemental Composition %, calculated from minerals (using molecular weight), for elements relevant for environmental classification
Determine the translation factor for each metal/mineral pair using the 7 and 28 day environmental solubility (from pure minerals and concentrates
transformation/dissolution)
Determine the metal release from the concentrate in ug/L using the measured elemental composition and the unique translation factors
(obtained in the previous step)
Calculate the acute and chronic toxic units for each metal by dividing the metal released (previous step) by the corresponding acute or chronic ERVs.
Add them up across all metals and obtain the Toxic Units Sum (TUS)*
Add the Toxic Units for Acute and Chronic. If the summation of TU ≥ 1, classify the concentrate as Acute 1,2,3 or Chronic 1, 2 or 3
Copper concentrates classification briefing note – 30 October 2014 20/22
Considering the elemental/mineral composition of the copper concentrates, the hazard profiles of various metal
ions are considered as relevant if the bio-accessibilities of these ions are above the classification trigger values. Oral
bio-availability of the inorganic metal ions exceeds dermal bio-availability and therefore the assessment focuses on
the oral exposure route.
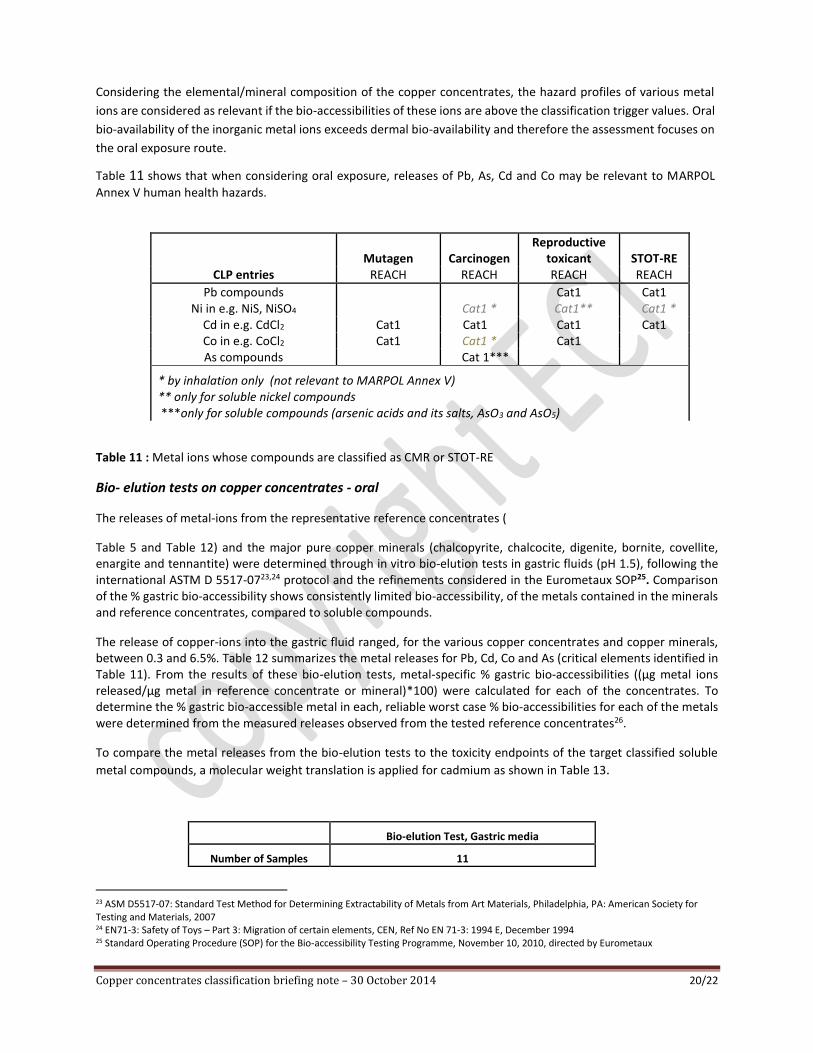
Table 11 shows that when considering oral exposure, releases of Pb, As, Cd and Co may be relevant to MARPOL
Annex V human health hazards.
Mutagen Carcinogen Reproductive
toxicant STOT-RE CLP entries REACH REACH REACH REACH
Pb compounds Cat1 Cat1 Ni in e.g. NiS, NiSO4 Cat1 * Cat1** Cat1 *
Cd in e.g. CdCl2 Cat1 Cat1 Cat1 Cat1 Co in e.g. CoCl2 Cat1 Cat1 * Cat1 As compounds Cat 1***
* by inhalation only (not relevant to MARPOL Annex V) ** only for soluble nickel compounds ***only for soluble compounds (arsenic acids and its salts, AsO3 and AsO5)
Table 11 : Metal ions whose compounds are classified as CMR or STOT-RE
Bio- elution tests on copper concentrates - oral
The releases of metal-ions from the representative reference concentrates (
Table 5 and Table 12) and the major pure copper minerals (chalcopyrite, chalcocite, digenite, bornite, covellite, enargite and tennantite) were determined through in vitro bio-elution tests in gastric fluids (pH 1.5), following the international ASTM D 5517-0723,24 protocol and the refinements considered in the Eurometaux SOP25. Comparison of the % gastric bio-accessibility shows consistently limited bio-accessibility, of the metals contained in the minerals and reference concentrates, compared to soluble compounds.
The release of copper-ions into the gastric fluid ranged, for the various copper concentrates and copper minerals, between 0.3 and 6.5%. Table 12 summarizes the metal releases for Pb, Cd, Co and As (critical elements identified in Table 11). From the results of these bio-elution tests, metal-specific % gastric bio-accessibilities ((µg metal ions released/µg metal in reference concentrate or mineral)*100) were calculated for each of the concentrates. To determine the % gastric bio-accessible metal in each, reliable worst case % bio-accessibilities for each of the metals were determined from the measured releases observed from the tested reference concentrates26.
To compare the metal releases from the bio-elution tests to the toxicity endpoints of the target classified soluble
metal compounds, a molecular weight translation is applied for cadmium as shown in Table 13.
Bio-elution Test, Gastric media
Number of Samples 11
23 ASM D5517-07: Standard Test Method for Determining Extractability of Metals from Art Materials, Philadelphia, PA: American Society for Testing and Materials, 2007 24 EN71-3: Safety of Toys – Part 3: Migration of certain elements, CEN, Ref No EN 71-3: 1994 E, December 1994 25 Standard Operating Procedure (SOP) for the Bio-accessibility Testing Programme, November 10, 2010, directed by Eurometaux
Copper concentrates classification briefing note – 30 October 2014 21/22
pH 1.5, 2 h, loading 200 mg/L
% gastric bio-accessibility
Metal Min. Max.
As Not detected 1.81 ± 0.25
Cd Not detected 14.1 ± 0.28
Co Not detected 4.00 ± 0.12
Pb 4.40 ± 0.176 56.8 ± 0.00
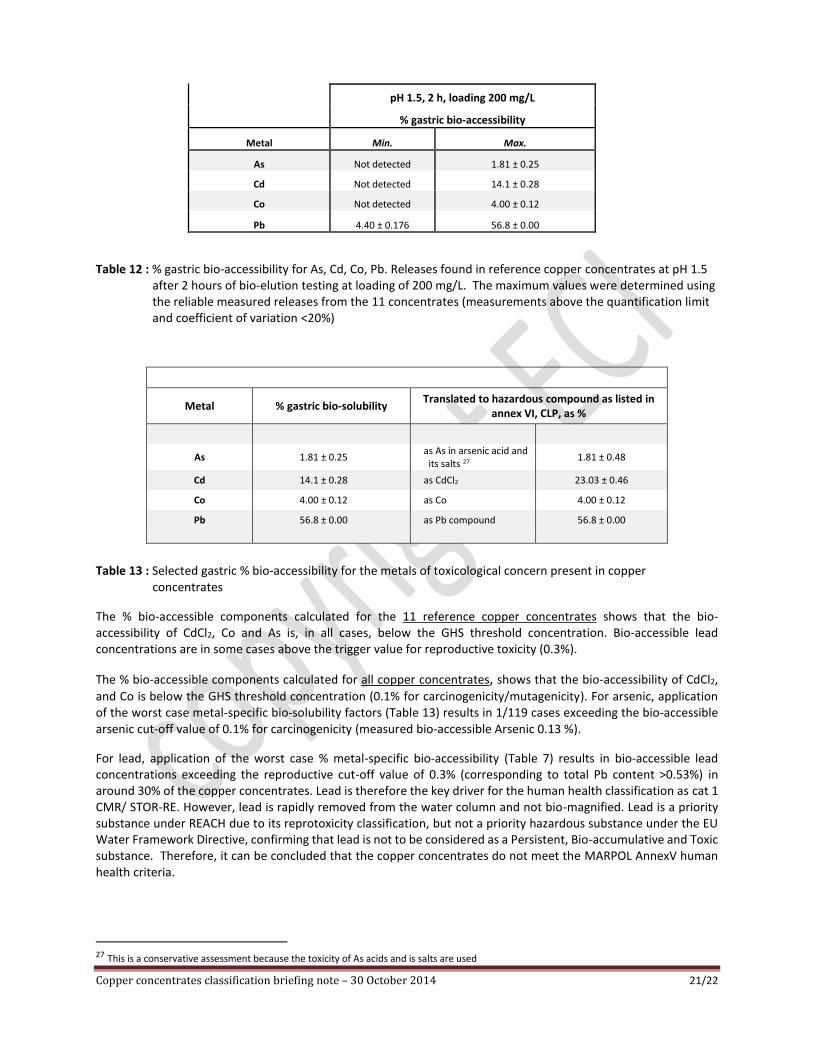
Table 12 : % gastric bio-accessibility for As, Cd, Co, Pb. Releases found in reference copper concentrates at pH 1.5 after 2 hours of bio-elution testing at loading of 200 mg/L. The maximum values were determined using the reliable measured releases from the 11 concentrates (measurements above the quantification limit and coefficient of variation <20%)
Metal % gastric bio-solubility Translated to hazardous compound as listed in
annex VI, CLP, as %
As 1.81 ± 0.25 as As in arsenic acid and its salts 27
1.81 ± 0.48
Cd 14.1 ± 0.28 as CdCl2 23.03 ± 0.46
Co 4.00 ± 0.12 as Co 4.00 ± 0.12
Pb 56.8 ± 0.00 as Pb compound 56.8 ± 0.00
Table 13 : Selected gastric % bio-accessibility for the metals of toxicological concern present in copper concentrates
The % bio-accessible components calculated for the 11 reference copper concentrates shows that the bio-accessibility of CdCl2, Co and As is, in all cases, below the GHS threshold concentration. Bio-accessible lead concentrations are in some cases above the trigger value for reproductive toxicity (0.3%).
The % bio-accessible components calculated for all copper concentrates, shows that the bio-accessibility of CdCl2,
and Co is below the GHS threshold concentration (0.1% for carcinogenicity/mutagenicity). For arsenic, application of the worst case metal-specific bio-solubility factors (Table 13) results in 1/119 cases exceeding the bio-accessible arsenic cut-off value of 0.1% for carcinogenicity (measured bio-accessible Arsenic 0.13 %).
For lead, application of the worst case % metal-specific bio-accessibility (Table 7) results in bio-accessible lead concentrations exceeding the reproductive cut-off value of 0.3% (corresponding to total Pb content >0.53%) in around 30% of the copper concentrates. Lead is therefore the key driver for the human health classification as cat 1 CMR/ STOR-RE. However, lead is rapidly removed from the water column and not bio-magnified. Lead is a priority substance under REACH due to its reprotoxicity classification, but not a priority hazardous substance under the EU Water Framework Directive, confirming that lead is not to be considered as a Persistent, Bio-accumulative and Toxic substance. Therefore, it can be concluded that the copper concentrates do not meet the MARPOL AnnexV human health criteria.
27 This is a conservative assessment because the toxicity of As acids and is salts are used
Copper concentrates classification briefing note – 30 October 2014 22/22
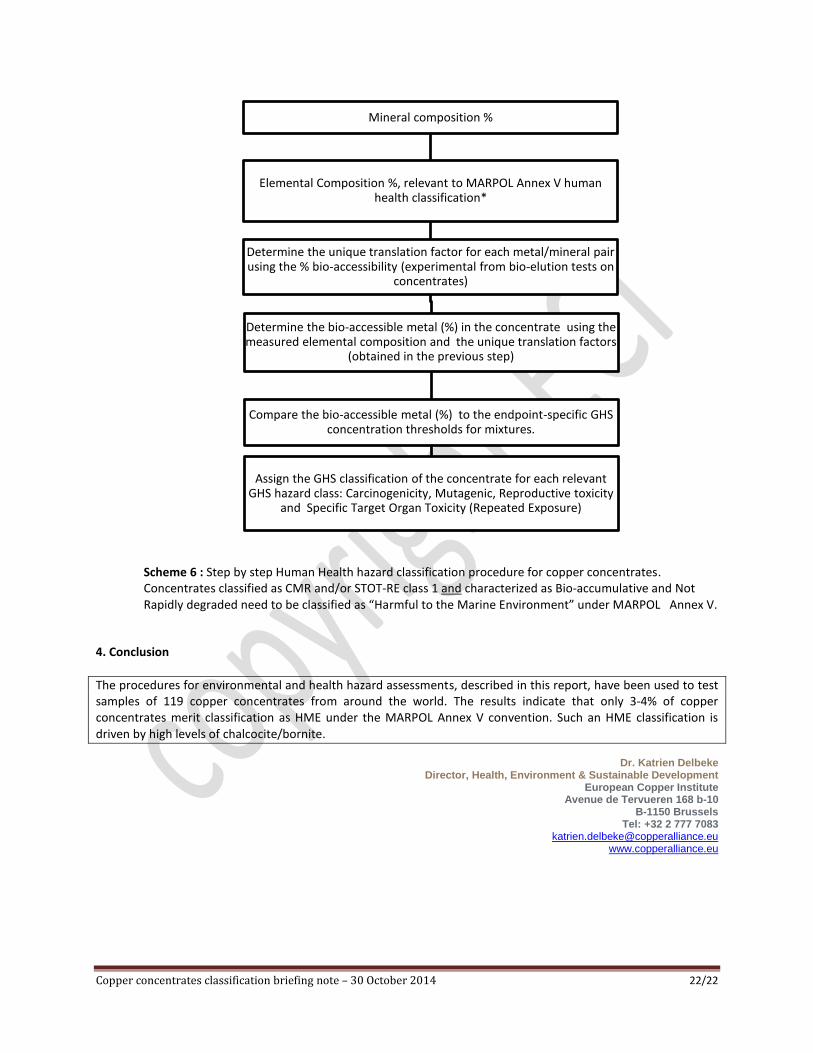
Scheme 6 : Step by step Human Health hazard classification procedure for copper concentrates. Concentrates classified as CMR and/or STOT-RE class 1 and characterized as Bio-accumulative and Not Rapidly degraded need to be classified as “Harmful to the Marine Environment” under MARPOL Annex V.
4. Conclusion
The procedures for environmental and health hazard assessments, described in this report, have been used to test samples of 119 copper concentrates from around the world. The results indicate that only 3-4% of copper concentrates merit classification as HME under the MARPOL Annex V convention. Such an HME classification is driven by high levels of chalcocite/bornite.
Dr. Katrien Delbeke Director, Health, Environment & Sustainable Development
European Copper Institute Avenue de Tervueren 168 b-10
B-1150 Brussels Tel: +32 2 777 7083
[email protected] www.copperalliance.eu
Mineral composition %
Elemental Composition %, relevant to MARPOL Annex V human health classification*
Determine the unique translation factor for each metal/mineral pair using the % bio-accessibility (experimental from bio-elution tests on
concentrates)
Determine the bio-accessible metal (%) in the concentrate using the measured elemental composition and the unique translation factors
(obtained in the previous step)
Compare the bio-accessible metal (%) to the endpoint-specific GHS concentration thresholds for mixtures.
Assign the GHS classification of the concentrate for each relevant GHS hazard class: Carcinogenicity, Mutagenic, Reproductive toxicity
and Specific Target Organ Toxicity (Repeated Exposure)