poultry industry trends - astral foods : home results...poultry industry trends financial overview...
TRANSCRIPT

Interim Results Presentation
for the six months ended 31 March 2015

2
AGENDA
Business Overview
Poultry Industry Trends
Financial Overview
Industry Matters
Prospects
Q & A
2

3
BUSINESS OVERVIEW

4
THE PERIOD IN PERSPECTIVE
Revenue
Operating profit
Earnings per share
Headline earnings per share 159%
The period under review reflects an improved performance assisted by higher poultry and
feed volumes with increased poultry sales realisations
Financial
Indicators
4
166%
158%
22%

5
THE PERIOD IN PERSPECTIVE
Increase in poultry sales volumes, in particular from the expansion at County Fair in the
Western Cape which now processes broilers supplied by Tydstroom (550 000 bpw)
Good poultry sales realisations coupled with lower stock levels and the post-festive
season demand for poultry products exceeding seasonal expectations
Good poultry production efficiencies, in particular an improved mortality rate together
with no cutbacks versus the comparative period have supported poultry sales volumes
Expansion in feed volumes that now includes production of feed from the Standerton feed
mill previously supplied by Afgri in Kinross
Healthy global maize and soya crops which resulted in the softening of grain prices and
subsequently benefited feed prices and livestock production costs
5

6
THE PERIOD IN PERSPECTIVE
Poultry imports continued at high levels with little impact from the EU anti-dumping
remedies
Depreciation of the Rand against the US Dollar eroding some of the benefits of
lower CBOT corn prices
Load shedding, especially unplanned, had an impact and a direct cost to the Group
of approximately R4 million
Currency weakness in Zambia and Mozambique negatively impacting raw material
costs and profitability
6

7
POULTRY DIVISION

8
Operating profit - R million
Operating profit up 680%
• Net margin 7.8% 1H2014: 1.4%
• Feed costs down 2.3%
Revenue - R million
Revenue up 36%
• Broiler volumes up 20%
• Broiler selling prices up 13%
3 317
4 503
-
1 000
2 000
3 000
4 000
5 000
1H2014 1H2015
45
351
-
50
100
150
200
250
300
350
1H2014 1H2015
POULTRY DIVISION - OVERVIEW
8

9
Broiler sales volumes increased year-on-year by 19.9% (Slide 10)
Broiler selling prices increased year-on-year by 12.8%
Product mix improvement with fresh increasing by 2% and IQF reducing by 1%
Improved broiler production efficiencies – improved mortality rate
Average broiler feed price decreases year-on-year by 2.3%
Continued high level of poultry imports ≈ March 2015 @ 7.2 million bpw
POULTRY DIVISION - OVERVIEW
9

10
53%
5%
10%
7%
3%
22%
Product Mix
POULTRY DIVISION – SALES
53%
4%
12%
7%
4%
21%
239 534 Tons Volume increase ≈ 20%
199 838 Tons
1H2014 1H2015
10

11
Poultry Production Volume Growth
POULTRY DIVISION - PRODUCTION
11
Farm efficiencies = 62 000 bpw
Increased placements = 170 000 bpw
Average birds per week
(increase of 790 000 birds ≈ 18,9%)
Tydstroom = 558 000 bpw
1H
2014 =
4,1
71,0
00
1H
2015 =
4,9
61,0
00
13.3%
4.1%
1.5%

12
70%
75%
80%
85%
90%
95%
100%
105%
110%
115%
120%
F2009 F2010 F2011 F2012 F2013 F2014 F2015
Mortality Feed conversion (FCR) Efficiency factor (PEF)
BROILER PRODUCTION PERFORMANCES
Key indicators base-lined to 100% in 2009
12

13
95%
96%
97%
98%
99%
100%
101%
102%
103%
104%
105%
106%
F2009 F2010 F2011 F2012 F2013 F2014 F2015
Slaughter age Live weight Processing yield
BROILER PRODUCTION PERFORMANCES
Key indicators base-lined to 100% in 2009
13

14
Projected higher feed costs in the second half of the reporting period
Broiler production efficiencies should uphold current positive performance
Slaughter volumes of approximately 5 million birds per week
Favourable market conditions for poultry to continue into 2H2015
Improved product mix towards fresh as a result of “Tydstroom” volumes
Supply to KFC “now” commenced from mid-April 2015
POULTRY DIVISION - PROSPECTS
14

15
FEED DIVISION

16
Operating profit - R million
Operating profit up 18%
• Net margin at 6.3% 1H2014: 6.2%
• Benefit from increased volumes
Revenue - R million
Revenue up 16%
• Sales volumes up 17%
• Avg. realisation down
FEED DIVISION - OVERVIEW
2 550
2 961
-
1 000
2 000
3 000
1H2014 1H2015
157
186
-
50
100
150
200
1H2014 1H2015
16

17
FEED DIVISION - OVERVIEW
Feed volumes increased by 17.2% due to higher inter-group volumes (up 36.6%)
Rand per ton margin maintained on prior year despite a competitive landscape
Inflationary costs were successfully recovered from the market
Profitability in the livestock markets positively impacted feed sales
Standerton feed mill producing on average 23 000 tons of feed per month
(ex Afgri 15 200 tons)
17

18
60%
8%
20%
12%
Meadow Feeds - Sales Mix
FEED DIVISION – SALES
52%
10%
23%
15%
605 066 Tons
1H2014 1H2015
708 969 Tons Volume increase ≈ 17%
18

19
FEED DIVISION - PROSPECTS
Current maize crop estimate of 9,8 million tons – smallest crop since 2007
Maize import opportunities into the coastal regions
Increasing local maize prices with upward pressure on feed prices
Lower soya prices in 2H2015 will partly offset the impact of higher maize prices
International maize and soya balance sheets remain healthy
Focus on Rand per ton margins to continue
19

20
OTHER AFRICA DIVISION

21
OTHER AFRICA DIVISION - OVERVIEW
Operating profit - R million
Operating profit up 24%
• Net margin 5.3% 1H2014: 4.4%
• Exchange rate impact
Revenue - R million
Revenue up 3%
• Feed volumes up 5%
• Hatchery volumes up 36%
248 256
-
50
100
150
200
250
1H2014 1H2015
11
14
-
3
5
8
10
13
15
1H2014 1H2015
21

22
OTHER AFRICA DIVISION - OVERVIEW
Zambia
Profitability at Tiger Animal Feeds impacted negatively by currency exchange
movements
Improved earnings in 1H2015 at Tiger Animal Feeds versus 1H2014
Tiger Chicks sales volumes increased by 29% over comparative period
Mozambique & Swaziland
Profitability at Meadow Mozambique impacted negatively by currency exchange
movements
Good performance from National Chicks Swaziland due to lower hatching egg
costs and improved hatchability
22

23
INDUSTRY TRENDS

24 Source: CJA Strategic Risk Brokers
F2011 F2012 F2015 F2013 F2014
SAFEX YELLOW MAIZE PRICE
24
F2010
Refer Slide 50

25 Source: CJA Strategic Risk Brokers
SAFEX SOYA BEANS PRICE
25
F2011 F2012 F2015 F2013 F2014 F2010
Refer Slide 50

26
INDUSTRY BROILER SELLING PRICES
Source: SAPA 26
13.2
2
13.4
7
13.4
1
12.7
0
11.9
6
11.9
5
11.7
5
12.2
2
11.7
5
11.7
6
12.2
9
11.8
3
12.3
3
12.8
3 13.5
1
13.3
4
13.4
2
13.2
0
13.3
8
13.4
6
13.1
8
12.7
9
12.8
6 13.5
6
13.9
1
14.9
0
15.5
3
14.5
1
13.6
6
13.2
1
13.4
2
13.1
5
12.6
7
12.5
1 1
3.4
0
15.0
3 15.7
9
15.5
5
14.8
2
13.8
5
14.0
8
15.5
3
15.3
5
15.2
4
15.0
7
15.4
2
15.4
4
16.0
1
16.2
7
16.2
6 17.0
5
16.1
5
16.6
0
16.8
8
16.9
7
17.1
3
17.2
3
15.9
4 1
6.9
6
16.7
4
17.4
4
18.4
8
18.6
8
17.6
9
17.8
1
17.9
8
11.00
11.50
12.00
12.50
13.00
13.50
14.00
14.50
15.00
15.50
16.00
16.50
17.00
17.50
18.00
18.50
19.00
19.50
Oct-
09
Dec-0
9
Fe
b-1
0
Ap
r-10
Ju
n-1
0
Au
g-1
0
Oct-
10
De
c-1
0
Fe
b-1
1
Ap
r-11
Ju
n-1
1
Au
g-1
1
Oct-
11
Dec-1
1
Fe
b-1
2
Ap
r-12
Ju
n-1
2
Au
g-1
2
Oc
t-1
2
Dec-1
2
Fe
b-1
3
Ap
r-13
Ju
n-1
3
Au
g-1
3
Oct-
13
Dec-1
3
Fe
b-1
4
Ap
r-14
Ju
n-1
4
Au
g-1
4
Oct-
14
Dec-1
4
Fe
b-1
5
Broiler selling price Six month average
Rand per kilogram

27
Source: SAPA & CJA Strategic Risk Brokers
BROILER PRICE VS FOOD PRICE INFLATION
27
85
90
95
100
105
110
115
120
125
130
135
140
85
90
95
100
105
110
115
120
125
130
135
140
Oct-
09
Dec-0
9
Fe
b-1
0
Ap
r-10
Ju
n-1
0
Au
g-1
0
Oct-
10
Dec-1
0
Fe
b-1
1
Ap
r-11
Ju
n-1
1
Au
g-1
1
Oct-
11
Dec-1
1
Fe
b-1
2
Ap
r-12
Ju
n-1
2
Au
g-1
2
Oct-
12
Dec-1
2
Fe
b-1
3
Ap
r-13
Ju
n-1
3
Au
g-1
3
Oct-
13
Dec-1
3
Fe
b-1
4
Ap
r-14
Ju
n-1
4
Au
g-1
4
Oct-
14
Dec-1
4
Fe
b-1
5
Ind
ex
(O
ct
20
09
= 1
00
)
Poultry selling price index SA food price index

28
Source: SAPA & Own Data
CHANGE IN BROILER SELLING PRICE VS FEED PRICE
28
-30%
-20%
-10%
0%
10%
20%
30%
40%
Oct-
09
Dec-0
9
Fe
b-1
0
Ap
r-10
Ju
n-1
0
Au
g-1
0
Oct-
10
Dec-1
0
Fe
b-1
1
Ap
r-11
Ju
n-1
1
Au
g-1
1
Oct-
11
Dec-1
1
Fe
b-1
2
Ap
r-12
Ju
n-1
2
Au
g-1
2
Oct-
12
Dec-1
2
Fe
b-1
3
Ap
r-13
Ju
n-1
3
Au
g-1
3
Oct-
13
Dec-1
3
Fe
b-1
4
Ap
r-14
Ju
n-1
4
Au
g-1
4
Oct-
14
Dec-1
4
Fe
b-1
5
% Change in feed price % Change in broiler selling price

29
-
5 000
10 000
15 000
20 000
25 000
30 000
35 000
40 000
45 000
50 000
Oct-
09
Dec-0
9
Fe
b-1
0
Ap
r-10
Ju
n-1
0
Au
g-1
0
Oct-
10
Dec-1
0
Fe
b-1
1
Ap
r-11
Ju
n-1
1
Au
g-1
1
Oct-
11
Dec-1
1
Fe
b-1
2
Ap
r-12
Ju
n-1
2
Au
g-1
2
Oct-
12
Dec-1
2
Fe
b-1
3
Ap
r-13
Ju
n-1
3
Au
g-1
3
Oct-
13
Dec-1
3
Fe
b-1
4
Ap
r-14
Ju
n-1
4
Au
g-1
4
Oct-
14
Dec-1
4
Fe
b-1
5
Total poultry imports 6 per. Mov. Avg. (Total poultry imports)
Tons
Source: SAPA
POULTRY IMPORTS PER MONTH
29

30
FINANCIAL OVERVIEW
31
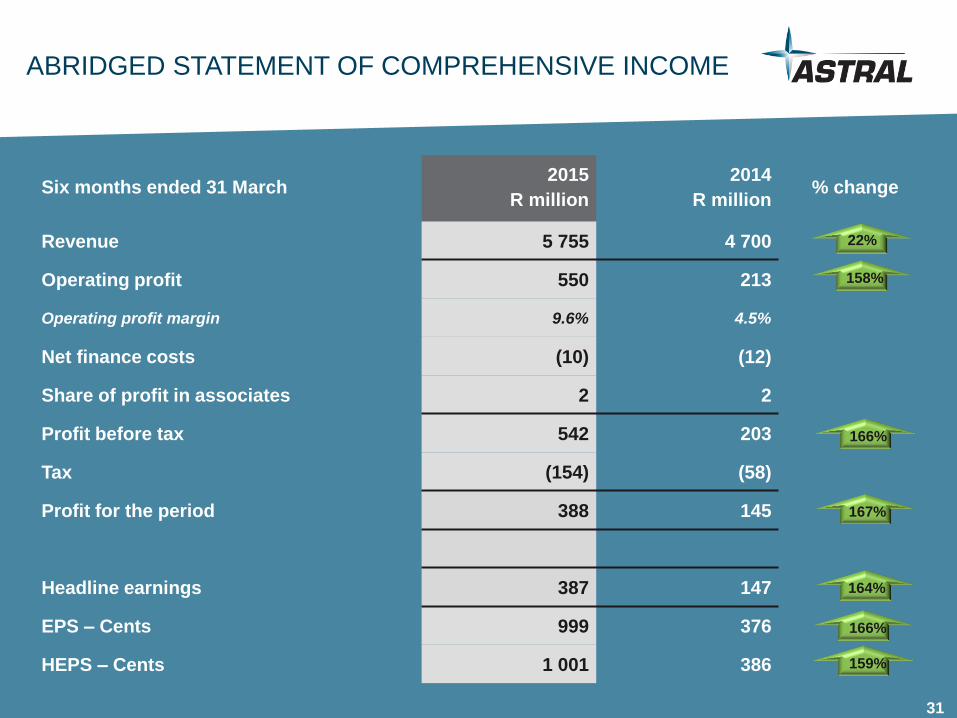
ABRIDGED STATEMENT OF COMPREHENSIVE INCOME
Six months ended 31 March 2015
R million
2014
R million % change
Revenue 5 755 4 700
Operating profit 550 213
Operating profit margin 9.6% 4.5%
Net finance costs (10) (12)
Share of profit in associates 2 2
Profit before tax 542 203
Tax (154) (58)
Profit for the period 388 145
Headline earnings 387 147
EPS – Cents 999 376
HEPS – Cents 1 001 386
22%
158%
166%
167%
164%
159%
166%
31
32
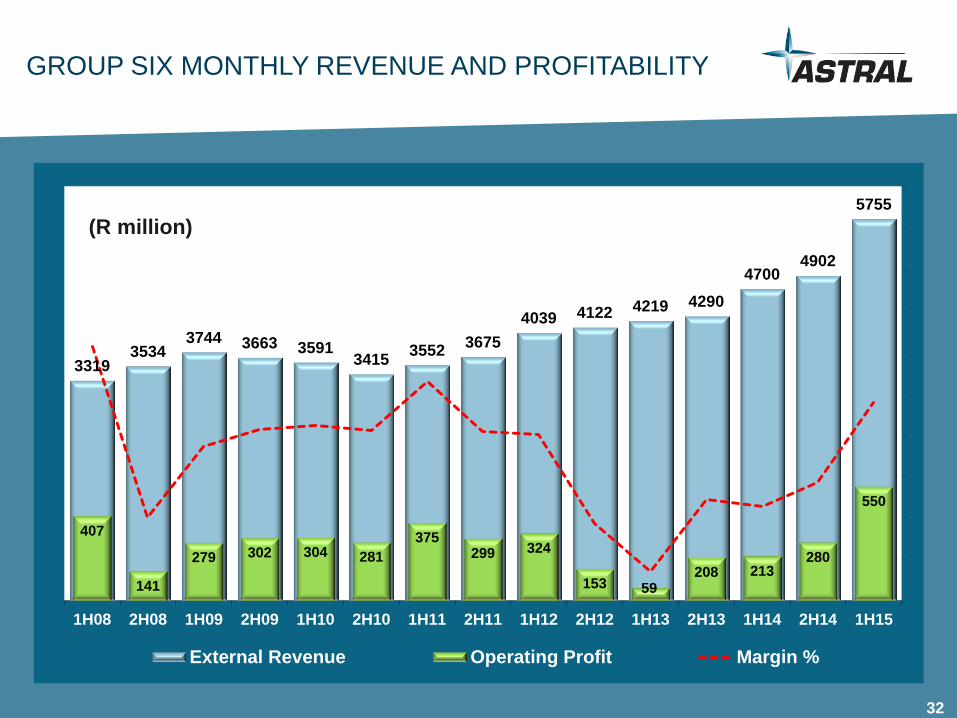
3319 3534
3744 3663 3591 3415
3552 3675
4039 4122 4219 4290
4700 4902
5755
407
141
279 302 304 281
375 299 324
153 59 208 213
280
550
0
200
400
600
800
1000
1200
1400
1600
1800
2000
0
1000
2000
3000
4000
5000
6000
1H08 2H08 1H09 2H09 1H10 2H10 1H11 2H11 1H12 2H12 1H13 2H13 1H14 2H14 1H15
External Revenue Operating Profit Margin %
GROUP SIX MONTHLY REVENUE AND PROFITABILITY
(R million)
32

33
2581 2449 2606 2652 2878 2956 2952 3049
3317 3650
4503
0.0
0.2
0.4
0.6
0.8
1.0
1.2
1.4
1000
1500
2000
2500
3000
3500
4000
4500
5000
5500
6000
1H10 2H10 1H11 2H11 1H12 2H12 1H13 2H13 1H14 2H14 1H15
Revenue Change in realisations (SAPA) Change in volumes
POULTRY – SIX MONTHLY REVENUE
33
(R million)

34
1847 1730 1708 1770
2175 2152 2397 2519 2550
2956 2961
0
0
0
1
1
1
1
1
2
1000
1500
2000
2500
3000
3500
4000
4500
1H10 2H10 1H11 2H11 1H12 2H12 1H13 2H13 1H14 2H14 1H15
Revenue Change in volumes Change in feed price
FEED – SIX MONTHLY REVENUE
34
(R million)

35
GROUP SIX MONTHLY OPERATING PROFIT
35
(R million)
134 128 229 124 140
-3 -117 5
45 59 351
151 130
133
149 154
135 156 173 157 197
186 304
281
375 299 324
153 59 203 213
280
550
-0.1
0.1
0.3
0.5
0.7
0.9
1.1
1.3
1.5
-120
-20
80
180
280
380
480
580
680
1H10 2H10 1H11 2H11 1H12 2H12 1H13 2H13 1H14 2H14 1H15
Poultry Feed Other Africa
Change in feed price Change in realisations (SAPA) Broiler volumes
Feed volumes

36
ABRIDGED STATEMENT OF FINANCIAL POSITION
March 2015
R million
September 2014
R million % change
Non-current assets 2 203 2 242
Net working capital 341 452
Current assets (excl. cash) 2 006 2 003
Current liabilities (excl. borrowings) (1 665) (1 551)
Non-current liabilities (excl. borrowings) (558) (575)
Net assets 1 986 2 119
Net (surplus) / debt (240) 174
Loans 183 206
Cash and cash equivalents (423) (32)
Equity 2 226 1 945
Total 1 986 2 119
2%
3%
6%
14%
6%
36
25%
7%
37
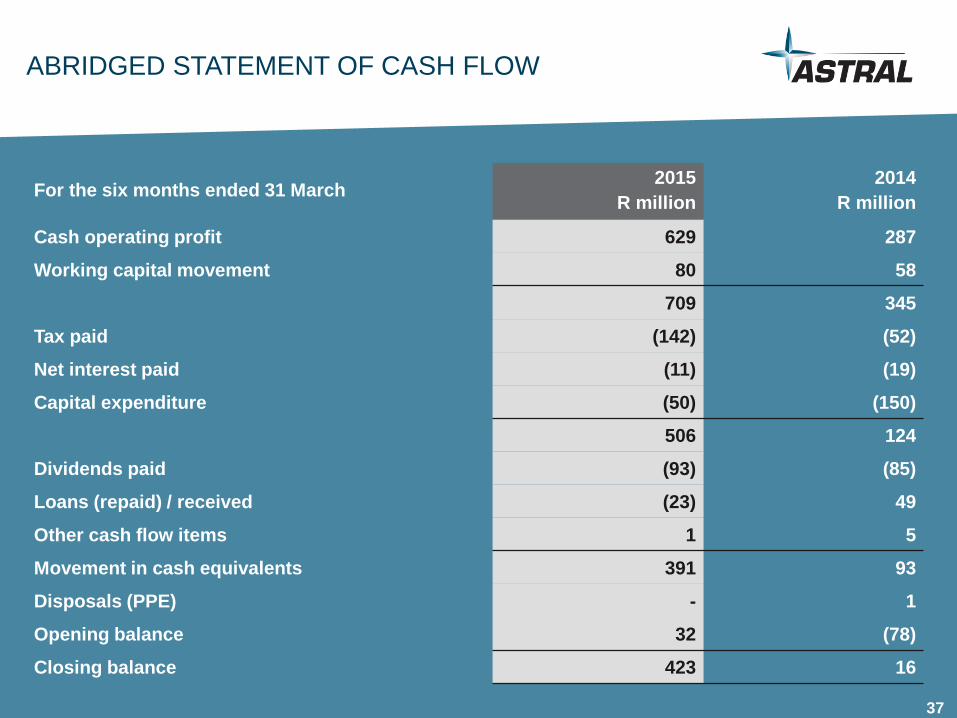
ABRIDGED STATEMENT OF CASH FLOW
For the six months ended 31 March 2015
R million
2014
R million
Cash operating profit 629 287
Working capital movement 80 58
709 345
Tax paid (142) (52)
Net interest paid (11) (19)
Capital expenditure (50) (150)
506 124
Dividends paid (93) (85)
Loans (repaid) / received (23) 49
Other cash flow items 1 5
Movement in cash equivalents 391 93
Disposals (PPE) - 1
Opening balance 32 (78)
Closing balance 423 16
37

38
CAPITAL EXPENDITURE
Six months ended 31 March 2015
R million
2014
R million
Depreciation 73 69
Replacement capex 41 74
Expansion capex 9 82
Total capex 50 156
Commitments 83
Total spent and committed 133
38

39
IN SUMMARY
39
Poultry division now at a more normalised profit margin level
Poultry division benefited from various volume growth initiatives
Feed division benefited from Standerton feed mill contribution
Cash flow for the period positive
Net surplus cash R240 million (30 Sep 2014: Net debt to equity ratio of 8.9%)
Interim dividend of 575 cents per share declared

40
INDUSTRY MATTERS
41
BRINING
70 : 30 (42.86% injection) current industry practice
75 : 25 (33.33% injection) industry proposal (now including Rainbow)
85 : 15 (17.65% injection) draft regulations
Various interactions with the DAFF Minister & Deputy Minister
SAPA consumer research survey underway
DAFF indications of a debate between industry and legislators
41

42
IMPORTS (EU & US)
On 27 Feb 2015 anti-dumping duties were imposed on Germany,
Netherlands and United Kingdom
Duties range from 3.86% to 73.33% on frozen bone in chicken portions
Outbreaks of AI in all three EU countries has interrupted imports into RSA
US demanding export leg quarter volumes to RSA duty free for AGOA
renewal
Poultry industry bodies of both countries not in agreement on quota
42

PROSPECTS

44
PROSPECTS
The slowing level of growth in the economy and higher unemployment levels
will continue to hamper an increase in the per capita consumption of poultry.
If a quota on US poultry imports is agreed to on the back of the AGOA
renewal this is likely to negatively impact local producers.
The South African maize crop currently being harvested is estimated to be
the lowest maize crop since 2007, which will negatively impact livestock
production costs due to higher feed prices in the second half of the current
reporting period and to the onset of the new maize crop in 2016.
The higher maize prices will be partly offset by more favourable soya prices
as global stock levels remain healthy.
Astral’s best cost integrated strategy has further strengthened on the back
of selective investments contributing to higher poultry volumes, improved
efficiencies and feeding costs into the future.
44

45 10 April 2015

46
ADDITIONAL INFORMATION
46

47 Source: CJA Strategic Risk Brokers
2009/10 2010/11 2011/12 2012/13 2013/14 2014/15E 2015/16F
Actual Actual Actual Actual Actual Estimate Forecast
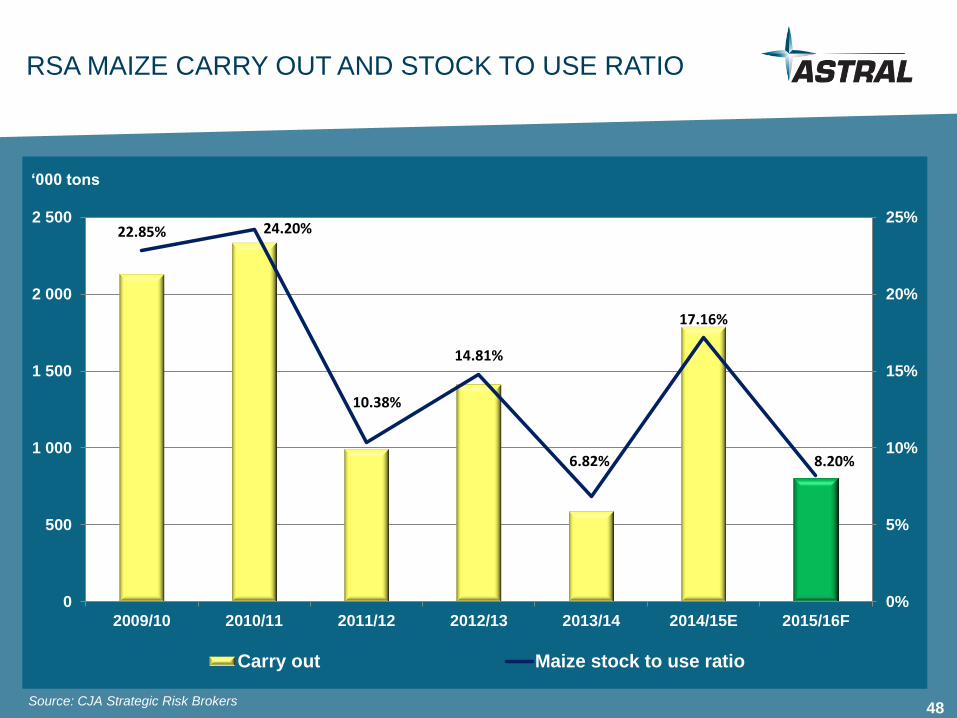
Carry In (1 May) 1,581 2,131 2,336 991 1,414 590 1,790
Crop Estimate 12,050 12,815 10,360 12,121 11,811 14,250 9,763
Sagis Delivery 11,697 12,092 10,394 11,972 11,072 13,730 9,193
Minus early deliveries 0 0 0 0 0 0 0
Imports 27 0 421 11 80 50 450
Total Supply 13,305 14,224 13,151 12,973 12,566 14,371 11,434
Domestic Usage Food 4,471 4,513 4,512 4,499 4,583 5,087 4,663
Domestic Usage Feed 4,101 4,271 4,362 4,378 4,715 4,904 4,527
Gristing, withdrawn & released 755 866 693 674 480 441 612
Total Domestic Usage 9,327 9,650 9,567 9,551 9,777 10,431 9,802
Exports & Sundries 1,847 2,238 2,590 2,008 2,122 2,149 828
Plus early deliveries 0 0 0 0 0 0 0
Carry Out (30 Apr) 2,131 2,336 994 1,414 590 1,790 804
No of days usage 83 88 38 54 25 63 30
STU 22.85% 24.20% 10.38% 14.81% 6.82% 17.16% 8.20%
Marketing year (May to April)
'000 tons
SOUTH AFRICA - TOTAL MAIZE SUPPLY & DEMAND
47
48
22.85% 24.20%
10.38%
14.81%
6.82%
17.16%
8.20%
0%
5%
10%
15%
20%
25%
0
500
1 000
1 500
2 000
2 500
2009/10 2010/11 2011/12 2012/13 2013/14 2014/15E 2015/16F
Carry out Maize stock to use ratio
Source: CJA Strategic Risk Brokers
RSA MAIZE CARRY OUT AND STOCK TO USE RATIO
‘000 tons
48

49
F2010 F2011 F2014 F2012 F2013
Source: CJA Strategic Risk Brokers
SAFEX YELLOW MAIZE VS CBOT CORN IN RAND TERMS
49
F2015

50
BROILER FEED
INGREDIENT INCLUSION AND COST CONTRIBUTION
50
69.1 43.5 65.1 48.7 68.8 49.2 67.0 39.0 66.9 47.5 67.0 44.6 65.9 42.5 65.5 40.8
16.3
19.7
16.6
18.6
16.6
22.6
16.6
24.7
14.0
20.9
17.0
26.8
18.9
29.2
16.5
25.3
4.2
3.4
5.7
3.5
4.5
3.3
6.1
5.4
8.5
8.0
7.0
6.8
6.0
5.7
7.5
7.5
8.5
14.9
10.4
19.8
6.1
11.9
7.1
13.2
9.9
18.5
8.4
16.6
7.9
14.7
9.9
21.3
1.6
4.8
1.9
5.1
3.8
8.3
1.4 3.6
0.5 1.2
0.4
1.1 0.9
2.4 0.3
0.9
0.3
13.7
0.3 4.3
0.3 4.8
0.3 3.5
0.3 3.8
0.3
4.1
0.4 5.5
0.3
4.2
0%
10%
20%
30%
40%
50%
60%
70%
80%
90%
100%
2H11Incl.
2H11Contr.
1H12Incl.
1H12Contr.
2H12Incl.
2H12Contr.
1H13Incl.
1H13Contr.
2H13Incl.
2H13Contr.
1H14Incl.
1H14Contr.
2H14Incl.
2H14Contr.
1H15Incl.
1H15Contr.
Maize Soya o/c Sunfl. o/c Other Fish Vit and Med

51
F2014 28,250 38,397 32,403 25,144 23,898 31,719 37,136 36,543 40,612 26,501 25,979 37,128
F2015 42,363 38,807 27,504 28,896 31,305 40,372
% Var 49.9 1.1 -15.1 14.9 31.0 27,3
bpw* 7,5 6,9 4,9 5,1 5,6 7,2
Source: SAPA
TOTAL POULTRY IMPORTS (CHICKEN, TURKEY, MDM)
*bpw ≈ million birds per week
Oct Nov Dec Jan Feb Mar Apr May Jun Jul Aug Sep
F2012 33 348 67 819 100 540 135 614 170 194 204 560 244 296 278 914 305 472 326 520 353 296 387 173
F2013 47 942 89 095 117 712 145 426 172 727 207 148 243 623 282 790 316 047 343 913 371 741 409 158
F2014 28 250 66 647 99 050 124 194 148 092 179 811 216 947 253 490 294 102 320 603 346 582 383 710
F2015 42 363 81 170 108 674 137 660 168 965 209 337
0
50 000
100 000
150 000
200 000
250 000
300 000
350 000
400 000
450 000
F2012 F2013 F2014 F2015
Tons

52 52
Ex BRAZIL – May 2015
FROZEN LEG QUARTERS BULK PACKED
CIF DBN US$ per ton TON 1 100.00 1 100.00 1 100.00 SA COST
R/$ exchange rate R$ 11.50 12.00 12.50
Rand per ton TON 12 650.00 13 200.00 13 750.00 20 800.00
Rand per kg KG 12.65 13.20 13.75 20.80
Duty per kg KG 37% 37% 37% -
Clearance costs KG 0.50 0.50 0.50 -
COST INTO STORAGE KG 17.83 18.58 19.34 20.80
Storage KG 0.50 0.50 0.50 -
Distribution KG 0.64 0.64 0.64 0.74
Marketing, Administration, Finance KG 0.78 0.78 0.78 0.85
TOTAL COST KG 19.75 20.50 21.26 22.39
Ex UNITED KINGDOM – May 2015
FROZEN LEG QUARTERS BULK PACKED
CIF DBN US$ per ton TON 1 400.00 1 400.00 1 400.00 SA COST
R/$ exchange rate R$ 11.50 12.00 12.50
Rand per ton TON 16 100.00 16 800.00 17 500.00 20 800.00
Rand per kg KG 16.10 16.80 17.50 20.80
Duty per kg KG 30.99% 30.99% 30.99% -
Clearance costs KG 0.50 0.50 0.50 -
COST INTO STORAGE KG 21.59 22.51 23.42 20.80
Storage KG 0.50 0.50 0.50 -
Distribution KG 0.64 0.64 0.64 0.74
Marketing, Administration, Finance KG 0.78 0.78 0.78 0.85
TOTAL COST KG 23.51 24.43 25.34 22.39
BRAZIL & EUROPE PRODUCT COST BENCHMARK

53
02468101214161820222426283032343638404244
5.0
10.0
15.0
20.0
25.0
30.0
Oc
t-0
9
De
c-0
9
Feb
-10
Ap
r-1
0
Ju
n-1
0
Au
g-1
0
Oct-
10
De
c-1
0
Feb
-11
Ap
r-1
1
Ju
n-1
1
Au
g-1
1
Oc
t-1
1
De
c-1
1
Feb
-12
Ap
r-1
2
Ju
n-1
2
Au
g-1
2
Oc
t-1
2
De
c-1
2
Feb
-13
Ap
r-1
3
Ju
n-1
3
Au
g-1
3
Oc
t-1
3
De
c-1
3
Feb
-14
Ap
r-1
4
Ju
n-1
4
Au
g-1
4
Oc
t-1
4
Dec-1
4
Feb
-15
RSA broilers (slaughtered / week) Poultry imports (birds / week)
Broiler selling price (Rand / kg) Per capita consumption (kg)
Million birds per week / Rand per kg kg
Source: SAPA
LOCAL BROILER PRODUCTION, IMPORTS & PER CAPITA CONSUMPTION
53

54
1000
1500
2000
2500
3000
3500
Beef
Pork
Chicken
Chicken Pork Beef Sheep
Feed Conversion Rate 1.7 2.2 5.5 5.0
Per Capita Consumption 37.9 kg 4.6kg 17.2kg 3.2kg
Source: SAPA & FNB
PRODUCER PRICE COMPARISON – RSA PROTEIN
Cents per kg
54

55
Tel: +27 (0) 12 667 5468
Fax: +27 (0) 86 504 2002
Astral Foods Corporate
Office
92 Koranna Avenue,
Doringkloof, Centurion,
0157, Gauteng, South Africa
Chris Schutte
Chief Executive Officer
Tel : +27 (0) 12 667 5468
Fax : +27 (0) 86 504 2002
Email: [email protected]
Website: www.astralfoods.com
Daan Ferreira
Group Financial Director
Tel : +27 (0) 12 667 5468
Fax : +27 (0) 86 504 1602
Email: [email protected]
CONTACTS
55