potashcorp.com yao manager, market research january 2015 fertilizer market update
TRANSCRIPT

PotashCorp.com
Click icon to add picture
Yao Yao
Manager, Market Research
January 2015
FertilizerMarket Update

This presentation contains forward-looking statements or forward-looking information (forward-looking statements). These statements can be identified by expressions of belief, expectation or intention, as well as those statements that are not historical fact. These statements often contain words such as “should,” “could,” “expect,” “may,” “anticipate,” “believe,” “intend,” “estimates,” “plans” and similar expressions. These statements are based on certain factors and assumptions including with respect to: foreign exchange rates, expected growth, results of operations, performance, business prospects and opportunities and effective tax rates. While the company considers these factors and assumptions to be reasonable based on information currently available, they may prove to be incorrect. Forward-looking statements are subject to risks and uncertainties that are difficult to predict. The results or events set forth in forward-looking statements may differ materially from actual results or events. Several factors could cause actual results or events to differ materially from those expressed in the forward-looking statements, including, but not limited to the following: variations from our assumptions with respect to foreign exchange rates, expected growth, results of operations, performance, business prospects and opportunities, and effective tax rates; risks and uncertainties related to operating and workforce changes made in response to our industry and the markets we serve; changes in competitive pressures, including pricing pressures; risks and uncertainties related to our international operations and assets; fluctuations in supply and demand in the fertilizer, sulfur, transportation and petrochemical markets; costs and availability of transportation and distribution for our raw materials and products, including railcars and ocean freight; adverse or uncertain economic conditions and changes in credit and financial markets; the results of sales contract negotiations within major markets; unexpected geological or environmental conditions, including water inflows; economic and political uncertainty around the world; risks associated with natural gas and other hedging activities; changes in capital markets; unexpected or adverse weather conditions; changes in currency and exchange rates; imprecision in reserve estimates; adverse developments in new and pending legal proceedings or government investigations; acquisitions we may undertake; increases in the price or reduced availability of the raw materials that we use; strikes or other forms of work stoppage or slowdowns; timing and impact of capital expenditures; rates of return on, and the risks associated with, our investments and capital expenditures; changes in, and the effects of, government policies and regulations; security risks related to our information technology systems; risks related to reputational loss; and earnings, and the decisions of taxing authorities, which could affect our effective tax rates. Additional risks and uncertainties can be found in our Form 10-K for the fiscal year ended December 31, 2013 under the captions “Forward-Looking Statements” and “Item 1A – Risk Factors” and in our other filings with the US Securities and Exchange Commission and the Canadian provincial securities commissions. Forward-looking statements are given only as at the date of this release and the company disclaims any obligation to update or revise the forward-looking statements, whether as a result of new information, future events or otherwise, except as required by law.
Forward-looking Statements

PotashCorp Overview

Agriculture Market Overview

1. Crop prices supported in the first half by strong demand, unrest in Ukraine/Russia and delayed US planting.
2. Robust planting and yields in the US led to record corn and soybean production.
3. Global crop stocks increased following two years of above-trend yields, weighing on prices.
4. Significant improvement in livestock economics and healthy ethanol sector margins.
5. Delayed planting in Brazil created some yield risk and could impact Safrinha planting prospects.
Strong Global Production Softens Crop Prices
World Crop Market Update
Source: Bloomberg
Jan-
06
Sep-0
6
Jun-
07
Mar
-08
Dec-0
8
Aug-0
9
May
-10
Feb-1
1
Nov-1
1
Jul-1
2
Apr-1
3
Jan-
14
Oct-1
40
50
100
150
200
250
300
350
400
* Based on corn, soybean and wheat prices (weighted by global consumption).
World Crop Price Index* 2014 Highlights
Price Index (2005 Average = 100)

1994 1996 1998 2000 2002 2004 2006 2008 2010 2012 2014F1,000
1,200
1,400
1,600
1,800
2,000
2,200
2,400
2,600
0%
5%
10%
15%
20%
25%
30%Consumption Production Stocks-to-Use Ratio
2014F refers to the 2014/15 crop year.
Stocks-to-Use RatioMillion Tonnes
Stocks Rise but Remain Well Below Historical Highs
World Grain and Oilseed Supply/Demand
Source: USDA

Soybean Corn Rice Wheat-4000
-2000
0
2000
4000
6000
8000
10000
12000
14000
Asia FSU EU
Latin America North America Others
Source: USDA
MT/HectareMillion Hectares
Record Production Driven by Acreage Expansion and Strong Yields
World Grain and Oilseed Acreage and Yield
Harvested Area Change: 2014 vs 5-Year Average Yield
2004
2005
2006
2007
2008
2009
2010
2011
2012
2013
2014
F
2.00
2.25
2.50
2.75
3.00
3.25
3.50
Yield Linear (Yield)
Jan-0
6
Jul-0
6
Feb-07
Sep-07
Mar-0
8
Oct
-08
May-
09
Nov-09
Jun-1
0
Jan-1
1
Jul-1
1
Feb-12
Sep-12
Mar-1
3
Oct
-13
May-
14
Nov-14
0
50
100
150
200
250
300
350
400
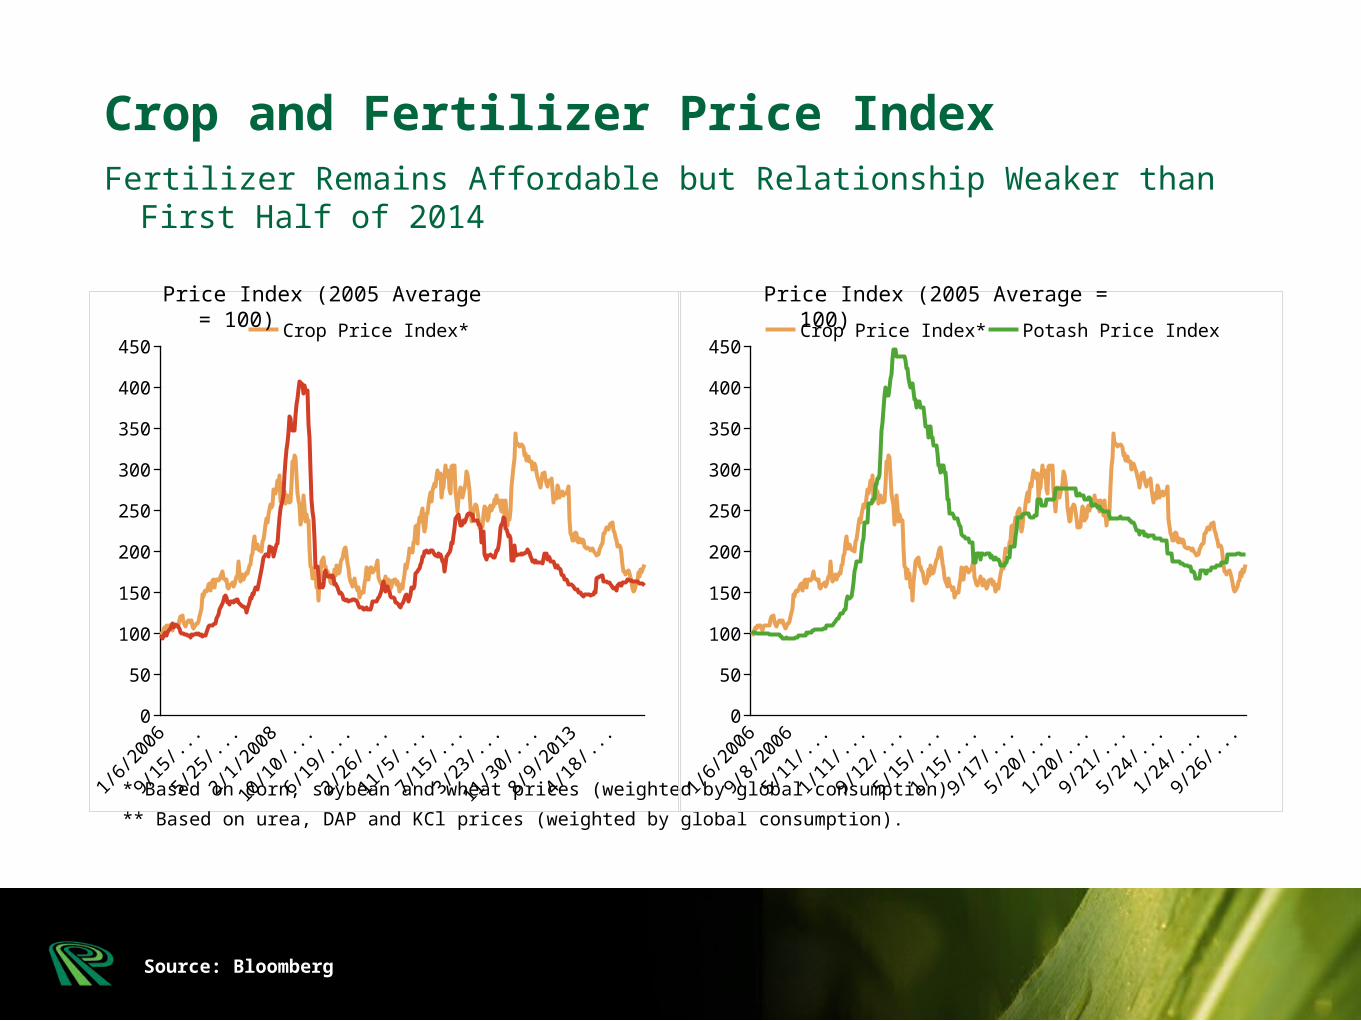
450Crop Price Index* Fertilizer Price Index**
* Based on corn, soybean and wheat prices (weighted by global consumption).
** Based on urea, DAP and KCl prices (weighted by global consumption).
Price Index (2005 Average = 100)
Crop and Fertilizer Price Index
Source: Bloomberg
Jan-0
6
Jul-0
6
Feb-07
Aug-07
Feb-08
Sep-08
Mar-0
9
Oct
-09
Apr-10
Nov-10
May-
11
Dec-11
Jun-1
2
Dec-12
Jul-1
3
Jan-1
4
Aug-14
0
50
100
150
200
250
300
350
400
450Crop Price Index* Potash Price Index
Price Index (2005 Average = 100)
Fertilizer Remains Affordable but Relationship Weaker than First Half of 2014

Source: USDA, PotashCorp
2000
2001
2002
2003
2004
2005
2006
2007
2008
2009
2010
2011
2012
2013
2014
F0
1
2
3
4
5
6
7Seed Fertilizer Chemical Other VCLand Rent Other FC Corn Price
US$/Bushel
Margins Reset in 2014 After Multiple Years of Robust Returns
US Corn Economics

• Brazilian crop progress and safrinha planted area
• US crop acreage changes
• Expect less corn and cotton acreage
• Potential for more soybean based on current economics
• Chinese import demand and policy changes
• Macro factors (FX, oil prices, geopolitical events)
2015 Factors to Watch

Fertilizer Market Overview

KCl Ammonia Phosphoric Acid0
10
20
30
40
50
60
70
80
90
100
North America FSU Europe China India
Other Asia Africa/Middle East Latin AmericaPercent*
Capacity Typically Located Near Low-Cost/High-Quality Raw Material Source
World Fertilizer Capacity Percentage by Region
* Based on 2013 year-end nameplate capacity.
Source: CRU, Fertecon

Source: Fertilizer Week, PotashCorp
Potash Prices Strengthened in 2014
World Potash Market Update
Jan-
10
Jul-1
0
Jan-
11
Jul-1
1
Jan-
12
Jul-1
2
Jan-
13
Jul-1
3
Jan-
14
Jul-1
4200
300
400
500
600
700
Brazil CFR NOLA FOB
US$/tonne1. Potash prices increased in 2014,
particularly in major markets for granular product.
2. Record potash shipments expected,
3. Estimated global operating rates above 90 percent.
4. Producer inventory levels down significantly compared to the beginning of the year.
World Potash Prices 2014 Highlights

2000
2001
2002
2003
2004
2005
2006
2007
2008
2009
2010
2011
2012
2013
2014
E0
10
20
30
40
50
60 Shipments Consumption Production
Million Tonnes KCl
World Potash S&D
Source: Fertecon, CRU, IFA, Industry Publications, PotashCorp
Record Potash Shipments in 2014
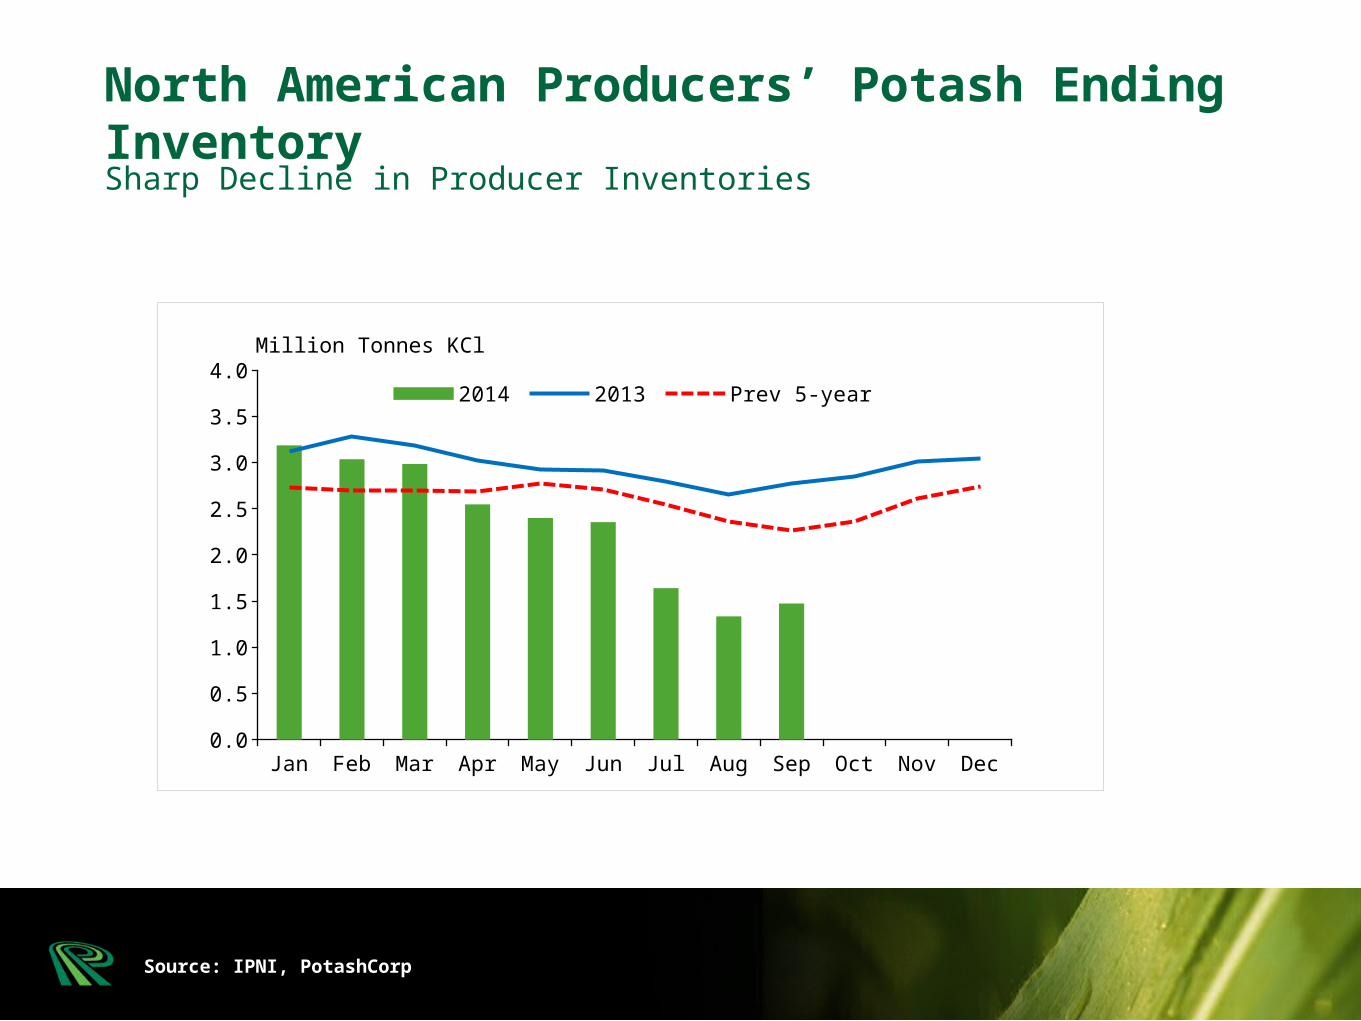
Source: IPNI, PotashCorp
Jan Feb Mar Apr May Jun Jul Aug Sep Oct Nov Dec0.0
0.5
1.0
1.5
2.0
2.5
3.0
3.5
4.02014 2013 Prev 5-year
Million Tonnes KCl
North American Producers’ Potash Ending InventorySharp Decline in Producer Inventories

12 13 14E
12 13 14E
12 13 14E
12 13 14E
12 13 14E
0
2
4
6
8
10
12
14
16Million Tonnes KCl
World Potash Shipments by Markets
Source: Fertecon, CRU, Industry Publications, PotashCorp
ChinaIndia L. AmericaOther Asia N. America
Strong Growth in Demand in All Major Potash Markets

Source: USDOC, Fertecon, IPNI, PotashCorp
2004 2005 2006 2007 2008 2009 2010 2011 2012 2013 2014E0.0
2.0
4.0
6.0
8.0
10.0
12.0 Domestic Producer Shipments Offshore Imports
Million tonnes KCl
North America’s Potash Shipment ProfileSignificantly Improved Demand in 2014

Source: USDA, AAPFCO, PotashCorp
Calculation based on commercial fertilizer application data, estimated nutrients available from manure and crop removal rates for all major crops grown in the US.
Central P
lains
Mountain
Lake States
MidwestOther
WestDelta
0.0
0.5
1.0
1.5
2.0
2.5
3.0
3.5
4.0
3.7
1.4
0.7 0.7 0.6 0.60.4
Million Short Tons KCl Equivalent
1975 1980 1985 1990 1995 2000 2005 20100
2
4
6
8
10
12
14
16Crop removal Fertilizer applied
Million Short Tons KCl Equivalent
Application Rates Have Not Kept Pace With Higher Crop Removal
US Potassium Application and Crop Removal
US Total Regional Application Deficit – 2010
~ 8.0 million
st

Source: Fertecon, CRU, Industry Publications
Potash Mines Could be Closed Due to Water Inflows or Ore Depletion
Historical Potash Mine Closures
1986
Berezniki - 3 mine in Russia (1.8 MMT)
was abandoned due to flooding
1988
Patience Lake SK mine (1.0 MMT) was converted to a
solution mine after flooding
1998
Cassidy Lake NB mine (1.3 MMT) was lost due to
flooding
1990-2003
Potash mines in US, Germany and France
closed due to depleting ore and high cost position
2006
Berezniki -1 mine in Russia (1.4 MMT) was closed due to
flooding
2014
Solikamsk - 2 mine in Russia (2.4 MMT) shut down due to elevated
brine inflow.
2018-2020
Mines to be closed due to reserve depletion:
Sigmundshall (Germany) and Taquari (Brazil)
2015
Mosaic to discontinue MOP production at
Carlsbad, NM mine (0.5 MMT)

Jan-
10
May
-10
Sep-1
0
Jan-
11
May
-11
Sep-1
1
Jan-
12
Jun-
12
Oct-1
2
Feb-1
3
Jun-
13
Oct-1
3
Feb-1
4
Jun-
14
Oct-1
40
100
200
300
400
500
600
700
800Tampa cfr Black Sea fob
Source: Fertilizer Week, PotashCorp
1. Weak fundamentals in the second half of 2013 impacted first-quarter 2014 ammonia prices.
2. Healthy demand and global plant outages supported ammonia prices following the first quarter.
3. Natural gas curtailments and plant reliability issues limited production in Egypt, Algeria, Libya, Trinidad and Pakistan.
4. Political tension in Ukraine/Russia constrained production and exports from this region.
US$/Tonne
Prices Were Firm Through Most of 2014
World Ammonia Market Update
World Ammonia Prices 2014 Highlights

Ukraine Trinidad Pakistan Egypt Algeria Libya0
1,000
2,000
3,000
4,000
5,000
6,000
7,000Production Curtailed Capacity
Million Tonnes - NH3
Significant Production Outages in Key Regions
Regional Ammonia Production Profile
Source: Fertecon, PotashCorp

Jan-
10
May
-10
Sep-1
0
Jan-
11
May
-11
Sep-1
1
Jan-
12
Jun-
12
Oct-1
2
Feb-1
3
Jun-
13
Oct-1
3
Feb-1
4
Jun-
14
Oct-1
40
100
200
300
400
500
600
700
800NOLA Middle East
Source: Fertilizer Week, PotashCorp
1. Strong demand in key import markets.
2. Tight supply contributed to a price premium in the US compared to global markets in the first half of 2014.
3. Record Chinese exports pressured global urea prices.
4. Middle East export volumes remained at elevated levels.
US$/MT
Prices Soften Due to Record Chinese Exports
World Urea Market Update
World Urea Prices 2014 Highlights

30,000
35,000
40,000
45,000
50,000
Source: Fertecon, CRU, PotashCorp
30,000
35,000
40,000
45,000
50,000Million Tonnes
Increased Demand Met by a Few Key Exporting Regions
Global Urea Trade Changes
World Urea Imports World Urea Exports
Million Tonnes

Jan
Feb
Mar
Apr
May
Jun
Jul
Aug
Sep
Oct
Nov
Dec
0
1,000
2,000
3,000
4,000
5,000
6,000
7,000
8,0002014
2013
Prev. 5-Year Avg.
Jan
Feb
Mar
Apr
May
Jun
Jul
Aug
Sep
Oct
Nov
Dec
0
1,000
2,000
3,000
4,000
5,000
6,000
7,000
8,00020142013Prev. 5-Year Avg.
Source: USDOC, Potafertz, FAI, Fertecon, PotashCorp
Million Tonnes
India Imports
Million Tonnes
Brazil ImportsUS Imports
Strong Imports in the Western Hemisphere; India to Catch Up
Cumulative Urea Imports for Key Regions
Jan
Feb
Mar
Apr
May
Jun
Jul
Aug
Sep
Oct
Nov
Dec
0
1,000
2,000
3,000
4,000
5,000
6,000
7,000
8,000
20142013Prev. 5-Year Avg.
Million Tonnes

Many Proposed Projects; Some Under Construction and Several Deferred
Potential North American Nitrogen Project Locations
High Probability Projects
Medium Probability Projects
More Speculative Projects
Projects under Construction
Expected Product Mix (million tons)
Ammonia Urea UAN
UC/High 1.3 5.0 3.8
Medium 0.9 0.7 0
Low 1.1 5.7 3.6
Source: Company Reports, Fertecon, CRU, PotashCorp
Announced Project Cancelations/Deferrals

1. Northern Hemisphere logistics and production issues tighten availability in first quarter.
2. India monsoon uncertainty and low importer margins limited import volumes.
3. Record demand from Latin America.
4. China exported record volumes with greater geographic diversity. Morocco and Saudi Arabia provided incremental supply.
5. Rising non-rock input costs.
Demand Strength and Supply Challenges Support Phosphate Market
World Phosphate Market Update
Jan-
10
Jul-1
0
Jan-
11
Jul-1
1
Jan-
12
Jul-1
2
Jan-
13
Jul-1
3
Jan-
14
Jul-1
40
100
200
300
400
500
600
700
0
200
400
600
800
1,000
1,200 Tampa DAP CFR India Phosphoric Acid
US$/tonne - Phosphoric AcidUS$/tonne - DAP
Source: Fertilizer Week
World Phosphate Prices 2014 Highlights

Mar
-13
May
-13
Jul-1
3
Sep-1
3
Nov-1
3
Jan-
14
Mar
-14
May
-14
Jul-1
4
Sep-1
4
Nov-1
4
Jan-
15
Mar
-15
-0.6
-0.4
-0.2
0.0
0.2
0.4
0.6
0.8
1.0
1.2
1.4
Million Tonnes
Significant Shifts in the Supply/Demand Balance
Global DAP/MAP Trade Balance
Source: Profercy
Trade Surplus
Trade Deficit

Source: FAI, Potafertz, CRU, PotashCorp
14E
12
14E
12
14E
12
14E
12
14E
12
0 1 2 3 4 5 6
USA
Morocco
China
Saudi Arabia
Russia
Million Tonnes
Higher Exports From Morocco, Saudi Arabia and China
DAP/MAP Exports By Major Region
Global DAP/MAP trade: 2012 – 20.5 MMT, 2013 – 20.6 MMT, 2014E– 22.0 MMT

Source: FAI, Potafertz, CRU, PotashCorp
14E
12
14E
12
14E
12
14E
12
14E
12
0 1 2 3 4 5 6 7
Other Asia
Brazil
India
Other Latin America
US
Million Tonnes
Record Latin America and US Imports in 2014
DAP/MAP Imports by Major Region
Global DAP/MAP trade: ~21.0 MMT

• Impact of lower crop prices on global fertilizer consumption?
• US fertilizer demand in spring and logistics capability
• Impact of shortened fall application season?
• Potential nitrogen product mix changes?
• Macro factors and Geopolitical events
• Impact of changing FX, oil prices?
• Potential for new global fertilizer capacity?
2015 Factors to Watch

There’s more online:
PotashCorp.comVisit us online
Facebook.com/PotashCorpFind us on Facebook
Twitter.com/PotashCorpFollow us on Twitter
Thank you
Click icon to add picture