portrait of ependymoma recurrence in children: … · philippe dessen2, vladimir lazar7, gilles...
TRANSCRIPT

Portrait of Ependymoma Recurrence in Children:Biomarkers of Tumor Progression Identified by Dual-Color Microarray-Based Gene Expression AnalysisMatthieu Peyre1., Frederic Commo2., Carmela Dantas-Barbosa1., Felipe Andreiuolo1,4, Stephanie
Puget1,3, Ludovic Lacroix4, Francoise Drusch4, Veronique Scott1, Pascale Varlet5, Audrey Mauguen6,
Philippe Dessen2, Vladimir Lazar7, Gilles Vassal1,8, Jacques Grill1,8*
1 Universite Paris-Sud, CNRS UMR 8203 ‘‘Vectorology and Anticancer Treatments’’, Gustave Roussy Institute, Villejuif, France, 2 CNRS FRE 2939, Bioinformatics Group,
Gustave Roussy Institute, Villejuif, France, 3 Department of Neurosurgery, Necker Sick Children’s Hospital, Universite Paris V Descartes, Paris, France, 4 Translational
Research Laboratory, Gustave Roussy Institute, Villejuif, France, 5 Department of Neuropathology, Sainte-Anne Hospital, Paris, France, 6 Department of Biostatistics,
Gustave Roussy Institute, Villejuif, France, 7 Functional Genomics Unit, Gustave Roussy Institute, Villejuif, France, 8 Department of Pediatric and Adolescent Oncology,
Gustave Roussy Institute, Villejuif, France
Abstract
Background: Children with ependymoma may experience a relapse in up to 50% of cases depending on the extent ofresection. Key biological events associated with recurrence are unknown.
Methodology/Principal Findings: To discover the biology behind the recurrence of ependymomas, we performedCGHarray and a dual-color gene expression microarray analysis of 17 tumors at diagnosis co-hybridized with thecorresponding 27 first or subsequent relapses from the same patient. As treatment and location had only limited influenceon specific gene expression changes at relapse, we established a common signature for relapse. Eighty-seven genes showedan absolute fold change $2 in at least 50% of relapses and were defined as the gene expression signature of ependymomarecurrence. The most frequently upregulated genes are involved in the kinetochore (ASPM, KIF11) or in neural development(CD133, Wnt and Notch pathways). Metallothionein (MT) genes were downregulated in up to 80% of the recurrences.Quantitative PCR for ASPM, KIF11 and MT3 plus immunohistochemistry for ASPM and MT3 confirmed the microarray results.Immunohistochemistry on an independent series of 24 tumor pairs at diagnosis and at relapse confirmed the decrease ofMT3 expression at recurrence in 17/24 tumor pairs (p = 0.002). Conversely, ASPM expression was more frequently positive atrelapse (87.5% vs 37.5%, p = 0.03). Loss or deletion of the MT genes cluster was never observed at relapse. Promotersequencing after bisulfite treatment of DNA from primary tumors and recurrences as well as treatment of short-termependymoma cells cultures with a demethylating agent showed that methylation was not involved in MT3 downregulation.However, in vitro treatment with a histone deacetylase inhibitor or zinc restored MT3 expression.
Conclusions/Significance: The most frequent molecular events associated with ependymoma recurrence were over-expression of kinetochore proteins and down-regulation of metallothioneins. Metallothionein-3 expression is epigeneticallycontrolled and can be restored in vitro by histone deacetylase inhibitors.
Citation: Peyre M, Commo F, Dantas-Barbosa C, Andreiuolo F, Puget S, et al. (2010) Portrait of Ependymoma Recurrence in Children: Biomarkers of TumorProgression Identified by Dual-Color Microarray-Based Gene Expression Analysis. PLoS ONE 5(9): e12932. doi:10.1371/journal.pone.0012932
Editor: Chris Jones, Institute of Cancer Research, United Kingdom
Received January 14, 2010; Accepted July 14, 2010; Published September 24, 2010
Copyright: � 2010 Peyre et al. This is an open-access article distributed under the terms of the Creative Commons Attribution License, which permitsunrestricted use, distribution, and reproduction in any medium, provided the original author and source are credited.
Funding: The authors thank the Societe de Neurochirurgie de Langue Francaise for the fellowship of MP and the Institut National du Cancer and the Region Ilede France for the Fellowship of CDB and FA, as well as the grant support from the Societe Francaise des Cancers de l’Enfant/Enfants et Sante 2006 (http://www.enfants-sante.asso.fr/) and from the charity ‘‘l’Etoile de Martin’’ (http://www.letoiledemartin.org/) for FA and CDB. The funders had no role in study design, datacollection and analysis, decision to publish, or preparation of the manuscript.
Competing Interests: The authors have declared that no competing interests exist.
* E-mail: [email protected]
. These authors contributed equally to this work.
Introduction
Ependymomas are tumours thought to derive from radial glial
cells [1] and display morphological characteristics of normal
ependyma [2]. They represent the third most common intracra-
nial tumour in children and intracranial location account for more
than 90% of cases [3]. The incidence is higher in young children
as more than fifty percent occur before the age of 5 [4]. The
overall prognosis of this tumour remains poor, especially in young
children [5] with a 10-year survival between 30 and 70% [6,7].
Extent of initial surgery remains the only consensual prognostic
factor across studies [6,8,9]. Recurrences are most of the time
local, at least at the beginning of the natural history; distant
metastases become more frequent with more effective local
treatment [7]. Treatment strategy is actually based on surgery at
diagnosis and at each relapse completed with local radiotherapy
PLoS ONE | www.plosone.org 1 September 2010 | Volume 5 | Issue 9 | e12932

[4,6,10]. The role of chemotherapy is circumscribed to children
under 3 years of age to avoid or postpone radiotherapy due to its
potential neuropsychological side effects [10,11]. There is actually
no treatment strategy specific for tumour recurrences after
radiotherapy.
Advances have been made in our understanding of the
molecular mechanisms underlying the oncogenesis of ependymo-
ma with the discovery of specific cancer stem cells [1] and the
definition of gene expression profiles specific of each location [1].
In addition, specific molecular signatures associated with clinical
characteristics have been identified [12–16]. However, reports on
prognostic biological markers have shown little consistency or
reproducibility [9,12,17–29]. The Notch pathway, however, has
been implicated in three independant studies as a key regulator of
ependymoma oncogenesis [1,12,30]. Nonetheless, most of these
reports concerned only tumours at diagnosis. Progression of
ependymoma is possibly related to multiple factors and activated
pathways that cannot always be unraveled by tumour analysis at
diagnosis.
Aiming at learning more about tumor progression, we
hypothesized that relevant information could be obtained by
comparing with high throughput technologies tumours from the
same patient at diagnosis and at relapse. Dual-color microarray-
based gene expression analysis with the two samples labeled with
different dyes on the same array, that hybridize competitively to
probes on the same spot, allows to adjust for many factors that
introduce noise and errors in studies where the comparison of
expression differences is made with three different arrays (one for
the control and two for the samples at diagnosis and at relapse)
[31,32]. Conversely, this design does not allow to have absolute
expression data at diagnosis but only the changes between
diagnosis and relapse, but with a higher sensitivity through the
limitation of normalization problems [33].
This study revealed pathways specifically up- or down-regulated
at relapse that may be used as targets for drug development in
pediatric ependymomas. Downregulation of metallothionein-3,
also known as neural growth inhibitory factor, was observed at
relapse in more than 80% of the recurrences. Conversely, genes of
Wnt and Notch pathways were upregulated at recurrence together
with numerous genes of the kinetochore and mitotic spindle.
Materials and Methods
Tumour material and patient characteristicsSeventeen patients with at least two frozen samples from two
different surgeries (one diagnosis and one relapse) were included in
this study. Frozen samples of tumour at diagnosis and at least one
relapse were obtained for each patient. All samples were snap
frozen at the time of surgery. For ten patients, one relapse was
available and for seven patients two to three relapses were
available. The study encompassed a total of forty-four tumour
samples, seventeen at diagnosis and twenty-seven at relapse.
Paired tumour samples (diagnosis and relapse) from fourteen
patients were obtained from the Tumour Bank at the Necker
Enfants Malades Hopital, Paris, France. Two additional paired
tumour samples were obtained from the Tumour Bank of the
Pierre Wertheimer Hospital, Lyon, France and one from the
Neurosurgery Department of the Vrije Universiteit of Amsterdam.
The biological study was approved by the Internal Review Board
of the Biological Ressource Center of the Necker Sick Children
Hospital in Paris, by the Internal Review Board of the
Neurosurgery Department of the Vrije Universiteit in Amsterdam
and by the Scientific Advisory Board of the NeuroBioTec Tumor
Bank in Lyon. Parents/guardians gave their written informed
consent for the biological studies performed with the tumor
samples.
Patients’ characteristics are described in the supplementary data
(Table S1). Male to female ratio was 8:9. Median age at disease
onset was 3.4 years (range: 0,4–10,6 years). Tumour location was
infratentorial in 11 of 17 patients. Median follow-up of the patients
was 42 months (range: 19–96 months). Evaluation of the extent of
resection was based on the surgeon’s report and post-operative
contrast enhanced imaging. External beam irradiation protocol
consisted of a local irradiation with surimpression on the operating
site. Total radiation doses varied from 50 to 55 Gy and
conventional fractioning was used for all irradiated patients.
Almost all patients who received chemotherapy were treated
according to the BBSFOP protocol [10] except two patients who
received fotemustin alone and etoposide alone respectively. When
considering the treatment received before a given relapse, we
analysed the entire therapeutic sequence between diagnosis and
this relapse. Three groups of treatment were considered:
surveillance only, chemotherapy only, or irradiation with or
without chemotherapy.
Relapse was defined in fifteen patients as a local recurrence of
the tumour. In one case, the relapses were loco-regional metastases
in the same cerebral hemisphere (Patient 15). In one patient, the
relapses were spinal and supra-tentorial metastases of an initially
posterior fossa tumour (Patient 3). The median delay between
diagnosis and recurrence was 22 months (range: 2.2 – 62.4).
Histological diagnosis and tumour grading review were
performed by two independent neuropathologists (PV and FA).
Subependymomas and myxopapillary ependymomas were exclud-
ed from the study. Before nucleic acid extraction, sections from
frozen tumour samples were colored with hematoxylin to discard
those containing necrosis or calcifications.
Nucleic acid isolationDNA and RNA were extracted from frozen samples with the
Microkit (Qiagen). On the forty-four samples studied, eighteen
were previously analysed by BAC array-CGH [30]. RNA quality
was assessed by 2100 BioanalyzerH (Agilent Technologies). Quality
criteria included 28S/18S ratio .1.2 and RIN (RNA Integrity
Number) .8.
Gene expression arrayFor each patient, relapses were co-hybridized against their
corresponding tumour at diagnosis which served as reference.
Probes from tumour tissue and from the reference tissue were
differentially labeled by the incorporation of cyanine 3 (Cy3) and
cyanine 5 (Cy5) (Dual Color 44K microarray, Agilent Technol-
ogies), respectively. Briefly, probes were synthesized from 500 ng
of total RNA in two steps according to the manufacturer’s
instructions. One microgram of purified cRNA from each relapse
was mixed with the same amount of diagnosis-tumour cRNA.
Hybridizations were performed, in dye-swap, on whole-human-
genome 44K oligonucleotide microarrays (product G4112A;
Agilent). Feature extraction software provided by Agilent (version
7.2) was used to quantify the intensity of fluorescent images and to
apply a Lowess Normalization to correct for artifacts caused by
non-linear rates of dye incorporation as well as inconsistencies of
the relative fluorescence intensity between some blue and red dyes.
All data were imported into Resolver software (Rosetta Biosoft-
ware, Kirkland, WA) for database management, quality control,
computational re-combination of dye-swaps, and statistical
analysis. Functional analysis was carried out through the Ingenuity
Pathway Analysis (IngenuityH System, http://www.ingenuity.
com). Microarray data have been posted on Array Express
Ependymoma Recurrence Biology
PLoS ONE | www.plosone.org 2 September 2010 | Volume 5 | Issue 9 | e12932

(IGR_EPENDYMOMA_STUDY_MP ArrayExpress accession
number: E-TABM-873, password for reviewer: 1260902888493).
Comparative Genomic Hybridization (CGH) arrayDNA was hybridized to 4644K whole-genome Agilent arrays
(G4426A). For each sample, 500 ng of DNA were fragmented by a
double enzymatic digestion (AluI + RsaI) and checked with
LabOnChip (2100 Bioanalyzer System, Agilent Technologies)
before labeling and hybridization. Tumor DNA and control DNA
matched for sex (Promega) were labeled by random priming with
Cy5-dCTPs and Cy3-dCTPs, respectively and hybridized at 65uCfor 17 h. The chips were scanned on an Agilent G256BA DNA
Microarray Scanner and image analysis was done using the
Feature-Extraction V9.1.3 software (Agilent Technologies). Fea-
ture-Extraction was used for the fluorescence signal acquisition
from the scans. Normalization was done using the ranking-mode
method, with default value for any parameter. Raw copy number
ratio data were transferred to the CGH Analytics v3.4.40 software
for further analysis. Raw data have been submitted to the Array
Express database (IGR_EPENDYMOMA_CGH_STUDY_MP
ArrayExpress accession number: E-TABM-1023, password for
reviewer: 1277231149363). The ADM-2 algorithm of CGH
Analytics v3.4.40 software was used to identify DNA copy number
anomalies at the probe level. A low-level copy number gain was
defined as a log2 ratio .0.25 and a copy number loss was defined
as a log2 ratio ,20.25. A high-level gain or amplification was
defined as a log2 ratio .1.5. DNA copy number anomalies were
plotted by the aCGH software package v1.10.0 using the R
statistical language.
Statistical analysisAccording to our Gene Expression experimental design, the
LogRatios represented the expression changes from diagnosis to
recurrence. An initial filtering was applied to retain sequences
which appeared as significantly differently expressed (p#0.01) in at
least 50% of recurrences studied. This threshold of 50% was more
stringent than the 20% cut-off usually used, but this choice was
motivated our decision to include in the statistical analysis only
probes which were highly relevant. On this probe set, a one-group
t-test was carried out to define a common signature. In this
context, the test considered mean (LogR) = 0 as the null
hypothesis. Group comparisons (localization and treatment) were
performed using a two-group t-test or an analysis of variance (in
case of groups.2) to define differential signatures. For these
analyses, the same initial filtering was first applied before carrying
out a one-group t-test on each group, independently. This
procedure allowed us to retain only probes which were
significantly modified in at least one of the compared groups.
Finally, the selected probe sets were pooled for the statistical
analysis.
For each signature, the networks/pathways search, and
functional analysis were generated trough the use of Ingenuity
Pathway AnalysisH. Briefly, each signature, containing probe
identifiers and LogRatio values, were uploaded into the applica-
tion. Agilent probe identifiers were mapped to their corresponding
gene objects in the Ingenuity Pathways Knowledge Base. These
genes were then overlaid onto a global molecular network
developed from information contained in the Ingenuity Pathways
Knowledge Base. Networks of these focus genes were then
algorithmically generated based on their connectivity. Identifica-
tion of biological functions was based on a Fischer’s exact test
which calculated a p-value determining the probability that each
biological function assigned to each signature is due to chance
alone.
CGH-array analysis were performed by using the aCGH R
package (v1.26.0), and the step down maxT multiple testing
procedure of Westfall and Young. Statistical analysis consisted in
comparing chromosomal regions imbalances at relapse vs
diagnosis, and identifying new abnormalities in recurrences, in
general and in association with location or treatment.
Quantitative Real-Time PCR (qPCR)Approximately 1 mg of total RNA was used to synthesize cDNA
using random hexamers and the Mu-MLV reverse transcriptase
(Applied Biosystems). qRT-PCR for the genes MT2A, MT3,
KIF11 and ASPM was carried out using Taqman Gene
Expression Assays on Demand (Applied Biosystems) and ABI
Prism 7700 Sequence Detector (Applera). Expression profile in
each specimen was assessed by using the comparative threshold
cycle (2-ddCt) method. 18S Ribosomal RNA was used as and
endogenous control and normal whole brain cDNA (Ambion) as a
calibrator.
Methylation AssayInvestigation of methylation status of the MT3 promoter was
assessed by combined bisulfate treatment of genomic DNA and
sequencing after PCR amplification. One microgram of genomic
DNA was treated with bisulfite, which converts the nonmethylated
cytosines to thymines, using the CpGenomeTM Universal DNA
Modification Kit (Chemicon) according to the manufactor’s
instructions. PCR amplification was accomplished with primers
that do not discriminate between methylated and unmethylated
alleles that overlap 4 regions covering the promoter, exon 1 and
intron 1 of the MT3 gene, as described [34] and also with two
additional pairs of primers (sequences available under request).The
PCR products were sequenced using the ABI3730 DNA analyser
(Applied Biosystems). The methylation status of CpG islands was
determined by direct sequencing of both strands and by estimation
of the relative peak height of the PCR products. Normal human
DNA and methylated DNA were used as reference control.
Primary-culture cellsIn the absence of an available ependymoma cell line, we used
short term cell cultures derived from 2 pediatric ependymomas
operated at Necker Sick Childrens Hospital in Paris. Parents/
guardians gave written informed consent for research according to
the policy of the Internal Review Board of the Biological
Ressource Center of Necker Sick Childrens Hospital. Right after
surgery, tissues were suspended in DMEM cell culture medium
and transferred to the laboratory. After mechanical dissociation,
tumour cells were seeded in a 25 cm2 flask and maintained in
AminioMAX C-100 supplemented medium (Invitrogen) in a tissue
culture incubator. Subcultures were processed when cells achieved
80–90% confluence. These primary culture cells were designated
as EP1 and EP2. The glial nature of the cultured cells were
assessed by morphology and expression of GFAP on immunocy-
tochemistry (Figure S1).
Epigenetic regulation of metallothioneins expression invitro
Primary cell cultures of ependymoma and DAOY medulloblas-
toma cell line (ATCC) were added to 60 mm dish at a density of
56105 cells and incubated overnight in a 5% CO2 incubator. The
following day they were treated with 5 mM of 5-Aza-desoxyCy-
tidine (5-Aza), a demethylating agent, for 3 to 7 days (accordingly
to the proliferation rate/doubling time of each cell type) or with
300 nM of TSA, a histone-deacetylase inhibitor, for 16 hours. For
Ependymoma Recurrence Biology
PLoS ONE | www.plosone.org 3 September 2010 | Volume 5 | Issue 9 | e12932

the combination 5-Aza-dC/TSA treatments, 5-Aza-dC treatment
in the same conditions were performed first, followed by identical
TSA treatment. Every day, new medium containing freshly
prepared 5-Aza was added. At the end of the incubation period,
after medium removal, cells were lysed in RTL buffer. RNA was
extracted using the RNeasy mini kit (Qiagen) for analysis by qPCR
of MT2A and MT3 gene expression levels.
In vitro regulation of MT3 gene by metal cations andsteroids in brain tumor cells Immunohistochemistry
Anti-ASPM affinity purified rabbit polyclonal antibodies were
purchased from Bethyl Laboratories Inc (Montgomery, Texas)
(reference IHC-00058). Anti-MT3 affinity purified rabbit poly-
clonal antibody was obtained from Dr Donald Sens (Professor of
Pathology, University of North Dakota, School of Medicine and
Health Sciences, Grand Forks, ND); their preparation and use on
formalin-fixed, paraffin embedded material have been described
previously (38, 39). Sections were cut at 4 mm, deparaffinized,
exposed to 30 minutes treatment in a steamer at 98uC in citrate
pH 7,3 buffer for ASPM and pH 6,0 buffer for MT3 and then
treated with a peroxidase blocking agent (reference S2001,
DAKO, Glostrup, Denmark). Antibody incubation was performed
overnight at 4uC for ASPM (1:100) and 60 minutes hour at room
temperature for MT3 (1:1000). Antibody binding was visualized
with the peroxidase-based anti-rabbit EnVision KitTM (reference
K4003, DAKO) for both antibodies. Diaminobenzidine tetra
hydrochloride (DAB, DAKO) was used as chromogen. Sections
were counterstained with Mayer’s hematoxylin.
Immunohistochemical staining for MT3 was scored semiquan-
titatively, based on staining intensity and cell number, as follows:
0, no staining; 1, weak staining (independently of the number of
positive cells) or staining in less than 10% of cells (independently of
the staining intensity); 2, moderate to strong staining in more than
10% of cells. Scoring was performed as of observed in the most
positive areas. MT3 generally stained both nucleus and cytoplasm
(Figure S2). Staining for ASPM was analysed at high power view
(x1000), and scoring was performed as follows: 0, no staining; 1,
staining in scarce cells, 2, staining in numerous cells. Following
staining patterns were observed for ASPM: cytoplasmic, nuclear,
presence of paranuclear ‘‘dots’’ or marked cells in mitosis (Figure
S3).
Tissue micro arrayTissue microarray blocks from ependymoma patients treated
with the BBSFOP protocol were built [10]. For each patient, all
paraffin blocks and corresponding slides were obtained and
reviewed by two neuropathologists (PV, FA) for diagnostic
accuracy and tissue adequacy. Sonic aspirator extracts were
excluded from the study. Ependymomas were graded based on
WHO 2007 criteria. Histopathological findings (ependymal
differentiation, necrosis, endothelial proliferation, mitotic index,
anaplasia) were evaluated and recorded for each tumour.
Immunostainnings for EMA (1:1, clone E29, DAKO), GFAP
(1:200, clone 6F2, DAKO), OLIG2 (1:100, RnD systems,
Abingdon, UK) and Neurofilament Protein 70 (1:50, clone
2F11, DAKO) were performed for selected cases. Tumour
material was available at diagnosis and at recurrence for 24
patients. There was a total of 29 tumours at recurrence including
17 patients with one recurrence, 6 patients with two recurrences
(n = 12) and 1 patient with 3 recurrences (n = 3). Three to four
600 mM-cores were obtained from each tumour. Representative
areas were selected whenever present: classical ependymal
differentiation (ependymal rosettes, perivascular pseudo-rosettes,
and ependymal channels), anaplasia and high vascularisation
zones. Normal adult and fetal brain samples were included as
internal controls. Frequencies of positivity of MT3 and ASPM at
first recurrence were compared to frequencies at diagnosis by
McNemar test for paired data, taking into account the intra-
patient correlation.
Results
Copy number abnormalities with CGHarrayConsidering the whole patient population, there was no
statistically significant increase in copy number abnormalities
from diagnosis to the relapse. The most frequent chromosomal
changes between the diagnosis and the relapse were losses of the
short arm of chromosome 3 and the long arm of chromosome 6;
only the locus 6q25.2 (RBM16, NM_014892) being statistically
significant (Figure S4). Copy number changes in 19 regions on
chromosome 9 discriminated supratentorial and posterior fossa
tumors (Figure S5, Table S2). There was no specific chromosomal
copy number variation according to the type of treatment
received, albeit loss on chromosomes 3p and 6q were more
frequent after radiotherapy (Figure S6).
Gene expression profilingWe first determined the number of gene expression probe sets
differentially expressed between recurrences and initial tumours.
These signature volumes were found to be highly variable, ranging
from 374 to 18814 probe sets (median: 6275 probes – mean: 9054
probes). The number of probes differentiating the recurrence from
its corresponding initial tumour could not be statistically correlated
with age at onset, location of the tumour or treatment received but
was only linked to the delay between the diagnosis and the relapse.
For recurrences occurring before 22 months (ie , to the median
delay of recurrence), mean signature included 4799 probes versus
9058 for recurrences that appeared after 22 months (p = 0.013,
Student t-test).
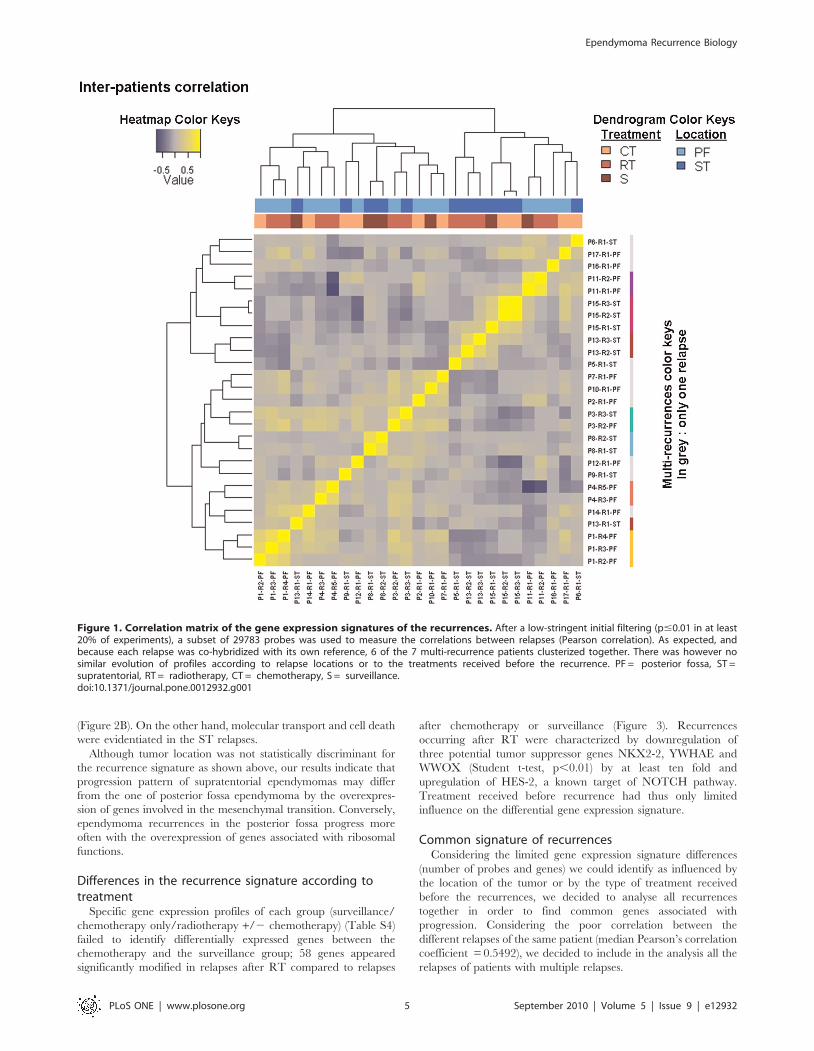
To study the molecular signature of the 27 relapses, we used a
hierarchical unsupervised clustering for 41000 probes present on
the arrays. Recurrences from the same patient were found to be
clustered together in 6 out of 7 patients who had experienced
several recurrences (Figure 1). Pearson’s correlation coefficient
between gene expression profiles of recurrences of the same
tumour ranged between 0.4191 and 0.8303 (median: 0.5492). As
illustrated in the upper lines on Figure 1, localization and adjuvant
therapy were not associated with the clustering of recurrences
based on their specific expression profile.
Differences in the recurrence signature according tolocation
This analysis allowed the identification of 197 genes differen-
tially expressed between the two type of recurrence according to
localization (Table S3). A clear difference between frequencies in
gene expression according to location was observed. Figure 2A
shows the genes most frequently upregulated at recurrence
according to the location of the primary tumor. In PF relapses,
the ribosomal proteins were the most represented (12 genes). The
most abundantly upregulated genes in the relapses of ST
ependymomas were involved in cytoskeleton organization (gelso-
lin, SEMA5A, contactin-1, sarcoglycan, villin-like, scinderin) and
extracellular matrix/cellular interactions (gliomedin, EXTL1,
galectin-9, desmuslin, tetranectin, versican, COL21A1, CO-
L16A1, CXCL12). A functional analysis of each group signature
revealed that the main functional networks associated with
posterior fossa relapses were cell cycle, cellular assembly and
organization plus DNA Replication, Recombination and Repair
Ependymoma Recurrence Biology
PLoS ONE | www.plosone.org 4 September 2010 | Volume 5 | Issue 9 | e12932
(Figure 2B). On the other hand, molecular transport and cell death
were evidentiated in the ST relapses.
Although tumor location was not statistically discriminant for
the recurrence signature as shown above, our results indicate that
progression pattern of supratentorial ependymomas may differ
from the one of posterior fossa ependymoma by the overexpres-
sion of genes involved in the mesenchymal transition. Conversely,
ependymoma recurrences in the posterior fossa progress more
often with the overexpression of genes associated with ribosomal
functions.
Differences in the recurrence signature according totreatment
Specific gene expression profiles of each group (surveillance/
chemotherapy only/radiotherapy +/2 chemotherapy) (Table S4)
failed to identify differentially expressed genes between the
chemotherapy and the surveillance group; 58 genes appeared
significantly modified in relapses after RT compared to relapses
after chemotherapy or surveillance (Figure 3). Recurrences
occurring after RT were characterized by downregulation of
three potential tumor suppressor genes NKX2-2, YWHAE and
WWOX (Student t-test, p,0.01) by at least ten fold and
upregulation of HES-2, a known target of NOTCH pathway.
Treatment received before recurrence had thus only limited
influence on the differential gene expression signature.
Common signature of recurrencesConsidering the limited gene expression signature differences
(number of probes and genes) we could identify as influenced by
the location of the tumor or by the type of treatment received
before the recurrences, we decided to analyse all recurrences
together in order to find common genes associated with
progression. Considering the poor correlation between the
different relapses of the same patient (median Pearson’s correlation
coefficient = 0.5492), we decided to include in the analysis all the
relapses of patients with multiple relapses.
Figure 1. Correlation matrix of the gene expression signatures of the recurrences. After a low-stringent initial filtering (p#0.01 in at least20% of experiments), a subset of 29783 probes was used to measure the correlations between relapses (Pearson correlation). As expected, andbecause each relapse was co-hybridized with its own reference, 6 of the 7 multi-recurrence patients clusterized together. There was however nosimilar evolution of profiles according to relapse locations or to the treatments received before the recurrence. PF = posterior fossa, ST =supratentorial, RT = radiotherapy, CT = chemotherapy, S = surveillance.doi:10.1371/journal.pone.0012932.g001
Ependymoma Recurrence Biology
PLoS ONE | www.plosone.org 5 September 2010 | Volume 5 | Issue 9 | e12932

To identify the specific genes associated with tumour progres-
sion, we chose to consider probes with a significant LogRatio
(Relapse/diagnosis, p-value#0.01) in at least 50% of the samples.
This filter selected 7384 of the 41 000 initial probes. A one-group
t-test was then carried out on this subset of probes by considering
LogRatio = 0 as the null hypothesis. The 298 probes identified
Figure 2. Comparison of functions associated with location of relapses. A Gene most frequently upregulated at relapse for supratentorial(upper yellow panel) are represented with the genes most frequently upregulated in infratentorial tumors (lower blue panel). Bars indicated thepercentage of tumors in each location with upregulation of the specific gene. B The -Log10(p-values) of the most discriminatory functions in eachgroup are represented. The p-value for a given function was calculated using the right-tailed Fisher Exact Test by considering 1) the number ofuploaded functional analysis molecules that participate in that function, and 2) the total number of molecules that are known to be associated withthat function in Ingenuity’s knowledge base.doi:10.1371/journal.pone.0012932.g002
Ependymoma Recurrence Biology
PLoS ONE | www.plosone.org 6 September 2010 | Volume 5 | Issue 9 | e12932

Figure 3. Supervised hierarchical clustering of differentially expressed genes in ependymoma relapse compared to diagnosis.Heatmap showing the 87 genes signature of the genes statistically up- or down-regulated in more than 50% of relapses with a fold change .2.Notice the homogeneity of the underexpression of the metallothioneins.doi:10.1371/journal.pone.0012932.g003
Ependymoma Recurrence Biology
PLoS ONE | www.plosone.org 7 September 2010 | Volume 5 | Issue 9 | e12932

were then analyzed in the IngenuityH database: 240 sequences
were mapped, ie related to known genes, 165 were network
eligible and 146 were pathway-eligible. This subset of 146 genes
was defined as the common signature of ependymoma recurrences
(Table S5). A reduced 87-genes signature of specific genes
associated with tumour progression is represented in Figure 4
and corresponds to the genes differentially expressed with a fold
change $2 in at least 50% of the recurrences. This signature is
characterized by the activation of the Wnt pathway with
overexpression of the following genes SFRP1, SFRP2, FZD2,
FZD8, WNT10B besides the upregulation of the stem cell marker
CD133 (PROM1) and the proliferation antigen identified by the
monoclonal antibody Ki-67 (MKI67). Two other groups of genes
were very homogenously differentially expressed in relapses. The
first one corresponds to proteins of the kinetochore (KIF14,
KIF11, KIF1C, KIF2C, PRC1, BUB1B, ZWINT, ASPM,
KNTC2, CENPF), all significantly upregulated. The second one
is the group of metallothioneins (MT1L, MT1G, MT1E, MT1X,
MT1B, MT2A, MT3) found to be downregulated in 65 to 85% of
relapses depending on the MT. MT3, also known as neural growth
inhibitory factor, was the most frequently downregulated gene
among metallothioneins. The expression of the proliferation
marker Ki67 was inversely correlated with MT3 at relapse
(Pearson’s correlation, r = 20.51, p,0.0001).
Several genes involved in the immune system were found to be
downregulated in the common signature of recurrence: CXCL5,
CX3CL1, TRAF3IP2, ITGBL1, SERPING1, IFT20, ENTPD3,
HP and HPR. Conversely, TIA1, a RNA-binding protein with
nucleolytic activity against cytotoxic lymphocytes, was significantly
overexpressed (adj. P value = 0.005).
Validation of microarray data by qPCR andimmunohistochemistry
Three genes expressed differentially in relapses compared to
diagnosis were chosen for further analysis. qPCR analysis were
performed for the genes KIF11, ASPM and MT3 in the tumours
previously analyzed by gene-expression microarray. The heat-map
on Figure 4A illustrates the correlation between microarray and
qPCR results. These analyses confirmed the progressive upregula-
tion of the genes KIF11 and ASPM at recurrence. For the MT3
gene, the results showed a low expression level at diagnosis that
tended to become even lower throughout relapse. Progressive
down-regulation of the MT3 gene expression during progression
was thus confirmed for 12 of the 17 (70.5%) patients. Among the 5
patients whose MT3 gene expression was stable or increased
during progression, 3 had expression levels below the one of
normal brain (Figure 4B). To verify the microarray data at the
protein level, immunohistochemistry for ASPM and MT3 was
performed on 7 patients among the 17 studied in microarray. The
same trend of decreasing MT3 and increasing ASPM staining was
confirmed (Figure 5).
Immunodetection of MT3 and ASPM expression in aindependant cohort of pediatric ependymomas
To confirm the changes in expression of MT3 and ASPM in
an independent cohort, we studied the expression of these two
genes on a TMA of childhood ependymomas composed of 24
tumours at diagnosis with at least one relapse. Among those 24
patients, 23 had a posterior fossa tumour and 1 a supratentorial
tumour. Seventeen patients (70.8%) displayed a weaker expres-
sion of MT3 at relapse compared to diagnosis (Table 1), 13 of
which becoming negative for MT3 during progression. Two
patients were negative at both diagnosis and relapse. Four had a
stable positive expression of MT3 over all samples, and only one
patient had a stronger expression of MT3 at recurrence
compared to diagnosis. ASPM staining was stronger at relapse
compared to diagnosis in 12 patients (50%), being even negative
at diagnosis in ten of then (Table 2). Among the other 12
patients, ASPM staining was identical at diagnosis and relapse,
either negative (3 patients) or positive (9 patients). Frequency of
positivity was significantly different at diagnosis comparing to
relapse for both markers (MT3: p = 0.002 and ASPM: p = 0.03,
McNemar test).
Figure 4. Confirmation analyses (internal validation of gene expression). A qPCR Heatmap showing expression of 3 candidate genes (MT3,KIF11, ASPM) in gene expression array and RT-PCR side to side. Pearson correlation coefficients between the two analyses are indicated. B Evolutionof MT3 expression throughout progression. RT-PCR levels are given as Log scale compared to normal brain.doi:10.1371/journal.pone.0012932.g004
Ependymoma Recurrence Biology
PLoS ONE | www.plosone.org 8 September 2010 | Volume 5 | Issue 9 | e12932

Mechanism of regulation of metallothionein inependymomas
Metallothioneins being the most homogeneously downregulated
genes at relapse, we decided to investigate the possible mecha-
nisms of their repression at the genetic and epigenetic levels.
Considering that all MT genes are clustered on chromosome
16q13, we first verified a possible deletion of this chromosome
region. CGH array analysis did not show a loss for this
chromosome region at relapse (Figure S5). To rule out the
possibility of a small genomic deletion missed by CGHarray
analysis we carried out quantitative PCR analysis for the MT2A
gene. Amplification products could be obtained in all 37 samples
tested with a CT corresponding to the one of normal DNA
reference (Figure S7).
The absence of DNA deletion prompted us to investigate the
regulation of gene expression at transcriptional level. We first
verified whether genes known to interact with the MT gene
promoters were differentially expressed at relapse. None of the
transcriptional activators (MTF1, USF1, NF1, STAT3, IL6) was
found to be down-regulated at relapse compared to diagnosis.
None of the transcriptional repressors (SIN3A, SIN3B, MTA1,
HDAC1) was found to be upregulated.
Since differential expression of regulatory factors could not
explain MT3 downregulation, we investigated whether epigenetic
factors and especially CpG islands methylation, were implicated in
MT3 down-regulation at relapse. If methylation would be the cause
of MT3 downregulation, more methylated CpG islands should be
observed at relapse. We observed limited to no methylation of the
74 CpG islands in regulatory regions and intron 1 of MT3 and no
increasing methylation at relapse (Figure 6A). None of the few
methylated sites was correlated with gene expression measured by
qPCR (Figure 6B). To confirm this data, ependymoma primary cells
(EP1 and EP2) were treated with the demethylating agent 5-Aza-
DeoxyCytidine (5-Aza) followed by MT3 and MT2Agene expres-
sion analysis by qPCR (Figure 6C). DAOY, a medulloblastoma cell
line was used for comparison. The 5-Aza treatment alone induced a
small increase in MT2A expression level in all cells tested (1.8, 2.2
and 5.7 fold for EP1, EP2 and DAOY respectively). The 5-Aza
treatment alone did not increase MT3 expression in the
ependymoma cells, while a 2 log increase in expression was found
for DAOY. This data confirms the CpG islands methylation results,
since the EP1 and EP2 exhibit very few methylated sites on the
contrary to DAOY cells which harbor a hypermethylated pattern
on MT3 promoter region (data not shown).
Figure 5. MT3 and ASPM immunostains differ at diagnosis and relapse. (A) Strong nuclear and cytoplasmic staining for MT3 at diagnosis. (B)At relapse the same patient shown at A displayed only weak MT3 staining. Another example of paired tumours, for which ASPM immunostaining wasnegative at diagnosis (C) and positive at relapse (D). Please also note paranuclear dots and a marked cell in mitosis (D, inserts), two patterns typicallyobserved in ASPM immunostains, together with weak cytoplasmic staining.doi:10.1371/journal.pone.0012932.g005
Ependymoma Recurrence Biology
PLoS ONE | www.plosone.org 9 September 2010 | Volume 5 | Issue 9 | e12932

To test if epigenetic inactivation of MT genes could be due to
histone acetylation, cells were also treated with trichostatin A
(TSA), a deacethylating agent, alone or in combination with 5-Aza
(Figure 6D). On the other hand, TSA proved effective in
increasing dramatically MT3 expression in all tested cells: 135
fold for EP1, 198 fold for EP2, and 73 fold in the DAOY. MT2A
expression level did not change significantly in the ependymoma
primary and in DAOY cells after TSA treatment. Combination of
5-Aza and TSA was more effective than either agent alone in
increasing MT3 levels in EP2 and in DAOY cell lines. MT2A
levels in EP cells were significantly increased after a treatment
combining 5-Aza and TSA compared to either treatment alone.
Epigenetic modulation of EP cells in vitro confirmed that MT3
expression was not regulated by promoter methylation but more
likely by histone acetylation status. On the contrary, MT2A was
not regulated only by histone acetylation status but also by
methylation.
The MT3 promoter presents many regulatory elements, such us
MRE (Metal Responsive Element) that allows MT induction by
metal cations through MTF1 transcription factor and GRE
(Glucocorticoid Responsive Element) for glucocorticoids induc-
tion. To check chromatin accessibility, we treated ependymoma
primary cells EP1 and EP2 and DAOY cell line with ZnSO4 and
dexamethasone (Figure 6D). Both agents were able to induce
MT2A expression in all cells tested. Nevertheless MT3 was
induced by ZnSO4 in only one of the two EP cells and in DAOY.
Dexamethasone did not induce a significant upregulation of MT3
in any of the three cell lines tested. These results suggest that the
MRE in the promoter of MT3 is not always accessible in EP cells
in vitro.
Discussion
Despite several molecular studies, the oncogenesis of ependy-
moma remains elusive. Specific molecular events occurring during
progression have only been seldom reported [30,35]. This work
focused on recurrence-specific gene expression signature varia-
tions. We choose a dual color microarray system in order to
maximize the likelihood to discover significant changes in gene
expression. The tumour of the patient at diagnosis was used as the
reference and marked with Cy5 and the tumour of the same
patient was marked with Cy3 and co-hybridized competitively.
Consequently, only real changes in gene expression occurring at
relapse were detected. As ependymoma’s cell of origin remains
uncertain, we also thought that most of the gene expression studies
have suffered from the lack of specificity of the reference mRNA
used. When comparing the tumour with the normal brain, most of
the genes that are overexpressed correspond to cellular processes
linked to proliferation while most of the genes downregulated
correspond to neuronal proteins. Moreover, it has been recently
assumed that glial tumours display brain-region specific expression
profiles regardless of the tumour histology [1,12,14,36]. To
Table 1. Metallothionein 3 immunohistochemical expressionin ependymomas at diagnosis and relapse.
Evolution Pattern Patient D R1 R2 R3
Decreased ++/- A ++ -
++/- B ++ -
++/- C ++ -
++/- D ++ -
++/- E ++ - -
++/- F ++ ++ - -
++/- G ++ + + -
+/- H + -
+/- I + -
+/- J + -
+/- K + -
+/- L + -
+/- M + + -
++/+ N ++ +
++/+ O ++ +
++/+ P ++ +
++/+ Q ++ ++ +
Stable ++/++ R ++ ++
++/++ S ++ ++
++/++ T ++ ++ ++
+/+ U + +
-/- V - -
-/- W - - -
Increased +/++ X + + ++
D = tumor at diagnosis, R1 = first relapse, R2 = second relapse, R3 = thirdrelapse, ++ = medium to strong staining, + = weak staining, – = negative.doi:10.1371/journal.pone.0012932.t001
Table 2. ASPM immunohistochemical expression inependymomas at diagnosis and relapse.
Evolution Pattern Patient D R1 R2 R3
Increased -/+ A - +
-/+ D - +
-/+ S - +
-/+ F - +
-/+ H - +
-/+ E - - +
-/+ M - - +
-/+ Q - - +
-/+ F - - + +
-/+ G - - - +
+/++ U + ++
+/++ V + ++
Stable -/- B - -
-/- C - -
-/- I - - -
+/+ L + +
+/+ N + +
+/+ O + +
+/+ P + +
+/+ K + +
+/+ R + +
+/+ S + +
+/+ W + + +
+/+ T + + +
D = tumor at diagnosis, R1 = first relapse, R2 = second relapse, R3 = thirdrelapse, ++ = medium to strong staining, + = weak staining, – = negative.doi:10.1371/journal.pone.0012932.t002
Ependymoma Recurrence Biology
PLoS ONE | www.plosone.org 10 September 2010 | Volume 5 | Issue 9 | e12932

analyse properly gene expression changes compared to the control,
one should therefore use the normal brain control from the same
location as the tumor. The brain region-specific expression pattern
should remain stable over time between diagnosis and local
recurrence. It is thus not surprising that none of the genes
described as location–specific at diagnosis appeared in our
recurrence signature.
Microarray studies conducted to discover molecular pathways
linked with tumour progression and papers comparing metastases
to initial tumours have already been performed [37–41]. The use
of paired samples alleviate the bias associated with interindividual
variation; for example, comparison of expression profile of
tumours prior to and following systemic chemotherapy allowed
the identification of differentially expressed genes correlated with
chemoresistance in ovarian carcinomas. [37] In addition, paired
samples by reducing variability increase strikingly the statistical
power of the study [42].
Microarray analysis of recurrence-specific expression changes
demonstrates the existence of a common signature for recurrence
in ependymoma. This signature pinpoints pathways already
described in other ependymoma studies focusing on tumours at
diagnosis such as the Wnt and the Notch pathways [12,14,30].
The common signature at relapse also unveils several genes
already described in the death-from-cancer signature [43]
Figure 6. A: Methylation status of 74 CpG sites at MT3 promoter and intron 1. Each row of circles represents one EP sample sequencedfrom PCR products generated from amplification of bisulfite-treated DNA. Empty circles = unmethylated cytosines; Dotted circles = hemimethylatedcytosines; Dark circles = methylated citosines. B: MT3 expression analysis by quantitative PCR in the corresponding ependymomatumors. Samples with results under 1.0 are downregulated and those over 1.0 are upregulated compared to normal brain. The black barscorrespond to sample at diagnosis, and the grey bar to relapse. Each histogram represent the corresponding sample studied for methylation. C:Epigenetic modulation of MT2A and MT3 expression on short term ependymoma cultures EP1 and EP2 and medulloblastoma cell line DAOYas control. Demethylation by 5-Aza-Deoxycytidine (left panel). Histone deacetylation inhibition by Trichostatin A (middle panel). Combinedtreatments (right panel). D: Treatment with zinc sulfate restores the expression of MT3. MT2A and MT3 expression level after 24 hours of200 mM of ZnSO4 (left panel) and 5 microM of dexamethasone (right panel) treatments in the ependymoma primary culture cells EP1 and EP2 and inthe medulloblastoma cell line DAOY.doi:10.1371/journal.pone.0012932.g006
Ependymoma Recurrence Biology
PLoS ONE | www.plosone.org 11 September 2010 | Volume 5 | Issue 9 | e12932

including MKI67, KNTC2 (HEC1) and BUB1B. These last two
genes belong to a broader group of molecules overexpressed at
relapse in ependymoma and playing a role in spindle formation.
Several kinetochore molecules were found in our signature and
have already been described as prognostic markers in other
tumours: KNTC2 in lung cancer and kinesin KIF14 in breast and
lung cancer [44–46]. The spindle molecule ASPM has been shown
to be involved in the malignant progression of gliomas possibly
through expansion of a cancer stem cell compartment [47]. Beside
their prognostic value, these molecules may also represent new
therapeutic targets. Classic spindle poisons target tubulin and have
not demonstrated their efficacy in ependymoma. But new
chemotherapies, known as kinesin spindle inhibitors, are actually
under evaluation. Among them, monastrol, a kinesin Eg5 (KIF11)
inhibitor, has already demonstrated its efficiency in glioma in vitro
[48–50] and is currently under clinical development.
Apart from upregulation of genes associated with proliferation,
the key event associated with recurrence in our common signature
was down-regulation of metallothioneins, especially MT3. The
metallothioneins are small proteins that posses about 60 amino
acids, with a high level of cysteines that confers to then the ability
to bind divalent metals. Metallothioneins function as metals
reservoirs, maintaining metal homeostasis and contributing to
heavy metals detoxification, phenomenon that can lead to
chemoresistance in some cancers, [51–53] and scavenging free
radicals [54]. In mammals there are four groups of MT proteins:
MT1, MT2, MT3 and MT4, that are coded by a family of genes
clustered on chromosome 16q13. MT2 protein coded by MT2A
gene accounts for 80% of the MTs proteins. The MT1 and MT2
are ubiquitously expressed. MT3 was first detected in the brain of
patients with Alzheimer’s disease, identified as a factor inhibiting
neuronal growth in culture and called neural GIF (growth
inhibitory factor) [55]. MT3 is expressed predominantly within
the CNS and has been found both in neurons and in astrocytes
[56]. MT3 is expressed at a lower level in other tissues such as
kidney [57,58]. MT4 is specifically expressed in the stratified
squamous epithelium [59]. A number of studies have shown
enhanced synthesis of MTs in proliferating tissues suggesting its
crucial role in normal and neoplasic cell growth [60] but their
precise role in carcinogenesis is still unclear, once they can also act
as oncosupressor [61]. In several carcinomas indeed, metallothio-
neins are downregulated compared to the tissue of origin [34,62–
65]. In ependymoma, the expression of MT 1-2 has been studied
at diagnosis by immunohistochemistry; MT1-2 positivity was
statistically more frequent in low grade ependymomas and was
associated with a better survival [66]. To the best of our
knowledge, our study is the first one focusing on MT3 and
displaying immunostains for MT3 in brain tumors. Of note, in our
controls consisting of normal adult and fetal brain we observed
prominent immunostaining for MT3 in astrocytes but no staining
in neurons (Figure S2). Since no genomic loss was observed on the
chromosome 16q13 region in our ependymoma samples, this
downregulation was more likely to be linked to transcriptional
inactivation.
Former descriptions of MT3 inhibition by promoter methyla-
tion [34] prompted us to perform a methylation assay on the MT3
gene in ependymomas. No significant hypermethylation was
observed, even if we consider exclusively the intron 1, reported
to be the region abnormally hypermethylated associated with low
MT3 expression in gastric carcinoma cells [44]. The inability of 5-
Aza to restore MT3 expression in EP cells confirmed these data.
Since all metallothioneins were homogeneously downregulated
at recurrence compared to diagnosis, we hypothesized that
chromatin changes in the 16q13 region of the MT genes cluster
could explain their repression. Histone deacetylases can regulate
expression of tumor suppressor genes and activities of transcrip-
tional factors involved in both cancer initiation and progression
through alteration of either DNA or the structural components of
chromatin. We therefore used the prototypic histone deacetylase
inhibitor TSA to modulate MT expression. While MT3 expression
was restored by TSA treatment, this was not the case for MT2A,
shown above to be also dependant on methylation. The TSA effect
could be explained either by inhibition of HDAC1, a known
repressor of MT genes or by opening of the chromatin structure
and upregulation of MTF1[67]. Although the main regulatory
event for MT3 seems to be associated with histone acetylation, the
synergistic effect observed in EP2 by combining TSA and 5-Aza
suggest that other methylated genes or histones maybe indirectly
involved in the regulation of MT3. Histone deacetylase inhibitors
may therefore be interesting drugs in ependymomas.
While the expression of MT3 and MT4 are constitutive and
tissue-specific, MT1 and MT2 expressions are more ubiquitous
and highly inducible by a variety of developmental and
environmental signals, such as metals, oxidative stress, cytokines,
glucocorticoids hormones and irradiation [68]. In this work, we
show the possibility to induce MT3 expression with zinc in brain
tumor (EP and medulloblastoma) cells. However, metal-responsive
element in the promoter of MT3 are not accessible in all EP cells.
Indeed, MT3 has been considered for a long time as a non metal-
inducible gene in normal astrocytes and neurons cultures [69,70],
but recently Wei and co-workers showed MT3 induction after zinc
treatment in prostate cancer cells [71]. Due to poor penetration of
zinc into the brain, modulating MT3 expression in ependymomas
with this cation would need proper formulations.
Several genes involved in the immune system were found to be
downregulated in the common signature of recurrence (Figure 2B,
Table S5); some of them being already reported by Donson et al,
as associated with the absence of recurrence [72]. Our data are
thus consistant with the hypothesis of these authors suggesting a
role for the immune system to prevent recurrence in ependymo-
ma.
Analysis of gene expression profiles specific of each location
pointed out overexpression of genes related to the epithelial-
mesenchymal transition in supratentorial locations [72]. The
overexpression of genes involved in cytoskeleton organization as
well as those involved in cel/cell and cell/matrix interactions could
explain the higher invasive capacities of these tumors at the time of
relapse. Contactin 1 (CNTN1), for example, has already been
proposed as a key factor in glioma dissemination and its expression
tends to be increased in several brain tumours [73]. In addition,
contactin 1 has recognized interactions with developmental
control genes belonging to the Notch pathway [74]. With respect
to the recurrences of posterior fossa ependymomas, the upregula-
tion of ribosomal proteins is consistent with increased proliferation
usually seen in these tumors at recurrence, depicted for example
by increased Ki67 labeling; in medulloblastomas as well, the
overexpression of ribosomal proteins has been shown to be the
hallmark of aggressive tumors[75].
The analysis of genes specifically downregulated at relapse after
radiotherapy identified NKX2-2, a transcription factor involved in
glioma histogenesis [76]. Its repression is associated with the
blockade of oligodendrocyte differentiation [77] and the oncogenic
phenotype of cancer [76].
ConclusionOur data suggests that the gene expression profile of ependymo-
ma shows limited but significant changes upon relapses. This gene
expression profile is only minimally influenced by the treatments
Ependymoma Recurrence Biology
PLoS ONE | www.plosone.org 12 September 2010 | Volume 5 | Issue 9 | e12932

used. However, the changes in expression profile at recurrence were
linked to some extent with the location of the initial tumor. Despite
interindividual variations, ependymoma relapses display a common
gene expression signature that is marked by the upregulation of
kinetochore proteins and downregulation of metallothioneins. The
therapeutic strategies targeting kinesin proteins or those aiming at
restoring metallothionein expression, such as histone deacetylase
inhibitors, deserve further study in these tumours.
Supporting Information
Table S1 Clinical characteristics of the patients. D = diagnosis.
R = recurrence. Delay of relapse in days. BBSFOP =
polychemotherapy protocol, see ref 7. RT = radiotherapy. PF
= posterior fossa, ST = supratentorial, SPI = spinal. DOD =
dead of disease, ADF = alive disease-free, AWD = alive with
disease. Time of follow-up in months.
Found at: doi:10.1371/journal.pone.0012932.s001 (0.03 MB
XLS)
Table S2 Chromosome 9 imbalances differentiating posterior
fossa and supratentorial ependymomas. Corresponding genes are
indicated in the second column.
Found at: doi:10.1371/journal.pone.0012932.s002 (0.18 MB
XLS)
Table S3 List of genes differentially regulated according to
location of the initial tumor. The site of the relapse was not
identical to the initial site in only one case (Pt3).
Found at: doi:10.1371/journal.pone.0012932.s003 (0.16 MB
XLS)
Table S4 List of genes differentially regulated according to the
treatment(s) received. All treatments received between diagnosis
and relapse are considered. Patients having received chemother-
apy and radiotherapy between diagnosis and the relapse
considered are included in the radiotherapy group for the analysis.
Found at: doi:10.1371/journal.pone.0012932.s004 (0.21 MB
XLS)
Table S5 List of genes differentially expressed at recurrence.
Found at: doi:10.1371/journal.pone.0012932.s005 (0.07 MB
XLS)
Figure S1 Ependymoma short-term cultures. Cells were cul-
tured after mechanical dissociation of fresh tumor material kept in
DMEM. Low passages (5th to 15th) were used for the experiments.
Found at: doi:10.1371/journal.pone.0012932.s006 (1.32 MB
DOC)
Figure S2 Metallothionein 3 (MT3) staining of normal brain.
MT3 is detected in the astrocytes but not in the neurons (panel A)
nor in the oligodendrocytes (panel B).
Found at: doi:10.1371/journal.pone.0012932.s007 (3.97 MB TIF)
Figure S3 ASPM staining of ependymomas. ASPM is detected
in the mitotic spindle in every phase of the mitosis, as well as in the
cytoplasm of cells not in mitosis.
Found at: doi:10.1371/journal.pone.0012932.s008 (10.17 MB
TIF)
Figure S4 Comparison of CGHarray profiles at diagnosis and at
relapse. D = diagnosis; R = relapse.
Found at: doi:10.1371/journal.pone.0012932.s009 (0.22 MB TIF)
Figure S5 Chromosomal imbalances that are distinct in
supratentorial and posterior fossa tumors. ST = supratentorial;
PF = posterior fossa.
Found at: doi:10.1371/journal.pone.0012932.s010 (0.20 MB TIF)
Figure S6 Chromosomal changes at relapse according to
treatment received. CT = chemotherapy; RT = radiotherapy;
Surv = surveillance.
Found at: doi:10.1371/journal.pone.0012932.s011 (0.16 MB TIF)
Figure S7 Quantitative PCR of MT2A gene in ependymoma
samples.
Found at: doi:10.1371/journal.pone.0012932.s012 (0.03 MB
DOC)
Acknowledgments
The authors thank:
Clemens Dirven from the Erasmus Universiteit Medisch Zentrum in
Rotterdam for providing some of the samples for the study.
Dr Donald Sens and Dr Scott Garrett from the School of Medicine and
Health Sciences, University of North Dakota, Grand Forks, ND for
providing us the anti-metallothionein 3 antibody.
The ‘‘Centre de Ressources Biologiques’’ of Necker Hospital in Paris,
‘‘NeuroBioTec tumor bank in Lyon and the pathologists of the French
Society of Pediatric Cancer (SFCE) who participated in the constitution of
the tissue-microarray blocks.
Part of this work has been presented at the 2008 Annual Meeting of the
American Society of Clinical Oncology in Chicago, abstract no 10048.
Author Contributions
Conceived and designed the experiments: MP FC CDB PD VL GV JG.
Performed the experiments: MP FC CDB FA LL FD VS PV. Analyzed the
data: MP FC CDB FA LL PV AM PD JG. Contributed reagents/
materials/analysis tools: FC FA SP PV PD VL GV. Wrote the paper: MP
FC CDB FA JG.
References
1. Taylor MD, Poppleton H, Fuller C, Su X, Liu Y, et al. (2005) Radial glia cells
are candidate stem cells of ependymoma. Cancer Cell 8: 323–335.
2. McLendon RE, Wiestler OD, Kros JM (2007) Ependymoma. In: Louis DN, ed.
WHO Classification of Tumours of the Central Nervous System. Lyon: IARC.
pp 74–78.
3. Peris-Bonet R, Martinez-Garcia C, Lacour B, Petrovich S, Giner-Ripoll B, et al.
(2006) Childhood central nervous system tumours–incidence and survival inEurope (1978-1997): report from Automated Childhood Cancer Information
System project. Eur J Cancer 42: 2064–2080.
4. Bouffet E, Perilongo G, Canete A, Massimino M (1998) Intracranial
ependymomas in children: a critical review of prognostic factors and a plea
for cooperation. Med Pediatr Oncol 30: 319–329; discussion 329–331.
5. Wetjen N, Raffel C (2006) Ependymomas. In: Tonn JC WM, Rutka JT,
Grossman SA, eds. Neuro-Oncology of CNS tumors. Berlin Heidelberg:Springer. pp 453–460.
6. Perilongo G, Massimino M, Sotti G, Belfontali T, Masiero L, et al. (1997)Analyses of prognostic factors in a retrospective review of 92 children with
ependymoma: Italian Pediatric Neuro-oncology Group. Med Pediatr Oncol 29:
79–85.
7. Merchant TE, Li C, Xiong X, Kun LE, Boop FA, et al. (2009) Conformal
radiotherapy after surgery for paediatric ependymoma: a prospective study.Lancet Oncol 10: 258–266.
8. van Veelen-Vincent ML, Pierre-Kahn A, Kalifa C, Sainte-Rose C, Zerah M,
et al. (2002) Ependymoma in childhood: prognostic factors, extent of surgery,and adjuvant therapy. J Neurosurg 97: 827–835.
9. Figarella-Branger D, Civatte M, Bouvier-Labit C, Gouvernet J, Gambarelli D,et al. (2000) Prognostic factors in intracranial ependymomas in children.
J Neurosurg 93: 605–613.
10. Grill J, Le Deley MC, Gambarelli D, Raquin MA, Couanet D, et al. (2001)
Postoperative chemotherapy without irradiation for ependymoma in children
under 5 years of age: a multicenter trial of the French Society of PediatricOncology. J Clin Oncol 19: 1288–1296.
11. Grundy RG, Wilne SA, Weston CL, Robinson K, Lashford LS, et al. (2007)Primary postoperative chemotherapy without radiotherapy for intracranial
ependymoma in children: the UKCCSG/SIOP prospective study. Lancet Oncol8: 696–705.
12. Modena P, Lualdi E, Facchinetti F, Veltman J, Reid JF, et al. (2006)
Identification of tumor-specific molecular signatures in intracranial ependymo-
Ependymoma Recurrence Biology
PLoS ONE | www.plosone.org 13 September 2010 | Volume 5 | Issue 9 | e12932
ma and association with clinical characteristics. J Clin Oncol 24: 5223–
5233.
13. Kilday JP, Rahman R, Dyer S, Ridley L, Lowe J, et al. (2009) Pediatric
ependymoma: biological perspectives. Mol Cancer Res 7: 765–786.
14. Palm T, Figarella-Branger D, Chapon F, Lacroix C, Gray F, et al. (2009)
Expression profiling of ependymomas unravels localization and tumor grade-
specific tumorigenesis. Cancer 115: 3955–3968.
15. Donson AM, Birks DK, Barton VN, Wei Q, Kleinschmidt-Demasters BK, et al.
(2009) Immune gene and cell enrichment is associated with a good prognosis in
ependymoma. J Immunol 183: 7428–7440.
16. Korshunov A, Witt H, Hielscher T, Benner A, Remke M, et al. (2010) Molecular
Staging of Intracranial Ependymoma in Children and Adults. J Clin Oncol 28:
3182–3190.
17. Hamilton RL, Pollack IF (1997) The molecular biology of ependymomas. Brain
Pathol 7: 807–822.
18. Hayama S, Daigo Y, Kato T, Ishikawa N, Yamabuki T, et al. (2006) Activation
of CDCA1-KNTC2, members of centromere protein complex, involved in
pulmonary carcinogenesis. Cancer Res 66: 10339–10348.
19. Hirose Y, Aldape K, Bollen A, James CD, Brat D, et al. (2001) Chromosomal
abnormalities subdivide ependymal tumors into clinically relevant groups.
Am J Pathol 158: 1137–1143.
20. Mendrzyk F, Korshunov A, Benner A, Toedt G, Pfister S, et al. (2006)
Identification of gains on 1q and epidermal growth factor receptor overexpres-
sion as independent prognostic markers in intracranial ependymoma. Clin
Cancer Res 12: 2070–2079.
21. Sowar K, Straessle J, Donson AM, Handler M, Foreman NK (2006) Predicting
which children are at risk for ependymoma relapse. J Neurooncol 78: 41–46.
22. Suarez-Merino B, Hubank M, Revesz T, Harkness W, Hayward R, et al. (2005)
Microarray analysis of pediatric ependymoma identifies a cluster of 112
candidate genes including four transcripts at 22q12.1-q13.3. Neuro Oncol 7:
20–31.
23. Tabori U, Ma J, Carter M, Zielenska M, Rutka J, et al. (2006) Human telomere
reverse transcriptase expression predicts progression and survival in pediatric
intracranial ependymoma. J Clin Oncol 24: 1522–1528.
24. Bortolotto S, Chiado-Piat L, Cavalla P, Bosone I, Mauro A, et al. (2001)
CDKN2A/p16 in ependymomas. J Neurooncol 54: 9–13.
25. Alonso ME, Bello MJ, Arjona D, Gonzalez-Gomez P, Lomas J, et al. (2002)
Analysis of the NF2 gene in oligodendrogliomas and ependymomas. Cancer
Genet Cytogenet 134: 1–5.
26. Schneider D, Monoranu CM, Huang B, Rutkowski S, Gerber NU, et al. (2009)
Pediatric supratentorial ependymomas show more frequent deletions on
chromosome 9 than infratentorial ependymomas: a microsatellite analysis.
Cancer Genet Cytogenet 191: 90–96.
27. Ridley L, Rahman R, Brundler MA, Ellison D, Lowe J, et al. (2008)
Multifactorial analysis of predictors of outcome in pediatric intracranial
ependymoma. Neuro Oncol 10: 675–689.
28. Snuderl M, Chi SN, De Santis SM, Stemmer-Rachamimov AO, Betensky RA,
et al. (2008) Prognostic value of tumor microinvasion and metalloproteinases
expression in intracranial pediatric ependymomas. J Neuropathol Exp Neurol
67: 911–920.
29. Lukashova-v Zangen I, Kneitz S, Monoranu CM, Rutkowski S, Hinkes B, et al.
(2007) Ependymoma gene expression profiles associated with histological
subtype, proliferation, and patient survival. Acta Neuropathol 113: 325–337.
30. Puget S, Grill J, Valent A, Bieche I, Dantas-Barbosa C, et al. (2009) Candidate
Genes on Chromosome 9q33-34 Involved in the Progression of Childhood
Ependymomas. J Clin Oncol 27: 1884–1892.
31. Lu R, Lee GC, Shultz M, Dardick C, Jung K, et al. (2008) Assessing probe-
specific dye and slide biases in two-color microarray data. BMC Bioinformatics
9: 314.
32. Martin-Magniette ML, Aubert J, Cabannes E, Daudin JJ (2005) Evaluation of
the gene-specific dye bias in cDNA microarray experiments. Bioinformatics 21:
1995–2000.
33. t Hoen PA, Turk R, Boer JM, Sterrenburg E, de Menezes RX, et al. (2004)
Intensity-based analysis of two-colour microarrays enables efficient and flexible
hybridization designs. Nucleic Acids Res 32: e41.
34. Smith E, Drew PA, Tian ZQ, De Young NJ, Liu JF, et al. (2005)
Metallothionien 3 expression is frequently down-regulated in oesophageal
squamous cell carcinoma by DNA methylation. Mol Cancer 4: 42.
35. Grill J, Avet-Loiseau H, Lellouch-Tubiana A, Sevenet N, Terrier-Lacombe MJ,
et al. (2002) Comparative genomic hybridization detects specific cytogenetic
abnormalities in pediatric ependymomas and choroid plexus papillomas. Cancer
Genet Cytogenet 136: 121–125.
36. Sharma MK, Mansur DB, Reifenberger G, Perry A, Leonard JR, et al. (2007)
Distinct genetic signatures among pilocytic astrocytomas relate to their brain
region origin. Cancer Res 67: 890–900.
37. L’Esperance S, Popa I, Bachvarova M, Plante M, Patten N, et al. (2006) Gene
expression profiling of paired ovarian tumors obtained prior to and following
adjuvant chemotherapy: molecular signatures of chemoresistant tumors.
Int J Oncol 29: 5–24.
38. Liu CJ, Liu TY, Kuo LT, Cheng HW, Chu TH, et al. (2008) Differential gene
expression signature between primary and metastatic head and neck squamous
cell carcinoma. J Pathol 214: 489–497.
39. Ki DH, Jeung HC, Park CH, Kang SH, Lee GY, et al. (2007) Whole genomeanalysis for liver metastasis gene signatures in colorectal cancer. Int J Cancer
121: 2005–2012.
40. Ramaswamy S, Ross KN, Lander ES, Golub TR (2003) A molecular signature
of metastasis in primary solid tumors. Nat Genet 33: 49–54.
41. Sousa JF, Espreafico EM (2008) Suppression subtractive hybridization profiles of
radial growth phase and metastatic melanoma cell lines reveal novel potential
targets. BMC Cancer 8: 19.
42. Michiels S, Koscielny S, Hill C (2007) Interpretation of microarray data in
cancer. Br J Cancer 96: 1155–1158.
43. Glinsky GV, Berezovska O, Glinskii AB (2005) Microarray analysis identifies a
death-from-cancer signature predicting therapy failure in patients with multipletypes of cancer. J Clin Invest 115: 1503–1521.
44. Corson TW, Gallie BL (2006) KIF14 mRNA expression is a predictor of gradeand outcome in breast cancer. Int J Cancer 119: 1088–1094.
45. Corson TW, Huang A, Tsao MS, Gallie BL (2005) KIF14 is a candidateoncogene in the 1q minimal region of genomic gain in multiple cancers.
Oncogene 24: 4741–4753.
46. Corson TW, Zhu CQ, Lau SK, Shepherd FA, Tsao MS, et al. (2007) KIF14
messenger RNA expression is independently prognostic for outcome in lungcancer. Clin Cancer Res 13: 3229–3234.
47. Bond J, Roberts E, Mochida GH, Hampshire DJ, Scott S, et al. (2002) ASPM is
a major determinant of cerebral cortical size. Nat Genet 32: 316–320.
48. Muller C, Gross D, Sarli V, Gartner M, Giannis A, et al. (2007) Inhibitors of
kinesin Eg5: antiproliferative activity of monastrol analogues against humanglioblastoma cells. Cancer Chemother Pharmacol 59: 157–164.
49. Chin GM, Herbst R (2006) Induction of apoptosis by monastrol, an inhibitor ofthe mitotic kinesin Eg5, is independent of the spindle checkpoint. Mol Cancer
Ther 5: 2580–2591.
50. Valensin S, Ghiron C, Lamanna C, Kremer A, Rossi M, et al. (2009) KIF11
inhibition for glioblastoma treatment: reason to hope or a struggle with thebrain? BMC Cancer 9: 196.
51. Cherian MG, Jayasurya A, Bay BH (2003) Metallothioneins in human tumorsand potential roles in carcinogenesis. Mutat Res 533: 201–209.
52. Yap X, Tan HY, Huang J, Lai Y, Yip GW, et al. (2008) Over-expression ofmetallothionein predicts chemoresistance in breast cancer. J Pathol 217:
563–570.
53. Satoh M, Cherian MG, Imura N, Shimizu H (1994) Modulation of resistance toanticancer drugs by inhibition of metallothionein synthesis. Cancer Res 54:
5255–5257.
54. Sato M, Bremner I (1993) Oxygen free radicals and metallothionein. Free Radic
Biol Med 14: 325–337.
55. Uchida Y, Takio K, Titani K, Ihara Y, Tomonaga M (1991) The growth
inhibitory factor that is deficient in the Alzheimer’s disease brain is a 68 aminoacid metallothionein-like protein. Neuron 7: 337–347.
56. Hidalgo J, Aschner M, Zatta P, Vasak M (2001) Roles of the metallothioneinfamily of proteins in the central nervous system. Brain Res Bull 55: 133–145.
57. Garrett SH, Sens MA, Todd JH, Somji S, Sens DA (1999) Expression of MT-3protein in the human kidney. Toxicol Lett 105: 207–214.
58. Ebadi M, Iversen PL, Hao R, Cerutis DR, Rojas P, et al. (1995) Expression andregulation of brain metallothionein. Neurochem Int 27: 1–22.
59. Quaife CJ, Findley SD, Erickson JC, Froelick GJ, Kelly EJ, et al. (1994)
Induction of a new metallothionein isoform (MT-IV) occurs during differenti-ation of stratified squamous epithelia. Biochemistry 33: 7250–7259.
60. Thirumoorthy N, Manisenthil Kumar KT, Shyam Sundar A, Panayappan L,Chatterjee M (2007) Metallothionein: an overview. World J Gastroenterol 13:
993–996.
61. Ferrario C, Lavagni P, Gariboldi M, Miranda C, Losa M, et al. (2008)
Metallothionein 1G acts as an oncosupressor in papillary thyroid carcinoma.Lab Invest 88: 474–481.
62. Deng D, El-Rifai W, Ji J, Zhu B, Trampont P, et al. (2003) Hypermethylation ofmetallothionein-3 CpG island in gastric carcinoma. Carcinogenesis 24: 25–29.
63. Dalgin GS, Drever M, Williams T, King T, DeLisi C, et al. (2008) Identificationof novel epigenetic markers for clear cell renal cell carcinoma. J Urol 180:
1126–1130.
64. Zhong S, Fields CR, Su N, Pan YX, Robertson KD (2007) Pharmacologic
inhibition of epigenetic modifications, coupled with gene expression profiling,
reveals novel targets of aberrant DNA methylation and histone deacetylation inlung cancer. Oncogene 26: 2621–2634.
65. Henrique R, Jeronimo C, Hoque MO, Nomoto S, Carvalho AL, et al. (2005)MT1G hypermethylation is associated with higher tumor stage in prostate
cancer. Cancer Epidemiol Biomarkers Prev 14: 1274–1278.
66. Korshunov A, Sycheva R, Timirgaz V, Golanov A (1999) Prognostic value of
immunoexpression of the chemoresistance-related proteins in ependymomas: ananalysis of 76 cases. J Neurooncol 45: 219–227.
67. Ghoshal K, Datta J, Majumder S, Bai S, Dong X, et al. (2002) Inhibitors of
histone deacetylase and DNA methyltransferase synergistically activate themethylated metallothionein I promoter by activating the transcription factor
MTF-1 and forming an open chromatin structure. Mol Cell Biol 22: 8302–8319.
68. Haq F, Mahoney M, Koropatnick J (2003) Signaling events for metallothionein
induction. Mutat Res 533: 211–226.
69. Kramer KK, Liu J, Choudhuri S, Klaassen CD (1996) Induction of
metallothionein mRNA and protein in murine astrocyte cultures. Toxicol ApplPharmacol 136: 94–100.
Ependymoma Recurrence Biology
PLoS ONE | www.plosone.org 14 September 2010 | Volume 5 | Issue 9 | e12932

70. Kramer KK, Zoelle JT, Klaassen CD (1996) Induction of metallothionein
mRNA and protein in primary murine neuron cultures. Toxicol Appl
Pharmacol 141: 1–7.
71. Wei H, Desouki MM, Lin S, Xiao D, Franklin RB, et al. (2008) Differential
expression of metallothioneins (MTs) 1, 2, and 3 in response to zinc treatment in
human prostate normal and malignant cells and tissues. Mol Cancer 7: 7.
72. Voulgari A, Pintzas A (2009) Epithelial-mesenchymal transition in cancer
metastasis: mechanisms, markers and strategies to overcome drug resistance in
the clinic. Biochim Biophys Acta 1796: 75–90.
73. Rome C, Loiseau H, Arsaut J, Roullot V, Couillaud F (2006) Diversity of
contactin mRNA in human brain tumors. Mol Carcinog 45: 774–785.
74. Bizzoca A, Corsi P, Gennarini G (2009) The mouse F3/contactin glycoprotein:
Structural features, functional properties and developmental significance of itsregulated expression. Cell Adh Migr 3: 53–63.
75. Pomeroy SL, Tamayo P, Gaasenbeek M, Sturla LM, Angelo M, et al. (2002)
Prediction of central nervous system embryonal tumour outcome based on geneexpression. Nature 415: 436–442.
76. Colin C, Virard I, Baeza N, Tchoghandjian A, Fernandez C, et al. (2007)Relevance of combinatorial profiles of intermediate filaments and transcription
factors for glioma histogenesis. Neuropathol Appl Neurobiol 33: 431–439.
77. Qi Y, Cai J, Wu Y, Wu R, Lee J, et al. (2001) Control of oligodendrocytedifferentiation by the Nkx2.2 homeodomain transcription factor. Development
128: 2723–2733.
Ependymoma Recurrence Biology
PLoS ONE | www.plosone.org 15 September 2010 | Volume 5 | Issue 9 | e12932