portland transportation hub link feasibility study final
TRANSCRIPT
Portland Transportation Hub Link Feasibility Study
FINAL REPORT
May 2016


PORTLAND TRANSPORTATION HUB LINK FEASIBILITY STUDY
FINAL REPORT
Nelson\Nygaard Consulting Associates, Inc.
Table of Contents
Page
1 Executive Summary ............................................................................................................. i Background and Purpose ........................................................................................................................... i Alignments ..................................................................................................................................................... i Evaluation and Recommendations ............................................................................................................ i
2 Background ......................................................................................................................... 1
3 Inventory of Hubs and Services .......................................................................................... 2 Portland International Jetport ................................................................................................................. 2 Portland Transportation Center .............................................................................................................. 3 Casco Bay Lines Ferry Terminal and Ocean Gateway Cruise Ship Terminal ............................... 3 METRO Pulse ............................................................................................................................................... 4
4 Potential Hub Link Alignments ........................................................................................... 6 Phase I: PTC/Thompson’s Point to Ferry Terminal ............................................................................... 6 Phase II: PTC/Thompson’s Point to Jetport .......................................................................................... 12
5 Public Involvement ........................................................................................................... 16 Key Themes ............................................................................................................................................... 16
6 Evaluation ........................................................................................................................ 17 Connectivity ............................................................................................................................................... 17 Mobility ...................................................................................................................................................... 22 Economic Development ........................................................................................................................... 29 Cost Effectiveness..................................................................................................................................... 35
7 Evaluation Summary ........................................................................................................ 37 Recommendations .................................................................................................................................... 39
8 Funding Considerations .................................................................................................... 45 The Market for hub Link Service ........................................................................................................... 46
9 Appendix .......................................................................................................................... 50 Public Outreach Summary ...................................................................................................................... 50 Public Involvement Events ....................................................................................................................... 51 Stakeholder Focus Group ....................................................................................................................... 51 Public Meeting .......................................................................................................................................... 51 What We Heard ..................................................................................................................................... 52 Overview of Comments .......................................................................................................................... 54 Stakeholder Focus Group ....................................................................................................................... 54 Public Meeting .......................................................................................................................................... 56 Intercept Survey Questions .................................................................................................................... 57

PORTLAND TRANSPORTATION HUB LINK FEASIBILITY STUDY
FINAL REPORT
Nelson\Nygaard Consulting Associates, Inc. | i
1 EXECUTIVE SUMMARY
BACKGROUND AND PURPOSE
Portland is a multi-modal community, enjoying high quality regional bus, rail, ferry, and airline
services. However, Portland’s transportation hubs are mostly on the periphery of its urban core
and geographically dispersed. This geographic separation makes connections between modes
inconvenient and difficult. The aim of this study is to identify alternatives to conveniently link
Portland’s transportation hubs. The proposed “Hub Link” service would play a key role in
Portland’s effort to bolster transit use and foster car-free travel options for both visitors and
residents by connecting the Jetport, Portland Transportation Center (PTC), and the Casco Bay
Ferry Terminal / Ocean Gateway.
ALIGNMENTS
The Hub Link was analyzed in two sections: Phase I from the PTC to the ferry terminals, and
Phase II, from Jetport to PTC. The alternatives considered for Phase I are as follows:
I-A: PTC to Ferry Terminal via I-295
I-B: PTC to Ferry Terminal via Congress Street
I-C: PTC to Ferry Terminal via Commercial Street
I-D: PTC to Ferry Terminal via Congress and Commercial Street
I-E: PTC to Ferry Terminal via Park Avenue
For Phase II, the alignment was the same for each alternative (reflecting the limited travel options
between the Jetport and the PTC), but differed in the level of transit priority treatments
considered for the corridor. Alternative II-A assumed no transit priority improvements, while II-B
would have transit signal prioritization and queue jump lanes.
EVALUATION AND RECOMMENDATIONS
Four major objectives guided the evaluation process:
Connectivity: effectively linking Portland’s major transportation hubs and facilitating
multi-modal connections
Mobility: contributing to the overall mobility of the region by integrating well into the
existing and planned services
Economic Development: supporting access to key activity centers and development
sites
Cost Effectiveness: making the most of available funding sources

PORTLAND TRANSPORTATION HUB LINK FEASIBILITY STUDY
FINAL REPORT
Nelson\Nygaard Consulting Associates, Inc. | ii
Based on of these objectives, Alternative I-B (PTC to Ferry Terminal via Congress
Street), which connects the PTC, Jetport, and ferry terminals, while also serving the METRO
Pulse transit center and Greyhound intercity bus terminal, performed best and was deemed the
recommended alternative for Phase I. For Phase II between Jetport and PTC, Alternative II-B,
which includes transit priority treatments, rates the highest. However, given the strong sentiment
expressed at public meetings to start small and demonstrate success first, Alternative II-A
(PTC/Thompson’s Point to Jetport with No Corridor Treatments) was recommended
above the more-difficult-to-implement Alternative II-B.

PORTLAND TRANSPORTATION HUB LINK FEASIBILITY STUDY
FINAL REPORT
Nelson\Nygaard Consulting Associates, Inc. | 1
2 BACKGROUND Portland, ME has established itself as one of the most “livable” communities in the United States.
This reputation has attracted new residents to the area, and spurred a vibrant and growing
tourism industry. Portland’s economic success, including its status as a tourist destination, is
supported by multiple transportation hubs that foster travel to, from, and within the region.
Portland is a multi-modal community. The city enjoys high quality regional bus, rail, ferry, and
airline services. However, for practical reasons, Portland’s transportation hubs are mostly located
on the periphery of its urban core, separated from key destinations in the city and from one
another. This geographic separation makes multi-modal connections complicated. For example,
seasonal visitors to the Portland region may arrive by plane, but have a final destination on one of
Portland’s many island communities located off-shore in Casco Bay. In this scenario,
arrangements would need to be made for transportation between Portland’s International
Jetport, west of downtown, and the Casco Bay Lines Ferry Terminal on the eastern edge of
downtown. Similarly, upcoast residents of Maine may find it easier to fly out of Boston than
Portland because intercity bus service is available directly to Logan Airport, while a taxi or
multiple bus connections are required to get from the Portland Transportation Center to the
Portland International Jetport.
The aim of this study is to identify several alternatives to conveniently link Portland’s
transportation hubs, and to provide analysis on the relative strengths of each alternative. The
proposed “Hub Link” service would play a key role in Portland’s efforts to bolster transit use and
foster car-free travel options for visitors and residents alike. Throughout, the study is informed by
input from stakeholders representing the respective hubs, and members of the public who
participated in various public meetings and intercept surveys.
Central to the development of a Hub Link service is the Thompson’s Point Transit Oriented
Development Tax Increment Financing (TIF) District. The District was established in 2011 to
support the new Thompson’s Point mixed-use development, located adjacent to the Portland
Transportation Center (PTC), and to improve and expand transit connections between
Thompson’s Point/PTC and the other transportation and commercial hubs in the region. In
pursuing the Hub Link Study, the goal is for the Hub Link service to be designed and ready to
begin operation in time to utilize TIF District funds from the first year of revenue capture.
However, given the inherent uncertainty of the pace of TIF revenue capture, Hub Link service
could be implemented in phases and funded in part, or in full, by other funding sources.

PORTLAND TRANSPORTATION HUB LINK FEASIBILITY STUDY
FINAL REPORT
Nelson\Nygaard Consulting Associates, Inc. | 2
3 INVENTORY OF HUBS AND SERVICES
As a first step toward assessing various options for linking Portland’s multiple transportation
hubs, the study team developed a comprehensive inventory of each hub, including the location of
the facility, the transportation services available at the hub, and the approximate volume of
passengers that flows through the hub daily. The following chapter focuses on the characteristics
of the Portland International Jetport, the Portland Transportation Center, the METRO Pulse, and
the Casco Bay Island Transit District (CBITD) Ferry Terminal.
PORTLAND INTERNATIONAL JETPORT
The Portland International Jetport is located in southwest Portland, approximately four miles
west of downtown (see Figure 1). The airport is served by five major airlines and offers direct
service to ten east coast and Midwest hubs.
Figure 1 Shortest Travel Distance between Jetport and Other Hubs
Hub Miles
Portland Transportation Center 2.5
METRO Pulse 3.9
CBITD Ferry Terminal 4.5
Air traffic into and out of Portland varies by time of year. Approximately 25 flights per day depart
the Jetport during the winter months, compared to 35 daily departures in the summer, with
similar arrival activity. In summer, the number of enplanements peaks in August, with close to
96,000 monthly boardings. During the winter months, enplanements drop to roughly 48,000 per
month in January and February.
The airport has short-term hourly parking, as well as a long term parking garage. Parking fees are
$2 per hour and $12 daily. Jetport staff is currently evaluating the possibility of raising the long-
term parking rate to $13 per day.
Numerous ground transportation options are also available at the Jetport, including courtesy
shuttles to area hotels and on-site car rental services. The average cost of a taxi ride between the
airport and downtown Portland (using the “METRO Pulse” downtown transit center as the
destination) is $20. Uber service from the airport to the same destination is approximately $15.
METRO Transit Route 5 provides service between the Jetport and METRO Pulse every 40-50
minutes on Weekdays and Saturdays, from approximately 6:00 AM to 10:00 PM. Sunday service

PORTLAND TRANSPORTATION HUB LINK FEASIBILITY STUDY
FINAL REPORT
Nelson\Nygaard Consulting Associates, Inc. | 3
to the Jetport will begin on Route 5 in August 2015. One-way fares are $1.50, with various
discounts available for qualified individuals, as well as multi-ride passes.
Besides being a transportation hub, the Jetport is a major economic hub for Portland, with nearly
1,000 badged employees, including over 100 TSA workers.
PORTLAND TRANSPORTATION CENTER
The Portland Transportation Center (PTC) is the city’s terminal for Amtrak’s Downeaster service
to Boston and Brunswick, as well as Concord Coach Lines intercity buses to northern Maine, New
Hampshire, and Massachusetts. The PTC is located approximately half-way between the Portland
Jetport and downtown Portland (see Figure 2).
Figure 2 Shortest Travel Distance between Portland Transportation Center and Other Hubs
Hub Miles
Portland International Jetport 2.5
METRO Pulse 2.0
CBITD Ferry Terminal 2.9
Amtrak has five trains per day operating between Boston and Portland, with two trips per day
continuing to Brunswick. There are 171,400 annual rail boardings at this station, or more than
14,000 boardings per month on average. Alightings are comparable.
Concord Coach Lines serves Portland with between 22 and 29 trips per day, depending on the
season. Most trips travel between Portland and Boston South Station or Boston Logan
International Airport (with some trips serving both). Select trips also serve the Maine cities of
Augusta, Brunswick, Bangor, and Orono. In total, 500,000 annual coach boardings, or an average
of nearly 42,000 per month, occur at Portland Transportation Center.
Parking is available at the PTC for $4 per day. Taxi and Uber service is available at the PTC, and
trips downtown typically range between $7 and $10. Service from the PTC to downtown Portland
is also available via METRO Transit Route 1, which operates between the PTC and METRO Pulse
every 30 minutes on Weekdays and Saturdays, from approximately 5:00 AM to 9:00 PM and
hourly until 11:00 PM. On Sundays, Route 5 replaces Route 1, providing service every 30 to 50
minutes between 9:00 and 6:30 PM. One-way fares are $1.50, with various discounts available for
qualified individuals, as well as multi-ride passes.
CASCO BAY LINES FERRY TERMINAL AND OCEAN GATEWAY CRUISE SHIP TERMINAL
The Casco Bay Lines Ferry Terminal is located near Commercial Street and Franklin Street in
downtown Portland. Ferries depart frequently from the terminal to Portland’s island
communities, and are used by both residents and visitors. The ferry terminal is located less than
one mile from the METRO Pulse, and 4.5 miles from the Portland International Jetport (see
Figure 3).

PORTLAND TRANSPORTATION HUB LINK FEASIBILITY STUDY
FINAL REPORT
Nelson\Nygaard Consulting Associates, Inc. | 4
Figure 3 Shortest Travel Distance between Casco Bay Ferry Terminal and Other Hubs
Hub Miles
Portland Transportation Center 2.9
Portland International Jetport 4.5
METRO Pulse 0.7
Casco Bay Lines offers service to Peaks, Little Diamond, Diamond Cove, Chebeague, Cliff, and
Long Island. While ridership fluctuates heavily depending on the season (up to 195,500 total
riders in August versus a low of 34,500 in February), the number of scheduled trips remains
relatively constant throughout the year. Peaks Island normally has 16 daily departures during the
summer season and 14 departures during winter, while the Down Bay islands are served six times
daily during summer months and four times daily in the winter.
The Ocean Gateway Cruise Ship Terminal is located two blocks away at Thames and Hancock
Street, and has three berths for cruise ships stopping in Portland. The cruise ship season begins in
mid-May and ends at the beginning of November. The peak number of departures occurs in
September, with 27 scheduled departures during the month. Larger cruise ships can carry up to
3,600 passengers with an additional 1,360 crew.
The Nova Star Cruise connects Portland to Yarmouth, Nova Scotia daily from June to October.
The ferry arrives at the Ocean Gateway Terminal at 6:30 PM and departs at 8:00 PM. Ridership
fluctuates between each month and has also varied year by year. This year, the Nova Star Cruise
carried 8,507, 13,319, and 15,974 passengers in June, July, and August respectively. This is
somewhat down from 2014, when ridership peaked at 20,500 in August.
Neither the Casco Bay Lines Ferry Terminal nor the Ocean Gateway Cruise Ship Terminal
provides any long-term parking. Several parking facilities are located within walking distance of
the cruise and ferry terminals, and most allow for long-term parking. However, these facilities
tend to fill up quickly in summer months.
The Casco Bay Lines Ferry Terminal is served by METRO Route 8, with service to the METRO
Pulse every 30 minutes on weekdays from 6:45 AM to 6:00 PM, and every 50 minutes on
Saturdays from 8:00 AM to 6:15 PM. Sunday service on Route 8 will begin in August 2015. One-
way fares are $1.50, with various discounts available for qualified individuals, as well as multi-
ride passes.
METRO PULSE
The METRO Pulse, located on Elm Street near Congress Street, is the main hub for local bus
service in Portland. Six of METRO’s eight bus routes serve the transit center (Route 1 and 8 have
stops about a block away). In addition to facilitating transfers between routes, METRO Pulse
offers an enclosed waiting space with restrooms and passenger information. The facility is
approximately two miles from the PTC and four miles from the Jetport (see Figure 4).

PORTLAND TRANSPORTATION HUB LINK FEASIBILITY STUDY
FINAL REPORT
Nelson\Nygaard Consulting Associates, Inc. | 5
Figure 4 Shortest Travel Distance between Metro Pulse and Other Hubs
Hub Miles
Portland Transportation Center 2.0
Portland International Jetport 3.9
CBITD Ferry Terminal 0.7
Nearly 900 METRO passengers per weekday board buses at the METRO Pulse. One-way fares on
all METRO routes are $1.50, with various discounts available for qualified individuals, as well as
multi-ride passes.

PORTLAND TRANSPORTATION HUB LINK FEASIBILITY STUDY
FINAL REPORT
Nelson\Nygaard Consulting Associates, Inc. | 6
4 POTENTIAL HUB LINK ALIGNMENTS Like most cities, Portland has a diversity of built environments reflecting the city’s history and
geography. South and east of I-295, the city has a grid system of streets with relatively short
blocks. Outside of I-295, the roadway network is more hierarchical, with smaller arterials feeding
into larger ones, and fewer options for cross-town travel. Thus, there are several viable routing
alternatives for service between the Casco Bay Lines Ferry Terminal and the Portland
Transportation Center, but only one realistic option for service between the PTC and Jetport.
The following chapter presents potential Hub Link alignments in two phases: Phase I focuses on
service between the ferry terminal and the PTC, and Phase II focuses on connecting the PTC to
the Jetport. The two phases could be implemented concurrently, or individually (and in no
particular order), but they are presented separately in this chapter due to the different operating
environments that each phase represents.
PHASE I: PTC/THOMPSON’S POINT TO FERRY TERMINAL
Alternative I-A: PTC/Thompson’s Point to Ferry Terminal via I-295
Alternative I-A would connect the Casco Bay Lines Ferry Terminal to the Portland Transportation
Center via Franklin Street and I-295 (see Figure 5).
Figure 5 Alternative I-A: Alignment

PORTLAND TRANSPORTATION HUB LINK FEASIBILITY STUDY
FINAL REPORT
Nelson\Nygaard Consulting Associates, Inc. | 7
The average operating speed for this alignment is estimated to be 20 mph (see Figure 6). This
relatively high speed reflects the fact that more than half of the route is on a freeway, and thus
would operate without stops.
Figure 6 Alternative I-A: Operating Statistics
Operating Statistics
Length 2.9 miles
Average Speed 20 mph
Roundtrip travel time 17 minutes
Given the route’s length and estimated operating speed, a round trip on this alignment would take
approximately 17 minutes. Thus, a single vehicle could provide service every 20 minutes with 3
minutes of “recovery” time. Recovery time is the time between the end of one trip and the start of
the next. This time is used both as a buffer to ensure that a bus that is running late on one trip
does not impact the on-time performance of the next trip, and as an opportunity for drivers to
take a brief rest. However, recovery time of less than five minutes can be risky, especially for a
route that may serve a significant number of tourists and visitors, as these riders tend to take
longer to board and alight transit vehicles, resulting in longer dwell times at each stop. Figure 7
shows the number of vehicles required to provide various service frequencies on this route, as well
as the resulting recovery times.
Figure 7 Alternative I-A: Operating Requirements
Frequency Bus Requirement Recovery Time
30 minutes 1 13 minutes
20 minutes 1 3 minutes
15 minutes 2 13 minutes
10 minutes 2 3 minutes
Alternative I-B: PTC/Thompson’s Point to Ferry Terminal via Congress Street
Alternative I-B would connect the Casco Bay Lines Ferry Terminal with the PTC via Congress
Street (see Figure 8). West of St. John Street, Congress Street is designated as one-way
(eastbound). Under this routing alternative, westbound buses would travel north on Weymouth
Street and west on Park Avenue to Fore River Parkway and the PTC. Alternative I-B would also
provide proximate service to the METRO Pulse, as well as the Greyhound terminal at Congress
and St. John Street.

PORTLAND TRANSPORTATION HUB LINK FEASIBILITY STUDY
FINAL REPORT
Nelson\Nygaard Consulting Associates, Inc. | 8
Figure 8 Alternative I-B: Alignment
The estimated average operating speed for this alternative is 12 mph (see Figure 9), which is the
typical operating speed of bus service in an urban environment. As a result, a single vehicle could
provide roundtrip service along this alignment every 30 minutes with 3 minutes for recovery,
while two vehicles could provide service every 20 minutes with 13 minutes of recovery (see Figure
10).
Figure 9 Alternative I-B: Operating Statistics
Operating Statistics
Length 2.7 miles
Average Speed 12 mph
Roundtrip travel time 27 minutes
Figure 10 Alternative I-B: Operating Requirements
Frequency Bus Requirement Recovery Time
30 minutes 1 3 minutes
20 minutes 2 13 minutes
15 minutes 2 3 minutes
10 minutes 3 3 minutes

PORTLAND TRANSPORTATION HUB LINK FEASIBILITY STUDY
FINAL REPORT
Nelson\Nygaard Consulting Associates, Inc. | 9
Alternative I-C: PTC/Thompson’s Point to Ferry Terminal via Commercial Street
Alternative I-C would connect the PTC with the Casco Bay Lines Ferry Terminal via Commercial
Street (see Figure 11). As a result, neither the METRO Pulse nor the Greyhound terminal would be
served. Although Alternative I-C is slightly longer than Alternative I-B, average operating speeds
for the alignment would be faster during most times of the day (see Figure 12). Commercial Street
is generally wider than Congress Street, and has fewer intersections, fewer traffic lights, and less
development (at least west of the Casco Bay Bridge). It does, however, experience congestion
during peak periods when it serves as a primary gateway to downtown Portland for I-295
commuters from the south.
Figure 11 Alternative I-C: Alignment
A single vehicle could provide 30-minute service frequency along the alignment shown in
Alternative I-C with five minutes for recovery. Two vehicles could provide service every 15 or 20
minutes, with either five or 15 minutes of recovery time for each vehicle per trip, depending on
the scenario (see
Figure 13).
Figure 12 Alternative I-C: Operating Statistics
Operating Statistics
Length 3.2 miles
Average Speed 15 mph
Roundtrip travel time 25 minutes

PORTLAND TRANSPORTATION HUB LINK FEASIBILITY STUDY
FINAL REPORT
Nelson\Nygaard Consulting Associates, Inc. | 10
Figure 13 Alternative I-C: Operating Requirements
Frequency Bus Requirement Recovery Time
30 minutes 1 5 minutes
20 minutes 2 15 minutes
15 minutes 2 5 minutes
10 minutes 3 5 minutes
Alternative I-D: PTC/Thompson’s Point to Ferry Terminal via
Congress and Commercial Street
Alternative I-D is a hybrid of Alternatives I-B and I-C, operating on Congress Street for most of
the alignment, but also serving the most densely developed section of Commercial Street between
Union Street and the Casco Bay Lines Ferry Terminal (see Figure 14). Under this scenario,
Temple/Union Street would bridge the Congress and Commercial Street corridors, allowing for
service to be provided to the ferry terminal, METRO Pulse, Greyhound terminal, and PTC.
Figure 14 Alternative I-D: Alignment
The length of this alignment, combined with an estimated average operating speed of 12 mph,
results in a 30-minute roundtrip travel time (see Figure 15). While 30-minute service frequency
could theoretically be provided with one vehicle, no time would be left over for recovery. Two
vehicles could provide service every 20 minutes, with ten minutes of recovery time for each
vehicle per trip (see Figure 16).
PORTLAND TRANSPORTATION HUB LINK FEASIBILITY STUDY
FINAL REPORT
Nelson\Nygaard Consulting Associates, Inc. | 11
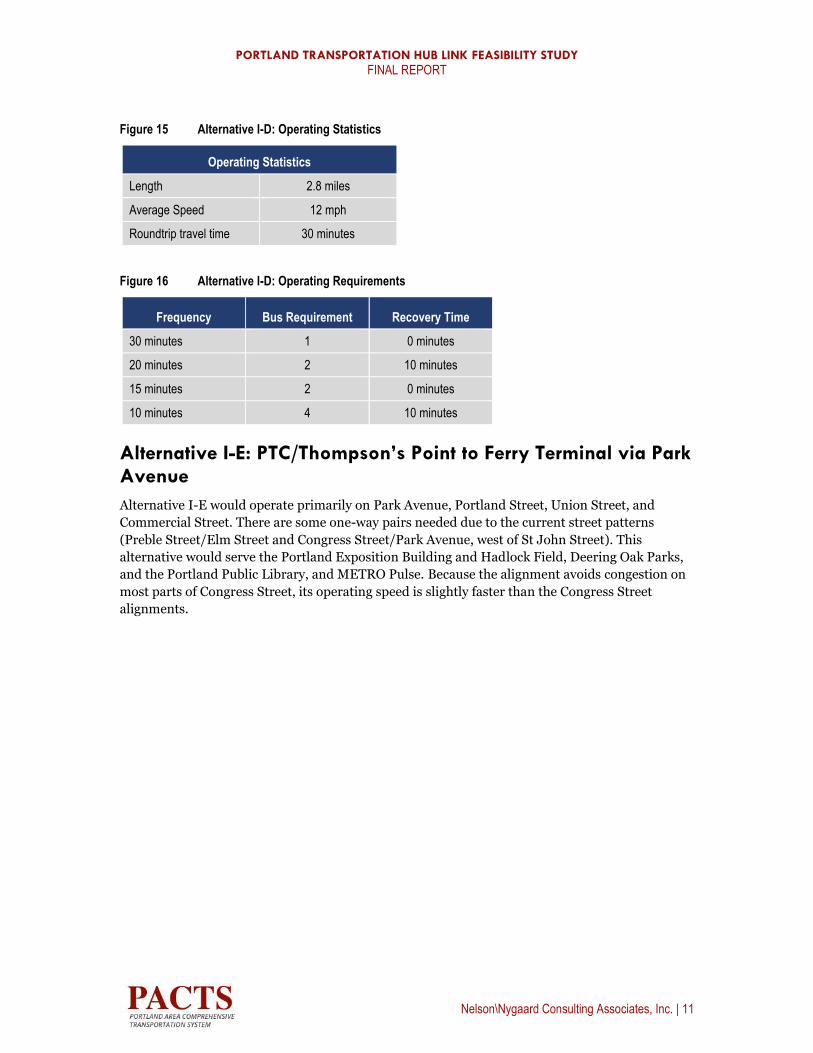
Figure 15 Alternative I-D: Operating Statistics
Operating Statistics
Length 2.8 miles
Average Speed 12 mph
Roundtrip travel time 30 minutes
Figure 16 Alternative I-D: Operating Requirements
Frequency Bus Requirement Recovery Time
30 minutes 1 0 minutes
20 minutes 2 10 minutes
15 minutes 2 0 minutes
10 minutes 4 10 minutes
Alternative I-E: PTC/Thompson’s Point to Ferry Terminal via Park Avenue
Alternative I-E would operate primarily on Park Avenue, Portland Street, Union Street, and
Commercial Street. There are some one-way pairs needed due to the current street patterns
(Preble Street/Elm Street and Congress Street/Park Avenue, west of St John Street). This
alternative would serve the Portland Exposition Building and Hadlock Field, Deering Oak Parks,
and the Portland Public Library, and METRO Pulse. Because the alignment avoids congestion on
most parts of Congress Street, its operating speed is slightly faster than the Congress Street
alignments.

PORTLAND TRANSPORTATION HUB LINK FEASIBILITY STUDY
FINAL REPORT
Nelson\Nygaard Consulting Associates, Inc. | 12
Figure 17 Alternative I-E: Alignment
The length of this alignment combined with an operating speed of 13 mph results in a 26 minute
roundtrip travel time (see Figure 18). This alternative would therefore support 15 minute
frequencies with two vehicles and still have four minutes of recovery time (see Figure 19).
Figure 18 Alternative I-E: Operating Statistics
Operating Statistics
Length 2.9 miles
Average Speed 13
Roundtrip travel time 26 minutes
Figure 19 Alternative I-E: Operating Requirements
Frequency Bus Requirement Recovery Time
30 minutes 1 4 minutes
20 minutes 2 14 minutes
15 minutes 2 4 minutes
10 minutes 3 4 minutes
PHASE II: PTC/THOMPSON’S POINT TO JETPORT
Phase II of the proposed Hub Link would connect the Portland Transportation Center to the
Portland International Jetport (see Figure 20). With the exception of a rather circuitous

PORTLAND TRANSPORTATION HUB LINK FEASIBILITY STUDY
FINAL REPORT
Nelson\Nygaard Consulting Associates, Inc. | 13
alignment using I-295, Western Avenue, and Johnson Road to access the airport from the south,
the only viable option for linking the PTC with the Jetport is via Congress Street and the Jetport
Access Road.
Figure 20 Phase II: Alignments
Alternative II-A: PTC/Thompson’s Point to Jetport with No Corridor Treatments
Alternative II-A envisions buses operating in mixed traffic along Congress Street and the Jetport
Access Road, just as METRO Route 5 does today. Assuming a 15 mph average operating speed,
which is typical in medium-density suburban environments, a round trip between the Jetport and
the PTC could be made in 24 minutes (see Figure 21).
Figure 21 Alternative II-A: Operating Statistics
Operating Statistics
Length 3 miles
Average Speed 15 mph
Roundtrip travel time 24 minutes
A single vehicle could provide 30-minute service frequency along the alignment shown in
Alternative II-A with six minutes for recovery. Two vehicles could provide service every 15 or 20
minutes, with either six or 16 minutes of recovery time for each vehicle per trip (see Figure 22).

PORTLAND TRANSPORTATION HUB LINK FEASIBILITY STUDY
FINAL REPORT
Nelson\Nygaard Consulting Associates, Inc. | 14
Figure 22 Alternative II-A: Operating Requirements
Frequency Bus Requirement Recovery Time
30 minutes 1 6 minutes
20 minutes 2 16 minutes
15 minutes 2 6 minutes
10 minutes 3 6 minutes
Alternative II-B: PTC/Thompson’s Point to Jetport with Transit
Priority Treatments
While there are few good alternatives to Congress Street for linking the PTC and Jetport, the
Congress Street corridor could itself be modified to improve the performance of transit service
along the alignment. Transit priority treatments for the corridor could include dedicated lanes,
queue jump lanes, and/or transit priority signals that extend green times or shorten red times in
response to an approaching transit vehicle (see Figure 23). These treatments could increase
average operating speeds by up to 2 mph (see Figure 24).
Figure 23 Rendering of Bus Lane on Congress Street
Transit priority treatments have a cumulative effect. The longer the corridor and the more
signalized intersections there are to “treat,” the greater the impacts of the priority treatments, in
terms of average operating speed and resulting time savings. The PTC-to-Jetport corridor is only
three miles long, so the estimated 2 mph improvement in operating speed will serve to increase
the recovery time for each trip, but is not enough to reduce the number of vehicles required to
maintain a given service frequency (compared to Alternative II-A).

PORTLAND TRANSPORTATION HUB LINK FEASIBILITY STUDY
FINAL REPORT
Nelson\Nygaard Consulting Associates, Inc. | 15
Figure 24 Alternative II-B: Operating Statistics
Operating Statistics
Length 3 miles
Average Speed 17 mph
Roundtrip travel time 21 minutes
Figure 25 Alternative II-B: Operating Requirements
Frequency Bus Requirement Recovery Time
30 minutes 1 9 minutes
20 minutes 2 19 minutes
15 minutes 2 9 minutes
10 minutes 3 9 minutes

PORTLAND TRANSPORTATION HUB LINK FEASIBILITY STUDY
FINAL REPORT
Nelson\Nygaard Consulting Associates, Inc. | 16
5 PUBLIC INVOLVEMENT
Following the initial inventory of hubs and services, the study team met with key stakeholders and
members of the public to identify key goals and objectives for the Hub Link service. Based on this
input, the study team developed evaluation criteria that reflect the community’s priorities and
translated them into a series of metrics by which to evaluate each service alternative. This
evaluation process allowed the team to determine which alternative best meets the needs and
values of the community.
KEY THEMES
Several common themes emerged from the stakeholder and public feedback:
Connectivity should be a priority of any new service. Respondents
predominantly agreed that connectivity between major hubs should be a priority of the
potential service, preferring more direct service between hubs over serving as many
places as possible.
Service should be convenient and easy to use. Above all, any Hub Link service
needs to provide connections that are reliable and convenient, and must be easy to use
and understand. This is particularly important for visitors, as well as Portland residents
who are not regular transit users.
Demonstrate success first. Respondents urged that the service should maximize
chances of success by starting small and making sure that service performs well first. If
the service is successful, then it can expand by phasing in additional service (increased
frequency, longer span of service, etc.) over time based on demonstrated demand.
Branding should play a major role. Branding can make service easy to recognize
and legible to riders and non-riders alike. Service branding and materials should clearly
convey that the service is easy to use and will take visitors where they need to go.
Additionally, the stakeholder and public meetings were used to validate key objectives developed
by the study team for the Hub Link service. These objectives are outlined in the following chapter.
A full summary of public outreach comments can be found in the Appendix of this report.

PORTLAND TRANSPORTATION HUB LINK FEASIBILITY STUDY
FINAL REPORT
Nelson\Nygaard Consulting Associates, Inc. | 17
6 EVALUATION All of the alternative alignments described in the Chapter 4 are technically feasible. To gauge the
relative benefits and disadvantages of each option, it is necessary to evaluate the alternatives
against specific objectives. For example, if the objective of the Hub Link service is to stimulate
economic development in Portland to the greatest extent possible, an alignment that offers the
fastest travel time between hubs, but few opportunities to access other downtown destinations,
may be viewed less favorably than a slower alignment that gives riders the opportunity to access
major employers and tourist destinations in downtown Portland.
The study team identified four key objectives for the Hub Link service, reflecting goals outlined in
the city’s long range transportation planning efforts. These objectives, which were developed with
input from project stakeholders and members of the public in a series of public and stakeholder
meetings, are listed and described below:
Connectivity: Effectively linking Portland’s major transportation hubs to facilitate
multimodal connections
Mobility: Contributing to the overall mobility of the region by complementing existing
and planned transit services
Economic Development: Supporting access to key activity centers and development
districts
Cost Effectiveness: Making the most of available funding sources
Alternatives were rated on measurable for each objective, producing a final rating for each
objective by which each alternative could be evaluated relative to the others. By assigning a score
of 1-4, where a “Poor” rating is awarded 1 point and a “Best” rating is awarded 4 points, the
various alignment alternatives can be ranked on how well they meet each metric. The sum of all
three metrics produces a final score for each objective. Note that not every rating will be applied
under every metric.
CONNECTIVITY
There are several ways to measure connectivity. For the purpose of this analysis, the study team
focused on three metrics: travel time, transfers, and frequency/span of service. Each alternative
(along with a “no build” option) was ranked for each metric.
Travel Time
The alignment that offers the fastest travel time between the Portland Transportation Center and
the Casco Bay Lines Ferry Terminal is Alternative I-A (PTC to Ferry Terminal via I-295) (see
Figure 26). Travel time is a function of both route length and average operating speed, and the

PORTLAND TRANSPORTATION HUB LINK FEASIBILITY STUDY
FINAL REPORT
Nelson\Nygaard Consulting Associates, Inc. | 18
primary advantage of Alternative I-A is that it operates along a freeway, ensuring the highest
average operating speed.
Figure 26 Travel Time Comparison – Phase I
ALTERNATIVE ONE-WAY TRAVEL TIME
(MINUTES) RATING
No Build (Existing METRO Service) 30 – 60* POOR
I-A (PTC to Ferry Terminal via I-295) 9 BEST
I-B (PTC to Ferry Terminal via Congress Street) 14 GOOD
I-C (PTC to Ferry Terminal via Commercial Street) 13 GOOD
I-D (PTC to Ferry Terminal via Congress and Commercial Street) 15 FAIR
I-E (PTC to Ferry Terminal via Park Avenue) 13 GOOD
* Travel times vary by direction due to differences in wait times for transfers between METRO Routes 1 and 8
Between the PTC and Jetport, Alternative II-B offers slightly faster travel times as a result of the
priority treatments envisioned for the scenario (see Figure 27).
Figure 27 Travel Time Comparison – Phase II
ALTERNATIVE ONE-WAY TRAVEL TIME
(MINUTES) RATING
No Build (Existing METRO Service) 25* POOR
II-A (PTC to Jetport with no Corridor Treatments) 12 BEST
II-B (PTC to Jetport with Transit Priority Treatments) 11 BEST
* Includes walk time between PTC and METRO bus stop at Congress Street and Whitney Avenue
Transfers
Requiring transit users to transfer from one vehicle to another in order to reach their final
destination tends to reduce the appeal of transit as an option, and has a negative impact on
ridership potential since the added step is perceived as an inconvenience by riders. When
estimating ridership, this is known as a “transfer penalty.” In Phase I, three of the alternative
alignments connect the Casco Bay Lines Ferry Terminal, METRO Pulse, Greyhound terminal, and
Portland Transportation Center, while two other alignments link the PTC and ferry terminal but
require transfers to METRO routes (or long walks) to reach the METRO Pulse or Greyhound
terminal (see Figure 28). As a result of this transfer penalty, these alternatives offer less direct
and convenient service than those that do not require transfers.

PORTLAND TRANSPORTATION HUB LINK FEASIBILITY STUDY
FINAL REPORT
Nelson\Nygaard Consulting Associates, Inc. | 19
Figure 28 Transfer Comparison – Phase I
ALTERNATIVE TRANSFERS NEEDED TO REACH ALL HUBS RATING
No Build (Existing METRO Service) 1 FAIR
I-A (PTC to Ferry Terminal via I-295) 1 FAIR
I-B (PTC to Ferry Terminal via Congress Street) 0 BEST
I-C (PTC to Ferry Terminal via Commercial Street) 1 FAIR
I-D (PTC to Ferry Terminal via Congress and Commercial Street) 0 BEST
I-E (PTC to Ferry Terminal via Park Avenue) 0 BEST
No transfers would be necessary for travel between the Portland Transportation Center and the
Jetport under either proposed alternative. Currently, there is no direct service between the PTC
and Jetport, although bus service to the Jetport is available at a 0.3 mile walk from the PTC.
Figure 29 Transfer Comparison – Phase II
ALTERNATIVE TRANSFERS NEEDED TO REACH ALL HUBS RATING
No Build (Existing METRO Service) 0* GOOD
II-A (PTC to Jetport with no Corridor Treatments) 0 BEST
II-B (PTC to Jetport with Transit Priority Treatments) 0 BEST
* Requires walk to METRO bus stop at Congress Street and Whitney Avenue to avoid transfer between Route 1 and Route 5
Span of Service and Frequency
The demand for transit service to each of Portland’s transportation hubs is directly related to the
arrival and departure schedules of the various modes serving each terminal. Figure 30 below
shows that Portland is truly a 24-hour city when it comes to regional and national transportation.
Passengers travel into and out of Portland from 5:00 AM until midnight, and to serve these
passengers, work shifts must begin several hours earlier and end well after midnight.
Figure 30 Ferry, Plane, Train, and Bus Departures (Peak Season, Friday)

PORTLAND TRANSPORTATION HUB LINK FEASIBILITY STUDY
FINAL REPORT
Nelson\Nygaard Consulting Associates, Inc. | 20
Service frequency and service span are primarily limited by service performance standards and
available funding. Service performance standards are usually set by an oversight body such as a
transit board or city council, and define acceptable levels of ridership and productivity. If
ridership fails to meet the set standards, service hours and/or frequency can be adjusted.
Funding is another key consideration, as service frequency is controlled by the number of vehicles
in concurrent operation. The more vehicles in service, the higher the operating cost. Similarly, the
number of hours that each bus is in operation impacts the total operating cost of the service.
Since the Hub Link service is envisioned as a premium transit service, as compared to existing
local transit service provided by METRO, it can be assumed that both frequency and span of
service will be more robust than the current METRO service. Beyond that, the only way to
differentiate the various alignment alternatives is to consider the frequency of service that can be
provided under each alternative with an equal level of resources. Figure 31 and Figure 32 show
the service frequency that can be provided with two vehicles assuming a minimum of 5 minutes
recovery for every trip.
Figure 31 Span of Service and Frequency – Phase I
ALTERNATIVE PEAK
FREQUENCY RATING
No Build (Existing METRO Routes 1 and 5) 30* POOR
I-A (PTC to Ferry Terminal via I-295) 15 BEST
I-B (PTC to Ferry Terminal via Congress Street) 20 GOOD
I-C (PTC to Ferry Terminal via Commercial Street) 15 BEST
I-D (PTC to Ferry Terminal via Congress and Commercial Street) 20 GOOD
I-E (PTC to Ferry Terminal via Park Avenue) 20 GOOD
*Routes 1 and 8 both offer 30-minute service frequency for most of their service day, but do not provide seamless connections

PORTLAND TRANSPORTATION HUB LINK FEASIBILITY STUDY
FINAL REPORT
Nelson\Nygaard Consulting Associates, Inc. | 21
Figure 32 Span of Service and Frequency – Phase II
ALTERNATIVE PEAK
FREQUENCY RATING
No Build (Existing METRO Route 5 Service) 30-45 POOR
II-A (PTC to Jetport with no Corridor Treatments) 15 BEST
II-B (PTC to Jetport with Transit Priority Treatments) 15 BEST
Connectivity Summary
By assigning a score of 1-4, where a “Poor” rating is awarded 1 point and a “Best” rating is awarded 4 points, the various alignment alternatives can be ranked on their relative connectivity. Figure 33 shows that three alternatives have the same cumulative score for connectivity, but with different ratings for the various assessments of connectivity. For example, Alternative I-A (PTC to Ferry Terminal via I-295) ranks “Best” in terms of travel time and service frequency, but only “Fair” in terms of the number of transfers required to reach all hubs. Alternatives I-B (PTC to Ferry Terminal via Congress Street) and I-E (PTC to Ferry Terminal via Park Avenue) require the least number of transfers to reach each hub, but rank less favorably than Alternative I-A in terms of travel time and service frequency.
Figure 33 Connectivity Rating – Phase I
ALTERNATIVE Travel Time Transfers
Service Span /
Frequency Score
No Build (Existing METRO Service) POOR FAIR POOR 4
I-A (PTC to Ferry Terminal via I-295) BEST FAIR BEST 10
I-B (PTC to Ferry Terminal via Congress Street) GOOD BEST GOOD 10
I-C (PTC to Ferry Terminal via Commercial Street) GOOD FAIR BEST 9
I-D (PTC to Ferry Terminal via Congress and Commercial Street)
FAIR BEST GOOD 9
I-E (PTC to Ferry Terminal via Park Avenue) GOOD BEST GOOD 10
For Phase II, both build alternatives would represent decreases in travel time, more direct service
between hubs, and increases in span of service and frequency. Thus, both build alternatives are
rated as best.

PORTLAND TRANSPORTATION HUB LINK FEASIBILITY STUDY
FINAL REPORT
Nelson\Nygaard Consulting Associates, Inc. | 22
Figure 34 Connectivity Rating – Phase II
ALTERNATIVE Travel Time Transfers
Service Span /
Frequency Score
No Build (Existing METRO Service) POOR GOOD POOR 5
II-A (PTC to Jetport with no Corridor Treatments) BEST BEST BEST 12
II-B (PTC to Jetport with Transit Priority Treatments) BEST BEST BEST 12
MOBILITY
The objective of mobility refers to the ability of each alternative alignment to contribute to the
overall quality and mode share of transit in the Portland region. This objective goes beyond
connectivity between the City’s transportation hubs, and considers the following additional
metrics: ridership potential, integration with the existing METRO network, and whether the
alignment complements future transit investments. More information on the topics of ridership
potential and integration with the existing network is also presented in Chapter 6: The Market for
Hub Link Service.
Ridership Potential
More than any other non-service related factor, transit use is driven by density. In most
communities, population and employment densities are strong indicators of ridership potential.
Downtown Portland is a high-density environment, with many blocks having densities of more
than 60 residents or employment positions per acre. As a point of reference, the recommended
minimum density for fixed-route transit service is approximately five residents or jobs per acre.
Figure 35 shows the transit potential of downtown Portland as a function of density.
Alternatives with the greatest interaction with the surrounding environment tend to generate the
highest ridership. Thus, Alternative I-A (PTC to Ferry via I-295), which would operate “closed
door” for a significant portion of its alignment, would offer relatively few boarding and alighting
opportunities as it traveled between the ferry terminal and PTC, and would thus perform poorly
in terms of overall ridership potential. Similarly, Alternative I-C (PTC to Ferry Terminal via
Commercial Street) would have lower ridership potential than the two alternatives operating
along Congress Street because Commercial Street is bordered by Portland Harbor on one side (see
Figure 36). Alternative I-E (PTC to Ferry Terminal via Park Avenue) operates adjacent to Deering
Oaks Park, an area with no population and little employment.

PORTLAND TRANSPORTATION HUB LINK FEASIBILITY STUDY
FINAL REPORT
Nelson\Nygaard Consulting Associates, Inc. | 23
Figure 35 Transit Potential Index Based on Population and Employment Density
Figure 36 Ridership Potential Ratings – Phase I
ALTERNATIVE RANKING
No Build (Existing METRO Service) FAIR*
I-A (PTC to Ferry Terminal via I-295) POOR
I-B (PTC to Ferry Terminal via Congress Street) BEST
I-C (PTC to Ferry Terminal via Commercial Street) FAIR
I-D (PTC to Ferry Terminal via Congress and Commercial Street) BEST
I-E (PTC to Ferry Terminal via Park Avenue) FAIR
*Reflects transfer penalty
All Phase II alternatives would follow the same alignment from the PTC to the Jetport, so
qualitatively differentiating the routes based solely on density is difficult. However, ridership
tends to increase in proportion to the level of corridor treatments applied to a transit route.
Corridors with dedicated bus lanes and enhanced passenger amenities generate greater interest
and awareness from prospective riders. In addition, corridor treatments can help stimulate
transit-oriented development as business owners and other developers recognize the long-term

PORTLAND TRANSPORTATION HUB LINK FEASIBILITY STUDY
FINAL REPORT
Nelson\Nygaard Consulting Associates, Inc. | 24
commitment that these investments represent on the part of the transit operator and other public
entities. Together, these factors translate into higher ridership potential.
Figure 37 Ridership Potential Ratings – Phase II
ALTERNATIVE RANKING
No Build (Existing METRO Service) FAIR
II-A (PTC to Jetport with no Corridor Treatments) FAIR
II-B (PTC to Jetport with Transit Priority Treatments) BEST
Integration with Existing Network
An analysis of recent METRO ridership shows high boarding activity in central Portland along
Congress Street, St. John Street, and Park Avenue (see Figure 38). While these ridership patterns
are certainly a function of the existing network, they also serve to highlight proven transit
corridors in the sense that other downtown corridors with METRO service have lower passenger
volumes.
Figure 38 METRO Transit Ridership (2013 Boarding and Alighting Study)
Serving existing ridership patterns is a key measure of the mobility impact of each alternative
alignment, as is proximity to other routes to facilitate transfers. The proposed Hub Link should be
well integrated with the existing transit network to ensure that local riders can benefit from the

PORTLAND TRANSPORTATION HUB LINK FEASIBILITY STUDY
FINAL REPORT
Nelson\Nygaard Consulting Associates, Inc. | 25
enhanced transit service that the Hub Link would provide along its alignment. From this
perspective, service along Congress Street and Park Avenue preferable to service along
Commercial Street, where there is very little existing ridership and far fewer transfer
opportunities.
As noted previously, a route that includes service along I-295 would provide minimum
opportunities for mid-route access, including transfers to other routes. Thus, Alternative I-A (PTC
to Ferry Terminal via I-295) ranks most poorly in terms of integration with the existing transit
network (see Figure 39).
Figure 39 Integration with Existing Network Ratings – Phase I
ALTERNATIVE RATING
No Build (Existing METRO Service) BEST
I-A (PTC to Ferry Terminal via I-295) POOR
I-B (PTC to Ferry Terminal via Congress Street) BEST
I-C (PTC to Ferry Terminal via Commercial Street) FAIR
I-D (PTC to Ferry Terminal via Congress and Commercial Street) GOOD
I-E (PTC to Ferry Terminal via Park Avenue) BEST
For Phase II, all of the alternatives would follow an identical alignment, and would thus provide
nearly identical benefits in terms of mobility. The one differentiating factor is that the current
METRO Route 5, which most closely mimics the proposed Phase II Hub Link alignment, does not
directly serve the PTC. This ranks it slightly lower than the Hub Link alternative alignments in
terms of seamlessly integrating key areas of existing ridership activity (see Figure 40).
Figure 40 Integration with Existing Network Ratings – Phase II
ALTERNATIVE RATING
No Build (Existing METRO Service) GOOD
II-A (PTC to Jetport with no Corridor Treatments) BEST
II-B (PTC to Jetport with Transit Priority Treatments) BEST
Ability to Complement Future Transit Investments
A high quality transit service connecting Portland’s key transportation hubs can be the
predecessor for future larger capital investments such as full-scale Bus Rapid Transit (BRT) or
streetcar service. Alignment decisions made in the near term can help ensure the success of future
transit investments. For example, if a streetcar service is envisioned for a particular corridor, Hub
Link service in the same corridor can begin to cultivate the ridership and development patterns
that will eventually support the rail service. On the other hand, Hub Link service in a corridor that
cannot support future rail or BRT service may result in a more disruptive transition for
passengers who have become reliant on the Hub Link service.
Future streetcar or BRT service along I-295 is extremely unlikely for all the accessibility reasons
mentioned previously. Thus, Alternative I-A (PTC to Ferry Terminal via I-295) scores poorly
PORTLAND TRANSPORTATION HUB LINK FEASIBILITY STUDY
FINAL REPORT
Nelson\Nygaard Consulting Associates, Inc. | 26
compared to other alternatives on its ability to complement future transit investments (see Figure
43). The remaining alternatives are ranked based on the relative likelihood of their alignments to
accommodate BRT or streetcar service in the future. This is a speculative exercise, but certain
conclusions can be drawn based on the right-of-way dimensions and adjacent land use
characteristics.
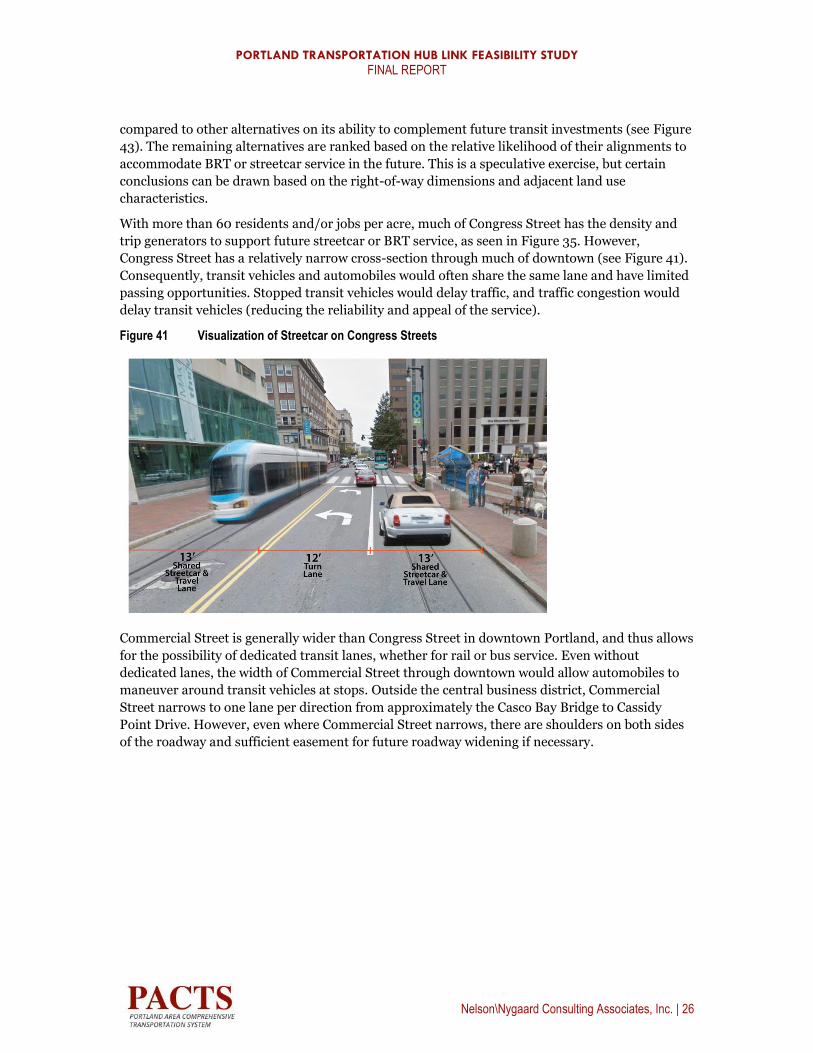
With more than 60 residents and/or jobs per acre, much of Congress Street has the density and
trip generators to support future streetcar or BRT service, as seen in Figure 35. However,
Congress Street has a relatively narrow cross-section through much of downtown (see Figure 41).
Consequently, transit vehicles and automobiles would often share the same lane and have limited
passing opportunities. Stopped transit vehicles would delay traffic, and traffic congestion would
delay transit vehicles (reducing the reliability and appeal of the service).
Figure 41 Visualization of Streetcar on Congress Streets
Commercial Street is generally wider than Congress Street in downtown Portland, and thus allows
for the possibility of dedicated transit lanes, whether for rail or bus service. Even without
dedicated lanes, the width of Commercial Street through downtown would allow automobiles to
maneuver around transit vehicles at stops. Outside the central business district, Commercial
Street narrows to one lane per direction from approximately the Casco Bay Bridge to Cassidy
Point Drive. However, even where Commercial Street narrows, there are shoulders on both sides
of the roadway and sufficient easement for future roadway widening if necessary.

PORTLAND TRANSPORTATION HUB LINK FEASIBILITY STUDY
FINAL REPORT
Nelson\Nygaard Consulting Associates, Inc. | 27
Figure 42 Visualization of Streetcar on Commercial Streets
Commercial Street does tend to experience periods of heavy congestions, as it is a key gateway
into the central business district for commuters, but this can be addressed in several ways, both in
the long term and short term. In the short term, Hub Link vehicles could be permitted to operate
on shoulders under certain traffic conditions. In the longer term, a dedicated transit lane could be
added in each direction, and/or a park-and-ride facility could be built near the end of the
Veterans Memorial Bridge to intercept some downtown traffic and encourage commuter use of
the Hub Link or future BRT or streetcar service.
Finally, Alternative I-E (PTC to Casco Bay Ferry Terminal via Park Avenue) rates as only fair. The
alignment on Park Avenue is likely wide enough to accommodate future investments in high
capacity transit. However, the one way pairs on Elm Street and Preble Street are narrow and
would likely require a larger re-arrangement of streets to accommodate streetcar or BRT service.
Overall, Commercial Street appears to be a more promising corridor for future rapid transit
investment. This is reflected in the rankings shown in Figure 43.
Figure 43 Ability to Complement Future Transit Investments Ratings – Phase I
ALTERNATIVE RATING
No Build (Existing METRO Service) GOOD
I-A (PTC to Ferry Terminal via I-295) POOR
I-B (PTC to Ferry Terminal via Congress Street) GOOD
I-C (PTC to Ferry Terminal via Commercial Street) BEST
I-D (PTC to Ferry Terminal via Congress and Commercial Street) GOOD
I-E (PTC to Ferry Terminal via Park Avenue) FAIR
For Phase II, each alternative alignment is almost evenly matched in terms of complementing
future transit investment. A Hub Link scenario that includes some corridor treatments in the near

PORTLAND TRANSPORTATION HUB LINK FEASIBILITY STUDY
FINAL REPORT
Nelson\Nygaard Consulting Associates, Inc. | 28
term would help build greater interest in and awareness of the transit service between the Jetport
and the PTC, resulting in more support for future BRT or streetcar service in the corridor. Thus
Alternative II-B (PTC to Jetport with Transit Priority Treatments) is rated best among the Phase
II alternatives.
Figure 44 Ability to Complement Future Transit Investments Ratings – Phase II
ALTERNATIVE RATING
No Build (Existing METRO Service) GOOD
II-A (PTC to Jetport with no Corridor Treatments) GOOD
II-B (PTC to Jetport with Transit Priority Treatments) BEST
Mobility Summary
Figure 45 is a summary of all metrics under the objective of Mobility. As with Connectivity, a
score of 1-4 is assigned for each metric, where 1 corresponds to a “Poor” rating and 4 corresponds
to “Best.” Alternative I-B (PTC to Ferry Terminal via Congress Street) scores highest on the
composite assessment of ridership potential, integration with the existing METRO network, and
whether the alignment complements future transit investments.
Figure 45 Mobility Ratings – Phase I
ALTERNATIVE Ridership Potential
Existing Network
Integration
Future Transit
Investment SCORE
No Build (Existing METRO Service) FAIR BEST GOOD 9
I-A (PTC to Ferry Terminal via I-295) POOR POOR POOR 3
I-B (PTC to Ferry Terminal via Congress Street) BEST BEST GOOD 11
I-C (PTC to Ferry Terminal via Commercial Street) FAIR FAIR BEST 8
I-D (PTC to Ferry Terminal via Congress and Commercial Street)
BEST GOOD GOOD 10
I-E (PTC to Ferry Terminal via Park Avenue) FAIR BEST FAIR 8
For Phase II, Alternative II-B (PTC to Jetport with Transit Priority Treatments) represents the
greatest mobility benefit based on the metrics considered (see Figure 46).
Figure 46 Mobility Ratings – Phase II
ALTERNATIVE Ridership Potential
Existing Network
Integration
Future Transit
Investment SCORE
No Build (Existing METRO Service) FAIR GOOD GOOD 8
II-A (PTC to Jetport with no Corridor Treatments) FAIR BEST GOOD 9
II-B (PTC to Jetport with Transit Priority Treatments) BEST BEST BEST 12

PORTLAND TRANSPORTATION HUB LINK FEASIBILITY STUDY
FINAL REPORT
Nelson\Nygaard Consulting Associates, Inc. | 29
ECONOMIC DEVELOPMENT
While transit service is often seen as a mobility tool, it is also an important economic engine in
the communities it serves. By facilitating access to job and services, transit connects workers with
industry, patients with healthcare providers, students with educational institutions, and
customers with retailers. There are countless ways to measure economic development, but for the
purpose of this study, three metrics were considered: key destinations served, proximity to
development districts, and the potential to stimulate new development.
Key Destinations Served
In most communities, a handful of destination types generate the bulk of transit trips. These
include schools (especially highs schools, colleges, and universities), medical facilities, and major
retail centers (particularly with grocery stores). Access to these destinations is critical to a healthy
economy. Secondary and higher education provides job skills and job training, while pre-schools
and primary schools offer child care that gives parents the opportunity to pursue careers.
Other common points of interest for transit riders are libraries, government and social service
providers, and occasionally cultural destinations such as museums and concert halls (this tends to
be truer in strong tourist markets). For some members of the community, libraries and social
service providers are resource centers for reviewing job postings and receiving other assistance
that may eventually lead to employment.
In the case of the proposed Hub Link, hotels must also be added to the list of key destinations that
may generate significant ridership, because convenient connections from each of the hubs to
hotels can support and even stimulate car-free tourism, or simply encourage visitors to forgo
renting a car if that is their typical mode of travel while visiting Portland for business or other
purposes. Large hotels are also significant employers, which reinforces the importance of transit
access.
Figures 48 and 49 show each of the alignment alternatives in relation to key destinations in
Portland. Many of these destinations are located on or in close proximity to Congress Street.
Thus, Alternatives I-B (PTC to Ferry via Congress Street) and I-D (PTC to Ferry via Congress and
Commercial Streets) score best on the metric of key destinations served (see Figure 47).
Alternative I-C (PTC to Ferry via Commercial Street) serves fewer destinations overall, but does
serve a large cluster of hotels near Commercial Street, between Union and Franklin Street.
Alternative I-E (PTC to Ferry Terminal via Park Avenue) serves the Portland Exposition Building,
Ice Arena, and Hadlock Field as well as some destinations near Metro Pulse. However most of its
alignment on Park Avenue and Portland Street does not serve major activity centers. Alternative
I-A (PTC to Ferry Terminal via I-295) serves far fewer destinations than the other alternatives,
and the no-build alternative presents a high likelihood that riders will have to transfer at least
once to reach their intended destination. Consequently, both of these alternatives rank worse than
the other options in terms of destinations served.

PORTLAND TRANSPORTATION HUB LINK FEASIBILITY STUDY
FINAL REPORT
Nelson\Nygaard Consulting Associates, Inc. | 30
Figure 47 Key Destinations Served Ratings – Phase I
ALTERNATIVE RATING
No Build (Existing METRO Service) FAIR
I-A (PTC to Ferry Terminal via I-295) POOR
I-B (PTC to Ferry Terminal via Congress Street) BEST
I-C (PTC to Ferry Terminal via Commercial Street) GOOD
I-D (PTC to Ferry Terminal via Congress and Commercial Street) BEST
I-E (PTC to Ferry Terminal via Park Avenue) GOOD
Figure 48 Key Destinations
For Phase II, all of the alternatives serve the same key destinations except for the PTC. The No-
Build alternative does not provide a direct connection between the Jetport and the PTC, so it is
ranked lower compared to the other two alternatives (see Figure 50).

PORTLAND TRANSPORTATION HUB LINK FEASIBILITY STUDY
FINAL REPORT
Nelson\Nygaard Consulting Associates, Inc. | 31
Figure 49 Hotels in the Portland Area
Figure 50 Key Destinations Served Ratings – Phase II
ALTERNATIVE RATING
No Build (Existing METRO Service) GOOD
II-A (PTC to Jetport with no Corridor Treatments) BEST
II-B (PTC to Jetport with Transit Priority Treatments) BEST
Proximity to Development Districts
The City of Portland has several pedestrian-oriented growth areas. These include the Waterfront,
Thompson’s Point, and Downtown/Arts District/Bayside. These districts are envisioned as
vibrant and diverse, both in their mix of economic generators and in their mix of transportation
options. Providing high quality transit service to these areas is central to that vision. Figure 51
shows that Alternatives I-B (PTC to Ferry Terminal via Congress Street), I-D (PTC to Ferry
Terminal via Congress and Commercial Street), and I-E (PTC to Ferry Terminal via Park Avenue)

PORTLAND TRANSPORTATION HUB LINK FEASIBILITY STUDY
FINAL REPORT
Nelson\Nygaard Consulting Associates, Inc. | 32
provide the greatest opportunities to access all three development districts. This is reflected in the
scoring in Figure 52.
Figure 51 Target Development Districts in Portland
Figure 52 Proximity to Development Districts Ratings – Phase I
ALTERNATIVE RATING
No Build (Existing METRO Service) FAIR
I-A (PTC to Ferry Terminal via I-295) FAIR
I-B (PTC to Ferry Terminal via Congress Street) BEST
I-C (PTC to Ferry Terminal via Commercial Street) FAIR
I-D (PTC to Ferry Terminal via Congress and Commercial Street) BEST
I-E (PTC to Ferry Terminal via Park Avenue) BEST
Alternatives II-A (PTC to Jetport with no Corridor Treatments) and II-B (PTC to Jetport with
Transit Priority Treatments) would both link the Jetport directly to the PTC and the Thompson’s
Point pedestrian-oriented growth area. The current METRO Route 5 serves the Jetport, but does

PORTLAND TRANSPORTATION HUB LINK FEASIBILITY STUDY
FINAL REPORT
Nelson\Nygaard Consulting Associates, Inc. | 33
not directly serve the Thompson’s Point district with its current alignment. Thus it scores lower
than the other two alternatives (see Figure 53).
Figure 53 Proximity to Development Districts Ratings – Phase II
ALTERNATIVE RATING
No Build (Existing METRO Service) GOOD
II-A (PTC to Jetport with no Corridor Treatments) BEST
II-B (PTC to Jetport with Transit Priority Treatments) BEST
Potential to Stimulate Development
It has already been established that Congress Street is a high-density and destination-rich
environment. Commercial Street, on the other hand, still has quite a bit of redevelopment
potential, particularly west of Union Street where there are several large parking lots and other
low-density land-uses. For this reason, Alternative I-C (PTC to Ferry Terminal via Commercial
Street) is more likely to stimulate new development than other alternatives that serve either
corridors that are already densely developed or corridors that do not allow for interaction with the
adjacent environment (see Figure 54). It is assumed the no-build scenario will have no more
impact on development trends than it does currently.
Figure 54 Potential to Stimulate Development Ratings – Phase I
ALTERNATIVE RATING
No Build (Existing METRO Service) POOR
I-A (PTC to Ferry Terminal via I-295) POOR
I-B (PTC to Ferry Terminal via Congress Street) FAIR
I-C (PTC to Ferry Terminal via Commercial Street) BEST
I-D (PTC to Ferry Terminal via Congress and Commercial Street) GOOD
I-E (PTC to Ferry Terminal via Park Avenue) FAIR
As discussed previously, corridor treatments can help stimulate transit oriented development as
business owners and other developers recognize the long-term commitment that these
investments represent on the part of the transit operator and other public entities. For this
reason, Alternative II-B (PTC to Jetport with Transit Priority Treatments) scored best among the
Phase II alternatives for potential to stimulate economic development.

PORTLAND TRANSPORTATION HUB LINK FEASIBILITY STUDY
FINAL REPORT
Nelson\Nygaard Consulting Associates, Inc. | 34
Figure 55 Potential to Stimulate Development Ratings – Phase II
ALTERNATIVE RATING
No Build (Existing METRO Service) POOR
II-A (PTC to Jetport with no Corridor Treatments) GOOD
II-B (PTC to Jetport with Transit Priority Treatments) BEST
Economic Development Summary
Figure 56 presents a summary of all metrics under the objective of Economic Development. As
with the previous objectives, a score of 1-4 is assigned for each metric, where 1 corresponds to a
“Poor” rating and 4 corresponds to “Best.” Alternative I-D (PTC to Ferry Terminal via Congress
and Commercial Street) scores highest on the composite assessment of proximity to key
destinations, proximity to development districts, and potential to stimulate development, and
thus ranks highest in meeting the objective of Economic Development.
Figure 56 Economic Development Ratings – Phase I
ALTERNATIVE
Proximity to Key
Destinations
Proximity to Development
Districts
Potential to Stimulate
Development SCORE
No Build (Existing METRO Service) FAIR FAIR POOR 5
I-A (PTC to Ferry Terminal via I-295) POOR FAIR POOR 4
I-B (PTC to Ferry Terminal via Congress Street) BEST BEST FAIR 10
I-C (PTC to Ferry Terminal via Commercial Street) GOOD FAIR BEST 9
I-D (PTC to Ferry Terminal via Congress and Commercial Street)
BEST BEST GOOD 11
I-E (PTC to Ferry Terminal via Park Avenue) GOOD BEST FAIR 9
For Phase II, both build alternatives present the opportunity to support economic development,
although Alternative II-B (PTC to Jetport with Transit Priority Treatments) offers the most
potential to stimulate development. Thus, Alternative II-B is ranked higher than Alternative II-A.
Figure 57 Economic Development Ratings – Phase I
ALTERNATIVE
Proximity to Key
Destinations
Proximity to Development
Districts
Potential to Stimulate
Development SCORE
No Build (Existing METRO Service) GOOD GOOD POOR 7
II-A (PTC to Jetport with no Corridor Treatments) BEST BEST GOOD 11
II-B (PTC to Jetport with Transit Priority Treatments) BEST BEST BEST 12

PORTLAND TRANSPORTATION HUB LINK FEASIBILITY STUDY
FINAL REPORT
Nelson\Nygaard Consulting Associates, Inc. | 35
COST EFFECTIVENESS
The proposed Hub Link service is envisioned to be funded in part by tax revenue generated
through the Thompson’s Point Transit Tax Increment Finance (TIF) district. The mechanism of a
TIF district is that as the property value of an area increases with redevelopment, a portion of the
resulting additional property tax revenue is set aside to fund specific projects such as
infrastructure or transportation. The exact amount of the Thompson’s Point TIF revenue is not
known, nor is it certain how quickly it will materialize, meaning that the Hub Link service may
require other funding sources if near-term implementation is a priority. Further discussion of
funding can be found in a subsequent section of this document. Regardless of how the service is
funded, cost effectiveness will be an important consideration, as it is with all public services.
The costs associated with providing transit service fall into two primary categories: Capital cost
and operating cost. For the most part, both of these cost categories are a function of the service
characteristics associated with transit operation. For example, to operate a transit service more
frequently, more vehicles must be added to the service. The purchase of these additional vehicles
is a capital cost, but if there are four vehicles operating concurrently where there were previously
two, then the operating cost of the service will double as well.
In the Span of Service and Frequency analysis presented earlier in this document, the various
alignment alternatives were ranked based on the service frequency that could be provided on each
alignment with just two buses. To evaluate cost effectiveness, service frequency will be treated as
fixed variable in order to analyze three metrics of cost effectiveness: operating cost, capital cost,
and recovery time.
Operating Cost / Capital Cost / Recovery Time
The current operating cost for METRO service is approximately $65 per revenue hour. This
means that one bus operating for two hours costs $130, the same as two buses operating for one
hour each. The hourly operating cost for the proposed Hub Link is not currently known, as it has
not been determined whether the service will be operated by METRO, a private contractor, or
some other entity. As a proxy, each alignment alternative can be compared based on revenue
hours, which are directly proportional to operating cost.
As described in the example above, revenue hours are a function of the number of vehicles in
service and the number of hours that each vehicle operates. For the purpose of this analysis, Hub
Link service is assumed to operate at a 15-minute service frequency and for 16 hours per day.
Based on the overview of each alignment alternative presented in Chapter 3, each of the Phase I
alternatives would require two vehicles to provide 15-minute service frequency. With two vehicles
operating for 16 hours per day, each alternative would result in 32 revenue hours per day. So,
based on operating cost (revenue hours) and capital cost (vehicles requires) alone, all of the Phase
I “build” alternatives are equal. The one measure of cost effectiveness that sets the alternatives
apart is recovery time, which can be used as a proxy to gauge how efficiently vehicles are being
used. Cost effectiveness can also be measured in terms of cost per passenger. However, that
measure is not used here, as ridership potential is already included as a separate metric, discussed
in the Mobility section above.
As mentioned in Chapter 3, recovery time is the time between the end of one trip and the start of
the next. Recovery time of less than five minutes can risk on-time performance, while recovery
time of more than 10% of the total cycle time for a route (cycle time = travel time + recovery time)
can mean that a bus is sitting unproductively for excess periods of time. By this measure,

PORTLAND TRANSPORTATION HUB LINK FEASIBILITY STUDY
FINAL REPORT
Nelson\Nygaard Consulting Associates, Inc. | 36
Alternative I-C (PTC to Ferry Terminal via Commercial Street) scores best in terms of cost
effectiveness because it allows for the most optimal use of resources (see Figure 58).
Figure 58 Operation Statistics by Alternative – Phase I
ALTERNATIVE Revenue
Hours Rating Vehicles Required Rating
Recovery Time Rating Score
No Build (Existing METRO Service)
Increase Route 1 to 15 Minute Service
Increase Route 8 to 15 Minute Service
64:00*
64:00* POOR
4.0*
4.0* POOR
0:00*
0:00* POOR 3
I-A (PTC to Ferry Terminal via I-295)
32:00 BEST 2.0 BEST 0:13 FAIR 10
I-B (PTC to Ferry Terminal via Congress Street)
32:00 BEST 2.0 BEST 0:03 POOR 9
I-C (PTC to Ferry Terminal via Commercial Street)
32:00 BEST 2.0 BEST 0:05 BEST 12
I-D (PTC to Ferry Terminal via Congress and Commercial Street)
32:00 BEST 2.0 BEST 0:00 POOR 9
I-E (PTC to Ferry Terminal via Park Avenue)
32:00 BEST 2.0 BEST 0:03 POOR 9
* Value reflects estimate for providing 15-minute service frequency for 16 hours per day along existing METRO route, with no additional route changes
As with Phase I, the only factor that differentiates the “build” alternatives is recovery time.
Alternative II-A (PTC to Jetport with no Corridor Treatments) scores slightly better than the
Alternative with treatments as it has less excess recovery time (see Figure 59).
Figure 59 Operation Statistics by Alternative – Phase II
ALTERNATIVE Revenue
Hours Rating Peak
Vehicles Rating Recovery
Time Rating Score
No Build (Existing METRO Service)
Increase Route 5 to 15 Minute Service
80:00* POOR 5.0 POOR 0:00 POOR 3
II-A (PTC to Jetport with no Corridor Treatments)
32:00 BEST 2.0 BEST 0:06 BEST 12
II-B (PTC to Jetport with Transit Priority Treatments)
32:00 BEST 2.0 BEST 0:09 GOOD 11
* Value reflects estimate for providing 15-minute service frequency for 16 hours per day along existing METRO route, with no additional route changes

PORTLAND TRANSPORTATION HUB LINK FEASIBILITY STUDY
FINAL REPORT
Nelson\Nygaard Consulting Associates, Inc. | 37
7 EVALUATION SUMMARY As stated previously, all of the alternative alignments identified in this study are technically
feasible. What sets them apart is how well they perform on specific objectives that the Hub Link
service should achieve. Alternative alignments were measured against four objectives –
Connectivity, Mobility, Economic Development, and Cost Effectiveness – based on the
recommendations of the study team and feedback from community stakeholders and members of
the public. Each alternative was rated on three metrics for each objective, resulting in a total score
for each alternative on all four objectives.
Figure 60 Overall Ratings of Alternatives
ALTERNATIVE Connectivity Mobility Economic
Development Cost
Effectiveness Total Score
PHASE I
No Build (Existing METRO Service)
4 9 5 3 21
I-A (PTC to Ferry Terminal via I-295)
10 3 4 10 27
I-B (PTC to Ferry Terminal via Congress Street)
10 11 10 9 40
I-C (PTC to Ferry Terminal via Commercial Street)
9 8 9 12 38
I-D (PTC to Ferry Terminal via Congress and Commercial Street)
9 10 11 9 39
I-E (PTC to Ferry Terminal via Park Avenue)
10 8 9 9 36
PHASE II
No Build (Existing METRO Service)
5 8 7 3 23
II-A (PTC to Jetport with no Corridor Treatments)
12 9 11 12 44
II-B (PTC to Jetport with Transit Priority Treatments)
12 12 12 11 47

PORTLAND TRANSPORTATION HUB LINK FEASIBILITY STUDY
FINAL REPORT
Nelson\Nygaard Consulting Associates, Inc. | 38
When all objectives are considered for Phase I, Alternative I-B (PTC to Ferry Terminal via
Congress Street) ranks highest among all four alternatives and the No Build alternative (see
Figure 60). Alternatives I-D (PTC to Ferry Terminal via Congress and Commercial Street), I-C
(PTC to Ferry Terminal via Commercial Street), I-E (PTC to Ferry Terminal via Park Avenue)
rank just behind I-B based on the sum of their ratings under all four objectives.
The “No Build” alternative ranks as the lowest among all the Phase I alternative alignments, and
Alternative I-A (PTC to Ferry Terminal via I-295) scores well behind the top performing
alternatives.
Among the Phase II alternatives, Alternative II-B (PTC to Jetport with Transit Priority
Treatments) performs highest, with the highest scores on three of the four objectives. Alternative
II-A (PTC to Jetport with no Corridor Treatments) also performs very well. The “No Build”
alternative least meets each of the four established objectives, and so receives a score of less than
half that of the two other alternatives.
While the alternative alignments for the Hub Link service may be evaluated based on the four
objectives cumulatively, it is important to remember that all objectives may not be equal. For
example, if enhancing mobility is deemed a higher priority objective for the Hub Link service than
supporting economic development, than the alternative alignments may be evaluated based solely
on their performance on the Mobility metrics; alternatively, each objective may be weighted, with
heavier weighting on the objectives that are more highly valued by the community.
Figure 61 shows that different alternatives perform best on different objectives. In terms of
Connectivity, Alternatives I-A (PTC to Ferry Terminal via I-295), I-B (PTC to Ferry Terminal via
Congress Street), and I-E (PTC to Ferry Terminal via Park Avenue) perform best among the Phase
I alternatives, while Alternative I-B also performs best on Mobility. Alternative I-C (PTC to Ferry
Terminal via Commercial Street) ranks highest on Cost Effectiveness, and Alternative I-D (PTC to
Ferry Terminal via Congress and Commercial Street) performs best on Economic Development.
In Phase II, both Alternatives II-A (PTC to Jetport with no Corridor Treatments) and II-B (PTC to
Jetport with Transit Priority Treatments) perform well on Connectivity. Alternative II-A ranks
highest on Mobility and Economic Development, while Alternative II-A performs best on Cost
Effectiveness.

PORTLAND TRANSPORTATION HUB LINK FEASIBILITY STUDY
FINAL REPORT
Nelson\Nygaard Consulting Associates, Inc. | 39
Figure 61 Top-Rated Alternatives by Objective
ALTERNATIVE Connectivity Mobility Economic
Development Cost
Effectiveness
PHASE I
No Build (Existing METRO Service)
I-A (PTC to Ferry Terminal via I-295)
I-B (PTC to Ferry Terminal via Congress Street)
I-C (PTC to Ferry Terminal via Commercial Street)
I-D (PTC to Ferry Terminal via Congress and Commercial Street)
I-E (PTC to Ferry Terminal via Park Avenue)
PHASE II
No Build (Existing METRO Service)
II-A (PTC to Jetport with no Corridor Treatments)
II-B (PTC to Jetport with Transit Priority Treatments)
RECOMMENDATIONS
Two important themes, which emerged from the public involvement process, help determine the
preferred alternatives for potential Hub Link service:
Connectivity should be a priority of any new service. Respondents
predominantly agreed that connectivity between major hubs should be a priority of the
potential service, preferring more direct service between hubs over serving as many
places as possible.
Demonstrate success first. Respondents urged that the service should maximize
chances of success by starting small and making sure that service performs well first. If
the service is successful, then it can expand by phasing in additional service (increased
frequency, longer span of service, etc.) over time based on demonstrated demand.
Given these sentiments, Alternative I-B (PTC to Ferry Terminal via Congress Street) is
the recommended Phase I alignment. This alternative scores highest when all objectives are
considered, but also does best on the Connectivity objective, which emerged as the highest
priority from the public involvement process.
Among the Phase II alternative, Alternative II-A (PTC to Jetport with no Corridor
Treatments) is most consistent with the theme of demonstrating success first. Although
Alternative II-A scored lower than Alternative II-B in cumulative scoring, the only difference

PORTLAND TRANSPORTATION HUB LINK FEASIBILITY STUDY
FINAL REPORT
Nelson\Nygaard Consulting Associates, Inc. | 40
between the two alternative is the level of capital investment. Thus, Alternative II-A can be
considered the first step toward the eventual implementation of Alternative II-B, after success has
been demonstrated.
During the public involvement process, a suggestion emerged to consider a service alternative
that includes more than one of the alignments. In other words, a Hub Link service operating as a
loop between the PTC and the Casco Bay Ferry Terminal using both Commerce Street and
Commercial Street (as an example, although some other combination of corridors could also be
considered). This suggestion was not pursued by the study team because it would either introduce
a transfer at the PTC for passengers wishing to travel to the Jetport, or result in double the
amount of service frequency along Congress Street between the PTC and Jetport as along the two
legs of the loop between the PTC and ferry terminal. Neither of these results is desirable as a
forced transfer would reduce the appeal of the service, and higher service frequency between the
PTC and Jetport is not justified.
STOP SPACING
As a general rule, arterial-running rapid transit services like streetcars or Bus Rapid Transit have
stop spacing of approximately every ¾ mile. The actual distance between stops can be more or
less, based on the built environment and location of key destinations. Based on current land-use,
recommended Hub Link stop locations include the following:
Portland International Jetport
Shaw’s / Tim Horton’s Shopping Center
PTC / Thompson’s Point
Greyhound / Maine Medical Center
Congress, between State and High Street
METRO Pulse
Congress and Franklin Street
Casco Bay / Ocean Gateway Terminals
PHASING
Throughout this study, Hub Link service between the PTC and Jetport and the PTC and ferry
terminals has been presented as two separate phases. In August 2015, the study team conducted
in-person intercept surveys at the Jetport, PTC, and ferry terminals in order to gauge the level of
interest and ridership potential for Hub Link service among the current users of each hub. From
the intercept surveys, it emerged that the strongest market for Hub Link service appears to be
between the Jetport and PTC, followed by the Jetport and ferry terminals.
Creating a direct link between the Jetport and PTC could be achieved with a relatively minor
modification of the existing METRO Route 5 alignment. With improved service frequency and
marketing, Route 5 could attract a larger share of trips between the Jetport and PTC than it
currently does. Thus, the introduction of a new Hub Link service to link the Jetport and PTC only
is likely not justified, given that another simpler option exists. However, the intercept surveys

PORTLAND TRANSPORTATION HUB LINK FEASIBILITY STUDY
FINAL REPORT
Nelson\Nygaard Consulting Associates, Inc. | 41
show the importance of the Jetport to the over-all ridership potential of the Hub Link service, so
the concurrent implementation of Phase I and Phase II is recommended.
Schedules and Operating Cost
The combined length of the Alternative I-B and II-A alignments is 11.4 miles. With an estimated
average operating speed of 13 mph (based on previous assumptions of 12 mph average speed for
Alternative I-B and 15 mph average speed for Alternative II-A), one round-trip can be completed
in 52 minutes, leaving seven minutes for recovery time between trips. Four vehicles operating
concurrently could provide 15-minute service frequency along the entire route from the ferry
terminals to the Jetport, while 20-minute service frequency could be provided with three vehicles
(Figure 62).
With a combination of 15-minute peak (weekdays from 6am to 9pm) and 20-minute off-peak
(weekends all day, and weekdays before 6am and after 9pm) service frequency, the estimated
annual operating cost for the Hub Link service is $1.5 million (Figure 62).
Figure 62 Operating Characteristics and Estimated Cost (Service Periods Approach)
Service Day Peak
Frequency Peak # of Vehicles
Off-Peak Frequency
Off-Peak # of
Vehicles
Daily In-Service
Hours
Annual In-Service
Hours
Total Annual Cost*
Weekday 0:15 4 0:20 3 69 17,250 $1,121,250
Saturday 0:20 3 0:20 3 54 2,808 $182,520
Sunday 0:20 3 0:20 3 54 2,808 $182,520
Holidays 0:20 3 0:20 3 54 324 $21,060
Total 23,190 $1,507,350
* Assumes cost of service is $65 per hour.
An alternative approach, which could reduce costs, is to run only alternating trips to the Jetport;
in other words, all trips would begin at the ferry terminals, but trips would alternate between
service to the PTC only, and service to the Jetport via the PTC. As every other trip would “short-
turn” at the PTC, service would be twice as frequent between the ferry terminals and the PTC as it
would be between the ferry terminals and the Jetport. With three vehicles operating concurrently,
the Jetport could be served every 30 minutes, while service between the PTC and the ferry
terminals would be available every 15 minutes (on average). This approach would reduce the
estimated annual operating cost to approximately $1.26 million (see Figure 63), but would also
reduce service frequency to the Jetport to once every 30 minutes. However, given existing
METRO ridership patterns and the overall higher density of development along Congress Street
east of the PTC, higher service frequency between the PTC and ferry terminals (and lower
frequency between the PTC and Jetport) would be justified in a phased approach that aims to
demonstrate success first.

PORTLAND TRANSPORTATION HUB LINK FEASIBILITY STUDY
FINAL REPORT
Nelson\Nygaard Consulting Associates, Inc. | 42
Figure 63 Operating Characteristics and Cost (Service Segments Approach)
Service Day Peak
Frequency* Peak # of Vehicles
Off-Peak Frequency*
Off-Peak # of
Vehicles
Daily In-Service
Hours
Annual In-Service
Hours
Total Annual Cost**
Weekday 0:15 3 0:15 3 54 13,500 $877,500
Saturday 0:15 3 0:15 3 54 2,808 $182,520
Sunday 0:15 3 0:15 3 54 2,808 $182,520
Holidays 0:15 3 0:15 3 54 324 $21,060
Total 19,440 $1,263,600
* 15-minute frequency is along the segment between the Ferry Terminal and the PTC. Due to short-turn at the PTC every other trip, service past the PTC to the Jetport would operate every 30 minutes.
** Assumes cost of service is $65 per hour.
Branding and Capital Costs
For many prospective transit users, a lack of familiarity with the service can be a major barrier to
access. This is true for both local residents and out-of-town visitors. Branding can play an
important role in increasing awareness of a service and conveying key service characteristics
related to the quality of the service and markets served. Branding can be applied to vehicles, to a
corridor, or to both. One approach that has become popular and affective with services that
attract a significant number of tourists is to integrate a system map into the vehicle livery (see
Figure 64).
Figure 64 Circulator Bus (Washington, DC)
However, for small transit systems, overly-specialized vehicle designs can create operational and
maintenance challenges. For example, a specially branded vehicle cannot be easily interchanged
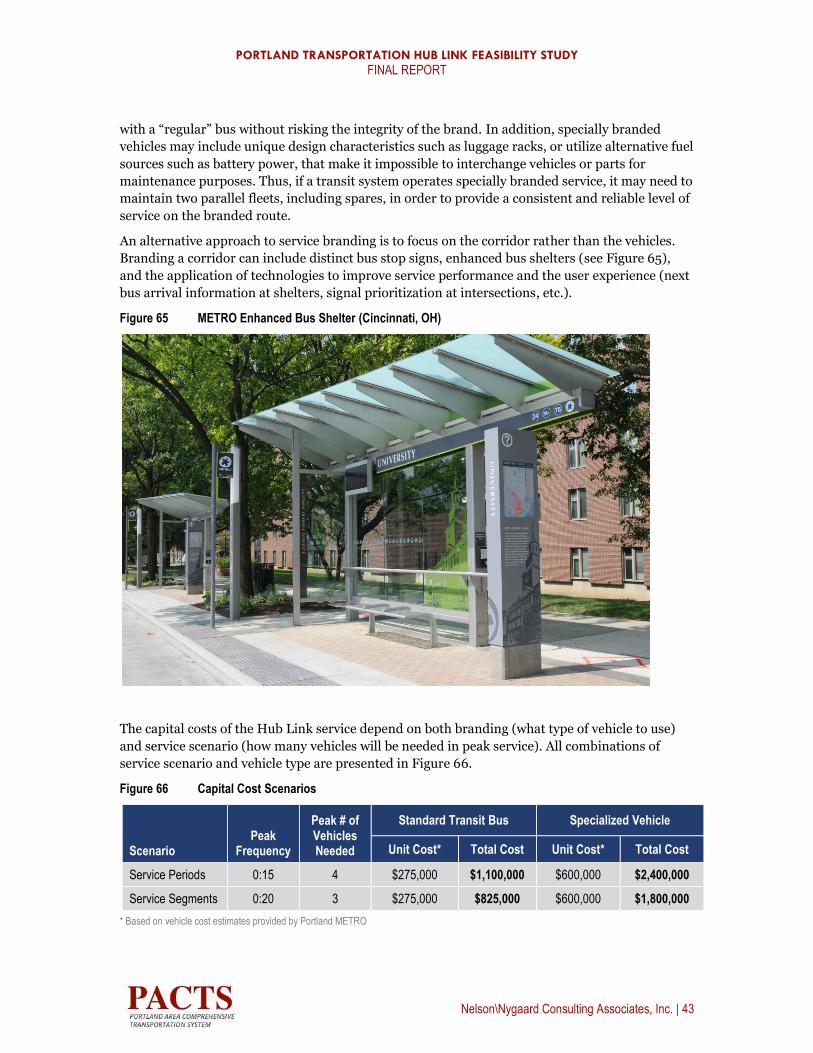
PORTLAND TRANSPORTATION HUB LINK FEASIBILITY STUDY
FINAL REPORT
Nelson\Nygaard Consulting Associates, Inc. | 43
with a “regular” bus without risking the integrity of the brand. In addition, specially branded
vehicles may include unique design characteristics such as luggage racks, or utilize alternative fuel
sources such as battery power, that make it impossible to interchange vehicles or parts for
maintenance purposes. Thus, if a transit system operates specially branded service, it may need to
maintain two parallel fleets, including spares, in order to provide a consistent and reliable level of
service on the branded route.
An alternative approach to service branding is to focus on the corridor rather than the vehicles.
Branding a corridor can include distinct bus stop signs, enhanced bus shelters (see Figure 65),
and the application of technologies to improve service performance and the user experience (next
bus arrival information at shelters, signal prioritization at intersections, etc.).
Figure 65 METRO Enhanced Bus Shelter (Cincinnati, OH)
The capital costs of the Hub Link service depend on both branding (what type of vehicle to use)
and service scenario (how many vehicles will be needed in peak service). All combinations of
service scenario and vehicle type are presented in Figure 66.
Figure 66 Capital Cost Scenarios
Scenario Peak
Frequency
Peak # of Vehicles Needed
Standard Transit Bus Specialized Vehicle
Unit Cost* Total Cost Unit Cost* Total Cost
Service Periods 0:15 4 $275,000 $1,100,000 $600,000 $2,400,000
Service Segments 0:20 3 $275,000 $825,000 $600,000 $1,800,000
* Based on vehicle cost estimates provided by Portland METRO
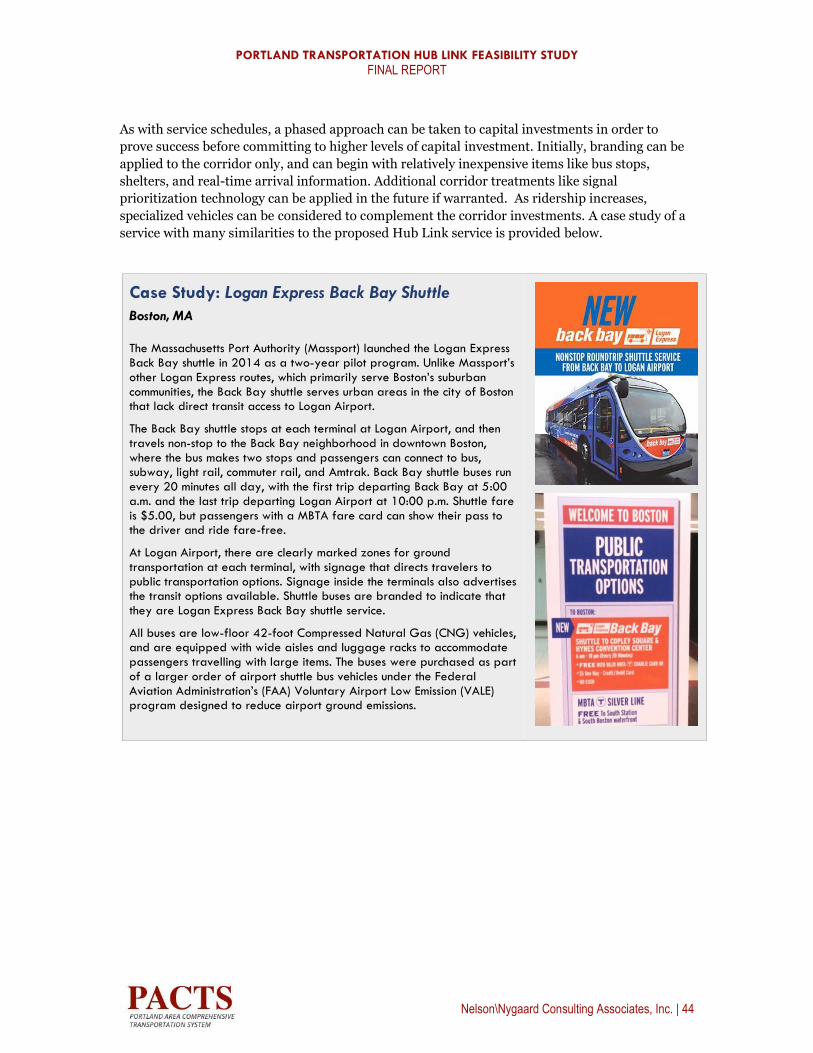
PORTLAND TRANSPORTATION HUB LINK FEASIBILITY STUDY
FINAL REPORT
Nelson\Nygaard Consulting Associates, Inc. | 44
As with service schedules, a phased approach can be taken to capital investments in order to
prove success before committing to higher levels of capital investment. Initially, branding can be
applied to the corridor only, and can begin with relatively inexpensive items like bus stops,
shelters, and real-time arrival information. Additional corridor treatments like signal
prioritization technology can be applied in the future if warranted. As ridership increases,
specialized vehicles can be considered to complement the corridor investments. A case study of a
service with many similarities to the proposed Hub Link service is provided below.
Case Study: Logan Express Back Bay Shuttle
Boston, MA
The Massachusetts Port Authority (Massport) launched the Logan Express Back Bay shuttle in 2014 as a two-year pilot program. Unlike Massport’s other Logan Express routes, which primarily serve Boston’s suburban communities, the Back Bay shuttle serves urban areas in the city of Boston that lack direct transit access to Logan Airport.
The Back Bay shuttle stops at each terminal at Logan Airport, and then travels non-stop to the Back Bay neighborhood in downtown Boston, where the bus makes two stops and passengers can connect to bus, subway, light rail, commuter rail, and Amtrak. Back Bay shuttle buses run every 20 minutes all day, with the first trip departing Back Bay at 5:00 a.m. and the last trip departing Logan Airport at 10:00 p.m. Shuttle fare is $5.00, but passengers with a MBTA fare card can show their pass to the driver and ride fare-free.
At Logan Airport, there are clearly marked zones for ground transportation at each terminal, with signage that directs travelers to public transportation options. Signage inside the terminals also advertises the transit options available. Shuttle buses are branded to indicate that they are Logan Express Back Bay shuttle service.
All buses are low-floor 42-foot Compressed Natural Gas (CNG) vehicles, and are equipped with wide aisles and luggage racks to accommodate passengers travelling with large items. The buses were purchased as part of a larger order of airport shuttle bus vehicles under the Federal Aviation Administration’s (FAA) Voluntary Airport Low Emission (VALE) program designed to reduce airport ground emissions.

PORTLAND TRANSPORTATION HUB LINK FEASIBILITY STUDY
FINAL REPORT
Nelson\Nygaard Consulting Associates, Inc. | 45
8 FUNDING CONSIDERATIONS Most transit systems in the United States get a significant portion of their funding from federal
grants, with the remainder of funds coming from passenger fares, advertising revenues and
contributions from other level of government (city, county, state, special districts, etc.).
A central purpose of creating the Thompson’s Point Transit Oriented Development TIF district
was to support improved and expanded transit service between Portland’s transportation hubs.
However, TIF revenue can be difficult to predict as it is determined by the pace of development
(or redevelopment) in the designated TIF district and the market valuation of the resulting real
estate projects. If revenue from the Thompson’s Point TIF district is slower to materialize than
anticipated, other funding sources can also be considered to supplement TIF revenue and support
the capital and operating costs of the Hub Link service. While the list below is not exhaustive, it
provides a sample of funding sources that could be considered.
Private Sponsorship/Partnership (for operating costs). Partnering with major
employers, hotels, and visitor sites could offset some of operating costs. Major hotels in
the Portland already provide complimentary shuttles to the Jetport and other local
destinations. Hotels may therefore be interested in funding the Hub Link so long as it
serves their guests with equal or greater convenience than their own shuttles at present.
The Congress Street alignment, which serves the most hotels and local destinations, may
have the highest potential in attracting funding from such businesses. An in-state
example of a sponsored shuttle services is the Acadia Explorer funded by L.L. Bean. Given
the number of tourism-related businesses in downtown Portland, sponsorship may be a
viable funding option for the Hub Link service.
Farebox Revenue (for operating costs). Intercept surveys conducted at Portland’s
transportation hubs in August 2015 suggested that 96% of those willing to use a potential
Hub Link service would pay a $3 fare. Thus, a premium fare could be considered for the
Hub Link service. To mitigate the financial impact of a premium fare on local users, a
discounted multi-ride pass could also be considered.
FTA Small Starts (for capital costs) Chapter 49 U.S.C. 5309 authorized the Federal
Transit Administration to create the Small Starts program for fixed-guideway (and bus
corridor) projects requesting Section 5309 Bus and Bus-Related Facilities funding of up
to $75 million, with a total project cost of less than $250 million. According to FTA’s
Small Starts final policy guidance for New and Small Starts Evaluation & Rating Process
(August 2013), FTA’s decision to recommend a project for funding is driven by a number
of factors, including the “readiness” of a project for capital funding, geographic equity, the
amount of funds versus the number and size of the projects in the Section 5309 funding
pipeline, and the project’s overall Small Starts rating. Small Starts grants can cover up to
80% of the total project costs or a maximum of $75 million.

PORTLAND TRANSPORTATION HUB LINK FEASIBILITY STUDY
FINAL REPORT
Nelson\Nygaard Consulting Associates, Inc. | 46
TIGER Grants (for capital costs). Transportation Investment Generating Economic
Recovery (TIGER) is a discretionary US DOT grant program that allows it to invest in
road, rail, transit and port projects. For fiscal year 2015, $500 was enacted to become
available for investment. The notice of funding availability was issued in early March
2015, and projects will be awarded on a competitive basis as in previous TIGER grant
rounds. A key criterion is project readiness (shovel ready).
TIFIA Loan Program (for capital costs). The Transportation Infrastructure Finance
and Innovation Act (TIFIA) program provides federal credit assistance to national and
regionally-significant surface transportation projects, including transit and rail. The
program is designed to fill market gaps and leverage substantial private match (or co-
development) by providing supplemental debt financing. The amount of a TIFIA loan
cannot exceed 33% of the total capital cost of a project. The loans are backed by Federal
revenues. Some capital components of the Hub Link may be backed by such funding
program.
CMAQ (for capital costs). Congestion Mitigation and Air Quality (CMAQ) funds are
used to support transportation projects in areas that are non-attainment areas of the
Clean Air Act. Projects with CMAQ funding must contribute to the attainment of the
national ambient air quality standards by reducing pollutant emissions from
transportation sources.
STP (for capital costs). Surface Transportation Program (STP) funds can be used for a
wide variety of transportation projects. These funds are also flexible funds that can be
transferred to FTA for award under Chapter 53 of Title 49.
FTA Urbanized Area Formula Grant (for capital costs). The Urbanized Area
Formula Funding program (49 U.S.C. 5307) makes Federal resources available to
urbanized areas and to Governors for transit capital and operating assistance in
urbanized areas and for transportation related planning. For urbanized areas with a
population less than 200,000, operating assistance funds are also available.
THE MARKET FOR HUB LINK SERVICE
Most federal grants are awarded through a competitive process that requires applicants to
quantify the benefits of the proposed project to be funded. Similarly, both sponsorships and
advertising partners are typically interested in the impact of their support on the local market.
Thus it is important to quantify the potential market for the recommended Hub Link service.
To establish a quantifiable ridership estimate for the recommended Hub Link service, the study
team followed a multi-step process:
Step 1: Baseline Ridership. The recommended Hub Link alignment is currently
served by several existing METRO routes. A METRO boarding and alighting study
conducted in 2013 provides an approximate average daily ridership for each route. A
2014 METRO passenger survey provides additional information on the origins and
destinations of riders on each route. By combining these two datasets, the study team was
able to determine the percentage of daily riders on each route whose trips both begin and
end within the recommended Hub Link corridor. This figure is considered the ridership
baseline for the Hub Link corridor.

PORTLAND TRANSPORTATION HUB LINK FEASIBILITY STUDY
FINAL REPORT
Nelson\Nygaard Consulting Associates, Inc. | 47
Step 2: New Riders. The inventory of Hubs conducted at the start of this project
identified the volume of passenger traffic that uses each hub on a monthly basis. Using
the month of August as a dataset, the approximate average daily passenger volume was
calculated for each hub. The study team then conducted in-person intercept surveys at
each hub to determine the percentage of passengers (and employees) at each hub whose
trips could reasonably be accommodated by the Hub Link service (i.e. passengers
transferring from the PTC to a ferry terminal) and who would be willing to consider a
transit solution for this sort of transfer. The questions included in the intercept survey are
included in the Appendix of this report.
Step 3: Total Ridership. The total ridership estimate for the recommended Hub Link
service is the cumulative total of the baseline ridership for the corridor and the estimated
new riders who likely use the Hub Link service.
For this analysis, it is assumed that Phases I and II of the Hub Link service will be implemented
concurrently, allowing for the consideration of trips to and from the Jetport, PTC, and ferry
terminals.
The following tables demonstrate both the process and findings of the Hub Link ridership
estimation process. Alternative I-B overlaps with four existing METRO routes: Route 1, Route 3,
Route 5, and Route 8. The total ridership on these routes, based on METRO’s boarding and
alighting study, is presented in Figure 67.
Figure 67 Existing Daily Ridership (2013 METRO Boarding and Alighting Study)
ALTERNATIVE Existing Route 1
Existing Route 3
Existing Route 5
Existing Route 8
I-B (PTC to Ferry Terminal via Congress Street) 902 525 1080 547
The study team then identified the percent of riders on each route that currently make trips
beginning at ending within the Hub Link corridor (Figure 68). Applying this percentage to each
route’s existing ridership provides an estimated baseline ridership for the Hub Link service
(Figure 69), assuming that riders that currently travel between hubs would use the new service to
make more direct connections.
Figure 68 Trips that both Begin and End within the Hub Link Corridor (2014 METRO Passenger Survey)
ALTERNATIVE Existing Route 1
Existing Route 3
Existing Route 5
Existing Route 8
I-B (PTC to Ferry Terminal via Congress Street) 67% 8% 46% 53%
Figure 69 Estimated Baseline Ridership
ALTERNATIVE Existing Route 1
Existing Route 3
Existing Route 5
Existing Route 8 Total
I-B (PTC to Ferry Terminal via Congress Street) 601 42 492 292 1,427
The study team also estimated potential new Hub Link riders. Based on the results of the
intercept survey, the percentage of passengers who were making a “hub link” trip and would be

PORTLAND TRANSPORTATION HUB LINK FEASIBILITY STUDY
FINAL REPORT
Nelson\Nygaard Consulting Associates, Inc. | 48
willing to use transit was calculated for each hub (see Figure 70). By applying these percentages to
the approximate daily passenger volumes at each hub, potential new Hub Link ridership was
estimated for each hub (Figure 71). The total estimated ridership for the new Hub Link service,
including both estimated baseline ridership and potential new Hub Link riders, is presented in
Figure 72.
Figure 70 Level of Interest in Hub Link Service
Survey Location % of Surveyed Making a “Hub
Link” % Making a Hub Link and
Willing to Use Transit
Airport 51.3% 46.2%
PTC 11.1% 6.7%
Ferry Terminal / Ocean Gateway 11.9% 7.7%
Figure 71 Potential New Hub Link Riders
Hub Existing Monthly
Passengers (August) Existing Approximate
Daily Passengers Estimated Potential
Hub Link Users
Airport 96,000 3,097 1,429 (46.2%)
PTC 56,000 1,806 120 (6.7%)
Ferry Terminal / Ocean Gateway 211,500 6,823 525 (7.7%)
Figure 72 Total Estimated Daily Ridership on Recommended Hub Link Corridor (August)
ALTERNATIVE Baseline Riders
New Riders
Total Riders
I-B (PTC to Ferry Terminal via Congress Street) 1,427 2,313 3,502
The intercept survey conducted by the study team provided important insight into the level of
interest in a Hub Link service, and allowed for an initial estimate of potential ridership. However,
the sample size of the survey was quite small, and the estimated share of Jetport passengers who
would potentially use the Hub Link (46.2%) is quite high, especially compared to the other hubs
(6.7% at the PTC and 7.7% at the Ferry Terminal/Ocean Gateway). Therefore, the study team
reviewed the mode share for transit at other airports in the U.S. to determine a more realistic
ridership estimate for Jetport passengers.
The study team examined the transit mode share for the 27 U.S. airports with the most public
transport users.1 The top and bottom ranked airports were removed to mitigate the impact of
outliers, and the average mode share for the remaining 25 airports was calculated (11.4%) and
applied to the Jetport’s approximate daily passengers to provide an alternative estimate of
potential Hub Link ridership at the Jetport (Figure 73). This estimate is lower than the figure
1 Airport Cooperative Research Program. “ACRP Report 4: Ground Access to Major Airports by Public Transportation.” Washington, D.C.: Transportation Research Board, 2008. (http://onlinepubs.trb.org/onlinepubs/acrp/acrp_rpt_004.pdf)

PORTLAND TRANSPORTATION HUB LINK FEASIBILITY STUDY
FINAL REPORT
Nelson\Nygaard Consulting Associates, Inc. | 49
based on the intercept survey results, and may be more realistic given the transit mode share
experience of these other airports.
This revised Jetport ridership estimate leads to an updated estimate for total Hub Link ridership,
as shown in Figure 74.
Figure 73 Revised Potential New Hub Link Riders
Hub Existing Monthly
Passengers (August) Existing Approximate
Daily Passengers Estimated Potential
Hub Link Users
Airport 96,000 3,097 353 (11.4%)
PTC 56,000 1,806 120 (6.7%)
Ferry Terminal / Ocean Gateway 211,500 6,823 525 (7.7%)
Figure 74 Revised Total Estimated Daily Ridership on Recommended Hub Link Corridor (August)
ALTERNATIVE Baseline Riders
New Riders
Total Riders
I-B (PTC to Ferry Terminal via Congress Street) 1,427 998 2,425

PORTLAND TRANSPORTATION HUB LINK FEASIBILITY STUDY
FINAL REPORT
Nelson\Nygaard Consulting Associates, Inc. | 50
9 APPENDIX
This appendix includes a summary of comments received in both the public and stakeholder
meetings for this project. In addition, the questions to the intercept survey administered in
August 2015 are included.
The following data sets will be provided in electronic format due to formatting and size:
Metro boarding and alighting data (2013)
Onboard Metro survey results (2014)
Raw and processed intercept data (2015)
PUBLIC OUTREACH SUMMARY
Goals for Public Involvement
The first round of public involvement focused on sharing the ideas for a “Hub Link” transit
service with members of the community, and soliciting feedback about what the priorities and
goals for such a service should be. At two events (a stakeholder focus group and a public meeting),
community members were asked to identify what features would be most important to them for a
Hub Link service, and what the goals and objectives should be for such a service. Based on this
input, the study team will develop evaluation criteria that reflect the community’s priorities and
translate them into a series of metrics by which to evaluate each service alternative. This
evaluation process will allow the team to determine which alternatives best meet the needs and
values of the community.
Key Themes
Several common themes emerged from the public feedback:
Connectivity should be a priority of any new service. Respondents
predominantly agreed that connectivity between major hubs should be a priority of the
potential service, preferring more direct service between hubs over serving as many
places as possible.
Service should be convenient and easy to use. Above all, any Hub Link service
needs to provide connections that are reliable and convenient, and must be easy to use
and understand. This is particularly important for visitors, as well as Portland residents
who are not regular transit users.

PORTLAND TRANSPORTATION HUB LINK FEASIBILITY STUDY
FINAL REPORT
Nelson\Nygaard Consulting Associates, Inc. | 51
Demonstrate success first. Respondents urged that the service should maximize
chances of success by starting small and making sure that service performs well first. If
the service is successful, then it can expand by phasing in additional service (increased
frequency, longer span of service, etc.) over time based on demonstrated demand.
Branding should play a major role. Branding can make service easy to recognize
and legible to riders and non-riders alike. Service branding and materials should clearly
convey that the service is easy to use and will take visitors where they need to go.
PUBLIC INVOLVEMENT EVENTS
The project team held two events to engage members of the community. A stakeholder focus
group was held with key stakeholders for the project, including representatives of the major
transportation providers in Portland. A public meeting was also held at Portland City Hall, where
members of the public were invited to learn more about the project and share their priorities for
the proposed Hub Link service.
STAKEHOLDER FOCUS GROUP
A focus group of local stakeholders was held on Thursday, May 7. The focus group included
stakeholders representing the six following organizations:
Greater Portland METRO
Portland International Jetport
Concord Coach Lines
Amtrak
Casco Bay Lines
Thompson’s Point
The focus group began with a brief presentation by the project team to introduce the study
purpose and provide an overview of the alignment alternatives, the goals of the project, and
performance measures. Following the presentation, stakeholders participated in a facilitated
conversation where they discussed their priorities and preferences for a Hub Link service,
including the potential route alignment, service characteristics, and the role of branding.
PUBLIC MEETING
The project team also held a public meeting on the evening of Thursday, May 7, at Portland City
Hall. A total of 17 members of the public attended the meeting, as well as two reporters. Of all
meeting attendees, five identified themselves as Portland residents, and two stated that they lived
downtown.
The meeting consisted of a presentation to attendees, although attendees were able to ask
questions and discuss the project during the course of the presentation. Project staff posed
questions to attendees throughout the presentation, and attendees had the opportunity to interact
with staff during and after the presentation.

PORTLAND TRANSPORTATION HUB LINK FEASIBILITY STUDY
FINAL REPORT
Nelson\Nygaard Consulting Associates, Inc. | 52
WHAT WE HEARD
Several common themes emerged from the discussions and feedback at the public involvement
events. Based on the discussions held at each event and input received by the project team, the
following themes were identified as priority issues for any proposed Hub Link service. More
detailed notes from each meeting are provided in the subsequent section.
Key Challenges
Car-free travel options for tourists are a major need in Portland. Tourism plays
a significant role in the Portland economy. Especially during the peak season, traffic
congestion and difficulty in finding vehicle parking pose challenges for visitors and residents
alike. One stakeholder shared that their organization had conducted a focus group outside of
Portland, and that participants identified their uncertainty about how to get around in
Portland as their greatest barrier to visiting the city without a personal vehicle. Respondents
largely concurred that meeting the needs of tourists and other visitors should be a key role of
the potential service. This car-free access is also important for Portland residents that need to
connect to major hubs to complete intercity, interstate, or international trips.
Portland’s tourism economy is seasonal. Tourism in Portland largely ebbs and flows
over the course of the year, with the peak occurring in the summer months, especially August.
While Portland is a major travel hub throughout the year, traffic through the major
transportation centers can double in August from what it is during the winter months as a
result of seasonal tourism. This seasonality poses a challenge to designing an effective service,
since demand may be very high for half the year and require a large amount of service, while
demand may be significantly lower in the winter and support a much lower level of service.
Service Priorities
Connectivity should be a priority of any new service. Respondents
predominantly agreed that connectivity between major hubs should be a priority of the
potential service, rather than spreading service over multiple corridors to maximize coverage.
Respondents expressed a desire for direct, convenient multimodal connections between hubs,
and stated that this is especially crucial for visitors or those making connections in Portland.
Demonstrate success first. Service needs to be effective to demonstrate success.
Respondents suggested that the earlier Portland Explorer service did not last because it “tried
to be everything to everyone,” rather than taking a more focused approach and trying to
achieve effectiveness. Based on that, respondents urged that the service should maximize
chances of success by starting small and making sure that service performs well first. If the
service is successful, then it can expand by phasing in additional service (increased frequency,
longer span of service, etc.) over time based on demonstrated demand.
Service should be convenient and easy to use. Service needs to provide
connections that are reliable and convenient. This is particularly important for visitors, as
well as Portland residents who are not regular transit users. Service needs to be easy for
visitors to understand and use, and should be recognizable as providing connections to major

PORTLAND TRANSPORTATION HUB LINK FEASIBILITY STUDY
FINAL REPORT
Nelson\Nygaard Consulting Associates, Inc. | 53
travel hubs. Simple and intuitive service design should make the service easy to use, as well as
make it attractive to those who do not already use transit.
Commercial Street and Congress Street both offer advantages. Respondents
expressed interest in both the Commercial Street and Congress Street alignments,
acknowledging that each street presents different advantages and meet different goals.
Respondents identified Commercial Street as suitable for serving primarily tourists, given the
proximity to the waterfront and the presence of several hotels and other businesses catering
to visitors. Congress Street, on the other hand, runs through the heart of downtown Portland,
and also provides connections to the METRO Pulse.
Frequency is an important part of service success. Among stakeholders and
community members alike, respondents indicated that high service frequency would be one
of the most important features of a potential Hub Link service. Increased frequency and
longer span of service each have advantages and drawbacks, but respondents largely agreed
that high service frequency would be a more important feature for the proposed route.
Additional Priorities
Branding should play a strong role in making service recognizable and legible. Branding and information materials should clearly convey that the service is easy to
use and will take visitors where they need to go. Respondents noted that non-riders should be
able to understand where to wait, how to board, and where the vehicle will take them. Stops
and/or stations should be clearly marked and uniquely branded to make them easy to find.
Simple, clear service design will also play a key role in the branding and legibility of the
service.
Specialized vehicles should be considered to accommodate tourists’ needs. Respondents noted that many tourists and other visitors frequently have luggage or other
large items, which can be difficult to bring on standard transit vehicles. Specialized vehicles
can be configured to meet the needs of visitors with luggage racks, low-floor boarding, wider
aisles, and fewer seats to accommodate luggage, strollers, and other large items.
Decisions about fare may affect the attractiveness of service. Some respondents
suggested that the service be fare-free, indicating that a fare may pose an additional barrier to
visitors considering the service. Other respondents suggested that, beyond charging the
current METRO fare, a higher fare could be charged since the service would offer a premium
transit experience, featuring limited stops, frequent service, and other key elements.

PORTLAND TRANSPORTATION HUB LINK FEASIBILITY STUDY
FINAL REPORT
Nelson\Nygaard Consulting Associates, Inc. | 54
OVERVIEW OF COMMENTS
This section provides an overview of the comments and questions about the study from both the
stakeholder focus group and the public meeting. The comments below present a more detailed
account of the discussions that occurred at each event, with the most common and significant
themes summarized in the previous section. Comments are not attributed to individual
participants.
STAKEHOLDER FOCUS GROUP
Thursday, May 7, 2015
12-2PM
METRO Offices
Attendees: 14
Greg Jordan, Greater Portland METRO
Hank Berg, Casco Bay Lines
Dana Knapp, Concord Coach Lines
Harry Blunt, Concord Coach Lines
Patricia Quinn, Amtrak
Zach Sundquist, Portland Jetport
Chris Thompson, Thompson’s Point
Carl Eppich, PACTS
Steve Linnell, Greater Portland COG
Bruce Hyman, City of Portland
Christine Grimando, City of Portland
Jeff Levine, City of Portland
William Needelman, City of Portland
Alex Jaegerman, City of Portland
Service Priorities
Cost effectiveness is critical. The downfall of the Portland Explorer was that it provided
an unsustainable level of service relative to the amount of funding, and so the service
burned through the CMAQ funds quickly. Based on that experience, this service should be
phased in, assessing the needs over time and acting accordingly. What is the service that
has the highest probability of success? Need to prioritize service characteristics
(frequency versus span).
Lots of demand for connection between the PTC and downtown/ferry. Ferry passengers
are generally travelling without a car, so that is a logical connection. Ferry connections to
train are important.
Could potentially do a trial service during the summer peak. Transportation hubs and
service providers could advertise to riders.
Seasonal variation in service would make it more difficult to coordinate with METRO
year-round service. There is some demand to connect from PTC to the Jetport, especially
from students. Students could support service during the rest of the year given academic
breaks. The connections would need to be really good, and the vehicles should anticipate
lots of luggage.
Current services
METRO will launch Sunday service on all routes beginning in August.

PORTLAND TRANSPORTATION HUB LINK FEASIBILITY STUDY
FINAL REPORT
Nelson\Nygaard Consulting Associates, Inc. | 55
Concord Coach provides 22 bus trips daily, and more in the summer. Carries
500,000 passengers annually
Casco Bay Lines does not have parking, but there is a municipal garage. Garage is
always full, and finding parking is a challenge.
Alignment
Traffic issues on Commercial Street: gridlocked in the summer, but only along the busiest
segment of the street.
Consider a bidirectional loop to serve both Commercial and Congress? The only reason
not to would be cost. Frequencies along different sections of a bidirectional loop would be
very tricky.
The Congress alignment could be faster than current fixed-route service, since it would be
limited-stop. But, it is a single lane and gets congested.
Absolutely need to connect the ferry to the Jetport.
Frequency and Span of Service
Concord Coach first trip is at 3:45am, last departure at 1:15am. Acknowledge that,
realistically, can’t serve that early with this service. Jetport: 4:30am would work for
airport passengers, but not employees.
Focus on frequency over span of service. Visitors don’t want to wait a long time for a bus.
Locals that take the train to Boston have already figured out how to get there. We need to
focus on serving inbound visitors without cars who want to get downtown.
Ferry and Concord Coach buses are both hourly during the peak season. Need to ensure
that people feel they can be guaranteed to make a connection to the Jetport or PTC if they
need to.
15-20 minutes would be a good frequency for this service.
Portland Explorer was hourly.
Integration with Existing Transit Services
Service should serve METRO Pulse, or otherwise connect to fixed-route service
Would Route 1 still serve the PTC? There would still be underlying transit service. Do we
really want to force a transfer on everyone? There can be other transfer points than the
Pulse.
Branding
It’s important to uniquely brand the service. The service should be easily identifiable.
The experience is most important – it should feel like something more special than
regular fixed-route service.
No expectation that this would be a local service. This should be a limited-stop, high-
speed, specially branded service. It should serve tourists, but there are also opportunities
to serve new and existing riders here.

PORTLAND TRANSPORTATION HUB LINK FEASIBILITY STUDY
FINAL REPORT
Nelson\Nygaard Consulting Associates, Inc. | 56
PUBLIC MEETING
Thursday, May 7, 2015
6:30-8 PM
Portland City Hall
Attendees: 17
Frequency versus Span of Service
Frequency is more important than span of service for this project. Every 30 minutes
would be acceptable.
Every 15 minutes would be nice, but 30 minutes is acceptable.
Alignment
Is this for tourists, or people in Portland? Commercial Street would be better for tourist
connections.
There is a lot of development on Commercial, and there will be more. The current Metro
bus only goes to the ferry. Tourists and employees have a hard time reach other
destinations.
Visitors would take a bus if it were a shuttle. Walking between hubs is not always
attractive or feasible for tourists. Make it easier to be here car-free.
It is not easy to get downtown. Congress would be better for both tourists and locals.
A two-way loop would be great. If the service is geared toward tourists, most would want
to go to downtown/Congress anyway. If there is not a loop route, then the service to
should operate on Congress.
The biggest barrier to a bidirectional loop route would be cost.
Route choice probably depends on the season. Commercial St. would better serve tourists
in the summer, while Congress St. could serve locals during the winter.
It is also important to note that the season is growing: there are more winter visitors.
Hotels are open year-round, too.
Integration with Other Transit Services
Like the idea of integrating with METRO Pulse; you could get anywhere.
There is a general perception that rapid transit is not feasible in Portland.
Need to make sure there is fare integration between METRO, Downeaster, etc.
Branding
Need to decide if the service is oriented toward tourists or not. If yes, then a specially
branded transit vehicle could be considered. Either a separate vehicle, or a METRO bus
with a unique wrap.
Having a special vehicle is important to making it stand apart.
It is not enough to have specially branded stops or corridors without special vehicles; it’s
important to get people thinking differently about transit.

PORTLAND TRANSPORTATION HUB LINK FEASIBILITY STUDY
FINAL REPORT
Nelson\Nygaard Consulting Associates, Inc. | 57
People have luggage, etc. Larger vehicles would be great so that there is more space to
accommodate these items.
Beyond amenities, branding is about legibility, and making it easier for visitors and non-
users to use transit. How can we use branding to make the service intuitive and easy to
understand?
So few people here use the bus, so making it attractive to tourists may also make it
attractive to locals who don’t use transit.
System maps at stops would help, but stops also need to feature bigger, more prominent
branding.
What about revenue/funding sources? We need to charge a fare.
Fare may be a barrier to tourists; consider making service fare-free if possible.
INTERCEPT SURVEY QUESTIONS
1. Are you:
An employee of this hub?
A local resident taking a trip?
A visitor to the Portland region?
Other
2. How are you traveling on this trip?
Plane
Train
Bus
Ferry
Other
3. Will you or did you use any other modes mentioned above during this trip (Portland
Region Only)?
Plane
Train
Bus
Ferry
Other
4. How did you get to this hub?
Car (Their Own)
Got a Ride
City Bus

PORTLAND TRANSPORTATION HUB LINK FEASIBILITY STUDY
FINAL REPORT
Nelson\Nygaard Consulting Associates, Inc. | 58
Taxi
Other
5. Where in the Portland region are you going or coming from on this trip?
6. Would you consider using a fast, frequent, direct transit service that connects this hub to
downtown and each of the other hubs if it were available?
7. Would you use this service if it were free?
8. Would you use this service if it were $3 a trip?
9. Comments
10. Where did you come from?