walla walla valley food hub feasibility study
TRANSCRIPT

Walla Walla Valley Food Hub Feasibility Study

1
Prepared for: Blue Mountain Action Council Food Bank 921 W. Cherry St. Walla Walla, WA 99362 www.bmacww.org Walla Walla Valley Food System Coalition Walla Walla, WA 99362 www.wwcfsc.org Funded by: USDA Local Food Promotion Program Prepared by: Arrowleaf Consulting 1857 Home Ave Walla Walla, WA 99362 www.arrowleafgroup.com Arrowleaf consulting team: Darin Saul Soren Newman Malea Saul Steve Peterson
Acknowledgements:
Ammon Felix Jennie Dickinson Beth Thiel Jennifer Kleffner Chandler Briggs Laura Raymond Christopher Iberle Lydia Caudill
Colette DePhelps Lynda Oosterhuis Emily Asmus Nolan Lockwood Erendira Cruz Patricia Sacha Helen Brown Shane Laib Jeff Mathias

2
Table of Contents Executive summary ....................................................................................................................................... 6
Introduction ................................................................................................................................................ 14
Overview ................................................................................................................................................. 14
Steering committee ................................................................................................................................ 15
Assessment methods .............................................................................................................................. 15
Project area and broader five-county region .......................................................................................... 18
Production assessment ............................................................................................................................... 19
Production assessment introduction, overview, and conclusions ......................................................... 19
Irrigation.................................................................................................................................................. 19
Farm locations ......................................................................................................................................... 22
Farm size ................................................................................................................................................. 24
Business annual sales .............................................................................................................................. 25
Types of products grown ........................................................................................................................ 26
Vegetables ........................................................................................................................................... 26
Fruit and nuts ...................................................................................................................................... 27
Animals and bees ................................................................................................................................ 29
Season extension .................................................................................................................................... 30
Market assessment ..................................................................................................................................... 31
Demographic overview ........................................................................................................................... 31
Regional population ............................................................................................................................ 33
Regional economy ................................................................................................................................... 35
Overview ............................................................................................................................................. 35
Labor force .......................................................................................................................................... 35
Cost of living ........................................................................................................................................ 35
Gross regional product ........................................................................................................................ 36
Industry growth ................................................................................................................................... 36
Location quotient ................................................................................................................................ 36
Average compensation ....................................................................................................................... 37
Unemployment rates .......................................................................................................................... 37
Agriculture .......................................................................................................................................... 38
Buyer perspectives .................................................................................................................................. 41
Buyer characteristics and contact information ................................................................................... 41
3
Interest in sourcing from Walla Walla Valley farms ........................................................................... 43
Importance of specific product attributes, such as certified organic and non-GMO ......................... 47
Challenges to buying food products from Walla Walla Valley farms ................................................. 48
Likelihood of purchasing through a food hub ..................................................................................... 50
Supplier interest in a food hub ................................................................................................................... 52
Food hubs and commercial kitchens suppliers currently use ................................................................. 52
Current and potential value-added products ......................................................................................... 52
Interest in supplying ingredients for someone else’s product ............................................................... 53
Markets suppliers are currently accessing and interested in accessing ................................................. 53
Interest in specific food hub services...................................................................................................... 55
Food hub location ................................................................................................................................... 56
Guiding principles ................................................................................................................................... 57
Suppliers’ likelihood of participating ...................................................................................................... 58
Lessons learned: Food hub case studies ..................................................................................................... 63
Case study overview and summary ........................................................................................................ 63
Food hub models .................................................................................................................................... 63
Puget Sound Food Hub ........................................................................................................................... 64
Local Inland Northwest Cooperative (LINC) Foods ................................................................................. 65
Western Montana Growers Cooperative (WMGC)................................................................................. 67
Pasco Specialty Kitchen ........................................................................................................................... 68
Case study conclusions ........................................................................................................................... 69
Major partners ............................................................................................................................................ 73
Blue Mountain Station ............................................................................................................................ 73
BMS: Business incubator space and support services ........................................................................ 73
BMS: Cooperative retail ...................................................................................................................... 73
BMS: Commercial kitchen ................................................................................................................... 74
Blue Mountain Action Council Food Bank .............................................................................................. 74
Food Bank routes and current producers ........................................................................................... 75
Food Bank needs ................................................................................................................................. 77
Food Bank’s current and potential economic impacts ....................................................................... 78
Food Bank partnership conclusions .................................................................................................... 79
Putting it all together: Food hub scenarios................................................................................................. 80
Scenario introduction ............................................................................................................................. 80

4
Scenario 1: Distribution food hub ........................................................................................................... 80
Scenario 1: Description ....................................................................................................................... 81
Scenario 1: Additional options ............................................................................................................ 83
Scenario 1: Financial considerations ................................................................................................... 84
Scenario 1: Economic impacts ............................................................................................................ 84
Scenario 1: Conclusions ...................................................................................................................... 85
Scenario 2: Value-added processing ....................................................................................................... 85
Scenario 2: Description ....................................................................................................................... 85
Scenario 2: Financial analysis framework and approach (caveats) .................................................... 86
Scenario 2: Salsa .................................................................................................................................. 89
Scenario 2: Marinara sauce ................................................................................................................. 97
Scenario 2: Popsicles ......................................................................................................................... 102
Scenario 2: Conclusions .................................................................................................................... 106
Scenario 3: Retail .................................................................................................................................. 106
Scenario 3: Description ..................................................................................................................... 106
Scenario 3: Financial analysis ............................................................................................................ 106
Scenario 3: Moscow Food Cooperative example .............................................................................. 107
Scenario 3: Economic impacts .......................................................................................................... 107
Scenario 3: Conclusions .................................................................................................................... 108
Scenario 4: Commercial kitchen ........................................................................................................... 108
Scenario 4: Description ..................................................................................................................... 108
Scenario 4: Conclusions .................................................................................................................... 110
Comparing the scenarios: Strengths, weaknesses, opportunities, treats ............................................ 111
Organizational structure ....................................................................................................................... 112
Triple-bottom line model .................................................................................................................. 112
For-profit model ................................................................................................................................ 112
Limited liability company (LLC) structure ......................................................................................... 112
Conclusions ....................................................................................................................................... 112
How should it be financed? .................................................................................................................. 113
Many funding sources and configurations are possible ................................................................... 113
The role of grants .............................................................................................................................. 114
Specific funders ................................................................................................................................. 115
Reduce capital costs through Food Bank partnership ...................................................................... 115

5
Member equity ................................................................................................................................. 115
What to do with education ................................................................................................................... 116
Conclusions ............................................................................................................................................... 118
Appendices ................................................................................................................................................ 119
Appendix A: Economic impacts methodology ...................................................................................... 119
Economic base assessment ............................................................................................................... 119
Defining and explaining economic impacts ...................................................................................... 120
Appendix B: Detailed Agricultural Census data description ................................................................. 120
Current production and farm characteristics ................................................................................... 120
Crops grown historically in the five-county region ........................................................................... 136
Appendix C. Population characteristics ................................................................................................ 141
Demographic overview ..................................................................................................................... 141
Age .................................................................................................................................................... 142
Race and ethnicity ............................................................................................................................. 143
Languages.......................................................................................................................................... 144
Poverty and food security ................................................................................................................. 145
Appendix D: Likelihood of participating explanations from supplier survey respondents ................... 146
Likelihood of participating in a food hub .......................................................................................... 146
Likelihood of participating in a commercial kitchen ......................................................................... 148
Appendix E: Some funding programs relevant to food hubs ................................................................ 150
Endnotes ................................................................................................................................................... 154
6
Executive summary
7
8

9

10

11

12

13

14
Introduction
Overview This feasibility study evaluates several options for creating a food hub in the Walla Walla Valley. For the
purposes of this study, a food hub is a flexible concept that includes one or more functions that enable
food producers and processors to reach new and more customers. Main types of services provided
include aggregation, storage, processing, marketing, sales, and distribution.
This feasibility study builds on years of work by groups and individuals in the Walla Walla Valley. One
outcome of the years of effort leading up to this feasibility study was the development of the Walla
Walla Valley Food System Coalition (WWVFSC). The coalition includes the Blue Mountain Action Council
(BMAC) Food Bank, which is currently planning to at least double its current space and add light
processing activities, such as repackaging, food salvage, freezing, and packing. This facilities expansion
provides an opportunity for the Food Bank to add additional space for a food hub to operate in the same
building.
The purpose of this study is to evaluate options for developing food hub services compatible with the
BMAC Food Bank’s operations and that help it more effectively meet its mission. The new services
should benefit everyone involved, including producers, consumers, employees, the Food Bank, and local
communities. The project is intended to increase knowledge and support organizational development
and coordination to benefit efforts in the Walla Walla Valley to expand local and regional food systems.
The project includes the following objectives:
• Objective 1: To understand the existing and potential supply for local and regional markets in
the Walla Walla Valley.
• Objective 2: To identify local and regional market characteristics and opportunities.
• Objective 3: To identify and evaluate potential scenarios, configurations, capabilities, locations,
and core business functions of a food hub.
• Objective 4: To identify and evaluate options and strategies for business structure, financing,
organization, and development of a food hub.
Because this project was a next step in a community-based collaboration, the feasibility study became part of ongoing planning, with many of those most active in the effort joining the project steering committee. Those involved included a preponderance of small farms and supporters of local foods in the area.
Our intention is for this study to be useful to other agricultural business development activities in the
Walla Walla Valley and greater Inland Northwest region. The project aimed to increase knowledge of
feasible food hub options and strategies to increase access to local and regional markets. This includes
developing information for planning needed to implement a successful food hub in the Walla Walla
Valley that meets local needs, including those of the BMAC Food Bank.

15
Steering committee This project included a steering committee made up of WWVFSC members who met regularly during the
project to plan and to provide information and feedback on project activities. The WWVFSC steering
committee includes:
• Emily Asmus, Welcome Table Farm
• Chandler Biggs, Hayshaker Farm
• Erendira Cruz, The Sustainable Living Center
• Jennie Dickenson, Port of Columbia/Blue Mountain Station
• Ammon Felix, Warren Orchards
• Chris Iberle, WSDA Regional Markets Program
• Jennifer Kleffner Miles Away Farm
• Shane Laib, Walla Walla Valley Food System Coalition
• Nolan Lockwood, Harvest Foods Supermarket
• Jeff Mathias, Blue Mountain Action Council (BMAC) Food Bank
• Lydia Caudill, Walla Walla Valley Food System Coalition
• Lynda Oousterhuis, Walla Walla County Conservation District
• Laura Raymond, WSDA Regional Markets Program
• Patricia Sacha, Hidden Garden Farms
• Darin Saul, Arrowleaf Consulting
• Beth Thiel, Walla Walla Valley Farm to School
Members of the WWVFSC volunteered their time by helping facilitate data collection, developing
scenarios, coordinating two public events, developing communications tools such as flyers and a
website, coordinating and attending meetings, developing maps, and other activities to support the
project. Many people provided information and data and resources to make the project possible
through conversations, meetings, interviews, and surveys.
Assessment methods This assessment is based on existing secondary data and new primary data we collected through
interviews, surveys, and participant observation in project-associated meetings, events, and activities.
Specifically, data collection included the components in Figure 1. The project also included economic
impact analysis that used both existing data and new data collected through project activities.
16
Figure 1. Assessment methods
Secondary data. We compiled and analyzed secondary data from federal, state, and nonprofit sources
to characterize Walla Walla Valley’s population and economic and agricultural trends. Major data
sources include US Census Bureau, US Department of Agriculture, Economic Impact Analysis for Planning
(IMPLaN) data, and Economic Modeling Specialists and International (EMSI) data.
Key informant interviews. From November 2018 to December 2019, we conducted 31 interviews with
producers, distributors, food hubs, retailers, institutions, and other key informants involved with local
and regional food supply chains in the Walla Walla Valley and throughout the Inland Northwest.
Interviews were semi-structured with open-ended questions to gather information used in multiple
parts of this study. Interviewed buyers include institutions, grocery stores, and regional food
distributors. Restaurants were specifically excluded by the steering committee and WWVFSC to not
disrupt and compete with established relationships.
Supplier survey. In November 2018 to February 2019, we conducted a web-based survey of potential
food hub suppliers (i.e., farmers, ranchers, and value-added and processed food business owners) to
identify their priorities, needs, and interests in participating. The survey gathered information on
business characteristics, current markets and interest in expanding into new markets, level of interest in
using select food hub services, and likelihood and conditions of participation. Members of the WWVFSC
emailed an invitation to participate along with the survey link to their respective mailing lists.
Participation in the supplier survey was also encouraged at the Food Producers’ Workshop held
February 12, 2019. A total of 67 potential food hub suppliers responded with useable data.
Survey of institutions and grocery stores. From April to November 2019, we conducted a web-based
survey of potential food buyers representing institutions and grocery stores located within the Walla
Walla Valley who currently buy or potentially could buy fresh food products, value-added/processed
food products, or both from farms located in the Walla Walla Valley. The aim of the survey was to
identify buyers’ priorities, needs, and interests in purchasing food products through a food hub. The

17
survey included questions to gather information on business characteristics, products currently
purchased, level of interest in buying local products, products of interest, importance of select product
characteristics (e.g., certified organic), and challenges to sourcing local products. Members of the
WWVFSC contacted buyers directly by phone or email to invite them to participate and then emailed
those who committed to take it the link to the web-based survey. A total of 10 potential food hub
buyers responded.
Participant observation. This project was unique in our experience in the depth of interaction between
the consulting team and the WWVFSC steering committee. Many details, interpretations, and other
feedback from the steering committee and the broader WWVFSC informed the development of the
scenarios and analysis over the 18-month project. The consulting team and steering committee
members presented their findings on a regular basis to the steering committee and the WWVFSC. Notes,
information, and observations from these interactions informed and shaped project activities and
enabled this feasibility study to move from a general analysis of feasibility to fine tuning the analysis to
support in-process efforts to develop a food hub.
Economic impacts methodology. We created a multi-county 2017 greater Walla Walla regional IMPLAN
(IMpact analysis for PLANning) model to estimate the economic impacts of the BMAC Food Bank and
three food hub scenarios (distribution food hub, value-added processing, and retail). IMPLAN is the most
widely employed input-output modeling software and data package for estimating economic impacts.
Outputs were adjusted for inflation to year 2020. A more detailed description of the economic impacts
methods is provided in Appendix A.

18
Project area and broader five-county region The project area was defined by the steering committee to include Clarkston, WA, to the east (a market
of interest to some and less than an hour from Blue Mountain Station in Dayton, WA); Hermiston, OR, to
the west, and all of Umatilla County that falls within the Walla Walla Valley to the south (Figure 2).
Figure 2. Project area map
The Snake River, which has few river crossings in this area, provides the northern boundary. While
neither the existing data nor the data collected through interviews and surveys fit neatly in this area, it
provided a useful frame for understanding likely producer participants and nearby markets for local
foods

19
Production assessment
Production assessment introduction, overview, and conclusions An overview of production provides insight into potential supply and helps determine the feasibility of
strategies and scales for a food hub. In this section, we provide an overview of potential supply, drawing
on Agricultural Census data for Asotin, Columbia, Garfield, Walla Walla, and Umatilla counties along with
data we collected through the supplier survey and interviews with producers and other stakeholders.
The Agricultural Census data provides an overview of the study area and what is theoretically possible
while the survey and interview data grounds the study in actual potential suppliers’ characteristics and
stated interests.
A more detailed profile of the study area production characteristics based on Agricultural Census data is
provided as Appendix B. The final section of Appendix B reports Agricultural Census data on the fruit and
vegetable crops grown in the five-county area in each census from 1934 to 2017, providing a historical
context for current production capacity, an indication of what has been grown in the past, and the
consistency of production over time. In summary, the historical data presented in Appendix B shows the
Walla Walla Valley region has long produced a variety of fruit and vegetable products.
Overall, the data show the Walla Walla Valley has a diverse farming sector that includes farms of all sizes
that grow a wide diversity of commodity and specialty crops and has significant portions of irrigated
land. While potentially farms located in all five counties (and the greater region) could supply a food
hub, fruit and vegetable production is currently concentrated in Walla Walla and Umatilla counties
where irrigation water is most available. Small-acreage farms (i.e., those of less than 50 acres) are also
concentrated in these two counties, especially Umatilla County.
The climate varies within the study area between elevations close to the Snake and Columbia rivers at a
few hundred feet elevation to the foothills of the Blue Mountains closer to 2,000 ft above sea level. This
diversity means the area is perfect for growing a wide variety of crops over a longer growing season
than much of the Northwest: from perfect cantaloupe-growing conditions in one area to the cool nights
and elevations needed for high-quality varietal fruit in others.
The Walla Walla Valley region’s overall capacity to produce high-quality vegetables and fruits and
associated value-added products is well beyond that needed for many more business ventures of the
scale this feasibility study evaluates. For example, only a very small portion of the fruit grown in the
Walla Walla Valley would be needed to supply any particular food hub product. This section also
suggests many food hub configurations could be feasible based on the production capacity and interest
of potential suppliers who participated in the survey.
Irrigation We begin this production assessment section with an overview of irrigation capacity in the five-county
area because irrigation provides important context that helps explain the location of farms and crops.
According to the Agricultural Census data, in 2017, 1,668 farms (50% of all farms) in the five-county area
had irrigation for a total of 214,082 irrigated acres. More of this could be converted if vegetable or fruit
production became a better option. Irrigation water availability is concentrated in Walla Walla and

20
Umatilla counties where farms have access to Walla Walla River resources. Asotin, Columbia, and
Garfield counties have very little irrigated farmland in comparison, except along some of the creeks and
rivers (for more information, see Appendix B).
Figure 3 is one of the most important maps in this assessment. It gives a sense of how ubiquitous water
is in Walla Walla County but not the rest of the Washington part of the study area. Umatilla County is
even more densely populated with small- and mid-acreage farms with water. Almost all irrigated mixed
vegetable production areas are in these two counties with “hot spots” along the creeks in the rest. This
is an indication of the location of likely production over the long run. If a food hub were to scale up to a
model that requires large quantities of produce, the area adjacent to Milton-Freewater and Walla Walla
would a good location.

21
Figure 2. Irrigated land. Map shows land with irrigation with streams and rivers in the background. The
50-mile radius is centered on Walla Walla. The map is meant to convey the amount available and
location of irrigated land. The colors of the irrigated parcels are not relevant to this study.

22
Farm locations Table 1 shows the number of farms in the five-county region in 2007, 2012, and 2017.i While some
fluctuation occurred across counties and census years, the overall number of farms remained relatively
stable. Farms in the region are concentrated in Walla Walla and Umatilla counties where irrigation water
is most available: in 2017, 52% of all farms were in Umatilla County and another 27% were in Walla
Walla County.
Table 1. Number of farms, by county, 2007-2017
Region 2007 2012 2017 % change
(2007-2017)
Asotin 192 185 205 6.8%
Columbia 283 308 257 -9.2%
Garfield 239 211 226 -5.4%
Walla Walla 929 943 903 -2.8%
Umatilla 1,658 1,603 1,724 4.0%
Five-county total 3,301 3,250 3,315 0.4%
Washington State 39,284 37,249 35,793 -8.9%
Oregon State 38,553 35,439 37,616 -2.4%
Figure 4 is a map showing the concentration and location of the 52 supplier survey respondents who
provided their zip code. Supplier survey respondents were dispersed throughout the Walla Walla Valley
and periphery; however, Asotin or Garfield counties were not represented, and supplier respondents
were concentrated in Walla Walla and Columbia counties.

23
Figure 3. Number of supplier survey respondents, by zip code (n=52)
Most (45 out of 66) supplier survey respondents were farmers or ranchers (Figure 5). Much of the
survey data we present in this chapter is specific to those who indicated their business includes
farming/ranching; however, the other types of food business respondents are included as relevant.
Figure 4. Supplier survey respondents’ business type (n=66)
18%
14%
27%
41%
Other
Value-added/processed food products
Both farm/ranch and value-added products
Farm/ranch

24
Farm size The 2017 Agricultural Census data shows all five counties have farms that range in size from smaller
than 50 acres to more than 1,000 acres (Figure 6).ii However, in addition to having more farms than the
other counties in the study area, Walla Walla and Umatilla counties stand out as having many more
farms that are smaller than 50 acres.
Supplier survey respondents farmed an average of 652 acres.
However, they ranged from farming 2 acres to 10,000 acres and
most were considerably smaller than the average: 59% of
respondents represented farms with 50 acres or less (n=42). Table 2
shows the distribution of respondents across farm acreage size
categories. The medianiii farm size for supplier survey respondents
was 18.5 acres and the modeiv was 4 acres. Together, supplier survey
respondents represented approximately 25,573 acres of productive
farmland.
88
71
50
489
1027
17
75
43
141
214
27
65
61
107
213
73
46
72
166
270
Asotin
Columbia
Garfield
Walla Walla
Umatilla
1.0 TO 49.9 ACRES
50.0 TO 219 ACRES
220 TO 999 ACRES
1,000 OR MOREACRES
Figure 5. Total number of farms by farm size and county, 2017
Table 2. Supplier survey
respondents’ total acres farmed
by acre category Total acres n %
1-10 acres 16 38%
11-50 acres 9 21%
51-100 acres 3 7%
101-500 acres 7 17%
501-1,000 acres 2 5%
˃ 1,000 5 12%
Total 42
25
In summary, the Walla Walla Valley includes a mix of small-, mid-, and large-acreage farms, with most
acreage in large farms (data presented in Appendix B show the number of farms with 1,000 acres or
more is decreasing, but large-acreage farms still encapsulate the greatest number of acres overall in the
five-county area). At the same time, considerable diversity at all farm scales exists. Interest in a food hub
has been largely from small- and mid-acreage diversified vegetable and/or fruit farms rather than large
operators. Small-acreage farms with less than 50 acres are increasing in both number and combined
acreage across the study area. The exception is in Columbia County where, although the total acreage of
farms in this size category increased, the total number of farms decreased, suggesting some
consolidation of farms has occurred (Appendix B).
Business annual sales In addition to acreage, we asked supplier survey
respondents to report their annual sales to get an idea
of the scale of businesses interested or potentially
available to participate in a food hub venture as well as
the capital they may represent. Many supplier
respondents (39%) represented small businesses with
annual sales less than $10,000 in 2017, although another
32% represented businesses with annual sales between
$50,000 and $249,999 (Figure 7).
Figure 8 shows supplier survey respondents’ annual
sales in 2017 by business type. Respondents in each
business type fell into a range of annual sales categories
except for those who indicated they had an “other”-type
business, all of whom fell into the less than $10,000
annual sales category.
Figure 8. Supplier survey respondents’ business annual sales by business type (n=55)
Annual sales ≥$250,000 ,
16%
Annual sales $50,000-
$249,999, 32%
Annual sales $10,000-
$49,999, 13%
Annual sales ≤$10,000, 39%
Figure 6. Supplier survey respondents’
annual sales, 2017 (n=56)
Since most producers that participate in food hubs represent small-
acreage farms, the large and growing number of small-acreage farms
and their combined acreage provides a considerable pool of potential
producers from which to recruit participants for a food hub.
100%
33%
35%
30%
33%
6%
13%
22%
41%
35%
11%
18%
22%
Other (n=6)
Value-added/processed food products(n=9)
Both farm/ranch and value-addedproducts (n=17)
Farm/ranch (n=23)
<$10,000 $10,000 -$49,999 $50,000 -$249,999 ≥ $250,000
26
Types of products grown The Agricultural Census data shows the study area produces an impressive diversity of fruits and
vegetables, both historically and currently (for more detail than summarized in the following section,
see Appendix B).
Collectively, supplier survey respondents have approximately 335 acres dedicated to growing fruit,
approximately 1,113 acres dedicated to growing vegetables, and 4,030 acres in pastureland or
rangeland dedicated to raising animals. Figure 9 shows the percentages of supplier survey respondents
who produce select types of food products for sale: more than half said they produce vegetables (i.e.,
row crops), fruits (e.g., berries and tree fruits), or both and more than a third produce field crops (e.g.,
wheat, barley, dry peas, dry lentils, hops). No respondents said they produce fish for sale and only 2%
sell dairy products. Most respondents produce food products in multiple categories.
Figure 7. Percentage of supplier survey respondents who produce select types of food products for sale
Vegetables According to the Agricultural Census, in 2017 there were 157 farms producing vegetables in the five-
county area, 60% of which were in Umatilla County and 33% were in Walla Walla County.v Table 3
reports the total number of acres of vegetables harvested in the region (only four counties are
represented in the table because no vegetable production data was reported for Garfield County in the
2017 Agricultural Census). Most of the vegetables harvested were processed into value-added products
rather than directed to fresh markets.
Table 3. Total acreage of vegetables harvested, 2017 Asotin Columbia Walla Walla Umatilla
Total 14 4 20,456 42,269
For fresh market 14 3 2,323 6,995 For processing 0 1 18,133 35,274
0%
2%
14%
25%
27%
36%
52%
58%
Fish (n=43)
Dairy products (n=43)
Poultry (n=44)
Livestock (n=44)
Eggs (n=44)
Field crops (e.g., wheat, dry peas) (n=44)
Fruits (n=46)
Vegetables (i.e., row crops) (n=45)

27
Table 4 shows the top-five crops in terms of the total
number of acres harvested in the five-county area in 2017.vi
The Agricultural Census data suggest farms producing
vegetables may have consolidated in recent decades: the
total number of vegetable farms decreased between 2002
and 2017 while total acreage in vegetable production
increased 44.3% to 62,743 acres. This amounts to 29% of
irrigated land in the study area. This trend could also
suggest farms are changing from other types of crops to
vegetables due to market opportunities or other factors.
Unsurprisingly based on irrigation capacity and
concentrated farm locations, the vast majority of acres in
vegetable production were in Umatilla and Walla Walla counties. In
2017, 85% of farms producing vegetables in the study area had
irrigation. The number of acres irrigating vegetables in the five-
county area has more than doubled over the last 15 years (108%
increase).
Most supplier survey respondents who grow vegetables represented
small-acreage operations. Supplier survey respondents had an
average of 43 acres dedicated to vegetable production (median = 3
acres, mode = 0.5 acres, range = 0.1-500 acres). Of the 26
respondents who indicated they have land dedicated to growing
vegetables, 73% had 10 acres or less dedicated to vegetables (Table
5).
Fruit and nuts Table 6 reports the number of operations, number of acres, and number of irrigated acres (as available)
for orchards, tree nuts, and berries in the five-county area in 2017.vii This Agricultural Census data show
most fruit and nut production is concentrated in Umatilla and Walla Walla counties, and nearly all
orchard and berry production is irrigated.
Table 4. Top-five vegetables grown in
the five-county area based on the
number of acres harvested, 2017
Top 5 Crop Total Acres Harvested
1 Potatoes 20,652
2 Green Peas 18,853
3 Sweet Corn 10,302
4 Dry Onions 4,043
5 Carrots 1,011
Vegetable acres n %
0.1-10 acres 19 73% 11-50 acres 3 12% 51-100 acres 1 4% 101-500 acres 3 12% 501-1,000 acres 0 0% ˃ 1,000 0 0%
Total 26
Table 5. Supplier survey
respondents’ acres of
vegetables farmed, by acre
category

28
Table 6. Number of farms, total acres, and irrigated acres in orchards, tree nuts, and
berries in the five-county area, 2017
Asotin Columbia Garfield Walla Walla Umatilla
Orchards
Number of operations 8 6 9 103 142
Number of acres 42 182 (D) 15,405 4,228
Irrigated acres 42 182 (D) 15,205 3,677
Tree nuts
Number of operations 0 0 2 9 7
Number of acres 0 0 (D) 4 24
Berries
Number of operations 2 3 n/d 47 18
Number of acres (D) (D) n/d 240 112
Irrigated acres (D) (D) n/d 240 112
Table 7 shows the number of farms producing specific types of fruits and nuts in each census year since
2002.viii Fluctuation occurred in the number of farms growing some of these products across years.
Notably, the number of farms growing apples decreased while the number growing grapes increased
overall. In 2017, the greatest number of farms were producing grapes, sweet cherries, and apples in the
five-county area. While the number of farms growing apples declined from 2002 to 2017, apples are still
one of the fruits with the greatest number of acres dedicated to their production (Appendix B).
Table 7. Number of farms with specific fruit and nut production in
the five-county region, 2002-2017
Fruit/Nut Type 2002 2007 2012 2017
Apples 133 95 92 80 Apricots 17 12 15 28 Cherries, sweet 84 82 98 94 Cherries, tart 1 1 8 23 Grapes 94 84 119 114 Kiwifruit 0 0 0 5 Nectarines 9 8 8 9 Peaches 24 21 26 38 Pears 23 17 25 31 Plum/apricot hybrid 0 2 1 3 Plums & Prunes 28 35 32 29 Almonds 0 5 0 6 Chestnuts 0 1 1 3 Hazelnuts 1 0 1 7 Walnuts 3 8 7 7
In 2017, 70 farms grew berries on 352 acres in the five-county area. Walla Walla County had the most
berry production, containing 67% of the farms growing berries and 68% of the total acres of berry
cropland. Garfield County had no berry production reported in the Agricultural Census in 2017. Figure 10
shows the number of farms growing berries by berry type in 2017.ix The greatest number of farms grow
blueberries and raspberries. Farms growing blueberries doubled in the five-county area to 42 farms

29
between 2012 and 2017 (Appendix B). The number of farms producing raspberries stayed constant over
this time period at 35 farms.
Supplier respondents who grow fruit had an average of 14 acres
dedicated to fruit production (median = 2.5 acres, mode = 1 acre,
range = 0.1-100 acres). Supplier respondents collectively had the
lowest number of acres in fruit production. Of the 23 respondents
who indicated they have land dedicated to growing fruit, 87% had
10 acres or less dedicated to fruit (Table 8).
Animals and bees The steering committee was not interested in exploring livestock or
animal enterprises in this feasibility study; therefore, these were not
a focus. However, we asked supplier survey respondents to report
the number of acres they dedicate to animal production and some
steering committee members were interested in honey, so we
report relevant data for those ventures here.
14
42
41
35
6
2
Figure 8. Number of farms growing specific berries, 2017
Table 8. Supplier survey
respondents’ acres of fruit farmed
Fruit acres n %
0.1-10 acres 20 87% 11-50 acres 2 9% 51-100 acres 1 4% 101-500 acres 0 0% 501-1,000 acres 0 0% ˃ 1,000 0 0%
Total 23
30
Supplier survey respondents who indicated they have
pastureland or rangeland had an average of 221 acres dedicated
to raising animals (median = 11 acres, mode = NAx, range = 0.25-
3,000 acres). However, most of the supplier survey respondents
raising animals represented small-acreage operations: of the 23
supplier survey respondents who indicated they have land
dedicated to raising animals, 48% had 10 acres or less dedicated
to animals and another 26% had 11 to 50 acres dedicated to
raising animals (Table 9).
We did not directly ask supplier survey respondents if they
produce honey; however, the Agricultural Census data provides
insight. The number of farms in the five-county area producing
honey grew 131% between 2002 and 2017, from 16 to 37 farms (Figure 11). Together, Umatilla, Garfield,
and Columbia counties produced 787,902 pounds of honey in 2017, which represented $1,528,000 of
honey sales. Most (92%) honey production was in Umatilla County, with 8,087 bee colonies across 19
farms.
Figure 9. Number of farms with productive bee coloniesxi
Season extension Season extension can be an important strategy to help
producers scale up production to increase available quantities
of product and meet demand for a longer season or
throughout the year. Use of hoop houses, green houses, and
other season-extending systems is an indication of how
consistent local supply to a food hub could be and, to some
extent, of potential volume. Forty-five percent of farmer
respondents said they currently use hoop houses, green
houses, or some other strategy to extend their growing
season (n=40) (Figure 12).
16
2420
37
0
10
20
30
40
50
2002 2007 2012 2017
Nu
mb
er o
f fa
rms
Agricultural Census Year
Pasture/range acres n %
0.1-10 acres 11 48%
11-50 acres 6 26%
51-100 acres 2 9%
101-500 acres 3 13%
501-1,000 acres 0 0%
˃ 1,000 1 4%
Total 23
Table 9. Supplier survey
respondents’ acres dedicated to
raising animals, by acre category
No, 55%Yes, 45%
Figure 12. Percentage of farmer supplier
survey respondents who currently use hoop
houses, green houses, or another strategy to
extend their growing season (n=40)

31
Market assessment
Demographic overview Here we provide a brief description of the demographic characteristics of the population that lives
within the five-county area based on US Census data. A more detailed description can be found as
Appendix C. The purpose of this demographic overview is to highlight some of the characteristics and
trends relevant to developing a food hub and associated enterprises.
The US Census data show 83% of the population resides in Umatilla and Walla Walla counties where
the majority of small-acreage fruit and vegetable production is happening. This co-location of markets
with production can offer several advantages, including generally less distance, time, and expense
required for transportation to local markets and value-added processing—potentially reducing costs and
increasing product quality. While smaller, the other counties in the five-county area offer potential
markets as well (Figure 13). Specifically, in 2018, the five-county area had a population of 167,354, with
77,516 people in Umatilla County and 60,922 people in Walla Walla County. Asotin County had 22,610
people, Columbia County had 4,059 people, and Garfield County had 2,247 people.
Figure 103. Population by location, 2018

32
Figure 14 shows that overall the population in the five-county area is slowly growing, especially in
Asotin and Walla Walla counties. The five-county area experienced a 2.6% growth rate between 2010
and 2018. Asotin, Walla Walla, and Umatilla counties saw population growth while Columbia and
Garfield counties decreased slightly. In 2019, the region's population had increased 2% since 2014,
growing by 3,282, which is substantially below
the regional average. Emsi expects the region to
increase by only 1.7% between 2019 and 2024,
(2,833 people). In contrast, Washington State has
grown by 8.3% since 2014, and Idaho has
increased by 9%. While population growth is
slow in the five-county area, in general local
markets are also likely growing and although the
demand potential will ultimately be shaped by
the product and services offered, Walla Walla
Valley food entrepreneurs are not constrained by
local markets. That is, products can be marketed
beyond the five-county area.
There is a sizeable and growing Hispanic
population in the five-county area (20% of the population was Hispanic in 2017), with Umatilla (26%)
and Walla Walla (21%) counties having the highest percentages and numbers. In fact, Hispanic
population growth accounted for most of the total population growth observed in the five-county area
from 2010 to 2017. The Hispanic population grew 19% in that period, whereas the non-Hispanic
population decreased 0.1%. From 2010 to 2017, Hispanic population growth was greater than 18% in
every county except Garfield County, whereas the non-Hispanic population had a maximum growth of
3.4% in Asotin County and decreased in both Columbia and Umatilla counties (see Appendix C for more
information). For the purposes of a food hub, this trend suggests culturally specific food needs and local
market demand that food hub enterprises could meet.
There is also a substantial number of Spanish speakers in the five-county area. In 2017, 22% and 16%
of the population spoke Spanish at home in Umatilla and Walla Walla counties, respectively. The
implications of this observation are twofold: 1) fully reaching the local Hispanic market may require
advertising in Spanish and 2) including Hispanic entrepreneurs in the food hub endeavor may require
outreach tailored to this demographic.
Figure 15 shows the population in the five-county area skews toward a greater proportion of middle and
low-income households, although many households are in the higher income categories as well. While
18% of households had incomes of $100,000 or more in 2017, 29% made less than $30,000. Implications
for food hub enterprises include that there is likely an affluent population to market higher-end
products to but also many people in the local and regional market who likely do not have the income to
regularly purchase higher-end food products.
2.6%
4.1%
-0.9%
-0.6%
3.4%
1.9%
Five-county total
Asotin
Columbia
Garfield
Walla Walla
Umatilla
Figure 14. Change in population, 2010-2018

33
While there is potentially a strong market for higher-end fresh and value-added products in the five-
county area, many people are also experiencing poverty and food insecurity. Table 10 summarizes
poverty and food insecurity data for the five-county area in 2017. Households with income below 185%
poverty level are eligible for federal food programs: 82% of all households in the five-county area met
this eligibility criteria in 2017, when just over 19,000 food-insecure people lived in the five-county area,
resulting in a food insecurity rate of 11.6%. This food security data gives a sense of the scale of food
insecurity in the study area and reflects the importance of the ongoing need for the food hub to not only
be compatible with Food Bank operations but to be synergistic in its efforts.
Table 10. Poverty level and food insecurity characteristics, 2017
Characteristics Asotin Columbia Garfield Walla Walla
Umatilla 5-county
total
Households with income below 185% poverty level
82% 84% 80% 78% 85% 82%
Food insecurity rate 12.5% 12.9% 12.8% 11.1% 11.5% 11.6% Estimated number of food
insecure individualsxii 2,790 520 290 6,640 8,830 19,070
Source: Feeding America, Map the Meal Gap
Regional population As expected, the population in the region is concentrated in urban areas, specifically Seattle and the
broader Puget Sound area, Portland, Boise, and Spokane. Almost all the population in the region is
within a 4-5-hour drive from Walla Walla, making delivery or pick up feasible within a single day (Figures
16 and 17). At the scale of all options discussed during this project, there is virtually an infinite market in
terms of accessible intermediated market buyers and consumers.
7,691
10,074
9,478
8,655
7,173
7,428
4,768
2,443
2,003
1,655
Less than $15,000
$15,000 to $29,999
$30,000 to $44,999
$45,000 to $59,000
$60,000 to $74,999
$75,000 to $99,999
$100,000 to $124,999
$125,000 to $149,999
$150,000 to $199,999
$200,000 or more
Source: US Census Figure 15. Number of households by income level, 2017

34
Figure 16. Regional population by county and place, 2018
Source: U.S. Census Bureau
35
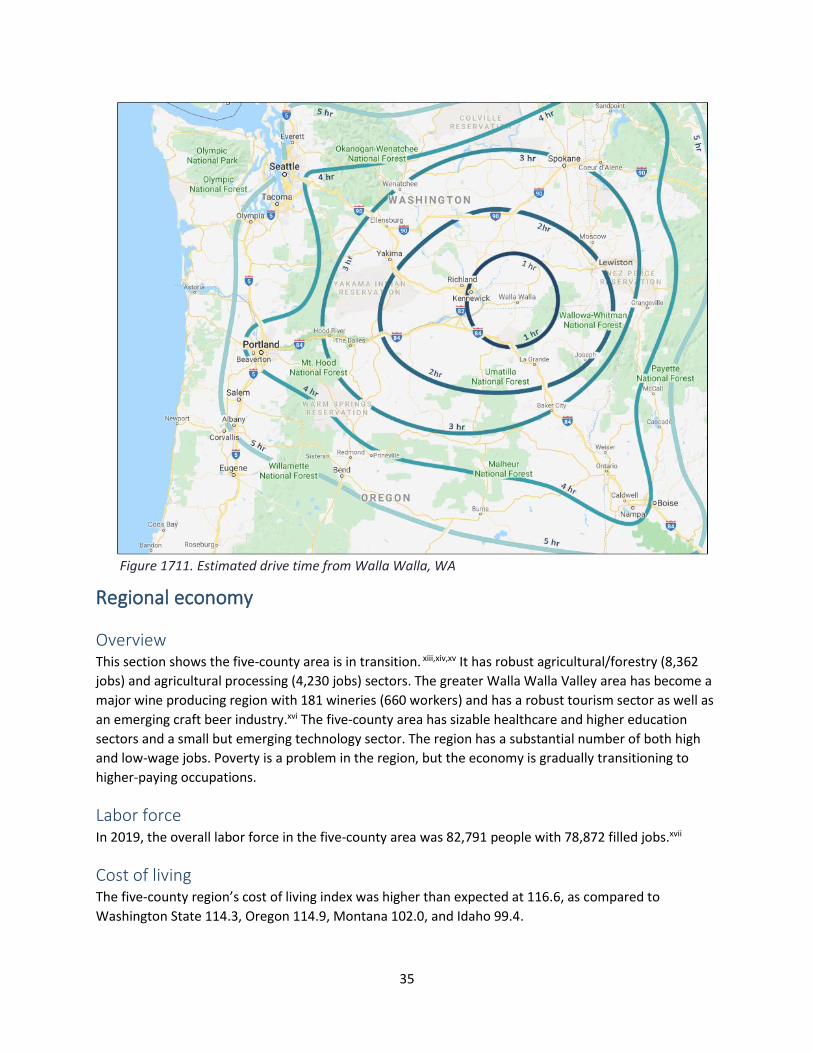
Figure 1711. Estimated drive time from Walla Walla, WA
Regional economy
Overview This section shows the five-county area is in transition. xiii,xiv,xv It has robust agricultural/forestry (8,362
jobs) and agricultural processing (4,230 jobs) sectors. The greater Walla Walla Valley area has become a
major wine producing region with 181 wineries (660 workers) and has a robust tourism sector as well as
an emerging craft beer industry.xvi The five-county area has sizable healthcare and higher education
sectors and a small but emerging technology sector. The region has a substantial number of both high
and low-wage jobs. Poverty is a problem in the region, but the economy is gradually transitioning to
higher-paying occupations.
Labor force In 2019, the overall labor force in the five-county area was 82,791 people with 78,872 filled jobs.xvii
Cost of living The five-county region’s cost of living index was higher than expected at 116.6, as compared to
Washington State 114.3, Oregon 114.9, Montana 102.0, and Idaho 99.4.

36
Gross regional product The gross regional product was $7.15 billion with imports (i.e., out-of-region purchases) of $11.1 billion
and out-of-region exports (i.e., sales) of $12.5 billion.
Industry growth An industrial overview is presented in Table 11. The region’s largest employer is federal, state, and local
government at 15,529 jobs. Second is health care at 10,522 jobs. Third is agriculture (mostly production
agriculture) with 8,362 jobs, fourth is manufacturing including agriculture processing with 8,099 jobs,
and retail trade with 7,027 jobs. The fastest growing industry from 2014 to 2019 was arts and
entertainment (28%) followed by construction (20%), accommodation and food service (12%), and
manufacturing (11%).
Table 11. Industry overview of regional economy
Description 2014 jobs 2019 jobs % change 2019
Location quotient
Earnings per worker
Government 15,500 15,529 0% 1.32 $72,588 Health Care/SA 9,753 10,522 8% 1.05 $54,421 Agriculture, Forestry, tec. 8,333 8,362 0% 9.09 $40,442 Manufacturing 7,314 8,099 11% 1.30 $61,199 Retail Trade 6,886 7,027 2% 0.90 $34,763 Accommodation/Food Services 4,759 5,341 12% 0.79 $22,036 Other Services 4,107 4,277 4% 1.15 $22,604 Educational Services 3,240 3,478 7% 1.71 $29,251 Construction 2,853 3,423 20% 0.76 $57,781 Transportation/Warehousing 3,093 3,257 5% 1.11 $65,354 Wholesale Trade 1,665 1,797 8% 0.62 $62,924 Administrative/Waste Management
2,039 1,796 -12% 0.37 $34,228
Professional, Scientific 1,560 1,574 1% 0.30 $59,189 Finance and Insurance 1,612 1,528 -5% 0.48 $67,306 Arts, Entertainment/Rec. 747 957 28% 0.69 $22,509 Real Estate 651 707 9% 0.53 $47,158 Information 641 685 7% 0.48 $64,479 Utilities 351 345 -2% 1.29 $148,119 Management 121 113 -7% 0.10 $72,639 Mining 50 46 -8% 0.14 $63,593 Total 75,277 78,872 5% $51,185
Source: Emsi
Location quotient The location quotient (LQ) for agriculture was 9.09, indicating it is a primary exporter and income
creation force in the regional economy. If the location quotient is greater than one, then there is
proportionally higher employment in that industry than the national average and can indicate an export
industry, bringing new monies into the regional economy.xviii Other important industries with relatively
37
high LQs include government (1.32), educational services (1.71), utilities (1.29), manufacturing (1.30),
transportation (1.11), other services (1.15), and health care (1.05).
Average compensation Table 11 has a measure of average compensation called earnings per worker. Overall, the region had
$51,185 per worker per year, which is below the regional and US averages: Washington State ($70,100),
Idaho ($53,100), and the US ($60,300). The highest wage industry is utilities at $148,119 per worker,
followed by management ($72,639), professional ($67,306), and mining ($63,593). The lowest wages are
in accommodation and food service ($22,036), arts and recreation ($22,509), and other services
($22,604).
Unemployment rates In December 2019, the unemployment rate for Asotin County was 3.9%, Columbia County was 5.7%,
Garfield County was 6.0%, Walla Walla County was 4.8%, and Umatilla County was 3.9%. Washington
State had an unemployment rate of 4.3%, Idaho was 2.9%, and the US rate was 3.4%. The overall five-
county regional unemployment rate was 4.13% for 2019 (Table 12).xix Given the national economy is
near the peak of the business cycle, overall unemployment rates are very low.
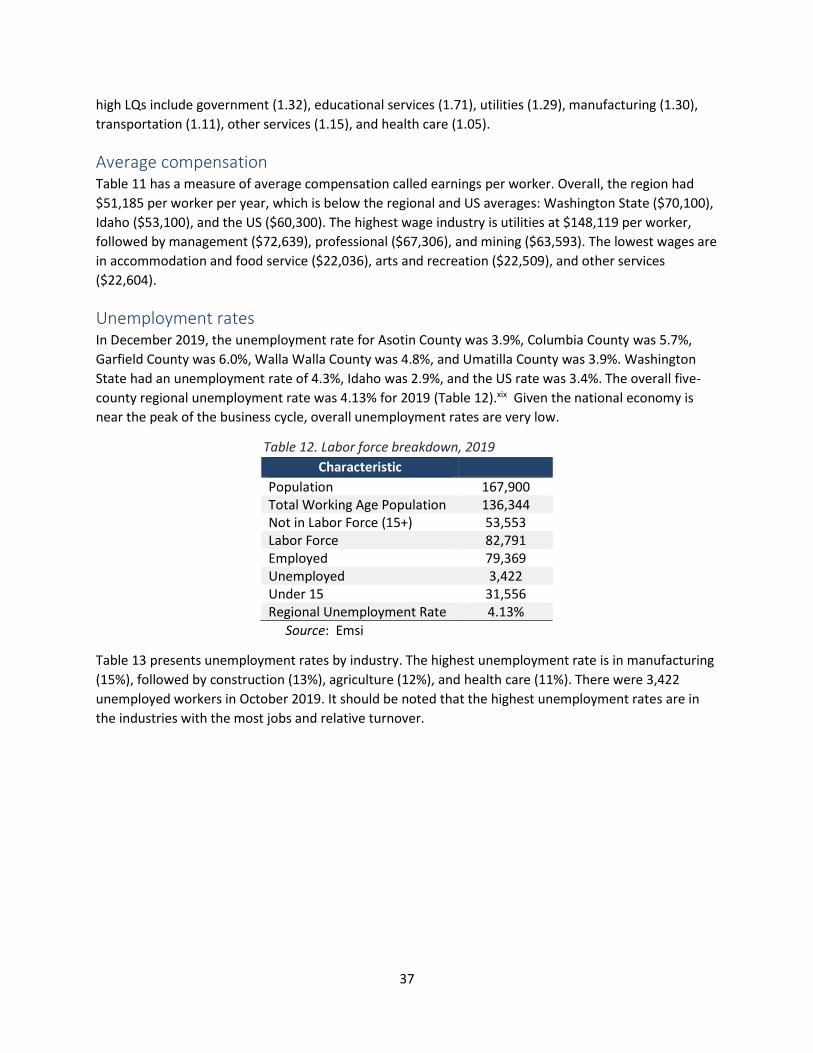
Table 12. Labor force breakdown, 2019
Characteristic
Population 167,900 Total Working Age Population 136,344 Not in Labor Force (15+) 53,553 Labor Force 82,791 Employed 79,369 Unemployed 3,422 Under 15 31,556 Regional Unemployment Rate 4.13%
Source: Emsi
Table 13 presents unemployment rates by industry. The highest unemployment rate is in manufacturing
(15%), followed by construction (13%), agriculture (12%), and health care (11%). There were 3,422
unemployed workers in October 2019. It should be noted that the highest unemployment rates are in
the industries with the most jobs and relative turnover.

38
Table 13. Unemployment by industry
Industry Unemployed
(10/2019) % of regional
unemployment % of national
unemployment
Agriculture, Forestry, etc. 399 12% 3% Mining 6 0% 1% Utilities 32 1% 0% Construction 430 13% 10% Manufacturing 513 15% 13% Wholesale Trade 126 4% 4% Retail Trade 294 9% 9% Transportation/Warehousing 150 4% 4% Information 32 1% 3% Finance and Insurance 58 2% 3% Real Estate and Rental and Leasing 28 1% 2% Professional, Scientific 76 2% 6% Management 2 0% 1% Administrative/Waste Management 132 4% 11% Educational Services 227 7% 3% Health Care and Social Assistance 370 11% 10% Arts, Entertainment, and Recreation 42 1% 1% Accommodation and Food Services 180 5% 6% Other Services 133 4% 3% Government 133 4% 2% Other 59 2% 7% Total 3,422 100% 100%
Source: Emsi
Agriculture The regional economy has a robust and vibrant agricultural sector. Crop production alone directly
employs 5,397 workers (Table 14). Overall, production agriculture employs 8,362 workers with an
average total compensation package (earnings-per-worker) of $40,442. Agricultural processing employs
4,230 workers with an average compensation package of $54,119. Clearly agriculture is one of the
region’s most important employers.

39
Table 14. Production agriculture and agricultural jobs and salaries
Description 2014 Jobs
2019 Jobs
% Change
Location Quotient
Avg. Earnings
Production agriculture sub-total 8,324 8,362 $40,442 Crop production 5,840 5,397 -8% 14.05 $39,434 Animal production 471 602 28% 2.90 $47,928 Logging 47 60 28% 1.75 $44,109 Fishing 32 29 -9% 2.13 $65,565 Support activities for crop production 1,886 2,195 16% 9.02 $40,072 Support activities for animal production 27 25 -7% 1.16 $31,585 Support activities for forestry 22 48 118% 4.54 $59,979 Other 7
Food processing sub-total 3,699 4,230 $54,119 Animal Food Manufacturing <10 22 -- 0.71 $46,576 Flour Milling and Malt Manufacturing 13 13 0% 1.37 $104,061 Chocolate and Confectionery Manufacturing
24 44 83% 2.12 $30,158
Frozen Food Manufacturing 1,021 982 -4% 22.51 $54,022 Fruit and Vegetable Canning 88 201 128% 5.07 $64,655 Animal Slaughtering and Processing 1,388 1,608 16% 6.37 $58,626 Bread and Bakery Product Manufacturing 32 106 231% 0.86 $24,237 Cookie, Cracker, and Pasta Manufacturing 46 14 -70% 0.53 $98,252 Snack Food Manufacturing 272 360 32% 12.77 $50,150 Coffee and Tea Manufacturing <10 21 -- 1.75 $63,508 Seasoning and Dressing Manufacturing 16 16 0% 0.78 $62,504 All Other Food Manufacturing 250 145 -42% 3.34 $48,918 Soft Drink and Ice Manufacturing <10 14 -- 0.29 $65,072 Breweries 27 <10 -- 0.21 -- Wineries 521 660 27% 19.39 $47,624 Distilleries 0 <10 -- 0.16 -- Other 24 --
Total Ag. and Ag. Processing 12,023 12,593
Source: BEA and Emsi
Agricultural production is nearly a $900 million-dollar
regional industry. Table 15 presents the agricultural cash
receipts by county. Most production agriculture is in Walla
Walla County, followed by Umatilla, Columbia, Garfield, and
Asotin counties.
Table 15. 2018 agricultural cash
receipts, by county
County Cash Receipts
Asotin $ 23,397,000 Columbia $ 47,564,000 Garfield $ 35,723,000 Walla Walla $ 442,831,000 Umatilla $ 326,651,000
Total $ 876,166,000
Source: BEA
40
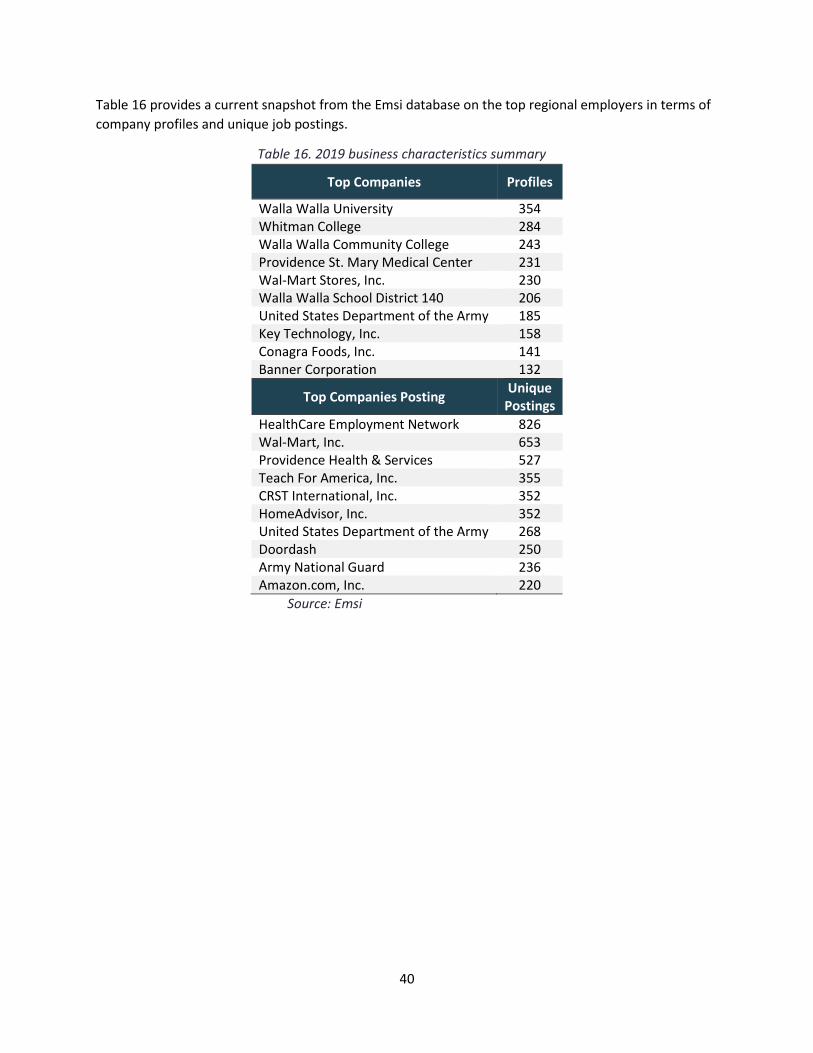
Table 16 provides a current snapshot from the Emsi database on the top regional employers in terms of
company profiles and unique job postings.
Table 16. 2019 business characteristics summary
Top Companies Profiles
Walla Walla University 354 Whitman College 284 Walla Walla Community College 243 Providence St. Mary Medical Center 231 Wal-Mart Stores, Inc. 230 Walla Walla School District 140 206 United States Department of the Army 185 Key Technology, Inc. 158 Conagra Foods, Inc. 141 Banner Corporation 132
Top Companies Posting Unique
Postings
HealthCare Employment Network 826 Wal-Mart, Inc. 653 Providence Health & Services 527 Teach For America, Inc. 355 CRST International, Inc. 352 HomeAdvisor, Inc. 352 United States Department of the Army 268 Doordash 250 Army National Guard 236 Amazon.com, Inc. 220
Source: Emsi
41
Buyer perspectives
Buyer characteristics and contact information We interviewed and surveyed
potential buyers of food hub
products to understand their
interests and constraints. We
interviewed 8 potential buyers,
including representatives from
Harvest Foods, Andy’s Market,
Providence St. Mary’s Medical
Center, Walla Walla School District,
Washington State Penitentiary,
Willow School, Walla Walla
University, and Perione’s Produce. Of
those interviewed, two represented
retailers, five represented institutions,
and one represented a regional
distribution company.
Walla Walla University (Table 17) and
Providence St. Mary’s Medical Center
(Table 18) provide examples of the
scale interviewed and surveyed
institutions represent.
Of the 10 buyer survey respondents,
three represented supermarket or
grocery stores, two represented
colleges or universities, two
represented hospitals, and two
represented K-12 schools (Table 19).
While we cannot generalize results
beyond those who participated, most
of the buyer survey respondents and those interviewed represented relatively large-scale institutions
and grocery stores in the area with considerable buying potential, especially collectively.
Table 18. Overview of Walla Walla University
Overview
• Vegetarian campus
• Provides meals seven days per week
• 1,000-1,400 meals per day
• 300 breakfasts, 475-500 lunches, and 475-500 dinners M-Th. Much less on weekends.
• Cater to large events (400-700 people) and other activities
• Under contract with Sodexo
• Prefer non-GMO and organically grown. They support vegan students and need vegan ingredients.
Table 17. Overview of Providence St. Mary’s Medical Center
Overview
• Serves about 1,000 meals a day
• 800 transactions on normal weekday, which they count as meals
• 60-70 average patients a day with 3 meals on average
• Cancer Center averages 12 trays a day for lunch
• Meals-on-Wheels: 3 days a week, 15-17 meals
• Juvenile Justice Center: 3 meals a day for an average of 15-20 people
• Catering: hospital parties and events
• Contracted with Thomas Cuisine
• Order through US Foods, Sysco, and Charlie’s Produce
• Currently sourcing as much as they can from local farms/companies

42
One respondent indicated they were a restaurant chef. More restaurants were not included in the buyer
survey results because the steering committee thought restaurants should not be a target market for a
food hub. Respondents described their position
in their business or organization as chef, chef
director, chief operating officer, culinary arts
instructor, owner, store manager, and
superintendent. Five respondents said their
business or organization zip code was 99362
(Walla Walla area), one respondent said 97862
(Milton-Freewater area), and one respondent
said 99328 (Dayton area).
Eight buyer survey respondents said they are
interested in the Walla Walla Valley Food System Coalition contacting them to explore opportunities to
buy locally and regionally produced foods when the study is completed. Six out of eight survey
respondents said they would like us to identify their business or organization in this final project report
as one that expressed interest in exploring opportunities to buy locally and regionally produced food.
The contact information for those buyer respondents is provided in Table 20.
Table 20. Buyer survey and interview respondents who are interested in exploring food hub opportunities
and gave permission to be identified in the report
Name Business or organization Phone number Email address
Duane Sorensen K-12 food service [email protected]
Norman Shaw Providence St. Mary’s
M.C. (Thomas Cuisine) 509-897-2802 [email protected]
Ray Nygard Safeway 541-938-5341 [email protected]
Jay Entrikin Wine Country
Culinary Institute 509-540-0511 [email protected]
Greg Schnorr Walla Walla
Community College 509-524-5150 [email protected]
Nolan Lockwood Walla Walla's
Harvest Foods 509-529-5000 [email protected]
% n
Supermarket or grocery store 30% 3
College or university 20% 2
Hospital 20% 2
K-12 school 20% 2
Restaurant 10% 1
Total 100% 10
Table 19. Types of businesses and organizations
represented by buyer survey respondents
43
Interest in sourcing from Walla Walla Valley farms Overall buyer survey and interview results reinforce the finding that there are considerable institutional
and retail markets locally for food products sourced from Walla Walla Valley farms. Most buyer survey
respondents and interviewees already source food products from Walla Walla Valley farms, especially
vegetables and fruits. Figure 18 shows the percentage of buyer survey respondents who currently
source select types of food products from farms located in the Walla Walla Valley. Their interest in
buying locally probably at least partially explains their motivation to participate in the buyer survey.
Only one institution interviewed had little hope of being able to work with a food hub: Walla Walla
Penitentiary. They were interested and supportive of the effort but are very constrained by their
procurement system. Even within those constraints they indicated that they were buying apples locally
but thought it would be hard to expand to anything else.
Figure 18. Percentage of buyers who currently source select food products from Walla Walla Valley farms
(n=10)
Figure 19 shows the number of farms with whom buyer survey respondents said their business or
organization currently has direct buying relationships. Few buyer respondents who are sourcing local
food products currently get them delivered through a third-party distributor. Two out of eight buyer
respondents said their business or organization purchases food products from within the Walla Walla
Valley through a private or cooperative distributor while 50% said they do not (Figure 20).
10%
20%
30%
30%
40%
50%
70%
70%
80%
70%
60%
60%
50%
40%
20%
20%
10%
10%
10%
10%
10%
10%
10%
10%
Fish
Poultry
Eggs
Livestock (e.g., beef, lamb, pork)
Field crops (e.g., wheat, barley, dry peas, dry lentils, hops)
Dairy products
Fruits (e.g., berries, tree fruits)
Vegetables (i.e., row crops)
Chart TitleYes No Don't know

44
13%
0%
25%
38%
25%
15 or more
10 to 14
5 to 9
1 to 4
0
% of buyer respondents
# o
f fa
rmer
s b
usi
nes
s h
as r
elat
ion
ship
wit
h
Figure 19. Number of farmers in the Walla Walla
Valley that buyer survey respondents currently
have direct buying relationships with, % of
respondents (n=8)
Don't know, 25%
No, 50%
Yes, 25%
Figure 20. Percentage of buyer survey respondents
who currently purchase food products from the Walla
Walla Valley through a private or cooperative
distributor (n=8)

45
Figure 21 reports buyer survey respondents’ level of interest in sourcing select types of food products
from farms located in the Walla Walla Valley. Comparing Figures 19 and 22, greater percentages of
buyer survey respondents said they are “very interested” in sourcing all the products we asked about
than are currently buying them. For example, while only 30% currently source local eggs (n=10), 71% of
buyer respondents said they were “very interested” in doing so (n=7) (although eggs were also the
product the highest percentage of respondents said they were “not at all interested” in sourcing from
Walla Walla Valley farms). All buyer respondents indicated they were “very interested” in sourcing local
fruits. That the majority of buyer survey respondents indicated they were “very interested” in sourcing
all the products we asked about from within the Walla Walla Valley could indicate that those who were
motivated to take the survey were those most inclined to support local and regional producers and food
system development. Nonetheless, it demonstrates demand from many potentially large-scale
institutional and grocery buyers located within the study area. One respondent wrote in the “other”
category that they would be interested in “anything ‘local’” and went on to list the examples of “wine,
spirits, and miscellaneous.”
Figure 21. Extent to which buyer survey respondents’ business or organization are interested in sourcing
select food products from Walla Walla Valley farms
57%
71%
71%
71%
75%
86%
88%
100%
29%
0%
14%
14%
13%
14%
13%
0%
14%
29%
14%
14%
13%
0%
0%
0%
Fish (n=7)
Eggs (n=7)
Livestock (e.g., beef, lamb, pork) (n=7)
Poultry (n=7)
Dairy products (n=8)
Field crops (e.g., wheat, barley, dry peas, dry lentils, hops) (n=7)
Vegetables (i.e., row crops) (n=8)
Fruits (e.g., berries, tree fruits) (n=8)
Chart TitleVery interested
Somewhat interested
Not at all interested

46
We asked buyer survey respondents to indicate if they
were interested in purchasing fruits and berries,
vegetables, meats, and herbs in several forms (i.e., fresh,
frozen, canned, and dried). Table 21 shows the greatest
number of buyer survey respondents were interested in
fresh products compared to frozen, dried, or canned (with
the exception of meats where slightly more were
interested in frozen over fresh); however, buyers indicated
some level of interest in products in all forms except for
canned meats and canned herbs.
Buyer survey respondents had the opportunity to list the
value-added or processed food products their business or
organization is interested in sourcing from producers
located in the Walla Walla Valley. Five respondents
provided an answer. Common products they listed
included processed meat, washed and cut produce,
sauces, and flour:
• “All of the above.”
• “Processed meats, flour, baked goods.”
• “Washed and cut produce, processed meat, pesto, flour, bread, wine, beer, cider, soup mix, jam,
sauces, yogurt, jerky, chips, cookies, breads.”
• “Washed and cut produce, whole fruits and veggies, perhaps some jams, sauces.”
• “Washed/cut produce, flour, bread, sauces, yogurt.”
Interviewed buyers were also interested in a wide diversity of
products. Items identified included vegetables, fruit, dairy and eggs,
and meats, as well as minimally processed foods and value-added
products. Providence St. Mary’s Medical Center is an example of an
institution interested in a wide diversity of products in a variety of
forms, including fresh, diced, sliced, frozen, and dried (Table 22).
Walla Walla University presents one of the biggest opportunities for
both diversity and volume of needs. Butternut squash, garbanzo
beans, salad mixes, and ready-to-cook tomatoes are examples of
food products they need daily (Table 23).
Several institutions were interested in long-term planning. Walla
Walla University was interested in developing a local source, which
could include contracts, for specialty vegetables, “like African
vegetables that aren’t normally grown around here.” They were
interested in participating in a pilot to see what worked. They were
also interested in contracting for butternut squash, especially for
supply later in the winter and spring. Butternut squash is one of their
highest volume and most important ingredients that they want year-
round. Diced, cubed, and frozen squash might be an ideal way to fill
Product Form Percent interested
Fresh 100%
Frozen 50%
Canned 38%
Dried 63%
Fresh 100%
Frozen 38%
Canned 38%
Dried 50%
Fresh 63%
Frozen 75%
Canned 0%
Dried 38%
Fresh 100%
Frozen 13%
Canned 0%
Dried 63%
Fruits & berries
Vegetables
Meats
Herbs
Table 21. Percentage of buyer survey
respondents who said they were interested in
purchasing select products from the Walla
Walla Valley, by product and form (n=8)
Table 22. Providence St. Mary’s Medical Center interest in select products
Products wanted
Unique, with color Fresh herbs Vinegars Cucumbers Tomatoes Summer squash Lentils Cauliflower Zucchini Onions Potatoes Carrots (diced) Dried fruit Single-serve juices Eggs

47
out a year-round supply. Other institutions interviewed were also interested in long-term planning and
contracts, especially for high-volume products.
Importance of specific product attributes, such as certified organic and non-GMO We asked buyer survey respondents to indicate how important select characteristics are when they
purchase food products for their business or organization (Figure 22). Regionally and locally sourced
food was important to buyer respondents. The three characteristics the greatest percentages of buyers
said were “very important” were ‘produced within the Northwest,’ ‘in season,’ and ‘produced within the
Walla Walla Valley.’ No respondent said these attributes were “not at all important” to them. Thirty-
eight percent of buyer survey respondents said grass fed was “not at all important” to their food
purchasing decisions and 63% said grass fed is “somewhat important;” however, no one said this
attribute was “very important” to them (n=8).
Table 23. Walla Walla University interest in select products
Products wanted
10 cases of salad mix twice per week Acorn squash
Salad blends: spinach (triple washed), spring Butternut squash
mix (triple washed; 5 big bags per day), Purple cabbage
romaine (including whole romaine heads) Asparagus
Kale Peas
Collard greens Any kind of berry and fruit (including
Tomatoes dehydrated apples)
Grape and cherry tomatoes Red and green grapes
Sauces without herbs Cantaloupe, honeydew, watermelon, and
Tomato paste other melons (daily)
Tomato sauce Garlic (peeled)
Diced tomatoes prepped for sauces Garbanzo beans (precooked, 10 gallons
Cucumber Per day)
Peppers Black beans, split peas, barley, quinoa, lentils,
Onions “we definitely like beans, any kind
Broccoli of beans…”
Potatoes Cheeses (whole, shredded, and sliced)
Carrots (various sizes, colors, and types; Milk
including shredded and cubed) Soy Milk
Celery Yogurt
“All the herbs” Sour cream
Eggplant Butter
Polenta Cottage cheese
Soymilk, sometimes almond, and coconut milk Cage-free eggs (liquid and shell)
48
Also, only one respondent out of eight (13%) said certified organic was “very important” to them
compared to 63% who said it was “somewhat important” and 25% who said it was “not at all
important.” While being certified organic does not appear to be very important overall, all eight buyer
survey respondents said pesticide free is “very important” (38%) or “somewhat important” (63%) and
only one respondent said certified naturally grown is “not at all important.” Together these findings
suggest that official third-party certification may not be essential, but many buyers do value the product
qualities and standards the certification label captures. In other words, many buyers may rely on their
personal relationship with and trust in the local farmer they are working with in lieu of third-party
certification.
Figure 22. Level of importance of select product attributes to buyer survey respondents
Challenges to buying food products from Walla Walla Valley farms When asked to indicate the extent to which several factors challenge the ability of their business or
organization to purchase food products from the Walla Walla Valley, price of products, lack of
distribution system for local products, and concerns about food safety were the top-three factors the
greatest percentages of buyers said were “significant” challenges (Figure 23). All survey respondents
identified the lack of a distribution system for local products, unavailability of specific products, and
inability to access products when needed as at least “moderate” if not “significant” challenges (i.e., no
buyers said these are only minor challenges or not challenges at all).
0%
13%
13%
25%
25%
38%
38%
38%
50%
57%
63%
63%
63%
75%
50%
63%
50%
50%
63%
50%
43%
38%
38%
25%
13%
25%
13%
13%
13%
0%
0%
0%
0%
Grass fed (n=8)
Certified organic (n=8)
Free range (n=8)
Non-Genetically Modified Organism (GMO) (n=8)
Humane Animal Treatment (n=8)
Antibiotic free (n=8)
Certified Naturally Grown (n=8)
Pesticide free (n=8)
Produced within the Walla Walla Valley (n=8)
In season (n=7)
Produced within the Northwest (n=8)
Chart TitleVery important
Somewhat important
Not at all important

49
Figure 23. Extent to which buyer survey respondents experience select challenges to purchasing food
products sourced from within the Walla Walla Valley
In addition, many buyers identified interest in a collective fresh sheet, which is a list of products to
communicate to buyers what is available. For some institutions, like school districts, it would provide
multiple bids in a single place, easing the burden of the bidding process. Another request was for long-
term fresh sheets, preferably online. Many institutions plan their menus and purchasing months in
advance rather than each week.
Several buyer interviewees also wanted someone to coordinate local farmers and organize the available
local supply. Most buyers interviewed were interested in the role of a food hub in providing access to
products from multiple farms. Several mentioned that online ordering similar to that used by
conventional distributors would help integrate purchasing from a food hub with their other systems.
These current challenges identified by survey respondents suggest food hub enterprises will need to be
sensitive to price constraints for many local institutional and grocery buyers. Those interviewed also
identified cost as a potential constraint, although they indicated they had some flexibility and were
optimistic about being able buy from a food hub. Survey respondents also suggested a need for a
distribution system for local products, or that individual producers need to transport their own products
to the buyer. Some food hubs (for example, Puget Sound) require participating farms to have liability
insurance and licenses (e.g., Master Business License and applicable specialty licenses). Requiring
licenses and individual insurance coverage (or providing group-level coverage) could help address
buyers’ food safety concerns thereby opening markets for food hub products and services.
13%
25%
25%
25%
38%
38%
50%
50%
57%
63%
75%
86%
75%
13%
50%
75%
13%
25%
25%
38%
43%
0%
25%
0%
13%
50%
25%
0%
13%
25%
13%
13%
0%
13%
0%
0%
0%
13%
0%
0%
38%
13%
13%
0%
0%
25%
0%
14%
Inability to access the variety of products needed (n=8)
Inadequate knowledge of how to source local products (n=8)
Inability to access a large enough quantity (n=8)
Inability to access products when needed (n=8)
Lower quality of products (n=8)
Unreliability of vendors (n=8)
Your purchasing requirements (n=8)
Ordering process (n=8)
Unavailability of specific products (n=7)
Concerns about food safety (n=8)
Lack of distribution system for local products (n=8)
Price of products (n=7)
Chart TitleSignificant challenge
Moderate challenge
Minor challenge
Not a challenge

50
Likelihood of purchasing through a food hub Figure 24 shows that all buyer survey respondents said they were somewhat or very likely to purchase
food products from a food hub if one existed in the Walla Walla Valley.
Figure 24. Buyer survey respondents’ likelihood of purchasing food products through a
food hub if one existed in the Walla Walla Valley (n=7)
Three buyer survey respondents explained their level of likelihood of purchasing food products through
a food hub if one existed in the Walla Walla Valley. Two buyer respondents who indicated they were
“very likely” to purchase through a food hub if one existed provided the following comments:
• “As a Culinary Arts Program we use foods in every shape, size and quantity imaginable.”
• “Depends on pricing and availability.”
One respondent who indicated they were “somewhat likely” to purchase through a food hub said
“We like to support local farmers but the challenges they face trying to get adequate insurance
coverage and jumping through the hoops to get us the product is often a barrier to doing
business, it is also challenging to juggle different manual ordering processes to ensure we have
what we need for our menu.”
An easy ordering system and delivery would increase many buyer respondents’ likelihood of using a
food hub. The following are all seven responses to the question of what, if anything, would increase
their likelihood of purchasing local food through a new food hub if one were developed in the Walla
Walla Valley:
• “Delivery.”
• “Distribution to our site.”
• “Easy to use order guide, easy payment process and ability to work with our corporate
purchasing structure.”
• “One produce order form.”
• “Single contact.”
• “Gap Certified.”
• “Hours of operation.”
Asked what, if anything, would decrease their likelihood of purchasing local food through a new food
hub if one were developed in the Walla Walla Valley, respondents provided the following answers:
• “Quality of product and safe delivery trucks.”
0%
0%
43%
57%
Very unlikely
Somewhat unlikely
Somewhat likely
Very likely

51
• “Quality/availability.”
• “Cost.”
• “Hours of operation.”
• “Inability to respond to our business needs.”
• “None.”
All buyers interviewed except for Washington State Penitentiary were likely to buy from a food hub in
Walla Walla. In general, they were optimistic about the prospects for local and regional food and
indicated strong consumer demand and willingness to pay a price premium. While each had their own
process and constraints, all expressed a willingness to be flexible and to work through constraints to
make a relationship with a food hub work.
To understand needed services, we also asked the buyer survey respondents about what would help
local farmers sell to businesses or organizations like theirs (Figure 25). Eighty-eight percent (88%) of
buyer respondents said liability insurance and product distribution were “very important” (n=8).
Providing food buyers a single point of purchase was “somewhat important” to 63% of respondents and
“very important” to the other 38% (n=8). Importance of value-added products was more mixed: 25%
said it was “very important,” 50% said it was “somewhat important,” and 25% said it was “not at all
important” (n=8).
Figure 25. Importance of select factors for helping food producers located in the Walla
Walla Valley sell to buyer survey respondents’ businesses or organizations (n=8)
25%
38%
88%
88%
50%
63%
13%
13%
25%
0%
0%
0%
Value-added processing
Providing buyers a single point ofpurchase
Product distribution
Liability insurance
Chart TitleVery important
Somewhat important
Not at all important

52
Supplier interest in a food hub
Food hubs and commercial kitchens suppliers currently use Figure 26 shows the current use of food hubs and commercial kitchens by those who took the supplier
survey. About a quarter of respondents use Blue Mountain Station, but few use LINC Foods or Pasco
Specialty Kitchen. Four supplier survey respondents listed other commercial kitchens they use that we
did not include in the closed-ended survey question. They identified the Elks, First Congregational
Church, and private commercial kitchens.
Figure 26. Percentage of supplier survey respondents who currently use the following
food hubs and commercial kitchens
Current and potential value-added products Twenty-seven supplier survey respondents listed the processed or value-added food products they currently produce for sale. Their responses included canned products (e.g., tomato sauce, tomatoes, pickles, honey, jams, jellies, mustard, and salsa), spices, distilled spirits, candy, frozen products (e.g., berries and meats), smoked meats, baked goods, and packaged fresh meats. The supplier survey asked respondents who currently produce value-added and processed food products to estimate the percentage of the ingredients they source for these products that come from the Walla Walla Valley. The results for this question are presented in Table 24. Thirty-seven percent of those who produce value-added food products source 100% of their ingredients from the Walla Walla Valley, which could be because they have a single-ingredient product (e.g., lamb) or because they grow all the needed ingredients themselves. As one respondent said, “We grow what we use.” The supplier survey also asked respondents who currently produce value-added and processed food
products if there is anything they currently source from outside the Walla Walla Valley for their value-
2%
5%
24%
Pasco Specialty Kitchen, Pasco, WA (n=61)
LINC Foods, Spokane, WA (n=61)
Blue Mountain Station, Dayton, WA (n=62)
Table 24. Percentage of value-added food
ingredients supplier survey respondents sourced
from the Walla Walla Valley
Percentage of ingredients sourced from the Walla Walla Valley
n %
0% 3 10%
1%-25% 3 10%
26%-50% 2 7%
51%-75% 4 13%
76%-99% 7 23%
100% 11 37%
Total 30

53
added products that they would source locally if it were available. Many skipped this question or said
“no”; however, four respondents provided the following answers:
• “Hot peppers, heritage rolled oats.”
• “Pineapple, vinegar.”
• “Tea and some herbs for mixes.”
• “USDA Box Type Meat, Cheese (larger size than 5 lbs.).”
Interest in supplying ingredients for someone else’s product Production from multiple farms may be necessary to provide enough volume of Walla Walla Valley-
sourced fruit, vegetable, or other raw ingredients needed to support production of a value-added
product. Asked to what extent they would be interested in supplying ingredients at wholesale prices for
someone else’s value-added product, most supplier survey respondents expressed at least some level of
interest (Figure 27).
Figure 27. Supplier survey respondents’ level of interest in in supplying ingredients at
wholesale prices for someone else’s value-added product(s) (n=56)
Markets suppliers are currently accessing and interested in accessing Supplier survey respondents currently sell to a variety of markets: direct to consumer, retailers (e.g.,
grocery stores), and restaurants or caterers were the most common (Figure 28). Respondents also
described other markets they sell to. Their responses included “direct to distributors,” “hummus
manufacturers,” “Internet,” “wineries,” and “Northwest Grain Growers and it gets shipped to Asia.”
11%
55%
34%
Not at all interested
Somewhat interested
Very interested

54
Figure 28. Percentage of supplier survey respondents who currently sell products through select markets
Many supplier respondents said they were “very interested” in increasing sales to the markets we asked
them about (Figure 29). For example, in addition to the markets many are already commonly selling to
(i.e., direct-to-consumer, restaurant, and retail markets), 46% said they are “very interested” in
increasing sales to institutions and 35% said they are “very interested” in increasing sales to food bank
or food pantry markets. Many others said they are at least “somewhat interested” in increasing sales to
these markets.
Figure 29. Supplier survey respondents’ level of interest in increasing sales to select
26%
27%
29%
47%
54%
75%
Processor, mill, or packer (n=54)
Food bank or food pantry (n=55)
Institutional (e.g., hospitals, schools) (n=56)
Restaurant or caterer (n=57)
Retailer (e.g., grocery store, co-op grocery store,supermarket) (n=57)
Direct to consumer (e.g., farmers market, farmstand, CSA, U-pick) (n=57)
35%
46%
54%
58%
68%
31%
25%
23%
28%
23%
33%
29%
23%
14%
9%
Food bank or food pantry (n=54)
Institutions (e.g., hospitals, schools) (n=56)
Retailers (e.g., grocery store, co-op grocery store, supermarket) (n=57)
Restaurants or caterers (n=57)
Direct to consumer (e.g., farmers market, farm stand, CSA, U-pick) (n=57)
Chart Title
Very interested Somewhat interested Not at all interested

55
Supplier project participants expressed interest in growing, processing, and selling a wide diversity of
value-added products. Figure 30 shows the percentage of survey respondents who said they are
interested in producing and selling processed or value-added
food products in the future (whether they currently are or not).
Thirty-six survey respondents listed the processed or value-
added products they are interested in selling in the future. Their
responses included canned tomatoes, tomato sauce, pickled
products, cider, hard cider, gluten-free baked goods, vegan
goods, mixes, flour from various grains, dried fruits, dried meats,
frozen vegetables, honey, ice cream, cheese, jam, mustard,
spices, pre-packaged frozen entrees, and fresh meat products.
Interest in specific food hub services Food hubs can offer a variety of services. Out of these options,
people must settle on a few or one to start. An important part
of feasibility is knowing what people want to do.
The supplier survey asked respondents how interested they
would be in using a variety of food hub services if new services
were available (Figure 31). Of those included on the survey, retail, marketing, and product distribution
were the services supplier respondents expressed the most interest in while office space, cool storage,
and dry storage garnered the least interest. Overall, respondents expressed at least some level of
interest in many potential food hub services.
Figure 31. Supplier survey respondents’ level of interest select food hub services
In the course of the assessment, many producers and other food entrepreneurs said distribution is a
barrier. For example, interviewees pointed to several businesses in Dayton and Walla Walla to illustrate
how some entrepreneurs had developed strong products but were unable to fully access markets
5%
12%
18%
21%
21%
29%
31%
32%
32%
34%
51%
52%
62%
10%
40%
38%
28%
28%
34%
37%
30%
20%
23%
43%
38%
27%
78%
38%
27%
42%
40%
34%
22%
27%
39%
28%
7%
7%
8%
7%
10%
17%
9%
11%
3%
10%
12%
8%
15%
0%
3%
3%
Office space (n=58)
Meeting space (n=58)
Hiring someone to do value-added processing for you (n=60)
Cool storage (for potatoes, garlic, etc.) (n=57)
Dry storage (n=57)
Refrigerated storage (n=59)
Collective branding (n=59)
Value-added processing equipment rental (n=60)
Freezer storage (n=59)
Shared liability insurance (n=61)
Product distribution (n=61)
Marketing (n=61)
Retail (n=60)
Chart TitleVery Somewhat Not at all Don't know
No, 36%
Yes, 64%
Figure 120. Supplier survey
respondents interested in producing
and selling processed or value-added
food products in the future (n=67)

56
because they did not have distribution that met their needs. Although interviewees identified existing
distribution options, almost everyone indicated that more and better options were needed. In addition,
several of the interviewees representing institutions wanted a single point of contact for purchasing and
scheduling deliveries.
The main interest of one interviewed producer was for collaborative marketing, for example, signs that
promote a fruit or vegetable variety. Another suggested developing “creative collaborative alliances” for
marketing and sales. The general consensus was that producers want to keep their own farm brand
rather than join a collaborative brand. One idea was to include labeling that identifies both the producer
and the food hub similar to the approach Western Montana Growers Cooperative has adopted.
Food hub location Most of those interviewed thought the food hub should be in or near Walla Walla. One suggested
College Place. Almost everyone thought outside of downtown was best, somewhere with good access to
the two main highways (highways 11 and 12). Since Blue Mountain Station (BMS) is in Dayton and most
of the production is in Walla Walla and Umatilla counties, several thought it makes sense to locate the
food hub somewhere along the Washington and Oregon border between College Place and Milton-
Freewater, while others suggested near Myra Road near Highway 12. The discussion of location included
the idea that the ideal location for most services would not likely be compatible with retail. Many
interviewees and steering committee members thought a location outside of town was ideal to avoid
congestion and reduce cost. Others pointed towards the potential need for city services such as water
and sewage as very important to site selection.
The Port of Walla Walla did not seem interested in leasing a food hub space, according to several
steering committee members who presented the project to them. The Port of Columbia is ready to
facilitate this type of activity, as evidenced
by BMS. BMS has plenty of room for new
buildings for a food hub, but this location
does not serve the Food Bank well.
Several interviewed producers, especially
those on the other side of Dayton from
Walla Walla, thought a farmer drop-off
location at BMS that includes a cooler and
other space for storage would be useful.
When asked where the most convenient
location for a new food hub or
commercial kitchen would be, 53% of
supplier survey respondents said Walla
Walla and 21% said Milton-Freewater
(Figure 32). Nine percent answered that
an “other” location would be most
convenient. They provided the following responses:
9%
5%
12%
21%
53%
Other
Touchet
Dayton
Milton-Freewater
Walla Walla
Figure 3213. Most convenient location for a new food
hub or commercial kitchen for supplier survey
respondents (n=57)

57
• “Either Dayton or Walla Walla.”
• “Moses lake.”
• “Tri-Cities.”
• “Tri-cities for best freight options, or Walla Walla would be 2nd choice.”
• “Waitsburg.”
On average, supplier survey respondents said they were willing to travel 22 miles to use a new food hub
or commercial kitchen (median = 20 miles, mode = 20 miles, range = 0 to 70 miles). The largest
percentage of respondents said they would be willing to travel 11 to 20 miles (Figure 33).
Figure 33. Miles supplier survey respondents said they would be willing to
travel to use a food hub or commercial kitchen (n=45)
As several project participants pointed out, the location of the food hub is likely to be wherever the
Food Bank locates. If the Food Bank expands its existing building, then the current location of the Food
Bank will be the future food hub site. If the Food Bank moves, then the food hub location will need to be
ideal for the Food Bank as well. Those interviewed indicated that no or few suitable buildings exist in
Walla Walla for a food hub or for a combination food bank/food hub. Several buildings were discussed
or identified in interviews, each of which was not suitable upon further investigation or discussion.
Suitable sites to lease to launch food hub services while the Food Bank fundraises and buys or expands
its facilities were identified in the area.
Guiding principles Several guiding principles emerged during interviews, producer meetings, and steering committee
meetings. We present the primary guiding principles that stakeholders emphasized throughout the
project here:
• Complementariness. The food hub needs to fit a need not currently met by others; it needs to
complement rather than compete with existing businesses and relationships and produce
something no one else has produced at high quality.
• Economic viability. The food hub needs to be economically viable, ultimately, if not initially, and without relying solely on grants. It needs to be able to scale up to a level to have employees for long-term sustainability. Multiple people indicated that the food hub needs to be consumer driven in the sense of focusing on what people want to buy and eat rather than what people want to grow.
13%
20%
36%
18%
9%
4%
≤ 5 miles
6-10 miles
11-20 miles
21-30 miles
31-50 miles
˃ 50 miles

58
• Fairness. All those participating need to be treated fairly, including everyone in the supply chain, from producer, to warehouse worker, to buyer, to consumer. Farmers and employees need transparency and opportunities to participate in decision making and ownership. Several of those interviewed said that it takes a lot of time to give everyone a voice, but it is worth it to build needed relationships.
• Inclusivity. Farmers interested in participating, including those active in the project steering committee, use a variety of practices including both organic and nonorganic. To accommodate those most interested in participating, the food hub will need some flexibility. A common conclusion was that the food hub needs to cast a wide net while having high product quality and stewardship standards, but not necessarily require participating farms to be organic. One reason mentioned was the difference in cost: for example, a number of those interviewed indicated that equipment for organic processing needs to be cleaned or separated from that for nonorganic. Another conclusion was that this discussion could wait for later parts of the food hub development process.
Suppliers’ likelihood of participating For a food hub to be successful, not only
do people have to want to buy its
products, but producers must want to
use its services. Figure 34 shows most
supplier respondents said they were
“very” or at least “somewhat” likely to
use a food hub if they had access to one
in the Walla Walla Valley. As with the
buyer survey, many potential suppliers
were likely motivated to take the survey
because they are interested in
participating.
Figure 35 shows the likelihood supplier
survey respondents would use a food
hub if they had access to one in the Walla Walla Valley by business size in terms of annual sales. Supplier
survey respondents represented a range of business scales, including some with annual sales of
$250,000 or more in 2017. Four of the nine respondents with businesses of $250,000 or more annual
sales in 2017 said they would be “very likely” to use a food hub and another four said they would be
“somewhat likely.” The one business at that scale that was “very unlikely” to use a new Walla Walla
Valley-based food hub explained they already had access to their own private resources. Overall, this
figure illustrates interest in a food hub from potential suppliers representing a range of capacities and
scales.
7%
5%
49%
39%
Very unlikely
Somewhat unlikely
Somewhat likely
Very likely
Figure 34. Supplier survey respondents’ likelihood of using
a food hub if they had access to one in the Walla Walla
Valley (n=61)

59
Figure 35. Supplier survey respondents’ likelihood of using a food hub if they had access to one in the
Walla Walla Valley, by annual sales (n=56)
Forty-two supplier respondents provided explanations for their likelihood (or unlikelihood) of using a
new food hub if they had access to one in the Walla Walla Valley. Those who indicated they were “very
likely” to use a new food hub were commonly motivated by the hub’s proximity to their farm and
customers; opportunities for processing, storage, and retail space; and the potential to facilitate
access to new intermediary markets, such as institutions. Supplier survey respondents’ explanations for
their level of likelihood of using a new food hub can be found in Table 25. The supplier survey asked
respondents what, if anything, would increase their likelihood of participating in a new food hub if one
were developed in the Walla Walla Valley. Responses to this question are presented in Appendix D.
32%
71%
44%
44%
68%
14%
33%
44%
0%
14%
6%
0%
0%
0%
17%
11%
<$10,000 (n=22)
$10,000 -$49,999 (n=7)
$50,000 -$249,999 (n=18)
≥ $250,000 (n=9)
Chart TitleVery likely Somewhat likely Somewhat unlikely Very unlikely

60
Table 25. Themes in what supplier survey respondents said would increase their likelihood of
participating in a new food hub if one were developed in the Walla Walla Valley
Theme Example Quotations
Fit of
equipment/services
“At least 500 square feet of available freezer/cold storage space.”
“Availability of the right equipment for my needs. Reasonable rental fees.
“Commercial kitchen.”
“Commercial kitchen, keeping my brand, shared distribution opportunities.”
“Distribution, STORAGE, collective marketing.”
“Establishment of a commercial kitchen.”
“Overhead door and community forklift. Help with increasing distribution would
be a nice benefit.”
“Staff to assist retail.”
Facilitating access
to new markets
“Thoughtful leadership, quality space, opened new markets.”
“Increasing ability to enter new retail markets/opportunities.”
“Opportunity to have more direct sales.”
“Ability to cross-pollinate marketing strategies, especially to reach out to the
tourists coming to town, giving them options to branch out of wine tasting to
enhance their overall experience.”
“Sustained availability of fresh product.”
Convenient
location
“Very affordable and in Walla Walla.”
“Location, pricing, hours.”
“Cost and distance from home. Hours available.”
“Distance from town (MF, CP area). Cost vs building my own facility. Privacy of
dedicated production space (process IP).”
Convenient hours
of operation
“Hours open in the evening.”
“Convenience of the time schedule. We have a routine and want access
processing when we're ready for it.”
Profit
“Price received for our produce.”
“Having excess produce and help. I am not familiar with how a food hub would
work or the kind of prices we could get for our produce. Getting sufficient
prices for our produce and a demand for high-quality organically grown
produce would be great.”
“Increased Revenue.”
Affordable for
suppliers
“Low cost or free.”
“Affordability and location.”
“Price, support, accessibility.”
Production
practices
“A focus on organic/regenerative production. A bilingual approach to include all
of WW's populations.”
“If the new hub is focused on regenerative farming practices and organic, non-
GMO crops and products.”

61
The supplier survey also asked respondents “What, if anything, would decrease your likelihood of
participating in a new food hub if one were developed in the Walla Walla Valley?” Common themes
related to what would decrease suppliers’ participation in a food hub included prohibitive costs, travel
distance, and poor management. Responses to this question are presented in Table 26.
Table 24. Themes in what supplier survey respondents said would decrease their likelihood of
participating in a new food hub if one were developed in the Walla Walla Valley
Theme Example Quotations
Poor fit between
supplier and
offered
equipment/services
“Exclusive emphasis on existing infrastructure & systems.”
“Expensive lease. No overhead door or trench floor drains. No community
forklift for pallet freight.”
“Lack of a commercial kitchen.”
“Not having the right equipment. Lack of certification/recognition of kitchen by
state/federal authorities.”
Cost prohibitive to
participate
“Availability and price.”
“Costs.”
“Facility use pricing.”
“Financially not feasible. Too far from farm to make it worth it.”
“High cost, limited access.”
Inconvenient
location
“>15 distance to food hub.”
“Distance.”
“If it was located away from Walla Walla. Increased competition for existing and
developed markets.”
“If it was not near Walla Walla or College Place.”
Poor management
“How many hands are in the pot.”
“Poor chemistry of leadership, lack of marketing savvy.”
“Squabbling over organic vs. conventional. Poor tracking, poorly documented
shrink, mishandling, priority management of like produce.”
Inconvenient hours “If it was only operating during the hours I need to be in the field.”
Production
practices
“If it is designed to use conventional methods that produce waste, toxins, and
trash that clogs the environment.”
In contrast to the 39% who said they would be
“very likely” to use a new food hub, when asked
about their likelihood of using a new commercial
kitchen if they had access to one in the Walla
Walla Valley, only 13% of supplier survey
respondents said they would be “very likely” to
use it (n=61) (Figure 36). Figure 37 shows how
likelihood of commercial kitchen use breaks
down by respondents’ business size in terms of
annual sales (2017). Likelihood responses are
generally distributed across annual sales groups.
30%
21%
36%
13%
Very unlikely
Somewhat unlikely
Somewhat likely
Very likely
Figure 36. Supplier survey respondents’ likelihood of
using a new commercial kitchen if they had access to
one in the Walla Walla Valley (n=61)

62
Figure 37. Supplier survey respondents’ annual sales, by likelihood of using a new commercial kitchen if
they had access to one in the Walla Walla Valley (n=56)
The supplier survey respondents’ explanations for their likelihood (or unlikelihood) of using a new
commercial kitchen if they had access to one in the Walla Walla Valley are provided in Appendix D.
18%
29%
6%
11%
45%
0%
33%
44%
14%
14%
33%
22%
23%
57%
28%
22%
<$10,000 (n=22)
$10,000 -$49,999 (n=7)
$50,000 -$249,999 (n=18)
≥ $250,000 (n=9)
Chart TitleVery likely Somewhat likely Somewhat unlikely Very unlikely

63
Lessons learned: Food hub case studies
Case study overview and summary We developed case studies of several existing food hubs within the Northwest to understand some of
the potential models for a food hub in the Walla Walla Valley. The project originally looked at five
examples: Puget Sound Food Hub, Local Inland Northwest Cooperative (LINC) Foods, Mission Mountain
Food Enterprise Center, Western Montana Growers Cooperative (WMGC), and Pasco Specialty Kitchen.
We picked these five operations to study based on discussions with the project steering committee and
key informant interviews. To develop the case studies, we interviewed representatives of the food hub
and gathered information from websites of each operation. The purpose of the case studies was to
provide lessons learned for the steering committee to consider as part of scenario development. This
includes an operational overview, a sense of territory and scale, services provided, equipment and
facilities, management or business model, funding sources, and contact information.
In addition to the five food hubs we developed into case studies, we interviewed representatives of five
more operations to inform our scenario development, analyses, and recommendations: Kraay’s Market
and Garden, Blue Mountain Station, and three food hub development efforts that did not succeed. The
three we interviewed that did not succeed were Idaho’s Bounty, which operated for a number of years
before failing, a proposed food hub in Gem County, Idaho, and an effort in northeast Oregon that
conducted a feasibility study but was unable to gain enough political and funding support to progress.
We use these to supplement the discussion of the case studies.
Food hub models The case studies included different models of services provided. Tables 27 to 31 summarize each case
study food hub operation. Puget Sound Food Hub is an example of a food hub that offers marketing,
aggregation, and distribution services. In this report, we call this a distribution food hub, since core
operations are similar to regional food distribution companies. Located in the Skagit Valley, the Puget
Sound Food Hub has access to population-dense markets and many suppliers. LINC Foods and WMGC
are also distribution food hubs. LINC Foods is also an example of a hybrid food hub because it is
developing a value-added operation. Mission Mountain Food Enterprise Center and Pasco Specialty
Kitchen are examples of local agency-led food hubs that support food entrepreneurs with commercial
kitchens and business support services. Mission Mountain Food Enterprise is another example of a
hybrid model. It includes multiple value-added processing services, a well-developed commercial
kitchen facility, and training and business support.

64
Puget Sound Food Hub Table 27. Case Studies: Puget Sound Food Hub Case Study xx,xxi,xxii
Operation Overview Feasibility assessed in 2006, operation began in 2009 Administrative office and distribution facility in Mt. Vernon, WA Satellite drop site in Everson, WA 52 members, including groups (e.g., Lummi Island Wild)
4 employees
Farm-to-business/institution model Market: restaurants, grocery stores, food co-ops, food manufacturers,
campus dining services, commissaries, schools, childcare centers, and hospitals
Territory and Scale Serves Whatcom, Skagit, Island, San Juan, Snohomish and King counties) Distributes 3,000 lbs./week of produce, meat, dairy, flour, and other products
$1.4 million in sales in 2017, $2.4 million in sales in 2018
Services Marketing, aggregation, and distribution Buyers and sellers have an online account where buyers place orders and
sellers update their inventory, pricing, and profile. Farms pack and deliver to the Skagit warehouse or Whatcom County
drop site Direct delivery to customers Tuesday/Friday deliveries Real-time invoices upon delivery (one invoice even if multiple farms’ products
included in delivery)
Farmers paid weekly Equipment and Facilities
8,000 ft2 facility with 2,000 ft2 refrigerated space Rentable dry, cold, or freezer space ($125/pallet/month) Five 16 ft delivery trucks
Online ordering and management software
Management Model Farmer-owned cooperative
Farmer board meets monthly
Non-profit 521 corporation Farm co-ops or associations can list products under one organizational name
Other Key Characteristics Products are source identified (and hub does not own product)
Farms pack their own boxes traceable to the source farm
Farms develop and maintain customer relationships and negotiate their own prices
Farms required to have $1M/$2M liability insurance, a Master Business License, and applicable specialty licenses
Farms required to follow WSDA marketing guidelines and size/scale standards
Farms required to have ≥1-year wholesale experience
Products not directly produced by the farm must be approved in advance
51% of ingredients in value-added foods must be produced by the farm selling Funding Sources
$250 refundable membership investment and $100 annual membership dues
Grants to expand freezing and refrigeration capacity Contact information
Billing Address: P.O. Box 2924, Mount Vernon, WA 98273
Tel.: 360-336-3727 Fax: 360-336-3751
General Inquiries: [email protected]
Terri Hanson, General Manager [email protected]
Scott Morris, Operations Manager [email protected], 360-399-8302
Joan E McIntyre, Sales and Marketing Manager [email protected], 360-399-9196

65
Local Inland Northwest Cooperative (LINC) Foods Table 2258. Case Studies: Local Inland Northwest Cooperative (LINC) Foodsxxiii,xxiv
Operation Overview ~50 farmer members
Distributes to wholesale buyers
Includes CSA
Malting at LINC Malthouse for brewers and distillers
Markets for fruits, vegetables, grains, legumes, meats, cheeses, and eggs: wholesale (e.g., universities, hospitals, restaurants, and grocers) and direct to consumer via LINC Box Microbrewing and distilling markets for malt (starting in ~2016)
Territory and Scale Territory bound by Cascade Mountains to west, Rocky Mountains to east,
Blue Mountains and Wallowa foothills to south and SE, and Canada to north
Farmer members must be within a 3-hour driving radius from Spokane
Serves greater Spokane, WA area with some distribution links in Walla Walla Valley, Palouse, and western Montana
Services General
Web-based ordering system Farmers drop off at LINC site Minimal processing for fee $5 million product liability insurance policy Pays farmers by check within 15 days after delivery to LINC Inspection upon farmer delivery to ensure quality and that matches farmer’s online description
LINC Box
LINC Box members pick up weekly
Two seasons: June-Thanksgiving and Winter Box
Half $25, full $50 (Winter $40)
Can add value-added products
Pickups at one site for Winter Box
Pickups at 5 sites during primary season (2 in Spokane, 1 Coeur d’Alene, 1
Cheney, 1 Airway Heights)
Services cont.
Wholesale
Fresh sheets sent to wholesale buyers Tues. and Fri. mornings
Orders due by 11pm Wed. and Sun
Direct deliveries Tues. and Fri. mornings
Buyers pay by check or through credit card or ACH payment
Equipment and Facilities Evolved over years. Started using cold storage in a Comfort Inn Hotel, then
partnered with Second Harvest Food Bank for one palate each cold, freezer, and dry storage
Malting facility
Management Model and Other Key Characteristics Worker and farmer-owned cooperative
Sourced primarily from farmer-members
Members required “to put into place a basic food safety program and agree to not use pesticides, herbicides, chemical fertilizers, and genetically modified organisms” (exception is malt grain producers)
Farmers set their own prices
Funding Sources Annual $100 refundable membership
LINC receives 25% of the revenue earned through sales)
Hired 1st employee with Specialty Crop Block grant
Moved to own warehouse with Value-added Producers grant (2017) $25,000 University of Washington Business Accelerator funding to pay
employees and start malting facility
Financing for malting facility
Contact information Billing Address: 3808 N. Sullivan Rd, BLDG 12P, Spokane Valley, WA 99216
General Inquiries: [email protected]
Beth Robinette, [email protected], 509-990-4247
Joel Williamson, [email protected], 509-230-1223
Brian Estes, [email protected], 509-521-0606
66
Mission Mountain Food Enterprise Center Table 29. Case Studies: Mission Mountain Food Enterprise Center
Operation Overview
Started in 1998
Food processing, research, and development facility Through grants and projects developed a $4.5 million facility Most equipment bought with grants
Program funding keeps it growing not revenues
Currently revenues support costs of facility and processing staff Technical assistance supported on grants Main client is $5M per year growers cooperative
Territory and Scale Lake County, MT Technical assistance programs are regional and statewide
Products and Services Business assistance services include grant writing and helping secure loans Support to form a cooperative Co-pack—process raw commodity into value added Four value-added processing lines Food safety technical assistance, training, and education Rent equipment and storage Developing own brand
Test runs of value-added product to test market Equipment and Facilities
Extensive list
Management Model Nonprofit started by and partnered with an economic development agency Originally food hub and technical programs separate; now merged as one nonprofit $180K operational base and approximately $500K total with programs
Other Key Characteristics 4 full-time employees in co-pack operation
1 food safety employee
Funding Sources Kellogg Foundation funded first community assessment
USDA Rural Cooperative Development Program funded hiring a staff member
Another grant to buy commercial kitchen equipment
Coordination at state level secured Agriculture Innovation Center Grant through USDA for 4 years
Contact information
Billing Address: 407 Main Street SW | PO Box 128 Ronan, Montana 59864
Tel.: (406) 676-5901 Fax: (406) 676-5902
General Inquiries: [email protected]
www.lakecountycdc.org
Jan Tusick, Director

67
Western Montana Growers Cooperative (WMGC) Table 30. Case Studies: Western Montana Growers Cooperative
Operation Overview
Started in 2003
40 farms in western Montana Distribute to institutions (11%), restaurants (21%), grocery stores (18.2%),
natural food stores (38.4%) $3.4 million in sales in 2018
Territory and Scale Farms from western Montana, markets include all of Montana with a focus on
western Montana and Missoula Products and Services
On farm pick up Cold and freezer storage Distribution in Missoula (43%), western Montana, and with partners all of
Montana CSA
Equipment and Facilities 4 trucks, forklifts and warehouse equipment
Management Model Farmer cooperative: aggregation, distribution, marketing and sales
Other Key Characteristics Profitable once reached $.5 million in sales
2 large dairies and 2 large egg producers provide 50% of sales and stabilize year-round cash flows
Funding Sources Grants, member loans, bank loans, member equity, revenues
Contact information Billing Address: 1500 Burns St Suite C, Missoula MT 59802
Tel.: (406) 546-3960
www.wmgcoop.com
Jim Sugarek, Accounting

68
Pasco Specialty Kitchen Table 31. Case Studies: Pasco Specialty Kitchen
Operation Overview Started in 2003
Licensed by WA Health Department
Part of Pasco Main Street Program for economic development
Meant to be a business incubator
Rent starts at $20/hour (max. rent = $800/month for unlimited hours), also
minimum monthly fee to encourage only food businesses and discourage
hobbyists
Available 24 hours a day, 7 days a week, 365 days a year
Capacity for 9+ businesses to use at a time
Currently have ~39 clients (13 with storefronts and 26 without storefronts)
2 employees: operations administrator and office administrator
Territory and Scale
Serves Tri-Cities and surrounding region
Services Commercial kitchen
Web-based scheduling and billing (Food Corridor)
Storage space
Street-facing retail space
Technical assistance
Commercial Foods Academy partnership with Pasco High School
Food truck leasing program
Free vendor space at Pasco farmers’ market and other events
Equipment and Facilities 12,000 ft2
3 kitchens (main, center, prep)
Extensive equipment list available at www.downtownpasco.com/psk/facility-
details/
Scalable, modular equipment and facilities
Meeting area
Management Model Managed by the City of Pasco
One employee manages operations, and another does office administration
Other Key Characteristics
Has adapted over the years to changing “food industry trends” by retooling
equipment, changing billing structure, and so on
Use requirements:
City of Pasco business license
Food handler’s permit
Health permit
Insurance
Signed agreement with Pasco Specialty Kitchen
$25 application fee
51% of ingredients in value-added foods must be produced by the farm
selling
Funding Sources
Rent (but below the market rate) and minimum monthly fee
City of Pasco owns the building
US Department of Commerce Economic Development Administration (EDA)
Program
Community Development Block Grant (CDBG) program, WA Dept. of Housing
and Community Development
Contact information
Kristi Correia, [email protected], 509-545-1172

69
Case study conclusions The distribution services food hubs (LINC Foods, WMGC, and Idaho’s Bounty, for example) in general
had a long hard path to become profitable. Idaho’s Bounty went out of business and LINC Foods is still
struggling its way towards profitability. Both LINC Foods and WMGC have been challenged by the
seasonality of agricultural production in the region. LINC Foods has added a value-added operation—
malting—to try to create a higher-margin, year-round operation to stabilize the business and make it
profitable. WMGC has increased its distribution of eggs and milk to provide year-round sales and
distribution. These are the two main strategies identified in the case studies and interviews to try and
overcome the low margins and season volatility of the food hub distribution model.
While not everyone had success in value-added ventures, almost everyone recommended starting there
rather than with general produce distribution. The exception was WMGC, which tried to develop frozen
food product lines and did not like the experience. Their feedback was to not merge value-added and
distribution functions because they represent different types of businesses, which did not turn out to
have enough synergy to work in their experience.
Among food hubs studied, we found a variety of startup stories and financing models, which were
largely shaped by who was the lead in starting and running the operation (Figure 38). We found several
models of private efforts, including private cooperatives and family businesses. Others were started and
managed by public agencies. Table 32 provides a description of each.
•Incubator, commercial kitchen, value-added, business and technical support
County agency
•Distribution and retail sales, home delivery, CSA, trucking
Family
•Distribution, value-added processing, CSA, branding, and marketing
Cooperative
Lead entity Services
Figure 38. Model by lead entity for case studies

70
Table 32. Food hub startup stories and financing models
Type Description
Bootstrapping
This startup and financing model included little or no startup funding and heavy reliance on resources from generous partners. In these cases, founders volunteered their time during start up, sometimes for years, and some had a heavy reliance on grants for scaling up. The startup approach was to focus on creating transactions—selling some products to get the process started as the food hub puts the resources together to scale up or stabilize the operation. The best example of this type that we studied is LINC Foods, which started out of the trunk of the founders’ car and borrowed cooler space from generous community partners (including a food bank). LINC Foods is a private employee-producer cooperative in which those working at the food hub can become members and receive equity shares same as member producers. Other examples include starting out with the equipment the food hub can afford, scaling up the operation until the equipment is inadequate, and then upgrading once the food hub has built enough supply chain to leverage to the next scale.
Expanding on an established business
Food hubs can also develop as a next step in a well-seasoned business that has been successful in compatible activities and now is adding food hub services as a next step in their development. Kraay’s Garden and Market near Bellevue, Idaho, is a good example of this. Building on their successful organic farm and farm stand, they expanded into distribution to retailers, restaurants, and institutions and home delivery for their own farm as well as over 50 other farms in the area. They built their food hub up from their own existing private resources without debt or grants. As they launched food hub services, they built upon their relationships with producers and buyers established through their successful farm stand.
Private producer cooperative
Another model is the private producer cooperative. Western Montana Grower’s Cooperative is a good example of this. They pick up, aggregate, store, market, and distribute products from approximately 40 farms in western Montana primarily to buyers in Montana. They started with member equity, loans, and in-kind services. Grants were important to their scaling up, but they have successfully completed equity drives and have received traditional financing, including bank loans in addition to revenues from operations.
Public agencies or nonprofit
The other operations we studied were either run by public agencies or nonprofits started and managed by public agencies. These included a city (Pasco Specialty Kitchen), a county port (Blue Mountain Station), and a county economic development agency (MMFEC). These operations focus on creating business and economic development opportunities. All of these were heavily subsidized if not largely supported by public funding, including grants but also generous amounts of agency staff time. Funding for these types of operations included using existing land, staff, and other resources for startup, in-kind staff for management and operations, and grants, subsidized or guaranteed loans, and local bonds.

71
All the operations studied generated revenues, which supported or helped support their operations.
Private operations used grants to start up and scale up operations but tended to be more focused on
building their revenue towards profitability. The public agencies were attempting to be as self-sufficient
as possible within the context of heavily
subsidizing the efforts through in-kind
staff, grants, and other public resources.
Commercial kitchens are a good example
of this type of effort. All studied (Pasco
Specialty Kitchen, Mission Mountain
Enterprise Center, Blue Mountain
Station-) were heavily subsidized by
grants and other public funding and did
not pay for themselves. At best, they
generated enough fees to pay for some
time for someone to provide scheduling
and some management.
In general, grants played several roles at
different points of business development
(Figure 39).
For the food hubs studied, the type of
group starting the food hub also
determined the resources available to
them. Private cooperatives and family
businesses relied upon their own resources and the resources of their members (equity drives and
loans) and used grants to supplement and enable scaling up. Grants were useful and important but were
seen as limited in scale and length of impact. The exception is Idaho’s Bounty (a nonprofit producer
cooperative), which according to two previous board members interviewed, was too focused on grants
as central to their business model. In this example, those interviewed indicated that the overreliance on
grants masked problems with their business model (i.e., not being profitable and being too
geographically extended in rural areas in their distribution), which led to eventual collapse. This was the
only negative example of use of grants as a funding mechanism identified by those interviewed. For the
public agencies on the other hand, a steady stream of large grants or in-kind staff was central to their
business model.
Almost everyone indicated that it took a lot of flexibility and good will among their partners to make
their effort a success. Most of the private efforts as well as the public agency efforts indicated a strong,
supportive network of nonprofits and public agencies providing resources, technical support, and access
to funding. Almost everyone indicated having gone through rapid adaptation based on experience. No
one interviewed described developing a plan and then having it work out as originally envisioned. Once
they had started, they adapted to the resources available, changing circumstances, and new
opportunities. Numerous people mentioned the importance of patience and persistence. It took longer
than almost everyone interviewed expected with more setbacks, obstacles, and frustrations than
originally envisioned.
Gra
nts
Feasibility studies
Business plans
Infrastructure
Buildings
Equipment
Staff
Marketing
Food safety
Capacity building
Financial management
Technical support
Figure 39. The role of grants in food hub development

72
A key lesson, identified by a number of those interviewed for the case studies, was to start with value-
added processing as a key operational component rather than distribution. The lesson learned was to
start with the highest margin operation and then spin up other services based on that success, rather
than developing them later as a means of supplementing low-margin services.

73
Major partners
Blue Mountain Station An important partner for a future food hub in the Walla Walla Valley
is the Blue Mountain Station (BMS). BMS includes multiple operations
(i.e., business incubation, cooperative retail, and a commercial
kitchen), of which the most prominent is building and leasing
incubator space to food and alcohol production businesses.
BMS also provides shared resources and considerable business
support, including joint marketing, business trainings, and individual
business coaching and support. They have paid for some marketing
expenses, connected businesses with distributors, and helped them
try to find a loan if they need funding. A shared forklift is just one
example of shared resources available to lessees (see sidebar).
Everyone interviewed agreed it is very important for a new food hub
to complement and collaborate with BMS rather than compete with
it. This view was also strongly reiterated in the WWVFSC and project
steering committee meetings throughout the feasibility study
process.
BMS: Business incubator space and support services There is a strong demand in Dayton for building space, and in
general, BMS has businesses waitlisted for space. BMS has been
successful both in developing and leasing facilities and in providing a
launch pad for food and alcohol entrepreneurs. An important asset is
that BMS is built to current food safety standards. While the Walla
Walla Valley has buildings available, few (if any) are suitable for
small-scale food processing without extensive remodeling, which
makes them impractical for all but the largest efforts. Several of
those interviewed were interested in leased incubator space and
business support services, but no one advocated that this be the role
of the food hub.
BMS: Cooperative retail BMS also provides an example of a cooperative retail operation. Blue
Mountain Station Co-op is a private business that leases space from
BMS. They sell local and regional products from as far away as
Moscow, ID, including fresh and value-added products. They have 45
local and regional vendors that sell through the store. The local
produce section of the store continues to grow, while growth in other
sections was flat in 2019. Blue Mountain Station Co-op operates on
consignment for a 25% fee.
Blue Mountain Station: Commercial kitchen resources & characteristics • 1,152 square feet
• Food-grade wall covering (FRP) to a height of 6 feet; 10-foot ceilings
• Type 1 exhaust hood over 6 burner propane stove/oven combo
• Electric convection oven
• Under-counter commercial dishwasher
• 8’ x 8’ walk-in cooler
• 8’ x 8’ walk-in freezer
• Floor mixer, cutting boards, and miscellaneous kitchen items
• Stainless steel 3 compartment sink, separate vegetable washing sink
• Janitor’s closet with mop sink
• Floor drains
• Glass front entry door and windows to the south
• Double doors to rear of the building (service and delivery area)
• Access to public restroom
• Serving counter/window into shared retail area
• Opportunity to sell product in shared retail area
• May be leased by the hour occasionally or on a regular basis.
• Rates, rules, and user agreement available at www.bluemountainstation.com

74
BMS: Commercial kitchen BMS has a well-developed commercial kitchen that it continues to upgrade to meet user needs. The
BMS commercial kitchen is heavily used by Walla Walla producers, caterers, and other food business
entrepreneurs as well as those closer to Dayton. BMS rents out its commercial kitchen by the hour. It is
at capacity for use during the day but still has additional capacity at night. The Port of Columbia handles
all the rental paperwork and money.
The commercial kitchen is one area of BMS’s operations that could be hurt by competition if more
facilities are developed elsewhere in the Walla Walla Valley. At the same time, as Jennie Dickinson, BMS
director, expressed, some competition is not necessarily a bad thing, and growth of a local and regional
food business cluster in the Walla Walla Valley could increase use of BMS as well as support additional
food hub and private development in the area. Therefore, new commercial kitchen development is not
necessarily competitive but would need to be very carefully planned.
BMS has established infrastructure and a lot of land. BMS would love to be the location of the food hub
or otherwise be a part of it. BMS makes great sense as a partner of a distributed system in the Walla
Walla Valley and as a center of gravity for the northern portion of the study area. Compared to Walla
Walla, Dayton is also a better location to pull in business from Lewiston, Clarkston, Pullman, and
Moscow.
Blue Mountain Action Council Food Bank Meeting the needs of the BMAC Food Bank is a primary driver of this project. The Food Bank is currently
constrained by the size and format of its building. For a variety of reasons, including an increased
emphasis on nutrition and health and a revitalization of local vegetable farming, the Food Bank is
distributing more fresh produce and dairy, which require additional storage and space for handling. The
Food Bank also receives donations that need to be minimally processed before they can be distributed
to consumers.
The Food Bank distributes to 24 agencies in a five-county area. In any given month it has about 100
sources of food. USDA provides 44% of the total food it receives. The scale of need is large and not going
away, and the Food Bank is growing rapidly in the volume of food distributed and overall impact. Food
Bank programs are expanding, especially for youth and seniors.
From interviews with Jeff Mathias, the BMAC Food Bank Director, the Food Bank operates out of a 5,000
square foot, BMAC-owned building in a good location and on a lot big enough to more than double the
building size. The idea is that when the Food Bank remodels or moves to a new building, it will include
some extra space for a food hub, which will provide complementary and supportive services. The
current lot is large enough for a building expansion adequate to anything planned during this project.

75
The Food Bank has many resources that could be useful to a
food hub (see sidebar). For example, the Food Bank owns
and operates a refrigerated truck, a van, and a pickup in the
five-county area on a regular basis. It also regularly sends
and receives trucks from the Seattle/Tacoma area and picks
up donations at local grocery stores five days per week.
Vehicles are usually empty driving one direction or the
other; therefore, Food Bank vehicles could help in the
transportation and distribution of food hub products.
Food Bank vehicles are lightly used and could be available
for use by a food hub to rent or buy into as the Food Bank
would like to upgrade its vehicles soon. Ideally, a partnership
would enable better, newer, and more vehicles to make a more efficient transportation system and
reduce costs for both.
Food Bank routes and current producers The Food Bank runs five routes each month throughout southeastern Washington, four of which
currently return from the drop-off location with empty trucks (Table 33 and Figure 40).
Table 33. BMAC Food Bank shipping route schedule, 2018
BMAC shipping routes to… Date of month Return load
Pasco, Connell, Basin City First Tuesday Empty
Clarkston First Wednesday Empty
Pasco First Thursday Full
Pomeroy, Clarkston Third Tuesday Empty
Waitsburg, Dayton Third Wednesday Empty
Miscellaneous shipments Capacity
Dayton volunteer pickup Every Tuesday 1,100 lb.
Burbank First Wednesday 1,500 lb.
Walla Walla grocery store pickups Weekdays
Food Bank Existing Resources
• Electric forklift
• ½ ton pickup
• 2-ton cargo van
• 6-ton refrigerated truck (fits 10
pallets)
• Network of providers
• Other buildings
• BMAC is a big operation, some
synergies with other programs

76
Figure 40. BMAC Food Bank shipping route map, 2018 (Map provided by Walla Walla Conservation
District).
The Food Bank currently has refrigerated and freezer space, although not adequate to its current needs.
These can be built upon as part of a more comprehensive system to better meet Food Bank and food
hub needs.
Another advantage of partnering with the Food Bank for a food hub is that the Food Bank already
receives donations from a large pool of farmers in the area, some of whom would be potential
participant farmers in a food hub as well. The food hub will also likely bring new producers to the mix,
some of whom will also provide food to the Food Bank.

77
Food Bank needs A basic premise of this feasibility study is that the Food Bank needs to expand to meet its current and
future needs, regardless of the food hub effort. The following is a list of what the Food Bank needs.
• More space. The Food Bank needs to double its building space, more than double its cooler and
freezer capacity, and add some minimal processing capabilities. All storage space needs to be set up
for forklift use with racks three pallets high, including freezers and coolers. It needs more office
space, warehouse space, staging areas, a better kitchen, and more loading docks.
• Space for volunteers and education. The Food Bank needs space for volunteer and educational
activities, including a community room, a teaching kitchen, and some educational space. These
could be in a separate building from the warehouse and distribution functions.
• Separate public and warehouse space. The Food Bank needs to separate public services such as
donation drop-offs from working areas. The constant flow of people dropping off donations or for
volunteer activities pose safety problems in a warehouse with large trucks, forklifts, and other
operations attempting to run as efficiently as possible.
• Minimal and value-added processing. Minimal produce processing—including washing, trimming,
and packaging—would help the Food Bank salvage more of the donations it receives. Value-added
processing, such as turning tomatoes into canned sauce, would extend shelf life and reduce waste.
• Reuse waste. Receiving and processing food donations generates a lot of waste. The Food Bank
needs a good waste system. Composting, feeding it to animals, and generating bioenergy are all
options that were discussed.
• A partner to share costs. The Food Bank has existing trucks and equipment, which can be shared or
leased. Sharing equipment costs and use with a food hub would enable better equipment at a lower
cost for everyone.
Table 34 summarizes estimated Food Bank space and equipment needs.

78
Table 26. Summary of BMAC Food Bank facility needs
Specific functions Requirement
Storage (forklift ready)
Cold storage for fruit 400 sq. ft Cold storage for vegetables 800 sq. ft Variable temperature cold storage 400 sq. ft Freezer 800 sq. ft Dry storage 5,000 sq. ft
Equipment for minimal processing
Sinks and equipment for washing and drying 2 triple sinks Equipment for cutting and trimming Palette wrapper
Vacuum sealer Packaging
Fresh vegetable and fruit
Dry goods
Frozen
Bottling
Vehicles and other equipment
New refrigerated truck 6 ton New refrigerated van 2 ton Existing pickup 1/2 ton New electric forklift and charging station
Building requirements
Public receiving area: one loading dock 600 sq. ft Non-public receiving area: two loading docks 1,200 sq. ft Non-public shipping area and staging area: two loading docks 1,200 sq. ft ADA parking lot 3,600 sq. ft Three staff offices 500 sq. ft Volunteer/community room 900 sq. ft Area for equipment and processing 2000 sq. ft Education and demonstration kitchen area 400 sq. ft Staff and volunteer kitchen area 200 sq. ft Bathrooms 200 sq. ft Utility room 200 sq. ft Supply room 100 sq. ft Space for waste separation, storage, and processing 400 sq. ft Floor drains Yes Room to grow! 3,000 sq. ft
Food Bank’s current and potential economic impacts The BMAC Food Bank has a highly successful distributive operation stretching over five counties and
headquartered in Walla Walla County. The Food Bank has an approximate $372,000 annual operating
budget. For this assessment, we assumed that in the absence of the Food Bank, most of its funding
would have moved to other cities in the state or out-of-state.
79
The Food Bank creates a total of 6.1 regional jobs, $173,575 in salaries and benefits, $263,059 in gross
regional product, and $553,989 in sales (output), including multiplier effects. In addition, it contributes
approximately $5,420 in property taxes, $10,092 in sales and excise taxes, and $2,137 in other taxes, for
a total of $17,649, including multiplier effects (Table 35).
Table 35. Economic impacts of the BMAC Food Bank
Impact type Employment Labor
income Gross regional
product Output
Direct effect 4.8 $127,109 $174,952 $381,088
Indirect effect 0.7 $22,077 $41,641 $91,154
Induced effect 0.6 $24,390 $46,466 $81,747
Total effect 6.1 $173,575 $263,059 $553,989
The Food Bank has many opportunities to expand both by itself and in cooperation with the proposed
food hub. If its revenues were to increase from $381,088 to $930,000 in five years, for example, the
employment impacts would increase from about 6 jobs to 15 jobs, paying out $422,415 in labor income,
$640,180 in gross regional output, and $1.353 million in sales (output). The tax contributions would
increase to $42,950 in state and local taxes. If one of the food hub scenario opportunities fully develops,
the job impacts could increase to more than 50, depending on the enterprise (Table 36).
Table 36. Economic impacts of the BMAC Food Bank under theoretical expansion
Impact type Employment Labor income Gross regional
product Output
Direct effect 12 $309,333 $425,763 $930,000
Indirect effect 2 $53,725 $101,338 $222,980
Induced effect 2 $59,355 $113,080 $199,808
Total effect 15 $422,415 $640,180 $1,352,788
Food Bank partnership conclusions The Food Bank needs a new or expanded facility as soon as possible. BMAC can fundraise the building
expansion, which would allow the Food Bank to maximize efficiencies and handle considerably more
volume than it does now. The expansion could also include space for community and educational needs.
Food Bank interests, needs, and resources are a critical strength of this food hub development
opportunity and provide a basis for making many food hub scenarios feasible.

80
Putting it all together: Food hub scenarios
Scenario introduction We developed four scenarios to explore feasibility and tradeoffs of food hub development options.
Scenario 1 describes an aggregation, storage, distribution, and marketing food hub like LINC Foods or
Western Montana Growers Cooperative. We refer to Scenario 1 as a distribution food hub, since most of
its services are like those offered by regional food distribution companies. Scenario 2 explores value-
added processing options based on three products (salsa, marinara, and popsicles), Scenario 3 examines
a retail operation, and Scenario 4 focuses on a commercial kitchen option. All scenarios assume the
BMAC Food Bank will remodel its existing building or buy a new building regardless of whether a food
hub develops, and meeting the requirements of the Food Bank is considered under all scenarios.
These scenarios were developed through an iterative, multi-stage process. We developed the initial
scenario descriptions and frameworks based on information generated from key informant interviews,
case studies, the 2019 Food Producers’ Workshop, and steering committee meetings. We then
presented the resulting preliminary scenarios to the project steering committee and updated and
further refined them based on their input and feedback.
Overall, many scenarios are feasible for developing a food hub. What is actually built will largely be
determined by the energy and vision of those who participate and the resources they are able to bring
to bear. Through the feasibility study process, the steering committee settled on value-added products
as the scenario they wanted to focus on for several reasons. Importantly, key informants from case
study food hubs and other organizations recommended skipping the many years of struggle to make a
distribution food hub work and focus from the start on value-added processing as a better path to
profitability and sustainability. Being a part of an ongoing planning process was an important aspect of
this feasibility assessment. Steering committee members along with additional producers were very
interested in taking steps to start producing a value-added product as soon as possible and did not want
to stop and wait for the completion of the feasibility report. To maintain their momentum towards
setting up one or more value-added processing lines, members of the steering committee called other
value-added processors, toured operations, attended conferences, and otherwise actively began
narrowing down the options. What they learned was integrated into Scenario 2.
Scenario 1: Distribution food hub
81
Scenario 1: Description Many suppliers and buyers wanted additional distribution options to move local food products both
within Walla Walla Valley communities and to broader regional markets. This distribution scenario
leverages many Food Bank resources and services since a main function of the Food Bank is aggregating
and distributing food.
The core assumption in this scenario is that the distribution food hub would be co-located with the
BMAC Food Bank in their newly expanded building in Walla Walla and the two entities would share
some docking, processing, storage, meeting, and other space as well as some equipment and trucks.
Table 37 presents the equipment and space that a distribution food hub would need for its exclusive use
and the resources that could be shared between the two entities.xxv “Shared use” in Table 37 means the
food hub would buy into the resource (e.g., trucks and processing equipment) with the Food Bank rather
than having to buy the resource on its own. Everything not identified as “shared use” in the table are the
resources the food hub would have to invest in independently or lease from the Food Bank.

82
Table 37. Needs of distribution food hub in addition to Food Bank needs addressed in Table 34
Specific functions Requirement
Aggregation
Farmer drop-off
Storage (forklift ready)
Cold storage for fruit 400 sq. ft
Cold storage for vegetables 800 sq. ft
Variable temperature cold storage 400 sq. ft
Freezer 2,000 sq. ft
Dry storage 1,000 sq. ft
Equipment for minimal processing
Triple sink for washing and drying 1
Equipment for cutting and trimming Shared use
Packaging
Fresh vegetable and fruit Shared use
Dry goods Shared use
Frozen Shared use
Bottling Shared use
Vehicles
New refrigerated truck Shared use
New refrigerated van Shared use
Pickup Shared use
Other Equipment
Electric forklift and charging station Shared use
Palette wrapper Shared use
Vacuum sealer Shared use Building
Loading docks 1 more dock Non-public shipping and staging area 600 sq. ft.
ADA parking lot 400 sq. ft Staff office 300 sq. ft Volunteer/community room Shared use Space for equipment and processing 500 sq. ft Cool storage area 500 sq. ft Education/demonstration kitchen area Shared use A staff/volunteer kitchen area Shared use Breakroom with lockers 400 sq. ft Bathrooms Shared use Utility room Shared use Supply room 200 sq. ft Waste separation, storage, and processing 100 sq. ft Floor drains Shared use Room to grow 1,000 sq. ft

83
Scenario 1: Additional options
Processing Participants in the first public meeting and steering committee members discussed three processing
options for the distribution food hub:
1. Farm drops off products to the food hub building ready to be delivered to the customer (i.e., the
farmer cleans, processes, and packages their own products, as necessary, themselves before
they drop them off at the hub).
2. Farm brings unprocessed products to the food hub and pays a fee to use food hub equipment to
do any needed processing themselves.
3. Farm brings unprocessed products to the food hub and pays the food hub to do any needed
processing (e.g., cleaning, trimming, cutting, packaging). The Food Bank could also pay the food
hub for the processing services it needs.
On-farm pick up This scenario assumes farms would transport their products to the food hub themselves, at least to
start. Participants in meetings and interviews thought on-farm pickup would be a useful service for a
distribution food hub but was unnecessary. They thought on-farm pick up is a service that could be
added in a later phase of development.
Pick up at Food Bank distribution sites Another possibility is for farmers to drop off their products at Food Bank distribution sites outside of
Walla Walla from where Food Bank trucks currently return empty, such as Pasco, Clarkston, Dayton, and
Waitsburg, to be hauled to the food hub on their return to Walla Walla.
Sales, marketing, and communication Many farmers wanted a food hub employee to handle sales and marketing; therefore, the food hub
could do some collective marketing for the organization and could manage relationships with buyers.
Adding a full-time salesperson would be a short-term goal, but not necessarily feasible as part of the
initial startup. Communication to buyers could also include a food hub fresh sheet to communicate what
is collectively available in short-term (e.g., weekly) and medium-term (e.g., months or seasons)
timeframes to facilitate access to institutional markets.
Farm-identified products and collective branding Farmers involved in the feasibility study wanted two layers of branding: products would continue to be
farm identified, as desired, but the food hub would have its own branding to use for marketing and, as
applicable, packaging. That is, the shared food hub branding would be more at the level of a marketing
point, like being Salmon Safe, for farm-identified products.
Community Supported Agriculture (CSA) Some farmers were interested in a food hub facilitating access to direct-to-consumer markets, especially
through development of a collaborative CSA. The idea was the CSA could offer a wide variety of
products, including vegetables, fruits, dairy, meats, value-added products like jams and sauces, and non-
food items like flowers. To improve distribution efficiency and build a customer base, another idea was

84
for the CSA to serve customers at workplaces with many employees, such as Key Technologies or
institutions. Smaller-scale farms especially liked this idea, including one who had had their own CSA and
had struggled to keep up with it.
On the other hand, many farmers did not think a CSA was a good idea for a food hub. In particular, the
idea of adding a CSA operation to the food hub tended to be unpopular among those already operating
successful CSAs (or other types of direct-to-consumer-focused operations). One guiding principle
adopted by the feasibility study steering committee was that the food hub should not compete with its
own producers. While there was some support for including a CSA, the decision was made to focus on
other activities for the food hub start up and leave discussion of a CSA for a later stage of development.
Scenario 1: Financial considerations The distribution food hub model requires considerable bootstrapping (i.e., use of existing resources),
capital investment, or both to launch. Case study and other findings show distribution food hubs have
very low operating margins (i.e., profitability once the cost of goods sold and operating expenses are
considered) and, even when successful, generally take 7-10 years to become profitable. The breakeven
point for this type of food hub ranges from $500,000 to $1.2 million in sales for a typical enterprise and
grants are usually needed to facilitate the scaling up needed to reach profitability.
A distribution food hub also would require many employees. Table 38 breaks down the number of
employees needed for even a mid-scale operation.
Using Western Montana Growers Cooperative (WMGC) as an
example, a fully scaled up distribution system would have
seven full-time employees and 15 part-time employees
during the summer. The start-up process for WMGC took
about $400,000 in government and member loans and use of
member resources. Realistically it would take between
$500,000 and $1 million dollars to launch and fully scale up
an operation from scratch as warehousing, transportation,
and refrigeration costs are substantial. WMGC had about
$3.56 million in sales in 2018, with 49% of their sales in dairy
and eggs.
The Walla Walla effort has an advantage because much of what is needed to start a distribution food
hub could be initially met by collaborating with the Food Bank.
Scenario 1: Economic impacts To understand economic impacts, we modeled a fully operational aggregation-distribution enterprise
such as LINC Foods or Western Montana Growers Association. We assumed $1.5 million in annual gross
revenues and 10 full-time and part-time employees. We employed a modified IMPLAN wholesale sector
shock to the economy. We assumed that most of the sales are out-of-region throughout Washington
State.
Factoring in the multiplier analyses, the distribution food hub would annually create a total of 19
regional jobs, $553,879 in salaries and benefits, $1.17 million in gross regional product, and $1.9 million
Table 38. Job positions and number of
employees needed for distribution
food hub
Job position Number needed
Salespeople 2
Manager 1
Truck drivers 3
Warehouse workers 6

85
in sales (output), including multiplier effects. In addition, the enterprise would contribute approximately
$107,102 in property taxes, $199,399 in sales and excise taxes, and $6,433 other taxes, for a total of
$312,934, including multiplier effects (Table 39).
Table 39. Economic impacts of a distribution food hub
Impact type Employment Labor
income Gross regional
product Output
Direct effect 15 $384,186 $901,632 $1,430,470
Indirect effect 2 $74,701 $128,685 $260,580
Induced effect 1.9 $74,992 $142,918 $251,386
Total effect 19 $533,879 $1,173,235 $1,942,436
Scenario 1: Conclusions The Walla Walla Valley food hub effort has tremendous advantages over any of the other similar
distribution food hubs studied in the region because of the opportunity to collaborate with the Food
Bank. While a number of producers and value-added processors wanted this option, and while a market
and a pathway to a profitable operation clearly exist, no one in the steering committee, WWVFSC, those
interviewed, or known of by those participating in the project thought it was a good option to pursue for
the start up. A main reason referred to by many was the need to focus on what is most profitable from
the beginning. This was a lesson learned expressed by a number of those interviewed from existing food
hubs. A distribution food hub is a lot of work, difficult to make profitable, and once it becomes
profitable, it is still a lot of work and difficult to keep profitable.
One alternative would be to work with other developing local distribution businesses and regional food
hubs to meet this need. It may be possible for LINC Foods, for example, to expand in the Walla Walla
Valley as an alternative to establishing an independent local network.
Scenario 2: Value-added processing
Scenario 2: Description Interest in and need for processing, especially for crops not currently picked or seconds was an interest
of almost everyone interviewed, including the Food Bank, making it an important opportunity with
potential food security benefits. Interest in value-added processing was also strong among those who
took the supplier survey, of whom 64% said they are interested in producing and selling processed or
value-added food products in the future (including new, expanded, or different products for those
already selling processed or value-added products) (n=67). Value-added processing can increase profits
for producers, create more options for consumers, and build the local economy and food system.
For the purposes of this report, value-added processing is understood to be at a scale larger than using a
commercial kitchen and that requires multiple producers or staff beyond what a single farm can
support. However, it is smaller than many conventional food-processing operations in that it is sized to
be optimal for small and mid-sized farms. This means the goal, at least initially, is at most to process
hundreds of acres of produce, not tens of thousands.

86
The processing lines analyzed are sized to use a few acres worth of produce and can be scaled up as
sales increase. A wide variety of options were identified for minimal processing, such as wash-and-cut
vegetables for sale to institutions and retail markets to salsas and marina sauce processing lines for
larger-scale production targeting regional markets.
This value-added processing scenario developed through many conversations and meetings both in and
outside of the steering committee over the length of the project. We considered many options, some of
which resonated, and most of which did not. Flash freezing, juicing, root washing, and co-packing, for
example, were brought up multiple times in interviews and by the steering committee but found no
advocates over the long run of the feasibility study process.
As the conversations evolved, three value-added product options (i.e., popsicles, salsa, and marinara sauce) solidified as those of most interest to the stakeholders ready to move forward. Specifically, members of Walla Walla Grown developed a plan for developing these products primarily because these three value-added products met the following criteria:
1. The raw ingredient need was at the scale of their production. 2. The product is sized at a small fraction of the market opportunity. 3. Main ingredients were ones produced by participating farmers. 4. Capital costs are low enough that the current group of interested producers could launch the
enterprise. 5. The product line directly aligned with Food Bank needs and was synergistic and mutually
beneficial with the Food Bank.
The ideas for these products come from producers in the steering committee and in Walla Walla Grown, whose members where active in the effort well before this feasibility study. Salsa and marina where both identified by the Food Bank and institutional and retail buyers as of interest as well. Our analysis suggests these products also have the greatest chance for success in the future in part because they have the greatest interest among the most active food coalition participants. Food coalition members have already completed substantial preliminary work to develop these value-added lines.
Scenario 2: Financial analysis framework and approach (caveats) In this section we present financial analyses for the three value-added product lines prioritized by the
WWVFSC: 1) salsa, 2) marinara sauce, and 3) popsicles. Data availability was greatest for salsa
manufacturing; therefore, we used the salsa option as a template to evaluate all three products.
The financial analysis presented in this report is a starting point for moving forward in the future. It will
need to be adjusted according to experience during the actual start up. Our approach does not account
for significant likely efficiencies; therefore, it overestimates costs. Reflecting the available data, the core
basis of the analyses are small-batch operations involving a 10-gallon process with some labor-intensive
operations (i.e., more at the scale of a large commercial kitchen or test batch size). A 50-gallon or 100-
gallon batch size is preferable, both of which were considered as options. We expect substantial
economies of scale to develop through mechanization and learning-by-doing as the operations are
scaled up. Since the equipment identified by Walla Walla Grown is the 100-gallon option, we used
capital and startup costs for that equipment line in all value-added scenarios. This likely dramatically
overestimates capital costs for popsicles, for example, although there are likely additional costs in
distribution and sales that may offset less expensive processing equipment.

87
We evaluated each value-added product as standalone for-profit enterprises for the purpose of clarity
and simplicity of analysis. Most likely, product lines will combine to share expenses, equipment, and
facility space. This could dramatically reduce cost per unit of production across multiple units and
encourage economies of scale among the different products and services created by the food hub.
Another important factor is that initial capital costs may be at least partly covered by the Food Bank or
grants. The analysis also does not account for the scaling up operational period and the ultimate capital
costs of acquiring a new facility in the long run.
Pricing and distribution The prices presented in these analyses are the net prices received by the producers. It does not include
the distribution markups that will be reflected in the final prices to the consumers. Those markups can
average from 30% to 45% in traditional largescale retail distribution systems. Markups can be much less
for other types of distribution systems, including venues such as farmers markets where producers will
sell directly to the consumer. Online sales are another avenue with lower or zero markups but will incur
additional shipping and handling costs. At a 30% markup, for example, the base case price of $10/bottle
of salsa would sell for $13/bottle to the public. The market prices (to the public) of both salsa and
marinara range from about $5.00 per unit to over $18 per unit. On average, prices range between about
$8 per bottle to $10 per bottle for both salsa and marinara. There was also a considerable range in the
price of popsicles, which is dependent on the quantities included in the package. The base case prices
used in this simulation were $10 per bottle for salsa (16 ounces), $11 per bottle for marinara (12
ounces), and $3 per popsicle based on the recommendations of the steering committee.
Specialty gourmet products The product mix are specialty and gourmet high-end products. The expectation is they will command a
price premium in the marketplace. This does not preclude offering bulk products to institutional buyers
at reduced rates or offering an array of products with differing qualities and prices. The steering
committee suggested that smaller quantities might be advisable for salsa and marinara (i.e., 12 ounces)
in keeping with modern household cooking practices that employ smaller batches. It could also add to
the upscale appeal of the products and will reduce production costs. The marinara sauce scenario was
changed from a 24-ounce bottle to 12-ounce bottle scenario as a result of this suggestion.
Real estate capital costs and leasing Construction costs for a new warehouse/manufacturing facility ranges from $150 to $400 a square foot,
averaging about $194 per square foot annually in the western United States, excluding land acquisition
costs.xxvi For existing facilities in the greater Walla Walla Valley, the cost can range between $36 to $130
per square foot depending on availability and attributes. Commercial and industrial lease rates range
from $.50 per month to $2.50 per month, depending on location, attributes, and amenities.xxvii The
economy (year 2020) is near the peak of the business cycle when labor is scarce and relatively
expensive.xxviii With such a robust economy, land acquisition and construction costs are high and the
timing of new construction should be carefully considered. It might be possible to lease a temporary
location during the scaling up process and acquire and build a permanent facility later, perhaps in
coordination with the expansion plans of the BMAC Food Bank. Currently the food coalition has
potential access to a 3,000 sq. ft. warehouse that can be leased at $0.50 per sq. ft. per month. The lease
is scalable, and 1,000 square feet of this space could be leased at a cost of $6,000 per year ($0.50 *
1,000 sq. ft *12 months).
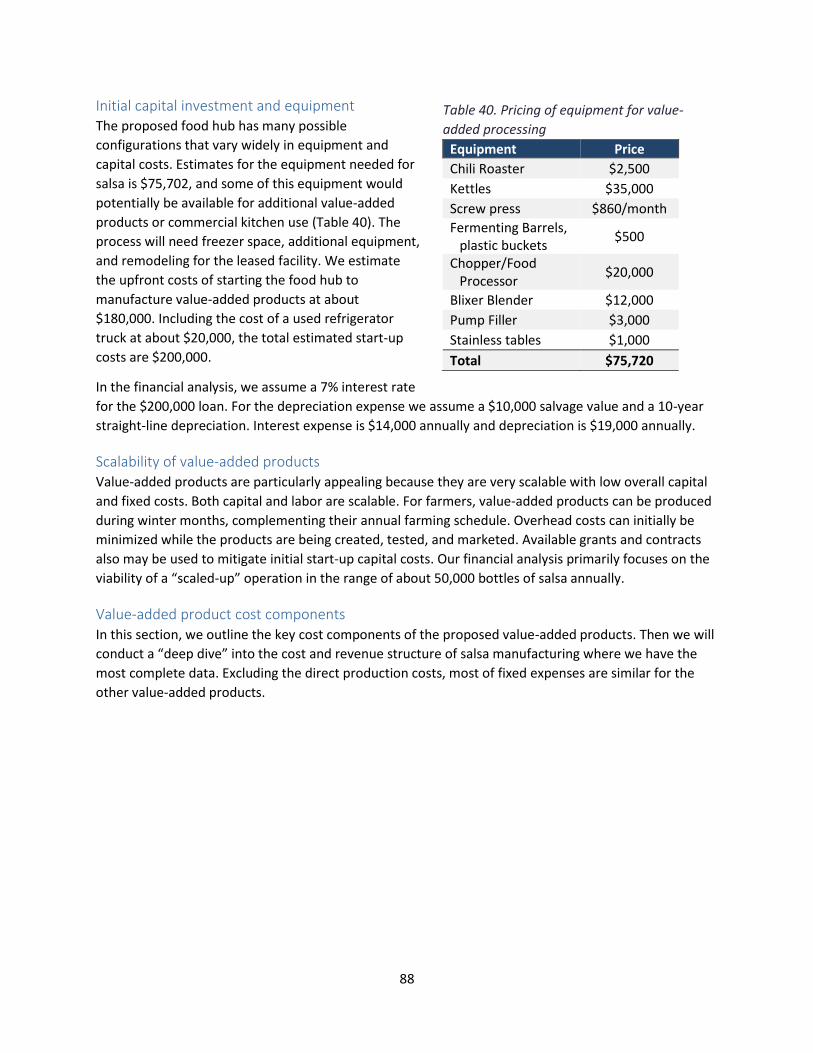
88
Initial capital investment and equipment The proposed food hub has many possible
configurations that vary widely in equipment and
capital costs. Estimates for the equipment needed for
salsa is $75,702, and some of this equipment would
potentially be available for additional value-added
products or commercial kitchen use (Table 40). The
process will need freezer space, additional equipment,
and remodeling for the leased facility. We estimate
the upfront costs of starting the food hub to
manufacture value-added products at about
$180,000. Including the cost of a used refrigerator
truck at about $20,000, the total estimated start-up
costs are $200,000.
In the financial analysis, we assume a 7% interest rate
for the $200,000 loan. For the depreciation expense we assume a $10,000 salvage value and a 10-year
straight-line depreciation. Interest expense is $14,000 annually and depreciation is $19,000 annually.
Scalability of value-added products Value-added products are particularly appealing because they are very scalable with low overall capital
and fixed costs. Both capital and labor are scalable. For farmers, value-added products can be produced
during winter months, complementing their annual farming schedule. Overhead costs can initially be
minimized while the products are being created, tested, and marketed. Available grants and contracts
also may be used to mitigate initial start-up capital costs. Our financial analysis primarily focuses on the
viability of a “scaled-up” operation in the range of about 50,000 bottles of salsa annually.
Value-added product cost components In this section, we outline the key cost components of the proposed value-added products. Then we will
conduct a “deep dive” into the cost and revenue structure of salsa manufacturing where we have the
most complete data. Excluding the direct production costs, most of fixed expenses are similar for the
other value-added products.
Table 40. Pricing of equipment for value-
added processing
Equipment Price
Chili Roaster $2,500
Kettles $35,000
Screw press $860/month
Fermenting Barrels, plastic buckets
$500
Chopper/Food Processor
$20,000
Blixer Blender $12,000
Pump Filler $3,000
Stainless tables $1,000
Total $75,720

89
Trucking and transportation costs A refrigerated truck will likely be an essential component of the food hub, both for transporting
products to market and to serve as portable refrigerated/freezer storage. Refrigerated truck prices vary
considerably depending on the size, attributes, year, and
other factors and can range from $8,000 to over $100,000.
We found several trucks under $20,000 that would likely
work well for start-up operations (Figure 41).xxix Annual cost
of gasoline is estimated to be about $8,900. Repairs and
maintenance are estimated at $0.12 per mile or about $3,600
annually.xxx For labor we estimate about ½ year full-time
(1,040 hours at $20 per hour, fully loaded salary) at a cost of
$20,800 per year.
We estimate that the truck would operate and travel 6
months out of the year (although there is a wide variance).
The average fuel mileage is about 9 miles to the gallon and
would consume an estimated 3,333 gallons per year at an
average cost of $2.67.xxxi Total estimated operating cost is
$33,300 per year (Table 41). This does not include
the interest or depreciation included in the
capital costs.
Total operating cost is $1.10 per mile, which is
consistent with the annual costs of operating a
tractor trailer-type truck at $1.38 per mile.xxxii
Labor for truck operations is included in trucking
costs and not in the labor component of the
financial statements, which only include production labor expenses.
Marketing costs Marketing costs for each scenario was included as a $5,000 fixed cost. The true marketing costs are
unknown. It was suggested by a steering committee member that marketing costs in the scenarios might
be low and should be set between 5% to 10% of total revenues. This would reflect the marketing costs
of a traditional retail store outlet. It is unclear that increasing marketing costs would be appropriate for
the value-added products in this proposal. Many avenues exist for advertising such as word-of-mouth,
Internet and social media, and other types of networking. The true marketing cost in these scenarios will
have to be determined during the start-up process.
Scenario 2: Salsa
Salsa product revenue and production assumptions The following section outlines the cost structure and revenue profile of salsa production. The base case
features a 10-gallon steam batch (small batch process) that produces 80 16-ounce jars of salsa per batch
(128 ounces per gallon total per batch). There are 12 jars per case, 6.7 cases per batch, and 80 jars per
batch. For the base case, each jar sells for $10 each or $800 of revenues per batch.
Figure 41. Refrigerated truck for sale
for $19,800
Table 41. Transportation costs
Description Cost
Fuel (30,000 miles *$2.67/gal) $ 8,900
Repairs ($0.12 per mile) $ 3,600
Labor (2,040 hrs. *20/hour) $ 20,800
Total costs $ 33,300

90
Salsa: Food preparation labor costs (small batch) A small-batch (i.e., 10-gallon batch) food preparation analysis was the basis for the small-batch salsa
labor estimation. The numbers in Table 42 were provided by Walla Walla Grown. They estimated that it
takes 600 minutes (10 labor hours) to prepare the vegetables, 120 minutes (2 hours) to cook the
ingredients, 80 minutes (1.33 hours) to jar the salsa, 40 minutes to label the jars, (0.67 hours), and 120
minutes (2 hours) for cleanup. In total, it takes about 960 minutes or 16 hours to produce one batch or
80 jars of salsa. If we assume a fully loaded wage (i.e., a wage including benefits) of $18 per hour, it
costs $288 of labor per batch of 80 jars. Scaling up to 667 batches (53,360 bottles) annually would cost
10,672 labor hours or 5.13 full-time equivalent jobs annually, costing $192,096 (Table 43).
Table 42. Salsa production labor time requirements
Task/batch Labor
minutes Labor hours
Prep Veg 600 10.00
Cook 120 2.00
Jar 80 1.33
Labels 40 0.67
Cleanup 120 2.00
Minutes/batch 960 16.00
Total batches (667) 640,320 10,672
Salsa: Economies of scale (larger batches) We assume economies of scale will substantially reduce labor costs per batch and overall costs. This
includes the benefits of learning-by-doing as production expands and from increasing capital acquisition.
A simulation of these effects is included in the analysis. We assume that at the 50-gallon batch size,
labor costs fall by 18.8% (13 labor hours equivalent) and by 37.5 % at the 100-gallon batch size (10 labor
hours equivalent).
Table 44 outlines the cost per batch size at differing economies of scale. At a 10-gallon batch, the labor
costs are 16 hours per batch or $288. For a 50-gallon batch the labor costs are $234 per 10-gallon batch
equivalent and for the 100-gallon batch size they are $180 (per 10-gallon equivalent). Per 100-gallon
batch size, the labor costs are $2,880 at 16 hours per 10-gallon batch equivalent, $2,340 at 13 hours per
10-gallon batch equivalent, and $1,800 at 10 hours per 10-gallon batch equivalent.
Table 44. Economies of scale of labor costs per batch size, at wage of $18.00/hr
Total batch size
Production time per 10 gal. produced
16 hr./10 gal. 13 hr./10 gal. 10 hr./ 10 gal.
10 gal. batch $ 288 $ 234 $ 180
50 gal. batch $ 1,440 $ 1,170 $ 900
100 gal. batch $ 2,880 $ 2,340 $ 1,800
Salsa ingredients
Tomatoes are a primary ingredient to salsa production. The Walla Walla Valley is a rich irrigated
agricultural region where tomatoes grow well. Production and price information was obtained from the
food coalition members and from Washington State University crop budgets.xxxiii We estimate that
Table 43. Labor costs for small-batch salsa
production
Personnel requirments Total
Wage ($18/hour) $192,096
Total annual FTEs 5.13

91
tomatoes can be obtained at about $0.67 per pound, although considerable variability exists. It may be
possible to obtain field “seconds” appropriate for canning or freezing but with visual imperfections for
lower costs. Onion costs are estimated at $0.08 per pound based on discussion with food coalition
members and University of Idaho crop budgets.xxxiv Chili peppers are estimated at $0.25 per pound
based on prices in local markets and discussions with food coalition members.
The food coalition members estimated that for a 10-gallon batch of salsa, 60 pounds of tomatoes, 30
pounds of peppers, and 15 pounds of onions are needed (Table 45). These quantities are proportionally
scaled for the 50-gallon and 100-gallon batch sizes.
Table 45. Salsa ingredient requirements
Ingredients
Pounds of ingredients required per batch size
10 gal. batch 50 gal. batch 100 gal. batch
Tomatoes 60 lbs. 300 lbs. 600 lbs.
Peppers 30 lbs. 150 lbs. 300 lbs.
Onions 15 lbs. 75 lbs. 150 lbs.
Salsa ingredient costs For a 10-gallon batch, tomatoes will cost $40.15, peppers will cost $7.40, and onions will cost $1.24.
Total costs for a 10-gallon batch is $48.79. For a 50-gallon batch the cost is $243.94, and for a 100-gallon
batch the cost is $487.89 (Table 46).
Table 46. Costs of salsa ingredients
Expenditures per batch
Ingredients $/lb. 10 gal. batch 50 gal. batch 100 gal. batch
Tomatoes $ 0.67 $ 40.15 $ 200.76 $ 401.51
Peppers $ 0.25 $ 7.40 $ 37.00 $ 74.00
Onions $ 0.08 $ 1.24 $ 6.19 $ 12.38
Total/batch $ 48.79 $ 243.94 $ 487.89
Expenditures* $ 32,541.97 $ 32,541.97 $ 32,541.97
*Overall for 53,360 bottles the total ingredients cost $32,541.97.
Salsa: Other variable costs The jars (bottles) and lids cost about $0.50 each for a total cost of $40 per 10-gallon batch. xxxv
Other miscellaneous supplies we estimate at $.10 per bottle or $16 per 10-gallon batch. We estimate
spoilage at 5% of revenues (80 bottles * 5% * $10/bottle) or $40 per 10 gallon batch (Table 47).
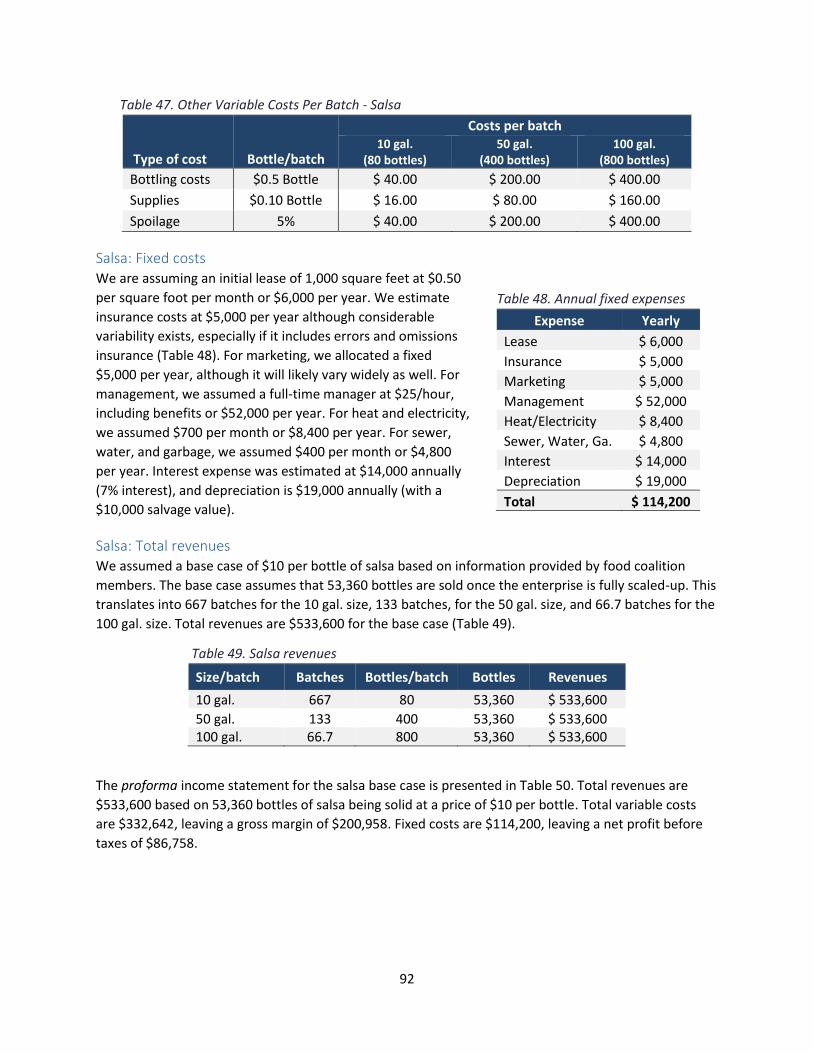
92
Table 47. Other Variable Costs Per Batch - Salsa
Type of cost Bottle/batch
Costs per batch 10 gal.
(80 bottles) 50 gal.
(400 bottles) 100 gal.
(800 bottles)
Bottling costs $0.5 Bottle $ 40.00 $ 200.00 $ 400.00
Supplies $0.10 Bottle $ 16.00 $ 80.00 $ 160.00
Spoilage 5% $ 40.00 $ 200.00 $ 400.00
Salsa: Fixed costs We are assuming an initial lease of 1,000 square feet at $0.50
per square foot per month or $6,000 per year. We estimate
insurance costs at $5,000 per year although considerable
variability exists, especially if it includes errors and omissions
insurance (Table 48). For marketing, we allocated a fixed
$5,000 per year, although it will likely vary widely as well. For
management, we assumed a full-time manager at $25/hour,
including benefits or $52,000 per year. For heat and electricity,
we assumed $700 per month or $8,400 per year. For sewer,
water, and garbage, we assumed $400 per month or $4,800
per year. Interest expense was estimated at $14,000 annually
(7% interest), and depreciation is $19,000 annually (with a
$10,000 salvage value).
Salsa: Total revenues We assumed a base case of $10 per bottle of salsa based on information provided by food coalition
members. The base case assumes that 53,360 bottles are sold once the enterprise is fully scaled-up. This
translates into 667 batches for the 10 gal. size, 133 batches, for the 50 gal. size, and 66.7 batches for the
100 gal. size. Total revenues are $533,600 for the base case (Table 49).
Table 49. Salsa revenues
Size/batch Batches Bottles/batch Bottles Revenues
10 gal. 667 80 53,360 $ 533,600
50 gal. 133 400 53,360 $ 533,600 100 gal. 66.7 800 53,360 $ 533,600
The proforma income statement for the salsa base case is presented in Table 50. Total revenues are
$533,600 based on 53,360 bottles of salsa being solid at a price of $10 per bottle. Total variable costs
are $332,642, leaving a gross margin of $200,958. Fixed costs are $114,200, leaving a net profit before
taxes of $86,758.
Table 48. Annual fixed expenses
Expense Yearly
Lease $ 6,000
Insurance $ 5,000
Marketing $ 5,000
Management $ 52,000
Heat/Electricity $ 8,400
Sewer, Water, Ga. $ 4,800
Interest $ 14,000
Depreciation $ 19,000
Total $ 114,200

93
Table 50. Proforma income statement for the Base Case - Salsa
Total revenues $533,600
Variable costs
Spoilage/Returns xxxvi $26,680
Cost of Goods Sold $32,542
Labor $192,096
Trucking $33,300
Add. Prod. Costs $10,672
Supplies $10,672
Bottling $26,680
Total variable costs $332,642
Gross margin $200,958
Fixed costs
Lease $6,000
Heat/electric $8,400
S/Water/Garbage $4,800
Insurance $5,000
Marketing $5,000
Interest $14,000
Depreciation $19,000
Management $52,000
Total fixed costs $114,200
Total variable + fixed costs $446,842
Net profits (before taxes) $86,758
The majority of costs are variable (74.4%), and while 25.6% are fixed. The largest-cost item is labor
(43%), followed by management salary (11.6%), trucking (7.5%), and cost of goods sold (i.e., the
ingredients) (7.3%). The analysis suggests that given the low fixed costs and relatively low ingredient
costs, production is very scalable. Production startup will have relatively low costs and can be expanded
(relatively) smoothly overtime. Return on investment (ROI) is a robust 43% ($86,758/$200,000),
although this metric must be viewed with caution for several reasons. First, this is a simulation of a fully
scaled-up enterprise. Second, there may be additional capital costs and investment needed as the firm
expands into a permanent facility. Marketing and transportation costs are likely to rise as well.
Table 51 presents the costs as percentages of variable and fixed costs separately and together as a
percentage of total costs. For example, labor constituted 57.7% of variable costs and 43% of total costs.
Management was 45.5% of fixed costs and 11.6% of total costs.

94
Table 52. Percent of costs for salsa production
Total costs % Variable % Fixed % Total
Variable costs
Spoilage/Returns 8.0% --- 6.0%
Cost of Goods Sold 9.8% --- 7.3%
Labor 57.7% --- 43.0%
Trucking 10.0% --- 7.5%
Add. Prod. Costs 3.2% --- 2.4%
Supplies 3.2% --- 2.4%
Bottling 8.0% --- 6.0%
Total variable costs 100.0% 74.4%
Fixed costs
Lease --- 5.3% 1.3%
Heat/Electricity --- 7.4% 1.9%
Sewer, water, Gb. --- 4.2% 1.1%
Insurance --- 4.4% 1.1%
Marketing --- 4.4% 1.1%
Interest --- 12.3% 3.1%
Depreciation --- 16.6% 4.3%
Management --- 45.5% 11.6%
Total fixed costs 100.0% 25.6%
Salsa: Batch sizes and economies of scale Three scenarios were conducted per batch size. Economies of scale were factored into the analyses as
previously discussed: Labor costs fell by 18.75% with the 50-gallon batches and 37.5% with the 100-
gallon scenario. Profits correspondingly increased from $86,758 per 10-gallon batches to $158,758 per
100-gallon batches. The return on investment (ROI) increases from 43% in the 10 gal. scenario to 79% in
the 100 gal. scenario (Table 53).
Table 53. Return on investment per batch size – salsa base case
Batch size Labor costs Profits Return on investment
10 gal. $ 192,096 $ 86,758 43%
50 gal. $ 156,078 $ 122,776 61%
100 gal. $ 120,060 $ 158,794 79%
Salsa: Breakeven analysis A breakeven analysis was conducted for each batch-size scenario. For the 10-gallon scenario, the price
was $10/unit, variable cost (VC) per unit was $6.23, margin per unit was $3.77, and total fixed costs
(TFC) were $114,200. The breakeven point was calculated by dividing total fixed costs ($114,200/3.77)
by the margin per unit equaling 30,323 units. This represents the number of units that must be sold to
cover all costs. Any units sold beyond the breakeven point create profits from the contribution of the

95
margin. The breakeven point declines as the batch size gets larger from economies of scale and decline
in labor costs. The 100-gallon batch has a breakeven point of 22,322 units (Table 53). Figure 42
illustrates the breakeven point graphically.
Table 53. Breakeven analysis -- salsa base case
Metric 10 gal./BT 50 gal./ BT 100 gal./ BT
Price $ 10.00 $ 10.00 $ 10.00
VC/Unit $ 6.23 $ 5.56 $ 4.88
Margin/Unit $ 3.77 $ 4.44 $ 5.12
TFC $ 114,200 $ 114,200 $ 114,200
Breakeven Units 30,323 25,714 22,322
Figure 42. Breakeven for base case of 10 gal. batches
Salsa: Sensitivity analysis Several scenarios were conducted to measure the sensitivity of assumptions. The first scenario lowered
the price to $7.00 per unit, holding everything else constant. The 10-gallon batch and 50-gallon batch
are unprofitable, but the 100-gallon batch still has a 3% ROI (Table 54) and a breakeven at 50,395 units.
This suggests the product is very sensitive to labor costs. As production is scaled-up and expanded,
labor costs per bottle of salsa will decline through automation, capital acquisition, and learning-by-
doing. Preliminary analysis by stakeholders suggest that labor costs per unit could be reduced by as
much as 50%.
$0
$50,000
$100,000
$150,000
$200,000
$250,000
$300,000
$350,000
$400,000
0
2,0
00
4,0
00
6,0
00
8,0
00
10
,00
0
12
,00
0
14
,00
0
16
,00
0
18
,00
0
20
,00
0
22
,00
0
24
,00
0
26
,00
0
28
,00
0
30
,00
0
32
,00
0
34
,00
0
36
,00
0
38
,00
0# of bottles
Total revenues Total costs

96
Table 54. Return on investment per batch size for the salsa base case when price is
reduced to $7.00 Unit
Batch size Labor costs Profits Return on investment
10 gal. $ 192,096 - $ 65,318 -33%
50 gal. $ 156,078 - $ 29,300 -15%
100 gal. $ 120,060 $ 6,718 3%
Breakeven units 124,662 71,775 50,395
Another scenario was conducted raising the price from $10 per bottle to $12 per bottle (Table 55). This
increased profits by $101,384 for each scenario and the ROI by 51%. Thus, the analysis is relatively
sensitive to price. The breakeven point fell substantially for each scenario: for example, falling to 10,168
units in the 10-gallon scenario.
Table 5527. Return on investment per batch size for the salsa base case when price is
raised to $12 per unit
Batch size Labor costs Profits Return on investment
10 gal. $ 192,096 $ 188,142 94%
50 gal. $ 156,078 $ 224,160 112%
100 gal. $ 120,060 $ 260,178 130%
Breakeven units 20,155 18,010 16,277
Wages and salaries were reduced by 30% in addition to the economics of scale for each scenario in Table
56. The breakeven point fell in each scenario, for example, falling by 5,480 units in the 10-gallon
scenario.
Table 56. Salsa productivity increases - reduced salary costs by 30% (price: $10 unit)
Batch size Labor costs Profits Return on investment
10 gal. $ 147,766 $ 131,088 66%
50 gal. $ 120,060 $ 158,794 79%
100 gal. $ 92,354 $ 186,500 93%
Breakeven units 24,843 22,322 20,265
Finally, we doubled the ingredient costs. Each scenario is still profitable with a high ROI, suggesting that
vegetable inputs are not a key factor to the profitability of the value-added products (Table 57).
Table 57. Doubling the ingredient costs – salsa (price: $10 unit)
Batch size Labor costs Profits Return on investment
10 gal. $ 192,096 $ 54,216 27%
50 gal. $ 156,078 $ 90,234 45%
100 gal. $ 120,060 $ 126,252 63%
Breakeven units 36,182 29,808 25,343

97
Salsa benefit-cost analysis (capital budgeting) A benefit-cost (financial) analysis was conducted for salsa under limited criteria. It is based on a fully
scaled-up operation on a ten-year time horizon with an initial capital investment of $200,000.
We assumed a discount rate of 7% (interest rate). Current rates for small business loans range from
6.50% to 11.25% in nominal terms.xxxvii We assumed the small batch base case for salsa production with
an output of 667 batches or 53,360 bottles of salsa. Total costs are 446,842 annually (fixed and variable)
and total revenues are $533,600 at $10 per bottle. Costs and revenues are assumed to increase
proportionally (thus offsetting) and kept constant to simplify the analysis. The net present value is
$409,352 at a 7% discount rate. The internal rate of return is 42% and the payback period is 3 periods.
The benefit-cost ratio is 1.12 (Table 58).
Table 58. Benefit-cost assessment salsa production (base case) (CCF=cumulative cash flows)
Yrs Investment Costs Total costs Revenue Net CCF
0 $200,000 $200,000 0 -$200,000 -$200,000
1 $446,842 $446,842 $533,600 $86,758 -$113,242
2 $446,842 $446,842 $533,600 $86,758 -$26,484
3 $446,842 $446,842 $533,600 $86,758 $60,274
4 $446,842 $446,842 $533,600 $86,758 $147,032
5 $446,842 $446,842 $533,600 $86,758 $233,790
6 $446,842 $446,842 $533,600 $86,758 $320,548
7 $446,842 $446,842 $533,600 $86,758 $407,306
8 $446,842 $446,842 $533,600 $86,758 $494,064
9 $446,842 $446,842 $533,600 $86,758 $580,822
10 $446,842 $446,842 $533,600 $86,758 $667,580
NPV $200,000 $3,138,431 $3,338,431 $3,747,783 $409,352
Internal rate of return 42%
Benefit/cost 1.12 Payback period 3 Discount rate 7%
Scenario 2: Marinara sauce
Marinara product revenue and production assumptions The base case features a 10-gallon batch (small batch process) that produces 80 12-ounce jars of salsa
per batch (96 ounces per gallon total per batch). Marinara processing includes an approximate 25%
reduction of volume of ingredients during the process. There are 12 jars per case, 6.7 cases per batch,
and 80 jars per batch. For the base case, each jar sells for $11 each or $880 of revenues per batch. The
cost structure is very similar to salsa production but with 12 ounces instead of 16 ounces per jar.
The initial marinara analysis in this studyxxxviii assumed a bottle size of 24 ounces instead of 12 ounces.
The base case was unprofitable at the 24-ounce size, given the other assumptions in the analysis. Right
sizing the bottle will increase revenues per batch and improve marketability as a high-end specialty
product.

98
Marinara: Labor costs (similar to salsa production) The WWVFSC estimated that it takes 600 minutes (10 labor hours) to prepare the vegetables, 120
minutes (2 hours) to cook the ingredients, 80 minutes (1.33 hours) to jar the marinara, 40 minutes to
label the jars (0.67 hours), and 120 minutes (2 hours) for cleanup. In total it takes about 960 minutes or
16 hours to produce one batch or 80 jars of marinara sauce. If we assume a fully loaded wage (i.e., a
wage including benefits) of $18 per hour, it costs $288 of labor per batch of 80 jars. Scaling up to
batches of 667 or 26,680 bottles annually, would cost 10,672 labor hours or 5.13 full-time equivalent
jobs annually, costing $192,096.
Marinara sauce economies of scale (larger batches) We assume the same economies of scale will occur to reduce labor costs per batch and overall costs as
in salsa production. The labor benefits include the benefits of learning-by-doing as production expands
and by automation from increasing capital acquisition. A simulation of these effects is included in the
analysis. We assume that at the 50-gallon batch size, labor costs fall by 18.75% (13 labor hours
equivalent) and by 37.5 % at the 100-gallon batch size (10 labor hours equivalent).
Marinara sauce ingredients The ingredient mixes for marinara sauce is similar to salsa but with substantially greater tomato inputs,
which are illustrated in Table 59. The food coalition members estimated that for a 10-gallon batch of
marinara, 90 pounds of tomatoes, 30 pounds of peppers, and 15 pounds of onions are needed. These
quantities are proportionally scaled for the 50-gallon and 100-gallon batch sizes.
Table 59. Marinara ingredients requirements
Ingredients
Pounds of ingredients required per batch size
10 gal. batch 50 gal. batch 100 gal. batch
Tomatoes 90 lbs. 450 lbs. 900 lbs.
Peppers 30 lbs. 150 lbs. 300 lbs.
Onions 15 lbs. 75 lbs. 150 lbs.
Marinara sauce ingredient costs For a 10-gallon batch, tomatoes will cost $60.23, peppers will cost $7.40, and onions will cost $1.24.
Total costs for a 10-gallon batch is $68.86. For a 50-gallon batch the cost is $344.32, and for a 100-gallon
batch the cost is $688.64 (Table 60).
Table 60. Cost of ingredients for marinara sauce
Expenditures per batch
Ingredients $/lb. 10 gal. batch 50 gal. batch 100 gal. batch
Tomatoes $ 0.67 $ 60.23 $ 301.13 $ 602.27
Peppers $ 0.25 $ 7.40 $ 37.00 $ 74.00
Onions $ 0.08 $ 1.24 $ 6.19 $ 12.38
Total/batch $ 68.86 $ 344.32 $ 688.64
Expenditures* $ 45,932.35 $ 45,932.35 $ 45,932.35
*Ingredients for 26,680 bottles cost $45,932.35.

99
Marinara total revenues We assumed a base case of $11 per bottle of marinara sauce based on information provided by coalition
members. The base case assumes that 53,360 bottles are sold once the enterprise is fully scaled up. This
translates into 667 batches for the 10 gal. size, 133 batches for the 50 gal. size, and 66.7 batches for the
100 gal. size. Total revenues are $586,960 for the base case (Table 61).
Table 61. Marinara revenues
Size/Batch Batches Bottles/Bh Bottles Revenues
10 lbs. 667 80 53,360 $ 586,960
50 lbs. 133 400 53,360 $ 586,960
100 lbs. 66.7 800 53,360 $ 586,960
The proforma income statement for the “base case” is presented in Table 62. Total revenues are
$586,960 based on 53,360 bottles of salsa being solid at a price of $11 per bottle. Total variable costs
are $384,700, leaving a gross margin of ($238,260). Fixed costs are $114,200, leaving a net profit before
taxes of $124,060. The base case is financially viable for marinara.

100
Table 62. Proforma income statement for the base case – marinara sauce
Total revenues $586,960
Variable costs
Spoilage/Returns xxxix $29,348
Cost of Goods Sold $45,932
Labor $192,096
Trucking $33,300
Add. Prod. Costs $10,672
Supplies $10,672
Bottling $26,680
Total variable costs $348,700
Gross margin $238,260
Fixed costs
Lease $6,000
Heat/electric $8,400
S/Water/Garbage $4,800
Insurance $5,000
Marketing $5,000
Interest $14,000
Depreciation $19,000
Management $52,000
Total fixed costs $114,200
Total variable + fixed costs $462,900
Net profits (before taxes) $124,060
Marinara breakeven analysis
Using the same framework as for salsa, we extended economies of scale for 50-gallon and 100-gallon
batches, providing 18.75% and 37.5% efficiency gains respectively. All scenarios are feasible as can be
seen in Table 63.
Table 6328. Marinara breakeven analysis
Metric 10 gal./BT 50 gal./ BT 100 gal./ BT
Price $ 11.00 $ 11.00 $ 11.00 VC/Unit $ 6.53 $ 5.86 $ 5.18
Margin/Unit $ 4.47 $ 5.14 $ 5.82
TFC $ 114,200 $ 114,200 $ 114,200
Breakeven units 25,576 22,217 19,638
Marinara sauce production: Increased labor efficiency scenario An alternative scenario increases labor efficiency by 50% for each scenario through learning-by-doing,
capital acquisition, and automation in the production process. All three batch sizes are feasible as seen

101
in Table 64. For the 100-gallon production process, the breakeven point of production is 17,395 units in
this scenario.
Table 64. Increasing labor efficiency 50%/batch size - marinara production
Metric 10 gal./BT 50 gal./ BT 100 gal./ BT
Price $ 11.00 $ 11.00 $ 11.00
VC/Unit $ 5.33 $ 4.88 $ 4.43
Margin/Unit $ 5.67 $ 6.12 $ 6.57
TFC $ 114,200 $ 114,200 $ 114,200
Breakeven units 20,158 18,675 17,395
Marinara sauce benefit-cost analysis (capital budgeting) A benefit-cost (financial) analysis was conducted for marinara under limited criteria. It is based on a fully
scaled-up operation on a ten-year time horizon with an initial capital investment of $200,000.
We assumed a discount rate of 7% (interest rate). We assumed the small-batch base case for marinara
sauce production with an output of 667 batches or 53,360 bottles of marinara. Total costs are $462,960
annually (fixed and variable) and total revenues are $586,960 at $11 per bottle. Costs and revenues are
assumed to increase proportionally (thus offsetting) and kept constant to simplify the analysis. The net
present value is $671,343 at a 7% discount rate. The internal rate of return is 62% and the payback
period is 2 years. The benefit-cost ratio is 1.19. The internal rate of return is the discount rate that
makes the net present value (NPV) of all cash flows from a project equal to zero (Table 65).
Table 65. Benefit-cost assessment for marinara production (base case) (CCF=cumulative cash flows)
Yrs Investment Costs Total costs Revenue Net CCF
0 $200,000 $200,000 0 -$200,000 -$200,000
1 $462,900 $462,900 $586,960 $124,060 -$75,940
2 $462,900 $462,900 $586,960 $124,060 $48,119
3 $462,900 $462,900 $586,960 $124,060 $172,179
4 $462,900 $462,900 $586,960 $124,060 $296,239
5 $462,900 $462,900 $586,960 $124,060 $420,298
6 $462,900 $462,900 $586,960 $124,060 $544,358
7 $462,900 $462,900 $586,960 $124,060 $668,418
8 $462,900 $462,900 $586,960 $124,060 $792,477
9 $462,900 $462,900 $586,960 $124,060 $916,537
10 $462,900 $462,900 $586,960 $124,060 $1,040,596
NPV $200,000 $3,251,218 $3,451,218 $4,122,561 $671,343
Internal rate of return 62%
Benefit/Cost 1.19
Payback Period 2
Discount Rate 7%

102
Economic impacts of salsa or marinara sauce production We assumed the base case of salsa and marinara production with overall gross revenues of $533,600.
The production and revenue streams of both products were very similar, thereby producing the same
overall economic impacts. Thus, these results can be used for either salsa or marinara production. We
are assuming most of the sales are made to larger cities and towns outside the regional economy.
Factoring in the multiplier analyses, either salsa or marinara food production (base case) creates a total
of 12 regional jobs, $448,479 in salaries and benefits, $543,986 in gross regional product, and $851,075
in sales (output), including multiplier effects (Table 66. In addition, the enterprise would contribute
approximately $9,372 in property taxes, $17,447 in sales and excise taxes, and $5,107 other taxes, for a
total of $31,926, including multiplier effects.
Table 66. Economic impacts of salsa or marinara sauce production
Impact Type Employment Labor
income Gross regional
product Output
Direct effect 10 $350,000 $369,435 $533,600
Indirect effect 0.7 $35,559 $54,532 $106,413
Induced effect 1.6 $62,920 $120,018 $211,062
Total effect 12 $448,479 $543,986 $851,075
Scenario 2: Popsicles
Popsicle revenue and production assumptions The following section outlines the cost structure and revenue profile for popsicle production. The
infrastructure of this scenario is similar to the salsa and marinara sauce scenarios and the fixed costs
were the same. The variable costs have proportionally less labor per batch but more ingredient costs per
batch than the other two scenarios. There will also be greater spoilage because the product has to be
frozen. Refrigeration will be a major factor throughout the production and supply chain process. The full
costs are largely unknown and may not be fully reflected in the analysis. This will be an important
consideration in the startup and scaling process.
The proposed popsicle products are “Peaches and Cream Walla Pop,”
“Melon Paleta Walla Pop,” “Blooming Mary Walla Pop,” and “Razzelberry,”
which we chose to represent the base case. The small batch size is a 5-
gallon batch that produces 300 Razzelberry popsicles per batch. For the
base case, each popsicle sells for $3 or $900 of revenues per batch.
Popsicle food preparation labor costs (small batch) A small-batch (i.e. 10-gallon batch) food preparation analysis for
Razzelberry was the basis for the labor estimation for popsicle production
based on input from the steering committee members (Tables 67 and 68).
Additional popsicle
equipment would cost
$20,000 if this scenario
shared equipment and
infrastructure with one
of the other value-
added lines.

103
Table 67. Razzelberry popsicle labor requirements
Task/batch Labor
minutes Labor hours
Prepare fruit 90 1.5
Cook/package 90 1.5
Minutes/batch 150 3.0
Total batches (667) 120,060 2,001
A steering committee member estimated that it takes 1.5 labor hours to prepare the fruit and 1.5 hours
to prepare the ingredients and for packaging, totaling 3 hours to produce one batch of 300 popsicles. If
we assume a fully loaded wage (i.e., a wage including benefits) of $18 per hour, it costs $54 of labor per
batch of 300 popsicles. Scaling up to batches of 667, or 200,100 popsicles annually, would cost 2,001
labor hours or 0.96 full-time equivalent jobs annually, costing $36,018.
Popsicle economies of scale (larger batches) We assume economies of scale will reduce labor costs per batch and overall costs. This includes the
benefits of learning-by-doing as production expands and from increasing capital acquisition. We assume
that at the 50-gallon batch size, labor costs fall by 16.7% (2.5 labor hours equivalent) and by 33 % at the
100-gallon batch size (2 labor hours equivalent) (Table 69).
Table 69. Economies of scale of labor costs per year per batch size of popsicles at wage of $18.00/hr
Total batch size
Production time per 10 gal. produced
3 hr./5 gal. 2.5 hr./10 gal. 2 hr./ 50 gal.
5 gal. $ 54.00 $ 45.00 $ 36.00
50 gal. $ 270.00 $ 225.00 $ 180.00
100 gal. $ 540.00 $ 450.00 $ 360.00
Labor costs $ 36,018 $ 30,015 $24,012
Popsicle ingredients For the Razzelberry popsicles, we assumed that 50% of the ingredients are berries, 25% apple juice, and
25% water. The coalition estimates that each 5-gallon batch takes 40 lbs. of berries at $2.0 per pound,
50 lbs. of apples at $0.50 per pound, and $10 of lemon juice and other ingredients. For a five-gallon
batch, the cost is $80 for berries, $25 for apples, and $10 for lemons and other ingredients. Total
product cost is $115 for 5 gallons, $1,150 for 50 gallons, and $2,300 for 100 gallons. Expenditures for
production of 200,100 popsicles would total $76,705.00 (Table 70).
Table 70. Cost of ingredients for Razzelberry popsicles
Expenditures Per Batch
Ingredients $/lb./unit 10 gal. batch 50 gal. batch 100 gal. batch
Berry fruit $ 2.00 $ 80.00 $ 800.00 $ 1,600.00
Apples $ 0.50 $ 25.00 $ 250.00 $ 500.00
Lemons/Sugar $ 10.00 $ 10.00 $ 100.00 $ 200.00
Total/Batch $ 115.00 $ 1,150.00 $ 2,300.00
Expenditures* $ 76,705.00 $ 76,705.00 $ 76,705.00
Table 68. Labor costs for Razzelberry popsicle
production
Personnel requirements Total
Wage ($18/hour) $36,018
Total annual FTEs 0.96

104
Popsicle total revenues The proforma income statement for popsicles is presented in Table 71. Total revenues are $600,300 for
200,100 popsicles. Variable costs are $396,148, creating a gross margin of $204,152. Total fixed costs
are $114,200, creating a net profit of $89,852 with a return on investment (ROI) of 45%.
Table 71. Proforma income statement for the base case - popsicles
Total revenues $600,300
Variable costs
Spoilage/returns xl $30,015
Cost of goods sold $76,705
Labor $36,018
Trucking $33,300
Additional production costs $40,020
Supplies $40,020
Packaging $140,070
Total variable costs $369,148
Gross margin $204,152
Fixed costs
Lease $6,000
Heat/electric $8,400
Sewer/water/garbage $4,800
Insurance $5,000
Marketing $5,000
Interest $14,000
Depreciation $19,000
Management $52,000
Total fixed costs $114,200
Total variable + fixed costs $510,348
Net profits (before taxes) $89,952
Popsicle breakeven analysis Table 72 presents the breakeven analysis for popsicles at various levels of productivity. The breakeven
for the base case is 111,933 popsicles.
Table 72. Popsicle breakeven analysis
Metric 5 gal./BT 50 gal./ BT 100 gal./ BT
Price $ 3.00 $ 3.00 $ 3.00
Variable costs/unit $ 1.98 $ 1.95 $ 1.92
Gross margin/unit $ 1.02 $ 1.05 $ 1.08
Total fixed costs $ 114,200 $ 114,200 $ 114,200
Breakeven units 111,933 108,736 105,716

105
Popsicle benefit-cost analysis (capital budgeting) A benefit-cost (financial) analysis was conducted for popsicles under limited criteria. It is based on a fully
scaled-up operation on a ten-year time horizon with an initial capital investment of $200,000.
We assumed a discount rate of 7% (interest rate). We assumed the small-batch base case for popsicle
production with an output of 667 batches or 200,100 popsicles. Total costs are $510,348 annually (fixed
and variable) and total revenues are $600,300 at $3 per popsicle. Costs and revenues are assumed to
increase proportionally (thus offsetting) and kept constant to simplify the analysis. The net present value
is $431,785 at a 7% discount rate. The internal rate of return is 44% and the payback period is 3 years.
The benefit-cost ratio is 1.11 (Table 73).
Table 73. Benefit-cost assessment popsicle production (CCF=cumulative cash flows)
Yrs Investment Costs Total costs Revenue Net CCF
0 $200,000 $200,000 0 -$200,000 -$200,000
1 $510,348 $510,348 $600,300 $89,952 -$110,048
2 $510,348 $510,348 $600,300 $89,952 -$20,096
3 $510,348 $510,348 $600,300 $89,952 $69,856
4 $510,348 $510,348 $600,300 $89,952 $159,808
5 $510,348 $510,348 $600,300 $89,952 $249,760
6 $510,348 $510,348 $600,300 $89,952 $339,712
7 $510,348 $510,348 $600,300 $89,952 $429,664
8 $510,348 $510,348 $600,300 $89,952 $519,616
9 $510,348 $510,348 $600,300 $89,952 $609,568
10 $510,348 $510,348 $600,300 $89,952 $699,520
NPV $200,000 $3,584,471 $3,784,471 $4,216,256 $431,785
Internal rate of return 44%
Benefit/cost 1.11
Payback period 3
Discount rate 7%
Economic impacts of popsicle production We assumed the base case of popsicle production with overall gross revenues of $600,300. We are
assuming most of the sales are made to larger cities and towns outside the regional economy.
Factoring in multiplier analyses, the popsicle base case creates a total of 8 regional jobs, $375,885 in
salaries and benefits, and $528,749 in gross regional product, and $889,001 in sales (output) per year.
(Table 74). In addition, the enterprise would contribute approximately $22,489 in property taxes,
$41,868 in sales and excise taxes, and $3,849 other taxes, for a total of $68,206, including multiplier
effects per year.
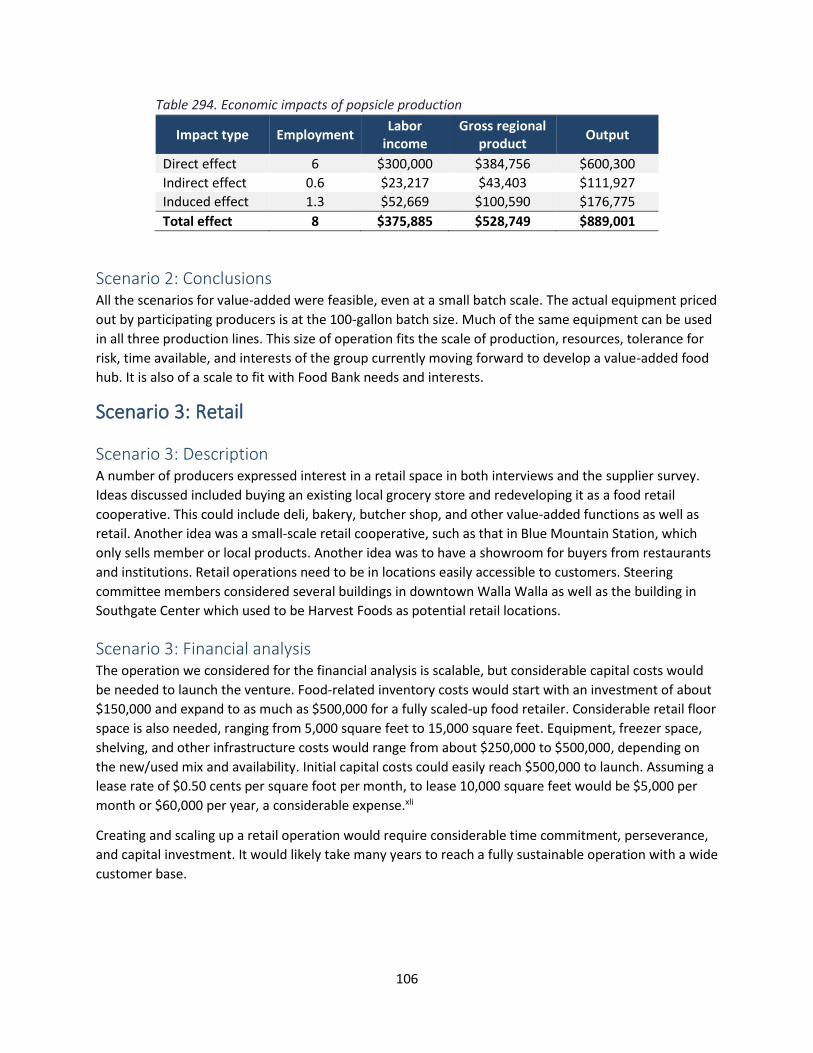
106
Table 294. Economic impacts of popsicle production
Impact type Employment Labor
income Gross regional
product Output
Direct effect 6 $300,000 $384,756 $600,300
Indirect effect 0.6 $23,217 $43,403 $111,927
Induced effect 1.3 $52,669 $100,590 $176,775
Total effect 8 $375,885 $528,749 $889,001
Scenario 2: Conclusions All the scenarios for value-added were feasible, even at a small batch scale. The actual equipment priced
out by participating producers is at the 100-gallon batch size. Much of the same equipment can be used
in all three production lines. This size of operation fits the scale of production, resources, tolerance for
risk, time available, and interests of the group currently moving forward to develop a value-added food
hub. It is also of a scale to fit with Food Bank needs and interests.
Scenario 3: Retail
Scenario 3: Description A number of producers expressed interest in a retail space in both interviews and the supplier survey.
Ideas discussed included buying an existing local grocery store and redeveloping it as a food retail
cooperative. This could include deli, bakery, butcher shop, and other value-added functions as well as
retail. Another idea was a small-scale retail cooperative, such as that in Blue Mountain Station, which
only sells member or local products. Another idea was to have a showroom for buyers from restaurants
and institutions. Retail operations need to be in locations easily accessible to customers. Steering
committee members considered several buildings in downtown Walla Walla as well as the building in
Southgate Center which used to be Harvest Foods as potential retail locations.
Scenario 3: Financial analysis The operation we considered for the financial analysis is scalable, but considerable capital costs would
be needed to launch the venture. Food-related inventory costs would start with an investment of about
$150,000 and expand to as much as $500,000 for a fully scaled-up food retailer. Considerable retail floor
space is also needed, ranging from 5,000 square feet to 15,000 square feet. Equipment, freezer space,
shelving, and other infrastructure costs would range from about $250,000 to $500,000, depending on
the new/used mix and availability. Initial capital costs could easily reach $500,000 to launch. Assuming a
lease rate of $0.50 cents per square foot per month, to lease 10,000 square feet would be $5,000 per
month or $60,000 per year, a considerable expense.xli
Creating and scaling up a retail operation would require considerable time commitment, perseverance,
and capital investment. It would likely take many years to reach a fully sustainable operation with a wide
customer base.

107
Scenario 3: Moscow Food Cooperative example The Moscow Food Co-op (Moscow, Idaho) is a good example of a highly successful retail enterprise. It is
now a community leader and a cornerstone business for downtown Moscow and part of the overall
brand of the City of Moscow. The Moscow Food Co-op helped establish the Moscow Farmers Market,
one of the best in the Pacific Northwest for the size of the community. However, the Moscow Food Co-
op had a very long scaling-up evolution, which took place over many decades. It was founded in 1973 –
47 years ago in a smaller building than it is in currently. Today it has about 15,000 square feet of retail
space and is owned by nearly 7,800 people in the Moscow, Idaho region. Its retail and food service
spaces are situated in a former Safeway store in downtown Moscow, Idaho
In 2018, the coop had $2.7 million in assets, $11.3 million in annual sales, and 130 staff. It purchases
$778,000 of local produce and products from 200 producers annually (Table 75).
Table 75. Moscow Food Co-op income statement
2017 2018
Net sales $11,112,321 $11,372,645
Cost of goods $6,447,410 $6,586,073
Gross profit $4,664,911 $4,786,572
Personnel $3,155,059 $3,319,088
Occupancy $395,441 $417,052
Administration $345,829 $400,987
Marketing + outreach $351,917 $351,926
Store operations $420,279 $416,922
Governance $36,289 $35,636
Total expenses $4,704,814 $4,941,611
Other income $67,835 $49,173
Other expenses $574 —
Net profit* $27,358 -$105,866 * Prior to final 2018 depreciation and final income taxes
Scenario 3: Economic impacts We assume a Moscow Food Coop type operation with about $7 million in retail sales and $1 million in
prepared foods. These represent base sales or new monies to the economy. We input the data into a
modified IMPLAN food and beverage stores sector and other food and drinking places in the model.
Factoring in the multiplier analyses, the retail operation creates a total of 60.0 regional jobs, $1.9 million
in salaries and benefits, and $2.7 million in gross regional product, and $4.4 million in sales (output)
including the multiplier effects per year. In addition, the operation contributes approximately $179,066
in property taxes, $333,377 in sales and excise taxes, and $23,082 other taxes, for a total of $535,525,
including the multiplier effects per year (Table 76).

108
Table 76. Output by impact type
Impact type Employment Labor
income Gross regional
product Output
Direct effect 49.7 $1,517,499 $1,905,161 $2,953,000
Indirect effect 3.3 $114,571 $253,092 $498,778
Induced effect 6.7 $266,824 $508,330 $894,300
Total effect 60 $1,898,895 $2,667,583 $4,346,078
Scenario 3: Conclusions Although a portion of those surveyed and several of those interviewed were interested in developing a
retail operation, others, including those on the steering committee, thought that retail was not a
compatible activity for this particular effort. Several thought establishing a retail outlet could detract
from Food Bank operations. The general feeling was that it did not seem like a good idea to give food
away and sell food in the same space. A retail operation also would need to be able to separate public
space from warehouse space, which is already a challenge for the Food Bank. Furthermore, while a retail
operation would benefit producers and potentially the food hub, it provides little gain or incentive for
the Food Bank to participate. While in general there was interest in this option, no strong advocate
interested in leading the effort was apparent during the process.
Scenario 4: Commercial kitchen
Scenario 4: Description Additional commercial kitchen capacity was consistently identified as a need for the Walla Walla Valley
in interviews and WWVFSC steering committee meetings. As part of exploring this scenario, those
surveyed, interviewed, and in the steering committee identified equipment needed for a commercial
kitchen. There is a considerable range in prices for any specific item, depending on multiple variables
(Table 77).
Commercial kitchen equipment can range from $15,000 to $500,000 for large operations.xlii Several key
informants we interviewed indicated that facility modifications are much more expensive than
equipment. Researchers in this study estimated the cost (at the high end) at about $130,000 for new
equipment and facility modifications for a commercial kitchen.

109
Table 77. Commercial kitchen needs
Specific function Cost
Preparation
Misc. kitchen tools, for example, cutting boards $500 Grinder $239 - $283 Dehydrator $200 - $690 Cherry pitter $103 Industrial chopper/dicer $185 - $500
Fruit & vegetable peeler $5 - $1,852
USDA meat room smoker and meat grinders LARGE RANGE
Vacuum packager $500 - $3,753 Mixer: 40-Quart / 80-Quart / Other $7,000 - $19,000 each Stainless steel tables $233-$440/each Heated proofer cabinet $2,000 - $6,142 VEMAG stuffers & portioner with guillotine
Cooking
Type 1 exhaust hood $1,000 - 4,530 Electric convection oven $5,718 - $10,725 Steam & water jacketed kettle $5,000- $25,000 Full-size four-rack gas convection oven $3,325 - $9,000
Four-burner gas stove $1,989.00 or
$4,990.15 Six-burner gas stove $1,657 - $5,620 Oven/stove combo ^^ Gas tilting skillet $18,122 - $19,361
Three-foot gas grill $2,500
Microwave $300- $1,300
Wash
Under-counter commercial dishwasher $5,275 - $7,818
Stainless-steel 3 compartment sink $500 - $1,303
Triple sink for washing produce $500-$1,300
Stainless steel dry racks $600 – 1,500
Handwashing sink $449
Storage
Stainless steel refrigerator (standalone) $1,373 - $6,000
Personnel
1 scheduler/manager

110
Scenario 4: Conclusions BMS and Pasco Specialty Kitchen serve people from across the Walla Walla Valley, but mostly those
closer to Dayton or Pasco, respectively, use their services. Many key informants thought that a large
portion of the Walla Walla Valley was underserved when it comes to commercial kitchen access. Several
stakeholders were concerned about the impact of a new commercial kitchen in Walla Walla on BMS,
although no one thought this was a barrier.
Several key informants indicated that enough commercial kitchens or suitable facilities exist and that it
is more a matter of people learning where to access them. For example, the Walla Walla Fairgrounds
has several kitchens that are underused, and churches, schools, and a variety of other options were
identified, although most of these do not include the specialized equipment normally associated with
commercial kitchens. During the planning process, meeting participants reported that both the cities of
Walla Walla and College Place were interested in developing commercial kitchens, further complicating
development of a commercial kitchen at a food hub. Also important, commercial kitchens are generally
organized by a public agency interested in local economic growth. The ones we reviewed were not profit
oriented, although their revenues helped cover some operational costs. This makes a commercial
kitchen less attractive as part of a startup that needs to breakeven as soon as possible.
At the same time, specific equipment is needed by multiple producers in the Walla Walla Valley that is
not currently available and is too expensive for individual small farms. Several on the steering
committee and interviewed identified steam kettles for making jams and sauces as the highest priority
gap in the Walla Walla Valley. For that reason, a smaller steam kettle could be added to the value-added
line in Scenario 2 to address this need as well as for use in developing recipes and test batches. A
commercial kitchen’s value is more as a support for food entrepreneurs and producers than as a profit
center to support a new food hub. Since multiple other groups are interested in developing commercial
kitchens in the area, it makes sense for the food hub to fit in a priority need of a number of actively
engaged producers (i.e., an appropriately sized steam kettle), but wait and see what else develops in the
area for commercial kitchens while focusing the food hub on starting up the value-added processing
lines.

111
Comparing the scenarios: Strengths, weaknesses, opportunities, treats We compared the scenarios using a SWOT analysis (Table 78).
Table 78. Summary of strengths, weaknesses, opportunities, and threats by scenario
Strengths Weaknesses Opportunities Threats
Scenario 1: Distribution • Stakeholder interest • Qualifies for government grants • Considerable local expertise available • Brings new money into community • Other organizations successfully doing this
in the region provide proof of concept
• Difficult to make profitable • Long lead time to make profitable • Higher human capital required • No one committing to move forward • Might require debt • Capital intensive • Requires a diverse range of products
• Synergistic with Food Bank operations • Can be integrated into Food Bank
remodel • Forming regional network with LINC
Foods and other distributors
• Local competition, including with mainstream food system
• Dependent on many committed farmers
• Dependent on Food Bank support
Scenario 2: Value-added processing • Producers already launching • Easiest to make profitable • Could qualify for government grants • Scalable at every stage • Considerable local expertise available • No local competition for many products • Brings new money into community • Could involve few or many types of crops • Other organizations successfully doing this
in the region provide proof of concept
• Potentially capital intensive • Small number of people involved make
exiting the business potentially more difficult
• Synergistic with Food Bank operations • Can be integrated into Food Bank
remodel • Ability to schedule processing during
farming off season • High potential for employment
opportunities • Flexibility for multiple
individuals/groups to develop products
• Could reduce Food Bank donations
Scenario 3: Retail • Could qualify for government grants • Considerable local expertise available • Other organizations successfully doing this
in the region provide proof of concept
• Likely incompatible with Food Bank operations
• Difficult to make profitable • Long lead time to make profitable • Higher human capital required • No one committing to move forward • Capital intensive • No suitable buildings available • Requires a diverse range of products
• Direct outlet for member producers • High potential for employment
opportunities
• Local competition, including with mainstream food system
• Dependent on many committed farmers
Scenario 4: Commercial kitchen
• Could qualify for government grants • Considerable local expertise available • Other organizations successfully doing this
in the region provide proof of concept
• Perception it could hurt BMS • Not profitable • No one committing to move forward • Less compatible with Food Bank than
value-added scenario
• Demand among some producers • Synergistic with Food Bank operations • Individual equipment synergistic with
value-added scenario • Flexibility for multiple
individuals/groups to develop products
• Could reduce Food Bank donations
• Local competition with other commercial kitchens

112
Organizational structure Discussion about how to organize the food hub took place throughout the project. The primary decisions
were 1) the values of the food hub and how they should be reflected in the organizational structure, 2)
whether it should be for-profit or nonprofit, and 3) what type of legal structure it should have.
Triple-bottom line model One decision point in the conversation occurred during a WWVFSC meeting in April 2019 where
coalition members discussed differences in focus between a food hub that is organized solely towards
making profit, a hub developed as a social enterprise (i.e., generating profit to address a social cause),
and one developed as a triple bottom line hub (i.e., balancing profit with social and environmental
values). While not a consensus, the group overwhelmingly chose a triple-bottom line model. Fairness to
everyone involved was repeatedly emphasized, meaning fairness to producers and employees as well as
everyone else in the supply chain, including consumers. While discussion continued in the project about
the balance of profit and nonmonetary values, from that point forward it occurred within the
expectation that the hub would follow a triple bottom line model.
For-profit model Another decision point was whether the food hub should be a nonprofit or for-profit organization. The
decision was made to focus on a for-profit model for a number of reasons: 1) since the Food Bank is a
nonprofit, the food hub would be able to access the larger pool of available grants available to
nonprofits without needing to be one itself, 2) developing a food hub is a lot of work over a long period
of time and those involved wanted to be rewarded financially if they invested their time and resources,
and 3) no one involved stepped forward to lead the charge to develop it as a nonprofit organization. A
factor that proved to be important is the food hub can be developed to follow triple bottom line values
regardless of whether it is a nonprofit or for-profit organization.
Limited liability company (LLC) structure Those interviewed and the steering committee considered several possible organizational structures,
including a producer cooperative, an employee/producer cooperative, a B-corporation (triple bottom
line), a limited liability company (LLC), and a nonprofit organization. Through discussion at WWVFSC and
steering committee meetings and research, the focus became on either a for-profit LLC or a cooperative.
Over the life of the project, the group settled on developing an LLC for several reasons: 1) either
business structure could facilitate advancing triple bottom line values, 2) an LLC is simpler to set up
given the size of the group currently committed to developing the food hub, 3) several members of the
group had set up their farms as LLCs and the group as a whole was comfortable with the model or did
not have strong opinions, and 4) several group members had been board members or members of
cooperatives and were not interested in the prolonged discussions and conflicts involved with getting a
large group to work together.
Conclusions At the end of the project, a small group of producers (less than 10) are moving forward with developing
a for-profit, triple bottom line food hub organized as an LLC focused on value-added processing of salsa,
marinara sauce, popsicles, and potentially jams to start. Although many farmers have expressed interest

113
in participating, it is unclear how many additional farmers will want to join the effort to actually start
one compared to those who will participate if others do the work of setting it up. The farmers most
involved figure they can change the organizational structure if needed in the future if circumstances
change.
How should it be financed?
Many funding sources and configurations are possible We found each food hub had a unique strategy and history of securing the resources they needed. The
funding and resources they secured generally reflected who was leading the effort, whether a public
agency, a cooperative, or a family business. Figure 43 includes funding sources identified by those
interviewed as being used during food hub start up and subsequent scaling up of operations. At the
scale of the food hub options considered, funding could be recruited from a variety of sources and
configurations, depending on the specific resources available. Every food hub we interviewed had their
own unique mix, which often included the use of existing or loaned equipment and storage space with a
lot of sweat equity and support by others. Co-location with other organizations or free or shared use of
infrastructure, such as coolers and freezers, is a common story. It does not take any particular funding
configuration to make this type of enterprise work; rather, it is the ability to put together whatever is
needed from the resources available. In general, food hubs run by agencies and nonprofits are more
heavily reliant upon public funding and matched staff and services. While most private enterprises used
public funding as part of startup and scaling up, they support their core functions with revenues as soon
as possible. The failure of one food hub, according to a former board member, resulted in part from the
failure to make this distinction. Running a for-profit business like an agency or nonprofit is not a strategy
for success.
Figure 43. Funding sources
Funding types
In-kind services
Grants & loans
Local bonds
Member equity
Public offering
Traditional financing
Family loans,
personal credit
Revenues
Existing resources
Volunteers
Sweat equity

114
The role of grants Ultimately, revenues should pay for food hub operations, but grants can be critical, especially during
startup. Coming up with initial funding for facilities, equipment, and staff has been a major barrier to
several of the food hubs studied.
Grants played a variety of roles in the food hubs we studied (Figure 44). Grants can provide larger sums
than other most other options, and smaller grants can fill holes in funding and build capacity. Federal
grants generally require the most work to administer and manage, although state grants can be equally
cumbersome. When an organization receives a grant from a program, funding through the same
program is less certain, and long-term funding is unlikely. Success in funding a long-term effort takes
planning and consistent effort in applying for new funding, and even the most disciplined effort will still
have occasionally disruptive gaps in funding. Other than a couple examples of agency-led efforts, almost
all of the food hubs we studied had one-time money grants, meaning they received a grant from that
funding source once, usually for a single thing, such as a year of a staff person, a piece of equipment, or
for a building.
Figure 44. Role of grants
Because of its partnership with the BMAC Food Bank, which is a nonprofit organization, the food hub
will have access to funding it otherwise would not be eligible for as a for-profit business as long as the
food hub develops in a way that is synergistic with the Food Bank. This gives the effort a lot of options,
and it should be possible to obtain grants and other resources that benefit both.
Our financial analysis found most scenarios would be profitable without including grants and other
subsidies; however, time needed to reach breakeven can be dramatically shortened by reducing costs
through grants or other subsidies. This is merited because the food hub would in part provide a service
that would benefit the general public as it will 1) enable business development at the entrepreneurial
stage to create local economic development, 2) fill a prioritized need in local and regional food system
development, help build the local small farm and business economy, and 4) increase the impact of the
115
Food Bank to address food insecurity, to name just a few of the benefits of this type of rural
development.
Specific funders An initial list of potential funding programs is included in Appendix E The list is meant to give a sense of
the overall funding landscape and is not exhaustive. Given the current expectations for the food hub,
some the funding sources are more obviously relevant to the effort than others. The USDA Agricultural
Marketing Service’s Local Food Promotion Program is a next logical step, since they funded this
feasibility study. Grants to that program can be as large as $500,000 and require a 25% match, which is
more than enough to cover all value-added scenarios analyzed and enough to launch any of the other
options as well. USDA Rural Development has several programs that are directly relevant, including the
Value-Added Producer Grants, which has been critical to other food hubs during their development in
the region. Western SARE has a number of programs that could benefit producers involved in a food
hub, and a number of private foundations and funds, such as the Tilth Alliance or M.J. Murdock
Charitable Trust are potential funders of the food hub or the Food Bank. Other funding can benefit the
effort through agency and nonprofit partners. Funding for technical training and education is available
through a variety of sources such as Western SARE, USDA, and Washington and Oregon states.
Walla Walla is also fortunate to be in Washington State, which has effective and highly supportive state-
level support for these types of efforts. In addition to funding through programs such as the Washington
State Department of Commerce Community Revitalization Board, which was critical to development of
Blue Mountain Station, for example, Washington State Department of Agriculture Regional Markets
Program has provided highly valuable resources, information, and technical support to LINC Foods and
other similar efforts in the region. Engaging support agencies such as this in the food hub development
effort is likely to make recruiting needed resources more strategic and easier and increase likelihood of
long-term success.
Reduce capital costs through Food Bank partnership Leasing space from the Food Bank will enable the food hub to avoid large capital costs that would
dramatically increase startup financing needs. The ability to buy into shared equipment with the Food
Bank is another big advantage. One option discussed is that the Food Bank could be the primary owner
of the equipment and lease use of the equipment to the food hub. One option favorably discussed was
that the food hub could pay its lease in processing services or in processed food, which would directly
benefit the Food Bank’s operation by salvaging food donations (which would otherwise be waste) and
by increasing local, shelf-stable, nutritious food for distribution. Marinara sauce and basic wash, trim,
and packaging services for fresh produce donations are examples of products and services of interest to
the Food Bank.
Member equity The producers participating in the food hub startup have also discussed each contributing $5,000 to
cover initial startup expenses while they apply for grants. This would enable them to start the process of
developing recipes and test batches while they write grants to buy equipment, help pay for staff, or
whatever is possible given priority needs and available resources. The producers in Walla Walla Grown
agreed that a substantial buy-in by participants in the food hub was important to get the ball rolling and

116
as a threshold of commitment for participation. They wanted everyone to put “skin in the game” if they
want to participate as a member or owner of the food hub. Those who do not buy in will likely be able to
lease the equipment or pay for processing and other services, but they will do so as customers rather
than as members or owners.
What to do with education Many people interviewed and participating in the feasibility process thought training and education
were vital functions for the food hub.
People who want to start a small business need education and support. There is a big gap in training and support between what is available at home kitchen and large commercial agricultural scales. People starting businesses in this economic space come from a wide variety of backgrounds, often with some experience in the food supply chain, whether it be in production, processing, retail, or restaurants. As a key informant who provides business support said, “It is not a lot of business majors.” Many people have knowledge that makes them competitive, but they need basic business support on how to start and scaleup the business aspects of their endeavor.
Supplier survey respondents were generally interested in participating in all three training topics the
survey asked them about (Figure 45). Other training topics respondents said they were interested in
included writing and negotiating contracts, consumer education, marketing, food pairing, GAP
certification, grant writing, insurance, accounting and bookkeeping, co-op business models, vegetable
and fruit production, and packaging.
Figure 45. Supplier survey respondents’ level of interest in participating in training on select topics (n=57)
Providing training and education to those supplying the food hub was a vital function in several of the public agency-led food hubs we studied. These had successfully developed grant funding to support education functions, which proved critical in supporting full-time, year-round staff. Other food hubs generally provided training for their members through partners, such as state extension or state agency programs.
A number of those interviewed, particularly those working for nonprofit organizations, identified the need for consumer education, including cooking classes. Several, including the Food Bank Director, identified the need for a community space for events, meetings, and activities. They indicated that a wide variety of education was needed for the public from cooking classes to outreach to schools. The Food Bank wants a teaching kitchen, a room suitable for use as a classroom, and a community room for larger events.
While education and community space was identified as a need, most interviewed and most of those in
the steering committee thought that it should be addressed at a later stage of development and
35%
40%
40%
39%
35%
39%
26%
25%
21%
Food safety practices
Creating value-added products
Business management
Chart Title
Not at all interestedVery interested Somewhat interested

117
probably not by the food hub at all, or with the food hub as a partner in a broader effort led by another
group. They felt that focusing a startup on educational activities detracts from the imperative to reach
profitability as soon as possible.
Education is still a high priority of the Food Bank and many of those involved in the food hub feasibility
study. The food hub though, is not a likely home for many of these activities, either during its startup or
once it is established. Some existing groups already provide educational programing, such as the Farm-
to-School program and the Walla Walla County Health Department. Next steps include further planning
with those interested in implementing training, education, and outreach activities to explore
collaboratively addressing this need.

118
Conclusions People are successfully operating all types of food hub enterprises in the Northwest, some of which are
decades old or multi-generational efforts. All the opportunities studied were feasible given enough
sweat equity and public funding, although not all are likely to be profitable or to benefit the BMAC Food
Bank. Out of the four scenarios, we found developing value-added products is the most promising in
terms of most quickly reaching breakeven. A commercial kitchen, on the other hand, will require
continuous grant and in-kind staff support and resources throughout its life. Distribution and retail
options are hard work, hard to make profitable, and hard to keep profitable. All four scenarios were
scalable, and all would benefit producers and consumers, but some less so the people setting up the
food hub (Figure 46). Ultimately, the food hub needs to reflect the interests and resources accessible to
those involved in starting it up. Overall, value-added processing was the best choice from the
perspectives of those involved.
At the same time, because of
the potential to partner with
the BMAC Food Bank, any of the
scenarios has some advantages
that a private business on its
own would not. For example,
through its access to Food Bank
equipment and infrastructure,
the food hub could start with
less capital costs than it would
otherwise. Partnership with the
Food Bank also provides access
to federal and state funding that
a private company would not
otherwise have. In addition to
helping process and supply
food—by leasing space and
buying into equipment,
vehicles, and services—a food
hub will enable the Food Bank
to get better and more equipment, which will reduce its costs and increase operational efficiencies. Co-
locating could also lead to problems, so communication and collaborative planning will be key as the
partnership advances to ensure the relationship is mutually beneficial and works well.
Ultimately the food hub will reflect the people involved, the products they choose to make and sell, and
the resources that they are actually able to bring together to start and scaleup the enterprise. The main
constraint to starting additional value-added processing activities or developing other services is the
people committed to making it happen. We encountered many people with vision and energy to
succeed in this type of endeavor, and there is room for more than one new food enterprise led by other
people interested in collaborating with the Food Bank. For this initial effort though, the next step is to
continue to develop value-added processing as the initial core service of a startup food hub.
Figure 46. Scenario summary

119
Appendices
Appendix A: Economic impacts methodology We created a multi-county 2017 greater Walla Walla regional IMPLAN (IMpact analysis for PLANning)
model to estimate the economic impacts of the BMAC Food Bank and three food hub scenarios
(distribution food hub, value-added processing, and retail). IMPLAN is the most widely employed input-
output modeling software and data package for estimating economic impacts. Outputs were adjusted
for inflation to year 2020.
Economic base assessment This analysis is founded on economic base theory. A local or regional economy has two types of
industries: base industries and non-base industries. Any economic activity that brings money into the
local economy from the outside is considered a base industry. A base industry is sometimes identified as
an export industry, which is defined as any economic activity that brings new monies into the
community from outside. For example, base industries can include high-technology companies, federal
government operations, and other manufacturing and service firms. Firms providing services to
individuals living outside the region’s trade center, such as medical and legal services, are included in the
region’s economic base. Payments from state and federal governments (including Social Security,
Medicare, university funding, retirement accounts, and welfare payments) are sources of outside
income to businesses and residents. These are counted as part of the economic base.
Non-base industries are defined as economic activity within a region that support local consumers and
businesses within the base sector. They recirculate incomes generated within the region from the base
industries. Such activities include, but are not limited to, shopping malls that serve the local population,
business and personal services consumed locally, barbers, medical services consumed locally, and local
construction contracts. Non-base industries support the base industries.
Base industries are sometimes confused with non-base industries. For example, some county economies
have large retail trade sectors that produce a paradox: they employ a substantial percentage of the
workforce but actually contribute little to the local economy because most of the retail sales are local.
They bring little new money into the community. Thus, it appears from the size effect that the retail
trade sector contributes a large amount of employment and earnings to the economy. Most of this
employment and earning activity is allocated or attributed to other local “export” industries that bring
revenues into the community from outside sales. From an economic base perspective, which determines
the economic “drivers” of the economy, the retail trade sector is much smaller. Only the retail trade
activities serving visitors from outside the area can be counted as economic base activity.
Economic base analysis is important for identifying the vital export industries of a region. Non-base
industries, on the other hand, are important for keeping money within a region and stimulating local
economic activity for residents. In this respect, non-base industries are said to deepen the economy
while export industries are said to broaden it. For example, suppose a Walla Walla patient elects surgery
at a local hospital instead of traveling to a medical center in Seattle, Washington. The substitution of
local services for an imported service represents an increase in the demand for local business services.
Keeping income in the community enhances the multiplier effects of the export industries. The overall
effect of import substitution can be viewed as an analogous increase in demand for an export industry.

120
Defining and explaining economic impacts Economic impacts measure the magnitude or importance of the expenditures of basic (export)
industries. Our economic model estimates multipliers for each industrial and service sector. Suppose
you have a (hypothetical) multiplier of 1.45. Every dollar of direct expenditures creates $1.45 dollars of
total new spending in the community’s economy.
Impacts are apportioned into two levels: the direct impact and the multiplier effects. The first level is the
direct impact of value-added expenditures on the regional economy (i.e., the jobs, payroll and earnings,
value added, and sales directly created by the industry of study through their exports). The second is
comprised of two parts: a) the impacts on other regional businesses that provide goods or services in
support of the industry of study (i.e., the indirect impacts), and b) the effect of employee and related
consumer spending on the economy (i.e., the induced impacts). The indirect and induced impacts are
the so-called “ripple” or multiplier effects of value-added expenditures in the regional economy. The
direct effects are driven by exports whereas the multiplier effects are driven by local expenditures and
the deepening of an economy. Exports, the new money coming into an economy, set off a web of
transactions as each business seeks to fulfill the demands of its customers. A manufacturer’s impact
upon the economy is thus comprised of the magnitude of the exports and magnitude of the
multiplier(s). The sum of the direct, indirect, and induced effects measures the total impact of an
industry to an economy.
Appendix B: Detailed Agricultural Census data description
Current production and farm characteristics
Number and size of farms Between 1997 and 2017, the overall trend in the five-county region is a decrease in number of farms
and total acreage farmed, except for farms less than 50 acres in size.
The number of farms in Washington and Oregon decreased from 2007-2017 at rates of 8.9% and 2.4%,
respectively (Table 79).xliii In the five-county region, the number of farms overall increased by 14 farms
(0.4%) from 2007-2017, recovering from a dip that occurred from 2007-2012. Growth was not even
across the five counties: the increases in Umatilla and Asotin counties outnumbered the losses in the
number of farms in Columbia, Garfield, and Walla Walla counties, which decreased by 9.2%, 5.4%, and
2.8% respectively.

121
Table 79. Number of farms, by county, 2007-2017
Region 2007 2012 2017 % change
(2007-2017)
Washington State 39,284 37,249 35,793 -8.9%
Oregon State 38,553 35,439 37,616 -2.4%
Five-county total 3,301 3,250 3,315 0.4%
Asotin 192 185 205 6.8%
Columbia 283 308 257 -9.2%
Garfield 239 211 226 -5.4%
Walla Walla 929 943 903 -2.8%
Umatilla 1,658 1,603 1,724 4.0%
Walla Walla and Umatilla counties have a concentration of small farms (Figure 47), which have grown in
number in the area (Figure 48). The number of farms over 1,000 acres declined by 9% across the five-
county region between 1997-2017. Farms over 1,000 acres also decreased 9% in combined acreage
(Figure 49). In the same period, farms with less than 50 acres made up 52% of the total number of farms
in the five-county region and were the only size of farm that increased in number between 1997 and
2017.
In contrast, for farms between 50-219 acres, Columbia County saw the largest growth rate in number
(47%) and combined acreage (76%) (Figure 51). Walla Walla and Asotin counties also increased in the
number of farms, although their increases were more modest (7% and 6%, respectively). Overall, the
number of farms between 50-219 acres decreased 5% in the five-county region because of losses in
Umatilla County (which decreased 20% in total number of farms and 16% in combined acreage) and in
Garfield County, which decreased 14% in number of farms of this size, although total acreage increased
by 45% in Garfield County. Total acreage of farms in this size increased in Columbia and Asotin counties
and decreased slightly in Walla Walla county. Umatilla County has the highest percentage of farms at
this scale at 59.6%, followed by Walla Walla County where 54.2% of the total number of farms are less
than 50 acres.

122
Figure 47. Total number of farms by farm size, by county, 2017
Figure 48. Number of farms by farm size, five-county totals, 1997-2017
88
71
50
489
1027
17
75
43
141
214
27
65
61
107
213
73
46
72
166
270
Asotin
Columbia
Garfield
WallaWalla
Umatilla
Number of farms
1.0 TO 49.9 ACRES
50.0 TO 219 ACRES
220 TO 999 ACRES
1,000 OR MOREACRES
0
100
200
300
400
500
600
700
800
900
1000
1.0 to 9.9 10.0 to 49.9 50.0 to 99.9 100 to 179 180 to 499 500 to 999 1,000 to1,999
2,000 +
Nu
mb
er o
f fa
rms
Size of farm (acres)
1997
2002
2007
2012
2017

123
Figure 49. Change in number of farms, 1997-2017
1543 14641525
1454
1725
516484 518
598 490513
486555
535473
789725 693 651 627
0
200
400
600
800
1000
1200
1400
1600
1800
2000
1997 2002 2007 2012 2017
1.0 TO 49.9 ACRES 50.0 TO 219 ACRES 220 TO 999 ACRES 1,000 OR MORE ACRES
11.39%
-10.13%
21.95%
4.26%
19.84%
13.11%
6.25%
47.06%
-14.00%
6.82%
-20.45%
-5.41%
22.73%
-25.29%
-11.59%
-28.19%
-6.58%
-14.77%
12.31%
-30.30%
-8.86%
-7.26%
-11.18%
-9.52%
-50% -30% -10% 10% 30% 50%
Asotin
Columbia
Garfield
Walla Walla
Umatilla
5-county Total
1.0 TO 49.9 ACRES
50.0 TO 219 ACRES
220 TO 999 ACRES
1,000 OR MORE ACRES
Figure 50. Percent change in number of farms by farm size 2007-2017

124
Though most farms in the five-county region were smaller than 50 acres in 1997-2017, the majority of
the total acreage is in farms over 1,000 acres (Table 80). In 2017, farms with total acreage over 1000
acres contained 88.5% of the total acreage in the five-county area (2,512,247 total acres). Large farms in
this size bracket are decreasing both in number and acreage, but still make up the majority.
Table 80. Acres in farms by size of farm (1997-2017)
Size of farm (acres)
Asotin Columbia Garfield Walla Walla
Umatilla 5-county Total
2017
1.0 to 49.9 767* 1,339 1,239 6,117 11,457 20,919*
50.0 to 219 1,891* 8,163 5,008 17,272 25,683 58,017*
220 to 999 12,367 31,633 30,725 58,004 114,227 246,956
1,000+ 235,137 202,216 252,876 621,144 1,200,874 2,512,247
2012
1.0 to 49.9 764 1,507 568* 7,463 10,519 20,821*
50.0 to 219 2,649* 9,266 5,145* 17,574 32,963 67,597*
220 to 999 17,877* 44,244 33,340 58,417 128,422 282,300
1,000+ 240,570 * 269,318 561,667 1,136,408 2,207,963
2007
1.0 to 49.9 986 1,626* 946 6,756 11,838 22,152*
50.0 to 219 1,442* 6,756* 5,720* 14,055 31,983 59,956*
220 to 999 12,690 42,054 35,642 75,259 118,971 286,242
1,000+ 257,498 262,743 * 586,280 1,284,529 2,392,676*
2002
1.0 to 49.9 577* 952 516* 5,839 12,937 20,821*
50.0 to 219 1684* 5,967 3,116* 15,338 29,963 56,068*
220 to 999 13,007 38,112 24,997* 62,106 113,810 252,032*
1,000+ 262,939 249,630 283,124 617,277 1,174,222 2,587,192
1997
1.0 to 49.9 684 1,063 706 5,960 13,104 21,517
50.0 to 219 1,742* 4,643 3,440* 17,938 30,513 58,276
220 to 999 16,872* 33,924 24,983* 62,380 134,192 272,351
1,000+ 295,123 281,000 301,226 664,791 1,225,789 2,767,929 * means at least one data detail withheld within sum “to avoid disclosing data for individual operations.”
The amount of data withheld in specific counties limits the conclusions about acreage of farm sizes.
However, a few conclusions about the five-county area can be drawn from the data:
• The total acreage in farms 220 to 999 acres in size decreased 9.3% between 1997 to 2017.
• The total acreage in farms larger than 1000 acres decreased 9.2% between 1997-2017.
• Walla Walla County saw a 2.6% increase in total acreage of farms sizes 1-49.9 acres.
On average, only about half of the total acreage of farms (48.2%) was harvested in 2017 (Table 76).
Farms with total acreage over 1000 acres had the lowest percentage of harvested cropland at 29.4%.

125
Farms less than 9.9 acres had an average of 48.2% of total cropland harvested, although some individual
counties had much higher rates. In this size category, Garfield County harvested 353.8% of their total
cropland, while Columbia harvesting 176.5%. These numbers greater than 100% indicated that specific
acres of land were harvested more than one time in 2017. Walla Walla County (64.8%) and Umatilla
County (35.6%) have lower harvesting rates, but ultimately have more farms in this size range. Farms
smaller than 50 acres harvested a higher percentage of their land than farms in general (Figure 51).
Table 81 provides percent of land harvested by county and farm size.
Table 51. Percentage of total cropland acreage that was harvested, 2017
Size of farm (acres)
Asotin Columbia Garfield Walla Walla
Umatilla 5-county
total
1.0 to 9.9 - 176.5% 353.8% 64.8% 35.6% 48.2%
10.0 to 49.9 11.5%* 68.3% 25.9% 43.4% 54.1% 47.9%*
50.0 to 99.9 - 27.0% 46.4% 35.7% 61.6% 46.6%*
100 to 499 68.4%* 38.0% 51.9% 65.5% 60.1% 58.1%
500 to 999 129.7% 30.0% 95.4% 65.6% 41.7% 55.7%
1,000+ 7.9% 37.2% 29.9% 38.2% 27.6% 29.4% * means at least one data detail withheld within sum “to avoid disclosing data for individual operations.”
Harvested48%
Not harvested52%
Farms with total acreage < 50 acres
Harvested32%
Not harvested
68%
Total
Figure 51. Percentage of total cropland that was harvested in 2017, five-county totals

126
Table 82. Acres of Harvested cropland by size of farm, 1997-2017
Size of farm (acres)
Asotin Columbia Garfield Walla Walla
Umatilla 5-county total
2017
1.0 to 9.9 41 143 92 691 1,129 2,096
10.0 to 49.9 88* 859 314 2,193 4,481 7,935*
50.0 to 199 1,269* 1,962 1,816 6,886 9,786 21,719*
200 to 499 3,790 5,045 6,006 16,171 25,130 56,142
500 to 999 8,359 6,213 19,546 25,343 34,199 93,660
1,000 + 18,536 75,291 75,519 237,400 331,363 738,109
2012
1.0 to 9.9 (D) 82 62 710 833 1,687
10.0 to 49.9 192* 770 207 2,610 5,349 9,128*
50.0 to 199 1,112 1,722 1,238 6,501 13,985 24,558
200 to 499 2,910 7,614 6,067 15,460 26,850 58,901
500 to 999 9,459 12,263 15,874 29,491 46,131 113,218
1,000 + 22,086 75,731 67,102 226,162 302,098 693,179
2007
1.0 to 9.9 47 73 30 426 1,048 1,624
10.0 to 49.9 (D) 703 46* 2,024 4,818 7,591*
50.0 to 199 1,311* 1,901 1,141 6,922 8,591 19,866*
200 to 499 810 5,584 5,677 11,675 25,317 49,063
500 to 999 9,242 7,693 16,978 30,100 47,130 111,143
1,000 + 21,189 89,547 59,450 230,945 352,977 754,108
2002
1.0 to 9.9 (D) 95 40 614 916 1,665
10.0 to 49.9 411* 865 190 2,853 4,773 9,092*
50.0 to 199 2,024 2,595 1,691 7,734 10,846 24,890
200 to 499 3,213 7,239 8,894 19,358 25,993 64,697
500 to 999 6,328 13,448 21,175 41,027 57,454 139,432
1,000 + 28,618 99,613 71,007 244,727 296,042 740,007
1997
1.0 to 9.9 38 67 47 684 1,093 1,929
10.0 to 49.9 492* 720 356* 2,463 4,776 8,807*
50.0 to 199 355 3,374 1,813 10,667 18,207 34,416
200 to 499 7,117 10,815 7,359 25,882 28,049 79,222
500 to 999 7,292 15,480 30,131 52,526 73,824 179,253
1,000 + 20,657 86,580 78,560 278,708 298,718 763,223
*means that there is at least one data detail missing/withheld within sum.
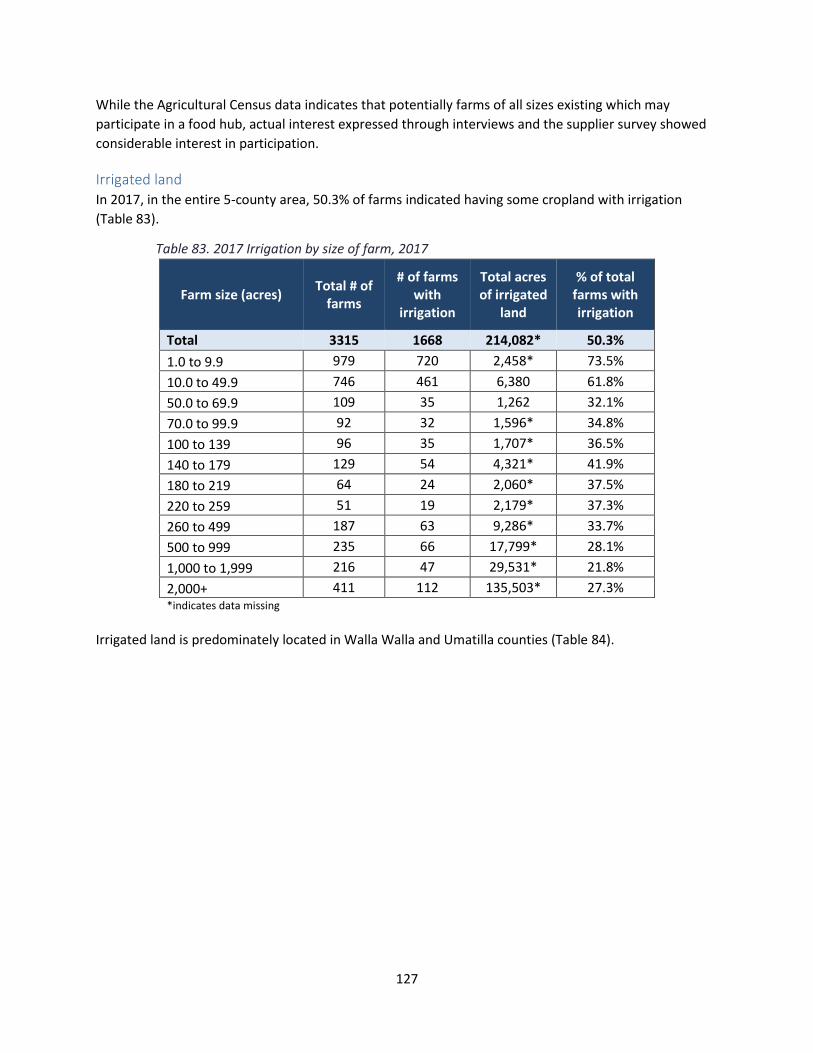
127
While the Agricultural Census data indicates that potentially farms of all sizes existing which may
participate in a food hub, actual interest expressed through interviews and the supplier survey showed
considerable interest in participation.
Irrigated land In 2017, in the entire 5-county area, 50.3% of farms indicated having some cropland with irrigation
(Table 83).
Table 83. 2017 Irrigation by size of farm, 2017
Farm size (acres) Total # of
farms
# of farms with
irrigation
Total acres of irrigated
land
% of total farms with irrigation
Total 3315 1668 214,082* 50.3%
1.0 to 9.9 979 720 2,458* 73.5%
10.0 to 49.9 746 461 6,380 61.8%
50.0 to 69.9 109 35 1,262 32.1%
70.0 to 99.9 92 32 1,596* 34.8%
100 to 139 96 35 1,707* 36.5%
140 to 179 129 54 4,321* 41.9%
180 to 219 64 24 2,060* 37.5%
220 to 259 51 19 2,179* 37.3%
260 to 499 187 63 9,286* 33.7%
500 to 999 235 66 17,799* 28.1%
1,000 to 1,999 216 47 29,531* 21.8%
2,000+ 411 112 135,503* 27.3% *indicates data missing
Irrigated land is predominately located in Walla Walla and Umatilla counties (Table 84).

128
Table 84. Irrigated acres by county, 2007-2012
Irrigated land (acres) Asotin County
Columbia County
Garfield County
Walla Walla County
Umatilla County
Total
2012 482 4,083 795 91,108 147,844
2007 307 4,172 474 92,438 142,301
% change, 2007-2012 57.0 -2.1 67.7 -1.4 3.9
Harvested cropland
2012 319 3,635 771 88,077 137,763
2007 151 3,486 379 87,162 125,833
% change, 2007-2012 111.3 4.3 103.4 1.0 9.5
Pastureland, excluding woodland pastured
2012 163 448 24 3,031 10,081
2007 156 686 95 5,276 16,468
% change, 2007-2012 4.5 -34.7 -74.7 -42.6 -38.8
Crops grown
Berries
In the five-county area, there are 70 farms that indicated they produce berries on a total of 352 acres
(Figure 52). All berry production in the area is irrigated.
In 2017, Walla Walla County contained 67.1% of the farms growing berries and 68.2% of the total acres
of berry cropland in the study area. Garfield County had no berry production reported in the Agricultural
Census in 2017.
Between 2012 and 2017, the number of farms growing blueberries doubled from 21 to 42 farms. In the
same time period, the number of farms growing blackberries decreased 33% and the number growing
strawberries decreased 57%. The number of boysenberry farms quadrupled from 1 to 4 farms, and
farms growing raspberries remained steady with 35 farms. Not all the farms that indicated they grow
berries had plants bear fruit.

129
Figure 52. Number of farms growing specific berries, 2017
Fruit and nut production
The number of farms growing fruits and nuts in the five-county region increased between 2002 and
2017, except for the number of farms growing apples (Table 85). The greatest increases occurred in the
number of farms growing tart cherries (increase of 22 farms), grapes (increase of 20 farms), and peaches
(increase of 14 farms). The number of farms growing apples decreased by 53 farms between 2002 and
2017. Most of this loss occurred between the 2002 and 2007.
Even though fewer farms produced apples in 2017 compared to 2002, apples remained one of the top-
three fruits the greatest number of farms in the five-county region grew in 2017: 80 farms grew apples,
114 farms grew grapes, and 94 farms grew sweet cherries.
County-level conclusions from 2002-2017 data include the following:
Asotin
• The number of farms growing grapes increased 33.3% (from three to four) and acreage
committed to growing grapes increased 333.3% to 13 total acres.
• Less than five farms grow any particular fruit/nut
Columbia
• The number of farms growing apples decreased 50%.
• In 2017, the number of farms growing pears increased 300% to four farms, with a total of 91
acres in pears.
Garfield
• In 2017, 23.7% of the farms growing peaches were located in Garfield County, with seven total
acres.
14
42
41
35
6
2

130
• The number and acreage of apricot farms grew from two acres at two farms in 2002 to five acres
at five farms in 2017.
Walla Walla
• In 2017, the greatest number of acres for specific fruits were apples (11,658 acres), grapes
(2,826 acres), sweet cherries (595 acres), and tart cherries (289 acres).
• The number of farms growing apples decreased 22.6%, but the total acreage of apples increased
37.3% to a total 11,658 acres in 2017.
• Farms growing apricots grew 900%, from 1 to 10 farms.
• The number of farms growing sweet cherries increased 50% and the number of acres used to
grow sweet cherries increased 22.7% to 595 acres in 2017.
• The number of farms growing grapes increased 3.2%, while total acreage decreased 21.9% to
2,826 acres in 2017.
• In 2017, 10 farms grew pears, but altogether they only totaled three acres.
• Between 2012 and 2017, six farms with a total of eight acres started growing nectarines.
• Data for plum and prune acreage was only made public in 2007 when there were 36 acres of
plums/prunes being grown on five farms. The data for 2012 and 2017 acreage was withheld, but
the total number of farms has increased to 12.
Umatilla
• The highest combined acreage of farms growing fruits and nuts in 2017 were for apples (2,395
acres), grapes (1,099 acres), and sweet cherries (481 acres).
• Acreage of the following fruits decreased: apples (17.2%), apricots (40.0%), plums and prunes
(61.4%), and sweet cherries (10.6%)
• Acreage of grapes increased 148.6% from 442 acres to 1099 acres, while the number of farms
increased 58.6%. The main increase was between 2002 and 2012, where acreage of grape farms
doubled (2007 data withheld).
• The number of farms growing peaches decreased 17.6% to 14 total farms in 2017, while acreage
increased 89.5% to 36 acres.
• The number of acres growing sweet cherries increased from 538 acres in 2002 to 892 acres in
2007. Between 2012 and 2017, sweet cherry acreage dropped from 877 to 481 acres.
• Plum and prune acreage dropped dramatically between 2012 and 2017 from 346 to 90 acres
total.

131
Table 85. Number of farms with specific fruit and nut production in the five-county region
Fruit/Nut Type 2002 2007 2012 2017 % change
2002 -2017
Apples 133 95 92 80 -39.8%
Apricots 17 12 15 28 64.7%
Cherries, sweet 84 82 98 94 11.9%
Cherries, tart 1 1 8 23 2200.0%
Grapes 94 84 119 114 21.3%
Kiwifruit 0 0 0 5
Nectarines 9 8 8 9 0.0%
Peaches 24 21 26 38 58.3%
Pears 23 17 25 31 34.8%
Plum/apricot hybrid 0 2 1 3
Plums & Prunes 28 35 32 29 3.6%
Almonds 0 5 0 6
Chestnuts 0 1 1 3
Hazelnuts 1 0 1 7 600.0%
Walnuts 3 8 7 7 133.3%
Vegetable production
The total number of farms with vegetable production decreased 23.0% in the five-county region
between 2002 and 2017. During the same time period, total acreage of vegetable production increased
44.3% from 40,649 acres in 2002 to 58,665 acres in 2017.
In 2017, 84.7% of farms with vegetable production were irrigated, compared to 71.1% of farms with
vegetable production that were irrigated in 2002. Though the number of operations with irrigation
decreased 8.3% from 2002-2017, the percentage of total farms with irrigation compared to the total
number of farms has increased. Additionally, the total acreage of vegetable production with irrigation
increased 108.6% between 2002 and 2017, from 22,102 acres to 46,099 acres.
In 2017, 58,665 acres in the five-county region were devoted to growing vegetables but 62,743 acres of
vegetables were harvested, indicating that some acreage was harvested more than once within the
year. The number of acres of vegetables harvested increased 54.0% between 2002 and 2017, though the
majority of that increase occurred between 2002 and 2007 when the total acreage harvested jumped
from 40,740 acres to 62,361 acres.
In 2017, potatoes with 20,652 acres harvested and green peas with 18,853 acres harvested were the
two crops with the greatest number of acres harvested (Table 86). The producers of both crops were all
located within Walla Walla and Umatilla counties.
Walla Walla and Umatilla counties were home to the majority of all vegetable production within the
five-county region (Table 87). Umatilla County had 59.9% of all farms with vegetable production (157
total) and 67.4% of the total acreage of vegetables harvested. Walla Walla County had 33.1% of all farms

132
with vegetable production and 32.6% of the total acreage of vegetables harvested (Table 88). In 2017,
Asotin County had six farms with a total of 14 acres growing vegetables and Columbia County had five
farms growing a total of four acres of vegetables.
No data vegetable production data was reported for Garfield County in the 2017 Agricultural Census;
however, in 2012 there were three farms that grew vegetables and at least one of them grew the
following crops: cantaloupe (1 farm), sweet corn (1), cucumbers (1), pumpkins (1), rhubarb (2), squash
(1), tomatoes (1), watermelons (1).
Table 86. Top-five vegetables grown in the five-county area based on the number of acres harvested, 2017
Top 5 Crop Total Acres Harvested
1 Potatoes 20,652
2 Green Peas 18,853
3 Sweet Corn 10,302
4 Dry Onions 4,043
5 Carrots 1,011

133
Table 87. Number of farms with specific vegetable production, 2017
Asotin Columbia Walla Walla Umatilla Total Number of Farms growing Vegetables 6 5 52 94
Artichokes - - 1 -
Asparagus - 1 2 7
Beans (Green & Lima) - - 2 2
Beans (Snap) 4 1 3 5
Beets 4 1 4 4
Broccoli - 1 6 1
Cabbage, Chinese - 1 1 2
Cabbage, Head - 1 4 3
Cantaloupe - 1 7 7
Carrots - 1 6 3
Cauliflower - 1 1 -
Celery - - 2 -
Chicory - - 1 -
Cucumbers - 1 5 6
Eggplant - - 4 5
Escarole & Endive - - 2 -
Garlic - 3 5 1
Herbs, fresh cut - - 9 3
Honeydew melon - - 2 -
Greens, Kale - - 4 6
Lettuce - 1 5 -
Lettuce, head - - 1 -
Lettuce, leaf - 1 5 -
Lettuce, romaine - - 3 -
Mustard greens - - 1 -
Onions, dry - 1 13 12
Onions, green - 3 3 1
Parsley - - 1 -
Peas, Chinese - 1 1 2
Peas, green - - 5 35
Peppers, bell - - 11 9
Peppers, Chile - 3 9 5
Potatoes - 1 11 19
Pumpkins 5 - 14 9
Radishes - - 2 -
Spinach - 3 6 -
Squash 1 3 10 12
Squash, summer 1 3 7 7
Squash, winter - 3 7 12
Sweet corn 5 3 10 12
Tomatoes 1 3 16 9
Turnips - - 1 -
Watercress - - - 2
Watermelon - - - 12
Vegetables, other - - 5 14

134
Table 88. Total acreage of vegetables harvested, 2017
Vegetable Crop Asotin Columbia Walla Walla Umatilla Total Acres of Vegetables Harvested 14 4 20,456 42,269
For fresh market 14 3 2,323 6,995
For processing 0 1 18,133 35,274
Artichokes - - (D) -
Asparagus - (D) (D) 144
Beans (Green & Lima) - - (D) (D)
Beans (Snap) 2 (D) (Z) 1
Beets (D) (D) (Z) (Z)
Broccoli - (D) 1 (D)
Cabbage, Chinese - (D) (D) (D)
Cabbage, Head - (D) (Z) (D)
Cantaloupe - (D) 2 26
Carrots - (D) (D) 1,011
Cauliflower - (D) (D) -
Celery - - (D) -
Chicory - - (D) -
Cucumbers - (D) 1 1
Eggplant - - 1 1
Escarole & Endive - - (D) -
Garlic - (D) 1 (D)
Herbs, fresh cut - - 1 (Z)
Honeydew melon - - (D) -
Greens, Kale - - (Z) 1
Lettuce - (D) 2 -
Lettuce, head - - (d) -
Lettuce, leaf - (D) (D) -
Lettuce, romaine - - (Z) -
Mustard greens - - (D) -
Onions, dry - (D) 1,647 2,396
Onions, green - (Z) (Z) (D)
Parsley - - (D) -
Peas, chinese - (D) (D) (D)
Peas, green - - 1,250 16,603
Peppers, bell - - 2 1
Peppers, chile - (Z) 2 (D)
Potatoes - (D) 10,223 10,429
Pumpkins 4 - 17 (D)
Radishes - - (D) -
Spinach - (Z) (D) -
Squash (D) 1 49 (D)
Squash, summer (D) (D) (D) 1
Squash, winter - (D) (D) (D)
Sweet corn 8 (Z) 6,051 4,243
Tomatoes (D) (D) 7 4
Turnips - - (D) -
Watercress - - - (D)
Watermelon - - - 857
Vegetables, other - - 8 (D)

135
Bee colonies
The number of farms with production from bee colonies in the five-county area grew 131.3% between
2002 and 2017, from 16 to 37 farms (Figure 53). Together, Umatilla, Garfield, and Columbia counties
produced 787,902 pounds of honey in 2017, which represented $1,528,000 of honey sales.
Figure 53. Number of farms with productive bee colonies
Most (92.4%) honey production was located in Umatilla County, with 8,087 bee colonies across 19
farms. The total number of colonies increased 63.8% between 2002 and 2017. In the same timeframe,
the number of farms with production increased 111.1% and the pounds of honey produced increased
761.9% from 84,452 pounds to 727,906 pounds. In 2017, each bee colony produced an average of 90.0
pounds of honey.
Sales in Umatilla County grossed $1,387,000 in 2017, averaging $1.90 per pound of honey or $171.50
per colony. The total sales grew from $959,000 in 2012 to $1,387,000 in 2017.
Honey production increased 388.3% in Columbia County between 2002 and 2017, from 10,160 pounds
of honey to 49,616 pounds. In 2017, Columbia County farms had a total of 66 colonies, averaged 752 lbs.
of honey per colony, and sold at an average rate of $2.47 per pound of honey. Sales per colony averaged
$1863.64.
Garfield County had nine farms with bee colonies, producing 10,380 lbs. of honey, grossing $18,000. In
2017, Garfield County farms with bee colonies averaged $1.73 per pound of honey.
Most of the data for Walla Walla County bee colonies and farms with bees is withheld, but we do know
that the number of operations with production increased from three farms in 2002 to nine farms in
2017.
16
24
20
37
0
5
10
15
20
25
30
35
40
45
50
2002 2007 2012 2017
Nu
mb
er o
f fa
rms
Agricultural Census Year

136
Certified-organic farms
There were 20 certified-organic farms in the five counties in 2017, down from 26 in 2012. All the
certifications were in Walla Walla and Umatilla counties. The six lost were in Umatilla County. In 2012,
Umatilla County had 13 certified-organic farms, two of which had sales less than $5,000 and 11 had sales
of $5,000 or more. In 2017, Umatilla County had seven certified-organic farms, six of which had sales of
$5,000 or more. Despite the decrease in the number of certified-organic farms, total sales of certified-
organic products increased from $11,470,000 to 13,554,000. Though the number of certified-organic
farms in Walla Walla County remained the same, there was a 149.4% increase in sales between 2012
and 2017, from $16,107,000 to $40,167,000.
Crops grown historically in the five-county region The following Tables 89-92 report Agricultural Census data for the vegetable and fruit crops that were
grown in the five-county region (Walla Walla, Columbia, Garfield, and Asotin counties in Washington
and Umatilla County in Oregon) from 1934 to 2017. This historical data provides context for current
production capacity, giving an indication of what has been grown in the past and the consistency of
production over time.

137
Table 89. Vegetables harvested for sale in the five-county region, 1934-1992
CROP 1934 1939 1945 1974 1992
# of farms Acres # of farms Acres # of farms Acres # of farms Acres # of farms Acres
Total 1,834 6,251 1,490 13,414 1,130 78,766 481 97,879 313 50,890
Artichoke
Asparagus 289 1,056 47 8,019 50 2,062
Beans, lima (green) 13 917
Beans, snap, string, or wax 130 77 57 37 76 52 21 1,216 10 495
Beets (table) 13 4 0 0
Broccoli
Cabbage, Chinese
Cabbage, Head 158 131 119 107 132 138 11 55 0 0
Cantaloupe, muskmelons, honeydews, etc. 81 106 8 57
Carrots 124 146 24 242 0 0
Cauliflower 5 2 3 20 0 0
Celery 2 0 0 0
Corn, sweet 200 197 66 134 130 263 20 638 21 1,979
Cucumbers 43 31 23 817 0 0
Eggplant
Escarole and Endives
Garlic
Greens, mustard and kale
Herbs, fresh cut
Lettuce 26 19 3 2
Onions, dry 152 345 48 628 60 3,301
Onions, green and shallots 12 54 0 0
Peas, chinese (sugar and snow)
Peas, green 93 10,492 190 74,229 131 69,689 107 41,278
Peppers, Bell
Peppers, Chile
Potatoes 43 15,248
Pumpkins
Radishes 14 5 10 10 3 2
Rhubarb
Spinach 131 339 27 295 14 207
Squash 61 117 10 48 0 0
Tomatoes 337 586 201 412 193 350 5 65 11 30
Turnips
Watercress
Watermelons 138 206 39 81 20 816 13 560
All other vegetables and melons 871 5,054 409 3,734 0 0

138
Table 90. Vegetables harvested for sale in the five-county region, 1997-2017
CROP 1997 2002 2007 2012 2017
# of farms Acres # of farms Acres # of farms Acres # of farms Acres # of farms Acres
Total 339 61,326 335 39,305 472 58,073 411 55,524 443 59,823
Artichoke 1 0
Asparagus 56 2,507 53 2,592 14 313 10 72 10 144
Beans, lima (green) 11 1,697 3 0 9 0 5 na 4 0
Beans, snap, string, or wax 12 837 2 0 19 1,751 18 4 13 3
Beets (table) 3 2 1 0 1 0 5 na 13 0
Broccoli 1 0 6 na 8 1
Cabbage, Chinese 3 0
Cabbage, Head 3 6 5 1 7 0 8 4 8 0
Cantaloupe, muskmelons, honeydews, etc. 9 126 16 73 16 82 12 37 16 28
Carrots 0 0 1 0 26 94 22 2 10 1,411
Cauliflower 0 0 0 0 0 0 1 na 2 0
Celery 0 0 0 0 0 0 2 0
Corn, sweet 32 9,612 24 6,583 42 9,875 36 13,619 30 10,302
Cucumbers 8 140 11 9 27 13 23 1 12 2
Eggplant 2 0 5 1 8 1 9 2
Escarole and Endives 5 1 2 0
Garlic 6 10 4 1 5 0 5 na 9 1
Greens, mustard and kale 5 1 5 1 2 0
Herbs, fresh cut 5 1 4 na 12 1
Lettuce 3 0 2 0 3 0 3 na 5 2
Onions, dry 52 6,086 58 2,748 37 800 37 739 26 4,043
Onions, green and shallots 0 0 1 0 1 0 4 na 7 0
Peas, Chinese (sugar and snow) 2 0 4 1010 3 na 4 0
Peas, green 104 39,133 66 26,230 53 21817 48 17,202 40 17,853
Peppers, Bell 20 3
Peppers, Chile 6 8 18 9 7 na 17 2
Potatoes 57 21405 40 22,795 30 24,761
Pumpkins 16 130 31 31 24 96 28 21
Radishes 3 0 0 0 1 0 5 6 2 0
Rhubarb 1 0 2 na 0 0
Spinach 12 306 11 115 8 0 2 na 9 0
Squash 0 0 9 5 9 0 11 na 26 50
Tomatoes 12 27 23 19 40 27 37 26 29 11
Turnips 1 0
Watercress 2 0
Watermelons 13 837 11 791 14 842 9 818 12 857
All other vegetables and melons 0 0 8 0 8 0 11 101 19 325

139
Table 91. Fruit harvested for sale in the five-county region, 1934-1992
CROP 1934 1939 1945 1974 1992
SMALL FRUITS HARVESTED # of farms Acres # of farms Acres # of farms Acres # of farms Acres # of farms Acres
Total 130 99 802 495 457 190 0 0 24 26
Blackberries and dewberries 103 36 74 19
Boysenberries 29 9 55 16
Blueberries 4
Currants 1
Gooseberries 17 1
Loganberries 10 3
Raspberries (tame) 313 178 241 67 8 2
Strawberries 130 99 289 252 87 88 12 24
Youngberries 40 16
NON-CITRUS ORCHARDS # of farms # of farms Acres # of farms Acres # of farms Acres # of farms Acres
Total farms with orchard fruit (acres) 1,517 6,472 1,193 6,889 230 5,288 410 8,995
# of farms Bushels # of farms Bushels # of farms Bushels # of farms Bushels # of farms Acres
Apples 1,722 952,101 909 349,546 1,204 376,428 163 1,813 199 8,100
Peaches 1,035 45,412 857 57,499 1,134 66,101 10 17 29 16
Pears, total 924 17,250 588 31,518 748 16,288 11 15 28 15
# of farms Pounds # of farms Pounds # of farms Pounds # of farms Pounds # of farms Acres
Plouts
Grapes 671 632,074 340 409,795 503 636,820 7 3,186,000 31 40
Cherries, Sweet
Cherries, Tart 1,531 69,816 940 2,615,532 1,185 3,020,379 65 393 85 719
Apricots 588 529,575 946 938,092 8 7 28 64
Nut trees 404 32,267 205 4,569 6 0
Nectarines 4 41

140
Table 92. Fruit harvested for sale in the five-county region, 1997-2017
CROP 1997 2002 2007 2012 2017
SMALL FRUITS HARVESTED # of farms Acres # of farms Acres # of farms Acres # of farms Acres # of farms Acres
Total 16 16 31 100 15 0 90 136 101 263
Blackberries and dewberries 3 2 3 21 9 14 2
Boysenberries 1 1 2
Blueberries 3 5 22 2 20 98 42 254
Currants 1
Gooseberries
Loganberries
Raspberries (tame) 8 7 11 5 6 35 27 37 7
Strawberries 5 9 11 71 4 13 2 5
Youngberries
NON-CITRUS ORCHARDS # of farms Acres # of farms Acres # of farms Acres # of farms Acres # of farms Acres
Total farms with orchard fruit (acres) 325 10,036 388 16,614 336 16,171 404 17,154 437 19,559
# of farms Acres # of farms Acres # of farms Acres # of farms Acres # of farms Acres
Apples 165 9,173 133 11,443 95 11,290 92 10,690 80 14,056
Peaches 18 25 24 38 22 19 26 47 38 54
Pears, total 18 10 23 21 17 0 31 167 31 94
# of farms Acres # of farms Acres # of farms Acres # of farms Acres # of farms Acres
Plouts 3 0
Grapes 33 163 94 4,064 84 3,511 116 4,662 114 3,938
Cherries, Sweet 89 1,076
Cherries, Tart 73 646 84 1,034 83 1,327 106 1,558 28 293
Apricots 15 19 17 14 13 8 15 6 28 14
Nut trees 0 0 4 0 13 13 10 18 18 28
Nectarines 3 0 9 0 9 3 8 6 8 6

141
Appendix C. Population characteristics
Demographic overview In 2018, an estimated 167,354 people lived in the five-county project area (Table 93).xliv More than 80%
of the total population in the project area resides in either Umatilla County or Walla Walla County
(Figure 54).
Table 9330. Population estimates and population change by county, 2010- 2018
County 2010 2018 #
change %
change
5-county Total 163,095 167,354 4,259 2.6%
Asotin 21,725 22,610 885 4.1%
Columbia 4,094 4,059 -35 -0.9%
Garfield 2,261 2,247 -14 -0.6%
Walla Walla 58,920 60,922 2,002 3.4%
Umatilla 76,095 77,516 1,421 1.9%
The populations of all 5 counties stayed relatively stable between 2010 and 2018. In the five-county
area, the population increased 4,259 individuals in that time, showing an overall 2.6% growth (Figure
55).xlv Growth in the project region is less than growth in both Washington and Oregon states, which
grew 11.8% and 9.2% in the same time period.
Walla Walla county experienced the most growth in population, increasing an estimated 2,002 people in
that time period, to 60,922.xlvi Asotin county saw the largest percent growth out of all 5 counties,
increasing 4.1% with 885 individuals. Both Columbia and Garfield county saw a decrease in population,
but numbers are small at 35 individuals and 14 individuals respectively.
Figure 144. Population of individual counties as percent of total, 2018
22,610
4,059
2,247
60,922 77,516
0% 10% 20% 30% 40% 50% 60% 70% 80% 90% 100%
Asotin Columbia Garfield Walla Walla Umatilla

142
Figure 55. Population of individual counties as percent of total, 2018
Age Ages 18-24 have the smallest percent and number of the
population (Figure 56). While 25.2% of the population of Umatilla
is under 18, in the other counties it is around 20%.xlvii Walla Walla
has the highest percentage of people ages 18-24 (12.9%) perhaps
because there are 3 colleges in the town. The majority of the
population in all counties is 25-64. A significant percent of people
over 65 years old live in Asotin (23.3%), Columbia (27.9%),
Garfield (25.4%) counties (Table 94).
28
,42
2
29
,54
9
30
,53
2
31
,52
1
32
,40
0
33
,01
9
33
,23
9
33
,73
2
13
1,5
27
13
1,7
07
13
1,8
62
13
1,9
55
13
1,9
47
13
1,7
04
13
1,4
67
13
1,3
50
0%
10%
20%
30%
40%
50%
60%
70%
80%
90%
100%
160,000
161,000
162,000
163,000
164,000
165,000
166,000
167,000
168,000
2010 2011 2012 2013 2014 2015 2016 2017 2018
Po
pu
lati
on
Est
imat
e
Year
Hispanic Non-Hispanic Total Population
9,956
19,378
8,827
16,619
41,866
40,616
30,092
< 5
5 to 13
14 to 17
18 to 24
25 to 44
45 to 64
65+
Age
(ye
ars)
Figure 156. Age distribution in 5-
county region, 2018

143
Table 94. Age Distribution of population, by county, 2018xlviii
Age Asotin Columbia Garfield Walla Walla Umatilla
# % # % # % # % # %
Total Population 22,610 4,059 2,247 60,922 77,516
< 18 years 4,588 20.3% 765 18.8% 478 21.3% 12,779 21.0% 19,551 25.2%
< 5 1,165 5.2% 205 5.1% 160 7.1% 3,336 5.5% 5,090 6.6%
5 to 13 2,318 10.3% 382 9.4% 216 9.6% 6,434 10.6% 10,028 12.9%
14 to 17 1,105 4.9% 178 4.4% 102 4.5% 3,009 4.9% 4,433 5.7%
18 to 64 years 12,750 56.4% 2,163 53.3% 1,198 53.3% 37,145 61.0% 45,845 59.1%
18 to 24 1,447 6.4% 241 5.9% 136 6.1% 7,871 12.9% 6,924 8.9%
25 to 44 5,156 22.8% 805 19.8% 456 20.3% 14,859 24.4% 20,590 26.6%
45 to 64 6,147 27.2% 1,117 27.5% 606 27.0% 14,415 23.7% 18,331 23.6%
65+ years 5,272 23.3% 1,131 27.9% 571 25.4% 10,998 18.1% 12,120 15.6%
85+ 653 2.9% 133 3.3% 85 3.8% 1,654 2.7% 1,443 1.9%
Race and ethnicity The majority of the population in every county in the project area is white (Figure 57). Of the non-white
population, the majority identifies as “Some other race” or “Two or more races.”xlix
Figure 57. Race of Population, 5-county region, 2017

144
In the 5-county project area, 20.4% of the population is Hispanic or
Latino (Figure 58).l Umatilla and Walla Walla counties have the
largest Hispanic or Latino populations, at 26.0% and 21.1% of their
total populations respectively. Garfield and Asotin counties have the
least percentage of population that is Hispanic or Latino, at 2.4%
and 3.6% respectively. The population of Columbia County is 7.4%
Hispanic or Latino.
Hispanic and Latino population growth accounts for most of the
total population growth in most of the counties. In the 5-county
region, the Hispanic population grew 18.7% between 2010 and
2017, whereas the Non-Hispanic population decreased 0.1%.li
Hispanic population growth between 2010 and 2017 was greater
than 18% in every county except Garfield county, whereas the non-
Hispanic population had a maximum growth of 3.4% in Asotin
county and decreased in both Columbia county and Umatilla county.
Between 2010 and 2017 the following occurred in each county:
• Asotin County experienced a 28.7% increase (181) in the Hispanic population and a 3.4%
increase (715) in the Non-Hispanic population.
• Columbia County experienced a 76.8% increase in the Hispanic population (up 129 individuals)
and a decrease of 2.3% or 87 Non-Hispanic individuals
• Garfield County experienced a decrease in the Hispanic population of 55.8% (67 people), while
the non-Hispanic population increase 2.5% (53 people)
• Walla Walla County experienced an increase in the Hispanic population of 19.8% (1,773 people)
and an increase of 1.1% non-Hispanics (504)
• Umatilla County experienced Hispanic population growth of 19.8% (3,294) while the non-
Hispanic population decreased 2.3% (1,362)
Languages English was the primary language spoken at home in all five counties in 2017 (Table 95). Asotin County
had the highest percentage of the population speaking English at home, at 97.1%. Umatilla and Walla
Walla counties had the lowest percentages of the population speaking primarily English, at 77.3% and
81.5% respectively.lii The second most spoken language was Spanish, which was the language spoken in
21.5% of homes in Umatilla County.
Table 95. Languages spoken at home by percent of population, 2017
Language Asotin Columbia Garfield Walla Walla
Umatilla
English 97.1% 91.9% 95.5% 81.5% 77.3%
Spanish 0.9% 4.2% 0.6% 15.8% 21.5%
Other Indo-European 1.4% 3.1% 0.5% 1.3% 0.4%
Asian and Pacific Island Languages
0.5% 0.8% 2.9% 1.2% 0.5%
Other 0.0% 0.0% 0.5% 0.3% 0.3%
Hispanic or Latino,
20.4%
Non-Hispan
ic or Latino, 79.6%
Figure 58. Percent of population
Hispanic or Latino in 5-county
area, 2017

145
Poverty and food security Food security is a measure of financial ability for households to live a healthy lifestyle. A food insecure
household is one that is not meeting basic dietary needs and might be running out of food, eating low
quality food, or skipping meals.liii Food insecurity is most commonly related to poverty, unemployment,
and rates of homeownership.liv
In the 5-county project region, an estimated 19,070 individuals were food insecure in 2017, representing
about 11.6% of the total population (Table 96).lv Columbia County had the highest rate of individuals
who were food insecure, at 12.8% of the total population. Walla Walla county had the lowest rate of
food insecurity, 11.1%, but the greatest number of individuals among the Washington counties. Umatilla
county had the greatest number of individuals at 8,820, because of its higher total population.
Table 96. Food insecurity characteristics, 2018
Characteristics Asotin Columbia Garfield Walla Walla
Umatilla 5-county
total
Population 22,259 3,999 2,226 59,862 76,736 165,082 Food Insecurity rate 12.5% 12.9% 12.8% 11.1% 11.5% 11.6% Estimated # food insecure individuals (rounded)
2,790 520 290 6,640 8,830 19,070
% below 185% poverty* 82% 84% 80% 78% 85% -
Table 9731. Population characteristics by state
Characteristics Washington Oregon
Total population (2017) 7,405,743 4,142,776
Children (under 18) 1,645,816 873,619
Median Household Income $67,106 $57,532
Rank among states (best to worst) 11 22
Total people living in poverty 805,691 536,146
Poverty rate 11.30% 13.30% Rank among states (worst to best) 39 25 Children living in Poverty 219,668 144,361 Child poverty rate 13.70% 17.00%
Rank among states (worst to best) 41 30
Total people living below 185% of Federal Poverty Level 1,732,705 1,160,990
Of the individuals who experienced food insecurity in 2016, between 78% and 85% of them were below
185% poverty, which means that they qualify for federal assistance such as SNAP benefits, WIC, and Free
and Reduced-price school meals.lvi
In Washington, 17.5% of children are food insecure and of those children, 61% are eligible for federal
assistance such as the Special Supplemental Nutrition Program for Women, Infants, and Children (WIC)
or Child Nutrition Programs.lvii In Oregon, 20.0% of children are food insecure and 63% are likely eligible
for federal assistance. A high percentage of people and children in both states live in poverty and below
the 185% of Federal Poverty level (Table 98).

146
In the entire 5-county project area there were 26,788 students
enrolled in the Free and Reduced Lunch Program.lviii
In Washington and Oregon together, 246,987 individuals
participated in the WIC program on average per month.lix In both
states, about 56% of those participants were children and 20% were
children.
A combined total of 131,991 children participated in the Child and
Adult Care Food Program on average per day in Washington and
Oregon.lx
In Washington and Oregon, a combined 105,034 individuals
participated in the Temporary Assistance to Needy Families (TANF) program, 72.4% of which were
children.lxi The maximum TANF benefit for a single-parent household with three kids was $521 in
Washington and $506 in Oregon.
Appendix D: Likelihood of participating explanations from supplier
survey respondents
Likelihood of participating in a food hub Forty-two supplier respondents provided explanations for their likelihood (or unlikelihood) of using a
new food hub if they had access to one in the Walla Walla Valley. Supplier survey respondents’ who said
they were “very likely” to use one provided the following explanations:
• “A location with easy access for both farmers and consumers would be very helpful.”
• “Access to storage and retail and marketing services would help sell and move our farm
products.”
• “Close. Customer base. Area residents are open to change.”
• “For all the reasons we chose in earlier questions: a retail store, value added processing kitchen,
storage for crops (cool, cold), to sell products to other value-added producers (pickling
cucumbers, kraut cabbage, etc.), for distribution to larger urban markets (Seattle, Portland,
Boise), under a WW brand.”
• “Gateway to synergistic market access to institutional sales.”
• “I am interested in the distribution and marketing potential that a food hub opens.”
• “I live in Walla Walla and commute to Dayton at least 5 times/week to work at Blue Mountain
Station. That said, I just signed a 2-year lease, so.............”
• “If the distance from the Milton Freewater/College Place/Walla Walla area was close enough I
could justify renting processing space.”
• “I've outgrown my current space. Having access to larger equipment and storage of finished
product is my current bottleneck to expanding my business.”
• “Need a place closer to make jams.”
Table 9832. Percent of
households participating in
SNAP benefits, 2012-2016
County % with SNAP
Asotin 18.1%
Columbia 17.7%
Garfield 9.9%
Walla Walla 14.9%
Umatilla 23.9%

147
• “There is definitely a lack of large-scale freezer/refrigerator space for 1,000-liter IBCs and such
for larger scale VAPs such as juices and frozen fruit. Freezing is one of the best ways to save
excess fruit that preserves the nutritional integrity and is a good form of season extension.”
• “To support local efforts, have better access to produce and a variety of produce, and hopefully
reduce my operating costs and expand my access to markets.”
• “To support other local businesses.”
• “Use it a lot as long as quality of produce exceeds or meets conventional produce.”
• “Very interested in freezer storage.”
• “We desperately need bottling and labeling services for high viscosity foods and sauces. The
wine industry reigns, and it is extremely hard to scale fermented and thermally processed
foods.”
• “We're excited about building local inertia for local food year-round -- in a retail front, in
institutions, in shared equipment & resources.”
• “Would love a local hub to store and retail goods.”
• “Would use for distribution, value-added processing, and marketing.”
Supplier respondents who indicated they were “somewhat likely” to use a new food hub if they had
access to one in the Walla Walla Valley provided the following explanations:
• “30 min. closer commute, and better places to eat lunch :). Also, hopefully better freight service
for pallet freight.”
• “Completely depends on where it’s at.”
• “Depending upon cost to use and the distance from my home.”
• “I am interested in expanding product sales and fulfilling customer needs.”
• “I am a home gardener with surplus so not sure if a hub would work for me. A farmers market in
Dayton would be very useful.”
• “I am retired.”
• “I feel the organic, non-GMO farmers need a food hub in the Walla Walla Valley.”
• “I LIKE THE IDEA BUT WE ARE A LITTLE FURTHER AWAY THAN MAKES THIS PRACITICLE [sic].”
• “I live in between Walla Walla and Dayton, so either the new food hub or the Blue Mountain
Station in Dayton would work for me depending on availability of each.”
• “I would purchase from the Food Hub but nothing else.”
• “If it is profitable enough and we have enough labor to expand our operations, we might be
interested in having more places to market our produce.”
• “If located in Dayton / Waitsburg very likely, anywhere else very unlikely.”
• “It would depend on if I required the space at a given time during the season.”
• “Location.”
• “Looking for different ways to market garbanzo beans locally.”
• “Personell [sic] to man and requirements.”
• “There is opportunity in our business using a food hub. I am not sure I have the time to take our
business to that next step.”
• “We are located south of Pendleton, Oregon.”
• “We would like to use a hub in Walla Walla for distribution.”
148
The one respondent who said they were “somewhat unlikely” to use a new food hub if they had access
to one in the Walla Walla Valley said, “It would depend on the location, hours, cost, etc.” The three
respondents who said they were “very unlikely” to use it said
• “I have my own place.”
• “I would have to research it.”
• “Our operation has no need for a food hub.”
Likelihood of participating in a commercial kitchen Thirty-seven supplier respondents provided explanations for their likelihood (or unlikelihood) of using a
new commercial kitchen if they had access to one in the Walla Walla Valley. Those who indicated they
were “very likely” to use a new commercial kitchen provided the following explanations:
• “Blue Mountain Station and Pasco Specialty Kitchen are both too far away for my needs.”
• “I'm only in Dayton because there was no commercial kitchen space in Walla Walla.”
• “Lack of a commercial kitchen in WW is holding us back from exploring the possibility of starting
our business of jarring heirloom tomatoes.”
• “Not heavily, but we might increase our business to include more value-added products.”
• “Would use it to can tomatoes.”
Those who indicated they were “somewhat likely” to use a new commercial kitchen provided the
following explanations:
• “Depending upon distance from my home and cost to use.”
• “Distance from the center of population and rental rates would be the biggest factor. Would
need to compare to building my own facilities.”
• “Interested to market garbanzo beans for incorporation into new recipes.”
• “It would depend on the location. Blue Mountain Station is already accessible easily, not a lot of
equipment for food processing though.”
• “Jams.”
• “Not in my core business plan, but plans can change.”
• “Possible use for value-added products.”
• “Sweet onion jam is more regulated than regular fruit jam so not sure just a commercial kitchen
is enough for us.”
• “Value-added products.”
• “We are looking for unique versatile ways to utilize our land/products.”
• “We are still working toward production levels and time availability to warrant use of an offsite
facility.”
• “We currently don't process food, but with that option available would consider it as an option.”
• “We currently have access to a low-cost kitchen.”
• “Would be most interested if contractor made value-added products for us that we marketed
ourselves.”
Those who indicated they were “somewhat unlikely” to use a new commercial kitchen provided the
following explanations:

149
• “A kitchen is not on my 'needed' list.”
• “Distance from where we are located.”
• “Have WSDA certified plant already.”
• “I only produce wheat and I am not sure that I would need kitchen space, but it would be helpful
to other people.”
• “Not my thing, but you never know...”
• “Only use commercial kitchen for using a dishwasher.”
• “Probably not necessary for our products.”
Those who indicated they were “very unlikely” to use a new commercial kitchen provided the following
explanations:
• “Could use it to make jam.”
• “Do not process foods.”
• “I have canning and other food preserving methods available at my home.”
• “I have my own bakery to use.”
• “I have my own place.”
• “I own a commercial kitchen.”
• “No need.”
• “Retired, move around some.”
• “There is only so much we can focus on doing and we like growing the produce more than
processing it.”
• “We have our own facility.”

150
Appendix E: Some funding programs relevant to food hubs
Funder Program Amount Summary Due Date
M.J. Murdock Charitable Trust
Strategic Projects Grants
$50,000-Big Help fund both new nonprofit programs and the expansion of existing programs, and may be used to cover start-up costs and/or related staff member additions.
LOI Continuous
Small Business Administration
(SBA)
Program for Investment in
Microentrepreneurs (PRIME)
$500,000; match
required
Funding to provide (i) training and technical assistance to disadvantaged entrepreneurs; (ii) training and capacity building to microenterprise development organizations (MDOs) and programs; (iii) aiding in researching and developing best practices for microenterprise and technical assistance programs for disadvantaged entrepreneurs; and (iv) for other activities as the SBA Administrator determines.
Continuous
Tilth Alliance Washington State
Organic & Sustainable Farming Fund
$2,000 - $20,000
Supports projects that will improve the economic viability, social impacts, or environmental sustainability of their farm businesses. The goal of this grant program is to enhance the operations of farmers practicing responsible and progressive methods such as sustainable soil management, crop diversification, habitat preservation, climate change mitigation and environmentally safe waste management practices.
1/18/2020
US Department of Commerce Economic
Development Administration
Economic Development
Assistance Programs $3,000,000
Supports construction, non-construction, technical assistance, and revolving loan fund projects under EDA’s Public Works and Economic Adjustment Assistance programs. Grants and cooperative agreements made under these programs are designed to leverage existing regional assets and support the implementation of economic development strategies that advance economic prosperity in distressed communities.
Continuous
USDA Community Facilities Technical Assistance and Training Grant
$150,000 Funding to provide Technical Assistance and/or training with respect to essential community facilities programs. Funds may be used for assisting communities in identifying and planning for community facility needs
Open
USDA Agricultural Marketing Service
Federal-State Marketing
Improvement Program (FSMIP)
100% match required
To strengthen and explore new market opportunities for US food and agricultural products. Requires 100% match. Only state agencies, agricultural experiment stations, and the state departments of agriculture can apply and receive funding.
4/5/2019*
Local Food Promotion Program (LFPP)
$500,000 Focus on planning and implementation of local and regional food intermediary supply chain development. Requires 25% match.
5/7/2019*
Organic Cost Share Programs
Up to 75% of certification costs, not to exceed $750
Federal reimbursement to assist with the cost of receiving and maintaining organic certification.
Accepted year round

151
Funder Program Amount Summary Due Date
USDA Agricultural Marketing Service
Specialty Crop Block Grant Multi-State Program (SCBGP)
$250,000 - $1M
Funds collaborative, multi-state projects that address food safety; plant pests and disease; research; crop-specific projects addressing common issues; and marketing and promotion.
9/1/2019*
Specialty Crop Block Grant Program
(SCBGP)
$250,000 - $1M
Enhances competitiveness of US grown specialty crops, including fruits, vegetables, dried fruit, tree nuts, horticulture, and nursery crops, including floriculture.
5/24/2019*
Farmers Market Promotion Program
(FMPP)
$500,000; $15,000-$500,000
Funds direct farmer-to-consumer marketing activities through capacity building and community development, training, and technical assistance projects
6/18/2019*
USDA NIFA
AFRI: Agricultural Economics & Rural
Communities
Up to $1,000,000
Supports rigorous social science projects, including behavioral and experimental economics research and analysis, that informs decision making and policy design to enhance the sustainability of agricultural production systems, both conventional and organic, and related activities in rural areas, protect the environment, enhance quality of life, and alleviate poverty. Topics include, but are not limited to, the interactions between agriculture, environment and communities in rural areas; demographic changes and impacts; consumer preferences or behavior; decision-making under uncertainty; crop insurance; availability of credit and financing; market structure and performance; and policy and design impact.
11/18/2020
Beginning Farmer & Rancher Development
$50,000-$200,000
Supports organizations for education, mentoring, and technical assistance initiatives for beginning farmers or ranchers.
3/19/2020
Community Food Projects
400,000 over four years
To increase food security in communities by bringing the whole food system together to assess strengths, establish linkages, and create systems that improve the self-reliance of community members over their food needs.
6/3/2019*
Small Business Innovation Research
Up to $100,000
Funds qualified small businesses to support high quality research related to important scientific problems and opportunities in agriculture that could lead to significant public benefits. This is a two-phase program and initial funding can be built upon.
Annually in October
Western SARE (Sustainable Agriculture Research & Education)
Farmer/Rancher Grants
$20,000 for one producer, $25,000 for 3
or more producers, up
to 3 years
Funds producers to conduct on-site experiments that can improve their operations and the environment and can be shared with other producers and also projects for marketing and organic production.
Fall 2020
Professional + Producer Grants
$50,000 for up to 3 years
Similar in concept to the Farmer/Rancher Grants except an agricultural professional coordinates the project and a farmer or rancher serves as the project advisor.
Fall 2020

152
Funder Program Amount Summary Due Date
Western SARE (Sustainable Agriculture Research & Education)
Professional Development
Program Grants
Up to $75,000 for up to 3
years
Funds training for agricultural professionals to help them spread knowledge about sustainable agriculture concepts and practices.
Fall 2020
Research and Education Grants
Up to $350,000 for up to 3 years
Funds interdisciplinary approaches to address issues related to sustaining agriculture. LOI due in
June in 2019
USDA Rural Development
Business and Industry Guaranteed Loan
Program $5M - $25M Provides loan guarantees for rural businesses
Accepted year round
Community Facilities Past awards
range $15,000-$56,000
Funding to develop essential community facilities in rural areas. An essential community facility is one that provides an essential service to the local community in a primarily rural area, and does not include private, commercial or business undertakings.
Renewable Energy Systems & Energy
Efficiency Improvement Loans &
Grants
Grants: $1,500 to $500,000;
Loans: $5,000 to $25 million
Provides guaranteed loan financing and grant funding to agricultural producers and rural small businesses for renewable energy systems or to make energy efficiency improvements.
Varies by type of grant
or loan
Rural Business Development Grants
$500,000 Supports targeted technical assistance, training, and other activities leading to the development or expansion of small and emerging private businesses in rural areas which will employ 50 or fewer new employees and have less than $1 million in gross revenue.
Continuous
Rural Cooperative Development Grants
$200,000 Helps improve the economic condition of rural areas by helping individuals and businesses start, expand, or improve rural cooperatives and other mutually owned businesses through Cooperative Development Centers.
Value-Added Producer Grants
Planning grants up to $75,000;
Working capital grants up to
$250,000; 50% match required
Helps producers enter into value-added activities related to the processing and/or marketing of new products. Goals are to generate new products, create, and expand marketing opportunities, and increase producer income. Priority if proposing a mid-tier value chain.
1/31/19 (based upon
last year's due date)
Rural Community Development
Initiative (RCDI) $250,000
Funds qualified intermediary organizations to provide financial and technical assistance to recipients to develop their capacity and ability to undertake projects related to housing, community facilities, or community and economic development.
6/25/2019 (Based upon
last year's date)

153
Funder Program Amount Summary Due Date
Washington State Department of
Agriculture
Specialty Crop Block Grant Program (USDA
AMS) Varies
Funding focus areas include packers and processors; improving efficiency and reducing costs of distribution systems; developing local and regional food systems; and improving food access in underserved communities. LINC received a $101,186 in 2019 to increase specialty crop sales to their largest customers.
11/4/19 LOI;
2/20/2020 proposals
Washington State Department of
Commerce
Community Economic Revitalization Board
Big
Funds local governments and federally-recognized tribes for public infrastructure which supports private business growth and expansion. Eligible projects include domestic and industrial water, storm water, wastewater, public buildings, telecommunications, and port facilities.
Every other month
through March 2021
* Based on last year's due date
Note: these entries include portions and fragments of text from funding program websites and program documents that have been edited, summarized, and interpreted for consistency and readability and adapted for the purposes of this plan. This funding spreadsheet is meant for use by the Walla Walla Valley Food System Coalition members for planning purposes, not for publication more generally.

154
Endnotes
i USDA Agricultural Census ii USDA Agricultural Census iii The median is measure of the center of a data distribution that is not affected by outliers. iv The mode refers to the most frequently occurring number of acres. vfUSDA Agricultural Census vi USDA Agricultural Census vii USDA Agricultural Census viii USDA Agricultural Census ix USDA Agricultural Census x There were no repeating numbers in this data. xi Farms indicating production as opposed to farms with inventory. xii Feeding America, Map the Meal Gap 2018: A Report on County and Congressional District Food Insecurity and County Food Cost in the United States in 2016 (2018) retrieved from https://www.feedingamerica.org/sites/default/files/research/map-the-meal-gap/2016/2016-map-the-meal-gap-full.pdf xiii Bureau of Economic Analysis (BEA). U.S. Department of Commerce. Bea.gov Home Page. Web. 10 Feb 2020. http://www.bea.gov/regional/. xiv Emsi. Economic Modeling Specialists, International. Web. 10 Feb 2020. https://www.economicmodeling.com/. xv Bureau of Labor Statistics (BLS). U.S. Department of Labor. Web. 10 Feb. 2020. http://www.bls.gov/. xvi Suljic, Ajsa, Employment Security Department, Washington State, https://esd.wa.gov/labormarketinfo/county-profiles/walla-walla. xvii Emsi. Economic Modeling Specialists, International. Web. 10 Feb 2020. https://www.economicmodeling.com/. xviii QCEW Explanation of Location Quotient: “If an LQ is equal to 1, then the industry has the same share of its area employment as it does in the nation. An LQ greater than 1 indicates an industry with a greater share of the local area employment than is the case nationwide. For example, Las Vegas will have an LQ greater than 1 in the Leisure and Hospitality industry because this industry makes up a larger share of the Las Vegas employment total than it does for the nation as a whole.” https://www.bls.gov/cew/about-data/location-quotients-explained.htm. xix Emsi labor force and unemployment rates are estimates for the year 2019 whereas the individual unemployment rates are for December 2019. xx Washington State University Extension, Thurston County. September 2018. Value-added Processing Facility Tour of Skagit and Whatcom Counties (official field tour notes). xxi 2018 Puget Sound Food Hub Cooperative Membership Application. xxii Puget Sound Food Hub Farmers’ Cooperative: A Guide for Farmers and Ranchers xxiii “LINC Foods Policies. Accessed February 3, 2019 from http://www.lincfoods.com/policies xxiv “LINC Foods Membership Policy.” Accessed February 3, 2019 from http://www.lincfoods.com/linc-farmers/ xxv These tables were developed as part of an iterative planning process. The initial tables were developed based on information from interviews, the National Food Hub Survey (2017 version), and team experience. The steering committee provided input at several times during the process. The tables were then used at meetings to discuss options for the food hub. xxvi Cummings Insights 2019 https://ccorpinsights.com/costs-per-square-foot/. Given that Walla Walla is a relatively rural region, the lower end estimates were used for warehousing and light manufacturing. There is wide variance in material and labor costs, which are relatively inexpensive in Walla Wall as compared to larger West Coast cities. xxvii Commercial Real Estate Listing, LoopNet Walla Walla, https://www.loopnet.com/search/commercial-real-estate/walla-walla-wa/for-sale/?sk=d22047d4e07d4cfe5e7af65de66e4274&e=u. xxviii Marotta, David, “Longest Economic Expansion In United States History,“ Forbes Magazine, https://www.forbes.com/sites/davidmarotta/2020/01/21/longest-economic-expansion-in-united-states-history/#7e094f6662a2. 1/21/20. xxix See: https://www.commercialtrucktrader.com/listing/2006-MITSUBISHI+FUSO-FE145-5005058054.

155
xxx “The Truckers Report,” https://www.thetruckersreport.com/infographics/cost-of-trucking/. xxxi Note there can be considerable volatility in fuel prices. This price was obtained from the U.S. Energy Information Administration, https://www.eia.gov/dnav/pet/pet_pri_gnd_dcus_nus_w.htm. xxxii See: https://www.nonforceddispatch.com/truck-drivers-paid-mile/. xxxiii Galinato, Suzette P., Carol A. Miles and Srinivasa S., “2011 Cost Estimates of Producing Fresh Market Field-Grown Tomatoes in Western Washington,” http://ses.wsu.edu/enterprise_budgets/. xxxiv Thornton, Mike, Neil R. Rimbey, and Kate Painter. Southwestern Idaho and Eastern Oregon: Treasure Valley Onions- 2013 Costs and Returns Estimate,” https://www.uidaho.edu/cals/idaho-agbiz/crop-budgets. xxxv Hannah Dolle, Arkansas Glass Container Corporation, 516 W. Johnson Avenue,Jonesboro, Arkansas 72401. xxxvi Returns/spoilage is normally netted out of total revenues but was included in variable costs to simplify the presentation. xxxvii https://www.merchantmaverick.com/sba-loan-rates/. xxxviii In an earlier draft and public presentation of this analysis. xxxix Returns/spoilage is normally netted out of total revenues but was included in variable costs to simplify the presentation. xl Returns/spoilage is normally netted out of total revenues but was included in variable costs to simplify the presentation. xli Cost estimates were obtained from steering committee members and from data collected regionally from the interview process and secondary data sources. xlii Decker, Fred, “The Estimated Cost for a Commercial Kitchen in a Small Business,” https://smallbusiness.chron.com/estimated-cost-commercial-kitchen-small-business-74630.html. Accessed 2-1-20. xliii United States Department of Agriculture (USDA), 2012 Census Volume 1, Chapter 2: County Level, Table 1 retrieved from https://www.nass.usda.gov/Publications/AgCensus/2012/Full_Report/Volume_1,_Chapter_2_County_Level/Washington (USDA, 2012, Census of Agriculture, Table 1) xliv U.S. Census Bureau, Annual Estimates of the Resident Population: April 1, 2010 to July 1, 2018, data accessed via American Factfinder (factfinder.census.gov), see Table PEPANNRES xlv U.S. Census Bureau, Annual Estimates of the Resident Population: April 1, 2010 to July 1, 2018, data accessed via American Factfinder (factfinder.census.gov), see Table PEPAGESEX xlvi U.S. Census Bureau, Annual Estimates of the Resident Population: April 1, 2010 to July 1, 2018, data accessed via American Factfinder (factfinder.census.gov), see Table PEPAGESEX xlvii U.S. Census Bureau, Annual Estimates of the Resident Population: April 1, 2010 to July 1, 2018, data accessed via American Factfinder (factfinder.census.gov), see Table PEPAGESEX xlviii U.S. Census Bureau, Annual Estimates of the Resident Population: April 1, 2010 to July 1, 2018, data accessed via American Factfinder (factfinder.census.gov), see Table PEPAGESEX xlix U.S. Census Bureau, 2013-2017 American Community Survey 5-Year Estimates, data accessed via American Factfinder (factfinder.census.gov); see Table B03002 l U.S. Census Bureau, 2013-2017 American Community Survey 5-Year Estimates, data accessed via American Factfinder (factfinder.census.gov); see Table B03002 li U.S. Census Bureau, 2010-2015 and 2013-2017 American Community Survey 5-Year Estimates, data accessed via American Factfinder (factfinder.census.gov); see Table DP05 lii U.S. Census Bureau, 2013-2017 American Community Survey 5-Year Estimates, data accessed via American Factfinder (factfinder.census.gov); see Table S1601 liii Food Research & Action Center, Sources for FRAC State of the States Profiles, (2018). liv Map the Meal Gap, Economic Drivers of Food Insecurity (2018) retrieved from https://public.tableau.com/profile/feeding.america.research#!/vizhome/MaptheMealGap-TheEconomicDriversofFoodInsecurity/CorrelationofFactors lv Feeding America, Map the Meal Gap 2019: Overall Food Insecurity in Washington by County in 2017 and Map the Meal Gap 2019: Overall Food Insecurity in Oregon by County in 2017 (2018). lvi Feeding America, Map the Meal Gap 2018: Overall Food Insecurity in Washington by County in 2016 and Map the Meal Gap 2018: Overall Food Insecurity in Oregon by County in 2016 (2018).
156
lvii Feeding America, Map the Meal Gap, Child Food Insecurity, (2018) retrieved from https://public.tableau.com/profile/feeding.america.research#!/vizhome/MaptheMealGap-ChildFoodInsecurity/ChildFoodInsecurity lviii Washington Superintendent of Public Instruction, Child Nutrition Program Reports, Free and Reduced-Price Meals Eligibility (October county) (2018) retrieved from https://www.k12.wa.us/data-reporting/reporting/child-nutrition-program-reports and Oregon Department of Education, Student’s Eligible for Free/Reduced Lunch (2018-2019) retrieved from https://www.ode.state.or.us/sfda/reports/r0061Select2.asp lix Food Research & Action Center, Profile of Hunger, Poverty, and Federal Nutrition Programs (2018). lx Food Research & Action Center, Profile of Hunger, Poverty, and Federal Nutrition Programs (2018). lxi Food Research & Action Center, Profile of Hunger, Poverty, and Federal Nutrition Programs (2018).