port logistics and competitiveness in latin america and ... 2014... · competitiveness in latin...
TRANSCRIPT
Tomás Serebrisky Principal Economic Advisor. Infrastructure Department. Inter-American Development Bank
June 18th, 2014
InterAmerican Committee on Ports
9th Ordinary Meeting
Port Logistics and
Competitiveness in Latin
America and the Caribbean
Port Efficiency and Competitiveness in Latin America and the Caribbean Tomás Serebrisky
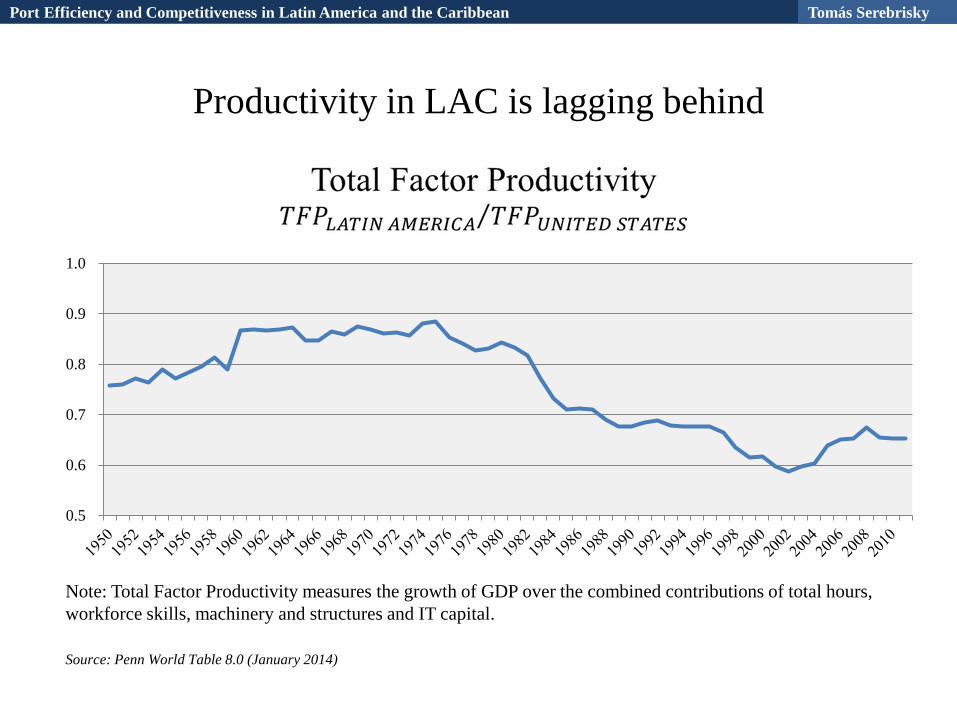
Productivity in LAC is lagging behind
Source: Penn World Table 8.0 (January 2014)
Note: Total Factor Productivity measures the growth of GDP over the combined contributions of total hours,
workforce skills, machinery and structures and IT capital.
Port Efficiency and Competitiveness in Latin America and the Caribbean Tomás Serebrisky
0.5
0.6
0.7
0.8
0.9
1.0
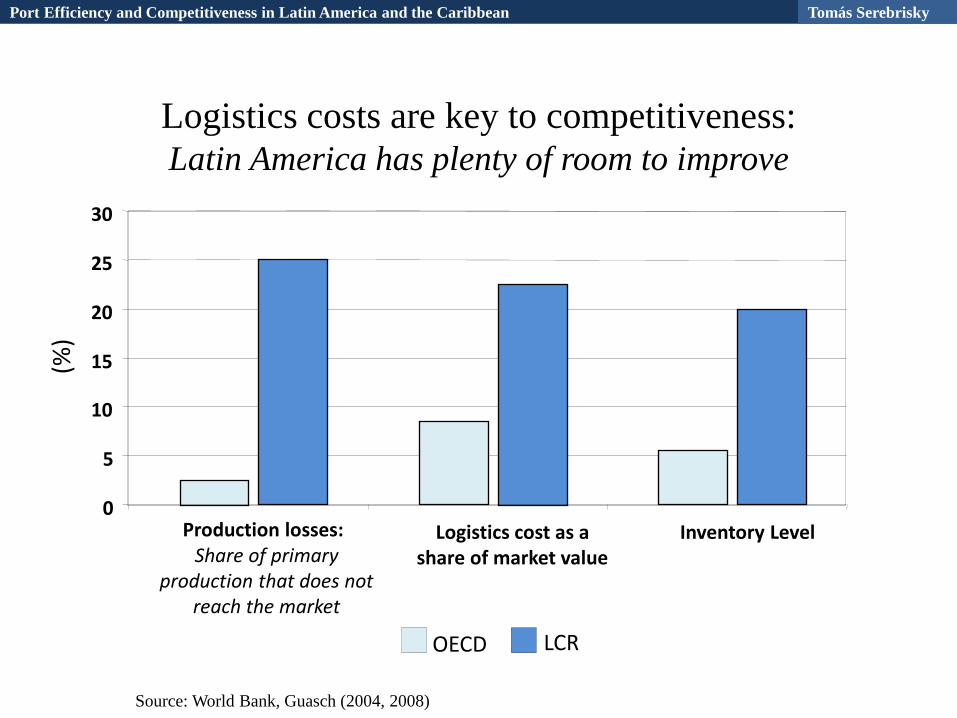
Logistics costs are key to competitiveness: Latin America has plenty of room to improve
0
5
10
15
20
25
30
Production losses: Share of primary
production that does not reach the market
Logistics cost as a share of market value
Inventory Level
(%
)
OECD LCR
Source: World Bank, Guasch (2004, 2008)
Port Efficiency and Competitiveness in Latin America and the Caribbean Tomás Serebrisky
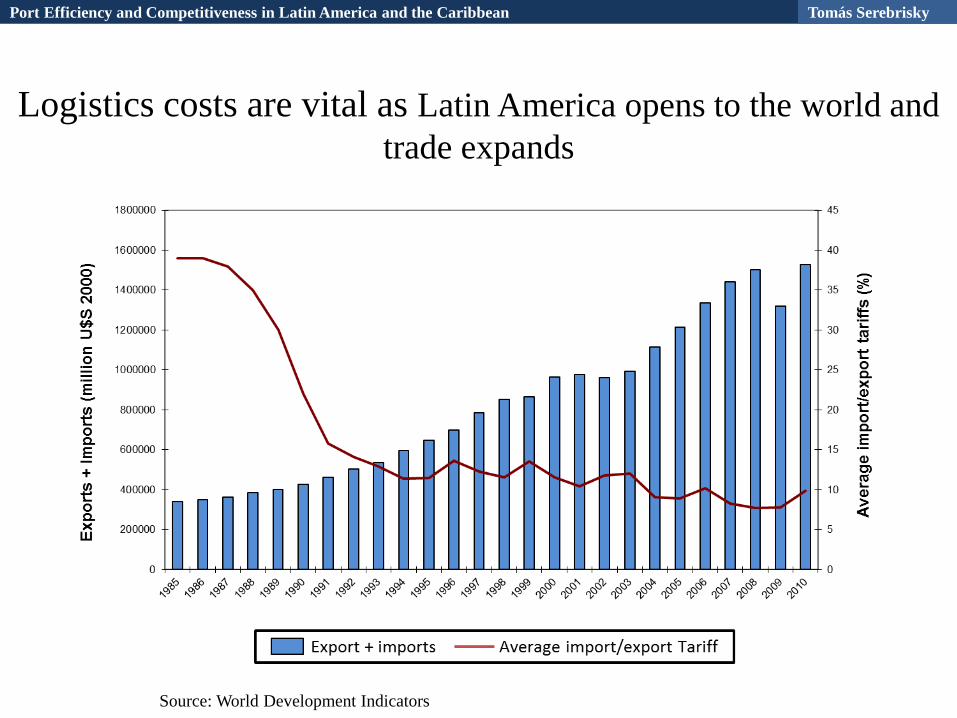
Logistics costs are vital as Latin America opens to the world and
trade expands
Source: World Development Indicators
Port Efficiency and Competitiveness in Latin America and the Caribbean Tomás Serebrisky

Logistics Costs are key to Poverty Alleviation: Logistics is a significant component of retail food price
Sha
re o
f H
H B
udg
et s
pen
t o
n fo
od
GDP per capita (log)
Source: Dessus, et al, World Bank (2008); data from household surveys.
Shar
e o
f h
ou
seh
old
bu
dge
t sp
ent
on
fo
od
Port Efficiency and Competitiveness in Latin America and the Caribbean Tomás Serebrisky
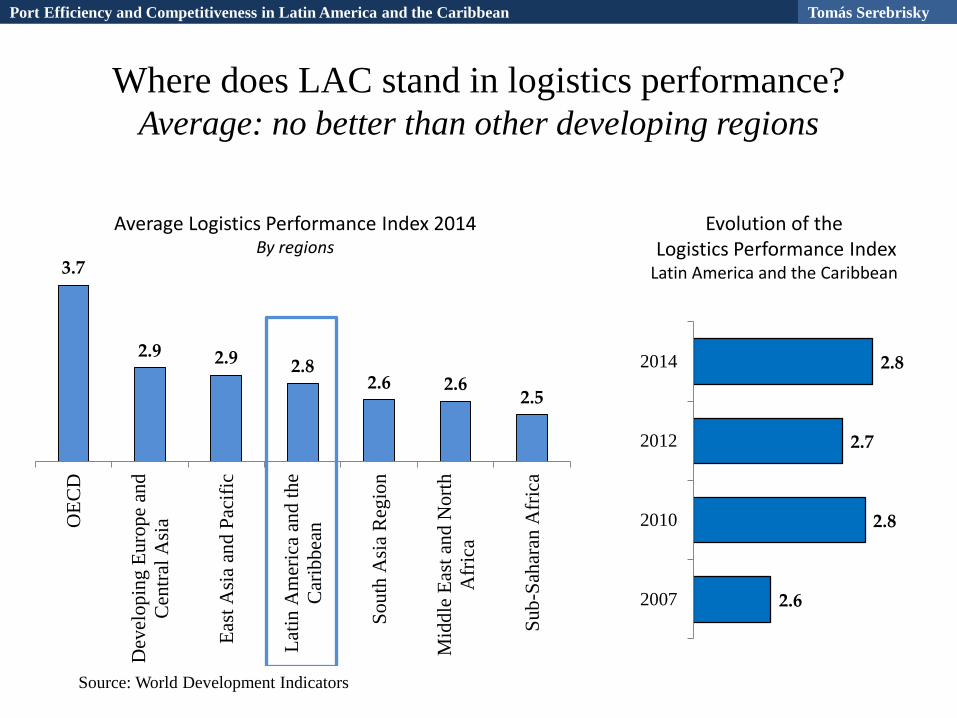
Where does LAC stand in logistics performance? Average: no better than other developing regions
3.7
2.9 2.9 2.8 2.6 2.6
2.5
OE
CD
Dev
elop
ing E
uro
pe
and
Cen
tral
Asi
a
Eas
t A
sia
and P
acif
ic
Lat
in A
mer
ica
and t
he
Car
ibbea
n
Sou
th A
sia
Reg
ion
Mid
dle
Eas
t an
d N
ort
h
Afr
ica
Sub
-Sah
aran
Afr
ica
Source: World Development Indicators
2.6
2.8
2.7
2.8
2007
2010
2012
2014
Average Logistics Performance Index 2014 By regions
Evolution of the Logistics Performance Index Latin America and the Caribbean
Port Efficiency and Competitiveness in Latin America and the Caribbean Tomás Serebrisky

Ports: fundamental to improve logistics in LAC
Supply chain globalization has made the economy more
transport and container intensive Over the last 10 years in Latin America:
5% 6% 9%
GDP GROWTH:
INTERNATIONAL TRADE GROWTH:
CONTAINER THROUGHPUT GROWTH:
International trade opening
Supply chain globalization
New production models
More outsourcing
Cargo Containerization
Empty container handling
New shipping lines
Transshipment
Globalization has been transport intensive
Source: World Development Indicators
Port Efficiency and Competitiveness in Latin America and the Caribbean Tomás Serebrisky

Perception of port quality varies widely in LAC…
8
6.4
5.6
5.2
5.2
5.1
5.0
4.9
4.7
4.6
4.3
4.0
3.9
3.9
3.8
3.6
3.6
3.5
3.3
3.3
3.2
3.2
2.6
2.5
2.4
1.9
0.0 1.0 2.0 3.0 4.0 5.0 6.0 7.0
PanamaBarbados
ChilePuerto Rico
JamaicaSurinameUruguay
Dominican RepublicHonduras
MexicoGuatemala
EcuadorEl Salvador
Trinidad and TobagoArgentinaParaguay
PeruBoliviaGuyana
ColombiaNicaragua
BrazilVenezuela, RB
Costa RicaHaiti
Average
Source: World Economic Forum (2013)
Port Efficiency and Competitiveness in Latin America and the Caribbean Tomás Serebrisky
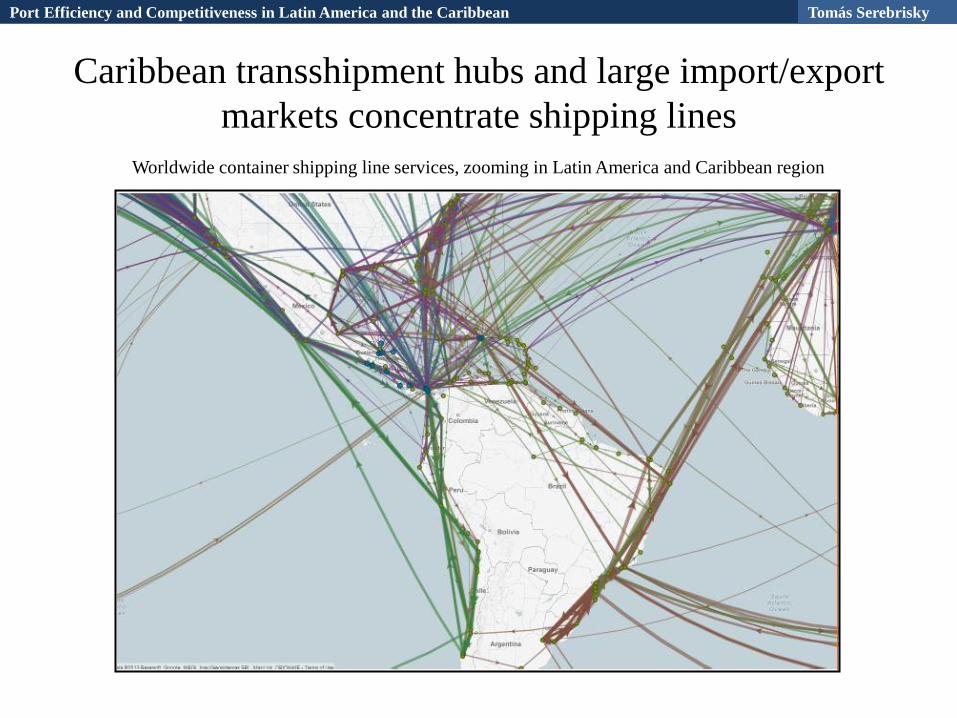
Worldwide container shipping line services, zooming in Latin America and Caribbean region
Caribbean transshipment hubs and large import/export
markets concentrate shipping lines
Port Efficiency and Competitiveness in Latin America and the Caribbean Tomás Serebrisky

Port quality and liner connectivity in LAC
10
HTI
VEN
BRA CRI
GUY NIC
COL PER
ARG HND
TTO GTM SLV ECU
MEX DOM
URY
SUR JAM CHL
BRB
PAN
2
2.5
3
3.5
4
4.5
5
5.5
6
6.5
0 5 10 15 20 25 30 35 40 45 50
Per
ceiv
ed Q
uali
ty o
f P
ort
In
fra
stru
ctu
re 2
01
3 (
WE
F)
Liner Shipping Connectivity 2013 (UNCTAD)
Better perceived
quality than
connectivity
Better
connectivity
than perceived
quality
Low perceived
quality and low
connectivity
Port Efficiency and Competitiveness in Latin America and the Caribbean Tomás Serebrisky
-
500
1,000
1,500
2,000
2,500
3,000
3,500
4,000
US
$ 2
01
3
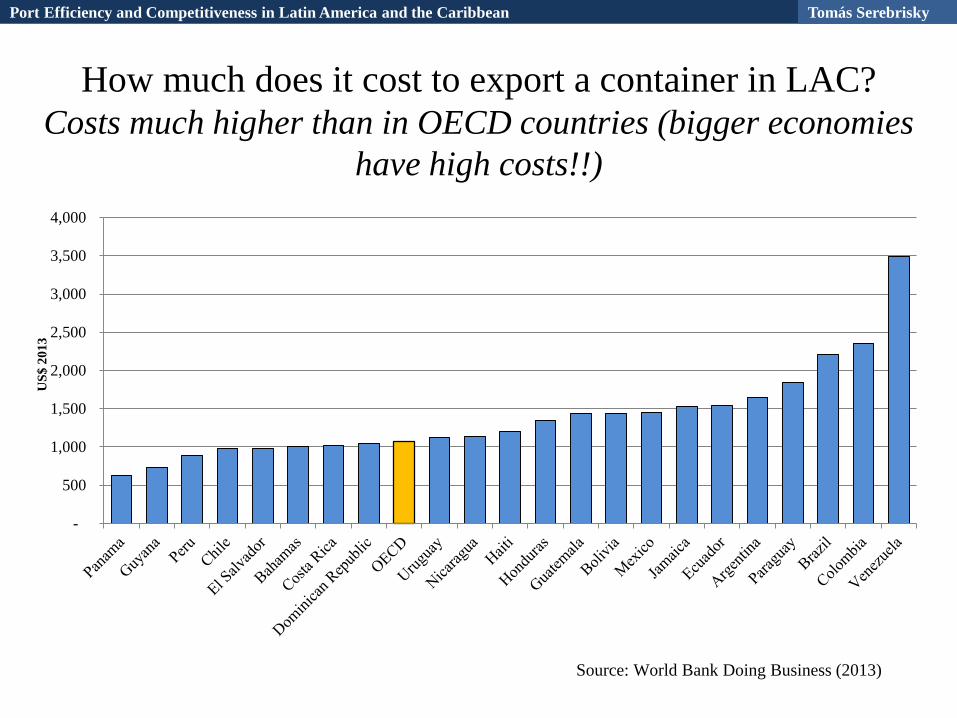
Source: World Bank Doing Business (2013)
How much does it cost to export a container in LAC? Costs much higher than in OECD countries (bigger economies
have high costs!!)
Port Efficiency and Competitiveness in Latin America and the Caribbean Tomás Serebrisky
What do we know about
port efficiency?
Port Efficiency and Competitiveness in Latin America and the Caribbean Tomás Serebrisky
13
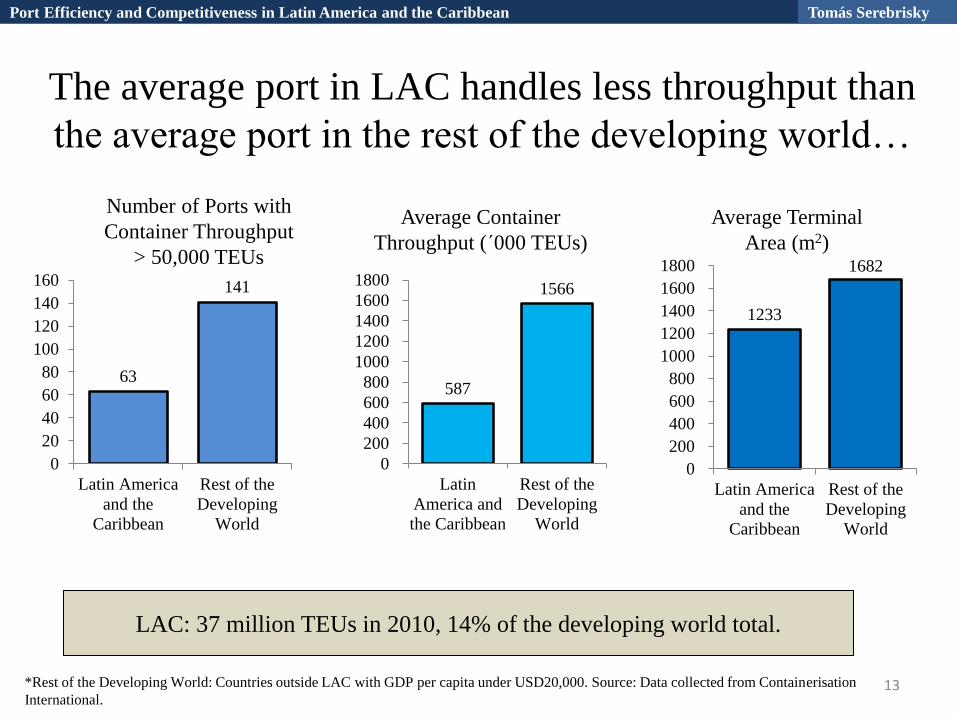
Number of Ports with
Container Throughput
> 50,000 TEUs
Average Container
Throughput (´000 TEUs)
Average Terminal
Area (m2)
63
141
0
20
40
60
80
100
120
140
160
Latin America
and the
Caribbean
Rest of the
Developing
World
587
1566
0
200
400
600
800
1000
1200
1400
1600
1800
Latin
America and
the Caribbean
Rest of the
Developing
World
1233
1682
0
200
400
600
800
1000
1200
1400
1600
1800
Latin America
and the
Caribbean
Rest of the
Developing
World
The average port in LAC handles less throughput than
the average port in the rest of the developing world…
*Rest of the Developing World: Countries outside LAC with GDP per capita under USD20,000. Source: Data collected from Containerisation
International.
LAC: 37 million TEUs in 2010, 14% of the developing world total.
Port Efficiency and Competitiveness in Latin America and the Caribbean Tomás Serebrisky

14
Average Total Length of
Berths (meters)
Average Number of
STS Gantry Cranes Share of Private
Participation in Ports
315
728
0
100
200
300
400
500
600
700
800
Latin
America
and the
Caribbean
Rest of the
Developing
World
3.3
10.6
0
2
4
6
8
10
12
Latin
America
and the
Caribbean
Rest of the
Developing
World
60% 65%
20%
30%
40%
50%
60%
70%
80%
Latin
America
and the
Caribbean
Rest of the
Developing
World
…and is also smaller in terms of infrastructure assets
(terminal area, length of berths and cranes)
*Rest of the Developing World: Countries outside LAC with GDP per capita under USD20,000.
Source: Data collected from Containerisation International.
50% of LAC ports have rail connection, the same
proportion as in the developing world.
Port Efficiency and Competitiveness in Latin America and the Caribbean Tomás Serebrisky
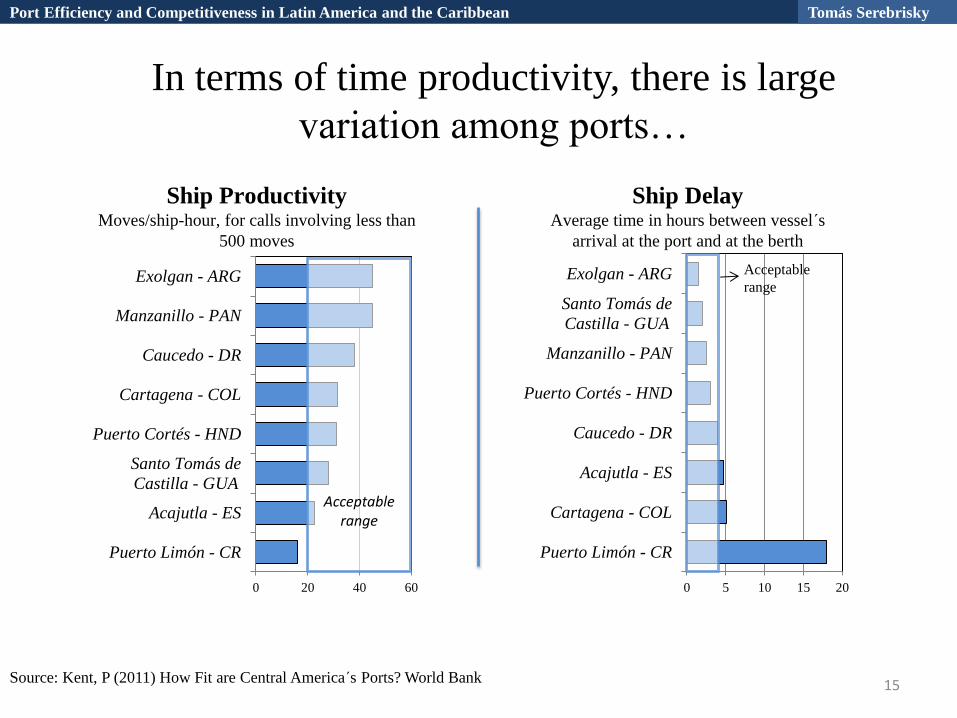
In terms of time productivity, there is large
variation among ports…
15
0 20 40 60
Puerto Limón - CR
Acajutla - ES
Santo Tomás de
Castilla - GUA
Puerto Cortés - HND
Cartagena - COL
Caucedo - DR
Manzanillo - PAN
Exolgan - ARG
Ship Productivity Moves/ship-hour, for calls involving less than
500 moves
Acceptable range
0 5 10 15 20
Puerto Limón - CR
Cartagena - COL
Acajutla - ES
Caucedo - DR
Puerto Cortés - HND
Manzanillo - PAN
Santo Tomás de
Castilla - GUA
Exolgan - ARG
Ship Delay Average time in hours between vessel´s
arrival at the port and at the berth
Acceptable
range
Source: Kent, P (2011) How Fit are Central America´s Ports? World Bank
Port Efficiency and Competitiveness in Latin America and the Caribbean Tomás Serebrisky

Measuring port efficiency is a difficult task Benchmarking studies have addressed efficiency with Partial Productivity
Indicators or with the estimation of Technical Efficiency Frontiers
Port
Efficiency Port access
time
Hourly load
time
Ship
waiting
time
Customs
Other
administrative
procedures
Hourly
unload time
Focus on Technical Efficiency:
A technical efficient port generates the maximum container throughput
with the lowest quantity of infrastructure inputs
Port Efficiency and Competitiveness in Latin America and the Caribbean Tomás Serebrisky
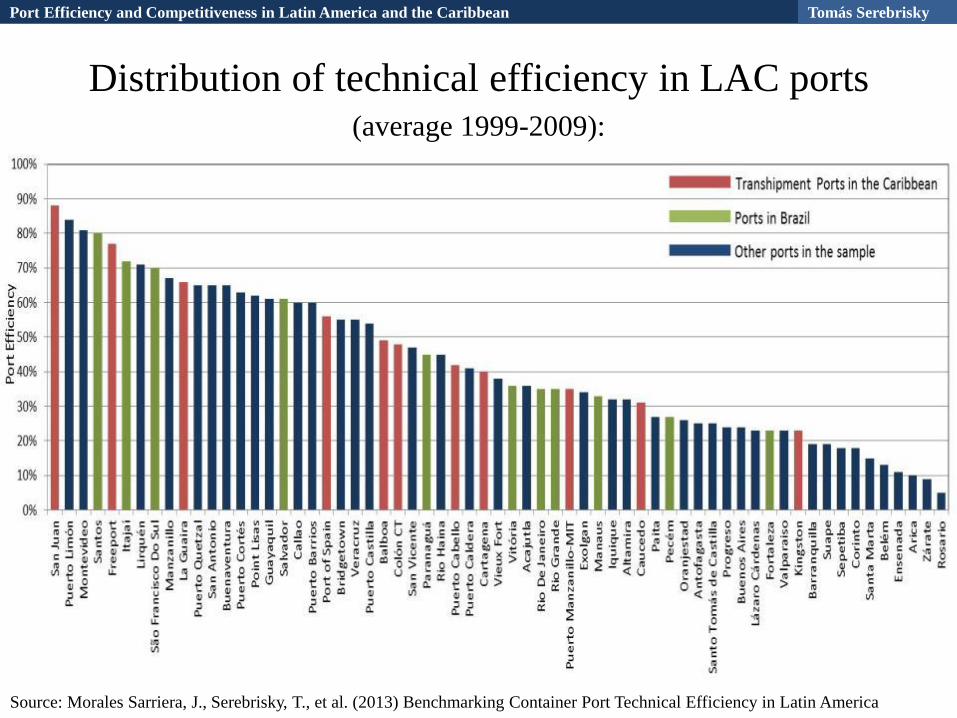
Distribution of technical efficiency in LAC ports (average 1999-2009):
Source: Morales Sarriera, J., Serebrisky, T., et al. (2013) Benchmarking Container Port Technical Efficiency in Latin America
Port Efficiency and Competitiveness in Latin America and the Caribbean Tomás Serebrisky
-
200
400
600
800
1,000
1,200
1,400
1,600
1,800
2,000
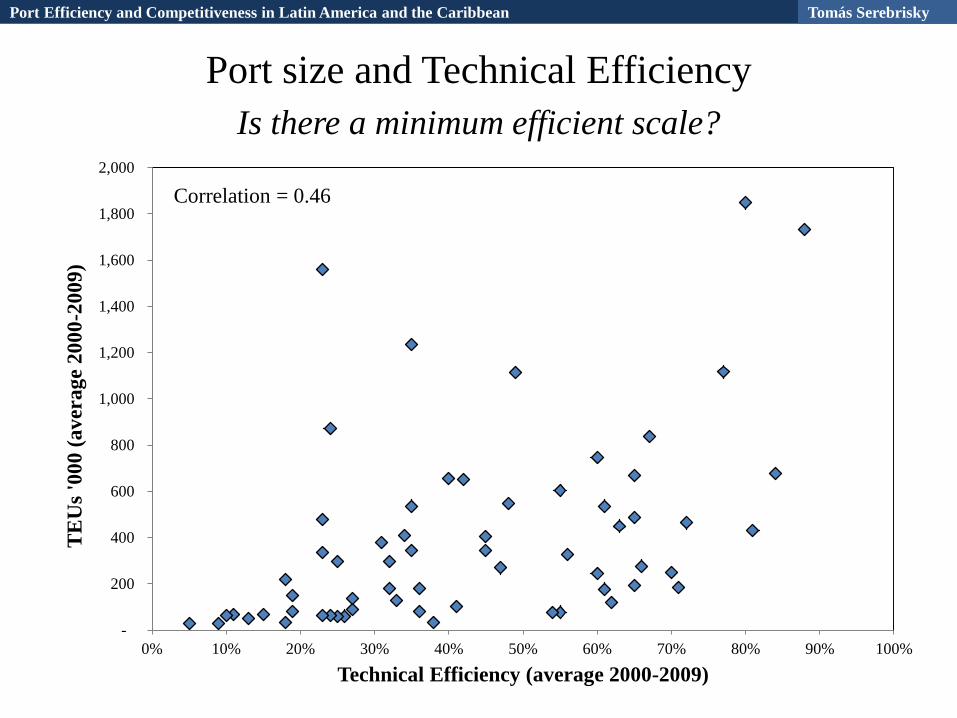
0% 10% 20% 30% 40% 50% 60% 70% 80% 90% 100%
TE
Us
'00
0 (
av
erag
e 2
00
0-2
00
9)
Technical Efficiency (average 2000-2009)
Correlation = 0.46
Port size and Technical Efficiency
Is there a minimum efficient scale?
Port Efficiency and Competitiveness in Latin America and the Caribbean Tomás Serebrisky

Overall technical efficiency in LAC ports is 43%
(Africa 30% and Europe 60%)
Good news: TE has improved significantly!!
36 37
40 38
40 43 43
45 47
51 50
30
35
40
45
50
55
1999 2000 2001 2002 2003 2004 2005 2006 2007 2008 2009
Tech
nic
al E
ffic
ien
cy, %
Compound Annual Growth Rate = 3.2%
Source: Morales Sarriera, J., Serebrisky, T., et al. (2013) Benchmarking Container Port Technical Efficiency in Latin America
Average technical efficiency growth in LAC over 1999-2009:
Port Efficiency and Competitiveness in Latin America and the Caribbean Tomás Serebrisky

Data, data, data… Can’t do better without it
Source: IADB (2014) Freight Logistics Statistics Yearbook for Latin American and the Caribbean
Port Efficiency and Competitiveness in Latin America and the Caribbean Tomás Serebrisky
Final Remarks
- Logistics costs are key determinants for productivity,
competitiveness and poverty alleviation
- Logistics and port quality: LAC is not in a good position
relative to other developing regions
- Growth in international trade has put pressure on ports to
accommodate increasing demand: expansion of
infrastructure is not the only solution. What about
efficiency?
- Data availability is a major constraint. Scarcity of data
does not allow a thorough benchmarking of our ports.
Major barrier to improve public policies.
Port Efficiency and Competitiveness in Latin America and the Caribbean Tomás Serebrisky