polymer systems designed specifically for dna sequencing ... commercial... · research article...
TRANSCRIPT
Research Article
Polymer systems designed specifically forDNA sequencing by microchipelectrophoresis: A comparison withcommercially available materials
Electrophoresis-based DNA sequencing is the only proven technology for the de novosequencing of large and complex genomes. Miniaturization of capillary array electro-phoresis (CAE) instruments can increase sequencing throughput and decrease cost whilemaintaining the high quality and long read lengths that has made CAE so successful forde novo sequencing. The limited availability of high-performance polymer matrices andwall coatings designed specifically for microchip-sequencing platforms continues to be amajor barrier to the successful development of a commercial microchip-sequencinginstrument. It has been generally assumed that the matrices and wall coatings that havebeen developed for use in commercial CAE instruments will be able to be implementeddirectly into microchip devices with little to no change in sequencing performance. Here,we show that sequencing matrices developed specifically for microchip electrophoresissystems can deliver read lengths that are 150–300 bases longer on chip than some of themost widely used polymer-sequencing matrices available commercially. Additionally, weshow that the coating ability of commercial matrices is much less effective in theborosilicate chips used in this study. These results lead to the conclusion that newmaterials must be developed to make high-performance microfabricated DNA-sequen-cing instruments a reality.
Keywords:
Band broadening / Capillary electrophoresis / DNA sequencing / Microchipelectrophoresis / Polymer solution DOI 10.1002/elps.200800352
1 Introduction
A wealth of biological information was unveiled by thesequencing of the first human genome [1, 2], andsubsequent sequencing projects [3, 4] have added to thisknowledge to give researchers insights into genomestructure, genome function, and human evolution [5–9].To further understand the basics of our genome, includingstudying genome diversity at scales larger than the single-nucleotide level, continued large-scale sequencing projectsare needed [10, 11]. For example, while cancer may be
characterized by the particular tissue where it originates,there does exist genome-scale diversity that must becharacterized accurately to more effectively diagnose andtreat these diseases [12].
Unfortunately, the costs associated with sequencingmultiple individuals or cancerous tissue samples arecurrently prohibitive, with the cost of producing a copy of ahuman-sized genome estimated at !$20 million [13]. Ulti-mately, technology development drives cost reductions, andDNA-sequencing technology has benefited previously fromthe invention of capillary array electrophoresis (CAE)instruments to replace the older slab gel methods used forSanger fragment separation [14–17]. The increased rate ofdata acquisition by CAE was achieved through automatedinstrumentation, faster separation times, and parallelsample processing. Through the introduction of automatedCAE instruments, determining the full sequence of giga-base-sized genomes became feasible.
While consumables (sample preparation kits, polymermatrices, etc.) make up a large fraction of the total sequen-cing costs at genome-sequencing centers, CAE instrumentdepreciation is the single largest cost associated with theprocess [18]. The potential to reduce the bottom line at
Christopher P. Fredlake1
Daniel G. Hert1
Brian E. Root2
Annelise E. Barron1,3
1Department of Chemical andBiological Engineering,Northwestern University,Evanston, IL, USA
2Department of Materials Scienceand Engineering, NorthwesternUniversity, Evanston, IL, USA
3Department of Bioengineering,Stanford University, Stanford,CA, USA
Received June 4, 2008Revised August 29, 2008Accepted August 29, 2008
Abbreviations: CAE, capillary array electrophoresis;DMA, N,N-dimethylacrylamide; GPC, gel permeationchromatography; LPA, linear polyacrylamide; MALLS,multi-angle laser light scattering; pDMA, poly(N,N-dimethylacrylamide)
Correspondence: Professor Annelise E. Barron, Department ofBioengineering, 318 Campus Drive, W300B James H. ClarkCenter, Stanford, CA 94305, USAE-mail: [email protected]: +1-650-723-9801
& 2008 WILEY-VCH Verlag GmbH & Co. KGaA, Weinheim www.electrophoresis-journal.com
Electrophoresis 2008, 29, 4652–46624652
sequencing centers exists by developing technology thatmaintains a comparable capital investment to currentinstrumentation while generating sequencing data atrates much higher than the capabilities of currentinstruments.
While many alternatives to Sanger-based sequencing areunder development [19–21], no other technology has provencapable of producing long and/or accurate enough readlengths to sequence a large and complex genome includinglarge amounts of repetitive DNA. The miniaturization ofSanger sequencing, however, represents an avenue forincreased sample throughput while obtaining data that arealready usable by the current genome-sequencing infra-structure. Throughput is increased via shorter separationtimes, but overall sequencing costs can also be reducedsince these systems also require fewer reagents per run andhave the potential to be integrated into miniaturized samplepreparation platforms (such as those demonstrated by theMathies group [22, 23]). By obviating instrumenta-tion involved in offline sample preparation, the total capitalinvestment of the entire process is further reduced as well.
Miniaturized sequencing instruments, however, are stillunder development. While many challenges remain, creat-ing materials for the high-quality separation of sequencingfragments is a problem that still needs to be addressed.Development of the DNA separation media was animportant step in optimizing the performance of CAEinstruments. The advent of polymers that serve as sequen-cing matrices and/or channel wall coatings was crucial tothe development of robust CAE-sequencing instrumentsthat deliver long and accurate DNA-sequencing readlengths.
Much work was done to optimize linear polyacrylamide(LPA) for capillary electrophoresis-sequencing applicationsto replace the crosslinked acrylamide gels that had beenused in slab gels. In LPA solutions in water, physicalentanglements between chains form the network of open-ings used to sieve the DNA as opposed to the chemicalcrosslinks that form pores in the gels. LPA is very hydro-philic and forms strongly entangled networks that have beenshown to be excellent for high-quality DNA separations,with the Karger laboratory demonstrating that longsequencing read lengths (up to 1300 bases) can be obtainedwith highly optimized LPA-matrix formulations andhighly pure DNA-sequencing samples [24]. Additionally,Doherty et al. showed that by adding very small amountsof crosslinking monomers back into the polymer (the poly-mer solution still flowed) to form stabilized LPA ‘‘nano-gels,’’ sequencing performance could be improvedcompared with LPA synthesized in the absence of anycrosslinker [25, 26].
LPA can also be used as a polymer wall coating forchannel surfaces by using the method developed by Hjerten[27]. This method creates covalently linked polymer chainson the surface of the channels to form the coating. Thesynthesis of the polymer coating is performed within thecapillary and requires up to 10 h to complete. This
procedure can lead to capillary clogging and the formationof non-homogeneously coated surfaces making the use ofthese coatings non-ideal, although they have been previouslyshown to allow high-quality DNA-sequencing read lengthsin some cases.
In addition to LPA, the acrylamide derivative poly(N,N-dimethylacrylamide) (pDMA) has also been demonstrated asa high-quality polymer for sequencing DNA [28–30].Sequencing matrices using pDMA generally have lowerviscosities than LPA matrices and are also able to formadsorptive, or dynamic, coatings on the capillary surfaces,eliminating the need to perform chemical reactions at thecapillary surface prior to polymer matrix loading and DNAfragment separation. Dynamic coatings are very advanta-geous as alternatives to covalent coatings because thesecoating can be applied relatively quickly (45 min or less) andare extremely stable [31].
While the dedicated development of polymer materialsfor DNA sequencing such as LPA and pDMA have beenmainly completed in CAE devices, research focusing on thedesign of microfabricated systems for DNA have tended tofocus on instrumentation while giving less attention tomatrix and wall coating development [23, 32–38]. Whileinstrumentation and integration challenges have been great,success in this field has been limited in part due to theassumption that the separation of sequencing fragments inmicrofluidic devices is not much different than in CAEinstruments. Specifically, it has been assumed that thematerials used in commercial CAE instruments can beplugged directly into microchip platforms with little or nochange in sequencing performance. In previous work [39],we have demonstrated that polymer systems (comprisingboth a matrix and wall coating) developed exclusively usinga microchip-sequencing instrument have delivered longsequencing read lengths (up to 600 bases) in short times(!6–7min). This single-channel throughput is over threetimes higher than in previously published microchip-sequencing reports, which generally used polymer matricesand coatings based on formulations that had been developedfor CAE instruments. In this paper, we show thatcommercially available CAE polymer matrices deliver muchshorter read lengths in microchips than polymer matricesdeveloped exclusively for microchip-sequencing platforms,and discuss the need for these new matrices and coatings tospeed the development of microfabricated platforms forDNA-sequencing analysis.
2 Materials and methods
2.1 Polymer synthesis
Polymers were synthesized by aqueous-phase free-radicalpolymerization. The N,N-dimethylacrylamide (DMA) mono-mer (Monomer-Polymer & Dajac Labs, Feasterville, PA,USA) was polymerized by dissolving monomer into distilledand deionized water at a concentration of 4%w/w.
Electrophoresis 2008, 29, 4652–4662 Microfluidics and Miniaturization 4653
& 2008 WILEY-VCH Verlag GmbH & Co. KGaA, Weinheim www.electrophoresis-journal.com

Additionally, isopropanol can be added to the solution tocontrol the molar mass of the polymer. The DMA solutionwas placed in a jacketed flask where the temperature wascontrolled at 471C by a re-circulating water bath. Oxygen wasremoved from the system by bubbling nitrogen gas throughthe solution for 30 min. The polymerization reaction wasinitiated using V-50 (2,20-azobis(2-amidinopropane) dihy-drochloride, Wako Chemicals, Richmond, VA, USA), andthe reaction was allowed to proceed for 6 h.
For synthesis of the coating polymer, N-hydro-xyethylacrylamide monomer (Cambrex, East Rutherford, NJ,USA) was dissolved at 0.5%w/w and prepared similar to theDMA solution with the re-circulating water bath set at atemperature of 251C. The N-hydroxyethylacrylamide poly-merization reaction was initiated using ammoniumpersulfate (APS, Amresco, Solon, OH, USA) and TEMED(Amresco). Purification of all synthesized polymers includeddialysis using Spectrum Spectra/Por cellulose estermembranes with a molar mass cutoff of 100 000 Da againstdistilled and deionized water for 2 wk with frequent waterchanges. After dialysis, dry polymer was recovered bylyophilization.
2.2 Polymer molar mass characterization
Polymer molar mass distributions were determined usingtandem gel permeation chromatography (GPC) (Waters,Milford, MA, USA)-multi-angle laser light scattering(MALLS) (Wyatt Technology, Santa Barbara, CA, USA).Polymer solutions were prepared at a concentration of1.0 mg/mL in the GPC aqueous mobile phase (0.1 M NaCl,50 mM NaH2PO4, and 200 mM NaN3). The samples werefractionated on the GPC using Shodex (New York, NY,USA) OHpak columns SB-806 HQ, SB-804 HQ, and SB-802.5 HQ were connected in series. After fractionation, thesamples flowed to the DAWN EOS MALLS instrument andthen to the Optilab DSP refractive index detector. Data wereprocessed using the ASTRA software from Wyatt Technol-ogy using the assumption of 100% mass recovery from theinjected sample and the known instrument calibrationconstant. Light scattering data were analyzed using theBerry method with a first-order fit for the molar mass andcoil radius distributions.
2.3 Rheology
The zero-shear viscosity of polymer matrices was deter-mined using an Anton Paar Physica MCR 300 (Ash-land, VA, USA) rheometer with the temperature maintainedby a Peltier controller connected to a digitally controlledre-circulating water bath (Julabo USA, Allentown, PA,USA). Controlled shear stress and shear rate sweepswere performed with a cone-and-plate (model CP50-1)fixture and a double gap Couette (model DG26.7)fixture.
2.4 Application of polymer dynamic coating
Prior to adsorption of polymer chains onto the channelsurface, a 1 M HCl solution was loaded into the channelsand allowed to contact the surface for 15 min. Followingacid treatment, the channels were flushed with water. A0.1–0.25%w/v solution of the coating polymer was thenintroduced into the channels and allowed to contact thesurface for 15 min. The polymer solution was then removedand water was flushed through the channels.
2.5 DNA sequencing by CAE
All DNA-sequencing separations by CAE were performedusing the Applied Biosystems (ABI) 3100 Genetic Analyzer.Two separate 22 cm capillary arrays were used in theseexperiments. One array was dynamically coated with poly(N-hydroxyethylacrylamide) (pHEA) using the methoddescribed in Section 2.4 (this was performed ‘‘offline’’ toavoid problems with introducing 1M HCl into the ABI 3100instrument). A pDMA matrix formulated in our laboratoryand ABI’s POP-6TM media were used as sequencingmatrices in order to compare matrix performance in thisinstrument using the pHEA-coated array. A second,uncoated array was used with POP-6TM (which coats thearray upon loading) to compare sequencing read lengthsobtained with the two different dynamic coatings. For theseexperiments, ABI Big Dye v3.1 four-color sequencingstandard was used as the sequencing sample. Prior tosample injection, pre-electrophoresis was performed with anelectric field of 250 V/cm. Sample was injected electrokine-tically under an applied field of 45 V/cm for 22 s. Four-colorDNA-sequencing separations were carried out at 551C underan electric field strength of 250 V/cm. Basecalling wasperformed by the NNIM BaseCaller (NNIM, LLC, Salt LakeCounty, UT, USA) and Sequencher v 4.0.5 (Gene Codes,Ann Arbor, MI, USA).
2.6 DNA sequencing by microchip electrophoresis
Analysis of M13 sequencing fragments (Amersham Bios-ciences, Piscataway, NJ, USA) was carried out on a home-built microchannel electrophoresis system that has beendescribed previously [40]. This system allows sensitive multi-color detection through LIF. The system comprises twosubsystems: an electrical system that supplies voltage to themicrofluidic device and an optical subsystem that allowsdetection of fluorescent molecules as they pass through afocused laser point from an 488-nm Argon-Ion laser. Thesetwo subsystems can both be controlled using a singleprogram written in LabView software.
Experiments were conducted using single-channelborosilicate glass microchips (chip T8050) purchased fromMicronit Microfluidics BV (Enschede, The Netherlands).These chips have an effective separation length of 7.5 cm.
Electrophoresis 2008, 29, 4652–46624654 C. P. Fredlake et al.
& 2008 WILEY-VCH Verlag GmbH & Co. KGaA, Weinheim www.electrophoresis-journal.com

Channels were dynamically coated with pHEA as describedin Section 2.4. Separations of sequencing fragments werecarried out in pDMA synthesized in our laboratory, whichwas dissolved in 1" TTE (49mM Tris, 49 mM TAPS, and2mM EDTA) and 7M urea. POPTM matrices from ABI(POP-5TM, POP-6TM, and POP-7TM) and Beckman Long-ReadTM sequencing matrix were used as purchased. Foreach run, pre-electrophoresis at 235 V/cm electric fieldwas performed for 60 s prior to sample injection. Thesample was injected for 40 s at 400 V/cm using an offsetT injector with a 100 mm offset. Separation was carried out at235 V/cm with 150 V/cm back biasing applied to the sampleand sample waste wells to ensure that no excess DNAmigrated into the separation channel. The chip was main-tained at 501C for the pre-electrophoresis, sample injection,and fragment separation steps using a copper plate inter-faced with a temperature controller. Basecalling wascompleted using NNIM Basecaller and Sequencher v 4.0.5.
3 Results and discussion
3.1 Polymer synthesis and characterization
The physical and chemical properties of polymer chainsgreatly influence the properties of both sequencing matricesand channel wall coatings [24, 31, 41]. The average molarmass of a polymer is critical for a polymer matrix to deliverlonger read lengths and for polymers physically adsorbed tothe channel surface to produce a robust and stable coating.Generally, the average molar mass must be in excess of1 MDa for both applications, although higher average molarmasses in separation matrices have been shown to lead tobetter sequencing performance [42, 43].
The physical properties of the polymers synthesized forthis study as measured by GPC-MALLS are given in Table 1.Careful control of various parameters of the synthesis suchas the monomer concentration, reaction temperature, andinitiator concentration is required to produce materials withhigh molar mass. Additionally, isopropanol can be added tothe reaction in order to reduce the average molar mass of thesynthesized polymers [28]. These lower molar mass poly-mers can be included in matrix formulations for increasingsequencing read lengths. All polymers were extensivelypurified after synthesis by dialyzing the reaction productsfor 2 wk against distilled and deionized water followed bylyophilization. The polymer matrix formulations were made
by dissolving the sequencing polymer into the 1" TTE+7Murea buffer.
The polymer matrices are entangled polymer solutionsthat can have a wide range of viscosities, which depend onboth polymer molar mass and concentration as well as thepolymer chemistry. The viscosities at different shear stressesare shown in Fig. 1. The matrices exhibit shear-thinningbehavior typical of entangled polymer solutions [41]. Thezero-shear viscosities along with the loading time of thematrices into the 8.5-cm long microchip channels at 190 psiare given in Table 2. The viscosity of these solutions can alsobe affected by the presence of the salts and other additives inthe buffers. Urea, which is used as a denaturant in ourmatrices, is known as a solution thickener although its
Table 1. Physical properties of polymers synthesized for thisstudy as measured by GPC-MALLS
Polymer Mw (MDa) Rg (nm) PDI
pDMA 5.9 98 1.5pDMAa) 0.28 31 1.9pHEA 3.0 98 1.5
a) Isopropanol added to reaction.
0.1 1 10 100 1000
102
103
104
105
106
107 LongReadTM
pDMA2 pDMA1 POPTM-6 POPTM-5 POPTM-7
Vis
cosi
ty (c
P)
Shear Stress (Pa)
Figure 1. This plot shows the change in viscosity for the differentmatrices used in this studywith shear stress. While viscosities canbe high for some of the matrices at low shear stress, the viscositycan often drop by an order of magnitude or more at higher shearstresses making filling the microchip easier.
Table 2. Zero-shear viscosity and channel loading times forsequencing matrices
Matrixa) Zero-shearviscosity (cP)
Chip loadingtimeb) (min)
POP-5TM 329 0.26POP-6TM 374 0.27POP-7TM 395 0.13PDMA1 24 000 1.16PDMA2 34 700 2.09LongReadTM 2 138 000 1.88
a) pDMA1 and pDMA2 were formulated in our laboratoryusing polymers from Table 1.
b) Time for matrix to fill chip with total length 8.5 cm at190 psi.
Electrophoresis 2008, 29, 4652–4662 Microfluidics and Miniaturization 4655
& 2008 WILEY-VCH Verlag GmbH & Co. KGaA, Weinheim www.electrophoresis-journal.com

contribution to the matrix viscosity is much lower than thecontributions from the polymer chain entanglements. Theviscosities of these solutions range over several orders ofmagnitude from !400 cP for the POPTM polymers to over 2million cP for the LongReadTM LPA matrix. Two of ourpDMA formulations have viscosities at an intermediatevalue between the POPTM matrices and the LongReadTM
matrix. With higher matrix viscosities, in general, the fillingof the microchips takes longer time. However, shear-thin-ning behavior is more pronounced in the LongReadTM
matrix as shown in Fig. 1, so that the loading times are thesame as the pDMA1 and pDMA2 matrices (1–2 min at190 psi), even though the zero-shear viscosity is two ordersof magnitude larger.
3.2 DNA sequencing by CAE
Previously, we have demonstrated that increased readlengths can be obtained in sequencing matrices where twopDMA polymers with different average molar masses areblended into a matrix relative to a matrix where just a singleaverage molar mass polymer is used to formulate the matrix[39]. Blends were formulated using a 3:1 and a 3:2 ratio ofhigh molar mass polymer to low molar mass polymerwith total polymer concentration of 4 and 5%w/v,respectively. Here, we evaluate the sequencing performanceof the 4%w/v blended pDMA matrix on the ABI 3100, acommercially available CAE-sequencing instrument, andcompare the read lengths with those obtained in ABI’s POP-6TM matrix. In these experiments, the hydrophilic polymerpHEA was used to dynamically coat the capillaries in thearray. In order to coat the capillaries with pHEA, a new arraywas removed from the instrument and connected to asyringe pump. Using the pump, acid was first flushedthrough the capillaries, followed by pumping the dilutepolymer coating solution through the capillaries (the fullmethod is described in Section 2).
In the pHEA-coated array, separation of DNA-sequen-cing fragments was performed with both the 4% pDMA andthe POP-6TM matrices. Figure 2 shows unprocessedsequencing electropherograms from typical runs in both ofthe matrices. The separation is much faster in the 4%pDMA formulation, with the last of the sequencing frag-ments eluting from the capillary in 22 min, compared withthe 60 min required in POP-6TM. The mobility of the DNAfragments is a function of the polymer matrix itself, and isnot affected by the coating. This was confirmed by separat-ing DNA-sequencing fragments in a second array in whichPOP-6TM was used as both the separation matrix and thedynamic wall coating. For this second capillary array, thePOP-6TM polymer was loaded into the bare capillaries priorto sample injection and separation, which is the normaloperating procedure for the instrument. Figure 3 shows theunprocessed fluorescence data for DNA fragment in atypical run for separations in POP-6TM using both thepHEA- and POPTM-coated arrays. The required run time
was 60 min for separations in arrays used with either coat-ing polymers.
Sequencing read lengths in the two matrices using thepHEA-coated capillaries are presented in Table 3, with allread lengths given at 98.5% accuracy. POP-6TM providedlonger read lengths on average (677 bases) as wellas the longest read of 757 bases, but the 4% pDMA deliveredonly slightly shorter read lengths on average (650 bases),and had a lower standard deviation of the data. Thelonger read lengths in POP-6TM derive, in part, from betterseparation of the smaller DNA fragments. Figure 4shows the first 70 called bases in a typical electropherogram
TM-6
0 10 20 30 40 50 60 70
0
3000
6000
9000
12000
POP
pDMA matrix
R.F.U.
Time (min)
Figure 2. These unprocessed sequencing electropherogramsshow that the injected DNA-sequencing sample elutes in muchshorter times from the pDMAmatrix formulated in our laboratorythan in POP-6TM in the ABI 3100. For these experiments, theelectric field was set at 250 V/cm and the temperature was set at551C. The capillaries had an effective length of 22 cm and weredynamically coated with pHEA polymer prior to matrix loadingand DNA injection. The DNA in the pDMA matrix elutes in!22min while the DNA takes 60min to move through the POP-6TM matrix.
TM
0 10 20 30 40 50 600
3000
6000
9000
12000
POP -6 Coating
pHEA Coating
R.F.U.
Time (min)
Figure 3. These unprocessed electropherograms show the effectof dynamic polymer coating on DNA elution time in the ABI3100. In 22-cm capillaries, dynamically coated with either pHEAor POP-6TM, DNA elution time is 60min through the POP-6TM-sequencing matrix. Thus there is no effect of the coatingpolymer on DNA speed through the matrix. Other experimentalconditions are the same as in Fig. 2.
Electrophoresis 2008, 29, 4652–46624656 C. P. Fredlake et al.
& 2008 WILEY-VCH Verlag GmbH & Co. KGaA, Weinheim www.electrophoresis-journal.com

for each of the two matrices after basecalling. It can be seenthat the peaks eluting from the 4% pDMA matrix (Fig. 4A)are more poorly resolved than peaks eluting from thePOP-6TM-filled capillaries (Fig. 4B) in this DNA fragmentsize range.
POP-6TM might be expected to perform better in theseexperiments since this sequencing matrix was developedspecifically for the ABI instrument. Both the data processingsoftware and the sample injection conditions are tuned forthe POPTM matrices. In our analysis of the data, we used abasecaller (from NNIM, LLC) that was not developed for anyone particular matrix or system (we did not use ABI’sbasecaller) so that specific adjustments for POPTM polymerswere minimized. However, the injection conditionsprogrammed into the instrument depend largely on theDNA mobility in the matrices, and the voltage and injectiontime were not changed from the conditions in the standardPOP-6TM sequencing program that was used to run theseparations on the instrument. Because DNA mobility ishigher in the 4% pDMA matrix, injection plugs were mostlikely wider than in POP-6TM for these injection conditionsand could lead to lower read lengths relative to a specificallyoptimized injection protocol for the pDMA matrix.
Even though read lengths were slightly lower, itmay be beneficial to use the 4% pDMA if one were tochoose between using one of these two matrices in thisinstrument since the separation time was much faster. Thesequencing throughput is approximately three times fasteras shown in Fig. 2. Therefore, with the 4% pDMA matrix,1950 bases per capillary can be acquired in about 1 h ofelectrophoresis, while only a single separation run can becompleted with the POP-6TM in that same hour, yielding677 bases per capillary.
We also compared sequencing performance usingeither the pHEA coating or the POP-6TM coating whenPOP-6TM was used as the separation matrix, as given inTable 4. The average read lengths and the longest readlength using the POPTM coating are lower than the readlengths in pHEA-coated capillaries. The pHEA is a morehydrophilic polymer coating than POPTM, resulting in areduction of interactions between the wall and the ssDNAfragments than would be observed in a more hydrophobiccoating. While the pHEA coating slightly increases readlengths, the application of the coating requires a more time-consuming offline coating procedure than the application ofthe POPTM coating, which only requires the capillaries to be
Table 3. Comparison of sequencing matrices on ABI 3100 with pHEA dynamically coated capillary arrays
Polymer Average read lengtha) (n5 4) Long read lengtha) Timeb) (min)
4% pDMAc) 650710 660 22POP-6TM 677768 757 60
a) All read lengths given at 98.5% accuracy.b) Time required for last DNA sequencing fragment to elute from column.c) 3% high molar mass (3.4 MDa) + 1% low molar mass (280 kDa).
Figure 4. Sequencing traces for small DNA fragments through (A) the pDMA matrix and (B) the POP-6TM matrix on the ABI 3100 showthe different abilities of the matrices to resolve DNA fragments in this size range. The double T peaks around base 31, 37, and 42 in thePOP-6TM matrix (trace b) are better resolved than the same peaks in the pDMA trace. Note that in the pDMA trace, these same peaksare 28, 33, and 39 because basecalling begins later in this matrix due to poorer resolution. Peaks are better resolved to baseline even tothe end of the shown sequence (!base 70).
Electrophoresis 2008, 29, 4652–4662 Microfluidics and Miniaturization 4657
& 2008 WILEY-VCH Verlag GmbH & Co. KGaA, Weinheim www.electrophoresis-journal.com
filled with matrix polymer. The offline coating method,however, is very simple to perform.
3.3 Comparison of polymer matrices on microchip-sequencing system
While the sequencing performance of our pDMA formula-tions and a commercially available POPTM matrix wascomparable on the ABI 3100, the main goal of the study wasto compare sequencing performance on a microchipelectrophoresis system. The microchip separations wereperformed on a system that was custom-built in ourlaboratory, and separations in all matrices were performedat the same temperature, electric field strength, andseparation distance. Additionally, the injection conditionswere held constant for every matrix. Because of the offsetT injection scheme employed in the chips [44], the sampleinjection is not greatly affected by the choice of separationmatrix. In these injections, the initial sample plug width isroughly defined by the length of the offset between sampleand waste arms in the chip, which is approximately 100 mmfor the Micronit chips used in these experiments. Weformulated two pDMA matrices, matrices pDMA1 andpDMA2, from the synthesized polymers described inSection 3.1, and compared sequencing performance ofthese two matrices with the commercially available sequen-cing matrices POP-5TM, POP-6TM, and POP-7TM fromABI and the LongReadTM matrix from Amersham/GEHealthcare.
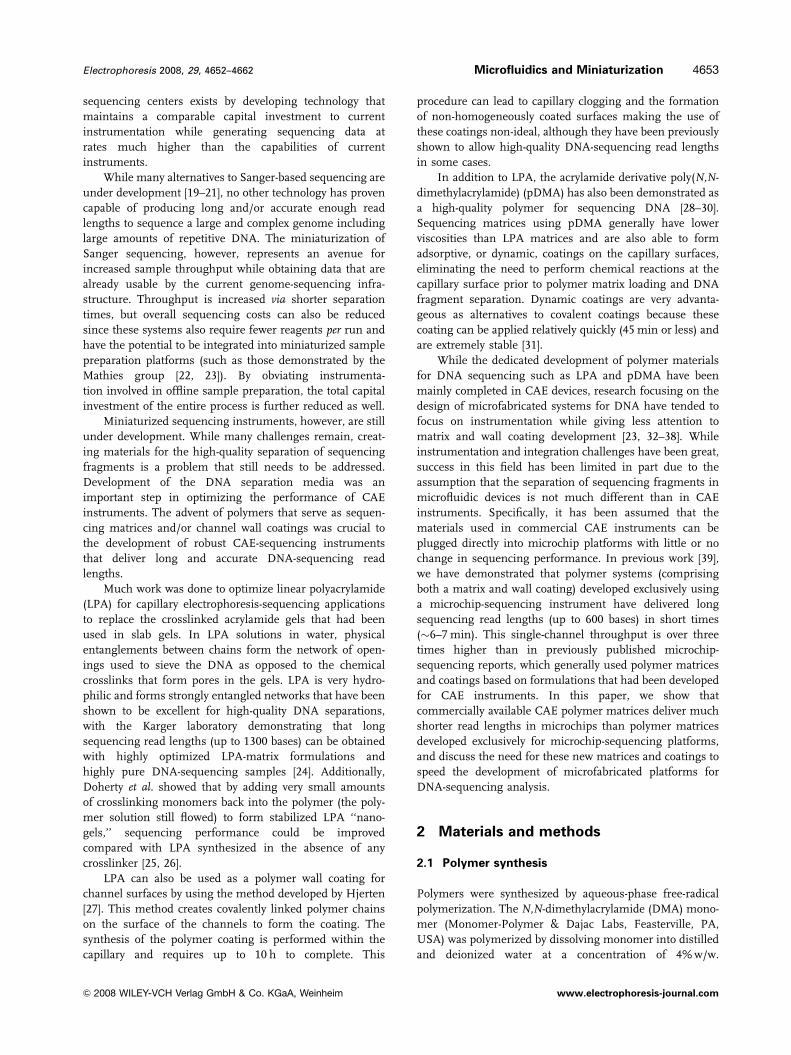
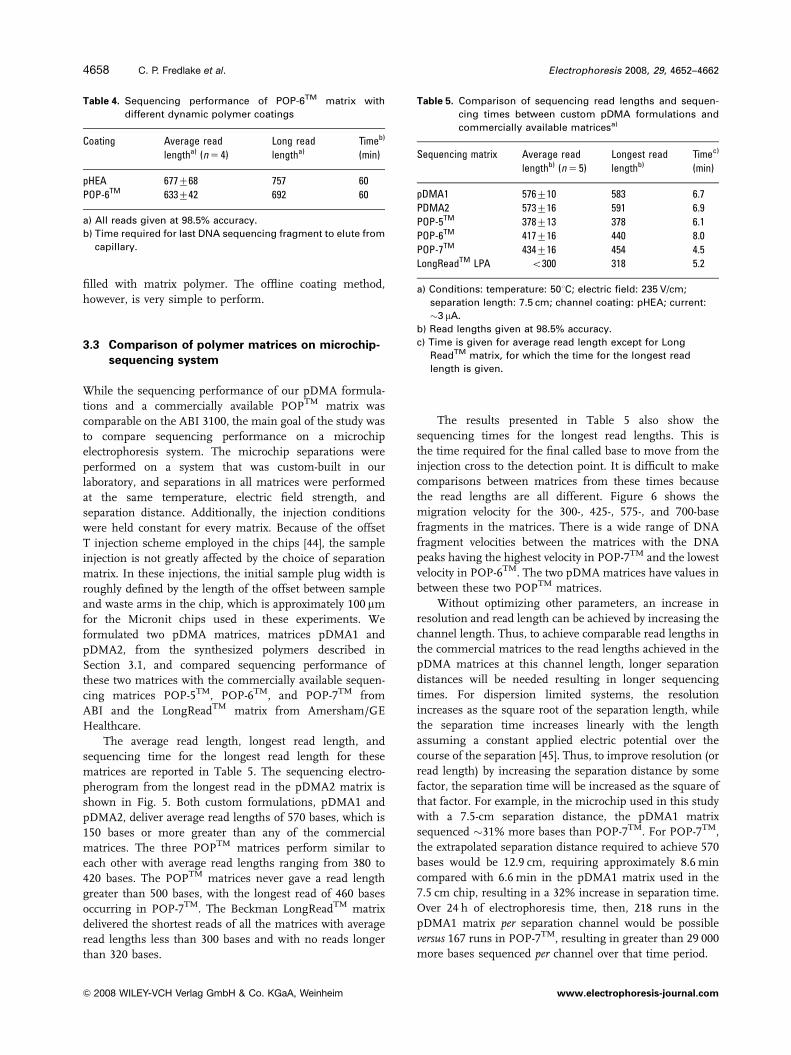
The average read length, longest read length, andsequencing time for the longest read length for thesematrices are reported in Table 5. The sequencing electro-pherogram from the longest read in the pDMA2 matrix isshown in Fig. 5. Both custom formulations, pDMA1 andpDMA2, deliver average read lengths of 570 bases, which is150 bases or more greater than any of the commercialmatrices. The three POPTM matrices perform similar toeach other with average read lengths ranging from 380 to420 bases. The POPTM matrices never gave a read lengthgreater than 500 bases, with the longest read of 460 basesoccurring in POP-7TM. The Beckman LongReadTM matrixdelivered the shortest reads of all the matrices with averageread lengths less than 300 bases and with no reads longerthan 320 bases.
The results presented in Table 5 also show thesequencing times for the longest read lengths. This isthe time required for the final called base to move from theinjection cross to the detection point. It is difficult to makecomparisons between matrices from these times becausethe read lengths are all different. Figure 6 shows themigration velocity for the 300-, 425-, 575-, and 700-basefragments in the matrices. There is a wide range of DNAfragment velocities between the matrices with the DNApeaks having the highest velocity in POP-7TM and the lowestvelocity in POP-6TM. The two pDMA matrices have values inbetween these two POPTM matrices.
Without optimizing other parameters, an increase inresolution and read length can be achieved by increasing thechannel length. Thus, to achieve comparable read lengths inthe commercial matrices to the read lengths achieved in thepDMA matrices at this channel length, longer separationdistances will be needed resulting in longer sequencingtimes. For dispersion limited systems, the resolutionincreases as the square root of the separation length, whilethe separation time increases linearly with the lengthassuming a constant applied electric potential over thecourse of the separation [45]. Thus, to improve resolution (orread length) by increasing the separation distance by somefactor, the separation time will be increased as the square ofthat factor. For example, in the microchip used in this studywith a 7.5-cm separation distance, the pDMA1 matrixsequenced !31% more bases than POP-7TM. For POP-7TM,the extrapolated separation distance required to achieve 570bases would be 12.9 cm, requiring approximately 8.6 mincompared with 6.6 min in the pDMA1 matrix used in the7.5 cm chip, resulting in a 32% increase in separation time.Over 24 h of electrophoresis time, then, 218 runs in thepDMA1 matrix per separation channel would be possibleversus 167 runs in POP-7TM, resulting in greater than 29 000more bases sequenced per channel over that time period.
Table 4. Sequencing performance of POP-6TM matrix withdifferent dynamic polymer coatings
Coating Average readlengtha) (n5 4)
Long readlengtha)
Timeb)
(min)
pHEA 677768 757 60POP-6TM 633742 692 60
a) All reads given at 98.5% accuracy.b) Time required for last DNA sequencing fragment to elute from
capillary.
Table 5. Comparison of sequencing read lengths and sequen-cing times between custom pDMA formulations andcommercially available matricesa)
Sequencing matrix Average readlengthb) (n5 5)
Longest readlengthb)
Timec)
(min)
pDMA1 576710 583 6.7PDMA2 573716 591 6.9POP-5TM 378713 378 6.1POP-6TM 417716 440 8.0POP-7TM 434716 454 4.5LongReadTM LPA o300 318 5.2
a) Conditions: temperature: 501C; electric field: 235 V/cm;separation length: 7.5 cm; channel coating: pHEA; current:!3 mA.
b) Read lengths given at 98.5% accuracy.c) Time is given for average read length except for Long
ReadTM matrix, for which the time for the longest readlength is given.
Electrophoresis 2008, 29, 4652–46624658 C. P. Fredlake et al.
& 2008 WILEY-VCH Verlag GmbH & Co. KGaA, Weinheim www.electrophoresis-journal.com
Figure 5. This processed sequencing electropherogram for the pDMA2 matrix on the microchip provides a read length of 591 bases at98.5% accuracy. This trace and all microchip-sequencing experiments were run at a temperature of 501C, an electric field of 235 V/cm,separation distance of 7.5 cm, and pHEA dynamic wall coating.
Electrophoresis 2008, 29, 4652–4662 Microfluidics and Miniaturization 4659
& 2008 WILEY-VCH Verlag GmbH & Co. KGaA, Weinheim www.electrophoresis-journal.com

3.4 Comparing pHEA and POPTM coatings inmicrochips
In addition to comparing the sequencing performance ofthe matrices, read lengths in one of the commercialmatrices, POP-5TM, were determined using both the pHEAand POPTM dynamic coatings. As discussed above, thePOPTM polymers are sold as self-coating matrices such thatwhen the matrices are loaded into the chip the polymershould dynamically coat the channels. All POPTM matricesare used as self-coating matrices on the ABI instrument asdiscussed earlier, and for these experiments, POP-5TM wasloaded into an uncoated Micronit chip for sequencingfragment separation. Table 6 presents the read lengthsobtained in the POP-5TM matrix both when POP-5TM itselfis used as the coating and when the chip is pre-coated withpHEA. The results show that POP-5TM is completelyineffective as a self-coating matrix in these chips, whereasthe application of pHEA prior to matrix loading leads to readlengths close to 400 bases.
Glass chemistries in the chips and capillaries used inthis study are different. The capillaries are made from fusedsilica while the glass used for the chips contain a significantamount of salts such as sodium borate. In the chip fabri-cation process, the salts lower the glass melting temperatureso that bonding of the chips to the cover plate can becompleted at lower temperatures. The presence of salts andother impurities can affect the interaction between the glasssurface and a polymer, potentially altering its efficacy as adynamic coating. Wall coatings compatible with microchipglass chemistries are obviously required for robust sequen-cing performance in these chips. Borosilicate glass chips areeasier to produce and thereby cheaper than fused-silica
chips, and are very commonly used for many microchipseparations. The issue of chip/coating compatibility must bekept in mind as other glass chemistries, such as soda lime,are introduced, and as plastic chips are further developed asDNA separation and sequencing substrates [37, 38, 46].Depending on chip material chemistry, microchip surfacecoatings will have to be developed specifically to the chipsubstrate that is used, and current commercially availablematerials may not be the best solution.
3.5 Comparing matrix performance in chips withmatrix performance in capillaries
The relative sequencing performances for these matricesdiffer greatly on the capillary and microchip platforms. Ineither the ABI 3100 or the MegaBace 1000, the commercialmatrices tested here easily deliver 600–700 base reads in anhour or two. Interestingly, the pDMA matrices formulatedin our laboratory also deliver long sequencing reads in alittle over 20 min. In the chips, however, these pDMAmatrices deliver much higher sequencing read lengths thanthe commercial matrices. These results suggest that, muchlike surface coatings, the materials developed for sequen-cing in capillary arrays will not be the optimal materials forDNA sequencing in microchip systems. Thus, new sequen-cing matrices developed and optimized specifically formicrochip-based sequencing systems are needed.
As mentioned above, the main difference betweencapillary and microchip systems is the sample injectionscheme. The injection method determines the initial sampleplug width, which contributes to the overall efficiency of theseparation [47]. In microchips, the geometry of the crossinjector or offset T injector approximately defines the widthof the sample plug resulting in plug widths of the order of100–200 mm. CAE instruments inject the sample DNA viadirect electrokinetic injection from the sample well into thecapillary. The injection must be long enough to reach aconcentration in the capillary so that the fluorescence can bedetected with high signal to noise, but the sample plugwidth, winj, also increases with time, tinj, as
Winj ¼ m" Einj " tinj ð1Þ
where Einj is the injection electric field strength and m is theDNA mobility at Einj. Equation (1) shows that the sample
Table 6. Comparison of sequencing performance using differentdynamic coatings on borosilicate chips with POP-5TM
sequencing matrix
Coating Average readlengtha) (n5 5)
Longest readlengtha)
pHEA 384718 430POP-5TM b) o50 N/A
a) Read lengths given at 98.5% accuracy.b) No precoating of chip; matrix loaded onto uncoated chip.
300 400 500 600 700
0.8
1.0
1.2
1.4
1.6
1.8
2.0
2.2V
eloc
ity (
cm/m
in)
DNA size (bases)
POPTM-7 pDMA1 pDMA2 LongReadTM
POPTM-5
POPTM-6
Figure 6. The speeds of ssDNA fragments are shown for thedifferent matrices used for sequencing in this study. Allconditions are identical to those in Fig. 5. Since the DNA velocityis assumed to be constant throughout the separation, therequired sequencing time can be calculated for a givenseparation distance, assuming that the distance is long enoughto resolve DNA fragments differing in size by one base.
Electrophoresis 2008, 29, 4652–46624660 C. P. Fredlake et al.
& 2008 WILEY-VCH Verlag GmbH & Co. KGaA, Weinheim www.electrophoresis-journal.com

plug width, and thus the separation efficiency, depends onthe mobility of the DNA during injection, which is directlyrelated to the properties of the polymer matrix. In capillary-based separations for DNA sequencing, the sample plugwidth can be of the order of 1 mm and is generally thedominant factor contributing to eluted peak widths for theseparations. In microchip-based separations, the matrixdoes not greatly affect the plug width during injection. Sincethe initial plug widths are smaller, the separation efficiency isdominated by other factors such as field-induced dispersionor analyte–wall interactions. Thus, different parameters rela-ted to the separation matrix and wall coating may limit theefficiency of the separations depending on the platform, sothat the dependence of resolution on a matrix will not followthe same trends in capillary and microchip separations.
4 Conclusions
The development of high-performance polymer matrices andcoatings has been one of the major obstacles in thedevelopment of a microchip-based commercial system forSanger-based DNA sequencing. A long-held assumption wasthat the polymer materials available commercially forcapillary-based systems could be easily transferred to micro-fabricated systems. However, we have shown here that thisassumption is invalid and the development of materials foruse exclusively on microchip electrophoresis platforms isnecessary to make these instruments a practical reality.
In this paper we also have demonstrated that sequen-cing matrices and channel wall coatings developed onmicrochip electrophoresis platforms can deliver longer readlengths in less time than the matrices and coatings that arecurrently commercially available for CAE instruments. Atthe same channel length, our matrices deliver over 150 moresequenced bases than the POPTM matrices from ABI andover 250 more sequenced bases than the LongReadTM
matrix from Amersham. For development of new polymermatrices for microchannel systems, optimization of thematerials must be completed on microfabricated systems, asmatrix-sequencing performance is not identical in capil-laries and microchips. In addition to matrix performance,the difference in glass chemistries between the fused silicaused in capillaries and the borosilicate glass used for chipfabrication can lead to varying wall coating–channel surfacecompatibility. Thus, coatings must be developed specificallyfor the chip substrate chemistry as well.
This work was supported by grant ] 2 R01 HG001970-07from the National Human Genome Research Institute of theNational Institute of Health. However, the views expressed inthis paper are solely the responsibility of the authors and do notnecessarily represent the official views of the National HumanGenome Research Institute or the National Institute of Health.
The authors have declared no financial or commercialconflict of interest.
5 References
[1] Lander, E. S., Linton, L. M., Birren, B., Nusbaum, C.et al., Nature 2001, 409, 860–921.
[2] Venter, J. C., Adams, M. D., Myers, E. W., Li, P. W. et al.,Science 2001, 291, 1304–1354.
[3] Gibbs, R. A., Rogers, J., Katze, M. G., Bumgarner, R.et al., Science 2007, 316, 222–234.
[4] Mikkelsen, T. S., Hillier, L. W., Eichler, E. E., Zody, M. C.et al., Nature 2005, 437, 69–87.
[5] Bussell, J. J., Pearson, N. M., Kanda, R., Filatov, D. A.,Lahn, B. T., Gene 2006, 368, 94–100.
[6] Harris, R. A., Rogers, J., Milosavljevic, A., Science 2007,316, 235–237.
[7] Newman, T. L., Tuzun, E., Morrison, V. A., Hayden, K. E.et al., Genome Res. 2005, 15, 1344–1356.
[8] Perry, G. H., Tchinda, J., McGrath, S. D., Zhang, J. J.et al., Proc. Natl. Acad. Sci. USA 2006, 103, 8006–8011.
[9] Zhao, S. Y., Shetty, J., Hou, L. H., Delcher, A. et al.,Genome Res. 2004, 14, 1851–1860.
[10] Check, E., Nature 2005, 437, 1084–1086.
[11] Gonzalez, E., Kulkarni, H., Bolivar, H., Mangano, A. et al.,Science 2005, 307, 1434–1440.
[12] Recommendation for a Human Cancer GenomeProject. Report of the Working Group on BiomedicalTechnology. February 2005. http://www.genome.gov/15015123
[13] NIH News Release. NHGRI Seeks Next Generation ofSequencing Technologies. 10 October 2004.http://genome.gov/12513210
[14] Cohen, A. S., Najarian, D. R., Karger, B. L., J.Chromatogr. 1990, 516, 49–60.
[15] Dovichi, N. J., Electrophoresis 1997, 18, 2393–2399.
[16] Hunkapiller, T., Kaiser, R. J., Koop, B. F., Hood, L.,Science 1991, 254, 59–67.
[17] Smith, L. M., Sanders, J. Z., Kaiser, R. J., Hughes, P.et al., Nature 1986, 321, 674–679.
[18] Mardis, E. R., Personal Communication 2006.
[19] Chan, E. Y., Mutat. Res. 2005, 573, 13–40.
[20] Margulies, M., Egholm, M., Altman, W. E., Attiya, S.et al., Nature 2005, 437, 376–380.
[21] Shendure, J., Porreca, G. J., Reppas, N. B., Lin, X. X.et al., Science 2005, 309, 1728–1732.
[22] Blazej, R. G., Kumaresan, P., Mathies, R. A., Proc. Natl.Acad. Sci. USA 2006, 103, 7240–7245.
[23] Paegel, B. M., Yeung, S. H. I., Mathies, R. A., Anal.Chem. 2002, 74, 5092–5098.
[24] Zhou, H. H., Miller, A. W., Sosic, Z., Buchholz, B. et al.,Anal. Chem. 2000, 72, 1045–1052.
[25] Doherty, E. A. S., Kan, C. W., Barron, A. E., Electro-phoresis 2003, 24, 4170–4180.
[26] Doherty, E. A. S., Kan, C. W., Paegel, B. M., Yeung,S. H. I. et al., Anal. Chem. 2004, 76, 5249–5256.
[27] Hjerten, S., J. Chromatogr. 1985, 347, 191–198.
[28] Chiari, M., Riva, S., Gelain, A., Vitale, A., Turati, E.,J. Chromatogr. A 1997, 781, 347–355.
Electrophoresis 2008, 29, 4652–4662 Microfluidics and Miniaturization 4661
& 2008 WILEY-VCH Verlag GmbH & Co. KGaA, Weinheim www.electrophoresis-journal.com
[29] Heller, C., Electrophoresis 1998, 19, 3114–3127.
[30] Madabhushi, R. S., Electrophoresis 1998, 19, 224–230.
[31] Doherty, E. A. S., Berglund, K. D., Buchholz, B. A.,Kourkine, I. V. et al., Electrophoresis 2002, 23,2766–2776.
[32] Koutny, L., Schmalzing, D., Salas-Solano, O., El-Difrawy, S.et al., Anal. Chem. 2000, 72, 3388–3391.
[33] Liu, S. R., Shi, Y. N., Ja, W. W., Mathies, R. A., Anal.Chem. 1999, 71, 566–573.
[34] Paegel, B. M., Emrich, C. A., Weyemayer, G. J., Scherer,J. R., Mathies, R. A., Proc. Natl. Acad. Sci. USA 2002, 99,574–579.
[35] Salas-Solano, O., Schmalzing, D., Koutny, L.,Buonocore, S. et al., Anal. Chem. 2000, 72, 3129–3137.
[36] Schmalzing, D., Adourian, A., Koutny, L., Ziaugra, L.et al., Anal. Chem. 1998, 70, 2303–2310.
[37] Shi, Y. N., Electrophoresis 2006, 27, 3703–3711.
[38] Shi, Y. N., Anderson, R. C., Electrophoresis 2003, 24,3371–3377.
[39] Fredlake, C. P., Hert, D. G., Kan, C. W., Cheisl, T. N. et al.,Proc. Natl. Acad. Sci. USA 2008, 105, 476–481.
[40] Chiesl, T. N., Shi, W., Barron, A. E., Anal. Chem. 2005,77, 772–779.
[41] Albarghouthi, M., Buchholz, B. A., Doherty, E. A. S.,Bogdan, F. M. et al., Electrophoresis 2001, 22,737–747.
[42] Goetzinger, W., Kotler, L., Carrilho, E., Ruiz-Martinez,M. C. et al., Electrophoresis 1998, 19, 242–248.
[43] Salas-Solano, O., Carrilho, E., Kotler, L., Miller, A. W.et al., Anal. Chem. 1998, 70, 3996–4003.
[44] Jacobson, S. C., Hergenroder, R., Koutny, L. B., Ramsey,J. M., Anal. Chem. 1994, 66, 1114–1118.
[45] Heller, C., Electrophoresis 2000, 21, 593–602.
[46] Llopis, S. D., Stryjewski, W., Soper, S. A.,Electrophoresis 2004, 25, 3810–3819.
[47] Luckey, J. A., Norris, T. B., Smith, L. M., J. Phys. Chem.1993, 97, 3067–3075.
Electrophoresis 2008, 29, 4652–46624662 C. P. Fredlake et al.
& 2008 WILEY-VCH Verlag GmbH & Co. KGaA, Weinheim www.electrophoresis-journal.com