plink gplink haploviewibg · plink gplink haploview whole genome association software tutorial ......
TRANSCRIPT
PLINK tutorial, December 2006; Shaun Purcell, [email protected]
PLINKgPLINK
HaploviewWhole genome association
software tutorial
Shaun PurcellCenter for Human Genetic Research, Massachusetts General Hospital, Boston, MABroad Institute of Harvard & MIT, Cambridge, MA
http://pngu.mgh.harvard.edu/purcell/plink/
http://www.broad.mit.edu/mpg/haploview/

PLINK tutorial, December 2006; Shaun Purcell, [email protected]
PLINK tutorial, December 2006; Shaun Purcell, [email protected]
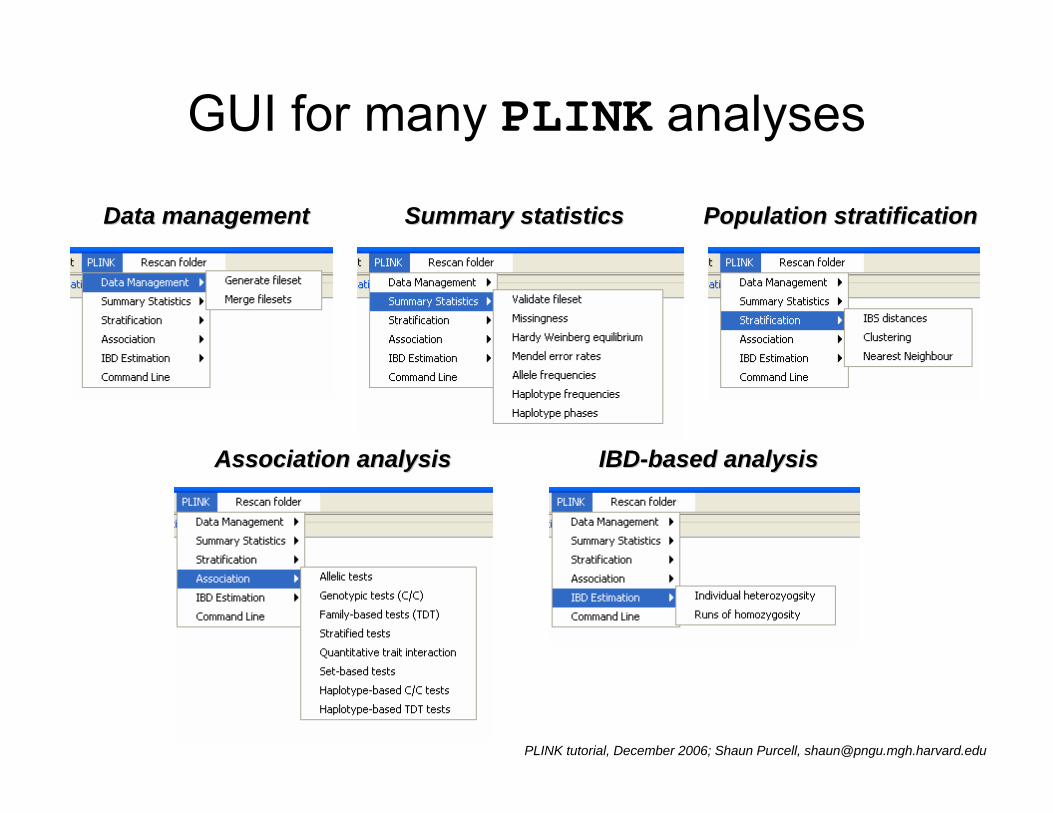
GUI for many PLINK analyses
Data managementData management Summary statisticsSummary statistics Population stratificationPopulation stratification
Association analysisAssociation analysis IBDIBD--based analysisbased analysis
PLINK tutorial, December 2006; Shaun Purcell, [email protected]
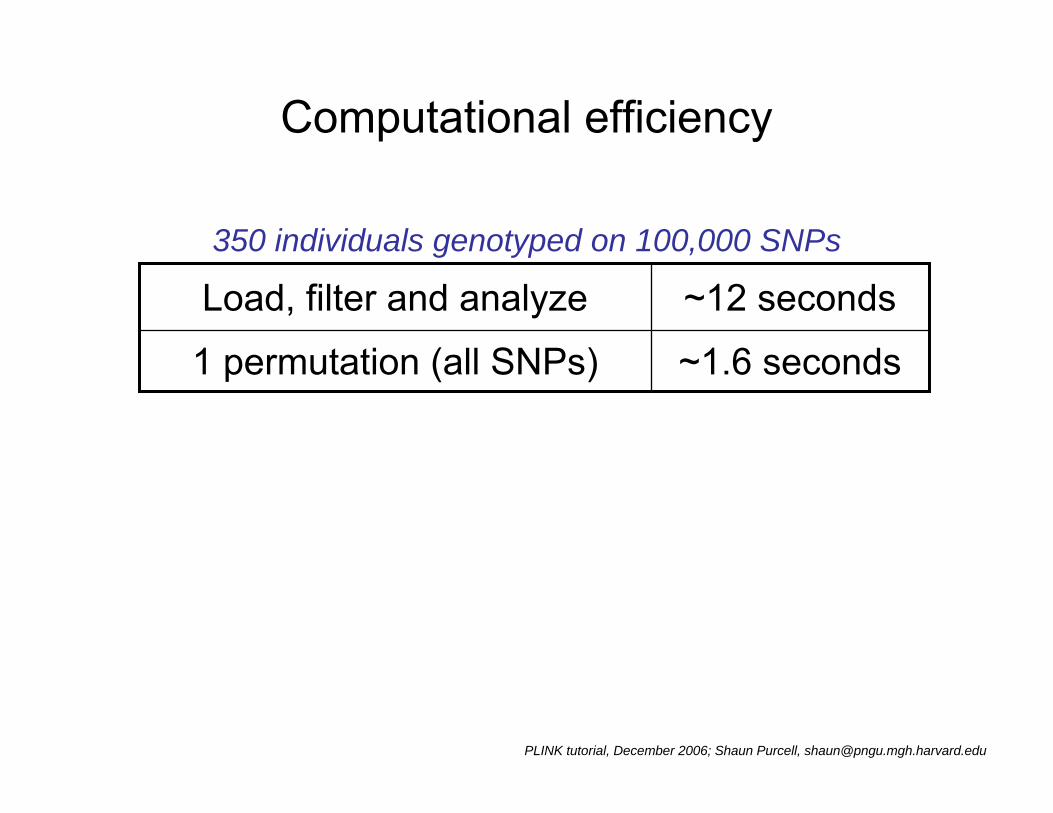
Computational efficiency
~11 minutesLoad and filter binary PED file
~5 minutesBasic association analysis
~68 minutesLoad PED file,
generate binary PED file
5000 individuals genotyped on 500,000 SNPs
~1.6 seconds1 permutation (all SNPs)
~12 secondsLoad, filter and analyze350 individuals genotyped on 100,000 SNPs
PLINK tutorial, December 2006; Shaun Purcell, [email protected]
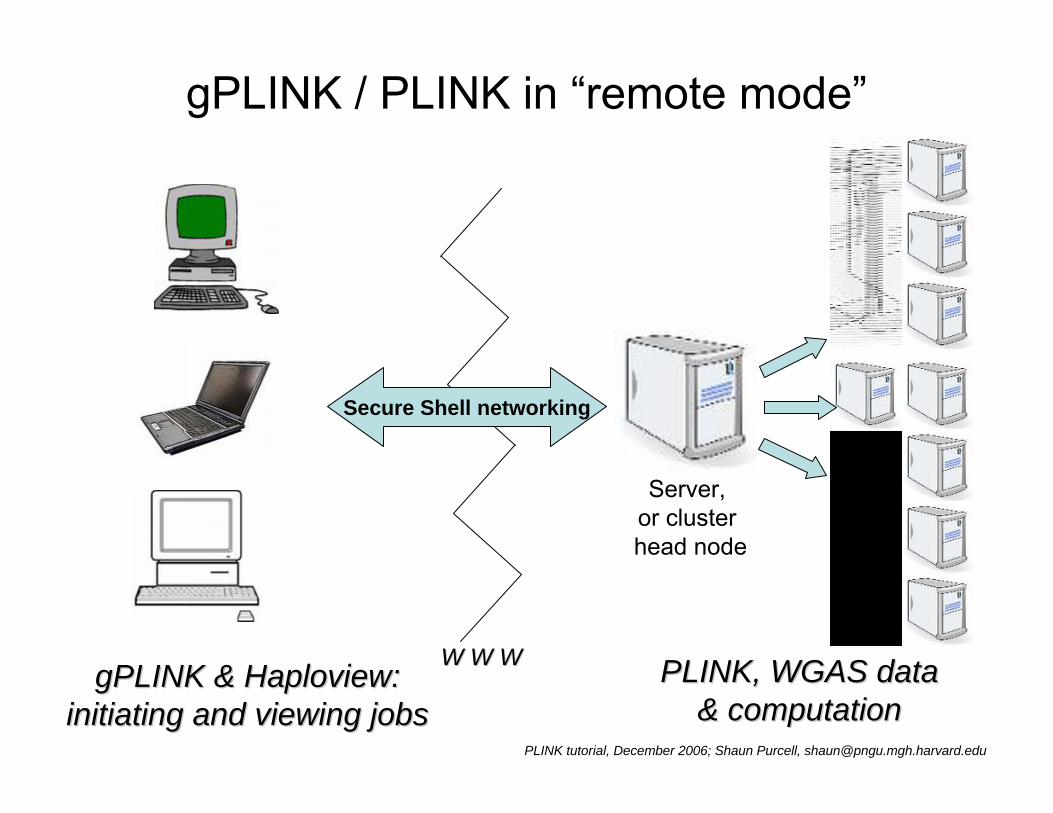
gPLINK / PLINK in “remote mode”
Server, or cluster head node
PLINK, WGAS dataPLINK, WGAS data& computation& computation
gPLINKgPLINK & & HaploviewHaploview::initiating and viewing jobsinitiating and viewing jobs
W W WW W W
Secure Shell networking
PLINK tutorial, December 2006; Shaun Purcell, [email protected]
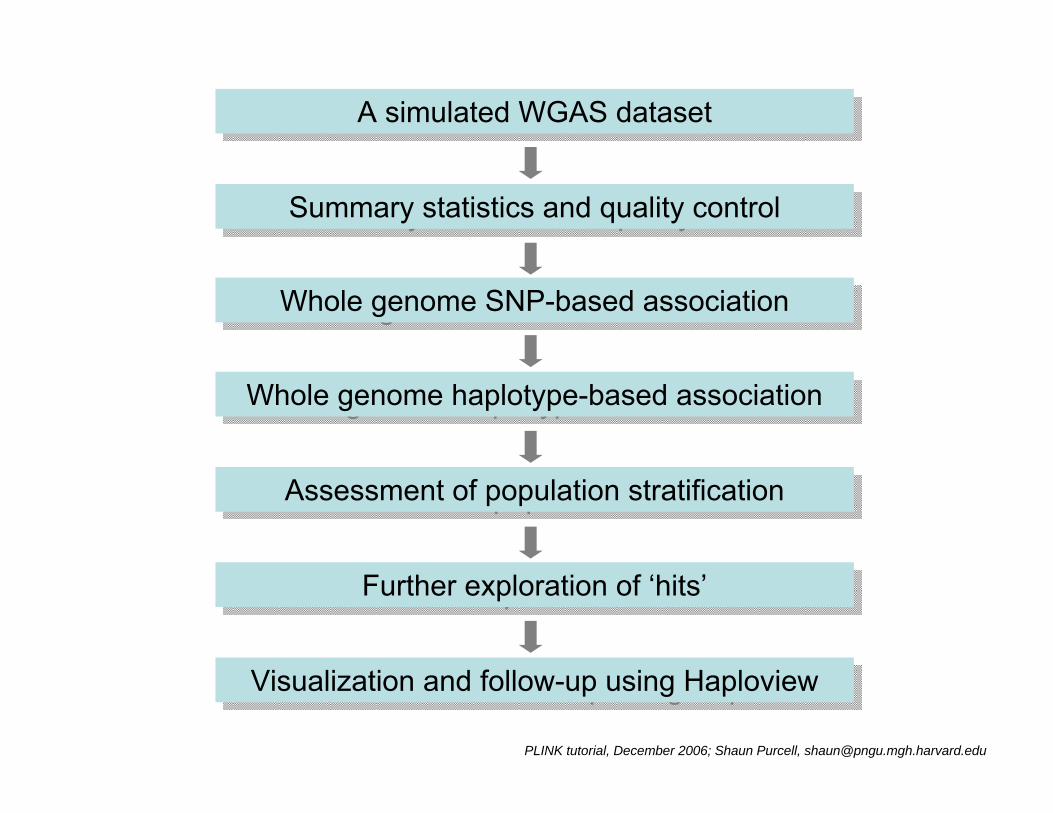
Summary statistics and quality controlSummary statistics and quality control
Whole genome haplotype-based association Whole genome haplotype-based association
Assessment of population stratificationAssessment of population stratification
Further exploration of ‘hits’Further exploration of ‘hits’
Visualization and follow-up using HaploviewVisualization and follow-up using Haploview
Whole genome SNP-based associationWhole genome SNP-based association
A simulated WGAS datasetA simulated WGAS dataset

PLINK tutorial, December 2006; Shaun Purcell, [email protected]
In this practical, we will use gPLINK, PLINK and Haploview to…
… examine genotyping rates and look for non-random missing data
… determine SNP frequencies and test Hardy-Weinberg equilibrium
… assess population stratification via clustering, genomic control
… test for allelic, genotypic and haplotypic association
… perform stratified analyses, conditioning on population strata
… assess between-stratum heterogeneity in association signal
… examine linkage disequilibrium patterns around associated SNPs
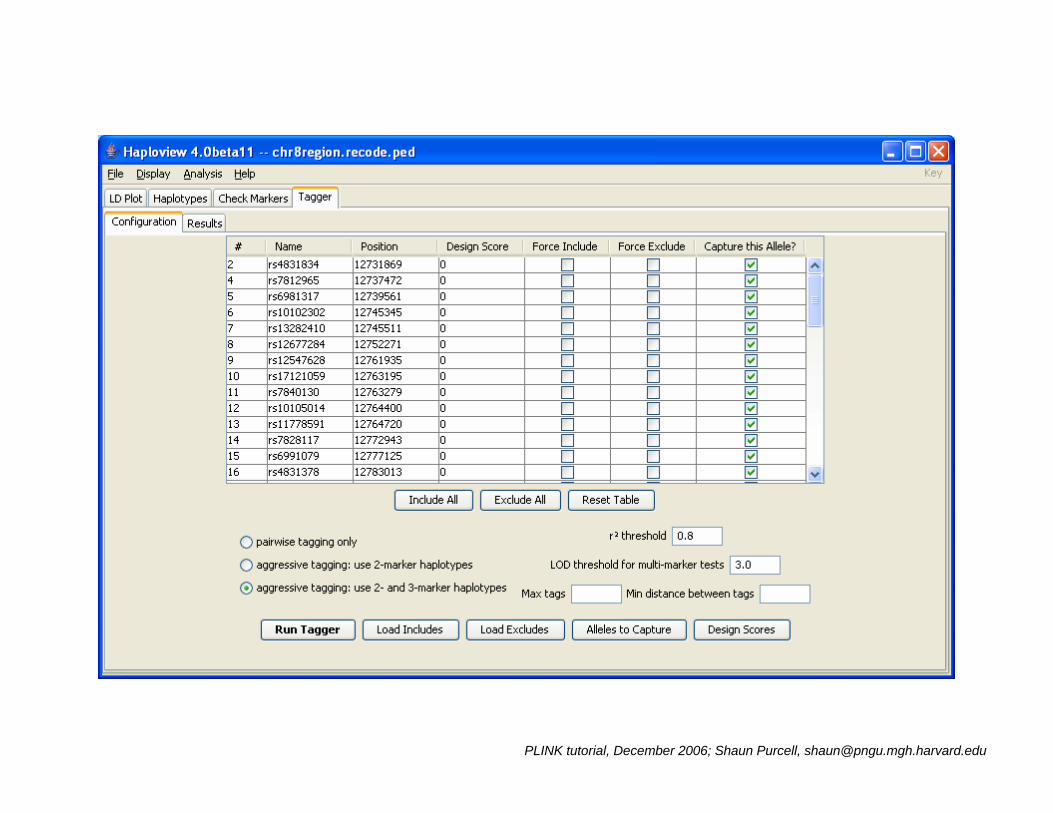
… select tag SNPs for follow-up and replication studies

PLINK tutorial, December 2006; Shaun Purcell, [email protected]
Simulated WGAS dataset
• Real genotypes, but a simulated “disease”
• 90 Asian HapMap individuals– 10K autosomal SNPs from Affymetrix 500K product
• Simulated quantitative phenotype; median split to create a disease phenotype
• Illustrative, not realistic!
PLINK tutorial, December 2006; Shaun Purcell, [email protected]
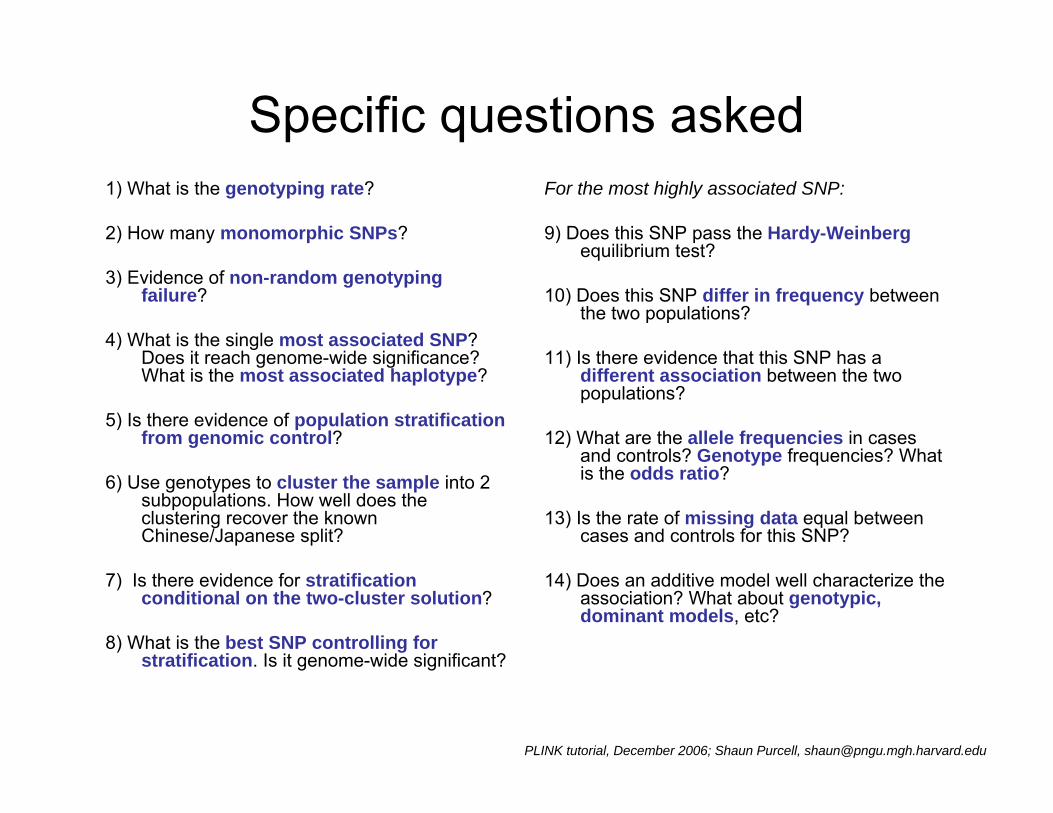
1) What is the genotyping rate?
2) How many monomorphic SNPs?
3) Evidence of non-random genotyping failure?
4) What is the single most associated SNP? Does it reach genome-wide significance? What is the most associated haplotype?
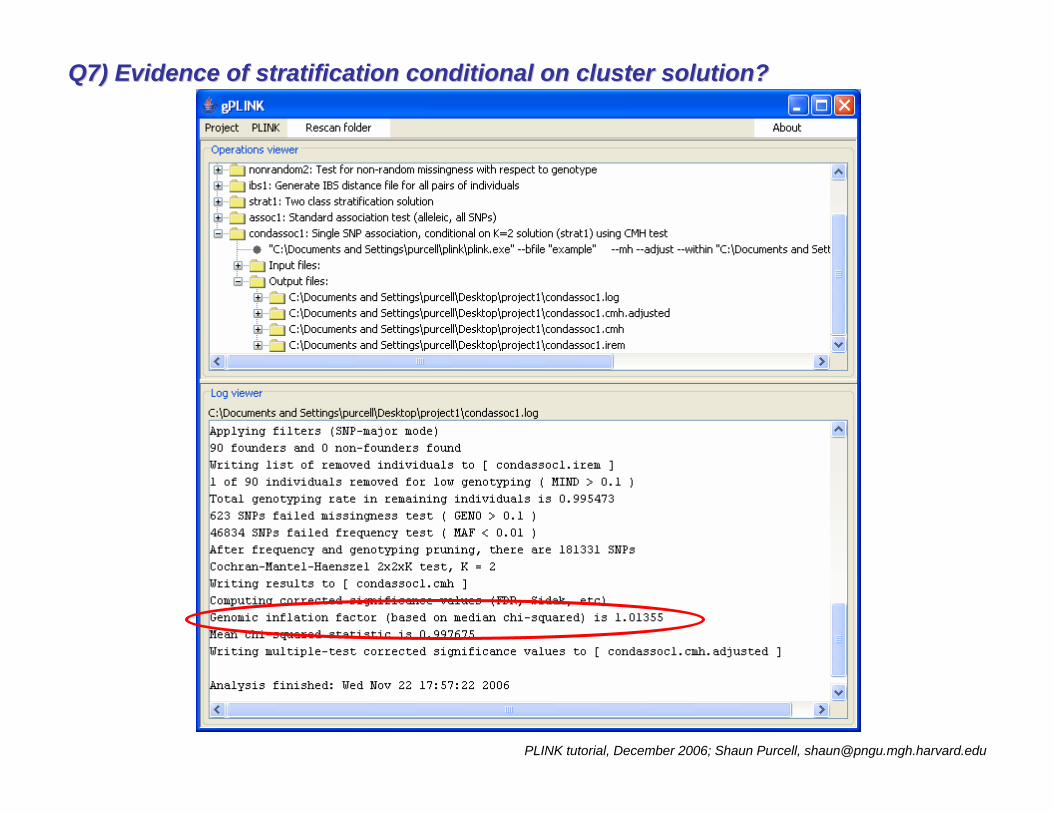
5) Is there evidence of population stratification from genomic control?
6) Use genotypes to cluster the sample into 2 subpopulations. How well does the clustering recover the known Chinese/Japanese split?
7) Is there evidence for stratification conditional on the two-cluster solution?
8) What is the best SNP controlling for stratification. Is it genome-wide significant?
For the most highly associated SNP:
9) Does this SNP pass the Hardy-Weinbergequilibrium test?
10) Does this SNP differ in frequency between the two populations?
11) Is there evidence that this SNP has a different association between the two populations?
12) What are the allele frequencies in cases and controls? Genotype frequencies? What is the odds ratio?
13) Is the rate of missing data equal between cases and controls for this SNP?
14) Does an additive model well characterize the association? What about genotypic, dominant models, etc?
Specific questions asked

PLINK tutorial, December 2006; Shaun Purcell, [email protected]
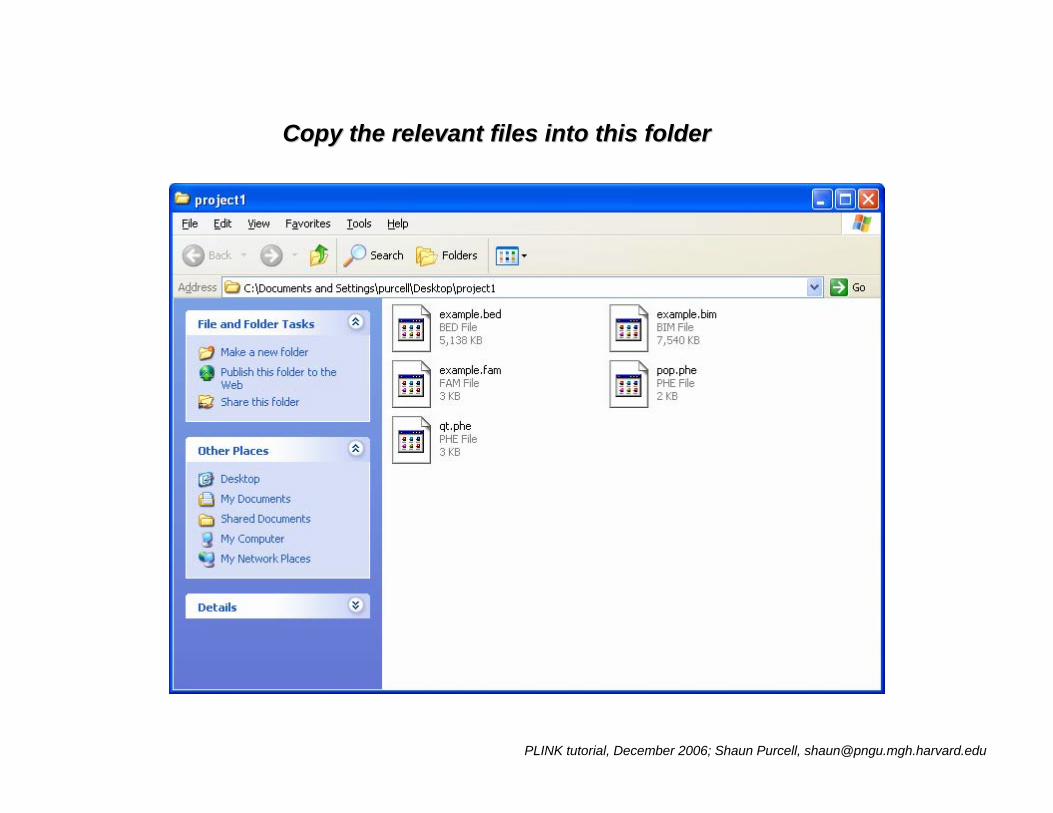
Data used in this practical• Available at http://pngu.mgh.harvard.edu/purcell/affy/purcell.zip
example.bed Binary format genotype information (do not attempt to view in a standard text editor)
example.bim Map file (6 fields: each row is a SNP: chromosome, RS #, genetic position, physical position, allele 1, allele 2)
example.fam Individual information file (first 6 columns of a PED file; disease phenotype is column 6)
pop.phe Chinese/Japanese population indicator (FID, IID, population code)
qt.phe Alternate quantitative trait phenotype file (Family ID, Individual ID, phenotype)
PLINK tutorial, December 2006; Shaun Purcell, [email protected]
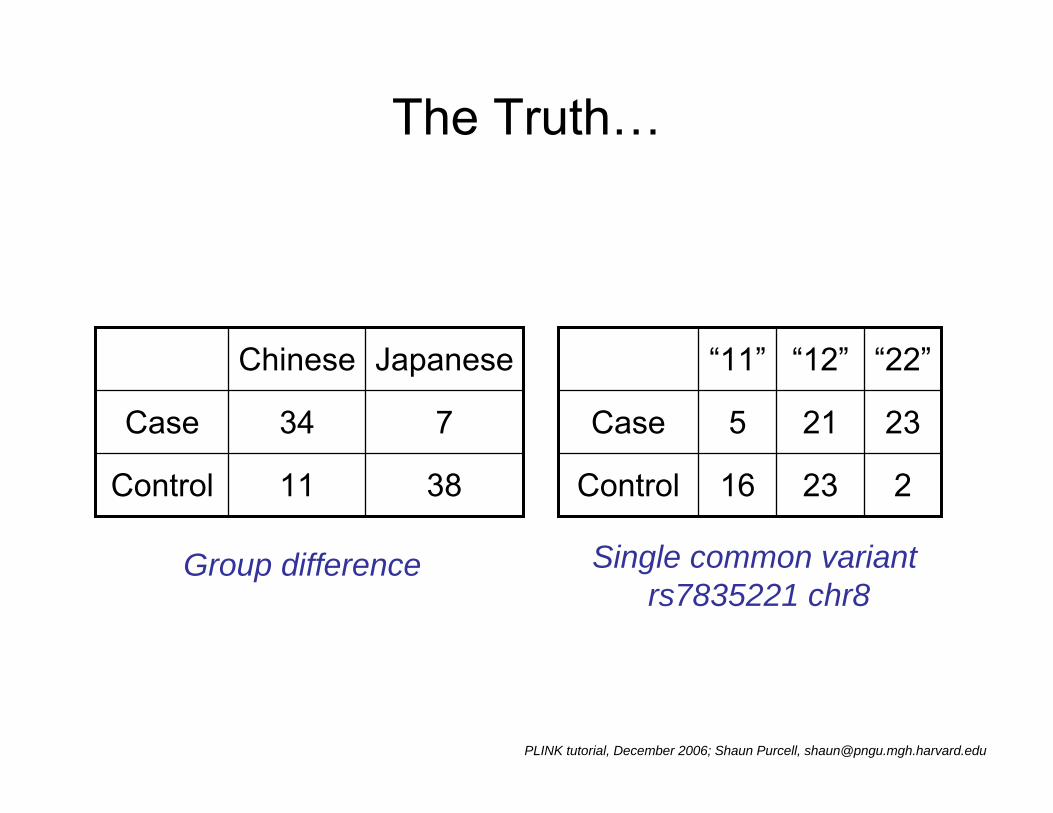
The Truth…
3811Control
734Case
JapaneseChinese
23
21
“12”
216Control
235Case
“22”“11”
Group difference Single common variantrs7835221 chr8

PLINK tutorial, December 2006; Shaun Purcell, [email protected]
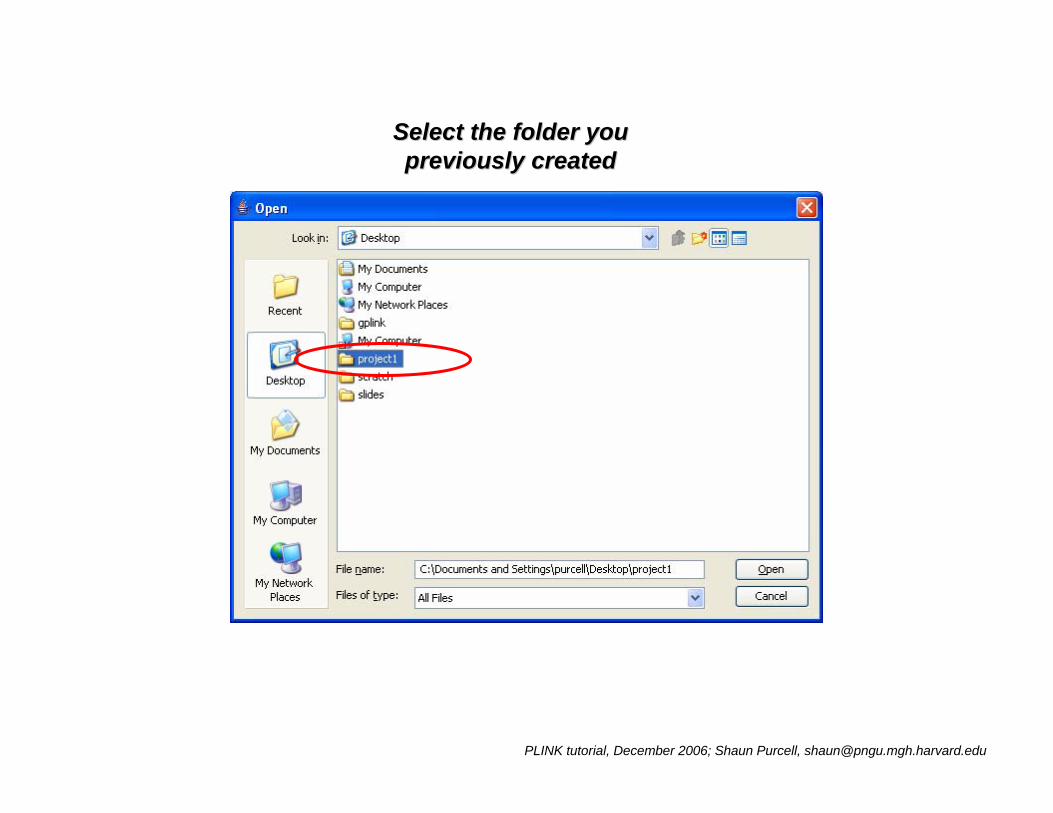
RightRight--click on the Desktop to create click on the Desktop to create a project foldera project folder…… ……and rename it and rename it ““project1project1””
A gPLINK “project” is a folder
PLINK tutorial, December 2006; Shaun Purcell, [email protected]
Copy the relevant files into this folderCopy the relevant files into this folder

PLINK tutorial, December 2006; Shaun Purcell, [email protected]
Start a new Start a new gPLINKgPLINK projectproject
PLINK tutorial, December 2006; Shaun Purcell, [email protected]
Select the folder you Select the folder you previously createdpreviously created
PLINK tutorial, December 2006; Shaun Purcell, [email protected]
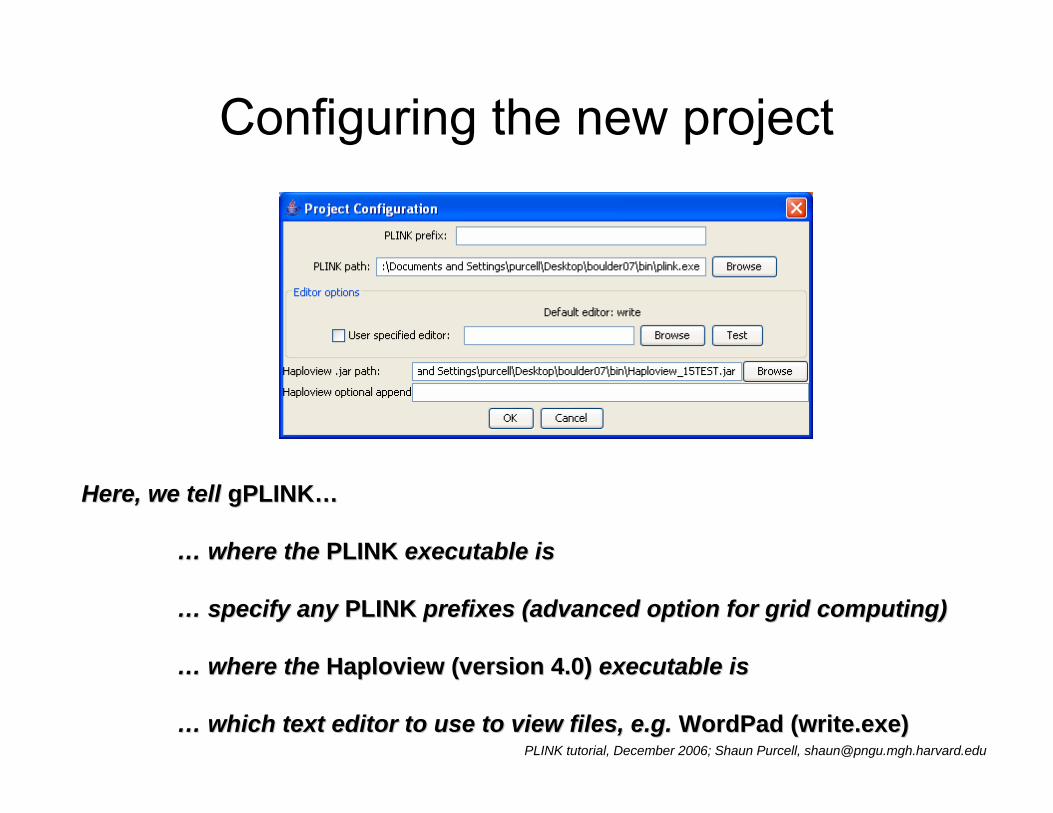
Configuring the new project
Here, we tell Here, we tell gPLINKgPLINK……
…… where the where the PLINK PLINK executable isexecutable is
…… specify any specify any PLINK PLINK prefixes (advanced option for grid computing)prefixes (advanced option for grid computing)
…… where the where the HaploviewHaploview (version 4.0)(version 4.0) executable is executable is
…… which text editor to use to view files, e.g. which text editor to use to view files, e.g. WordPad (WordPad (write.exewrite.exe))

PLINK tutorial, December 2006; Shaun Purcell, [email protected]
Data management
• Recode dataset (A,C,G,T → 1,2)• Reorder dataset• Flip DNA strand• Extract subsets (individuals, SNPs)• Remove subsets (individuals, SNPs)• Merge 2 or more filesets• Compact binary file format

PLINK tutorial, December 2006; Shaun Purcell, [email protected]
Summarizing the data
• Hardy-Weinberg• Mendel errors• Missing genotypes• Allele frequencies
• Tests of non-random missingness– by phenotype and by (unobserved) genotype
• Individual homozygosity estimates• Stretches of homozygosity• Pairwise IBD estimates
PLINK tutorial, December 2006; Shaun Purcell, [email protected]
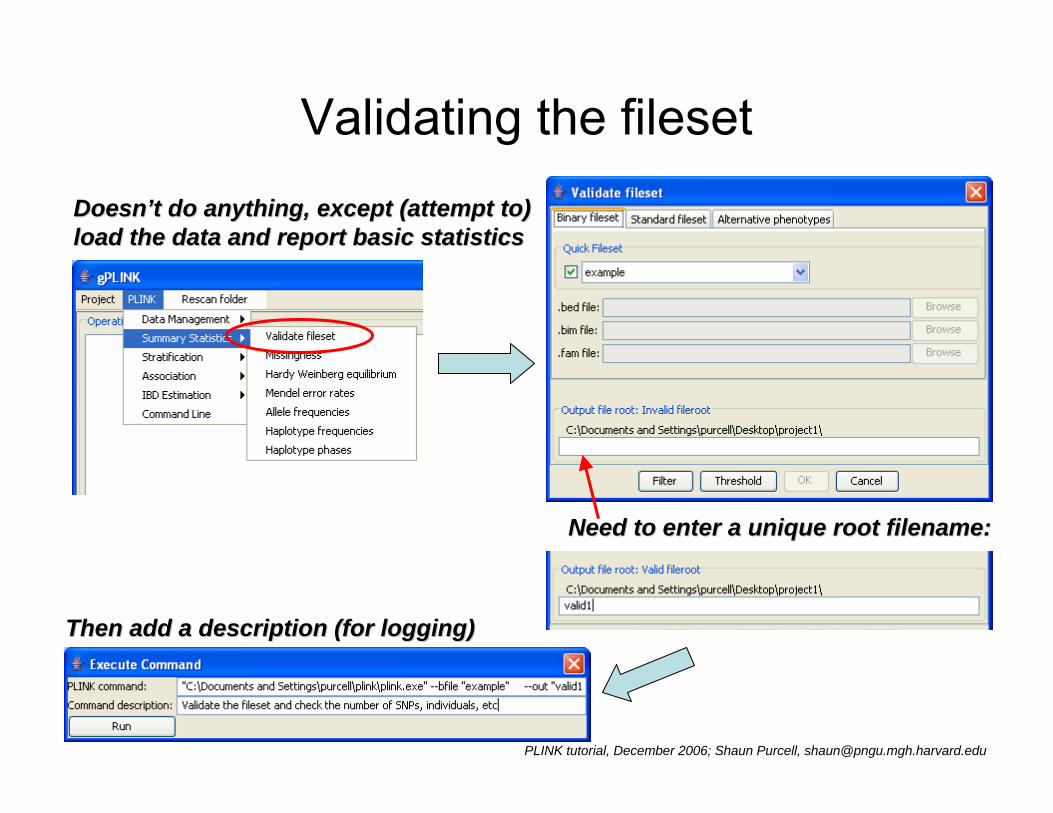
Validating the fileset
Need to enter a unique root filename:Need to enter a unique root filename:
DoesnDoesn’’t do anything, except (attempt to) t do anything, except (attempt to) load the data and report basic statisticsload the data and report basic statistics
Then add a description (for logging)Then add a description (for logging)
PLINK tutorial, December 2006; Shaun Purcell, [email protected]
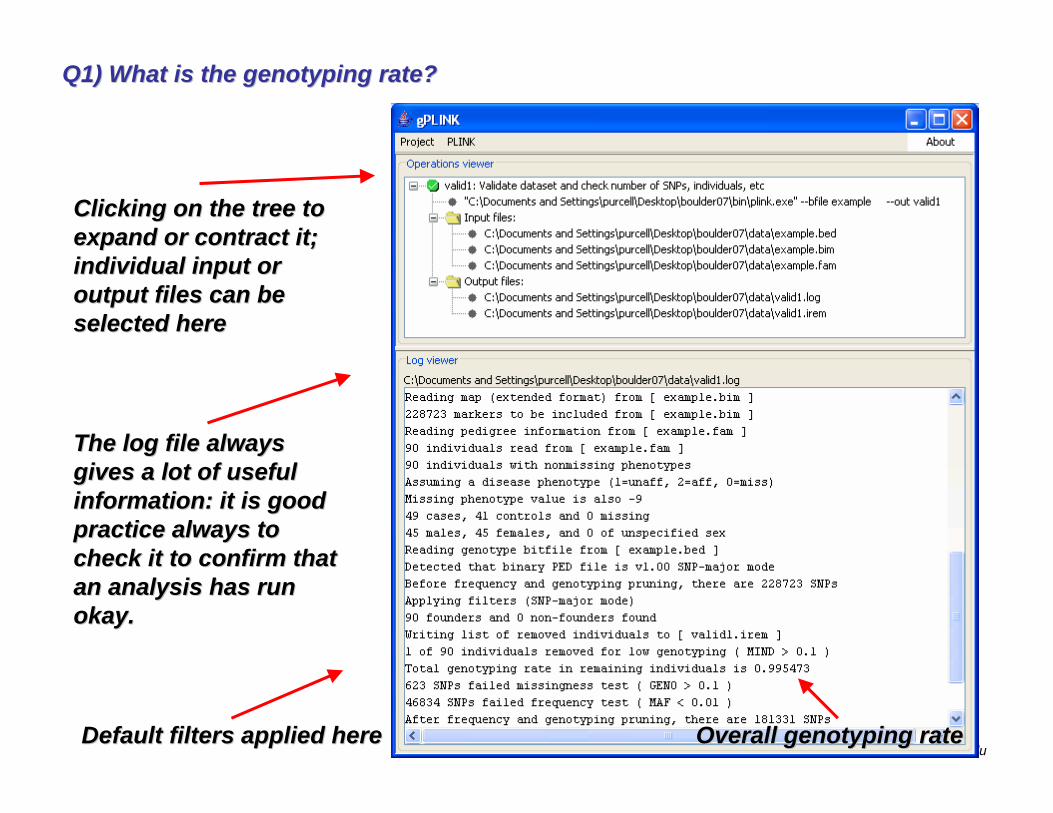
Clicking on the tree to Clicking on the tree to expand or contract it; expand or contract it; individual input or individual input or output files can be output files can be selected hereselected here
The log file always The log file always gives a lot of useful gives a lot of useful information: it is good information: it is good practice always to practice always to check it to confirm that check it to confirm that an analysis has run an analysis has run okay.okay.
Default filters applied hereDefault filters applied here
Q1) What is the genotyping rate?Q1) What is the genotyping rate?
Overall genotyping rateOverall genotyping rate
PLINK tutorial, December 2006; Shaun Purcell, [email protected]
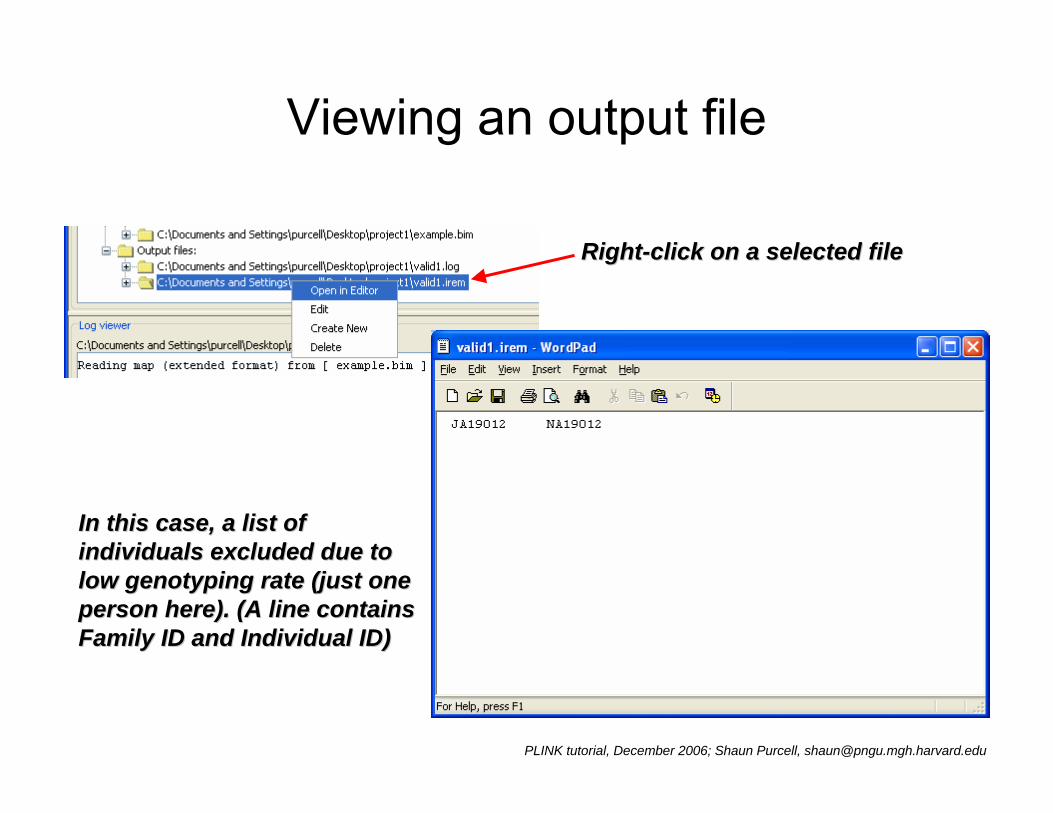
Viewing an output file
In this case, a list of In this case, a list of individuals excluded due to individuals excluded due to low genotyping rate (just one low genotyping rate (just one person here). (A line contains person here). (A line contains Family ID and Individual ID)Family ID and Individual ID)
RightRight--click on a selected fileclick on a selected file
PLINK tutorial, December 2006; Shaun Purcell, [email protected]
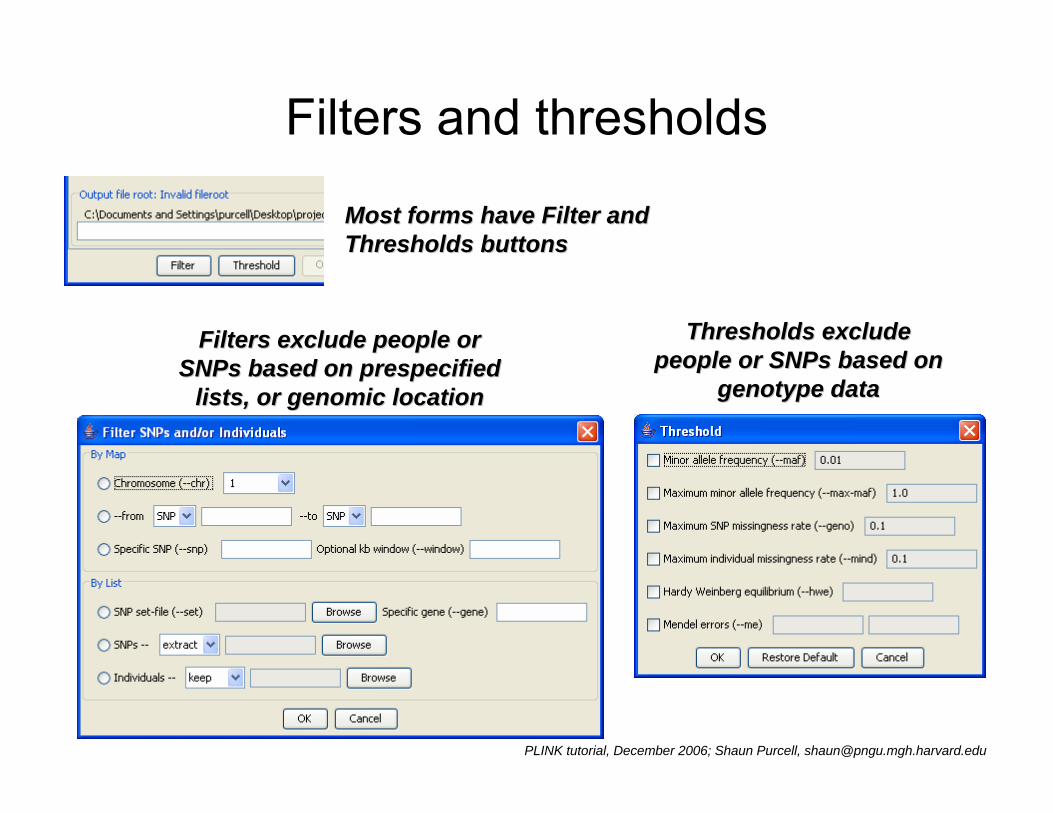
Filters and thresholds
Most forms have Filter and Most forms have Filter and Thresholds buttonsThresholds buttons
Thresholds exclude Thresholds exclude people or people or SNPsSNPs based on based on
genotype datagenotype data
Filters exclude people or Filters exclude people or SNPsSNPs based on based on prespecifiedprespecified
lists, or genomic locationlists, or genomic location

PLINK tutorial, December 2006; Shaun Purcell, [email protected]
Q2) How many Q2) How many monomorphicmonomorphic SNPsSNPs??
We can use thresholds and the Validate We can use thresholds and the Validate filesetfileset option to answer this:option to answer this:

PLINK tutorial, December 2006; Shaun Purcell, [email protected]

PLINK tutorial, December 2006; Shaun Purcell, [email protected]
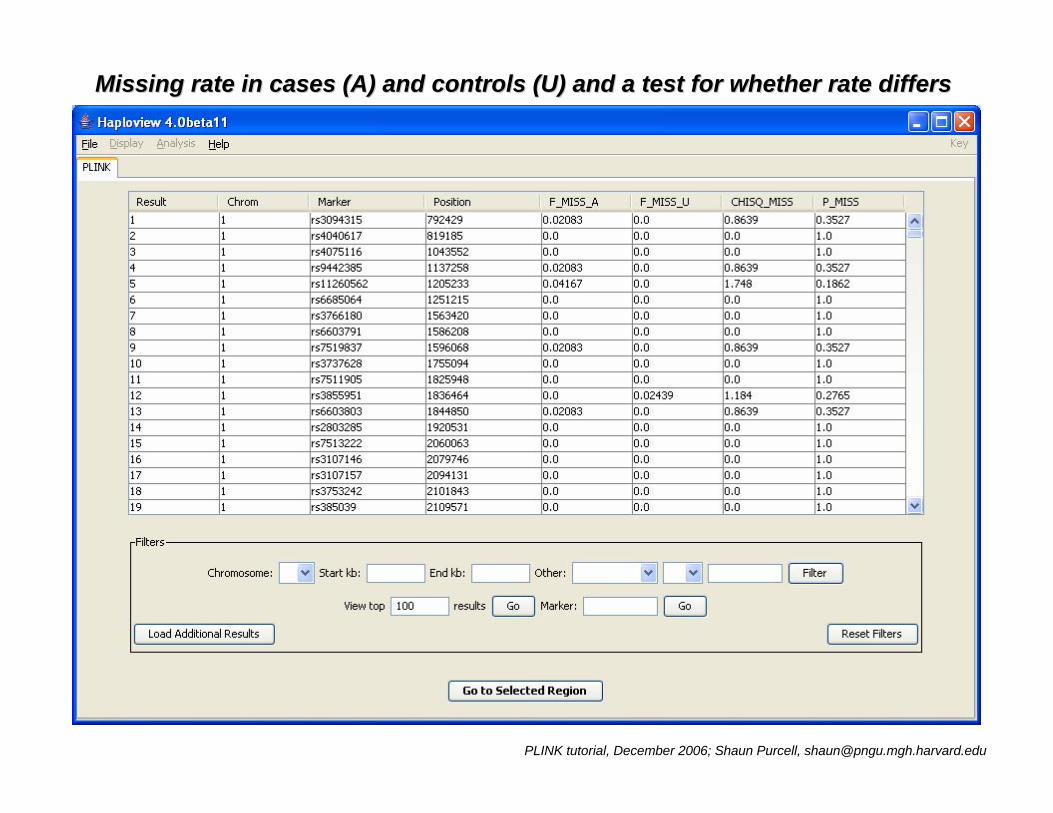
Q3) Evidence of nonQ3) Evidence of non--random genotyping failure?random genotyping failure?
The Summary Statistics/The Summary Statistics/MissingnessMissingness option can answer this:option can answer this:
PLINK tutorial, December 2006; Shaun Purcell, [email protected]
Missing rate in cases (A) and controls (U) and a test for whetheMissing rate in cases (A) and controls (U) and a test for whether rate differsr rate differs
PLINK tutorial, December 2006; Shaun Purcell, [email protected]
REFER
ENC
E SNP
50%
40%10%
10%20%
70%
GENOTYPED
MISSING
FLAN
KIN
G S
NP
FLAN
KIN
G S
NP
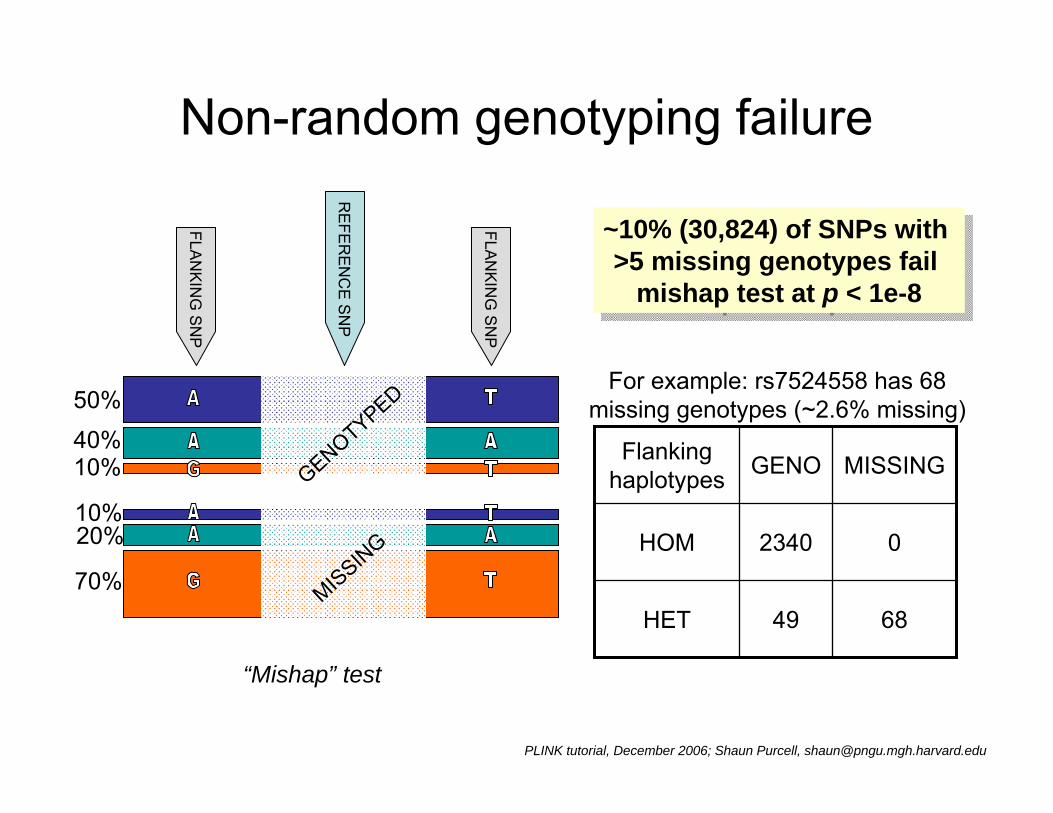
Non-random genotyping failure
“Mishap” test
~10% (30,824) of SNPs with >5 missing genotypes fail
mishap test at p < 1e-8
~10% (30,824) of SNPs with >5 missing genotypes fail
mishap test at p < 1e-8
6849HET
02340HOM
MISSINGGENOFlanking haplotypes
For example: rs7524558 has 68 missing genotypes (~2.6% missing)
PLINK tutorial, December 2006; Shaun Purcell, [email protected]
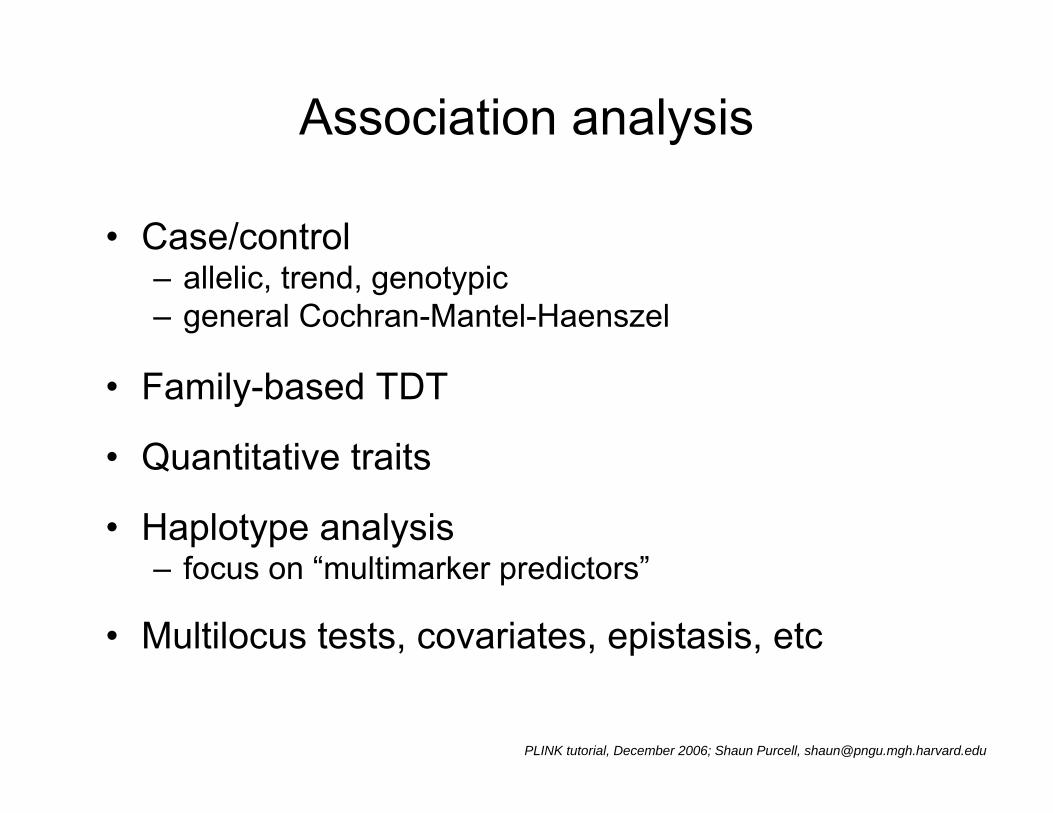
Association analysis
• Case/control– allelic, trend, genotypic– general Cochran-Mantel-Haenszel
• Family-based TDT
• Quantitative traits
• Haplotype analysis– focus on “multimarker predictors”
• Multilocus tests, covariates, epistasis, etc
PLINK tutorial, December 2006; Shaun Purcell, [email protected]
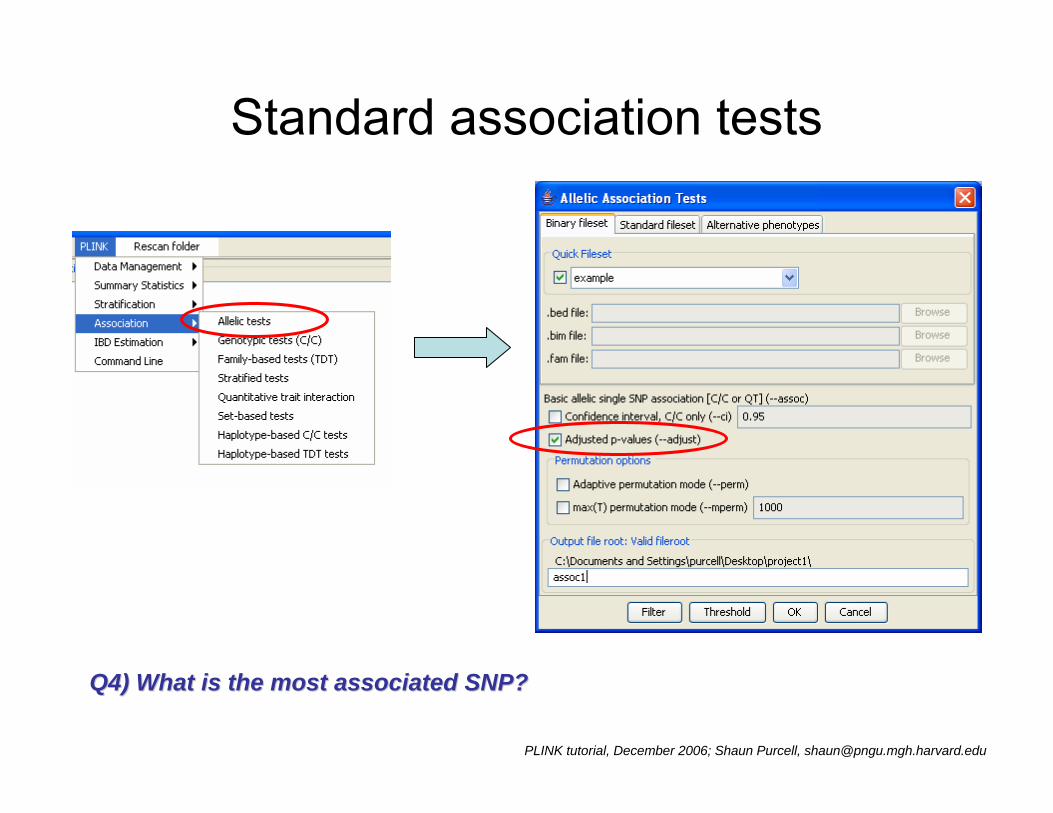
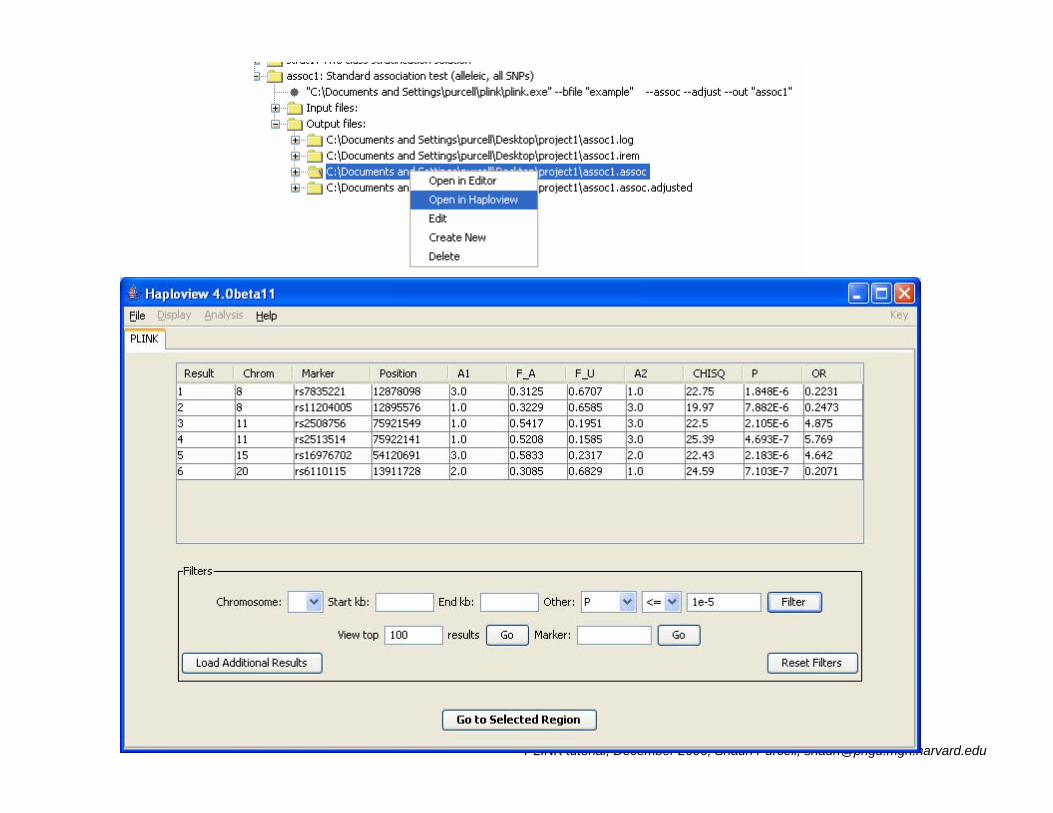
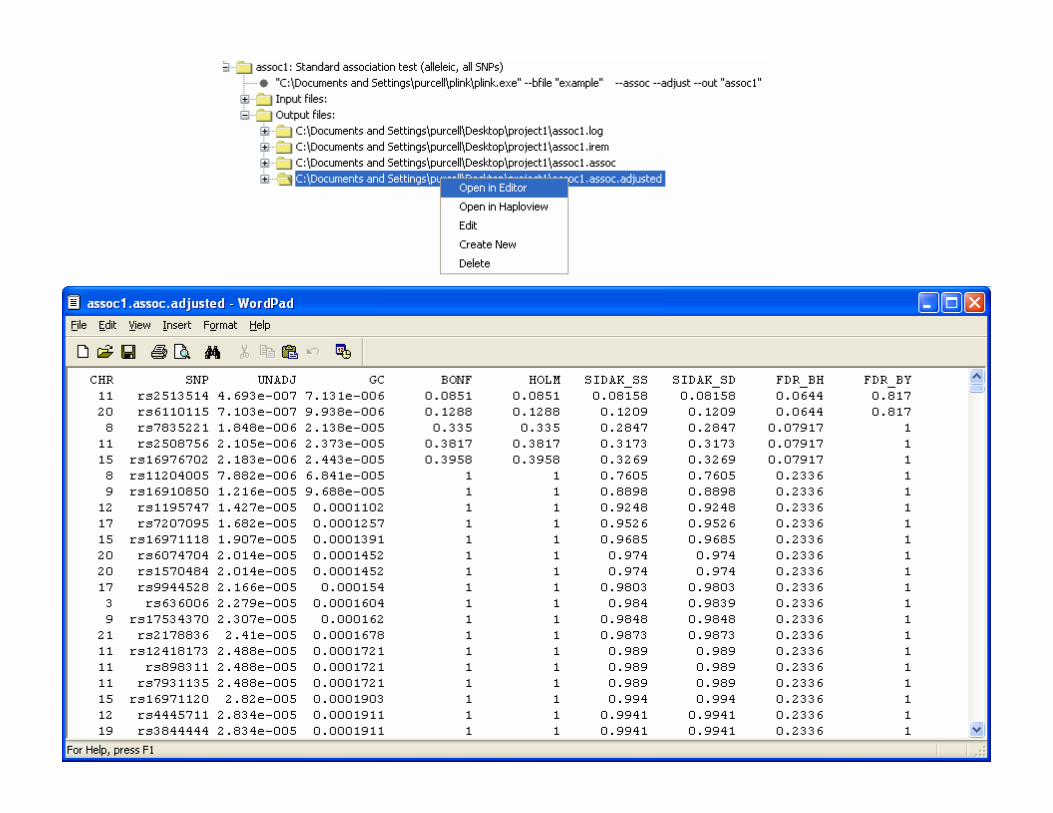
Standard association tests
Q4) What is the most associated SNP?Q4) What is the most associated SNP?

PLINK tutorial, December 2006; Shaun Purcell, [email protected]
Q5) Evidence of stratification from genomic control?Q5) Evidence of stratification from genomic control?

PLINK tutorial, December 2006; Shaun Purcell, [email protected]
Genomic control
Test locus Unlinked ‘null’ markers
( )2χE
χ2 No stratification
( )2χE
χ2
Stratification → adjust test statistic
PLINK tutorial, December 2006; Shaun Purcell, [email protected]
PLINK tutorial, December 2006; Shaun Purcell, [email protected]
PLINK tutorial, December 2006; Shaun Purcell, [email protected]
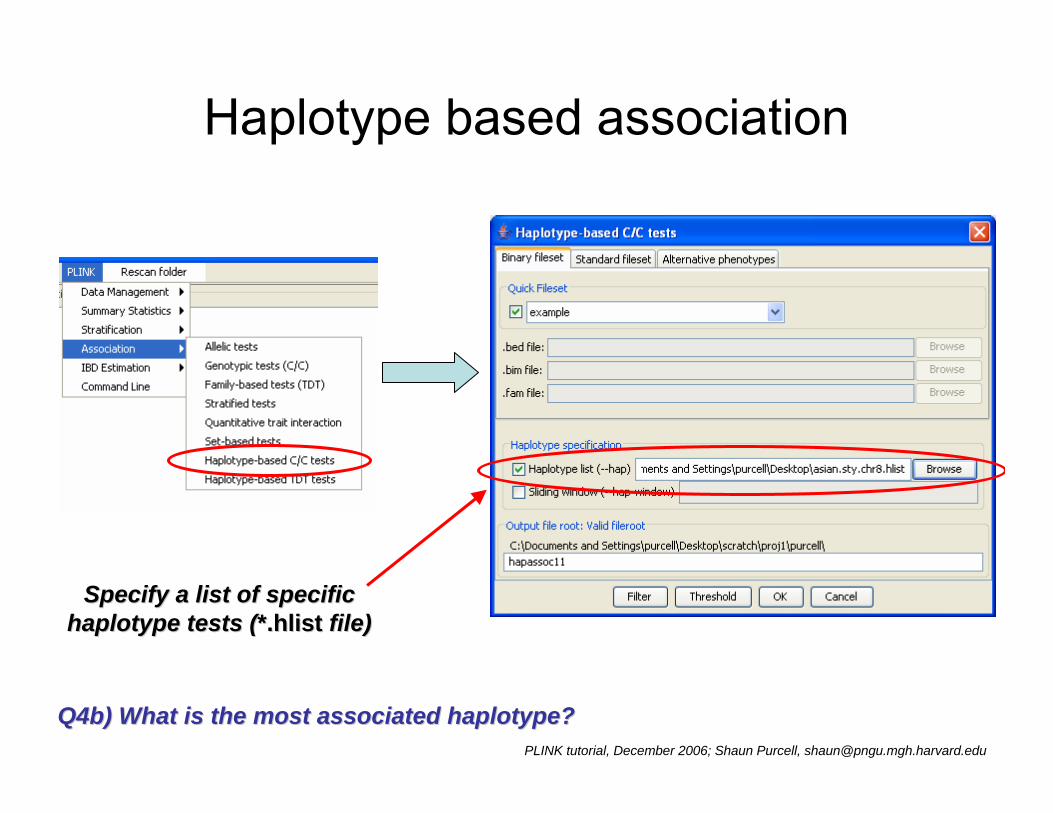
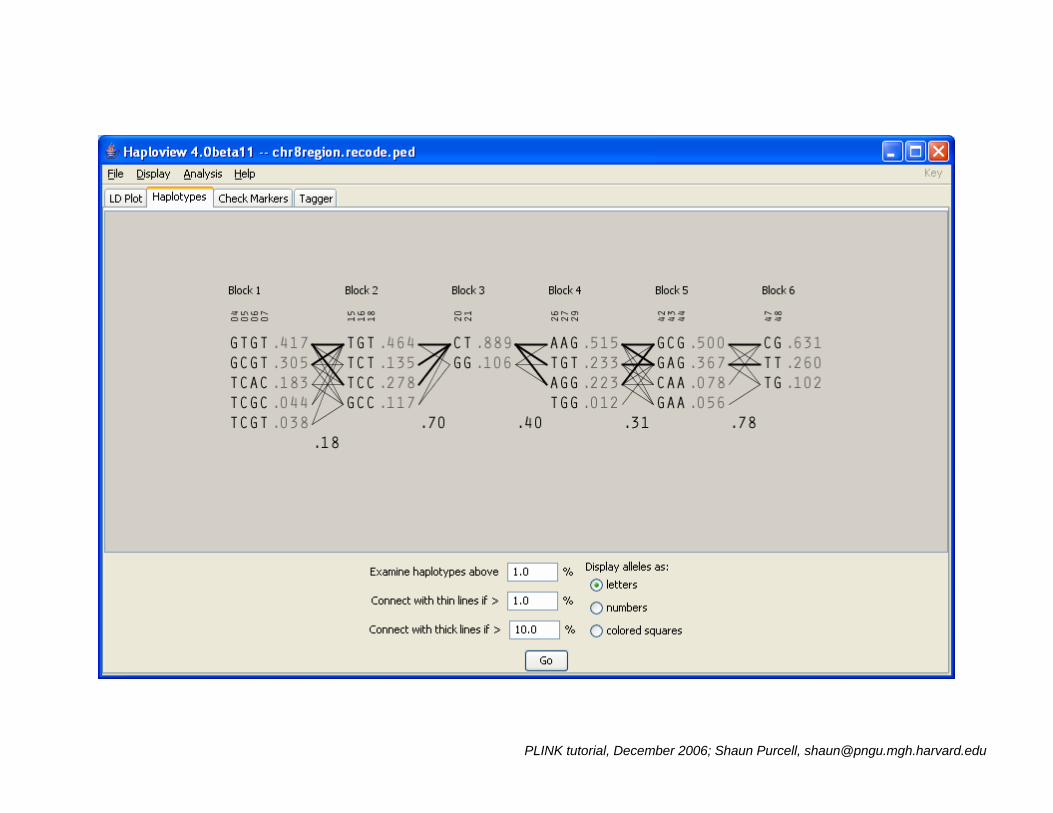
Haplotype based association
Specify a list of specific Specify a list of specific haplotype tests (haplotype tests (*.*.hlisthlist file)file)
Q4b) What is the most associated haplotype?Q4b) What is the most associated haplotype?

PLINK tutorial, December 2006; Shaun Purcell, [email protected]
Specifying haplotype tests
i_rs2906364 8 0 158484 1 2 14 rs7000519 rs10488370i_rs3750097 8 0 187042 1 2 23 rs2906334 rs11988064i_rs10105400 8 0 188546 1 2 23 rs2906334 rs11988064i_rs13258954 8 0 211039 1 2 34 rs13265571 rs3008257… etc …
Or, specifying a sliding window of fixed Or, specifying a sliding window of fixed SNPsSNPs with:with:
e.g. e.g. ----haphap--window 4window 4
* rs7000519 rs10488370* rs2906334 rs11988064* rs2906334 rs13265571 rs3008257… etc …
Specify specific haplotypesSpecify specific haplotypes
Or, specify the locus (i.e. only specify predicting Or, specify the locus (i.e. only specify predicting SNPsSNPs))
ID ID chrchr cMcM bpbp alleles alleles Haplotype Haplotype SNPsSNPs (in data file)(in data file)
PredictorsPredictorsPredictedPredicted

PLINK tutorial, December 2006; Shaun Purcell, [email protected]
Haplotype-based tests
Haplotype Haplotype C/C associationC/C association
resultsresults(omnibus &(omnibus &
haplotypehaplotype--specific)specific)
List of tests that List of tests that could not be could not be
performed, e.g. if performed, e.g. if the predictor the predictor SNPsSNPs were were
removed in the removed in the filtering stage filtering stage

PLINK tutorial, December 2006; Shaun Purcell, [email protected]
Identity-by-state (IBS) sharing
Individual 1 A/C G/T A/G A/A G/G| | | | | |
Individual 2 C/C T/T A/G C/C G/GIBS 1 1 2 0 2
Pair from same population
Individual 3 A/C G/G A/A A/A G/G| |
Individual 4 C/C T/T G/G C/C A/GIBS 1 0 0 0 1
Pair from different population

PLINK tutorial, December 2006; Shaun Purcell, [email protected]
Empirical assessment of ancestry
Han ChineseJapanese
Multidimensional scaling plot: ~10K random SNPsComplete linkage IBS-based
hierarchical clustering

PLINK tutorial, December 2006; Shaun Purcell, [email protected]
Q6) Use genotypes to cluster the sample into 2 subpopulationsQ6) Use genotypes to cluster the sample into 2 subpopulations
Step 1) Generate IBS distances for all pairs (may take a few minStep 1) Generate IBS distances for all pairs (may take a few minutes)utes)

PLINK tutorial, December 2006; Shaun Purcell, [email protected]
Step 2) Cluster individuals based on IBS distances Step 2) Cluster individuals based on IBS distances and other constraintsand other constraints
Constrain cluster solution Constrain cluster solution to two classes (K=2)to two classes (K=2)
Specify previouslySpecify previously--generated generated IBS file (*.genome)IBS file (*.genome)
PLINK tutorial, December 2006; Shaun Purcell, [email protected]
PLINK tutorial, December 2006; Shaun Purcell, [email protected]
PLINK tutorial, December 2006; Shaun Purcell, [email protected]
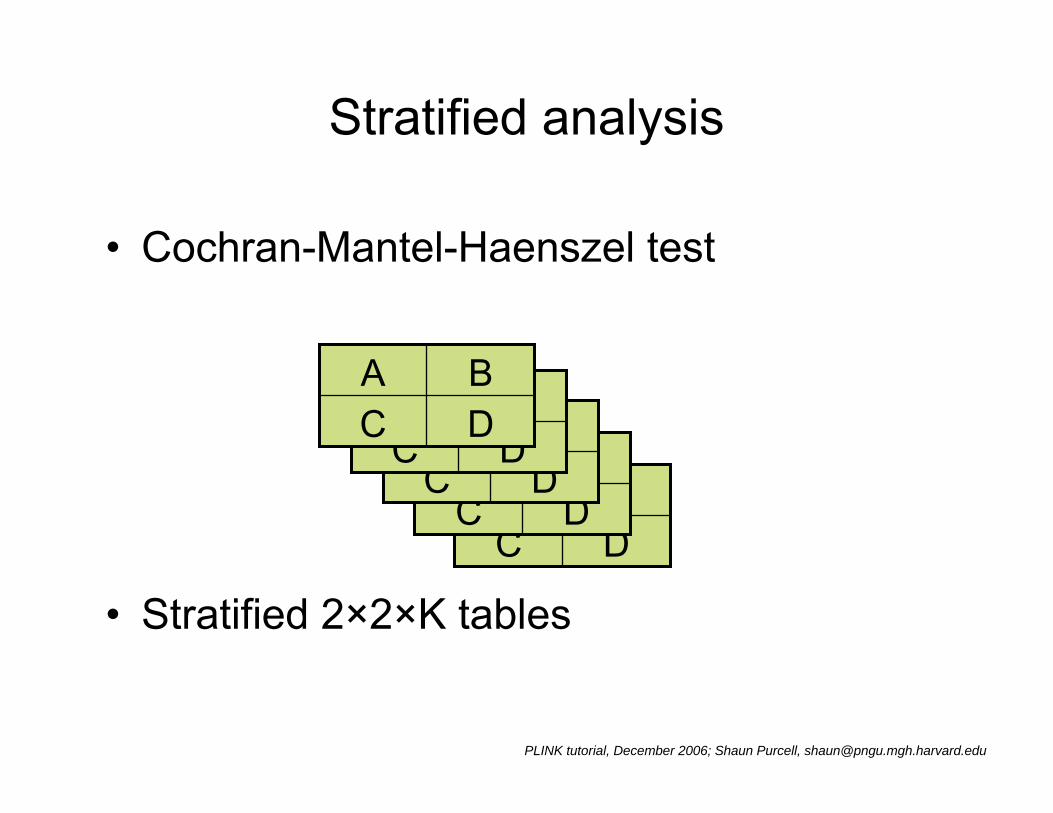
Stratified analysis
• Cochran-Mantel-Haenszel test
• Stratified 2×2×K tables
DCBA DC
BA DCBA DC
BADCBA

PLINK tutorial, December 2006; Shaun Purcell, [email protected]
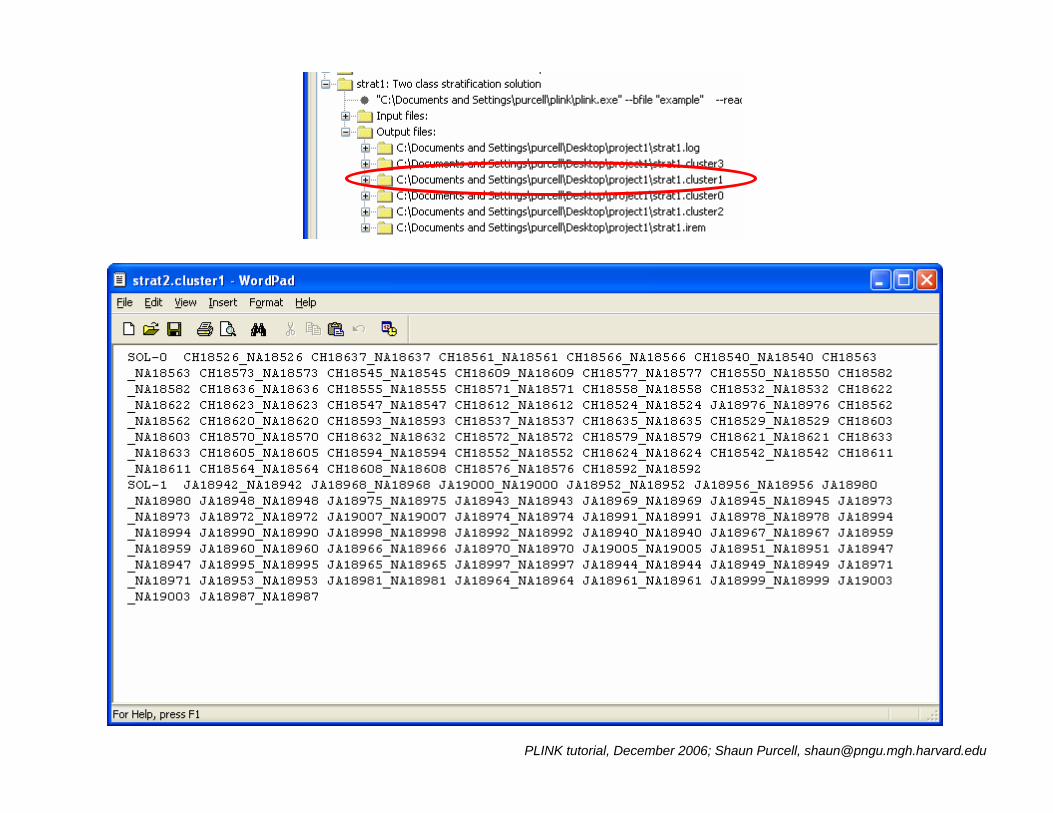
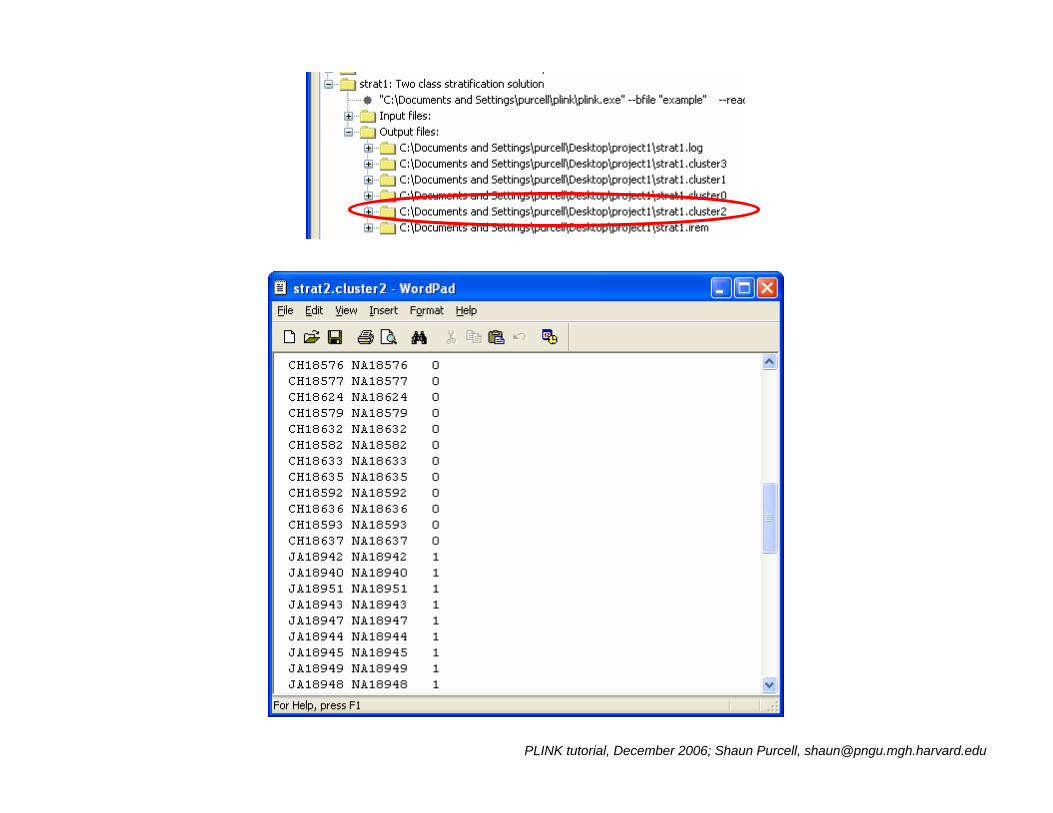
Select the previously calculatedSelect the previously calculated*.cluster2*.cluster2 file. This file. This ““cluster filecluster file””
has one line per individualhas one line per individual
PLINK tutorial, December 2006; Shaun Purcell, [email protected]
Q7) Evidence of stratification conditional on cluster solution?Q7) Evidence of stratification conditional on cluster solution?

PLINK tutorial, December 2006; Shaun Purcell, [email protected]
Q8) What is the best SNP controlling for stratification?Q8) What is the best SNP controlling for stratification?

PLINK tutorial, December 2006; Shaun Purcell, [email protected]
Making a Haploview fileset
Select 200kb region Select 200kb region around our around our ““best hitbest hit””
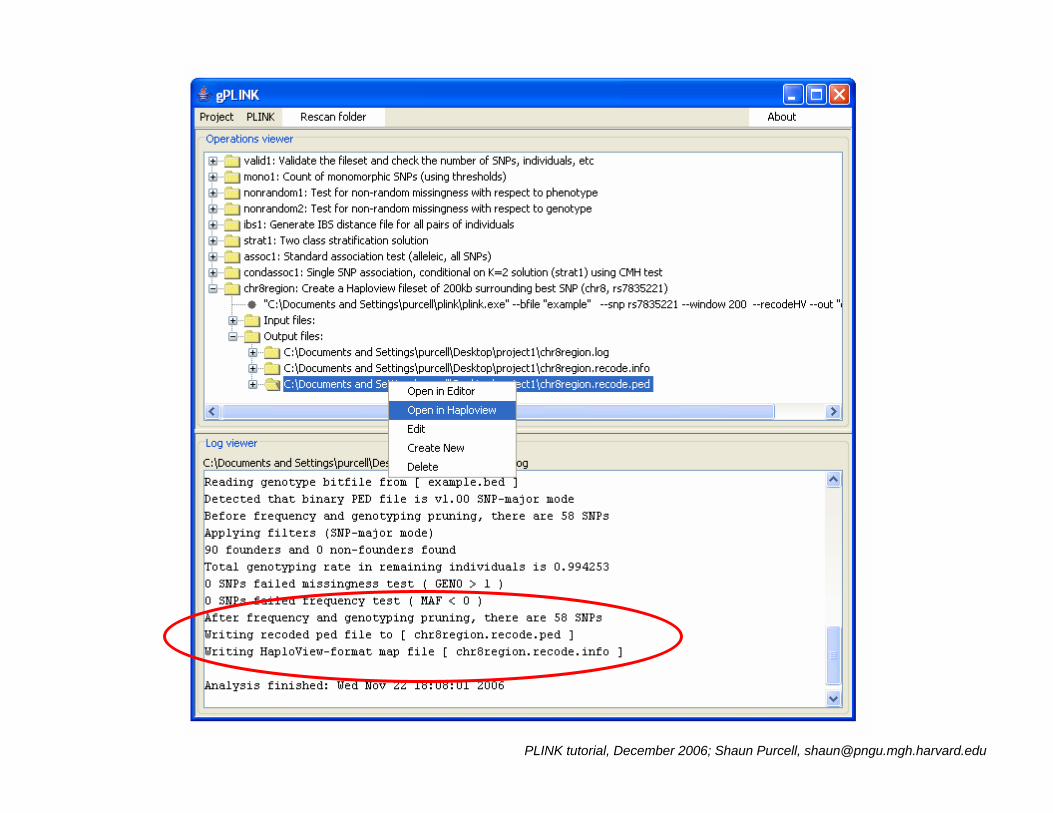
PLINK tutorial, December 2006; Shaun Purcell, [email protected]

PLINK tutorial, December 2006; Shaun Purcell, [email protected]
PLINK tutorial, December 2006; Shaun Purcell, [email protected]

PLINK tutorial, December 2006; Shaun Purcell, [email protected]
PLINK tutorial, December 2006; Shaun Purcell, [email protected]
PLINK tutorial, December 2006; Shaun Purcell, [email protected]
In the remaining time (if any…)
• Extract as a new PLINK fileset just the single best SNP (rs7835221)
• Using this new file, attempt questions 9-14.– Here are some clues
• 9) Summary statistics → Hardy Weinberg• 10) Standard association test, with an alternate phenotype• 11) Stratified association with Breslow-Day test• 12) You’ve already calculated these (i.e. *.assoc, *.hwe)• 13) This is already calculated also (i.e. *.missing)• 14) Use genotypic association test
Consult the PLINK documentation (http://Consult the PLINK documentation (http://pngu.mgh.harvard.edu/purcell/plinkpngu.mgh.harvard.edu/purcell/plink/)/)

PLINK tutorial, December 2006; Shaun Purcell, [email protected]
In summary
• We performed whole genome– summary statistics and QC– stratification analysis– conditional and unconditional association analysis
• We found a single SNP rs7835221 that…– is genome-wide significant– has similar frequencies and effects in Japanese and Chinese
subpopulations– shows no missing or HW biases– is consistent with an allelic, dosage effect– has common T allele with strong protective effect ( ~0.05 odds
ratio)

PLINK tutorial, December 2006; Shaun Purcell, [email protected]
Acknowledgements
Julian Maller
Dave BenderJeff BarrettMark Daly
Shaun Purcell
Kathe Todd-BrownBen NealeMark DalyPak Sham
(g)PLINKdevelopment
Haploviewdevelopment