please cite this article as: davy, catherine a.,skoczylas...
TRANSCRIPT

�������� ����� ��
Gas migration properties through a bentonite/argillite interface
Catherine A. Davy, F. Skoczylas, P. Lebon, T. Dubois
PII: S0169-1317(08)00117-8DOI: doi: 10.1016/j.clay.2008.05.005Reference: CLAY 1458
To appear in: Applied Clay Science
Received date: 21 July 2007Revised date: 13 May 2008Accepted date: 18 May 2008
Please cite this article as: Davy, Catherine A., Skoczylas, F., Lebon, P., Dubois, T., Gasmigration properties through a bentonite/argillite interface, Applied Clay Science (2008),doi: 10.1016/j.clay.2008.05.005
This is a PDF file of an unedited manuscript that has been accepted for publication.As a service to our customers we are providing this early version of the manuscript.The manuscript will undergo copyediting, typesetting, and review of the resulting proofbefore it is published in its final form. Please note that during the production processerrors may be discovered which could affect the content, and all legal disclaimers thatapply to the journal pertain.

ACC
EPTE
D M
ANU
SCR
IPT
ACCEPTED MANUSCRIPT
1
Manuscript
1 Gas migration properties through a
2 bentonite/argillite interface
3 Catherine A. Davy a,1, F. Skoczylas a, P. Lebon b, T. Dubois a
4 aEcole Centrale de Lille and LML, UMR CNRS 8107, F-59651 Villeneuve d’Ascq
5 Cedex, France
6 b ANDRA, 1-7 rue Jean Monnet, F-92298 Chatenay-Malabry Cedex,
France
7 Abstract.
8 Among diversified industrial uses, see for instance [Koch, Appl.Clay Sci., (21)
9 2002], and following positive in situ experiments, compacted bentonite blocks
10 are potential candidates for sealing nuclear waste repositories, thanks to their
11 swelling ability in a wet environment.
12 As requested by ANDRA (French Agency for Nuclear Waste Management)
13 and complementarily to in situ experiments, an original experimental labora-
14 tory set-up was designed in order to reproduce the introduction and swelling
15 of bentonite plugs inside an argillite host rock. Once the argillite/bentonite
16 interface is established, an increase in storage tunnel gas pressure is simulated
17 and the interface gas migration pressure (or gas critical pressure) is evalu-
18 ated. More precisely, a first experimental set-up provides bentonite swelling
19 pressure and kinetics (i.e. mainly hydraulic cut-off, time to reach asymptotic
20 swelling pressure and value of asymptotic swelling pressure) at given initial
21 compaction and saturation rate. This phase is preparatory to reproducing the

ACC
EPTE
D M
ANU
SCR
IPT
ACCEPTED MANUSCRIPT
2
1 introduction and subsequent swelling of a bentonite plug inside the argillite
2 host rock, which uses a similar test rig. Experimental results of water perme-
3 ability and gas critical pressure are provided for MX80 compacted bentonite
4 associated to Bure Callovo-Oxfordian argillite.
5 Keywords: nuclear waste storage; argillite; bentonite; gas migration; pulse
6 test; swelling.

ACC
EPTE
D M
ANU
SCR
IPT
ACCEPTED MANUSCRIPT
3
1 1 Introduction
2 High-level and long-lived nuclear waste storage on the long-term has become
3 a key issue for industrial countries, so that it has been extensively investi-
4 gated for the last twenty-five years. In particular, clayey geological formations
5 situated away from reputed seismic areas have been selected for their poten-
6 tially high impermeability and stability. In France, ANDRA (National Agency
7 for Nuclear Waste Management) is investigating a deep underground storage
8 solution (Lebon and Mouroux (1999)) inside a Callovo-Oxfordian argillite ly-
9 ing in the East, in both Haute-Marne and Meuse French Departements. This
10 formation welcomes a full-scale underground research laboratory still under
11 construction (Fouche et al. (2004)).
12 The deep-seated nuclear waste repository generally consists of a main ac-
13 cess tunnel drilled in clayey (or crystalline) rock, in which disposal pits are
14 aligned (Montes-H et al. (2005); Komine (2004)), each of them containing a
15 waste canister. Wastes are vitrified (or cemented, or bituminized, see Mugler
16 et al. (2006)), confined in a copper/steel canister before being surrounded by
17 pre-compacted swelling clay blocks in the disposal pit (Lloret et al. (2003);
18 Martin and Barcala (2005); Victoria Villar and Lloret (2007)), the whole sys-
19 tem thereby forming an engineered barrier to potential radionuclide leakage
20 through the host rock. Pre-compacted swelling clay is also considered for global
21 repository tunnel sealing. Over time, such a clay should absorb surrounding
22 groundwater and swell, closing up any construction clearance (Horseman et al.
23 (1999)). This effect is known as buffering. Several engineered compacted clays
24 are considered (Lloret et al. (2003)). A large majority of them is made up
25 from naturally swelling sodium bentonites, and are composed in majority of
1 montmorillonite (Mitchell (1993); Neaman et al. (2003); ANDRA (2005)). In

ACC
EPTE
D M
ANU
SCR
IPT
ACCEPTED MANUSCRIPT
4
2 particular, MX80 bentonite, as used in this study, is composed of ca. 90 %
3 montmorillonite (Horseman-99).
4 For performance and safety assessment purposes, varied damage and failure
5 scenarii are investigated. In particular, humid corrosion of copper/steel can-
6 isters may occur on the long term, due to groundwater seepage through the
7 engineered barrier. Coupled to radioactive waste decay and radiolysis of wa-
8 ter, humid corrosion may induce hydrogen gas production (Horseman et al.
9 (1999)). Gradually, hydrogen gas pressure could increase notably, first, in-
10 side disposal pits, at the interface between waste metal canisters and clay
11 plugs, and, subsequently, inside the repository tunnel. Whenever gas pres-
12 sure reaches groundwater pressure, the capillary threshold for gas entry into
13 the clay is reached, whereby hydrogen gas leakage may occur through the
14 repository sealing plug. Horseman et al. (1999) present evidences that this
15 eventuality is much less probable than that of the creation of micro-cracks
16 and fracturing of the pre-compacted sealing clay due to gas pressure increase,
17 so that, finally, H2 gas (and later, radionuclides) may leak from the repository.
18 Gas migration through bulk compacted sealing clays has been extensively
19 investigated. As reported by Galle (2000); Hildenbrand et al. (2002), gas mi-
20 gration mechanisms involve the creation and propagation of preferential path-
21 ways throughout the water-saturated clay. Depending on the gas pressure
22 value, these pathways may be unstable and lead to intermittent gas flow.
23 Nevertheless, it is generally admitted that gas convective transport in fully
24 water-saturated clay is possible whenever gas pressure marginally exceeds the
25 sum of the clay swelling pressure and the interstitial water pressure (Horseman
26 et al. (1999); Galle (2000); Hildenbrand et al. (2002)). For instance (Horseman
27 et al. (1999)), for a fully water-saturated bentonite of initial 1.6 g.cm−3 dry

ACC
EPTE
D M
ANU
SCR
IPT
ACCEPTED MANUSCRIPT
5
1 density, the expected swelling pressure is of 7 MPa. When such bentonite is
2 subjected to 5 MPa interstitial water pressure, which corresponds in situ to
3 500 m depth, gas migration is expected at a pressure slightly above 12 MPa.
4 Similar prediction is provided by Galle (2000) for Fo-Ca clay. Horseman et al.
5 (1999) also points out the potential importance to gas migration properties
6 of the boundary conditions for a swelling clay. Indeed, gas migration through
7 a compacted swelling clay is generally accommodated by global dilation. Yet,
8 no investigation has been made to our knowledge as to the influence of oe-
9 dometric boundary conditions upon the gas migration properties of swelling
10 clays. Finally, Galle (2000) proposes a model for gas migration at the Fo-Ca
11 clay/metal overpack interface, which predicts an order of magnitude similar
12 to gas breakthrough pressure: the gas migration phenomenon may not be ne-
13 glected for long term disposal safety assessment.
14 Complementarily, our study aims at characterising the gas migration condi-
15 tions through the bentonite/host rock interface, by using laboratory experi-
16 ments. An originality of this work is that it reproduces in the laboratory 1)
17 the in situ positioning of an unsaturated bentonite plug inside a brittle clayey
18 rock (namely argillite), 2) the bentonite swelling, followed by 3) a gas pres-
19 sure increase. Although each test may last more than a month, this experiment
20 provides additional information upon swelling, transport properties and gas
21 interface migration to those obtained during similar in situ experiments (Van
22 Geet et al. (2007)). All along the study, argillite swelling is assumed negligible
23 compared to bentonite swelling.

ACC
EPTE
D M
ANU
SCR
IPT
ACCEPTED MANUSCRIPT
6
24 2 Experimental methodology
1 All tests are performed in a temperature-controlled room at 22 degrees C. Two
2 different versions of the experimental set-up are proposed. Both are based upon
3 former set-ups designed in the laboratory for low permeability measurements
4 of bulk materials (Skoczylas and Henry (1995) Loosveldt et al. (2002) Davy
5 et al. (2007)). These consist of placing a specimen inside a triaxial cell and
6 subject it to both confining pressure and interstitial liquid or gas flow, see
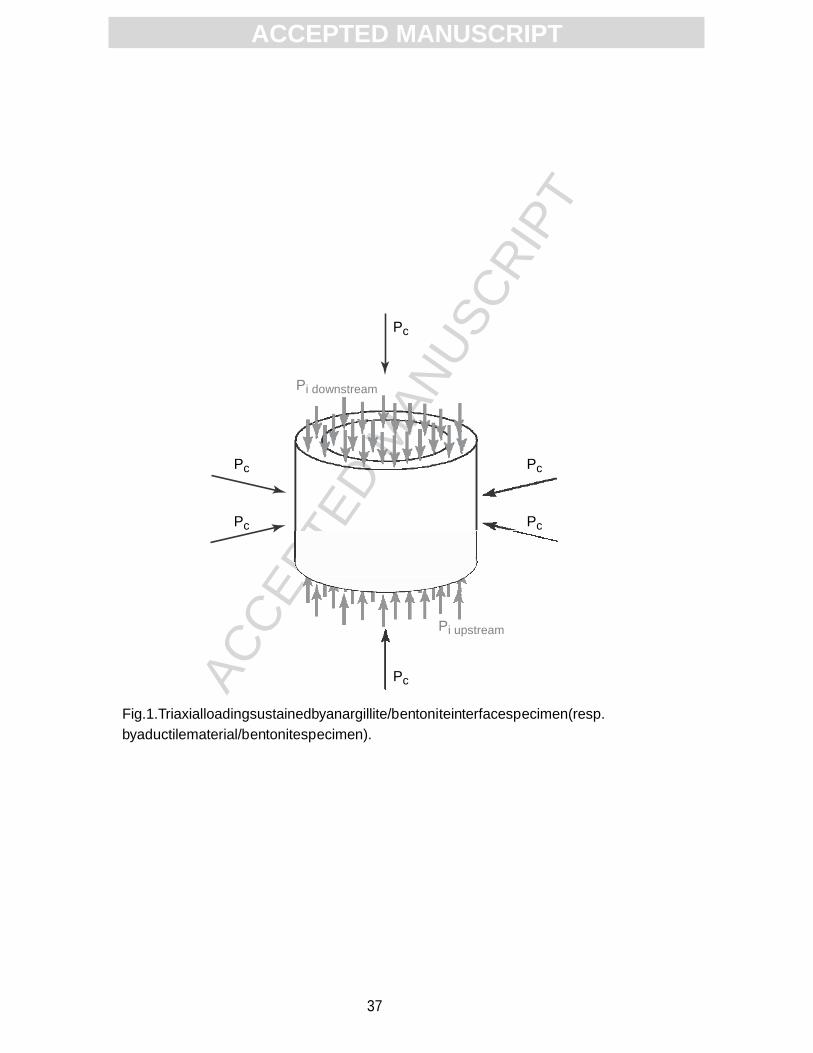
7 Fig. 1. For all tests, a 12 MPa confining pressure is used. This reproduces the
8 in situ lithostatic pressure at approximately 500 m depth, given that argillite
9 density is evaluated at 2.4 (Wright (2001)).
10 One set-up version aims at characterising bentonite swelling kinetics and pres-
11 sure by surrounding initially unsaturated bentonite with an instrumented and
12 calibrated tube (phase 1). Several versions of the tube ductile material (alu-
13 minium, PlexiglasT M or aluminium-PlexiglasT M ) are tested in order to retain
14 the most sensitive and reliable one. The second set-up version reproduces the
15 in situ swelling conditions. A cautious swelling procedure is devised and val-
16 idated, which reproduces the adequate positioning of a bentonite plug inside
17 the argillite host tube whilst avoiding argillite failure. The bentonite-argillite
18 specimen (or sample) is referred to as a mock-up, since it represents a reduced-
19 scale tunnel seal. After bentonite swelling, water permeability of the mock-up
20 is derived from indirect fluid flow rate measurements (or pulse test technique),
21 see Skoczylas (1996); Meziani and Skoczylas (1999); Loosveldt et al. (2002);
22 Davy et al. (2007), and gas critical pressure at the bentonite/argillite interface
23 is determined (phase 2).

ACC
EPTE
D M
ANU
SCR
IPT
ACCEPTED MANUSCRIPT
7
1 2.1 Materials
2 All tests are performed on argillite provided by ANDRA from a single plug
3 MSE 00707 cored at a height of 555 to 556 m at the Bure underground lab-
4 oratory site. The water pressure of 4 MPa imposed in our experiments is
5 therefore a lower bound value of the in situ water column pressure. Bentonite
6 plugs are made in our laboratory from MX80 powder provided by Eurogeomat-
7 Consulting company (Orleans, France) (Hokmark et al. (2007)). Its average
8 grain size, evaluated using a Beckman-CoulterT M LS230 laser granulometer,
9 is of 264 ± 2 µm.
10 2.2 Mock-up design
11 The mock-up geometry and dimensions are chosen according to various con-
12 straints, with proper representativeness as a main focus. First, a circular cylin-
13 drical geometry ensures uniform loading conditions in a triaxial cell. The tri-
14 axial cell is chosen to reproduce surrounding rock hydrostatic loading upon
15 the sample. Besides, bentonite tunnel seals have this overall geometry (Lloret
16 et al. (2003); Komine (2004)). Existing laboratory experience upon argillite
17 confinement involves 65 mm diameter (or alternately 37 mm diameter) circular
18 cylindrical specimens, which guarantees material representativeness relatively
19 to its microstructure scale (this scale is fixed at 10 microns in Abou-Chakra
20 Guery et al. (2008)). Consequently, the geometry chosen for the interface spec-
21 imen is such that the argillite host rock corresponds to a tube of 65 mm outer
22 diameter, 40 mm inner diameter, and 50 mm height. Four argillite tubes have
23 been cored for this study, using a purposely-built diamond circular cylindrical
24 double saw, with extra precautions aimed at avoiding argillite shattering dur-

ACC
EPTE
D M
ANU
SCR
IPT
ACCEPTED MANUSCRIPT
8
25 ing the process. After coring, the tube top and bottom surfaces are ground in
1 order to guarantee proper planeity and parallelism, see the result Fig. 3(b).
2 Tube n.4 has displayed one single major macro-crack which resulted in split-
3 ting the tube in two parts (of about (1/4)th and (3/4)th of the total tube
4 volume). We have chosen to seal it with a thin layer of PC12 glue (usually
5 used to glue strain gauges) and to use the tube to make sample n.4.
6 Bentonite is a circular cylindrical plug placed inside the argillite tube, see
7 Fig. 1. In order to reproduce in situ conditions, ANDRA requested that the
8 bentonite plug should have an initial 3 to 4 % clearance inside the tube inner
9 volume, see Subsection 2.2.1 for details.
10 For bentonite swelling characterisation, a mock-up of identical dimensions is
11 chosen. Yet, the tube is made of a ductile material less prone to failure than
12 argillite; it is either made of aluminium (two tubes have been made for this
13 study), of PlexiglasT M (one tube), or of a composite composed of concentric
14 layers of aluminium and PlexiglasT M (one tube), see Figs. 3(c), 3(d).
15 During all tests (phase 1 or phase 2), the mock-up lateral surface is wrapped
16 into a VitonT M membrane and placed inside the confining triaxial cell, see
17 Fig. 2, while its bottom and top surfaces are subjected to a water (or gas)
18 flow. In order to avoid bentonite swelling through the water pipes, a sheet of
19 filter paper combined with a sintered brass disc are disposed on each of the
20 specimen top and bottom surfaces.
21 2.2.1 Bentonite plug preparation
22 The plugs are prepared according to ANDRA technical specifications, using
23 a quasi-static compaction technique, contrarily to dynamic loading which is

ACC
EPTE
D M
ANU
SCR
IPT
ACCEPTED MANUSCRIPT
9
24 often used in situ (Ito (2006)). Bentonite powder water content is stabilised
25 after 2 to 3 days in a BinderT M air conditioned enclosure (KBF type) which is
1 set at a fixed relative humidity of 76 %RH and at a constant temperature of 20
2 degrees C. Powder is then compacted under oedometric boundary conditions,
3 such as in Tien et al. (2004), for 4 hours at 42 MPa and in two successive
4 batches. This eventually provides two superposed plugs of 38.5 mm diameter
5 and 24 mm height each, at the required compaction level and relative humidity,
6 see Fig. 3(a). Those dimensions correspond to a 3.75 % initial clearance for
7 the tube inner diameter and 4 % for its height. The plugs are representative
8 of the material macroscopic behaviour, since the powder characteristic size is
9 264µm. About ten plugs have been manufactured, since each plug is removed
10 from the tube and replaced by another one after a single, irreversible, swelling
11 phase. The plug water content
12 w = (sample water mass)/(dried sample mass) = 14.2 % ± 0.05 13 is characterised after drying of a sample made under identical conditions. This
14 represents an initial saturation level
15 Sw = (water volume)/(available pore volume) = 46 %,
16 where the available pore volume corresponds to the sample mass variation
17 from dry to fully water saturated states (times water density). The plug dry
18 density
19 ρdry = (dry solid mass)/(total plug volume)
20 is of 1.68 g.cm−3 ±0.01 prior to swelling, and it is 21 ρswell = (dry solid mass)/(total volume after swelling) = 1.09 g.cm−3
22 after the plug has filled the initial 4 % clearance. A swelling pressure in the
23 range 7 to 8 MPa is expected.

ACC
EPTE
D M
ANU
SCR
IPT
ACCEPTED MANUSCRIPT
10
1 2.2.2 Water flow composition
2 Plug swelling is achieved by subjecting unsaturated bentonite to a reconsti-
3 tuted water flow. The proportion of chemical elements added to the water
4 reproduces the in situ seeping water composition, see Table 1.
5 2.3 Bentonite swelling measurement
6 2.3.1 Set-up description and measurements accuracy
7 When subjected to a water flow, bentonite swells and progressively fills up
8 the initial clearance within the tube, until it comes in contact and applies
9 a pressure on the tube inner surface. The pressure applied on the tube in-
10 ner surface is recorded using four strain gauges located transversely on the
11 tube outer surface, so as not to disturb the water flow, see for instance
12 Fig. 3(c). The strain gauge accuracy is of 10−6, i.e. 10−4 %. Interstitial pres-
13 sures Pi upstream, on the sample upstream side, and Pi downstream , on the sample
14 downstream side, are measured using conventional manometers. Their accu-
15 racy is of (1/100) MPa, i.e. 0.1 bar. By adequately switching the position
16 of two available valves, see Fig. 2, downstream pressure Pi downstream may ei-
17 ther be put to zero (atmospheric pressure value), to Pi upstream value, or to
18 an intermediary value between 0 and Pi upstream. Confining pressure Pc is held
19 constant using a GilsonT M -type pump and it is recorded with an accuracy of
20 (1/100) MPa.

ACC
EPTE
D M
ANU
SCR
IPT
ACCEPTED MANUSCRIPT
11
21 2.3.2 Calibration procedure
22 Prior to the swelling phase, the tube is carefully calibrated in order to identify
23 the relationship between the gauge strains and the average normal stress ap-
24 plied to the tube inner surface. The latter is identified as the average bentonite
1 swelling pressure. Calibration is performed by 1) placing the tube inside the
2 triaxial cell, see Fig. 2, at a fixed outer confining pressure Pc of 12 MPa (cor-
3 responding to the lithostatic pressure, see Section 1), and then 2) by varying
4 the inner water pressure Pi upstream = Pi downstream from zero up to 10 MPa
5 and by recording the corresponding gauge strains.
6 2.3.3 Swelling procedures
7 After calibration, the mock-up is placed inside the triaxial cell and confined
8 up to 12 MPa. After water flow through bentonite has started, hydraulic cut-
9 off occurs. Hydraulic cut-off is defined as the time necessary to get a contact
10 between bentonite and the tube inner surface. This occurs as soon as the
11 initial clearance is filled with enough swelling bentonite so as to hinder any
12 fluid flow. This parameter is identified under two types of interstitial pressure
13 loading. Both procedures represent reasonable scenarii. They correspond to
14 low interstitial pressure values so as not to modify irreversibly the bentonite
15 pore network morphology. It is either:
16 (1) an hydraulic gradient, with 2 MPa imposed on the upstream sample side
17 and atmospheric pressure (i.e. 0 MPa relative pressure) at t=0 on the down-
18 stream side. This procedure is used with aluminium tubes only. The upstream
19 water pressure is fixed with a GilsonT M -type pump, see Fig. 2, while the down-
20 stream circuit is open and lets water flow continuously for several minutes so as
21 to remove any potentially trapped air. Afterwards, the downstream circuit is

ACC
EPTE
D M
ANU
SCR
IPT
ACCEPTED MANUSCRIPT
12
22 simply closed, whereby Pi downstream has an intermediary value between 0 and
23 2 MPa. The hydraulic cut-off is considered obtained as soon as downstream
24 pressure value decreases, as measured on the downstream side manometer.
25 This procedure lets bentonite swell quite naturally, without applying heavy
26 water pressure on both sides of the mock-up.
1 (2) a static pressure of 4 MPa on both sample sides. The water pressure of
2 4 MPa has been set in accordance with ANDRA, at a minimum value corre-
3 sponding to the water column below 420 m depth (where the Bure argillite
4 layer is situated, Wright (2001)). This aims at best reproducing the in situ pore
5 water pressure conditions. It has been used with PlexiglasT M and aluminium-
6 PlexiglasT M tubes. As with the first procedure, water at 4 MPa pressure is
7 injected by a GilsonT M -type pump from the upstream sample side, and let
8 to flow through the sample for several minutes, while the downstream side is
9 open. Then upstream and downstream water pressures are connected together
10 and fixed at the in situ pore pressure of 4 MPa. Hydraulic cut-off is identi-
11 fied from swelling pressure values, see Section 3. Despite applying a noticeable
12 4 MPa static pressure to bentonite, this procedure remains at pressures lower
13 than the expected swelling pressure of 7 to 8 MPa.
14 With both swelling procedures, the initial water flow for several minutes aims
15 at removing the air potentially trapped inside the sample. Nevertheless, while
16 this procedure alone ensures that the air around the sample and in the filters
17 is removed, it is very difficult to ensure that all air trapped inside the pores
18 of the clay plug is removed. This is why, during the initial water flow, the
19 downstream side valve is opened and closed several times (so as to put water
20 under pressure) until no more gas bubble is visible on the downstream outlet
21 (water flow only remains).

ACC
EPTE
D M
ANU
SCR
IPT
ACCEPTED MANUSCRIPT
13
22 2.4 Permeability measurement techniques
1 Several methods exist to measure the permeability K of a porous material
2 under confinement, depending on the order of magnitude of K (Skoczylas
3 and Fleureau (2003); Davy et al. (2007)). Those methods usually consist in
4 applying an axial unidimensional steady state or transient fluid flow through
5 a circular cylindrical sample confined in a conventional triaxial test rig. In the
6 present case, permeability measurements are performed by water pulse test.
7 Further details may be found in Lion et al. (2004) or Davy et al. (2007).
8 2.5 Specific measurement techniques for the bentonite/argillite interface
9 The bentonite/argillite mock-up is tested with the same set-up as sketched
10 in Fig. 2, except that it is equipped with a few specific measurement devices,
11 and that it is subjected to specific procedures.
12 First, each bentonite/argillite mock-up is subjected to a long lasting swelling
13 phase in order to ensure that asymptotic swelling pressure value is reached,
14 see Subsection 3.2. When asymptotic swelling pressure is considered reached,
15 water permeability measurements are performed.
16 Subsequently, gas migration experiments are performed. To this purpose, the
17 triaxial cell is disconnected from the water-supplying GilsonT M pump, see
18 Fig. 2. The 12 MPa confinement is kept, and all internal pipes remain filled
19 with unpressurised water: the 4 MPa interstitial pressure is not maintained.
20 This phase lasts at least 72 hours in order to re-equilibrate the internal water
21 pressure to atmospheric pressure, and to check that no gas is present inside
22 the depressurised water, for this could disturb gas migration measurements.

ACC
EPTE
D M
ANU
SCR
IPT
ACCEPTED MANUSCRIPT
14
23 Then the upstream sample side is connected to an inert Argon gas source
24 followed by a small buffer reservoir of 0.05 litres. The sample downstream side
25 is open at atmospheric pressure. In order to observe very small gas leakage
26 through the sample, a flexible transparent tube is plugged onto the stainless
1 steel pipe connected to the sample downstream side, and filled with water,
2 see Fig. 4. A similar device is described in Pusch and Forsberg (1983). Gas is
3 injected at the sample upstream side by 1 MPa increasing steps until reaching
4 3 MPa, and then onwards, by 0.5 MPa increasing steps. Potentially very slow
5 gas migration kinetics have been accounted for, as reported by Hildenbrand
6 et al. (2002). Indeed, gas pressure increase is performed at a rate of 1 MPa
7 (or 0.5 MPa) per 3 to 7 days, so that at least 72 hours are let between two
8 steps, and up to 7 days if any change is expected or observed. Similarly, Galle
9 (2000) used a gas pressure increase rate of 0.5 MPa per 120 hours.
10 Hildenbrand et al. (2002) propose an extensive review related to gas migration
11 characterisation through bulk sedimentary rocks. They detail the phenomena
12 that usually occur, from the first gas entry inside the largest (but not neces-
13 sarily interconnected) pores, to extensive gas breakthrough. For Galle (2000),
14 two kinds of threshold pressures may be observed during laboratory experi-
15 ments: (1) the gas entry pressure is the pressure over which a significant gas
16 flow may be measured downstream of the sample; (2) when the gas pressure is
17 increased, a second gas threshold pressure is attained. It is called breakthrough
18 pressure, and it is detected when downstream gas flow rate sharply increases.
19 Breakthrough pressure is always higher than entry pressure, yet both are very
20 close for fully saturated media. For fully-saturated MX80 bentonite blocks,
21 Horseman et al. (1999) measure a gas peak pressure on the sample upstream
22 side (followed by a negative transient), and a so-called breakthrough pressure
23 as soon as a nonzero gas flow rate is attained on the downstream sample side.

ACC
EPTE
D M
ANU
SCR
IPT
ACCEPTED MANUSCRIPT
15
24 Both are very close, if not identical. Thomas et al. (1968) evaluates a thresh-
25 old pressure as soon as a continuous water flow is recorded, which is followed
26 by gas bubbles if enough time is allowed (Hildenbrand et al. (2002)). Finally,
27 Pusch and Forsberg (1983) names critical pressure the pressure at which a
1 sudden bubble gas release is observed through an outlet transparent tube.
2 Gas flow is already detectable below this pressure. As our experiments use a
3 similar technique to that proposed in Pusch and Forsberg (1983), the detec-
4 tion of gas migration in our study is referred hereafter as gas critical pressure,
5 in direct relation with the gas migration phenomenon.
6 Complementarily, a specific test has been designed in order to check that gas
7 migration does occur through the bentonite/argillite interface and not through
8 the bentonite bulk. Two 38 mm diameter and 3 mm thick disks, also named
9 obturators, are placed each at an end of the bentonite plug, prior to setting it
10 inside the argillite tube. Then the mock-up is sealed, as previously mentioned,
11 with a sheet of filter paper and then a sintered brass disc. The obturators
12 are glued to the sintered brass discs. This ensures that gas will pass with
13 more difficulty through the bentonite bulk rather than at the interface with
14 argillite. It is expected that gas migration results obtained from this mock-
15 up, labelled n.3, should be similar to those obtained on other non-obturated
16 mock-ups, provided that gas migration occurs preferentially at the interface
17 rather than in the bentonite water-saturated bulk. Test n.4, performed on an
18 initially-sealed argillite tube, has not been equipped with obturators, similarly
19 to Tests n.1 and 2, see Table 4.

ACC
EPTE
D M
ANU
SCR
IPT
ACCEPTED MANUSCRIPT
16
20 3 Results
21 3.1 Calibration of swelling measurements
22 Outer surface gauge strains have been recorded for several ductile tubes, by
23 subjecting them to 12 MPa confining pressure combined to varying inner pres-
24 sure Pi, see Figs. 5. As expected, all tubes remain in the linear elastic and
1 reversible domain of mechanical behaviour, yet their deformabilities are very
2 different, see Table 2. Deformability, expressed in 10−6 per MPa, is evaluated
3 using least squares interpolation from all four gauge data, with Pearson’s cor-
4 relation coefficient r2 higher than 0.95 in all cases. Two aluminium tubes have
5 been tested, which provides material variability evaluation for deformability.
6 Results show that the aluminium tube is seven times less deformable than
7 the aluminium-PlexiglasT M tube, the latter being four times less deformable
8 than the PlexiglasT M tube. Yet, although highest deformability is obtained
9 with PlexiglasT M , PlexiglasT M is proven to display creep after several hours
10 confinement and inner pressurising. While being unnoticed during instanta-
11 neous calibration measurements (gauge strains are stable for several hours),
12 PlexiglasT M creep goes up to 1.4 to 2 MPa after 3 days and 1.1 to 2.1 MPa
13 after 12 days, under a constant 12 MPa confinement and 7 MPa inner pres-
14 sure (i.e. under the expected bentonite swelling pressure). In the forthcoming
15 swelling tests, creep has been accounted for, whenever a PlexiglasT M tube has
16 been used.

ACC
EPTE
D M
ANU
SCR
IPT
ACCEPTED MANUSCRIPT
17
17 3.2 Bentonite plug swelling pressure and kinetics
18 Fig. 6 presents swelling test results obtained using aluminium tubes and a
19 limited water pressure gradient (of 2 MPa on the upstream side and zero on the
20 downstream side at t = 0). Asymptotic behaviour is reached in two successive
21 phases, with a sharp increase in swelling pressure up to four days, and then a
22 slower increase up to 8 to 10 days only. For these tests, water pressure has not
23 been released at any time. Average water pressure throughout the sample is
1 of 1 MPa, and it is only partially transmitted to the aluminium tube all along
2 its height. Subsequently, it is assumed that, with this procedure, the effect
3 of pore water pressure upon swelling pressure is negligible. This hypothesis is
4 validated when comparing swelling pressure results obtained with the other
5 ductile tubes, see Table 3. Indeed, these are very close, with an average value
6 of 7.5 MPa, and a scatter of only 0.1 MPa.
7 3.2.1 Hydraulic cut-off
8 Hydraulic cut-off occurs whenever bentonite fills up sufficiently the initial
9 clearance inside the tube so as to cut all hydraulic (i.e. fluid) paths. At hy-
10 draulic cut-off time, bentonite begins to apply a swelling pressure upon the
11 tube inner surface, which is identified differently, depending on the swelling
12 procedure. Swelling pressure is also named contact pressure in the following.
13 With the first swelling procedure, hydraulic cut-off corresponds to the moment
14 when downstream side pressure decreases of a small amount. It is reached after
15 4 to 8 hours. Hydraulic cut-off is not measured clearly by the strain gauges:
16 they just keep increasing regularly throughout the test, see Fig. 6. The second
17 swelling procedure used on PlexiglasT M and aluminium-PlexiglasT M tubes im-

ACC
EPTE
D M
ANU
SCR
IPT
ACCEPTED MANUSCRIPT
18
18 poses a 4 MPa static water pressure after several minutes of free water flow.
19 It is readily seen from Figs. 7 that contact pressure instantaneously increases
20 up to 4 MPa as soon as the static pressure is applied on both sample sides,
21 and it decreases quickly afterwards while bentonite swells inside the clearance
22 volume. Hydraulic cut-off time ∆t is considered reached when contact pressure
23 is minimal. This is best evidenced on Test n.2, see Fig. 7(b). For PlexiglasT M
24 tubes, ∆t could be determined with proper accuracy during Test n.1 only:
25 ∆t = 5 hours. For the aluminium-PlexiglasT M tube, see Table 3, hydraulic
1 cut-off is of an hour only. These results are all on the same order as with the
2 first procedure (i.e. less than 10 hours).
3 3.2.2 Effective swelling (or contact) pressure
4 Contact pressure time variations are compared graphically for all test types:
5 aluminium and PlexiglasT M tube tests are plotted in Fig. 8(a), while aluminium-
6 PlexiglasT M and PlexiglasT M tubes are represented in Fig. 8(b). Contrarily to
7 hydraulic cut-off, asymptotic swelling kinetics are influenced by the swelling
8 procedure chosen. For all tests on PlexiglasT M tubes, asymptotic total con-
9 tact pressure is reached after no less than 12 to 14 days swelling, see Figs. 7.
10 It appears to be on the order of 8 days only for the aluminium-PlexiglasT M
11 tube, see Figs. 8, yet data recording after 8 days could not be continued due
12 to technical problems, so that an accurate conclusion, on this particular point,
13 is not easy.
14 For tests on PlexiglasT M tubes, after more than 12 swelling days, water pres-
15 sure is brought back to atmospheric pressure, i.e. to zero relative pressure,
16 see Figs. 7. After one to three days, contact pressure reaches a new asymp-
17 tote situated 2 to 3 MPa lower than the total asymptotic swelling pressure

ACC
EPTE
D M
ANU
SCR
IPT
ACCEPTED MANUSCRIPT
19
18 for PlexiglasT M tubes. This asymptote is the effective bentonite swelling pres-
19 sure. It is only due to the bentonite solid matrix acting upon the tube inner
20 surface, in the absence of any pore water pressure. Total asymptotic swelling
21 pressure is lowered by 2.5 MPa for the PlexiglasT M tube, and 3.6 MPa for
22 the aluminium-PlexiglasT M tube. Due to technical problems, the transitory
23 phase from total to effective swelling pressure has not been recorded for the
24 aluminium-PlexiglasT M tube test, yet, asymptotic effective swelling pressure
1 could be reliably measured, see Table 3.
2 For PlexiglasT M tube Test n.1, a water pressure cycle is applied further, from
3 Day 22, see Fig. 7(a). A 4 MPa water pressure increase is imposed instanta-
4 neously, and it is maintained from Day 22 to Day 26. On Day 26, water pressure
5 is put back to zero, see Fig. 7(a). Results show that former total asymptotic
6 swelling pressure is recovered on Day 26, and former effective swelling pres-
7 sure is also recovered, from Day 29. Similar results are obtained with Test
8 n.2 and Test n.3 on PlexiglasT M tubes. Eventually, effective swelling pres-
9 sure values are given in Table 3, together with hydraulic cut-off and time
10 to reach effective swelling pressure. On average, effective swelling occurs at
11 Pswelling = 7.5 MPa ±0.1, after up to 12 swelling days under 4 MPa water 12 pressure followed by up to 2 days in unpressurised water, independently of the
13 ductile material used for the tube. This complies with the expected swelling
14 value, see Subsection 2.2.1.
15 3.2.3 Effect of a gas pressure increase
16 Further experiments show that contact pressure at the bentonite/tube inter-
17 face is affected by injected gas pressure. More precisely, when a 4 MPa gas flow
18 is imposed on Day 33 to the fully-saturated bentonite sample upstream side

ACC
EPTE
D M
ANU
SCR
IPT
ACCEPTED MANUSCRIPT
20
19 placed inside a PlexiglasT M tube (Test n.1), the contact pressure recorded by
20 the strain gauges is increased by 1.5 MPa after 5 days, see Fig. 9(a). Further,
21 several increasing gas pressure values Pi have been applied, and the corre-
22 sponding contact pressure increase ∆Pcontact has been recorded, see Fig. 9(b).
23 While gas pressure Pi is kept constant, after an immediate response, contact
24 pressure keeps increasing over time until reaching an asymptote. The aver-
25 age slope in the (Pi,∆Pcontact ) plane is of 0.4 for the asymptotic behaviour.
26 This means that contact pressure increases by up to 40 % of the injected gas
27 pressure, when injected gas pressure is applied on the sample upstream side.
1 This is not negligible, since it represents more than 1 MPa for injected gas
2 pressures above 3 MPa. This coupling effect between contact pressure and gas
3 pressure is of particular importance when considering gas migration. Indeed,
4 these measurements are performed when bentonite has fully swelled, so that
5 asymptotic effective swelling pressure value is reached, by injecting more and
6 more pressurised gas on one side of the sample, until gas reaches the sample
7 downstream side (i.e. at gas critical pressure). Applied gas pressure values
8 may be of up to 5 MPa and more. Therefore, during such a test, the coupling
9 of swelling pressure with gas pressure should not be neglected. This is inter-
10 preted as a consequence of two combined effects: 1) a direct micro-structural
11 or poro-mechanical coupling, between the pore fluids (i.e. water pushed by
12 gas) and the bentonite solid skeleton, and 2) a structural effect. Indeed, if the
13 tube is assumed perfectly rigid, when a gas pressure is applied on the sample
14 upstream side, bentonite sustains globally a lateral deformation of the nature
15 of a Poisson effect. Hopefully, this structural effect is of no major contribution
16 in situ, where large bentonite blocks are present. It is mainly a laboratory test
17 feature, where samples are of small dimensions compared to the gas loading
18 area. This provides an upper bound to effective swelling pressure value. The
ACC
EPTE
D M
ANU
SCR
IPT
ACCEPTED MANUSCRIPT
21
19 effect of upstream gas pressure Pi = Pgas upon bentonite swelling pressure
20 may be accounted for as follows:
21 Pswelling corrected = 7.5 + 0.4 × Pgas (MPa)
22 In particular, corrected bentonite swelling pressure Pswelling corrected may be
23 evaluated at the upstream gas pressure Pgas when gas migration is detected
1 (i.e. gas critical pressure, see Subsection 3.4).
2 3.3 Bentonite/argillite interface setting procedure
3 The bentonite/argillite mock-up requires a careful setting procedure. Indeed,
4 the argillite tube has to sustain around 7 MPa bentonite swelling pressure
5 upon its inner surface (Galle (2000); Victoria Villar et al. (2005)), and si-
6 multaneously a 12 MPa confining pressure upon its outer surface. Without
7 due precaution, the brittle argillite tube may fail before the in situ interface
8 loading conditions are fully reproduced.
9 Therefore, based on bentonite swelling characteristics identified above, a care-
10 ful setting procedure has been devised for the bentonite/argillite association,
11 as follows. The bentonite/argillite mock-up is made up, and placed inside the
12 triaxial cell. It is then loaded in three gradual steps: 1) a 5 MPa confinement
13 is applied, followed by an interstitial water pressure of 2 MPa. Hydraulic cut-
14 off, determined as for the first swelling procedure (through the downstream
15 side manometer reading decrease), is obtained very soon, after 2 hours only
16 (on Day 1). 2) On Day 2, confinement is increased up to 8 MPa, and wa-
17 ter pressure up to 4 MPa. 3) On Day 4, confinement is increased again, to
18 its final 12 MPa value. Then, for each bentonite/argillite mock-up, the total

ACC
EPTE
D M
ANU
SCR
IPT
ACCEPTED MANUSCRIPT
22
19 swelling phase (from Day 1) lasts for at least 21 days (samples 1 and 2) or 28
20 days (samples 3 and 4). Subsequent extremely low water permeability results,
21 see Subsection 3.4, indicate that no major failure of any of the mock-ups has
22 occurred, thereby validating the setting procedure.
23 3.4 Bentonite/argillite interface hydraulic behaviour
1 For all bentonite/argillite tests, hydraulic cut-off is very quick: it occurs after
2 2 to 3 hours water flow only. With an average value of 2. 10−21 m2, water
3 permeability of the mock-up is extremely small (almost impermeable), and it
4 is on the order of that of bulk argillite, see Davy et al. (2007). This is in favour
5 of the bentonite sealing efficiency, provided it is enabled to fully swell.
6 Gas migration
7 Prior to any evidence of gas migration, gas pressure increase systematically
8 induces a water volume displacement inside the transparent tube. In such an
9 event, gas pressure is kept constant for 7 days. Later, gas migration occurs
10 whenever a gas bubble is observed at the base of the downstream water circuit,
11 inside the flexible transparent tube, see an example in Fig. 4. As soon as
12 a gas bubble is observed, the corresponding pressure on the upstream side
13 is recorded and held constant for the next two days. Gas pressure is then
14 increased again only if no subsequent gas bubble is noticed.
15 In the case of sample 1, a first single gas bubble is observed getting slowly
16 out of the downstream steel pipe, inside the transparent flexible tube initially
17 filled with water, between 4 and 4.5 MPa upstream gas pressure. Further,
18 the bubble frequency is of only two to three bubbles per 12 hours. This fre-

ACC
EPTE
D M
ANU
SCR
IPT
ACCEPTED MANUSCRIPT
23
19 quency remains constant when increasing gas pressure up to 10 MPa. This
20 is in favour of a very progressive gas passage through the mock-up, instead
21 of a sudden brutal breakdown. For sample 2, the first gas bubble appears
22 at Pgas = 4 MPa. It is followed by a number of very small gas bubbles as
23 soon as gas pressure is slightly increased. As with sample 1, no major break-
24 down is observed up to 10 MPa gas pressure. For sample 3, the first small gas
25 bubbles are observed at 3.6 MPa, yet gas flowrate is insignificant. When gas
26 pressure is increased by 1 MPa steps, the bubble frequency increases up to
1 about 10 bubbles per minute. For sample 4, no gas bubble is observed up to
2 4.5 MPa and slightly above, which is a first evidence that the initial argillite
3 tube sealing does not seem to affect the mock-up gas migration behaviour. For
4 all samples, gas pressure decrease does not stop gas bubble outflow down to
5 very small gas pressure values. Table 4 summarizes gas migration test results.
6 Average gas critical pressure Pcritical gas is of 4.35 MPa±0.95, see Table 4. 7 This result is within the range 0.1-4.5 MPa obtained by Thomas et al. (1968),
8 although their threshold pressure corresponds to the detection of a continu-
9 ous downstream water flow (rather than to that of gas bubbles first appear-
10 ance). Pcritical gas represents 58 % of the bentonite effective swelling pressure
11 Pswelling = 7.5 MPa. The corrected bentonite swelling pressure at critical gas
12 pressure is Pswelling corrected = 9.2 MPa.
13 Evidence of interfacial gas migration
14 Sample 3 has been prepared with obturators placed upon the bentonite plug
15 top and bottom surfaces so as to hinder gas migration through the bentonite
16 bulk, but not at the bentonite/argillite interface (see Subsection 2.5). The
17 sample water permeability ranges between those obtained for samples 1 and
18 2, which is extremely low. Sample 3 also has similar, yet slightly lower, gas

ACC
EPTE
D M
ANU
SCR
IPT
ACCEPTED MANUSCRIPT
24
19 critical pressure than all other samples. As no major difference is noticed
20 with un-obturated samples 1 and 2, it is deduced that gas migration occurs
21 preferentially at the interface between the bentonite plug and the argillite
22 tube, and not in the bentonite bulk. It is to be noted that, due to argillite
23 reputed high gas critical pressure (it is above 10 MPa, see ANDRA (2005)),
1 gas flow through the argillite bulk is not considered a viable scenario.
2 Effect of initially-sealed argillite macro-crack
3 Low water permeability, similar to that measured with samples 1, 2 and 3,
4 is obtained for reconstituted sample 4. Sample 4 argillite tube was initially
5 macro-cracked and has been subsequently sealed prior to mock-up manufac-
6 ture. As with sample 3, there is negligible (or small) difference in both water
7 permeability and gas migration behaviour. These results are evidence that the
8 initial macro-crack sealing may be considered as having no noticeable effect
9 upon gas migration properties of the mock-up.
10 4 Conclusion
11 This contribution has investigated the swelling of a bentonite plug inside an
12 argillite host rock, represented by a thick circular cylindrical tube, in rela-
13 tion with nuclear waste storage tunnels sealing. Subsequently, the bentonite-
14 argillite mock-up transport and gas migration properties have been identified.
15 Using a first experimental set-up requiring no argillite, but rather a sufficiently
16 deformable and reliable ductile material tube, effective swelling pressure of the
17 plug has been identified at Pswelling = 7.5 MPa±0.1, corresponding to given 18 compaction conditions for initially powdered bentonite. The phenomenon ki-
ACC
EPTE
D M
ANU
SCR
IPT
ACCEPTED MANUSCRIPT
25
19 netics is shown to be quick: bentonite swells inside the tube initial 4 % clear-
20 ance in less than 8 hours, and effective swelling pressure is reached after 14
21 days swelling at most, depending on the water flow pressure conditions, pro-
22 vided the latter remain below the effective swelling pressure (water pressure of
23 up to 4 MPa was used). Indeed, if higher water pressure is applied, bentonite
24 pore network may shrink irreversibly or fracturing may occur, hence modi-
25 fying all preceding results. Moreover, effective swelling pressure is influenced
26 by gas injection upon the sample upstream side, so that the effective swelling
27 pressure Pswelling increases of up to 40 % of the imposed gas pressure value
1 Pgas:
2 Pswelling corrected = 7.5 + 0.4 × Pgas (MPa). 3 This is interpreted as a (pore fluid/solid matrix) mechanical coupling, com-
4 bined with a structural effect, which provides an upper bound for in situ
5 swelling pressure. Hence, when bentonite-argillite mock-up gas critical pres-
6 sure is identified, the coupling has to be taken into account, and a correction
7 to the associated effective swelling pressure has to be performed.
8 After bentonite swelling characterisation, a setting procedure has been pro-
9 posed for the bentonite-argillite mock-up. It is validated from water perme-
10 ability measurements of four different mock-ups. After 21 to 28 days swelling,
11 bentonite-argillite mock-ups have an average water permeability of 2. 10−21 m2 ,
12 on the order of that of bulk argillite. Hence, after sufficient swelling, bentonite
13 provides a highly impermeable seal, equivalent to that of the argillite host rock.
14 Subsequently, gas critical pressure is identified at Pcritical gas = 4.35 MPa±0.95. 15 This result is within the range provided by Thomas et al. (1968). Moreover,
16 Pcritical gas represents 58 % of the swelling pressure evaluated in the absence
17 of gas pressure; it corresponds to a corrected effective swelling pressure for
18 bentonite Pswelling corrected of 9.2 MPa, so that gas critical pressure Pcritical gas

ACC
EPTE
D M
ANU
SCR
IPT
ACCEPTED MANUSCRIPT
26
19 represents 47 % of Pswelling corrected. This is also in accordance with the studies
20 of Schlomer (1998); Hildenbrand et al. (2002): gas breakthrough (and flow)
21 is possible in mudrocks at gas pressures much lower than confining pressure
22 or fracture pressure (i.e. the sum of confining pressure and tensile strength of
1 the rock). And while the mock-up is globally highly impermeable to water,
2 gas leakage is shown to occur preferentially at the bentonite-argillite interface
3 rather than in the bentonite bulk.
4 Further, the methodology used here may be adapted to characterising gas
5 migration through other host rock/sealing material couples, such as granite
6 (as proposed for nuclear waste storage by Spain, Sweden or Canada) coupled
7 to various engineered bentonite/sand sealing mixtures.
8 Acknowledgments
9 The authors are grateful to ANDRA (French Agency for Nuclear Waste Man-
10 agement) for funding this research program under contract no 031685 SMG-
11 14/02/2005. We also acknowledge the Catalysis and Solid State Chemistry
12 Laboratory-UMR CNRS 8010 (Prof. N. Fatah, and G. Cambien), for useful
13 expertise on laser granulometry.
14 References
15 Abou-Chakra Guery, A., Cormery, F., Shao, J., Kondo, D., 2008. A microme-
16 chanical model of elastoplastic and damage behavior of a cohesive geoma-
17 terial. International Journal of Solids ad Structures 45, 1406–1429.
18 ANDRA, 2005. Referentiel des materiaux d”un stockage de dechets a haute

ACC
EPTE
D M
ANU
SCR
IPT
ACCEPTED MANUSCRIPT
27
19 activite et a vie longue - TOME 1- Materiaux a base d”argiles gonflantes.
20 Internal report (in French), CRP ASCM 04 0015, FDR HAVL-Argile (avail-
21 able on CD-Rom).
22 Davy, C. A., Skoczylas, F., Barnichon, J.-D., Lebon, P., 2007. Permeability of
23 macro-cracked argillite under confinement: Gas and water testing. Physics
24 and Chemistry of the Earth 32 (8-14), pp. 667–680.
25 Fouche, O., Wright, H., Cleac’h, J. L., Pellenard, P., 2004. Fabric control
26 on strain and rupture of heterogeneous shale samples by using a non-
27 conventional mechanical test. Applied Clay Science 26, pp. 367–387.
1 Galle, C., 2000. Gas breakthrough pressure in compacted Fo-Ca clay and
2 interfacial gas overpressure in waste disposal context. Applied Clay Science
3 17, pp. 85–97.
4 Hildenbrand, A., Schlomer, S., Kroos, M., 2002. Gas breakthrough experi-
5 ments on fine-grained sedimentary rocks. Geofluids 2, pp. 3–23.
6 Hokmark, H., Ledesma, A., Lassabatere, T., Falth, B., Borgesson, L., Robinet,
7 J., Sellali, N., Semete, P., 2007. Modelling heat and moisture transport in
8 the ANDRA/SKB temperature buffer test. Physics and Chemistry of the
9 Earth 32 (8-14), pp. 753–766.
10 Horseman, S. T., Harrington, J. F., Sellin, P., 1999. Gas migration in clay
11 barriers. Engineering Geology 54, pp. 139–149.
12 Ito, H., 2006. Compaction properties of granular bentonites. Applied Clay
13 Science 31, pp. 47–55.
14 Komine, H., 2004. Simplified evaluation for swelling characteristics of ben-
15 tonites. Engineering Geology 71, pp. 265–279.
16 Lebon, P., Mouroux, B., 1999. Knowledge of the three French underground
17 laboratory sites. Engineering Geology 52, pp. 251–256.
18 Lion, M., Skoczylas, F., Ledesert, B., 2004. Determination of the main hy-

ACC
EPTE
D M
ANU
SCR
IPT
ACCEPTED MANUSCRIPT
28
19 draulic and poro-elastic properties of a limestone from Bourgogne, France.
20 Int. J. Rock Mech. Min. Sci. 41, pp. 915–925.
21 Lloret, A., Villar, M. V., Sanchez, M., Gens, A., Pintado, X., Alonso, E. E.,
22 2003. Mechanical behaviour of heavily compacted bentonite under high suc-
23 tion changes. Geotechnique 53 (1), pp. 27–40.
24 Loosveldt, H., Lafhaj, Z., Skoczylas, F., 2002. Experimental study of gas and
25 liquid permeability of a mortar. Cement and Concrete Research 32, pp.
26 1357–1363.
27 Martin, P. L., Barcala, J. M., 2005. Large scale buffer material test: Mock-up
1 experiment at CIEMAT. Engineering Geology 81, pp. 298–316.
2 Meziani, H., Skoczylas, F., 1999. An Experimental Study of the Mechanical
3 Behaviour of a Mortar and of its Permeability under Deviatoric Loading.
4 Materials and Structures 32, pp. 403–409.
5 Mitchell, J. K., 1993. Fundamentals of Soil Behavior. 2nd Edition, John Wiley
6 & Sons, New York.
7 Montes-H, G., Marty, N., Fritz, B., Clement, A., Michau, N., 2005. Modelling
8 of long-term diffusion-reaction in a bentonite barrier for radioactive waste
9 confinement. Applied Clay Science 30, pp. 181–198.
10 Mugler, C., Filippi, M., Montarnal, P., Martinez, J.-M., Wileveau, Y., 2006.
11 Determination of thermal conductivity of opalinus clay via simulations of
12 experiments performed at the Mont Terri undergroung laboratory. Journal
13 of Applied Geophysics 58, pp. 112–129.
14 Neaman, A., Pelletier, M., Villieras, F., 2003. The effects of exchanged cation,
15 compression, heating and hydration on textural properties of bulk bentonite
16 and its corresponding purified montmorillonite. Applied Clay Science 22, pp.
17 153–168.
18 Pusch, R., Forsberg, T., 1983. Gas migration through bentonite clay. In:

ACC
EPTE
D M
ANU
SCR
IPT
ACCEPTED MANUSCRIPT
29
19 SKBF-KBS Technical Report,TR. 83-71, Stockholm, Sweden, 15pp.
20 Schlomer, S., 1998. Abdichtungseigenschaften pelitischer Gesteine: Ex-
21 perimentelle Charakterisierung und geologische Relevanz. Berichte des
22 Forschungszentrums Julich.
23 Skoczylas, F., Fleureau, J., 2003. GDR FORPRO, Benchmark Permeabilite
24 sur mortier et argilite. Synthese des resultats. In: Actes du Colloque du
25 GDR-FORPRO (in French), 22-24 Sept.
26 Skoczylas, F., Henry, J., 1995. A Study of the Intrinsic Permeability of Granite
27 to Gas. Int. J. Rock Mech. Min. Sci. & Geomech. Abstr. 32 (2), pp. 171–179.
1 Skoczylas, F., 1996. Ecoulements et couplages fluide-squelette dans les mi-
2 lieux poreux. Etudes experimentales et numeriques. Memoire d’Habilitation
3 a Diriger des Recherches (French Dissertation assessing Research Supervi-
4 sion - in French), Universite des Sciences et Technologie de Lille, France.
5 Thomas, L., Katz, D., Tek, M., 1968. Threshold pressure phenomena in porous
1 media. Society of Petroleum Engineers Journ 243, pp. 174–184.
2 Tien, Y. M., Wu, P. L., Chuang, W. S., Wu, L. S., 2004. Micromechanical
3 model for compaction characteristics of bentonite-sand mixtures. Applied
4 Clay Science 26, pp. 489–498.
5 Van Geet, M., Volckaert, G., Bastiaens, W., Maes, N., Weetjens, E., Sillen, X.,
6 Vallejan, B., Gens, A., 2007. Efficiency of a borehole seal by means of pre-
7 compacted bentonite blocks. Physics and Chemistry of the Earth 32 (1-7),
8 pp. 123–134.
9 Victoria Villar, M., Lloret, A., 2007. Dismantling of the first section of the
10 FEBEX in situ test: THM laboratory tests on the bentonite blocks retrieved.
11 Physics and Chemistry of the Earth 32 (8-14), pp. 716–729.
1 Victoria Villar, M., Martin, P. L., Barcala, J. M., 2005. Modification of physi-
2 cal, mechanical and hydraulic properties of bentonites by thermo-hydraulic
ACC
EPTE
D M
ANU
SCR
IPT
ACCEPTED MANUSCRIPT
30
3 gradients. Engineering Geology 81, pp. 284–297.
4 Wright, H., 2001. Role de la mineralogie, de la texture et de la structure dans
5 la deformation et la rupture des argilites de l’Est. ENPC PhD thesis in
6 Geologie de l’Ingenieur, 185p., France.

ACC
EPTE
D M
ANU
SCR
IPT
ACCEPTED MANUSCRIPT
31
7 List of Tables
8 1 Chemical composition of the reconstituted in situ water 9 (expressed in mole per litre of water. 31
10 2 Identification of ductile tubes deformability: slope of average 11 gauge strain vs. inner pressure Pi for three different materials, 12 all tested under 12 MPa confining pressure. 32
13 3 Bentonite swelling characteristics: effective swelling pressure 14 and kinetics, under 12 MPa confining pressure. 33
15 4 Gas migration test results for four bentonite/argillite samples 16 subjected to 12 MPa confinement and 0 MPa interstitial water 17 pressure. 34

ACC
EPTE
D M
ANU
SCR
IPT
ACCEPTED MANUSCRIPT
32
Chemical
element Cl S Na K Ca Mg Fe Si Sr
symbol
Quantity
(mol.l−1 ) 0.03 0.034 0.032 0.0071 0.015 0.014 0.00033 9.4 ×10⁻⁵ 0.0011 Table 1 Chemical composition of the reconstituted in situ water (expressed in mole per litre of water.

ACC
EPTE
D M
ANU
SCR
IPT
ACCEPTED MANUSCRIPT
33
Tube material aluminium aluminium-PlexiglasT M PlexiglasT M
Deformability 12.7±0.3 87.4 357.1
(in 10−6 per MPa)
Table 2 Identification of ductile tubes deformability: slope of average gauge strain vs. inner pressure Pi for three different materials, all tested under 12 MPa confining pressure.

ACC
EPTE
D M
ANU
SCR
IPT
ACCEPTED MANUSCRIPT
34
Tube Hydraulic Bentonite effective Time to reach
material cut-off time swelling asymptotic effective (hours) pressure (MPa) swelling pressure (days)
aluminium tube 1 8 7.60 8
aluminium tube 2 4 7.49 10
PlexiglasT M - test 1 5 7.46 14
PlexiglasT M - test 2 - 7.44 14
PlexiglasT M - test 3 - 7.54 12
aluminium-PlexiglasT M 1 7.42 -
On average ≤ 8 7.5±0.1 ≤ 14
Table 3 Bentonite swelling characteristics: effective swelling pressure and kinetics, under 12 MPa confining pressure.

ACC
EPTE
D M
ANU
SCR
IPT
ACCEPTED MANUSCRIPT
35
Sample 1 Sample 2 Sample 3 Sample 4 argillite tube
Sample no no with crack sealing
type obturators obturators obturators and no obturators
Water permeability 1.3 2.5 1.5 3
(10−21 m2)
Gas critical 4.5 4 3.6 5.3
pressure (MPa)
Table 4 Gas migration test results for four bentonite/argillite samples subjected to 12 MPa confinement and 0 MPa interstitial water pressure.

ACC
EPTE
D M
ANU
SCR
IPT
ACCEPTED MANUSCRIPT
36
18 List of Figures
19 1 Triaxial loading sustained by an argillite/bentonite interface 20 specimen (resp. by a ductile material/bentonite specimen). 36
21 2 Experimental triaxial set-up for bentonite swelling 22 identification, and argillite/bentonite interface in situ 23 reproduction. 37
24 3 Photograph of (a): a pre-compacted bentonite plug; (b): an 25 argillite tube after coring and top and bottom surface grinding; 26 (c) PlexiglasT M tube instrumented with four strain gauges; 27 (d): Aluminium-PlexiglasT M tube before instrumentation. 38
28
29
30
31
32
33
722
723
4 Observation of the onset of gas migration for the bentonite/argillite mock-up. As shown on this photograph, gas migration occurs as soon as a first gas bubble is observed at the base of the downstream water circuit, inside the flexible transparent tube filled with water and plugged onto it. 39
5 Aluminium tubes, aluminium-PlexiglasT M tube and
PlexiglasT M tube calibrations, all performed at 12 MPa confining pressure. 40
724
725
726
727
728
729
730
731
6 Swelling pressure time variation for bentonite placed inside an aluminium tube (1 or 2) and subjected to a hydraulic water gradient. 41
7 Bentonite swelling inside a PlexiglasT M tube under a 4 MPa
static water pressure: (a) First test, with two phases when water pressure is off (from day 20 to 22, and from day 26 to 34); (b) Tests 2 and 3 with water pressure off at day 14 (test 2) or day 12 (test 3). 42
732
733
734
735
736
737
738
8 Comparison of test results for bentonite swelling either: (a) inside aluminium tube 1 or tube 2, or inside a PlexiglasT M
tube (three tests); (b): inside an aluminium-PlexiglasT M tube or inside a PlexiglasT M tube (three tests). 43
9 Bentonite swelling inside a PlexiglasT M tube - Effect of
gas injection upon: (a) bentonite swelling response; (b) bentonite/tube contact pressure. 44
ACC
EPTE
D M
ANU
SCR
IPT
ACCEPTED MANUSCRIPT
37
Pc
Pi downstream
Pc Pc
Pc Pc
Pi upstream
Pc
Fig. 1. Triaxial loading sustained by an argillite/bentonite interface specimen (resp. by a ductile material/bentonite specimen).

ACC
EPTE
D M
ANU
SCR
IPT
ACCEPTED MANUSCRIPT
38
Pi downstream
Gilson-type pump
triaxial cell
argillite/bentonite
specimen
Gilson-type
pump
Pc
Pi upstream Fig. 2. Experimental triaxial set-up for bentonite swelling identification, and argillite/bentonite interface in situ reproduction.

ACC
EPTE
D M
ANU
SCR
IPT
ACCEPTED MANUSCRIPT
39
24m
m h
eigh
t
38.5mm diameter
(a)
50 mm height
φ 65 mm
(b)
(c) (d) Fig. 3. Photograph of (a): a pre-compacted bentonite plug; (b): an argillite tube after coring and top and bottom surface grinding; (c) PlexiglasT M tube instrumented with four strain gauges; (d): Aluminium-PlexiglasT M tube before instrumentation.

ACC
EPTE
D M
ANU
SCR
IPT
ACCEPTED MANUSCRIPT
40
Fig. 4. Observation of the onset of gas migration for the bentonite/argillite mock-up. As shown on this photograph, gas migration occurs as soon as a first gas bubble is observed at the base of the downstream water circuit, inside the flexible transparent tube filled with water and plugged onto it.

ACC
EPTE
D M
ANU
SCR
IPT
ACCEPTED MANUSCRIPT
41
Fig. 5. Aluminium tubes, aluminium-PlexiglasT M tube and PlexiglasT M tube cali- brations, all performed at 12 MPa confining pressure.

ACC
EPTE
D M
ANU
SCR
IPT
ACCEPTED MANUSCRIPT
42
Fig. 6. Swelling pressure time variation for bentonite placed inside an aluminium tube (1 or 2) and subjected to a hydraulic water gradient.

ACC
EPTE
D M
ANU
SCR
IPT
ACCEPTED MANUSCRIPT
43
(a)
(b) Fig. 7. Bentonite swelling inside a PlexiglasT M tube under a 4 MPa static water pressure: (a) First test, with two phases when water pressure is off (from day 20 to 22, and from day 26 to 34); (b) Tests 2 and 3 with water pressure off at day 14 (test 2) or day 12 (test 3).

ACC
EPTE
D M
ANU
SCR
IPT
ACCEPTED MANUSCRIPT
44
(a)
(b) Fig. 8. Comparison of test results for bentonite swelling either: (a) inside alu- minium tube 1 or tube 2, or inside a PlexiglasT M tube (three tests); (b): inside an aluminium-PlexiglasT M tube or inside a PlexiglasT M tube (three tests).

ACC
EPTE
D M
ANU
SCR
IPT
ACCEPTED MANUSCRIPT
45
Con
tact
pre
ssur
e in
crea
se (M
Pa)
(a)
(b) Fig. 9. Bentonite swelling inside a PlexiglasT M tube - Effect of gas injection upon: (a) bentonite swelling response; (b) bentonite/tube contact pressure.