plasma-based surface modifications of polyester fabrics ... · pdf fileplasma-based surface...
TRANSCRIPT

von der Fakultät für Naturwissenschaften der Technischen Universität Chemnitz
genehmigte Dissertation
Gutachter: Prof. Dr. Stefan Spange, Technische Universität Chemnitz
Prof. Dr. Brigitte Voit, Technische Universität Dresden
Eingereicht am: 01.11.2011
Tag der Verteidigung: 04.01.2012
Plasma-based surface modifications of polyester
fabrics and their interaction with cationic
polyelectrolytes and anionic dyes
von der Fakultät für Naturwissenschaften der Technischen Universität Chemnitz
genehmigte Dissertation zur Erlangung des akademischen Grades
doctor rerum naturalium
(Dr. rer. nat.)
vorgelegt von Master in Chemie
Tarek Sayed Mohamed Salem
geboren am 10.10.1974, Ägypten
Gutachter: Prof. Dr. Stefan Spange, Technische Universität Chemnitz
Brigitte Voit, Technische Universität Dresden
1.11.2011
04.01.2012
based surface modifications of polyester
fabrics and their interaction with cationic
polyelectrolytes and anionic dyes
von der Fakultät für Naturwissenschaften der Technischen Universität Chemnitz
akademischen Grades
Gutachter: Prof. Dr. Stefan Spange, Technische Universität Chemnitz
based surface modifications of polyester
fabrics and their interaction with cationic
polyelectrolytes and anionic dyes

DEDICATED TO THE SPIRIT OF MY FATHER

Abstract
Salem, Tarek
“Plasma-based surface modifications of polyester fabrics and their interaction
with cationic polyelectrolytes and anionic dyes”
Plasma-based surface modifications offer many interesting possibilities for the production of
high value-added polymeric materials. In this work, different plasma-based synthetic concepts
were employed to endow poly(ethylene terephthalate) (PET) fabrics with accessible amine
functionalities. These concepts were compared to find out the appropriate engineering
methods, which can be further accepted by textile industries to overcome the limited
reactivity of PET fabric surfaces, while the bulk characteristics are kept unaffected.
Amine functionalities were introduced onto the surface of PET fabrics using either
low-pressure ammonia plasma treatment or coating oxygen plasma-treated PET fabric with
cationic polyelectrolytes. Two different cationic polyelectrolytes were used in this study
namely poly(diallyldimethylammonium chloride) as an example of strong polyelectrolytes
and poly(vinyl amine-co-vinyl amide) as an example of weak polyelectrolytes. The modified
surfaces were characterized by a combination of various surface-sensitive techniques such as
X-ray photoelectron spectroscopy (XPS), electrokinetic measurements and time-dependent
contact angle measurements. Furthermore, the amine functionalities introduced by different
surface modifications were used for the subsequent immobilization of various classes of
anionic dyes to evaluate the efficiency of different surface modifications. Color strength (K/S)
and fastness measurements of colored fabrics were also explored. Their results can be taken as
a measure of the extent of the interaction between different modified surfaces and anionic
dyes.
Finally, it was demonstrated that anchoring poly(vinyl amine-co-vinyl amide) layer onto PET
fabric surfaces modified with low-pressure oxygen plasma is an efficient approach to improve
coloration behavior and to overcome different problems related to PET fabrics coloration,
such as coloration of PET/wool blend fabric with a single class of dyes. This is a crucial step
towards the substrate independent surface coloration, which becomes dependent on the
properties of the top layer rather than chemical structure of the fibers.
Keywords
Plasma treatment, poly(ethylene terephthalate) (PET), adhesion, polyelectrolytes, poly(vinyl
amine-co-vinyl amide) (PVAm), XPS, zeta-potential, metachromacy and anionic dyes.

Acknowledgement
I would like to start my sincere appreciation to Prof. Dr. Stefan Spange, professor of polymer
chemistry, Technical University of Chemnitz, for giving an opportunity to carry out this work
and for his scientific supervision. I would also like to express my extremely sincere gratitude
and appreciation to Dr. Frank Simon for his valuable discussion, helpful advices and
encouragement; I will never be able to thank him properly or sufficiently for all the precious
time he gave me and for his infinite patience and wisdom. Additionally, I would also like to
give a special thank to Dr. Mirko Nitschke and Dr. Susanne Höhne for their valuable
discussion, helpful suggestions and encouragement. The value of their advices throughout this
dissertation is not easy to express in words. I am indebted to them.
I have spent more than four years conducting my present work at the department of Polymer
Interfaces at the Leibniz Institute of Polymer Research (IPF) in Dresden. It has been a time of
great experience and a lot of interesting work. I would like also to express my sincere thanks
to all scientific staff of Polymer Interfaces department, especially to Dr. Cornelia Bellmann,
Dr. Karina Grundke, Dr. Ralf Frenzel, Mr. Dieter Pleul, Dr. Alla Synytska, and Dr. Alfredo
Calvimontes.
The appreciations are extended to the Egyptian government for the financial support, and I
would like to extend my gratitude to all members of the Egyptian Culture Office in Berlin for
their interest and enormous helping.
Much gratitude is owed Prof. Dr. Madiha El-Kashouti, Prof. Dr. Azza El-Halwagy, Prof. Dr.
Mohamed El-Molla, Dr. Martin Müller, Dr. Rolf-Dieter Hund and Dr. Ulrich Oertel for their
valuable discussion. I would also like to thank Dr. Saber Ibrahim, M.Sc. Ali Gaber, Dipl. Ing.
Steffi Hempel and Mrs. Katharina Fink for their advices and assistances during all time and
especially during the first weeks in Dresden.
My special thanks address to Mrs. Anja Casperi, Mrs. Cornelia Krause and Mrs. Christina
Elgner for their skillful laboratory performance; they helped me the most, providing great
facilities for my research work.
Finally, I acknowledge the strong support and love that I have received from all of my family
during the preparation of this dissertation. I am very grateful to my mother, my wife Eman
and my two daughters Nashwa and Noran, who gave the incredible love and the endless
support during all time.

Table of Contents i
Table of Contents Table of Contents i
List of Figures iv
List of Tables viii
List of Abbreviations ix
1 Introduction 1
1.1 Overview and motivation 1
1.2 Objective and synthetic concepts 4
2 Theoretical Background 6
2.1 Textile fibers 6
2.2 PET fibers: production and applications 7
2.2.1 PET/wool blend fabrics 9
2.2.2 Coloration of PET fabrics 10
2.3 Anionic dyes 12
2.3.1 Acid dyes 12
2.3.2 Reactive dyes 13
2.3.3 Direct dyes 14
2.3.4 Printing textile fabrics with anionic dyes 14
2.4 Plasma surface modification of textiles 16
2.4.1 Nature of plasma 16
2.4.2 Plasma-based modification methods of textiles 17
2.4.2.1 Simple plasma treatment of textile surfaces 17
2.4.2.2 Adsorption of polyelectrolytes on plasma treated textile surfaces 20
2.5 Use of polyelectrolytes in textile applications 20
2.5.1 Polyelectrolyte classifications 21
2.5.2 Poly(diallyldimethylammonium chloride) (PDADMAC) 22
2.5.3 Poly(vinyl amine-co-vinyl amide) (PVAm) 23
2.5.4 Polyelectrolyte/dye interactions 25
3 Experimental Part 27
3.1 Materials 27
3.1.1 PET fabric 27
3.1.2 PET/ wool blend fabric 27
3.1.3 PET film 27
3.1.4 Plasma gases 28
Table of Contents ii
3.1.5 Polyelectrolytes 28
3.1.6 Dyestuffs and auxiliaries of printing pastes 29
3.1.7 Solvent and other chemicals 30
3.2 Surface modification methods of PET fabrics 30
3.2.1 Ammonia plasma treatment 30
3.2.2 Oxygen plasma treatment 31
3.2.3 Coating of oxygen plasma-treated PET fabrics with cationic polyelectrolytes 31
3.3 Characterization methods 31
3.3.1 X-ray photoelectron spectroscopy (XPS) 31
3.3.2 Electrokinetic measurements 33
3.3.3 Kinetics measurements of wetting 35
3.3.4 ATR- FTIR spectroscopy 35
3.3.5 Differential scanning calorimetry measurements (DSC) 36
3.3.6 Atomic force microscopy (AFM) 37
3.3.7 Scanning electron microscopy (SEM) 38
3.4 Coloration of PET fabrics by printing 38
3.4.1 Preparation of printing pastes 38
3.4.2 Printing and post-treatment methods 39
3.5 Characterization methods of printed PET fabrics 39
3.5.1 Color strength measurements of printed fabrics 39
3.5.2 Color fastness of printed fabrics 40
3.5.2.1 Color fastness to washing 40
3.5.2.2 Color fastness to rubbing 40
4 Results and Discussion 41
4.1 Low-pressure ammonia plasma treatment 41
4.1.1 XPS characterization 42
4.1.2 Electrokinetic measurements 47
4.1.3 Surface morphology 49
4.1.4 Kinetics measurements of wetting 49
4.1.5 Stability of the ammonia plasma-treated PET fabric 52
4.1.6 Determination of the degree of crystallinity by DSC 54
4.2 Surface functionalization of PET fabric with cationic polyelectrolytes 55
4.2.1 Low-pressure oxygen plasma treatment 55
4.2.1.1 XPS characterization 57
4.2.1.2 Electrokinetic measurements 58
4.2.1.3 Surface morphology 60

Table of Contents iii
4.2.1.4 Kinetics measurements of wetting 60
4.2.1.5 Stability of the oxygen plasma-treated PET fabric 62
4.2.1.6 Determination of the degree of the crystallinity by DSC 64
4.2.2 Coating of oxygen plasma-treated PET fabric with cationic polyelectrolytes 65
4.2.2.1 XPS characterization 66
4.2.2.2 ATR-FTIR spectroscopy 71
4.2.2.3 Electrokinetic measurements 72
4.2.2.4 Surface morphology 75
4.2.2.5 Kinetics measurements of wetting 76
4.3 Surface activity of modified PET fabrics towards anionic dyes 79
4.3.1 Anionic acid dyes 79
4.3.2 Anionic reactive dyes 82
4.3.3 Fastness properties of colored PET fabrics 87
4.4 Surface functionalization of PET/wool blend fabric with PVAm 90
4.4.1 XPS characterization 90
4.4.2 Electrokinetic measurements 92
4.4.3 Kinetics measurements of wetting 93
4.4.4 Surface morphology 94
4.4.5 Evaluation of PVAm coating stability 96
4.4.6 Printing properties of PET/wool blend fabric 97
4.4.7 Fastness properties of colored PET/wool blend fabric. 98
5 Summary and Outlook 100
6 References 104
7 Selbständigkeitserklärung 116
8 Curriculum Vitae 117
Publications from this work 118

List of Figures iv
List of Figures
Figure 1.1 Global apparel fiber market trends from 1980 to 2010 . ..................................... 2 Figure 1.2 Step-wise mechanism of the aminolysis reaction of PET. .................................. 3 Figure 1.3 Schematic representation of the different synthetic routes investigated in the
present work for introduction amine-containing groups onto PET fabric surfaces. .. 5 Figure 2.1 Classification of textile fibers according to their origin. ..................................... 6 Figure 2.2 End uses of PET fibers. ....................................................................................... 7 Figure 2.3 PET fiber production output. ............................................................................... 8 Figure 2.4 Textile dye classes global market share. ........................................................... 11 Figure 2.5 The chemical structure of C.I. Acid yellow 69. ................................................ 12 Figure 2.6 Schematic representation of acid dye fixation on fibers by ionic bond. ........... 12 Figure 2.7 The reaction mechanism of cellulosate anion with MCT type reactive dye. .... 13 Figure 2.8 The reaction mechanism of cellulosate anion with VS type reactive dye. ........ 13 Figure 2.9 The chemical structure of C.I. Direct Yellow 4. ............................................... 14 Figure 2.10 Schematic representation of different synthetic approaches used for surface
functionalization of textiles based on low-pressure plasma treatment. ................... 18 Figure 2.11 Schematic representation of plasma effects on a polymer surface.................. 19 Figure 2.12 Classification scheme of polyelectrolytes. ...................................................... 21 Figure 2.13 Cyclopolymerization of DADMAC and structures of resulting polymers. .... 22 Figure 2.14 Protonation/deprotonation equilibrium of PVAm. .......................................... 23 Figure 2.15 Enamine-Imine tautomerism in vinyl amine. .................................................. 24 Figure 2.16 Synthesis of PVAm from hydrolysis of PVFA. .............................................. 24 Figure 2.17 Chemical structure of poly(vinyl amine-co-vinyl amide) copolymer. ............ 25 Figure 2.18 An amino and formamide groups formed an amidine group. ......................... 25 Figure 2.19 Molecular arrangements in J- (a) and H-aggregates (b). ................................. 26 Figure 3.1 Chemical structures of the polyelectrolytes used to modify PET fabric
surface. ..................................................................................................................... 28 Figure 3.2 Schematic representation of chemical labeling of primary amino group by
TFBA. ...................................................................................................................... 33 Figure 3.3 Schematic representation of the electrochemical double layer at the interface
according to the Gouy-Chapman-Stern-Grahame (GCSG) model. ......................... 34 Figure 3.4 Schematic representation of streaming measuring cell for fabrics. .................. 34 Figure 4.1 Possible surface functionalization reactions on PET fabric using ammonia
plasma. ..................................................................................................................... 42 Figure 4.2 Wide-scan XPS spectra of the unmodified PET fabric (a) and ammonia
plasma-treated (600 s) PET fabric (b). The peaks are assigned to the corresponding chemical elements. ........................................................................... 43
Figure 4.3 High-resolution C 1s XPS spectra of the unmodified PET fabric (a) and ammonia plasma-treated (600 s) PET fabric (b). ..................................................... 45
Figure 4.4 Atomic percent of the total nitrogen and fraction of –NH2 groups that able to react with TFBA after ammonia plasma treatments as determined by XPS and TFBA labeling. ........................................................................................................ 46

List of Figures v
Figure 4.5 High-resolution N 1s XPS spectrum of ammonia plasma-treated (600 s) PET fabric. ....................................................................................................................... 47
Figure 4.6 ζ-pH dependence for the unmodified PET fabric and ammonia plasma-treated PET fabric at different treatment time. ........................................................ 48
Figure 4.7 Three-dimensional AFM images of PET fibers showing surface roughness of the unmodified PET fiber (a) and the ammonia plasma-treated (600 s) PET fiber (b). ............................................................................................................................ 49
Figure 4.8 Contact angles of water droplets in dependence on resting time on the unmodified PET fabric and ammonia plasma-treated PET fabric at different treatment time. The error of each measurement is ± 2°. .......................................... 50
Figure 4.9 Image sequences of water droplet applying to the unmodified PET fabric surface (a) and the ammonia plasma-treated (600 s) PET fabric surface (b). ......... 51
Figure 4.10 The [N]:[C] atomic ratio of ammonia plasma-treated (600 s) PET fabric as a function of the ageing time in the air under ambient conditions. ......................... 52
Figure 4.11 Effect of ageing time on the contact angles of water droplets in dependence on resting time on the ammonia plasma-treated (600 s) PET fabric. The error of each measurement is ± 2°. ....................................................................................... 53
Figure 4.12 DSC thermograms of the unmodified and ammonia plasma-treated PET fabrics 2nd heating run (a), and the effect of plasma treatment time on percent of crystallinity for different PET fabrics (b). ............................................................... 54
Figure 4.13 Possible surface functionalization reactions on PET fabric using oxygen plasma. ..................................................................................................................... 56
Figure 4.14 High-resolution C 1s XPS spectra of (a) unmodified PET fabric and (b) oxygen plasma-treated (600 W, 15 s) PET fabric. ................................................... 58
Figure 4.15 ζ-pH dependence for the unmodified PET fabric and oxygen plasma-treated PET fabric at different treatment power for 15 s (a) and ≤ 30 s (b). ........... 59
Figure 4.16 Three-dimensional AFM images of single PET fiber showing surface roughness of unmodified PET (a) and oxygen plasma-treated (600 W, 15 s) PET fabric (b). ................................................................................................................. 60
Figure 4.17 Contact angles of water droplets in dependence on resting time on the unmodified PET fabric and the oxygen plasma-treated PET fabric at different treatment power for 15 s (a) and ≤ 30 s (b). The error of each measurement is ± 2°. .......................................................................................................................... 61
Figure 4.18 High-speed image sequences at different resting time for water droplet applying to oxygen plasma-treated (600 W, 15 s) PET fabric................................. 62
Figure 4.19 The [O]:[C] atomic ratio for oxygen plasma-treated (600 W for 15 s) PET fabric as function of the ageing time in air under ambient conditions. ................... 62
Figure 4.20 Effect of ageing times on the contact angles of water droplets in dependence on resting time on oxygen plasma-treated (600 W, 15 s) PET fabric surface. The error of each measurement is ± 2°. ..................................................... 64
Figure 4.21 DSC thermograms of the unmodified and oxygen plasma-treated PET fabrics 2nd heating run (a), and the effect of plasma treatment conditions on percent of crystallinity for different PET fabrics (b). .............................................. 65

List of Figures vi
Figure 4.22 Wide-scan XPS spectra of the unmodified PET fabric (a), oxygen plasma-treated (600 W, 15 s) (b), PDADMAC-treated PET obtained with CPDADMAC = 3 wt. % (c) and PVAm-treated PET obtained with CPVAm= 3 wt. % (d). The intensity of all spectra were related to the O 1s peak. ............................... 67
Figure 4.23 Schematic representation of counterion effect on the adsorption of PDADMAC at the oxygen plasma-treated PET fabric. ........................................... 69
Figure 4.24 Schematic representation of heat-induced cross-linking reaction. .................. 69 Figure 4.25 High-resolution C 1s XPS spectra of the unmodified PET fabric (a), the
oxygen plasma-treated (600 W, 15 s) PET fabric (b), PDADMAC-treated PET fabric obtained with CPDADMAC = 3 wt. % (c), and PVAm-treated PET fabric obtained with CPVAm = 3 wt. %.. ............................................................................... 70
Figure 4.26 High-resolution N 1s XPS spectrum of PDADMAC-treated PET fabric obtained with CPDADMAC = 3wt. % (a), and PVAm-treated PET fabric obtained with CPVAm = 3wt.% (b). .......................................................................................... 71
Figure 4.27 ATR-FTIR spectra of the unmodified PET fabric (a), the oxygen plasma-treated (600 W and 15 s) PET fabric (b), PVAm-treated PET before (c) and after heat treatment at 120 °C (d). The spectra have been shifted vertically for clarity. . 72
Figure 4.28 ζ-pH dependence for the unmodified PET fabric, the oxygen plasma- modified (600 W, 15s) PET fabric and PDADMAC-treated PET fabrics obtained with different concentrations of PDADMAC. ......................................................... 73
Figure 4.29 ζ-pH dependence for the unmodified PET fabric, the oxygen plasma-treated (600 W, 15s) PET fabric and PVAm-treated PET fabrics obtained with different concentrations of PVAm. .......................................................................... 74
Figure 4.30 SEM images of the unmodified PET fabric (a), oxygen plasma-treated (600 W, 15s) PET fabric (b), PDADMAC-treated PET fabric obtained with a CPDADMAC = 3 wt. % after rinsing (c) and PVAm-treated PET obtained with a CPVAm= 3 wt. % after rinsing (d). ............................................................................. 76
Figure 4.31 Contact angles of water droplets in dependence on resting time on the unmodified PET fabric, oxygen plasma-treated (600 W, 15 s) PET and plasma modified-PET coated with PDADMAC and PVAm obtained with 3 wt. % of polyelectrolyte. The error of each measurement is ± 2°. ......................................... 77
Figure 4.32 Chemical structures of the anionic acid dyes used in this work as an example for PET fabrics coloration. ........................................................................ 79
Figure 4.33 K/S absorption spectra of different PET fabrics printed with C.I. Acid Red 18 after ammonia plasma treatment (a), PDADMAC coating (c), PVAm coating (e), and printed with C.I. Acid Blue 80 after ammonia plasma treatment (b), PDADMA coating (d) PVAm coating (f). ............................................................... 80
Figure 4.34 The binding mechanism of acid dye with modified PET fabric surface. ........ 81 Figure 4.35 Chemical structures of anionic reactive dyes used in this work to color
ammonia plasma-treated and polyelectrolyte-modified PET fabrics. Dyes C.I. Reactive Violet 2 and C.I. Reactive Blue 5 are typical MCT dyes, while C.I. Reactive Violet 5 and C.I. Reactive Black 5 are VS dyes. ...................................... 83

List of Figures vii
Figure 4.36 K/S absorption spectra of ammonia plasma modified PET printed with C.I. Reactive Blue 5 (a) and with C.I. Reactive Violet 2 (b). K/S absorption spectra of PVAm-treated PET printed with C.I. Reactive Blue 5 (c), C.I. Reactive Violet 2 (d), C.I. Reactive Violet 5 (e) and C.I. Reactive Black 5 (f). ............................... 84
Figure 4.37 Schematic representation of the binding mechanism of (a) MCT dyes and (b) VS dyes with modified PET fabric surfaces containing –NH2 groups. ............. 85
Figure 4.38 ζ-pH dependence for the unmodified PET/wool fabric, oxygen plasma- modified (600 W, 15s) PET/wool fabric and PVAm-treated PET/wool fabric obtained with CPVAm = 3 wt. %. ............................................................................... 93
Figure 4.39 Contact angles of water droplets in dependence on resting time on the unmodified PET/wool fabric and oxygen plasma-treated (600 W, 15 s) PET/wool fabric. The error of each measurement is ± 2°. ...................................... 94
Figure 4.40 SEM images of PET/wool fabrics: (a) the unmodified (1000X), (b) the unmodified (5000X), (C) unmodified PET component (50000X), (d) unmodified wool component (50000X), (e) oxygen plasma-treated (600 W, 15 s) PET component, (f) oxygen plasma-treated (600 W, 15 s) wool component, (g) PVAm-treated PET component, and (h) PVAm-treated wool component. ............. 95
Figure 4.40 (Continued.) ................................................................................................... 96 Figure 4.41 K/S absorption spectra of the unmodified PET/wool fabric and PVAm-
treated PET/wool obtained with CPVAm = 3 wt. % printed with C.I. Acid Red 18 (a) and C.I. Acid Blue 80 (b). ................................................................................. 97
Figure 4.42 Digital photos of the unmodified PET/wool blend fabric and PVAm-treated PET/wool blend fabric printed with C.I. Acid Red 18 (a), C.I. Acid Blue 80 (b). .. 98

List of Tables viii
List of Tables
Table 2.1 Plasma gases and their applications. ................................................................... 18 Table 3.1 Polyelectrolytes used to modify PET fabric surfaces. ........................................ 28 Table 3.2 Dyestuffs used in this study. ............................................................................... 29 Table 3.3 Auxiliaries used in print pastes in this study. ..................................................... 29 Table 3.4 Other chemicals used in this study ..................................................................... 30 Table 4.1 The elemental surface composition and atomic ratios determined by XPS for
the unmodified and ammonia plasma-treated PET fabrics for the indicated treatment time. ......................................................................................................... 43
Table 4.2 The elemental surface composition and elemental ratio determined by the XPS for the unmodified and oxygen plasma-treated PET fabrics under different operating conditions. The unmodified PET indicated by plasma power = 0 and modification time = 0. .............................................................................................. 57
Table 4.3 The elemental surface composition and elemental ratios determined by XPS for the unmodified, oxygen plasma-, PDADMAC- and PVAm- treated PET fabrics. ..................................................................................................................... 68
Table 4.4 UV/Vis absorption maxima λmax of anionic dyes in aqueous solution and on modified PET fabrics with different cationic polyelectrolytes. ............................... 86
Table 4.5 Color fastness properties of different modified PET fabrics printed with C.I. Acid Red 18 and C.I. Acid Blue 80. ........................................................................ 87
Table 4.6 The effect of rinsing on [N]:[C] atomic ratio determined by XPS. The unmodified and different modified PET fabric surfaces with PDADMAC or PVAm rinsed at 40 °C, pH 10 for 30 min. ............................................................... 88
Table 4.7 Color fastness properties of PVAm-treated PET fabrics printed with different reactive dyes. ........................................................................................................... 89
Table 4.8 The surface elemental composition and elemental ratios determined by XPS for the unmodified PET/wool fabric, oxygen plasma-treated (600 W, 15 s) PET/wool, fabric and PVAm-treated PET/wool fabric obtained with CPVAm= 3 wt. %. ....................................................................................................................... 91
Table 4.9 The effect of washing on the [N]:[C] elemental ratio determined by XPS. ....... 96 Table 4.10 Color fastness properties of PVAm-treated PET/wool blend fabric printed
with C.I. Acid Red 18 and C.I. Acid Blue 80. ......................................................... 99

List of Abbreviations ix
List of Abbreviations AC Alternating current
ADMA Allyldimethylamine
AFM Atomic force microscopy
at. % Atomic percent
ATR-FTIR Total reflectance-Fourier transform infrared
BE Binding energy
BHET Bis(2-hydroxyethyl)terephthalate
C.I. Color index
Co. Company
Con. Concentration
CPDADMAC PDADMAC concentration
CPVAm PVAm concentration
DADMAC Diallyldimethylammonium chloride
DAMA Diallymethylamine
DC Direct current
DMT Dimethyl terephthalate
DSC Differential scanning calorimetry measurements
EG Ethylene glycol
ESCA Electron spectroscopy for chemical analysis
FDA Food and drug administration
eV Electron volt
GCSG Gouy–Chapman–Stern–Grahame model
GHz Gigahertz
h Hour
Hi-tech High-technology
Hz Hertz
IEP Isoelectric point
IFAM Institut für Fertigungstechnik und Angewandte Materialforschung
IHP Inner helmholtz plane
IR Infrared
IRE Internal reflection element
ISO International organization for standardization
kHz Kilohertz
MCT Monochlorotriazinyl
18-MEA 18-methyl eicosanoic acid
MHz Megahertz
min Minute
MTAAC Methyltriallylammomium chloride

List of Abbreviations x
MW Microwave
OHP Outer helmholtz plane
PDADMAC Poly(diallyldimethylammonium chloride)
PELs Polyelectrolytes
PET Poly(ethylene terephthalate)
pH Hydrogen ion concentration
PVAm Poly(vinyl amine-co-vinyl amide)
RF Radiofrequency
s Second
SEM Scanning electron microscopy
sccm Standard cubic centimeters per minute
t Time
TFBA 4-Trifluoromethylbenzaldhyde
TPA Terephthalic acid
UV Ultraviolet
UV/Vis Ultraviolet/visible
VS vinyl sulphone
W Watt
wt. % Weight percent
XPS X-ray photoelectron spectroscopy

Introduction 1
1 Introduction
1.1 Overview and motivation
A shift toward highly functional and added value textiles is now recognized as being
essential to the sustainable growth of the textile industry (1). To achieve this purpose,
textiles have undergone several surface modifications to alter their surface characteristics
such as wetting and adhesion. Most of these modifications are carried out by wet chemical
methods (2; 3). Such modifications are successful on natural fibers as they have
naturally-occurring graft-sites on their surfaces such as the hydroxyl groups on cellulose
fibers, which offer a platform for surface modifications. However, many other textile
materials lack such reactive functional groups or sites on their polymer chains, e.g.,
polyester.
Poly(ethylene terephthalate) (PET), the main member of polyester polymers, is the most
widely used fabric in the textile industries. Over the years, polyester has become
synonymous with PET. PET fabrics exhibit desirable properties, including high-tensile
strength, dimensional stability, resistance to many chemicals and environmental conditions
(4). These remarkable attributes make it an excellent candidate for a variety of potential
applications including, but not limited to, technical textiles, domestic textiles, the
automotive industry and medical textiles (5). Statistics show that sharing of PET in the total
textile production (about 42%) still dynamically grows and has begun to grab market share
from cotton (Figure 1.1) (6). This is due to the above-mentioned advantages combined with
the material's cheapness and availability of the raw materials with the possibility to recycle
PET fibers. For example, PET bottles and other PET products have recently attracted
attention as new recyclable resources for the production of fibers. Moreover, PET is
stronger than the most natural fibers. Therefore, it is used with those fibers to produce
more resilient and wrinkle free blend fabrics (i.e. PET/wool and PET/cotton) (7).
Unfortunately, like the most synthetic polymers, PET does not possess good adhesion and
wetting properties, due to its inherently low surface free energy. As mentioned previously,
PET does not exhibit reactive functionalities, such as –NH2, – COOH, and/or -OH groups
wanted for different interactions, which makes the molecule of PET has limited reactivity
and innately hydrophobic. The low surface free energy and the resulting poor adhesion to
other materials have created numerous technical challenges, such as less wearing comfort,

Introduction 2
limitation in coloration properties, build-up of electrostatic charges, insufficient soil
release, and difficulties in finishing and poor washability (8). In addition, PET has limited
reactivity toward antimicrobial agents that are used to suppress bacteria, molds, algae, and
microorganisms that cause some health-concerned problems. These limitations in
functional properties of PET fabrics have constrained their further application in garments
and other industries. As a result, significant efforts have been expended to overcome the
PET limitations and to facilitate a broad spectrum of uses.
Figure 1.1 Global apparel fiber market trends from 1980 to 2010 (6).
Accordingly, the surface design and development of highly functional PET fabrics have
become increasingly important in various industrial fields such as adhesives, food
packaging, printing and biomedical technologies. To improve PET’s performance and
obtain new applications, it is often necessary to introduce specific functional groups onto
its surface. In particular, nitrogen-containing PET fabrics can be considered as a potential
substrate for the versatile applications. Implanted amino groups, with their associated
polarity and reactivity, can be useful in the coupling and immobilization of a variety of
functional molecules, which typically contain functional groups able to interact with amino
groups.
For this purpose, various approaches have been developed for modifying PET fibers
properties. The introduction of nitrogen-containing functionalities by conventional wet
chemical reactions is one possible means for altering the physical and chemical nature of
the PET fabric to adapt its surface for different applications. The feasibility of
0
10
20
30
40
50
60
1980 1990 2000 2010
Mar
ket s
hare
(%
)
Year
Cotton
Polyester
Wool
Others

Introduction 3
incorporating amino groups into the surface of PET fibers by reaction with
monofunctional, bi-functional or multifunctional amines was investigated (8-11). For
instance, aminolysis of PET fibers with diamines. In this reaction, ester bonds along PET
react with amines to give amides. The aminolysis reaction mechanism (Figure 1.2)
involves the nucleophilic attack of the amine at the electron-deficient carbonyl carbon to
form a tetrahedral intermediate, under basic conditions; the tetrahedral intermediate is
deprotonated, followed by expulsion of the alcohol leaving group from the tetrahedral
intermediate, which leads to the formation of an amide and an alcohol (12).
C
O
O CH2 CH2 OC
O
n
H2N R NH2
CC
O
O CH2 CH2 O
O
H2N R NH2
n
CC
O
O CH2 CH2 O
O
HN R NH2
CC
O O
O CH2 CH2 O C
O
C
O
NH R NH2n HO CH2 CH2 OH
n-1
Figure 1.2 Step-wise mechanism of the aminolysis reaction of PET.
Other surface engineering methods were also employed to obtain PET fabric surface
decorated with nitrogen-containing groups. The use of chitosan to modify the PET fabric
surface was reported as one probable approach to introduce amino groups. However,
because of the limited reactivity of the PET fabric surface, it is essential for PET fabric to
undergo pretreatment prior modification to improve the adhesion with chitosan (13; 14). In
connection with this pretreatment, alkaline hydrolysis with sodium hydroxide is well
known to make PET fabrics more wettable. The alkaline hydrolysis of PET fibers starts

Introduction 4
from the outer shell of the fiber by breaking polymer chains, and creating additional
hydroxyl and carboxylic groups (9; 15; 16).
In spite of, these surface modifications of PET fibers have been somewhat shown to be an
effective method to achieve surface modification for many years. However, alkaline
hydrolysis and aminolysis inadvertently involve polymer degradation and the surface of
the PET fibers is removed layer by layer, leads to a loss in the strength of the fabric and
may adversely affect the overall product performance (8). These effects reduce the range of
its applications, especially in the technical area. In addition, these conventional methods
have a greater environmental impact because the generation of corrosive and hazardous
chemical waste (17; 18). At the same time, the environmental restrictions concerning the
wastewater produced by conventional textile finishing techniques are getting more and
more severe. This poses a challenge that has led to search for alternative surface
engineering methods that need less energy consumption and cause less environmental
contamination in the textile finishing processes (19).
In this context, physicochemical approaches stand out as the most promising alternative to
reduce environmental problems associated with the textile industry. Physicochemical
approaches include ultraviolet (UV), γ-ray, electron beam, and plasma treatments. Among
these techniques, plasma treatment is becoming an attractive alternative method for surface
modification of textile substrates (20-23). Surface modification by plasma treatment is
simple, time efficient process, environmentally friendly process and the modification is
limited to the outermost layers of several hundred angstroms while the bulk properties can
be kept unchanged as well as the touch of the textiles (24; 25). It provides a reactive
medium at the ambient temperature that can introduce functional groups onto the surface
of a treated substrate depending on plasma parameters such as power, gas used, duration of
treatment and pressure (26).
1.2 Objective and synthetic concepts
As described above, an interest in the present work is to find out appropriate engineering
methods, which can be further accepted by textile industries for surface functionalization
of PET fabrics to overcome its limited reactivity and to keep the bulk characteristics
unaffected. Toward this goal, two typical plasma-based synthetic concepts were thoroughly
employed and compared to endow PET fabrics with accessible amine functionalities to
provide more flexibility in their uses. In this work, coloration with anionic dyes was used

Introduction 5
to evaluate the effectiveness of different plasma-based surface modifications of PET
fabrics.
Plasma-based modified PET fabrics that contain amine functionalities have been achieved
by use directly low-pressure ammonia plasma treatment to produce –NH2 groups. The
second approach was the adsorption of cationic polyelectrolytes from aqueous solution to
plasma-treated PET fabric in which negatively charged groups were introduced by
low-pressure oxygen plasma. Oxygen plasma was applied in order to promote adhesion to
PET fabric surface through the introduction of carboxylic groups that interact with the
subsequent coating layer (Figure 1.3). Cationic polyelectrolytes used in this study were
poly(diallyldimethylammonium chloride) (PDADMAC) as a strong polyelectrolyte and
poly(vinyl amine-co-vinyl amide) (PVAm) as a weak polyelectrolyte. Afterwards, an
appropriate annealing procedure was developed to stabilize the polymer layer on PET
surface.
NH2
NH2
NH2NH2
NH2
NH2N N
N
Figure 1.3 Schematic representation of the different synthetic routes investigated in the present
work for introduction amine-containing groups onto PET fabric surfaces.

Theoretical Background 6
2 Theoretical Background
2.1 Textile fibers
Textile fibers have been used for thousands of years, and their importance in the world
today is greater than ever before (27). The use of fibers has been expanding from modern
apparel, home furnishings, and medicine to high-performance applications. The textile
industry uses substantial quantities of fibers in the construction of fabrics that undergo
several mechanical and chemical treatments before reaching their end user. Textile fibers
may be either of natural or man-made origin (Figure 2.1). Natural fibers can be mainly
divided into plant fibers of cellulosic origin (cotton), protein fibers of animal origin (wool,
silk), and mineral fibers (asbestos). Man-made fibers regenerated from natural sources are
called regenerated fibers that can be obtained by mechanical and/or chemical processes of
vegetable or animal origin fibers, while the fibers from synthetic organic or inorganic
origins are often called synthetic fibers (6).
Figure 2.1 Classification of textile fibers according to their origin (6).
Textile Fibers
Natural Man-Made
Plant OriginAnimal Origin
Mineral Origin
Regenerated Synthetic
e.g. Asbestose.g. Wool Silk
e.g. Cotton Linen
Organic Inorganic
e.g. Polyester Polyamide
e.g. Glass Ceramic
e.g. Rayon Acetate

Theoretical Background
2.2 PET fibers: production and applications
Polyesters are a category of polymers, which contain at least one ester
repeating unit in their main chain
polymers in use today. In their simplest form, polyesters are produced by
polycondensation reaction of a glycol (diol) with a dicarboxylic acid (diacid) or its diester.
Hundreds of polyesters exist due to the myriad of combinations of diols and diacids. The
earliest work on polyesters was done by W. H. Carothers at DuPont in the
The workhorse of polyesters is
production of fiber for textile products. Fiber applications include not only wearing
apparel, curtain, upholstery, thread, tire cord, and fabrics for industrial filtration but also
for a wide variety of industrial applications (Figure 2.2)
discovered in UK laboratories of the Calico Printers Association in 1941.
Industrially the PET is produced by step
(EG) and either dimethyl terephthalate (DMT) or terephthalic acid (TPA). Two processes
are used for the synthesis of PET. The first stage is an ester interchange to
bis(2-hydroxyethyl)terephthalate (BHET) along with small amounts of larger
oligomers (31). The reactants DMT and EG are heated at temperatures increasing from 150
to 210 °C, and the methanol is continuously distilled off.
11%
C
O
OH3C
OC H2C H2HO
PET fibers: production and applications
Polyesters are a category of polymers, which contain at least one ester
repeating unit in their main chain (28). They are one of the most important classes of
polymers in use today. In their simplest form, polyesters are produced by
olycondensation reaction of a glycol (diol) with a dicarboxylic acid (diacid) or its diester.
Hundreds of polyesters exist due to the myriad of combinations of diols and diacids. The
earliest work on polyesters was done by W. H. Carothers at DuPont in the
polyesters is PET, which is used for packaging, bottles and for the
production of fiber for textile products. Fiber applications include not only wearing
apparel, curtain, upholstery, thread, tire cord, and fabrics for industrial filtration but also
of industrial applications (Figure 2.2) (30). The PET fibers were firstly
discovered in UK laboratories of the Calico Printers Association in 1941.
Figure 2.2 End uses of PET fibers (30).
Industrially the PET is produced by step-growth polycondensation from ethylene glycol
(EG) and either dimethyl terephthalate (DMT) or terephthalic acid (TPA). Two processes
are used for the synthesis of PET. The first stage is an ester interchange to
hydroxyethyl)terephthalate (BHET) along with small amounts of larger
. The reactants DMT and EG are heated at temperatures increasing from 150
and the methanol is continuously distilled off.
27%
10%
13%24%
11%
15%Apparel
Nonwoven textiles
Home textiles
Industrial
Carpets and rugs
Fiberfill
150-210 oC
C
O
O C H3 HO C H2 C H2
Catalysts: Z inc, Calcium o
C O C H2 C H2 O H
O
CO
O
2
2
7
Polyesters are a category of polymers, which contain at least one ester-linking group per
. They are one of the most important classes of
polymers in use today. In their simplest form, polyesters are produced by the
olycondensation reaction of a glycol (diol) with a dicarboxylic acid (diacid) or its diester.
Hundreds of polyesters exist due to the myriad of combinations of diols and diacids. The
earliest work on polyesters was done by W. H. Carothers at DuPont in the early 1930s (29).
PET, which is used for packaging, bottles and for the
production of fiber for textile products. Fiber applications include not only wearing
apparel, curtain, upholstery, thread, tire cord, and fabrics for industrial filtration but also
. The PET fibers were firstly
discovered in UK laboratories of the Calico Printers Association in 1941.
growth polycondensation from ethylene glycol
(EG) and either dimethyl terephthalate (DMT) or terephthalic acid (TPA). Two processes
are used for the synthesis of PET. The first stage is an ester interchange to produce
hydroxyethyl)terephthalate (BHET) along with small amounts of larger-sized
. The reactants DMT and EG are heated at temperatures increasing from 150
Nonwoven textiles
Carpets and rugs
O H
or M anganase acetate
C H3O H2

Theoretical Background 8
In the second-stage, the temperature is raised to 270–280 °C and polymerization proceeds
with the removal of ethylene glycol being facilitated by using a partial vacuum of 0.5–1
torr (32-34).
The production of PET accelerated in the early 1960s when processes to produce pure TPA
were improved (35; 36). The linear homopolymer PET constitutes the majority of the
polyester fibers produced and consumed globally. PET for industrial fibers has a higher
degree of polymerization, higher molecular weight and higher viscosity. The normal
molecular weight range lies between 15000 and 20000, with the normal extrusion
temperature 280-290 °C. The PET fiber was commercialized through the 1950s as Dacron®
in the United States and as Terylene® in the United Kingdom. The global PET fiber
production has demonstrated an upward trend in recent years (Figure 2.3) (37). PET fiber
production was reaching about 35 million tons in 2010; this figure is especially impressive
when we note that, PET was not introduced as a commercial product until 1953 (37).
Figure 2.3 PET fiber production output (37).
0
5
10
15
20
25
30
35
40
2000 2002 2004 2006 2008 2010
Mill
ion
tons
Year
C O CH2 CH2 O H
O
COCH2CH2HO
O
n
270-280 oCCatalyst: Antimony(III) oxide
CC
OO
O C H2 C H2 O
n
HO C H2 C H2 O Hn

Theoretical Background 9
Besides excellent properties, the growth of PET fiber production may be assigned to the
combination of many factors: low production costs, ability to be blend with natural fibers
such as cotton to give a better feel, has outstanding crease resistance and can be treated
with cross-linking resins to impart-press (wash-and-wear) properties. This increase forever
changed the world map of fibers production.
2.2.1 PET/wool blend fabrics
Textile fabrics containing more than one kind of fibers are termed as blend, union or a
mixture (38). The reasons for developing such fabric unions may be offered the most
valuable options for economic reasons on raw material cost (if one of the component fibers
is relatively expensive), or to develop a material with enhanced or unique properties, which
cannot be achieved easily with fabrics made from a single fibers type. Due to the wide
range of fibers properties and characteristics, there are almost limitless opportunities for
the creation of blends of different type, composition and fabric structure. Therefore, blends
are a way to enable the production of fabrics with a unique and novel diverse range of
properties using existing fibers types (39; 40).
Wool is an elastic and biodegradable protein fiber. However, wool suffers from a number
of intrinsic properties that severely limit its use as textile fibers for many applications. The
most common one is the propensity of wool fabrics to undergo felting shrinkage when
agitated in aqueous solutions. Another problem experienced by pure wool fabrics is the
maintenance of creases. These problems may be overcome by chemical methods or the
application of polymers to the surface of the fibers. Another route is to blend wool with
polyester.
Chemically, the principal component of the wool fiber is the protein keratin (41). The
protein molecules consist of a long polypeptide chain constructed from the eighteen
commonly encountered amino acids that are found in most naturally-occurring proteins (42;
43). At intervals, the polypeptide chains are linked together by disulfide (—S—S—)
bridges derived from the amino acid cystine. These bonds can easily be broken and
reformed, causing the wool to have significant problems with shrinkage and wrinkling.
There are also ionic links between the protonated amino (–NH3+) groups and carboxylate
(-COO), which are located on the amino acid side-groups and at the end of the
polypeptide chains (42; 44; 45). Many of the functional groups on the wool fiber play some
part of the forces of attraction involved when dyes are applied to the fibers.

Theoretical Background 10
From a morphological point of view, the wool fiber is a nanocomposite of high complexity
with a clear hierarchy. The fiber is surrounded by cuticle cells, which consist of at least of
four layers, the epicuticle, the A-layer and the B-layer of the exocuticle cells and the
endocuticle.
The epicuticle has been considered to consist of lipids (including 18-methyleicosanoic acid
(18-MEA)), proteins, and/or carbohydrates, and, due to its chemical inertness, has been
called a resistant membrane. It is highly resistant to attack from alkalis, oxidizing agents,
and proteoltic enzymes. It is about 2.5 nm thick and amounts to approximately 0.1 % of the
weight of the fiber (42).
Blends of polyester with wool represent an attempt to achieve the combination of desirable
properties of both fibers. They allow the production of fabrics having good wear
properties, dimensional stability, mechanical strength, abrasion resistance and attractive
handle. Because wool/polyester blend fabrics can show the complementary properties over
fabrics composed only of one of these two fibers wool/polyester blend fabrics have gained
a considerable share in woven suiting. The most common blend ratios are 55:45 and 70:30
PET/ wool (46).
2.2.2 Coloration of PET fabrics
The value of the textile materials destined for the domestic market is increased by
coloration, which is achieved either by dying or by printing. The objectives of coloration
are imparting the desired color to textile materials and, in the case of using functional dyes,
introducing additional functional properties (i.e. anti-microbial, UV protection, optical
sensor for pH). This could result in combination of interesting functionality and unique
characteristics of textile materials by coloration (47-50).
As shown in Figure 2.4, different classes of dyes are used in coloration of textile materials.
These dyes are water-soluble, sparingly water-soluble dyes, alternatively water-insoluble
pigments (47). The choice of the dyes molecules is dependent on the functional groups in
the fiber structure, dye molecules and the potential interaction between these groups (51;
52). Dyes bond to textile materials with Van der Waals forces, ionic and covalent bonding
(53). In the textile coloration, a single class of dyes predominates on the substrate
concerned, for example, acid dyes on polyamides and wool, basic dyes on acrylic, disperse
dyes on polyesters and cellulose acetate.

Theoretical Background 11
Figure 2.4 Textile dye classes global market share (54).
When PET fibers first appeared, they presented many problems for traditional dyers. PET
fibers do not have dye sites, neither basic nor acidic groups. For this reason, it is colored
mainly with non-ionic disperse dyes. This class of dyes possesses no specific chemical
reactivity toward the fibers and does not require the formation of specific interactions with
functional partner groups. Thereby coloration of PET relies on Van der Waals forces to
hold the dye on the fiber. On the other hand, natural fibers like wool, cotton, silk, and then
later man-made ones like rayon and polyamides were-well known and had been good dye
affinities because the fibers had pendant groups such as –NH2, –COOH, and/or –OH.
These dyes were developed to interact with such groups. All classic cationic and anionic
dyes for wool, silk and cotton had water-solubilizing ionic groups like –NR3+ and –SO3,
such dyes had no affinity for PET (55).
In fabric blends, because different fibers have a different chemical structure blends suffer
from inherent disadvantages. In these blends, usually coloration requires two classes of
dyes during the two-stage process to produce solid shades; disperse dyes for the PET
component and acid dyes for the wool (56; 57). This greatly hinders the simultaneous
process of coloration.
As the PET fibers market grew, it has been recognized that dyes other than disperse dyes
would be valuable, which facilitate a broad spectrum of PET uses. In this context, anionic
dyes would play a much larger industrial role if they successfully applied to PET fabrics.
Consequently, it is possible to widen the scope of coloration of PET fabric as well as use a
single set of dyes for blend fabrics such as PET/wool fabrics, thereby reducing complexity
in coloration technology and effluent treatment (58). In addition, it is possible to apply
some dyes specifically designed for high-technology (Hi-tech) applications such as
12.4%
4.6%
6%
32.7%
29.4%
14.9%
Acid
Direct
Vat
Disperse
Reactive
Others

Theoretical Background 12
biomedical and pH sensitive dyes. The following discussion will focus on anionic dyes
namely reactive, acid and direct dyes.
2.3 Anionic dyes
2.3.1 Acid dyes
Acid dyes can be used to color fibers within the cationic groups such as wool, silk and
polyamide. Sodium sulfonate groups incorporated into the structure of acid dyes work both
to impart water solubility to the acid dye molecule as well as to serve as binding sites for
the coloration process. In the case of wool, amino groups are protonated in an acidic
medium to form cationic centers. Acid dye molecules were fixed through ionic bond.
Figure 2.5 shows an example of acid dyes namely C.I. Acid Yellow 69.
Figure 2.5 The chemical structure of C.I. Acid yellow 69.
One drawback of coloration by acid dyes is limited wash fastness. Since the bond holding
the dye molecules to the substrate is an ionic bond (Figure 2.6), an ion-exchange reaction
can readily take place in the presence of water or steam, effectively removing the dye from
the substrate. Dye removal can occur with every washing or steaming, causing the overall
color of the material to fade.
Figure 2.6 Schematic representation of acid dye fixation on fibers by ionic bond.
NH2NH2
NH2
++ H⊕
NH3NH3
NH2
⊕⊕Dye SO3
Dye SO3
N N
CH3
NH2
SO3Na
CH3
NaO3S

Theoretical Background 13
DyeS
O O
O Cellulose
H OH
DyeS
O O
O CelluloseO Cellulose
DyeS
O O
DyeS
O ODye
SO O
OSO3Na
HH2O
Na2CO3S
OO
Dye OSO3H
OH
2.3.2 Reactive dyes
Reactive dyes are water-soluble dyes and widely used for coloration cellulosic fibers as
well as their blends under alkaline conditions. They contain a group capable of forming a
covalent bond with the hydroxyl groups in the cellulosic polymer during the coloration
process. The two main reactive groups are the monochlorotriazinyl (MCT) group and the
beta-sulphatoethylsulphone (masked vinyl sulphone (VS)). The alkali added to the dyebath
initiates the desired dye/fiber reaction. At higher pH, a larger percentage of the cellulose
hydroxyl groups are dissociated and, thus, forming cellulosate anions. These react with the
dye by either nucleophilic substitution or nucleophilic addition reactions (47). MCT
reactive dyes contain a triazinyl ring with halide substituent, which are easily attacked in a
nucleophilic substitution reaction by a cellulosate anion, forming a permanent ether linkage
between the substrate and the triazinyl ring. Reactions involving MCT type reactive dye
are shown in Figure 2.7.
Figure 2.7 The reaction mechanism of cellulosate anion with MCT type reactive dye.
VS reactive dyes form a covalent bond between the dye molecule and the fiber via a
nucleophilic addition reaction. Reactions involving a VS reactive dye are shown in Figure
2.8.
Figure 2.8 The reaction mechanism of cellulosate anion with VS type reactive dye.
N N
N ClNDye
H
O CelluloseOH
N N
NCl
ONDye
H
CelluloseN N
N O CelluloseNDye
H
Cl

Theoretical Background 14
The major advantage of using reactive dyes to color cellulosics fibers is excellent fastness
properties. The dye molecules are permanently attached to the fiber because a covalent
bond is formed. Thus, little to no dye is removed during subsequent washings. Therefore,
fabrics colored with reactive dyes should pose no problems for the end-user of the product.
2.3.3 Direct dyes
Direct dyes are defined as anionic dyes with substantivity for cellulosic fibers. The
molecules of direct dyes are similar in structure to those of acid dyes but they are larger.
There is, however, no clear demarcation between acid and direct dyes. They are available
in a full range of hues but are not noted for their color brilliance. The major drawback is
their moderate fastness to washing (59; 60).
Figure 2.9 The chemical structure of C.I. Direct Yellow 4.
C.I. Direct yellow 4 (Figure 2.9) exhibits color changing from yellow to orange with pH
variation in the pH range 6.5-8 (61). This halochromic change makes it useful as a
pH-indicator. Halochromic textiles can be used as sensors that give an indication of the
environment’s pH by an easy visual color observation and can be applied in a broad range
of applications. For example, investigation the skin pH variations of burn patients, the skin
pH changes during the healing process. By using a halochromic wound bandage, it would
be possible, without having to remove the gauze so without damaging the wound, to follow
this recovery process by following the color change of the bandage (61).
2.3.4 Printing textile fabrics with anionic dyes
Textile printing or patterned dyeing is the most versatile method used for applying color in
a localized design to textile fabrics (62). This is usually achieved by applying thickened
HO
NN SO3Na
NN
NaO3S
OH

Theoretical Background 15
pastes. The printing paste on the fabric may be regarded as a miniature localized dye bath,
highly concentrated thickened solutions, containing the dye and all the additives necessary
for the coloration process. In particular, the viscosity of a print paste determines the
volume of paste transferred to the fabric and the degree to which it spreads on and into the
surface fabrics.
Various methods have been developed for producing printed textile fabrics, such as rotary
screen-printing, flat-bed screen-printing, transfer and roller printing (63). Except for
transfer and roller printing, all of these techniques require a screen for color application to
the fabrics (64). Printing process is consisting of sequences of operations; the sequence of
operations is printing the fabric with a thickened paste containing the dyes, followed by
drying and steaming or thermofixation. During steaming, the dyes re-dissolve in the water
condensed on the paste films and diffuse into the fibers. A final washing removes the
thickener, unfixed dyes and other chemicals from the fabric (60).
Thickening agents play a paramount role in the formulation of printing pastes, ensuring
through the modulation of the rheological properties, a homogeneous distribution of the
printing paste on the screen and its uniform flow through the screen openings. The
selection of the thickening agent is determined by the print paste stability for storage and
compatibility of thickening agents with the added dyes as well as chemicals in the print
paste. Depending on their chemical structure, dyes may interact with thickening agents, to
form complexes or to give a chemical reaction, so causing a variation of the rheological
properties of the printing pastes and, hence, of their application characteristics (65-67).
Thus, anionic polymers are rarely compatible with cationic dyes. The hydroxyl groups in
most carbohydrate gums react with reactive dyes and therefore, they are excluded.
Sodium alginates have become very important for printing paste thickening because of
their ready solubility. They are especially important for pastes of reactive dyes for several
reasons: the extent of interaction is very small, the absence of hydroxyl groups and the
repulsion of dye anions by the ionized carboxyl groups of the polymer under alkaline
conditions (68). The repulsion promotes migration of the dye from the thickener into the
fabric during steaming, which results in better color yields. The alginate film after drying
and dye fixation is washed out easily (62). On the other hand, the preferred thickening
agents for printing with acid dyes are of the galactomannan type. These are stable in the
acidic conditions, which are required at the fixation stage of dyes.

Theoretical Background 16
2.4 Plasma surface modification of textiles
Many properties of textiles are more related to the outer surface rather than to the bulk.
Accordingly, the surfaces of textiles offer a platform for functional modifications to meet
specific requirements for a variety of applications. In this context, plasma treatment is
investigated as an attractive alternative to conventional wet chemical treatment and
pretreatment processes. For example, shrink resistance, water repellent finishing or
improvement of coloration properties, which tend to alter the mechanical properties of the
fabric and are environmentally hazardous. Plasma processing can be applied to both
individual yarns and fabrics, which add a lot of flexibility and broaden the field of
application. Moreover, it brings a competitive solution to the environmental and
economical problems related to water; reduction of processing times, energy usage and it
decreases the effluents to be disposed.
2.4.1 Nature of plasma
Plasma is defined as an ionized gas composed of highly excited atomic, molecular, ionic
and radical species, as well as photons and electrons (69; 70). Chemically reactive species of
plasma, resulting from ionization, fragmentation and relaxation after an excitation process,
are energetic enough to dissociate a wide variety of chemical bonds, resulting in a
significant number of simultaneous recombination mechanisms (4; 71). From a macroscopic
point of view, plasma is considered neutral with the density of electrons and negative ions
being equal to the density of the positively charged ions, known as plasma quasi-neutrality.
In order to form and sustain plasma, an energy source must be used. The electric field
required for plasma generation may be produced by using either direct current (DC) or
alternating current (AC) power supplies. Several types of power supply are used: low
frequency (50-450 KHz), radio frequency (RF) (13.56 or 27.12 MHz) and microwave
(MW) (2.45 GHz) (4; 72).
A first broad classification of plasmas may be done in terms of their thermodynamic
properties: thermal (or hot) plasmas and non-thermal (or cold) plasmas regarded as
plasmas in thermodynamic equilibrium and non-equilibrium, respectively. In the first class,
all the species composing the plasma are in thermodynamic equilibrium. The temperature
of all active species (electron, ion and neutral) is the same, of the order 1000 K. Therefore,
thermal plasmas are clearly unsuitable for treating textiles. It is typically used where heat is
required, such as for cutting, welding or spraying. Cold plasmas, on the other hand, are
maintained at around room temperature or slightly above it. The temperature of neutral and

Theoretical Background 17
positively charged species is low, while the electrons are relatively in much higher
temperature. Therefore, equilibrium between all the species is far from established.
Consequently, cold plasma is well suited for the treatment or surface modification of
temperature-sensitive materials such as textile materials (73; 74).
The non-thermal plasmas can be classified into two accepted types based on the gas
pressure at which they are generated: low-pressure and atmospheric pressure plasmas.
Typical low-pressure plasmas operate in the range between 0 and 1 mbar, a vacuum
chamber and the necessary vacuum pumps are required. The atmospheric pressure plasmas
are operated at one atmosphere (74).
2.4.2 Plasma-based modification methods of textiles
Plasma is a very reactive environment in which several different interactions between
plasma species and a surface are possible. Over the past several years, the number of
possible plasma-based modifications has increased dramatically to tailor specific surface
properties of textiles. Despite the increasing use of plasmas in the surface tailoring of
polymers, not yet all aspects about how plasma processing can lead to a wide variety of
different functionalities or interaction mechanisms between plasma species are fully
explored or well understood (75). In many applications, the functional groups can be
introduced onto the surface in situ by plasma treatment and/or on subsequent exposure to
the atmosphere, which can serve as anchoring sites for paints, adhesives and for bioactive
molecules. There are several synthetic approaches have been used to modify the surface of
textiles as shown in Figure 2.10. The following discussion will be limited to simple plasma
treatment and adsorption of polyelectrolytes on plasma-treated surfaces approaches used in
the present study.
2.4.2.1 Simple plasma treatment of textile surfaces
For many applications, a short exposure of the polymer surface to a low-pressure plasma is
sufficient to obtain, e.g., a better wettability or an improved adhesion. Plasmas (NH3, H2O,
and O2) offer a versatile and viable tool to alter the surface properties of textile materials
without affecting the bulk properties. Plasma treatments are used to introduce the radicals
or functional group onto a polymeric surface in a controlled and reproducible manner as
well as the creation of charged surfaces (Table 2.1). In these systems, no additional
molecular layer is deposited. One of the major limitations of plasma technologies is the
diversity of functional groups produced by the multitude of chemical reactions that occurs
in the plasma (76).

Theoretical Background 18
Low-pressure plasma-based surface functionalization of textiles
Depositing plasmaNon-depositing plasma
Introduces hydrophilic or hydrophobic groups e.g. O2, NH3 plasma
(Simple plasma treatment)
Adsorption of polyelectrolytes
Plasma induced grafting
Cross-link pre-deposited polymer
Plasma polymerization
Introduces free radicals e.g. Ar, He plasma
(Simple plasma treatment)
Apply a functional coating directly
e.g. Acrylic acid
Figure 2.10 Schematic representation of different synthetic approaches used for surface functionalization of textiles based on low-pressure plasma treatment.
Table 2.1 Plasma gases and their applications.
Plasma gas Application Oxidizing gases (O2, air, H2O, N2O) Removal of organics by oxidation and to leave oxygen species in
the polymer surface.
Nobel gases (Ar, He) To generate free radicals in surfaces, to cause cross-linking or to generate functional groups for further reactions.
Active gases (NH3) To generate amino groups.
Fluorinated gases (CF4, SF6) Fluorinated surface groups such as –CF2 and –CF3 are introduced into the surface, which make it inert and hydrophobic.
Plasma treatment can modify the surface of a polymer substrate by physical and chemical
changes. The plasma capable of exerting four major effects (77), that is, surface ablation or
etching, surface functionalization, surface cross-linking, and deposition (Figure 2.11) with
concomitant effects on wetting, coloration, surface adhesion, electrical conductivity and

Theoretical Background 19
P P P P P
M-
UV
e-M+
M
M.
Plasma
Polymer
P P PP P PP P P
P P P
P PP P P
PP
PMM
M
M M
M M
Cross-linking Etching Deposition Functionalization
other characteristics of interest in the textile industry. Depending on the plasma
parameters, one of these changes can predominate on the others. The nature of the
modification of a textile surface by plasma treatments is governed by a variety of factors:
the type of the used gas, the power and duration of the treatment (78). It was observed that,
the results from different workers contradict one another; the discrepancy is often
attributable to differences in treatment conditions (6; 79; 80).
Figure 2.11 Schematic representation of plasma effects on a polymer surface.
The application of simple plasma treatments for improved wettability has been done on all
possible fiber materials, with varying success. The treatment aims at the introduction of
water compatible functional groups such as –COOH, –OH and –NH2. The wettability of
textile surfaces is usually monitored by indirect methods such as absorption time, because
their porous structure immediately absorbs the liquid drop (81; 82). The PET fabric was
treated by plasma initiated in various gases (N2, O2, air, CO2 and NH3) by Wróbel et al.
(83). The best results were obtained after treatment with oxygen, nitrogen and air plasma.
Costa et al. (84) also studied the effects of gas composition on the wettability of PET
fabrics. Molina et al. (45) reported on an improved wettability of keratin fibers with water
vapor plasma. Although plasma exposure can dramatically alter wettability, an ageing
effect is observed. The popular consensus is that the polar groups undergo migration into
the bulk of the modified materials in order to reduce the interfacial tension (85). The impact
of a nitrogen plasma treatment on the dyeing properties of wool fabric was also studied
(86). The nitrogen plasma introduced new -NH2 groups onto the wool surface, thereby
enhancing the extent of dye exhaustion. Recently, Raffaele-Addamo et al. (87) applied RF

Theoretical Background 20
plasma in air or argon to PET fibers and showed an increased color depth upon dying with
disperse dyes. Additionally, simple plasma treatment can be considered as a key technique
in various multistep strategies, including the immobilization of predeposited molecules as
well as the surface functionalization for subsequent grafting or adsorption procedures
(Figure 2.10).
2.4.2.2 Adsorption of polyelectrolytes on plasma modified textile surfaces
Another route to durable surface modifications is the use of low-pressure plasma
treatments combined with the subsequent adsorption of appropriate polyelectrolytes for the
construction of surface reactive textile materials (88; 89). The adsorption of polyelectrolytes
onto surfaces is strongly favored when the polyelectrolyte and the surface carry opposite
charges. In such systems, small amounts of adsorbed polyelectrolyte become very
effective. Hence, surface properties can be controlled by the chemical structure of the
polyelectrolytes used. The definition of “coating” in the following paragraphs is a
polymeric layer deposited on top of a textile structure. The usefulness of combined
treatment strategies to modulate various surface properties is given by the following
examples. Shan-hui Hsu et al. (90) studied various air plasma treatments followed by
application of chitosan to achieve the antibacterial effects to nylon fabrics. Bratskaya et al.
(91) also studied the application of chitosan on oxygen plasma treated polypropylene
surfaces to improve their wettability, dying behavior and antimicrobial properties.
2.5 Use of polyelectrolytes in textile applications
Polyelectrolytes (PELs) are a special class of polymers whose repeating units contain
charged or chargeable groups along or pendent to the polymer backbone and are primarily
water-soluble (92-94). An important property of polyelectrolytes is their tendency to adsorb
on substrate surfaces. This is used to modify solid surfaces and interfaces by
polyelectrolyte based coatings (95-97). The adsorption of PELs onto textiles has been
subject of numerous investigations because of the simple procedure for application (98; 99).
The ability to modify the chemistry of textile surfaces by polyelectrolyte-based coatings
provides a straightforward mechanism for controlling surface chemistry and therefore the
properties of the modified surface (100; 101). Besides the entropic effects, the
polyelectrolyte adsorption is mainly controlled by electrostatic interactions between the
oppositely charged surface of some natural fibers and the polyelectrolyte. Cotton, for
instance, has a multitude of naturally occurring hydroxyl and carboxylic acid groups along

Theoretical Background 21
the cellulose chain, which can serve as anchor sites for the adsorption process. However,
many other textile materials, particularly polypropylene and PET, lack such reactive
groups or sites on their polymer chains. In this case, it is important to produce a surface
containing active groups that could react electrostatically with a polyelectrolyte. The
adsorption of polyelectrolytes depends heavily on the surface charge density, the polymer
charge density, the ionic strength of the solution and the molecular properties like
conformation or molar mass (92).
2.5.1 Polyelectrolyte classifications
As shown in Figure 2.12, polyelectrolytes can be categorized according to their origin into
natural (e.g., polynucleic acids and polypeptides), modified natural (e.g., chitosan and
cellulose), and synthetic (e.g., poly(4-styrene-sulfonic) or PDADMAC). In terms of the
nature of the ionic groups, they can be classified as polyacids/polyanions,
polybases/polycations, that depending on whether the ionizable groups are all anionic or all
cationic. A special class of polyelectrolytes is called “polyampholytes”, macromolecules
that carry both anionic and cationic groups covalently bound to the polymer chain. Based
on composition they are homopolymers and copolymers.
Figure 2.12 Classification scheme of polyelectrolytes.
Polyelectrolytes
Synthetic
Modified natural
Natural
Origin
Polyampholytes
Polybases/ Polycations
Polyacids/ Polyanions
Charge
Copolymers
Homopolymers
Composition
Weak
Strong
Charge density of molecules

Theoretical Background 22
Polyelectrolytes can be subdivided into strong or weak based on the charge density of the
macromolecule. Strong polyelectrolytes that remain fully charged over the entire pH range,
in other words charge density is fixed over the entire pH range (102; 103). For example, in
the PDADMAC nitrogen is quaternized and no change in the degree of charging is possible
due to the absence of an acidic hydrogen atom. On the other hand, weak polyelectrolytes
whose charge density can be tuned by solution pH-value, such as PVAm (104).
In the last few years, water-soluble cationic polyelectrolytes have attracted particular
interest for their applications in the surface modification and finishing of textile materials
to improve their quality and properties (104-106). Because the most of naturally-occurring
textile surfaces are negatively charged. They are used as finishing agents for color fastness,
light fastness, preparation of polymeric water-soluble dyes (98) as well as the removal of
dyestuffs and detergents from wastewater via a coagulation process before it is discharged
(100; 101; 107-109). In this work, we will report on the surface modification of PET fabrics
using the water-soluble polymer PDADMAC and PVAm (Lupamine®9095).
2.5.2 Poly(diallyldimethylammonium chloride) (PDADMAC)
PDADMAC is one of the most important commercial polymer of the allyl monomers. It is
a cationic functional polymer that has outstanding utility in many applications as a
flocculent (110; 111), fixing agent (112; 113), antistatic agent (96), and antibacterial agent
(114; 115) in textile industry. It should be mentioned that it was the first polymer to be
approved by the U.S. Food and Drug Administration (FDA) for the use in potable water
treatment (116).
Free-radical polymerization of diallyldimethylammonium chloride (DADMAC) results in a
water-soluble linear polymer containing five-membered pyrrolidinium units (Figure 2.13)
(96; 117; 118). Depending on the purity of the raw materials and the reaction conditions the
technical monomer solutions can contain small amounts of, for example,
allyldimethylamine (ADMA), diallymethylamine (DAMA), or methyltriallylammomium
chloride (MTAAC) (119).
Figure 2.13 Cyclopolymerization of DADMAC and structures of resulting polymers.
N N NN
84 % 14 % less than 2 %
cis trans

Theoretical Background 23
Although the PDADMAC was first prepared in the 1950s (120), research interest in
PDADMAC has not diminished. This is based on its unique chemical structure,
PDADMAC molecules possess a backbone of cyclic units and a charged quaternary
ammonium group found in each monomer unit provides the polymer with high water
solubility and solution properties corresponding to those of strong polyelectrolytes.
2.5.3 Poly(vinyl amine-co-vinyl amide) (PVAm)
PVAm is a weak PEL containing a controllable number of reactive and accessible primary
amino groups on the polymer backbone. It is an interesting candidate for solid surface
functionalization in aqueous solutions (121; 122), because it has a high chemical potential
for subsequent derivatization reactions with electrophilic agents.
The charge degree of PVAm depends on the protonation/deprotonation equilibrium of the
amino groups (Figure 2.14). The protonation/deprotonation equilibrium can be easily
influenced by the pH value of a surrounding aqueous medium. The stability of the
adsorbed polyelectrolyte layer can be also affected by the environmental conditions. For
practical applications and subsequent functionalization reactions, it is recommended that
the PVAm layer to be stabilize by cross-linking reactions (123). Various procedures such as
heat-induced cross-linking reactions involving two or more functional groups, amino
groups can react with aldehyde, anhydrides, and carboxylic acids, proved to be an
interesting route in the formation of covalent bonds in the electrostatically or H-bonding
stabilized polymer complexes (124-126) and polyelectrolyte multilayers (127; 128).
Figure 2.14 Protonation/deprotonation equilibrium of PVAm.
PVAm cannot be synthesized directly from the vinyl amine monomer because according to
the enamine-imine tautomerization vinyl amine is fully converted to its corresponding
imine (Figure 2.15). Therefore in industry, PVAm can be synthesized only via indirect
routes by modifications of other polymers that are readily available. Attempts have been
N H2
n N H3
n
H
O H

Theoretical Background 24
made to synthesize PVAm via the hydrolysis of poly(N-vinylimide)s (129),
poly(N-vinylcarbamate)s (130) and poly(vinylacetamide) (98).
Figure 2.15 Enamine-Imine tautomerism in vinyl amine.
Poly(N-vinyl formamide) (PVFA) was used for simple and economical production of
PVAm (131; 132). PVFA can be easily converted into PVAm by hydrolysis in either acidic
or basic aqueous solution (Figure 2.16) (132; 133).
Figure 2.16 Synthesis of PVAm from hydrolysis of PVFA.
The hydrolyzation reaction does not fully cleave the formamide group, as consequence
copolymers with different formamide/amino group ratios are produced (Figure 2.17).
Hence, the degree of hydrolysis of the formamide groups is an excellent tool to control the
desired charge density of the polyelectrolyte (131). It is known that an aqueous solution of
PVAm with the degree of hydrolysis larger than 90 % (Lupamine®9095) can be used to
form an ultrathin film on hydrophilic surfaces (134).
H2C CH
NH
OH
n
Radical
polymerization
CH2 CH
NH
OHn
PVFA
NaOH/H2O
HCOONa
HCl/H2OHCOOH
CH2 CH
NH2
n
CH2 CH
NH3
n
Enamin
H2C CH
N RH
H2C CH
N R
H
Imine

Theoretical Background 25
Figure 2.17 Chemical structure of poly(vinyl amine-co-vinyl amide) copolymer.
Moreover, the coexistence of amino and formamide groups along the polymer backbone
may form amidine groups (Figure 2.18). The amidine formation can take place when
polymers with a degree of hydrolysis in the order of 20–80% are used. Furthermore, acidic
surface groups can also induce the amidinium ion formation (135).
Figure 2.18 An amino and formamide groups formed an amidine group.
Non-protonated primary amino groups in the PVAm molecules have a high synthetic
potential, which can be used for versatile subsequent derivatization reactions (121; 136). The
nucleophilic character in combination with the free-electron pair distinguishes the primary
amino group. Therefore, it can react with a variety of electrophilic compounds such as
carbonyl, acid anhydrides, isocynates, oxiranes and carboxylic acid derivatives (132; 137).
2.5.4 Polyelectrolyte/dye interactions
The interactions of different water-soluble cationic polyelectrolytes with anionic azo dyes
have been reported. This interaction is often accompanied by marked changes in the
absorption spectrum of the dye. This effect is known as metachromacy (138).
As a global definition, metachromacy is the phenomenon whereby the ionic dyes change
their color in aqueous solution as a result of their interaction with oppositely charged
macroions, or charged surfaces (128). This is a consequence of the interactions of the dye
CH2 CH CH2 CH
NH2NH
HC Ox 1-x
NH
COH
NH2 NHx y z
NCH
Formamidegroup
Amino group
Amidine group

Theoretical Background 26
orbitals with each other or with the orbitals of polyion, when the dye molecules in close
proximity on the macroion chain or on the surface (138). The substrates inducing such
spectral changes of the dye are called chromotropes. Spectral changes as bathochromic
(λmax shift to a longer wavelength, red) or hypsochromic (λmax shift to a lower wavelength,
blue) shifts were reported for several anionic dye/cationic polyelectrolyte systems (139;
140). These changes in the absorption spectrum have often used as the basis of quantitative
determination of the small amounts of cationic polyelectrolytes in natural and industrial
water (141).
In addition, the aggregation of dye molecules in an ordered structure on the external
surface or embedded in the polyelectrolyte layer (with corresponding dipoles) results in
spectral changes. Shifts in the absorption spectra are depending on the mutual orientation
of the interacting dipole moments (142). The arrangement changes the energy difference
between ground and excited state of the dye molecule (143). When the dipole moments are
in-line, the arrangement is termed J-aggregates (Figure 2.19a), which decrease the
difference between ground and excited states of dye molecule leading to a bathochromic
(red) shift. In the case of, the dipole moments are parallel; the arrangement is termed
H-aggregates (Figure 2.19b), which increase the difference between ground and excited
states of dye molecule, then the spectra exhibit a hypsochromic (blue) shift (142; 143).
Figure 2.19 Molecular arrangements in J- (a) and H-aggregates (b) from (143).
Numerous synthetic polycations with cationic centers were studied include
poly(ethyleneimine) (144) and poly(vinylpyridin) (145) have been used as chromotropes for
the metachromacy of anionic dyes. Chitosan as a natural polycation with amino groups has
been also used as a chromotrope for anionic dyes (140). Particularly, in textile industries,
cationic polyelectrolytes were used for selective adsorption of anionic dyes from
wastewater (96).
(a) (b)

Experimental Part 27
3 Experimental Part
3.1 Materials
3.1.1 PET fabric
Commercial PET 100% weave fabric of (165 g/m2) used as the substrate for modification
throughout this study was supplied by private sector Co., Egypt. The PET fabric was
washed before use with an aqueous solution containing 0.5 g/L non-ionic detergent
Tissocyl CSB (Zschimmer & Schwarz, Burgstädt, Germany) and 1 g/L sodium carbonate.
The liquor-to fabric ratio of the aqueous solution was kept at 50:1 for 60 min at 70 °C.
After washing the fabric was thoroughly rinsed with deionized water, dried at room
temperature until constant weight and kept in desiccators before use in the experiments. It
was observed that, although PET fabric was carefully cleaned before any further
modification, surface contaminants are not completely removed. The samples used for the
modification procedures were 4x4 cm2 in size and 0.3 mm in thickness.
3.1.2 PET/ wool blend fabric
Commercial PET/wool weave blend fabric of (150 g/m2); with a blend composition of
70 % PET and 30 % wool was supplied by El-Mehala El-Kobra Co., Egypt. The fabric was
washed by treatment in a bath containing 0.5 g/L non-ionic detergent Tissocyl CSB and
sodium carbonate 1g/L at the liquor-to-fabric ratio of 50:1 for 30 min at 50 °C followed by
rinsing with deionized water, dried at room temperature until constant weight and kept in
desiccators before use in the experiments. The samples used for the modification
procedures were 4x4 cm2 in size and 0.3 mm in thickness.
3.1.3 PET film
PET films were used as model substrates for Attenuated total reflectance-fourier transform
infrared (ATR-FTIR) studies. The PET films, having a smooth surface, are quite amenable
to make a good contact with the surface of the internal reflection element (IRE) to be
studied by ATR-FTIR. The PET films were kindly supplied from Fraunhofer Institut für
Fertigungstechnik und Angewandte Materialforschung (IFAM), Bermen, Germany. PET
film with a thickness of 16 µm was cut to a dimension of 4 x4 cm2 samples. Prior to the
surface modification experiment, the PET films were washed for 10 min in an ultrasonic

Experimental Part 28
HC CH
CH2H2CN
CH2H2C
CH3H3C
Cl
n
bath successively in acetone and water to remove surface contaminants, dried in the air at
the room temperature and kept in desiccators before use in the experiments.
3.1.4 Plasma gases
Ammonia (99.99 %) and oxygen (99.95 %) were used as process gases for plasma
treatments of PET fabric samples. Process gases were purchased from Messer Griesheim,
Germany.
3.1.5 Polyelectrolytes
The cationic polyelectrolytes used in the study to build different molecular architectures on
PET surfaces were the strong polyelectrolyte PDADMAC obtained as a 20 wt.-% aqueous
solution and the weak polyelectrolyte PVAm (Lupamine® 9095) obtained as a 22 wt.-%
with a hydrolysis degree > 90 %. The polyelectrolytes were used without further
purification. The molecular masses, charge densities and supplier of cationic
polyelectrolytes are summarized in Table 3.1. The molecular structures of the
polyelectrolytes are presented in Figure 3.1.
Table 3.1 Polyelectrolytes used to modify PET fabric surfaces.
Polyelectrolyte molar mass (g/mol)
Charge density(a)
(meq/g) Supplier
Poly(diallyldimethylammonium
chloride) (PDADMAC)
200000-350000 6.27 Sigma-Aldrich
Chemie GmbH
Poly(vinylformamide-co-
vinylamine) (PVAm)
(Lupamine®9095)
340000(b) 5.47 BTC Specialty
Chemical
Distribution GmbH
(a) The values were determined by polyelectrolyte titrations (146). (b) The molar mass given here is the molar mass of pre-polymer PVFA, which was used for hydrolyzation
reaction
PDADMAC PVAm (Lupamine® 9095)
Figure 3.1 Chemical structures of the polyelectrolytes used to modify PET fabric surface.
CH2 CH
NH2
CH2 CH
NH
HC O0.95 n 0.05n

Experimental Part 29
3.1.6 Dyestuffs and auxiliaries of printing pastes
The commercial six anionic dyes in this study are listed in Table 3.2. The chemical
structures of these dyes will be presented in section 4.3. Other auxiliaries used in the
formulation of print pastes are listed in Table 3.3.
(a) UV/Vis spectra were recorded on a Lambda 800 spectrophotometer (Perkin–Elmer, Germany).
Table 3.2 Dyestuffs used in this study.
Dye C.I. generic name Class λλλλmax (nm)(a) Supplier
1 C.I. Acid Red 18 Acid dye 507 Bruno Ludewig GmbH
2 C.I. Acid Blue 80 Acid dye 581,625 Bruno Ludewig GmbH
3 C.I. Reactive violet 2 Reactive dye 551 Bruno Ludewig GmbH
4 C.I. Reactive Blue 5 Reactive dye 600 Bruno Ludewig GmbH
5 C.I. Reactive Violet 5 Reactive dye 560 Sigma-Aldrich Chemie GmbH
6 C.I. Reactive Black 5 Reactive dye 597 Sigma-Aldrich Chemie GmbH
Table 3.3 Auxiliaries used in print pastes in this study.
Auxiliaries Used as Supplier
Gum guar Thickener for acid dyes print
pastes
Sigma-Aldrich Chemie GmbH
Sodium alginate Thickener for reactive dyes
print pastes
Sigma-Aldrich Chemie GmbH
Urea A very common constituent
of print pastes as it acts as
both dye solvent and
hygroscopic agent (147)
Sigma-Aldrich Chemie GmbH
Ludigol A mild oxidizing agent (147) BTC Specialty Chemical Distribution GmbH
Contripon AT Defoamer Zschimmer & Schwarz GmbH & Co KG

Experimental Part 30
3.1.7 Solvent and other chemicals
Water purified and deionized (reverse osmosis followed by ion exchange and filtration) by
Milli-RO 5 Plus and Milli-Q Plus systems (Millipore GmbH, Germany) was used in all
experiments as solvent. Its conductivity was < 1 µS cm-1. The other chemicals used in this
study are given in Table 3.4.
3.2 Surface modification methods of PET fabrics
3.2.1 Ammonia plasma treatment
Ammonia plasma treatment was carried out in a computer-controlled MicroSys apparatus
by Roth&Rau, Wüstenbrand, Germany. The cylindrical vacuum chamber, made of
stainless steel, had a diameter of 350 mm and a height of 350 mm. The base pressure
obtained with a turbomolecular pump was < 10-7 mbar. On the top of the chamber, a 2.46
GHz electron cyclotron resonance plasma source RR160 by Roth&Rau with a diameter of
160 mm and a maximum power of 800 W was mounted. The plasma source can be
operated in a pulsed mode. The process gas was introduced into the active volume of the
plasma source via a gas flow control system. When the plasma source was on, the pressure
was measured by a capacitive vacuum gauge. Samples were introduced by a
load-lock-system and placed on a grounded aluminum holder near the center of the
chamber. The distance between the sample and the excitation volume of the plasma source
was about 200 mm. For the experiments of this work, the following parameters were used:
power 400 W, pulse frequency 1000 Hz, duty cycle 10 % (i.e. effective power 40 W);
ammonia gas flow 15 standard cubic centimeters per minute (sccm), pressure 7x10⁻³ mbar
(148).
Table 3.4 Other chemicals used in this study
Chemical Supplier
Sodium carbonate anhydrous Fluka
Citric acid Sigma-Aldrich Chemie GmbH
4- Trifluoromethylbenzaldhyde
( TFBA)
Merck

Experimental Part 31
3.2.2 Oxygen plasma treatment
Oxygen plasma treatment of PET fabric surfaces was carried out in a plasma processor 440
(Technics Plasma, Kirchheim, Germany). The apparatus was equipped with a 2.4 GHz
microwave source (maximum output power 600 W), which was connected with a quartz
window to a vacuum chamber with dimensions of 350 x 350 x 350 mm3 (base pressure
0.02 mbar). The process gas was introduced into the chamber via a gas-flow control
system. After switching on the microwave source, homogenous plasma was formed in the
chamber volume. The PET fabric samples were treated in dependence on input discharge
power and treatment time using the following parameters: input discharge power (100 W,
300 W, and 600 W) and treatment time (15 s, and 30 s); oxygen gas flow 10 sccm;
pressure, 0.14 mbar (149).
3.2.3 Coating of oxygen plasma-treated PET fabrics with cationic polyelectrolytes
Immediately following the oxygen plasma exposure, the fabric samples were immersed in
0.1, 0.5, 1, or 3 wt. % aqueous cationic polyelectrolyte solution for 3 h at the pH
corresponding to the solution of each cationic polyelectrolyte with no adjustment, i.e., pH
6 for PDADMAC, and pH 8 for PVAm. During the adsorption, the solution was gently
shaken at 25 °C. After adsorption, PET fabric samples were annealed in a convection oven
for 1h at 120 °C (91; 150). In order to remove weakly adsorbed polymer, the fabric samples
were extensively rinsed with deionized water until constant water conductivity was < 1
µS/cm measured with SevenMulti (Mettler-Toledo GmbH, Schwerzenbach, Switzerland),
then dried for 30 min at the same temperature. Finally, they conditioned on air and stored
in desiccators before use in characterization and coloration methods.
3.3 Characterization methods
3.3.1 X-ray photoelectron spectroscopy (XPS)
X-ray photoelectron spectroscopy (XPS), also known as electron spectroscopy for
chemical analysis (ESCA), is a surface sensitive method allowing to identify and to
quantify the chemical elements in the surface region of a solid and provides quantitative
information on the chemical structure, atomic composition, and chemical bonding state.
The spectral information appears from a depth of approximately 8–10 nm in maximum
(151). The technique is based upon the determination of the kinetic energy of
photoelectrons expelled from the core levels of sample surface atoms by absorption of
monochromatic soft X-ray photons in the so-called photoelectric effect (152). Core level

Experimental Part 32
binding energies measured by XPS are specific to the emitting elements in a reliable way
and shift due to changes in their chemical bonding environments. Photoelectrons whose
binding energies can be calculated according to the following equation (153):
�� � �ν � ��� � φ
where hν is the energy of the incident X-ray photons, EB is the binding energy of the
photoelectrons, Ekin is the kinetic energy of the photoelectrons, and φ is the work function
that is the energy which is necessary to transfer an electron from the Fermi level to the
vacuum level (151). The energy conservation law of the photoelectric effect allows
determining the core level EB from the measurement of the Ekin of the corresponding
photoelectrons.
XPS measurements were carried out by means of an Axis Ultra X-ray photoelectron
spectrometer (Kratos Analytical, Manchester, UK). The spectrometer was equipped with a
monochromatic Al KR (hυ = 1486.6 eV) X-ray source of 300 W at 15 kV. The kinetic
energy of the photoelectrons was determined with a hemispherical analyzer set to pass
energy of 160 eV for wide-scan spectra and 20 eV for the high-resolution element spectra.
During all measurements, electrostatic charging of the sample was avoided by means of a
low-energy electron source working in combination with a magnetic immersion lens.
Later, all recorded peaks were shifted by the same amount that was necessary to set the
C 1s peak to 284.76 eV for the carbon of the phenyl ring (154). Quantitative elemental
compositions were determined from peak areas using experimentally determined
sensitivity factors and the spectrometer transmission function. Spectrum background was
subtracted according to Shirley (155). The high-resolution spectra were deconvoluted by
means the spectra deconvolution software. Free parameters of component peaks were their
EB, height, full width at half-maximum, and Gaussian-Lorentzian ratio.
Selective chemical labeling reactions of primary amino groups (-NH2) were carried out
using the method by Favia et al (156). The PET fabric samples were exposed to vapor of
4-trifluoromethyl benzaldehyde (TFBA) for 60 min at room temperature before XPS
analysis by placing the PET fabric in a closed glass vessel together with TFBA (1 ml)
(Figure 3.2).

Experimental Part 33
(I) (II) (III)
Figure 3.2 Schematic representation of chemical labeling of primary amino group by TFBA.
The aldehyde group of TFBA (II) selectively reacts with –NH2 (I) functional groups on the
PET fabric surface, giving rise to the Schiff base (III) containing a trifluoromethyl group,
and subsequently analyzed the surface with XPS. The F1s peaks were used for quantifying
the number of –NH2 groups among all other nitrogen functionalities (157-159). According to
the stoichiomtric ratio of (III) the determined amount of fluorine must be three times the
amount of amino groups.
3.3.2 Electrokinetic measurements
Determination of the electrokinetic or zeta-potential for textile fabrics are interesting to
investigate distinct surface charges result from different modification steps or finishing
processes such as purification and coatings used in textile industries (160-163). It is well
established that the charge distribution differs remarkably between the bulk phase of a
liquid and the phase boundary between a solid and a liquid. At this phase boundary,
charges resulting from the dissociation of ionogenic groups at the solid surface as well as
from the adsorption of ions in the bulk, will then be accumulated, i.e., the formation of
what is known as an electrochemical double layer or Stern layer (164; 165). Based on this
conception, the electrokinetic behavior of surfaces can be demonstrated. Using the values
obtained by measuring the streaming potential between two electrodes, the zeta-potential
(ζ) can then be calculated.
Figure 3.3 shows a schematic of the electrochemical double layer based on the
Gouy-Chapman-Stern-Grahame model (GCSG-model) (160; 166). According to this model,
the electrochemical double layer is divided into the inner Helmholtz plane (IHP), the plane
of the centers of strongly adsorbed ions; the potential at this plane is ΨIHP and the outer
Helmholtz plane (OHP) that is the plane of the centers of oppositely charged ions; the
potential at this plane is ΨOHP. The remaining excess of charges is compensated by ions in
NH 2
NH 2
+ CF3 C
O
H - H 2 O
CF3 CHN
CF3 CHN
2

Experimental Part 34
the so-called diffuse or mobile layer. In the electrokinetic experiment, an external force
field is applied to the solid/liquid system and generates a relative movement between the
fixed part and the diffuse part. The plane between the immobile and mobile planes is called
“surface of shear” or “slipping plane” and the potential at this surface is called the
electrokinetic or ζ potential. It depends on the surface charge density and the double-layer
thickness (167).
Figure 3.3 Schematic representation of the electrochemical double layer at the interface according to the Gouy-Chapman-Stern-Grahame (GCSG) model after (160).
In the present work, electrokinetic measurements were carried out to determine the
zeta-potential of the PET surface as a function of the pH values of the electrolyte solution
using the streaming potential method. Streaming potential is generated when a liquid is
forced to flow directly through a parallel-plate channel formed between two sample
surfaces separated by a narrow slit (Figure 3.4).
Figure 3.4 Schematic representation of streaming measuring cell for fabrics.
+-
-
- +
+
-
distance z
surface
Immobile layer
mobile layer
Hydrated cation
Hydrated anion
OHPIHP
Shear plane
0
ζ
IHPΨ
OHPΨ

Experimental Part 35
The streaming potential was determined using EKA electrokinetic analyzer from Anton
Paar (Graz, Austria). The pH values were adjusted with 0.1 mol·L-1 HCl or 0.1 mol·L-1
KOH. To prevent a significant change in the ionic strength by adding HCl and KOH, all
measurements were carried out in 10-3 mol·L-1 KCl. The apparently ζ-potential values were
calculated from the measured streaming potential values by the use of the Smoluchowski
equation (168).
ζ � – ��� ηκ
ε�ε�
Where U is the streaming potential, p the pressure, εr and ε0 the dielectric constant and the
vacuum permittivity of the liquid phase, η the viscosity of the liquid phase and κ is the
conductivity of the measuring fluid. Surface conductivity of the fabric samples was not
taken into account. Furthermore, a lot of information can be gained from electrokinetic
measurements, for example polyelectrolyte adsorption.
3.3.3 Kinetics measurements of wetting
The wetting properties of the PET fabric surfaces before and after plasma treatment were
estimated by means of dynamic wetting measurements, which were carried out with a
FibroDAT 1122HS dynamic contact angle tester (Fibro System, Sweden) equipped with a
high speed video camera according to the sessile drop method. A microliter syringe was
used to place a deionized water droplet (Millipore water having a surface tension of
γlv = 72.8 mN/m at 23 °C) of a 10 µl volume on the fabric surface under investigation by a
short stroke from an electromagnet (169). The strength of stroke was minimized to avoid
oscillation effects. The data were collected after the water droplet stabilized on the surface.
The instrument was located in a temperature-controlled laboratory maintained at 23 ± 1°C.
Relative humidity of 50 ± 3 % was kept constant. The initial contact angle of water and the
absorption time (i.e. time recorded after the drop had completely penetrated into the PET
fabric surface) were used to evaluate the wettability of PET fabrics before and after plasma
treatment. The contact angle and the absorption time of water droplets shown for each
sample are averages of five single measurements (169).
3.3.4 ATR- FTIR Spectroscopy
Infrared spectroscopy can be used to identify functional groups present in polymer layers.
When an infrared (IR) beam irradiates a sample, chemical bonds periodically stretch,
contract, and bend ( among other vibration modes) and IR radiation is absorbed at defined

Experimental Part 36
wavenumbers (ν). In the ATR-FTIR sampling technique the examined film is placed on
the surface of IRE and the IR beam is directed into a crystal of the relatively higher
refractive index under a certain angle θ exceeding the critical angle. The beam of radiation
enters from an optically dense (ATR crystal) into a less optical dense medium (sample with
lower refractive index). The IR beam reflects from the internal surface of the crystal and at
the reflection point an evanescent wave is created, which penetrates into the sample being
in intimate contact with the ATR crystal. Some of the energy of the evanescent wave is
absorbed by the sample and the reflected radiation returns to the detector. Rationing and
logarthming the wavenumber ν dependent intensities reordered from the coated sample
IRE (Is (ν)) and the bare reference IRE (IR (ν)) gives the absorbance spectrum A(ν)
according to A(ν) = - log (Is (ν)/IR (ν))
Practically, in this work, samples of the unmodified and different modified PET films were
analyzed by ATR-FTIR spectroscopy using a commercial ATR-FTIR attachment
(OPTISPEC, Zürich, Switzerland). The ATR-FTIR attachment was installed on the IFS 55
Equinox FTIR spectrometer (BRUKER Optics GmbH, Ettlingen) equipped with globar
source and MCT detector. Samples (2 x 4 cm2) of the unmodified and different modified
PET films were pressed against trapezoidal ZnSe internal reflection elements (IRE) (50 x
20 x 2 mm3). The IRE and film were clamped together onto a home built
in-situ-ATR-FTIR cell. Spectra were recorded at 2 cm−1 resolution between 4000 cm−1 and
400 cm−1. The examination was limited to the region 1150-1880 cm-1 where the effects of
annealing process can be seen.
3.3.5 Differential scanning calorimetry measurements (DSC)
Thermal analysis by DSC can give some insight into the structure and properties of the
polymer by determination of the glass transition temperature (Tg), the melting temperature
(Tm) and the degree of crystallinity (XDSC). The Tg represents an approximate measure of
conformational rigidity and the transition from a frozen state to an amorphous state
whereby there is sufficient thermal energy for bond torsion to occur and for the polymer to
exhibit elastomeric properties (170).
The degree of crystallinity of polyester fiber is determined by integrating the peak area of a
differential scanning calorimetry curve. This method is based on a thermodynamic
definition of order and it requires the absolute value of the heat of fusion of the ideal
polymer crystal. The heat of fusion obtained from this is directly proportional to the
crystallinity.

Experimental Part 37
The measurements were conducted under nitrogen as inert atmosphere using a differential
scanning calorimeter (DSC Q 1000, TA Instruments, USA). The DSC analyses have been
carried out to determine the influence of plasma treatments on Tm, Tg and XDSC of the
unmodified and different plasma-treated PET fabrics. The samples were subjected to a
heating-cooling-heating cycle between -80 to 300 ºC at a scan rate of 10 ºC/min. The
results of the second heating run were generally reported. The crystallinity XDSC was
determined, according the commonly known relationship:
���� �%� � ���� � 100
where ∆Hm is the heat of fusion for the fiber-forming PET polymer, calculated from the
area under the peak of the DSC heating curve and ∆Ho is the heat of fusion for an 100 %
PET polymer. The reported ∆Ho for PET is 140 J/g was used for crystallinity percent
calculation (170).
3.3.6 Atomic force microscopy (AFM)
Surface roughness of PET fibers were characterized by AFM (NanoScope V Dimension
3100, Veeco, USA) using silicon-SPM-sensors (Budget Sensors, Bulgaria) with a tip
radius lower than 10 nm and a resonance frequency of about 300 kHz. Two or three PET
fibers were fastened to a steel sample mount. A tapping mode was used to scan the fiber
surface. Each AFM image was analyzed in terms of arithmetic mean roughness (Ra) of
0.6 µm x 0.6 µm area on the surface of the samples. Ra of PET fibers was calculated from
the following equation by the instrument software (171):
�� � 1� �!�" � !#$�%
&
"'(
&
�'(
Ra is the arithmetic mean roughness, N is the number of data points in the image, i and j
are the pixel locations on the AFM image, zij is the height value at i and j locations, zav is
the average height value within the given area and zcp is the height value of the center
plane.
The basic principle of AFM is the sample interacts with a sharp tip attached to the free end
of the cantilever. Tips are typically made from Si3N4 or Si. The changes of the interactions
due to surface features leads to a bending of the cantilever in contact mode or a change in
amplitude (A) of the oscillating cantilever in tapping mode. The motion of the cantilever is

Experimental Part 38
detected in a photodetector as a shift of the laser reflecting from the back of the cantilever.
The scanner corrects the changes in the bending of the cantilever or the change in the
amplitude, in order to keep the cantilever state constant. It also moves the sample during
scanning. This produces a topographical image from the sample (height image) recorded
from the scanner movement. Tapping mode is often useful for soft samples because it
reduces the tip-sample contact time
3.3.7 Scanning electron microscopy (SEM)
Surface morphologies of unmodified and different modified PET fabric surfaces were
evaluated by SEM Ultra 55 equipped with field emission gun (Carl Zeiss NTS GmbH,
Oberkochen, Germany) operating at electron energy of 2 keV. Prior to the analysis, the
samples were sputter-coated with a thin layer 3 nm of platinum under vacuum in an argon
atmosphere using a sputter coater (Bal-Tec SCD 500, USA) to avoid or minimize sample
charging under the electron beam.
3.4 Coloration of PET fabrics by printing
3.4.1 Preparation of printing pastes
The printing pastes with the anionic dyes C.I. Acid Red 18 and C.I. Acid Blue 80 were
formulated according to the following recipe:
* Only in the case of PET fabric surface modified with ammonia plasma or PVAm
The printing pastes with the anionic dyes C.I. Reactive Violet 2, C.I. Reactive Violet 5, C.I.
Reactive Blue 5 and C.I. Reactive Black 5 were prepared according to the following recipe:
Ingredients By weight (%)
Dye 1 Guar gum 1.5 Urea 10 Ludigol 0.5 Citric acid* 0.5 Contripon AT 0.2 Water 86.3
Ingredients By weight (%)
Dye 1 Sodium alginate 5 Urea 10 Sodium carbonate 3 Contripon AT 0.2 Water 80.8

Experimental Part 39
3.4.2 Printing and post-treatment methods
The aforementioned formulated printing pastes of the anionic dyes were applied to the
unmodified and different modified PET fabrics by using a conventional flat screen-printing
method (63). After printing, the printed fabric samples were dried in the air followed by
steaming at 100 °C for 20 min for C.I. Acid Red 18 and C.I. Acid Blue 80. However, C.I.
Reactive Violet 2, C.I. Reactive Violet 5, C.I. Reactive Blue 5 and C.I. Reactive Black 5
were fixed by thermofixation in a thermostatic oven (Memmert, Switzerland) at 180 °C for
3 min. Then, the printed fabric samples were washed with cold water and soaped using 3
g/L of non-ionic detergent (Tissocyl CSB) at 60 °C for 15 min at a liquor-to-fabric ratio of
50:1. Afterward, the samples are rinsed in cold water to remove unfixed dyes and finally
air-dried.
3.5 Characterization methods of printed PET fabrics
3.5.1 Color strength measurements of printed fabrics
The PET fabrics printed under different conditions of treatments were individually tested
for their color strength (K/S). The K/S values are a function of the spectral reflectance at a
given wavelength and are defined as the ratio between light absorption (K) and scattering
(S) characteristics of the sample. The color strength K/S values of the printed fabrics were
instrumentally determined from reflectance measurements with the following Kubelka-
Munk equation (172; 173):
K =
(1-β)2
S 2 β
where (β) is the degree of remission = R/100. Reflectance (R) obtained from a software
calculation is expressed as a percent value. (S) is the scattering coefficient and (K) is the
absorption coefficient of the printed fabrics. The K/Smax value corresponded to the largest
value of K/S over the scanned wavelength is commonly used to describe the color strength
of a dye-substrate system (174). Therefore, the increase of the K/Smax value can be used as a
characteristic for different surface modification approaches applied to PET.
The colorimetric measurement by reflectance was carried out in ACS imaging system CS-5
Chroma Sensor colorimeter (standard illuminant D65; 10◦ standard observer). The
reflectance of the printed fabrics was measured over the wavelength range of 400–700 nm.
In the process, the unprinted fabrics were used as a reference. Each fabric sample was

Experimental Part 40
folded twice, and three scans were performed at different places on the fabric surface. The
average value was recorded.
3.5.2 Color fastness of printed fabrics
Textiles are subjected to frequent washing and rubbing during their usage. Hence, color
fastness of printed modified fabrics has been assessed to determine the degree of wash
down. The samples were visually assessed using gray scales (175; 176). The gray scale
ranges from 5, for no shade change (or no stain on the adjacent fabric), to 1, for a severe
shade change (or staining), with half points (between 4 and 5, 3 and 4, 2 and 3, 1 and 2) in
between.
3.5.2.1 Color fastness to washing
The color fastness to washing was determined according to the ISO standard method
105-C02 (1989). The printed samples (4x4 cm2) were sewed between two pieces of cotton
and wool fabrics. The composite sample was immersed in an aqueous solution containing
(5 g/l soap and 2 g/l sodium carbonate) at the liquor ratio of 50:1. The bath was
thermostatically adjusted to 40 °C. The test was run for 30 minutes. The samples were then
removed, rinsed twice with occasional hand squeezing, then dried. Evaluation of the wash
fastness was established using the gray scale reference for color change.
3.5.2.2 Color fastness to rubbing
The color fastness to rubbing was determined according to the ISO standard method
105-X12 (1987). This test is designated for determining the degree of color, which may be
transferred from the surface of the colored fabric to another surface by rubbing. A colored
test sample fastened to the base of a crockometer was rubbed with white crock test fabric
under controlled conditions.
Dry rubbing test
The test sample was placed flat on the base of the crockometer. A white testing fabric was
mounted. The covered finger was lowered onto the test sample and caused to slide back
and forth 20 times by making ten complete turns at a rate of one turn/s. The white test
sample was then removed for evaluation using the gray scale.
Dry rubbing test
The white test sample was thoroughly wetted out in deionized water to a 65 % pick up. The
procedure was run as before. The white test samples were then air-dried before evaluation.

Results and Discussion 41
4 Results and Discussion
4.1 Low-pressure ammonia plasma treatment
Among nitrogen-containing plasmas, ammonia plasma is widely used to modify the
surface of polymeric materials to improve their wettability, printability, and
biocompatibility (177). The ammonia plasma treatment gives rise to nitrogen
functionalities, such as amino (–NH2), imino (–CH=NH), on polymer surfaces. The amino
group seems to be one of the most attractive ones, due to the versatile applications
provided by the rich amine chemistry (178).
In the work reported herein, the PET fabric was modified with ammonia plasma to control
its surface reactivity and polarity. Consequently, the coupling and immobilization of
different anionic molecules, particularly anionic dye molecules, can be regulated. The
ammonia plasma treatments were carried out at 10, 30, 60, 120 and 600 s. Moreover, their
effects on the surface properties of PET fabric were investigated.
The introduction of nitrogen-containing functional groups onto the PET fabric surface may
be explained through different expected reaction mechanisms resulted from interaction
between ammonia plasma reactive species and PET fabric surface (Figure 4.1) (179). It is
assumed that UV, electrons and ions in ammonia plasma probably attack ester groups
along the PET chain by two different routes. As a result, oxygen (route 1) or carbon
(route 2) radicals will be formed at the ends of the PET polymer chains making the surface
more reactive. This may lead to elimination reactions of ester groups, i.e. decarboxylation
as shown in the first route. Ammonia plasma contains H radicals and N radicals like NH
radicals and NH2 radicals. These radicals might be involved in ester group scission and can
react with carbon or oxygen radicals that were generated after ester group scission. Hence,
numerous different nitrogen-containing functional groups are introduced by these reaction
mechanisms as shown in the expected two routes (179; 180). In addition, the oxygen
(route 1) radicals may combine with hydrogen radicals generated from ammonia plasma,
which results in the formation of the oxygen-containing polar groups, such as carboxylic
groups on the fabric surface.

Results and Discussion 42
Route (1)
C
O
O CH2 CH2 OC
O
Repeating unit of PET polymer
C
O
OC
O
CH2 CH2 O
C
O
OC
O
C
O
NH2
C
O
CO2Decarboxylation
NH2 radicals
CO2
Ammonia plasma
Route (2)
Repeating unit of PET polymer
C
O
O CH2 CH2 OC
O
C
O
C
O
O CH2 CH2
C
O
C
O
C
O
C
O
O NH
Ammonia plasma
NH radicals
Figure 4.1 Possible surface functionalization reactions on PET fabric using ammonia plasma. 4.1.1 XPS characterization
Figure 4.2 shows wide-scan XPS spectra of the unmodified PET and ammonia plasma-
treated PET fabrics. A typical XPS wide-scan spectrum of the PET fabric surface (Figure
4.2a) depicts two peaks characteristic of carbon (C 1s) and oxygen (O 1s). However, after
ammonia plasma treatment (Figure 4.2b), one additional peak appeared for nitrogen (N 1s).
The N 1s peak indicates that the nitrogen-containing functional groups were introduced
onto the surface of the PET fabric by ammonia plasma treatment.

Results and Discussion 43
1000 800 600 400 200 0Binding energy [eV]
C 1s
O 1s
O KLL Si 2sSi 2p
O 2s
1000 800 600 400 200 0Binding energy [eV]
O 1s C 1s
O KLL
Si 2sSi 2p
O 2s
F 1s N 1sF KLL
Figure 4.2 Wide-scan XPS spectra of the unmodified PET fabric (a) and ammonia plasma-treated (600 s) PET fabric (b). The peaks are assigned to the corresponding chemical elements.
The elemental surface compositions of surface region and the corresponding atomic ratios
of the unmodified and different ammonia plasma-treated PET fabrics are summarized in
Table 4.1. Surface chemical composition induced by ammonia plasma treatments was
determined by XPS analysis during 30 min after modification. The stoichiometry value of
the unmodified PET fabric surface calculated from the repeating unit of the PET polymer
chains was found to be ([O]:[C]|stoi, PET = 4:10) with C (at. %) value of 71.4 and O (at. %)
value of 28.6 (181).
Table 4.1 The elemental surface composition and atomic ratios determined by XPS for the unmodified and ammonia plasma-treated PET fabrics for the indicated treatment time.(a)
Treatment time (s) C (at. %) O (at. %) N (at. %) [N]:[C] [O]:[C]
0(b) 72.1 25.6 0 0 0.35
10 72.6 23.0 1.5 0.02 0.32
30 72.4 22.1 3.0 0.04 0.31
60 70.2 22.9 4.4 0.06 0.33
120 68.2 22.1 7.1 0.1 0.32
600 63.6 20.8 12.2 0.19 0.33
(a) It should be noted that Si as surface contaminant is not completely removed and effect of plasma on the variation of Si at. % not involved in discussion.
(b) Unmodified PET fabric
(a) (b)

Results and Discussion 44
Table 4.1 demonstrates that the unmodified PET fabric surface displayed significantly
lower value of [O]:[C] atomic ratio than the stoichmetrical PET. This is probably due to
the adsorption of a small amount of an adventitious hydrocarbon layer onto the PET fabric
surface or the residual processing agents that might deposit on the fabric surface during the
manufacturing processes of the PET fabric.
On the other hand, the results obtained after the ammonia plasma treatment indicated that
as the treatment time increases from 10 to 600 s, the nitrogen content increases while the
carbon content decreases in the surface region. As a result, the [N]:[C] atomic ratio
increases proportional to the treatment time. For instance, after the ammonia plasma
treatment of PET fabric for 10 s the [N]:[C] atomic ratio increases from 0 to 0.02, while
after 600 s the [N]:[C] atomic ratio value increases significantly to 0.19 indicating the
incorporation of nitrogen-containing functional groups onto the PET surface. The increase
in nitrogen content may be attributed to the increase in the number of reactive species, in
the plasma environment increases, involved in the functionalization process (182).
Additional insight into the surface chemistry can be obtained through deconvolution of the
XPS spectra to investigate what were chemical functional groups introduced onto the
surface of the PET fabric after ammonia plasma treatment. The high-resolution C 1s
spectra of the unmodified and ammonia plasma-treated PET fabric surface for 600 s are
presented in Figures 4.3a-b. The C 1s spectrum of the unmodified PET fabric surface
(Figure 4.3a) mainly contains three distinct component peaks indicated by italic letter. The
component peak A corresponds to unsaturated hydrocarbon –C–C–/C–H, carbon atoms in
phenyl ring (284.7 eV). Component peak C corresponds to C–O, methylene carbon atoms
singly bonded to oxygen (286.1 eV). Component peak E corresponds to O=C–O, ester
carbon atoms (288.6 eV). In addition, there are shake-up peaks (291.1 eV) results from
π → π* electron transitions between the occupied and unoccupied π-orbitals of the phenyl
rings. Their appearance is very typical for intact conjugated π-systems in arenes. The
binding energies of these component peaks are consistent with those reported by Beamson
and Briggs for clean PET films (154).
Additional component peaks were necessary to fit the measured spectrum. Component
peak D at (286.7 eV) represents also O–C groups. Its binding energy most likely
corresponds to alcoholic groups, but considering the [C]:[O] ratio (determined from the
C1s spectrum and its comparison with the ratio determined from the wide-scan spectrum)
the component peak must appear from ether groups. The second additional component

Results and Discussion 45
Si
A
280
3 00 290 2802 852 95B ind ing energ y [eV ]
CDEShake-up
O 2s
S i
3 00 2 90 2 802852 95B in d ing ene rgy [eV ]
P h
CF
E
Sh a k e-u p B
A
peak Si shows C–Si, carbon atoms singly bonded to Si of residual processing agents.
Although PET fabrics were carefully cleaned before any further modification, surface
contaminants are not completely removed as shown in the presence of Si.
Figure 4.3 High-resolution C 1s XPS spectra of the unmodified PET fabric (a) and ammonia plasma-treated (600 s) PET fabric (b).
After ammonia plasma treatment, the C 1s spectrum of the ammonia plasma–modified
PET fabric is shown in Figure 4.3b. With respect to the unmodified PET fabric (Figure
4.3a); the plasma-treated PET sample shows origin of the component peak B (285.9 eV)
and component peak F (287.6) in addition to main component peaks of the unmodified
PET fabric surface. Concluding from the binding energy of component peak B formation
the C–N bond that may be attributed to introduction of new nitrogen-containing functional
groups at the surface such as amino group (183), and the binding energy of component peak
F assigned to number of functionalities, such as N−C=O and C=O groups (154).
Determination of the−−−−NH2 groups by TFBA
Direct identification and quantification of amino groups by XPS are not possible when the
amino groups coexist with other nitrogen containing species with similar chemical shifts
(184; 185). The basic principle of determination of the primary amino groups is to have a
specific reaction between the −NH2 functional groups and a special marker molecule. The
marker molecule must have at least one element that does not exist in the original sample.
Therefore, in the case of the successful reaction, the target functionality can be detected
unambiguously by the new element exists in the XPS spectra. TFBA has been found to
satisfy the above-mentioned criteria and was used in our study to prove the presence of
−NH2 groups (158). The aldehyde group of TFBA reacts selectively with surface-near –NH2
groups forming a Schiff’s base containing a trifluoromethyl groups (as shown in Figure 3.3
(a) (b)

Results and Discussion 46
in experimental part). This covalently linked TFBA via imine bonds, whereby [–NH2]
concentration could readily be deduced from the fluorine concentration [F], at the surface
determined by XPS.
The labeling results in Figure 4.4 illustrate the concentration of –NH2 groups for the
different plasma treatment times. It can be seen that the concentration of nitrogen
introduced on the surface rises to the maximum and the amount of –NH2 groups is
significantly lower than the amount of total nitrogen determined from wide-scan spectra.
That behavior was expected, because other nitrogen-containing functional groups were
produced simultaneously, such as amide groups. Furthermore, the TFBA molecule has a
high steric demand. The large TFBA molecules may not be able to react with all of the
amino groups on the PET fabric surface.
This labeling reaction indicates that the incorporation of primary amino groups onto the
surface varies between 0.3 and 1% by the ammonia plasma. This suggests that by plasma
treatment it is difficult to obtain a –NH2 surface functionalization with high selectivity
since other nitrogen functionalities are formed simultaneously (186). This is generally
referred to as “unspecific functionalization” (187; 188). Reaction mechanisms in plasma are
quite different from reactions in solutions or gas phase. Many of reactions occurring in
plasma are not controlled. Hence, numerous different nitrogen-containing functional
groups are expected.
Figure 4.4 Atomic percent of the total nitrogen and fraction of –NH2 groups that able to react with TFBA after ammonia plasma treatments as determined by XPS and TFBA labeling.
0 100 200 300 400 500 600
0
2
4
6
8
10
12
14
16
Sur
face
de
nsity
in %
Plasma treatment time (s)
N total
%
N NH2
%

Results and Discussion 47
From the previous studies (158; 189), the application of IR spectroscopic in the
determination of other nitrogen functionalities present at the polymer surfaces is limited.
The reason behind that is the IR sampling depth higher than the outer layer onto which new
functionalities are introduced. Whereas, XPS is a powerful tool in surface analysis,
therefore the high-resolution N 1s XPS was taken into consideration (Figure 4.5).
Figure 4.5 High-resolution N 1s XPS spectrum of ammonia plasma-treated (600 s) PET fabric. The high-resolution N 1s spectrum (Figure 4.5) confirmed the addition of different
nitrogen functionalities to the PET surface during plasma treatment. The high-resolution
N 1s spectrum was decomposed into two main component peaks (component peaks F and
G) showing the presence of the two chemical states of nitrogen. Nitrogen species with a
BE around 398.9 eV attached to the phenyl ring contribute to component peak F.
Component peak G at higher BE 400.1 eV appears from nitrogen species attached on
saturated carbon atoms, such as methylene groups (154; 190).
4.1.2 Electrokinetic measurements
The introduction of the Brønsted-basic amino groups can be additionally proved by
streaming potential measurements that are very sensitive to analyze charge formation
processes on solid surfaces. Figure 4.6 shows the determined zeta-potential values (ζ) for
the unmodified and different ammonia plasma-treated PET fabrics as a function of the pH
values of an aqueous KCl with a concentration of 10-3 mol·L-1 solution. The linear shape of
the function ζ= ζ(pH) of the unmodified PET fabric sample over investigated pH range is
typical for non-polar solid surfaces without dissociating surface groups. Thus, the
adsorption of the potential-determining ions H+ and OH¯ control the charge formation of
the unmodified PET fabric surface.
410 400 390395
N 1s
405
FG
Binding energy [eV]

Results and Discussion 48
Figure 4.6 ζ-pH dependence for the unmodified PET fabric and ammonia plasma-treated PET fabric at different treatment time.
At pH < 4, the zeta-potential of the unmodified PET fabric is positive because the
adsorption of H3O+ ions from the electrolyte solution onto the fabric surface. With
increasing the pH value, zeta-potential decreases. At pH = 4 there is neither an excess of
negative nor positive charges in the shear plane, and the corresponding zeta-potential is
zero. The pH value where zeta-potential equals to 0 is called the isoelectric point (IEP =
pH|ζ=0). At pH > IEP, negative zeta-potential values are observed due to a preferential
adsorption of OH from electrolyte solution.
The change of the interfacial charge at the PET fabric surfaces was observed after
ammonia plasma treatment, which causes a remarkable shift of the IEP to a higher pH
value compared to the unmodified PET fabric. The shifts of IEP toward a higher pH reflect
changes of chemical structure of PET fabric surface. It was assumed that these changes
caused by an additional contribution of Brønsted basic groups into the surface region of
PET fabric. Even with the shortest modification time of 10 s, the IEP value is shifted
towards pH 4.25 (IEP for the unmodified PET around pH 4). With longer modification
time, the shift increases giving IEP for 30 s modified sample at pH 5. By extrapolating the
curve of the zeta-potential for 60 s, the IEP was approximately observed at pH 6.1. If PET
fabric surface is modified with ammonia plasma for 120 s the IEP is slightly shifted to
about pH 6.2 and reaches approximately pH 6.5 after 600 s. According to Stern theory
3 4 5 6 7 8 9 10 11-80
-70
-60
-50
-40
-30
-20
-10
0
10
20
30
40
50
ζ (m
V)
pH
Unmodified PET 10 s 30 s 60 s 120 s 600 s

Results and Discussion 49
(166), IEP corresponds to the number of the Brønsted basic groups on the ammonia plasma-
treated PET fabric surface. In the case of all the amino groups are protonated, these
ammonium species can be gradually deprotonated by increasing pH-value and,
consequently, the zeta-potential value decreases, at IEP all ammonium species are
deprotonated. This qualitatively corresponds to XPS results where [N]:[C] ratio dependent
on the treatment time.
4.1.3 Surface morphology
In order to investigate the impact of the ammonia plasma treatment on the surface
morphology of PET fabric surface AFM was carried out. Figure 4.7 shows AFM images
corresponding to the unmodified and ammonia plasma-treated (600 s) PET single fibers.
Indeed, no major difference can be observed between the unmodified and modified fibers.
The mean roughness value (Ra) was calculated, it was 6.1 nm for the unmodified and 6 nm
for the ammonia plasma-treated. Therefore, it was concluded that surface functionalization
processes prevailing over etching under investigated operating conditions (191).
Ra = 6.1 nm Ra = 6 nm Figure 4.7 Three-dimensional AFM images of PET fibers showing surface roughness of the
unmodified PET fiber (a) and the ammonia plasma-treated (600 s) PET fiber (b).
4.1.4 Kinetics measurements of wetting
The wettability of materials can be characterized by wetting experiments, which is
routinely evaluated based on the static contact angle, to quantify the wettability (192).
However, the static contact angle cannot be used to evaluate the wetting behavior of
heterogeneous structures such as textile fabrics, because water is able to penetrate the pores
of fabrics by capillary forces (193). Therefore, the effectiveness of plasma treatment with
µµµµm
nm
µµµµm
nm
(a) (b)
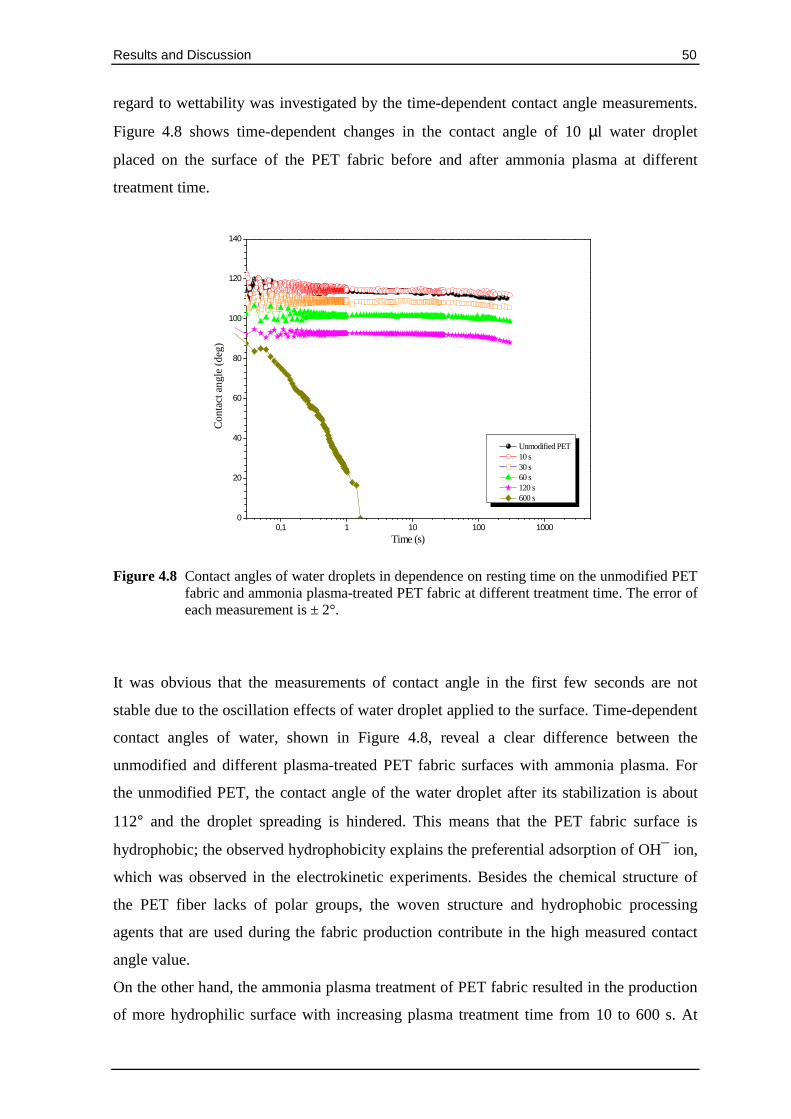
Results and Discussion 50
regard to wettability was investigated by the time-dependent contact angle measurements.
Figure 4.8 shows time-dependent changes in the contact angle of 10 µl water droplet
placed on the surface of the PET fabric before and after ammonia plasma at different
treatment time.
Figure 4.8 Contact angles of water droplets in dependence on resting time on the unmodified PET fabric and ammonia plasma-treated PET fabric at different treatment time. The error of each measurement is ± 2°.
It was obvious that the measurements of contact angle in the first few seconds are not
stable due to the oscillation effects of water droplet applied to the surface. Time-dependent
contact angles of water, shown in Figure 4.8, reveal a clear difference between the
unmodified and different plasma-treated PET fabric surfaces with ammonia plasma. For
the unmodified PET, the contact angle of the water droplet after its stabilization is about
112° and the droplet spreading is hindered. This means that the PET fabric surface is
hydrophobic; the observed hydrophobicity explains the preferential adsorption of OH¯ ion,
which was observed in the electrokinetic experiments. Besides the chemical structure of
the PET fiber lacks of polar groups, the woven structure and hydrophobic processing
agents that are used during the fabric production contribute in the high measured contact
angle value.
On the other hand, the ammonia plasma treatment of PET fabric resulted in the production
of more hydrophilic surface with increasing plasma treatment time from 10 to 600 s. At
0,1 1 10 100 10000
20
40
60
80
100
120
140
C
ont
act a
ngl
e (d
eg)
Time (s)
Unmodified PET 10 s 30 s 60 s 120 s 600 s

Results and Discussion
low modification time of 10 s, the contact angle remained unchanged
explained by the XPS results, the formed
wetting behavior. Most of the surface area seem
treatment time is increased to 30 s the contact angle shows an initial decrease in
comparison to the unmodified PET
increased to 120 s, the contact angle decreased rapidly from 112
increase in treatment time to 600 s, initial contact angles significantly decreased and water
absorptivity is greatly enhanced by ammonia plasma treatment. The
in the time-dependent wetting behavior can be explained by the different chemistry of the
PET fabric surfaces.
Figure 4.9 illustrates the image
unmodified and ammonia
shows that the water droplet does not spread
the first 1.8 s and the shape of
that the water droplet fully spread
This change in the wetting behavior can be attributed to
the surface, which improve the wettability of the PET fabric
0.01 s 0.03 s
0.01 s 0.03 s Figure 4.9 Image sequences of water droplet
the ammonia plasma
(b)
(a)
low modification time of 10 s, the contact angle remained unchanged
results, the formed hydrophilic groups are insufficient
. Most of the surface area seems to be unmodified. As the plasma
increased to 30 s the contact angle shows an initial decrease in
the unmodified PET fabric and 10 s treatment time. As the
increased to 120 s, the contact angle decreased rapidly from 112° to about 88
time to 600 s, initial contact angles significantly decreased and water
absorptivity is greatly enhanced by ammonia plasma treatment. The observed differences
dependent wetting behavior can be explained by the different chemistry of the
the image-sequence of water droplets applied to the surface of the
unmodified and ammonia plasma-treated (600 s) PET fabrics, respectively.
the water droplet does not spread on the unmodified PET fabric surface during
the first 1.8 s and the shape of the water droplet is nearly spherical. Figure 4.9b points out
that the water droplet fully spreads on the plasma-treated PET fabric surface within 1.8 s.
wetting behavior can be attributed to the polar groups introduced
prove the wettability of the PET fabric.
0.03 s 0.5 s 1.0 s
0.03 s 0.5 s 1.0 s
of water droplets applying to the unmodified PET fabric surface (a) and plasma-treated (600 s) PET fabric surface (b).
51
low modification time of 10 s, the contact angle remained unchanged (Figure 4.8). As
insufficient to control the
to be unmodified. As the plasma
increased to 30 s the contact angle shows an initial decrease in
time. As the treatment time is
to about 88°. Further
time to 600 s, initial contact angles significantly decreased and water
observed differences
dependent wetting behavior can be explained by the different chemistry of the
droplets applied to the surface of the
(600 s) PET fabrics, respectively. Figure 4.9a
on the unmodified PET fabric surface during
droplet is nearly spherical. Figure 4.9b points out
PET fabric surface within 1.8 s.
polar groups introduced onto
1.8 s
1.8 s
applying to the unmodified PET fabric surface (a) and

Results and Discussion 52
4.1.5 Stability of the ammonia plasma-treated PET fabric
The functional groups introduced onto the PET fabric surface can be unstable and lose
reactivity over time. Changes in contact angle and surface atomic composition have been
used to quantify the kinetics of surface restructuring (177; 194). In this regard, the ammonia
plasma treatment of PET fabrics was examined along time by a combination of XPS results
(Figure 4.10) and time-dependent contact angle measurements (Figure 4.11) as
surface-sensitive techniques. To examine the stability of ammonia plasma-treated PET
fabric, the fabric modified for 600 s presenting high [N]:[C] atomic ratio was chosen. The
modified fabric was stored in the air under normal conditions of temperature and humidity
for different storage times (1, 7 and 14 days) after plasma treatment. In Figure 4.10, the
ageing behavior was studied by XPS. The first-time measurements were made 1 day after
modification, the [N]:[C] atomic ratio at the surface is slightly less than [N]:[C] ratio
recorded immediately after plasma treatment, gradually decreased from 0.19 to 0.17 after 1
day. After 7 days of storage in air, the [N]:[C] ratio of plasma modified-PET surface was
reached a value of 0.15. Afterwards, the surface composition remains nearly unchanged
during the following week. Based on the results obtained from the XPS measurements
during ageing, the PET fabric surface lost about 21 % of its overall nitrogen containing
groups induced by plasma treatment after 14 days.
Figure 4.10 The [N]:[C] atomic ratio of ammonia plasma-treated (600 s) PET fabric as a function of the ageing time in the air under ambient conditions.
Changes in wettability induced by the introduction of the polar functional groups can be
time-dependent. Many researchers report this effect, often called ageing or hydrophobic
recovery, on plasma-treated surfaces (183; 195). The ageing was evaluated by determination
0 2 4 6 8 10 12 14
0,15
0,16
0,17
0,18
0,19
[N]:[
C]
Ageing time (days)

Results and Discussion 53
of water-absorption time, which is required by the water droplet to be completely absorbed
into the fabric (Figure 4.11). It was observed that the water-absorption time gradually
increased in the first week of storage. Afterwards, no significant differences in
water-absorption time were found after storage in the air between 7 and 14 days. This is
consistent with the results of XPS analysis (Figure 4.10). It is also important to note that
not all the hydrophilic nature achieved by the plasma treatment is lost during the ageing
process. Several factors have been reported to influence the stability of the modified
surfaces, including contamination, the chemical structure of the original polymer and the
storage environment, all may contribute to the overall decay phenomena (196; 197).
The most plausible explanation of ageing phenomenon based on a process of
thermodynamic relaxation. After plasma treatment, the polymer can be considered as a
non-homogeneous material regarding its surface and bulk properties. From the
thermodynamic point of view, the surface always has a tendency to rearrange continuously
in order to minimize its surface free energy (198). Hence, allowing chain migration into the
bulk of the material and reorientation of the surface polar groups away from the surface
during storage. Surface rearrangement can therefore affect results from surface analyses
and explain the gradual deterioration of the surface properties and the effect of wettability
reversal.
Figure 4.11 Effect of ageing time on the contact angles of water droplets in dependence on resting time on the ammonia plasma-treated (600 s) PET fabric. The error of each measurement is ± 2°.
0,01 0,1 1 100
20
40
60
80
100
120
140
Co
nta
ct a
ngle
(d
eg.)
Time (s)
Modified PET , 600 s After 1 day After 7 days After 14 days

Results and Discussion 54
4.1.6 Determination of the degree of crystallinity by DSC
In an attempt to show the effect of the ammonia plasma treatments on the bulk properties
of PET fabric, DSC studies were performed on PET fabrics before and after the ammonia
plasma treatment, in which the heat flow is measured as a function of temperature. The
main objective of performing DSC was to investigate the effect of the ammonia plasma
treatment on the Tm, Tg (Figure 4.12a) and the degree of crystallinity (Figure 4.12b) of the
unmodified and different ammonia plasma-treated PET fabrics.
Figure 4.12 DSC thermograms of the unmodified and ammonia plasma-treated PET fabrics from 2nd heating run (a), and the effect of plasma treatment time on percent of crystallinity for different PET fabrics (b).
It was found that DSC thermograms (Figure 4.12 a) of ammonia plasma-treated PET
fabrics exhibit no significant changes regarding the melting point in comparison with the
unmodified PET fabric. It can be seen that the DSC thermograms of PET fabrics showed
an endothermic peak with the maximum at 250 °C, which due to the Tm. In addition, the
thermograms do not reveal any significant features that are attributable to the surface
modifications. Figure 4.12b shows the values of the degree of crystallinity for the
unmodified and ammonia plasma-treated PET fabrics. It is also observed that no
considerable changes are observed in the degree of crystallinity of PET fabric after the
ammonia plasma treatments compared to the unmodified PET fabric. This may be due to
the limited penetration depth of the plasma to the outermost surface, but the crystallinity is
a bulk internal property of the polymer. Accordingly, the DSC is not sensitive enough to
-80 -30 20 70 120 170 220 2700,0
0,2
0,4
0,6
(a)
He
at F
low
(W
/g)
Temperature (oC)
unmodified PET 10 s 30 s 60 s 120 s 600 s
end
o
30
32
34
36
38
degr
ee
of c
ryst
allin
ity (
%)
ammonia plasma treatment
(b)
un
mo
difi
ed
PE
T
10
s
30
s
60
s
12
0 s
60
0 s

Results and Discussion 55
detect those changes caused by plasma (at the surface). Thus, the results obtained by DSC
analysis confirm that plasma treatments do not interfere with bulk properties of fabrics.
In conclusion, the ammonia plasma increases the amount of nitrogen-containing groups on
the surface of PET fabric, without significant damage of the bulk material. It was also
observed that ammonia plasma treatment like the most of simple plasma treatments results
in diversity of functional groups produced by the multitudes of chemical reactions that take
place on the PET fabric surface. To overcome this, a new tool for selective surface
modification of PET fabric with amine functionalities was investigated.
Functionalized surfaces with the highest degree of retained amine functionalities seem very
important for the development of functional materials (91). For that purpose, in the next
part of this study, the functionalization of a hydrophobic PET fabric surface with cationic
polyelectrolytes was performed. However, in order to anchor cationically charged
polyelectrolytes it was necessary to produce functional surface groups having the ability to
be negatively charged in aqueous environment. Therefore, the oxygen plasma treatment
was used as a preliminary stage to enhance surface polarity, reactivity of PET fabric and to
keep the mechanical and the physical properties of the bulk PET without serious
impairment. Afterwards, cationic polyelectrolytes were immobilized on the plasma-treated
surface from their aqueous solution.
4.2 Surface functionalization of PET fabric with cationic polyelectrolytes
In term of industrial applications, PDADMAC and PVAm were selected according to their
applications and commercial availability. The main goal of the application of cationic
polyelectrolytes is to modify the PET fabric to provide a high surface charge density
required for a better interaction with anionic molecules.
4.2.1 Low-pressure oxygen plasma treatment
The reproducible functionalization of the PET fabric surface with oxygen plasma requires
optimization of the operating plasma parameters. In this study, the aim of the optimization
was to minimize the process of material ablation and equip the PET fabric surface with a
sufficient density of carboxylic acid groups, which can dissociated in an aqueous medium
and provides anchoring sites for the polyelectrolyte molecules. The chosen plasma
discharge powers for this study were 100, 300 and 600 W; and for each power, a treatment
time of 15 and 30 s were performed.

Results and Discussion 56
C O CH2 CH2 OC
O OOxygen plasma
CC
O O
CH2 OCH2O
CC
O OH
CC
O O
H
CC
O OO2
CC
O O
O O H CC
O O
O OH
CC
O O
O OHOH
CC
O O
O HCC
O O
OH
Indeed, when the PET fabric surface contacts with oxygen plasma, the following expected
reactions (Figure 4.13) occurred at the surface of the PET fabrics. Oxygen plasma
treatment generates polymer chain scissions of the ester bonds of PET by high-energy
electrons and photons (UV-radiation). These chain scissions create a large amount of very
reactive chain-ends, such as free radicals, which then react easily with the reactive species
present in the oxygen plasma such as OH radicals, excited molecular oxygen O2 and H
radicals. At the chain-ends, these reactions create some oxidized groups like carbonyl,
carboxyl and hydroxyl groups (199; 200).
Route (1): the formation of hydroxyl groups
C O CH2 CH2 OC
O O
C OC
O O
CH2 OCH2
Oxygen plasma
Repeating unit of PET polymer
Route (2): the formation of carbonyl and carboxyl groups
Figure 4.13 Possible surface functionalization reactions on PET fabric using oxygen plasma.
C OC
O OH
C
O
OHC
O
C
OOH
C
O
OHDecarboxylation
CO2C
O
OHC
O

Results and Discussion 57
To confirm chemical and morphological alteration of the PET fabric after oxygen plasma
treatment at different treatment conditions, XPS, electrokinetic measurements, AFM,
kinetics measurements of wetting and DSC were performed. Then the results were
compared to those obtained for the unmodified PET fabric.
4.2.1.1 XPS characterization
The elemental surface compositions and the corresponding atomic ratio [O]:[C] of the
unmodified and different oxygen plasma-treated PET fabrics determined by XPS are
summarized in Table 4.2. Changes in the surface composition were noticeable for all
plasma modified-PET fabrics. After oxygen plasma treatment, the [O]:[C] atomic ratio is
significantly increased. The [O]:[C] atomic ratio can be further increased by a higher
plasma power and a longer treatment time. The oxygen content and [O]:[C] atomic ratios
do not change anymore when the plasma treatment time is increased from 15 s to 30 s at
600 W. This shows that there is a saturation of the plasma effect on the PET fabric. These
obtained results suggest that oxygen plasma treatment enabled the introduction of oxygen
functional groups onto the hydrophobic PET surfaces.
Table 4.2 The elemental surface composition and elemental ratio determined by the XPS for the unmodified and oxygen plasma-treated PET fabrics under different operating conditions. The unmodified PET indicated by plasma power = 0 and modification time = 0.
Plasma Power (W) Modification time (s) C (at. %) O (at. %) [O]:[C]
0 0 72.1 25.6 0.35
100 15 62.2 35.5 0.57
300 15 61.9 36.0 0.58
600 15 56.6 39.9 0.7
100 30 57.6 38.9 0.67
300 30 57.1 39.3 0.68
600 30 56.5 39.7 0.7
In order to investigate the oxygen functional groups introduced onto the PET fabric
surfaces by oxygen plasma treatment, high-resolution XPS analysis of C 1s peaks was
performed. In comparison with the unmodified PET fabric (Figure 4.14a), the XPS C 1s
spectrum of the oxygen plasma-treated (600 W, 15 s) PET fabric shows a high amount of

Results and Discussion 58
Si
A
280
300 290 280285295Binding energy [eV]
CDEShake-up
O 2sSi
A
280
300 290 280285295Bind ing energy [eV]
CBE
Shake-up
D
F
introduced oxygen-containing functional groups (Figure 4.14b). The shape of the
high-resolution C 1s spectrum of the oxygen plasma-treated PET fabric is qualitatively
similar to the C1s spectrum of the unmodified PET fabric in addition to two new
component peaks. The first component peak B corresponding to introduced keto groups
C=O (287.5 eV) which indicates a partly oxidized, but intact polymer chain. The second
new component peak F at 289.6 eV indicates the presence of carboxyl groups O=C–OH. If
the carbon atoms of the phenyl rings are directly involved in the oxidation reaction forming
carboxylic groups, the phenyl rings must be destroyed. However, the presence of the
shake-up satellite peaks in Figure 4.14b clearly shows the presence of delocalized
π-electron systems of intact phenyl rings. Obviously, the oxidation reaction is largely
selective to cleave the ester bond and oxidize the residual methylene group of the ethylene
unit. It seems also possible to form carboxylated phenyl ring (Figure 4.13). The π-electron
delocalization can include the carboxylate group, hence wider shake-up peaks are
observed. These results show that the oxygen plasma treatment introduced different polar
groups.
Figure 4.14 High-resolution C 1s XPS spectra of (a) unmodified PET fabric and (b) oxygen
plasma-treated (600 W, 15 s) PET fabric.
4.2.1.2 Electrokinetic measurements
The XPS findings indicate that the oxygen plasma treatment introduce carboxylic acid
groups, which are weak Brønsted acids. The presence of weak acidic groups should
influence the electrokinetic properties. Hence, streaming potential measurements can be
applied to prove the existence of Brønsted acids groups on the PET fabric surface. Figure
4.15 shows the determined zeta-potential values for the unmodified and different oxygen
plasma-treated PET fabrics as a function of the pH values of an aqueous KCl with a
(a) (b)

Results and Discussion 59
concentration of 10-3 mol·L-1 solution. An alteration of the charge state was observed after
the oxygen plasma treatment.
Figure 4.15 ζ-pH dependence for the unmodified PET fabric and oxygen plasma-treated PET fabric at different treatment power for 15 s (a) and ≤ 30 s (b).
The gradual shift of IEP to a lower pH values (Figure 4.15a) indicates the contribution of
Brønsted acidic groups to the interfacial charge introduced by the plasma treatment.
Combined with the results obtained by high-resolution C1s spectrum (Figure 4.15b) it can
concluded that the plasma treatment forms oxygen-containing groups that are acidic
carboxylic acid groups (O=C–OH). Hence, the strong IEP shift is mainly caused by
formation of carboxylate groups (O=C–O) which are negatively charged and contribute to
the net surface charge. Figure 4.15a shows that the higher the discharge power of the
oxygen plasma treatment, the higher the shift of the IEP from about pH 4 for the
unmodified PET to lower pH of about 2.6 for oxygen plasma-treated (600 W, 15 s) PET
fabric indicating the increase in the number of surface acidic groups. The function
ζ = ζ(pH) in the pH range before the appearance of the plateau is reached, show the
stepwise dissociation of carboxylic acid groups, which is driven by OH¯ ions with increase
pH-values. With longer modification time 30 s (Figure 4.15b) the shifts increase, giving
IEP for 100 W modified PET fabric at pH value of 3.25 and for 300 W modified PET
fabric at pH 2.9. If PET fabric is modified with oxygen plasma at 600 W for 30 s the shift
in IEP not exceed beyond pH 2.6, and this might be due to the formation of acidic groups
at the surface was saturated at 600 W for 15 s. The dissociated carboxylic acid groups
3 4 5 6-60
-50
-40
-30
-20
-10
0
10
20
30
ζ (m
V)
pH
Unmodified PET 100 W, 15 s 300 W, 15 s 600 W, 15 s
3 4 5 6-60
-50
-40
-30
-20
-10
0
10
20
30
ζ (m
V)
pH
Unmodified PET 100 W, 30 s 300 W, 30 s 600 W, 15 s 600 W, 30 s
(a) (b)

Results and Discussion 60
introduced by oxygen plasma can be used as anchoring sites for subsequent
functionalization with cationic polyelectrolytes. High-resolution XPS spectra and
streaming potential measurements confirm that the PET fabric surface was oxidized by the
oxygen plasma treatment.
4.2.1.3 Surface morphology
Plasma-induced morphological changes of PET single fibers were investigated by AFM.
AFM images of the unmodified and oxygen plasma-treated (600 W, 15 s) PET fibers
(Figure 4.16) show no significant surface morphological changes on the PET fiber after the
oxygen plasma treatment. It was found that the Ra of oxygen plasma-treated PET was
nearly kept unchanged 6.3 nm after plasma compared with the Ra= 6.1 of the unmodified
PET fabric. Therefore, it is concluded that surface functionalization processes prevailing
over etching under investigated operating conditions (191).
Ra = 6.1 nm Ra= 6.3 nm Figure 4.16 Three-dimensional AFM images of single PET fiber showing surface roughness of
unmodified PET (a) and oxygen plasma-treated (600 W, 15 s) PET fabric (b).
4.2.1.4 Kinetics measurements of wetting
The effects of the functional surface groups introduced by the oxygen plasma treatment on
the wetting behavior of PET fabrics can be observed from the time-dependent contact
angle measurements. It is noticed that all of the oxygen plasma-treated PET fabrics
exhibited a marked increase of wettability. It was not possible to measure the advancing or
µµµµm
nm
µµµµm
nm
(a) (b)

Results and Discussion 61
(a) (b)
receding contact angles of the oxygen plasma-treated PET fabric. Therefore, the wettability
was evaluated by measuring water-absorption time that obtained from the time-dependent
contact angle measurements. This proved a much better diagnostic tool for a systematic
investigation of the wettability imparted to PET fabrics by operating under different
plasma conditions. Note that for the unmodified PET fabric the water droplet was not
absorbed at all but remained on the surface.
Figure 4.17a shows the variations of water-absorption time of water droplets (10 µl) on the
surface of PET fabrics with respect to the discharge power at treatment time of 15 s. It was
found that the water-absorption time decreased as the discharge power increased from 100
to 600 W. The water-absorption time measured immediately after the modification was
always lower than 0.1 s compared with more than 100 s for the unmodified PET fabric.
This suggested that the wetting behavior of the PET fabric was enhanced remarkably after
plasma treatment even with short treatment time 15 s and short discharge power 100 W. It
indicated the effectiveness of oxygen plasma to switch wetting behavior of PET fabric
surface from hydrophobic to hydrophilic. On the other hand, increasing the exposure time
from 15 to 30 s within the discharge plasma power range 100-600 W (Figure 4.17b),
exhibits comparable results regarding water-absorption time. The decrease of water-
absorption time can be attributed to the introduction of oxygen-containing polar groups
such as carboxylic acid groups. The existence of such group was shown in the
high-resolution C1s XPS spectrum (Figure 4.14b).
Figure 4.17 Contact angles of water droplets in dependence on resting time on the unmodified PET fabric and the oxygen plasma-treated PET fabric at different treatment power for 15 s (a) and ≤ 30 s (b). The error of each measurement is ± 2°.
0,01 0,1 1
0
20
40
60
80
100
120
140
Co
nta
ct a
ngl
e (
deg
)
Time (s)
Unmodified PET 100 W, 15 s 300 W, 15 s 600 W, 15 s
0,01 0,1 1
0
20
40
60
80
100
120
140
Co
nta
ct a
ng
le (
de
g)
Time (s)
Unmodified PET 100 W , 30 s 300 W , 30 s 600 W , 15 s 600 W, 30 s

Results and Discussion 62
Figure 4.18 illustrates the image sequence of a water droplet applied to the surface of
oxygen plasma-treated fabrics at 600 W for 15 s. As can be seen the droplet fully spreads
on the plasma-treated PET fabric surface within 0.025 s after being dropped on it
compared with the unmodified PET fabric.
4.2.1.5 Stability of the oxygen plasma-treated PET fabric
The plasma modified fabric at at 600 w, 15 s presenting a high [O]:[C] atomic ratio value
of 0.7 was chosen for the stability study. It was stored in the air under normal conditions of
temperature and humidity for different storage periods (1, 7 and 14 days). The stability of
the modified surfaces was tested with respect to XPS and the time-dependent contact
angle.
Figure 4.19 The [O]:[C] atomic ratio for oxygen plasma-treated (600 W for 15 s) PET fabric as function of the ageing time in air under ambient conditions.
-2 0 2 4 6 8 10 12 14 160,50
0,55
0,60
0,65
0,70
0,75
0,80
[Ο]:[
C]
Ageing time (days)
0.001 s 0.005 s 0.010 s 0.012 s 0.025 s
Figure 4.18 High-speed image sequences at different resting time for water droplet applying to
oxygen plasma-treated (600 W, 15 s) PET fabric.

Results and Discussion 63
In general, long storage time of the oxygen plasma-treated PET fabrics results in a weak
loss of oxygen-containing groups (Figure 4.19). Within 1 day after plasma treatment, the
[O]:[C] atomic ratio increases slightly from 0.7 to 0.75. Then, it decreases as a function of
storage time. The PET surface lost about 22 % of its overall oxygen functionalities after 1
week and the surface composition remains unchanged during the following week. The
modified PET fabric stored for 14 days keeps about 74 % more oxygen than the
unmodified PET fabric.
The observed increase in [O]:[C] atomic ratio from 0.7 to 0.75 after 1 day of ageing could
be explained as follow. During the plasma process, the PET fabric surface is continuously
bombarded by a number of particles, such as electrons, photons, and ions, which may lead
to the formation of free radicals (Figure 4.13). These free radicals were trapped at and
below the PET fabric surface during plasma treatments. After the samples were removed
from the plasma chamber and stored in the air, these long-live free radicals become
available to interact with atmospheric oxygen from the air. The existence of long-live
trapped free radicals was documented in the case of the plasma-treated polymers (201).
Trapped free radicals are considered one of special features in the plasma-polymerized
films, for instance, styrene plasma-polymerized films (202). Yasuda et al (203) have
reported on some stable radicals remain in the glass substrate as living radicals caused by
UV radiation from plasma treatments. Wakida et al (204) concluded that the free-radicals
intensity of the plasma-treated fibers, such as wool, silk and PET depend considerably on
the plasma characteristics and their chemical constitutions.
After a storage time of 1 week in the air, the [O]:[C] atomic ratio of the outermost surface
slightly decreased from value of 0.75 to 0.61. The minimization of the interfacial energy
and entropic effects are assumed the driving forces of the restructuring process.
The stability of the modified surface regarding wettability of PET fabric along time has
been investigated (Figure 4.20). It is evident that the initial contact angles were increased
at the beginning of the measurement accompanied with a slight increase of
water-absorption time. As mentioned above, the wetting results can be explained by the
findings of the XPS studies.

Results and Discussion 64
Figure 4.20 Effect of ageing times on the contact angles of water droplets in dependence on resting time on oxygen plasma-treated (600 W, 15 s) PET fabric surface. The error of each measurement is ± 2°.
4.2.1.6 Determination of the degree of the crystallinity by DSC
DSC technique was used to investigate the effect of low-pressure oxygen plasma on the
Tm, Tg (Figure 4.21a) and the degree of crystallinity (Figure 4.22b) of the unmodified PET
and different plasma-treated PET fabrics. Figure 4.21a shows the DSC thermograms of the
unmodified and different oxygen plasma-treated PET fabrics. It can be seen that the Tm for
different oxygen plasma-treated PET fabrics were nearly similar (250 °C) to the
unmodified PET fabric. The thermograms do not reveal any significant features that are
attributable to the surface modifications. Additionally, experiments reveal no reduction in
the glass transition temperature (Tg ≈ 80 °C) of the unmodified and different plasma-treated
PET fabrics. It is also found that, the oxygen plasma treatment with a treatment time up to
30 s at discharge power 600 W has no significant effect on the degree of bulk crystallinity
(Figure 4.21b). Thus, the obtained results confirm that oxygen plasma treatments do not
affect the bulk properties of the fibers.
0,01 0,10
20
40
60
80
100
120
140
Con
tact
an
gle
(d
eg)
Time (s)
Modified PET with 600 w , 15 s After 1 day After 7 days After 14 days

Results and Discussion 65
-80 -30 20 70 120 170 220 2700,0
0,2
0,4
0,6
(a)
Hea
t Flo
w (
W/g
)
Temperature (oC)
unmodified PET 100 W, 30 s 300 W, 30 s 600 W, 15 s 600 W, 30 s
endo
30
32
34
36
38
degr
ee o
f cry
stal
linity
(%
)
oxygen plasma pretreatment
(b)
unm
odi
fied
PE
T
100
W, 1
5 s
300
W, 1
5 s
600
W, 1
5 s
100
W, 3
0 s
300
W, 3
0 s
600
W, 3
0 s
Figure 4.21 DSC thermograms of the unmodified and oxygen plasma-treated PET fabrics from 2nd heating run (a), and the effect of plasma treatment conditions on percent of crystallinity for different PET fabrics (b).
To summarize the results of oxygen plasma treatments, it can be clearly seen that the XPS
spectroscopic and electrokinetic findings prove the presence of Brønsted acidic surface
groups. Such groups may play a significant role in adhesion promotion by increasing the
wettability of the PET fabric surface and providing the necessary functionalities for
interacting with subsequent coating layers of cationic polyelectrolytes. The optimum
conditions were achieved for the plasma power of 600 W and 15 s treatment time at which
no damage and saturation occurred. Subsequently, these parameters were used for the
further investigations.
4.2.2 Coating of oxygen plasma-treated PET fabric with cationic polyelectrolytes
In the next step, the cationic PELs such as PDADMAC or PVAm were coupled to oxygen
functionalities, which were introduced by oxygen plasma (600 W, 15 s) in the preliminary
step. The concentration of the aqueous polyelectrolyte solution during adsorption varies
between 0.01, 0.5, 1 and 3 wt. %.
PDADMAC contains a large number of quaternary ammonium groups. Nevertheless,
PDADMAC bears quaternized ammonium groups which are considered as inert and not
suitable for further chemical derivatization reactions. However, in some technical
applications quaternary ammonium groups are suited to improve strongly adhesion

Results and Discussion 66
properties of modified surfaces to anionic molecules such as anionic dyes (205) or used as
flocculant in water treatment plants (111).
In comparison with PDADMAC, PVAm is a potential polyelectrolyte candidate for many
applications. Depending on the pH of the aqueous solution, the primary amino groups of
PVAm can be partly protonated (−NH3+) or they can be present as charge-neutral amines
(−NH2). In this context, PVAm can be considered as a weak cationic polyelectrolyte. After
loading PVAm on PET, a large number of the reactive primary amino groups remain
available for many subsequent chemical functionalization reactions (131; 132). Besides the
positive contribution of the entropy, the electrostatic interactions between the negatively
charged of oxygen plasma-treated PET fabric surface and the positively charged
polyelectrolytes support the adhesion between the PET and the cationic polyelectrolytes.
4.2.2.1 XPS characterization
The changes in the chemical structure of the different modified PET fabric surfaces were
investigated using the XPS. Figure 4.22 compares XPS wide-scan spectra of the
unmodified PET (a), oxygen plasma-treated PET (b) and PDADMAC-treated PET (c) or
PVAm-treated PET(d) fabrics.
From comparing of the XPS wide-scan spectra, the adsorbed polyelectrolyte can be easily
identified by the N 1s peak appeared on the PET fabric modified with PDADMAC and
PVAm showing the existence of nitrogen on the PET fabric surface. In the case of
PDADMAC the nitrogen originates from the quaternary ammonium groups of
PDADMAC. While, N 1s peak originates from the amino and residual formamide groups
of PVAm. On the other hand, the spectrum of the unmodified (Figure 4.22a) and oxygen
plasma-treated PET fabrics (Figure 4.22b) showed no traces of nitrogen. This can be
considered as an indication of a successful formation of a PDADMAC or PVAm layer
covering the PET fabric surface.

Results and Discussion 67
1 0 0 0 8 0 0 6 0 0 40 0 2 0 0 0B in d in g e n e rgy [eV ]
O 1s
O KLL Si 2sSi 2p
O 2s
C 1s
Na 1s Na KLLN 1s
Cl 2sCl 2p
O 1s C 1s
O KLL
Si 2sSi 2p
O 2s
N 1s Cl 2sCl 2p
(a)
(b)
(c)
(d)
Table 4.3 shows the elemental surface composition and the corresponding atomic ratios of
different modified PET fabric surfaces determined by the XPS. After the deposition of
PDADMAC or PVAm onto the oxygen plasma-treated PET fabric surface, regardless the
polyelectrolytes concentration, the carbon content as well as nitrogen content increases.
Meanwhile the relative oxygen content decreases in the surface region. The [N]:[C] atomic
ratio is considered as an accurate measure of the amount of deposited polyelectrolyte. In
the case of PDADMAC, it was found that the [N]:[C] atomic ratio increases from 0.03
obtained with 0.1 wt. % to 0.05 obtained with 3 wt. % of PDADMAC solution. Likewise,
for the PVAm the [N]:[C] atomic ratio increases from 0.06 obtained with 0.1 wt. % to 0.1
obtained with 3 wt. % of PVAm solution.
Figure 4.22 Wide-scan XPS spectra of the unmodified PET fabric (a), oxygen plasma-treated (600
W, 15 s) (b), PDADMAC-treated PET obtained with CPDADMAC = 3 wt. % (c) and PVAm-treated PET obtained with CPVAm= 3 wt. % (d). The intensity of all spectra were related to the O 1s peak.

Results and Discussion 68
On the other hand, the [O]:[C] atomic ratio decreased from 0.7 to 0.31 when the oxygen
plasma-treated PET fabric was treated by 3 wt. % of the PDADMAC solution. Similarly,
treating the oxygen plasma-treated PET fabric surface with 3 wt. % PVAm solution
decreases the [O]:[C] atomic ratio from 0.7 to 0.27. This indicates that, carboxylic acid
groups or their dissociated forms are widely covered by the applied polymers. Therefore,
they play a significant role in the adhesion promotion of PDADMAC and PVAm onto the
PET fabric surface.
The N 1s peak appears only from the polyelectrolyte layer. Therefore, the [N]:[C] atomic
ratio is considered an accurate measure of the adsorbed polyelectrolytes amount.
According to Table 4.3, the PET fabric modified by the PVAm revealed significantly
higher [N]:[C] atomic ratio values in comparison to the PET fabric modified by
PDADMAC. This is associated with a strong electrostatic repulsion between positively
charged quaternary ammonium groups in PDADMAC chains. The electrostatic repulsion
makes PDADMAC chains stiff and stretched, and consequently, hampering the adsorption
of PDADMAC onto the PET fabric surface. Moreover, Cl counterion may shield the
interaction between the PDADMAC chains and carboxylate groups on the oxygen
plasma-treated PET fabric (Figure 4.23). In addition, it contributes to decrease the
Table 4.3 The elemental surface composition and elemental ratios determined by XPS for the unmodified, oxygen plasma-, PDADMAC- and PVAm- modified PET fabrics.
Modification conditions C (at. %) O (at. %) N (at. %) [N]:[C] [O]:[C]
Unmodified PET fabric 72.1 25.6 0 0 0.35
Oxygen plasma-treated PET 56.6 39.9 0 0 0.7
0.1 wt. % PDADMAC 65.4 29.6 2.0 0.03 0.45
0.5 wt. % PDADMAC 66.1 28.3 2.3 0.035 0.43
1 wt. % PDADMAC 67.7 26.0 3.1 0.046 0.38
3wt. % PDADMAC 69.9 21.6 3.7 0.053 0.31
0.1 wt. % PVAm 71.5 22.6 4.6 0.06 0.32
0.5 wt. % PVAm 72.9 20.8 5.5 0.07 0.28
1 wt. % PVAm 72.2 20.2 6.7 0.09 0.28
3wt. % PVAm 72.3 19.4 7.4 0.1 0.27

Results and Discussion 69
120 °C
PVAm
H2N
H3NH3
HN
H2N
HN
O O
HOO
HOO
adsorbed amount of PDADMAC (206; 207). As a result, during washing of
PDADMAC/PET fabric, all weakly bounded macromolecules were removed from the PET
fabric surface, while the strong-deposited PDADMAC remained onto the surface.
Figure 4.23 Schematic representation of counter-ion effect on the adsorption of PDADMAC at the
oxygen plasma-treated PET fabric.
In contrast to the PDADMAC, the PVAm copolymer with a degree of hydrolysis higher
than 90 % contains, in excess, non-protonated amino groups at working pH 8. Hence, the
PVAm macromolecules seem to be more flexible and, therefore, a higher amount of
PVAm was adsorbed onto the PET fabric surface.
Besides the electrostatic interaction between PVAm layer and the oxygen plasma-treated
PET fabric surface, the electron pair transfer from the n-electrons of the amino groups to
the conjugated π-electron in phenyl ring in the PET also contributes to the stability of the
adsorbed PVAm layer. Moreover, the PVAm layer has been stabilized by a subsequent
thermal treatment. Where the amide groups have been formed between the primary amino
groups of the PVAm, and the carboxylic groups introduced onto the PET fabric surface by
oxygen plasma (Figure 4.24). The formation of the amide groups is supported by
ATR-FTIR analysis, which will be discussed later.
Figure 4.24 Schematic representation of heat-induced cross-linking reaction.
O O
N N N
Cl Cl

Results and Discussion 70
In comparison with the oxygen plasma-treated PET fabric surface (Figure 4.25b), the
high-resolution C 1s XPS spectra of PDADMAC-treated PET (Figure 4.25c) and
PVAm-treated PET fabrics (Figure 4.25d) contain an additional component peak G at
286.3 eV. It arises from C–N+ and C-N bonds showing the presence of PDADMAC and
PVAm, respectively.
Figure 4.25 High-resolution C 1s XPS spectra of the unmodified PET fabric (a), the oxygen plasma-treated (600 W, 15 s) PET fabric (b), PDADMAC-treated PET fabric obtained with CPDADMAC = 3 wt. % (c), and PVAm-treated PET fabric obtained with CPVAm = 3 wt. %.
Generally, in high-resolution N 1s XPS spectra, nitrogen bound to carbon in primary,
secondary or tertiary amines or amides typically occurs at BE values of 399–400 eV.
Whereas, cationic quaternary ammonium and protonated amino groups nitrogen species
are significantly shifted to a higher BE values of 401.5–402.5 eV. The high-resolution N 1s
XPS spectrum of the PDADMAC-treated PET fabric (Figure 4.26a) was decomposed into
two component peaks. This indicates the presence of both “uncharged” N–C (component
peak L) and “charged” quaternary nitrogen C–N+ (component peak M) species. It is known
that PDADMAC has fully quaternized nitrogen atoms, and does not contain uncharged
primary, secondary or tertiary amines. The existence of this uncharged nitrogen in the
Si
A
28 0
300 290 280285295Binding energy [eV]
CDEShake-up
S i
A
2 8 0
3 0 0 2 9 0 2 8 02 8 52 9 5B in d in g e n e r g y [ e V ]
CDE
S h a k e -u p
B
F
S i
A
2 8 0
300 290 280285295B inding energy [eV ]
E GB
D
CShake-up
2 8 0
3 0 0 2 9 0 2 8 02 8 52 9 5B in d in g e n e r g y [ e V ]
CD
E
S h a k e - u p G
A
(a) (b)
(c) (d)

Results and Discussion 71
commercial product may be attributed to the small impurities or possibly due to the
undesired free-radical side-reactions occurring during the cyclopolymerisation. These
uncharged nitrogen species may be part of the polymer backbone or distinct uncharged
moieties (208).
Figure 4.26 High-resolution N 1s XPS spectrum of PDADMAC-treated PET fabric obtained with CPDADMAC = 3 wt. % (a), and PVAm-treated PET fabric obtained with CPVAm = 3 wt.% (b).
The high-resolution N 1s spectrum of the PVAm-treated PET (Figure 4.26b) was
decomposed also into two component peaks (M and L). The amino groups of the PVAm
polymer can be protonated by hydronium ions. Figure 4.26b shows such protonated amino
groups (component peak M), clearly separated from the non-protonated amino groups
(component peak L). Nitrogen involved in the amide groups contributes to component
peak L. The ratio of the two component peak areas [M]:[L] can be considered as the
protonation-deprotonation equilibrium of the amine-functionalized surface (131; 132).
4.2.2.2 ATR-FTIR spectroscopy
The ATR-FTIR spectra of the PVAm-treated PET fabric before and after the thermal
treatment at 120 °C were compared. As well as the unmodified and the oxygen
plasma-treated PET fabrics were obtained to follow the changes in the functional groups
after each modification step (Figure 4.27).
It was found that, the IR spectrum of the plasma-treated PET did not show remarkable
changes when compared to the unmodified PET fabric. Although, the XPS and streaming
potential measurements revealed the introduction of new oxygen functionalities onto PET
fabric surface by oxygen plasma treatment.
(b)L
M
280
400 395405
A
Binding energy [eV]390410
(a)
Binding energy [eV]410 400 390395405
L
M

Results and Discussion 72
Figure 4.27 ATR-FTIR spectra of the unmodified PET fabric (a), the oxygen plasma-treated (600 W and 15 s) PET fabric (b), PVAm-treated PET before (c) and after heat treatment at 120 °C (d). The spectra have been shifted vertically for clarity.
This can be ascribed to the surface chemical changes resulting from plasma treatment are
confined to a very thin surface layer. Hence, the local concentration of the formed oxygen
functionalities in this surface layer is not high enough to be sensed by ATR-FTIR
spectroscopy. In Figure 4.27, ATR-FTIR spectra of the PET samples modified with
3 wt. % of PVAm before (Figure 4.27c) and after (Figure 4.27d) thermal treatment on the
PET fabric surface are given. Before thermal treatment, the formed layer is confirmed by
the complete disappearance of the characteristic absorption bands at 1715 cm–1 (υ(C=O))
and 1245 cm–1 (stretching υ(C–O)) of the ester groups of PET, since the PET fabric is
covered by PVAm. Therefore, new characteristic absorption bands at 1670 cm-1 (amide I,
mainly υ (C=O) stretching) and 1580 cm-1 (amide II, mainly υ (NH) bending) were formed
indicating the formation of amide groups onto the PET fabric surface. After thermal
treatment (Figure 4.27d), it is obvious that the intensity of both absorption bands at 1670
and 1580 cm-1 have increased in comparison to sample before thermal treatment.
4.2.2.3 Electrokinetic measurements
Streaming potential measurements are very sensitive to analyze charge formation processes
on solid surfaces. With increasing the pH value of an ambient aqueous solution, the
1800 1700 1600 1500 1400 1300 1200
Abs
orb
ance
Un
its
Wavenumber (cm-1)
a: Unmodified PET
b: A+ oxgen plasma pretreatment
c: B+ 3wt.% PVAm
d: B+ 3 wt.% PVAm @120oC

Results and Discussion 73
carboxylic groups existing on the solid surface progressively undergo dissociation
reactions. The formed carboxylate groups (O=C–O) are negatively charged and contribute
to the net surface charge. The adsorption of polyelectrolytes at the charged surface is used
frequently for charge reversal (209; 210). The changes induced by coating of the PET fabric
surface with PDADMAC or PVAm can be characterized by electrokinetic measurements.
The coating of plasma modified-PET fabric with different concentrations (0.1, 0.5, 1 and 3
wt. %.) of PDADMAC aqueous solution was investigated (Figure 4.28).
Figure 4.28 ζ-pH dependence for the unmodified PET fabric, the oxygen plasma- modified (600 W, 15s) PET fabric and PDADMAC-treated PET fabrics obtained with different concentrations of PDADMAC.
The effects of oxygen plasma treatments of PET fabric on the IEP values have already
been discussed. After coating plasma-treated PET fabric surface with PDADMAC, a
positively charged surface was observed over the pH-range changed in dependence of the
concentration of the PDADMAC solutions. As a result, the IEP values display a significant
shift towards higher pH values as the concentration of PDADMAC increases. For example,
the adsorption from a lower concentrated PDADMAC solution (CPDADMAC = 0.1 wt. %) is
characterized by IEP value that was significantly shifted from about 2.6 in the case of
oxygen plasma-treated PET to about 7.5 in the case of PDADMAC-treated PET fabric.
With increasing concentration of PDADMAC, the IEP values gradually shift to higher
3 4 5 6 7 8 9 10 11-60
-50
-40
-30
-20
-10
0
10
20
30
40
50
60
ζ (m
V)
pH
600 W, 15s Unmodified PET 0.1 wt.% 0.5 wt.% 1 wt.% 3 wt.%

Results and Discussion 74
values up to pH 10.8 (CPDADMAC = 3 wt. %), approximately. The curve shapes clearly show
the presence of plateau origins from the positive charged quaternary ammonium groups at
high concentration of the PDADMAC. The shift of IEP values can be considered as the
formation of more closed and dense PDADMAC layer on the fabric surface, shielding
charges of the oxygen plasma modified-PET fabric surface.
Similarly, after adsorption of PVAm from different aqueous solution (0.1, 0.5, 1 and 3 wt.
%.) lead to different IEP values (Figure 4.29). The adsorption from a lower concentrated
PVAm solution (CPVAm= 0.1 wt. %) is characterized by IEP value which is significantly
shifted from about 2.6 in the case of oxygen plasma-treated PET to about 8 in the case of
PVAm-treated PET. The adsorption from higher concentrated PVAm solution (CPVAm =
0.5 wt. %) increases the shift of the IEP value to the pH 8.5. With increasing concentration
of PVAm solution the IEP gradually shifts towards higher value pH 9.3 (CPVAm = 3 wt. %).
Figure 4.29 ζ-pH dependence for the unmodified PET fabric, the oxygen plasma-treated (600 W, 15s) PET fabric and PVAm-treated PET fabrics obtained with different concentrations of PVAm.
This behavior is resulted from the existence of potential amine groups on the outermost
surface of the modified PET after the adsorption of PVAm. In the pH range < IEP, all
amino groups that able to be positively charged are protonated. With increasing OH–
3 4 5 6 7 8 9 10 11-60
-50
-40
-30
-20
-10
0
10
20
30
40
50
ζ (m
V)
pH
600 W, 15s Unmodified PET 0.1 wt.% 0.5 wt.% 1 wt.% 3 wt.%

Results and Discussion 75
concentration, the protonated amines were gradually deprotonated in the aqueous solution,
consequently, the zeta-potential values decreased. This confirmed that only hydronium and
hydroxyl ions determine the surface potential, and indicate that the PVAm is covering the
PET fabric.
Moreover, the streaming potential measurements demonstrated that the formed PVAm or
PDADMAC layers onto the oxygen plasma-treated PET fabric surface were able to resist
the strong shear forces during the measurement. In the electrokinetic experiment, the
streaming liquid with a pressure of 250 mbar, in a maximum, causes a considerable
mechanical shear stress on the coated solid surface. Accordingly, if the formed
polyelectrolyte layers are removed during measurements, then either the IEP will be
shifted to a lower pH value, or the ζ = ζ(pH) functions seem to be discontinuous. Indeed,
these two assumptions have not occurred. This is an excellent proof for the mechanical
stability of the polyelectrolyte layers built-up on the plasma-treated surfaces.
The results obtained by electrokinetic investigation were in a good agreement with the
XPS. The increase of PDADMAC or PVAm concentration leads to a significant increase
of the measured [N]:[C] atomic ratio (Table 4.3) as well as shifts the IEP values of
polyelectrolyte modified PET fabric to higher pH values. It is worth mentioning that, the
results of PVAm adsorption show chemically defined PET fabric surface decorated with
amino groups in comparison with ammonia plasma treatment.
4.2.2.4 Surface morphology
The SEM images of different modified PET fabric surfaces were given in Figure 4.30, to
follow the morphological changes after each modification step. The SEM images of the
surfaces were measured at a magnification of 30000X. Figures 4.30a and b illustrate the
surface of the unmodified PET fabric and the plasma-treated PET, respectively. The
surfaces are relatively smooth with some contaminants especially in Figure 4.30b.
Moreover, these SEM images do not reveal significant differences between them,
indicating that there was no etching occurred to the fabric surface after oxygen plasma
treatment.

Results and Discussion 76
Figure 4.30 SEM images of the unmodified PET fabric (a), oxygen plasma-treated (600 W, 15s) PET fabric (b), PDADMAC-treated PET fabric obtained with a CPDADMAC = 3 wt. % after rinsing (c), and PVAm-treated PET obtained with a CPVAm= 3 wt. % after rinsing (d).
After coating the oxygen plasma-treated PET fabric surface with different cationic
polyelectrolytes, it can be seen that polyelectrolytes adhered to PET fabric surface. In the
case of PDADMAC, the surface is not fully covered by a layer but by separated islands
(Figure 4.30c). The SEM image in Figure 4.30d shows a uniform coating of PVAm layer
on the surface of the PET fabric.
4.2.2.5 Kinetics measurements of wetting
It was found that a water droplet placed on the polyelectrolyte modified PET fabric surface
was absorbed within a few seconds, and it was not possible to measure the contact angle of
the coated PET. The degree of wettability was evaluated by measuring the
water-absorption time. As already explained for the unmodified PET fabric, the water
droplet was not absorbed at all but remained on the surface within the investigated time
range. In the case of the polyelectrolyte-treated PET fabric surface, there are excess of
polar groups on the outermost PET fabric surface, which are still not interacted with the
(a) (b)
(c) (d)

Results and Discussion 77
opposite charges on the oxygen plasma-treated PET fabric. This excess of polar groups
improves the wettability of polyelectrolyte-treated surfaces (Figure 4.31). Moreover,
Figure 4.31 compares the water-absorption time of the unmodified PET and different
modified PET fabrics.
It was found that, the water-absorption time decreases in the order: unmodified PET >
PDADMAC-treated PET > PVAm-treated PET > oxygen plasma-treated PET fabrics. This
suggests that the adsorption of the polyelectrolytes has a slight effect and decreases the
surface wettability of the plasma modified-PET fabric surface.
Figure 4.31 Contact angles of water droplets in dependence on resting time on the unmodified PET fabric, oxygen plasma-treated (600 W, 15 s) PET and plasma modified-PET coated with PDADMAC and PVAm obtained with 3 wt. % of polyelectrolyte. The error of each measurement is ± 2°.
The decrease in the water-absorption time after polyelectrolyte adsorption on the plasma
modified-PET fabric surface might be explained by the fact that, the absorption of water by
a textile is largely determined mainly by two parameters. The first one is the surface free
energy of the fiber material, and the second one is the capillary effects of the yarn and the
fabric (193). A coating covering the PET fabric surface can influence the absorption in
several ways. The coating can act as a barrier, preventing a direct contact of the liquid with
the fibers, stopping or at least decelerating the absorption by the fiber material. The coating
0,01 0,1 1 10 100 1000
0
20
40
60
80
100
120
140
Unmodified PET Oxygen plasma-modified PET PDADMAC-modified PET PVAm-modified PET
Con
tact
ang
le (
deg)
Time (s)

Results and Discussion 78
can also influence the capillary forces by blocking pores; therefore, it changes the
wettability of the fabric.
In conclusion, the surface modification of PET fabric by the attachment of cationic
polyelectrolytes onto PET fabric surface provides a simple means to modify PET fabric
and makes it wettable. The anchoring polyelectrolyte layer can also serve as binding sites
for desirable attachment of other functional molecules, which are able to strongly complex
with the introduced amine functionalities. In particular, Section 4.3 demonstrates the
interaction of different modified PET fabrics towards various classes of the anionic dyes,
in order to evaluate the effectiveness of different surface modifications.

Results and Discussion 79
HO
SO3Na
NN
NaSO3
NaO3SO
O
NH
NH
CH3
CH3
SO3Na
SO3Na
H3C
H3C
4.3 Surface activity of modified PET fabrics towards anionic dyes
Coloration of PET fabrics with anionic dyes, namely acid and reactive dyes, is generally
impossible. This is attributed to, the fact that, the unmodified PET does not contain amine
groups in their structure needed for the dye/fiber reaction mechanism. Therefore, the
efficiency of different surface modifications have been compared in terms of K/S
absorption spectra and fastness test obtained from the printing experiments with different
classes of anionic dyes.
4.3.1 Anionic acid dyes
In order to evaluate the activity of different modified PET fabrics towards anionic acid
dyes, four different sets of PET fabrics: unmodified PET, ammonia plasma-treated PET,
PDADMAC-treated PET and PVAm-treated PET were independently printed with two
different acid dyes. Which are C.I. Acid Red 18 and C.I. Acid Blue 80 dyes the structure of
the two dyes are shown in Figure 4.32.
C.I. Acid Red 18 C.I. Acid Blue 80
Figure 4.32 Chemical structures of the anionic acid dyes used in this work as an example for PET fabrics coloration.
Figure 4.33 shows several K/S absorption spectrum in the visible region of C.I. Acid Red
18 or C.I. Acid Blue 80 dyes after application on different modified PET fabric. The K/S
absorption spectra of different modified PET fabrics were compared to the unmodified
PET fabric. The results displayed that the ammonia plasma treatments, (Figures 4.33a-b),
had no positive effect on the fixation of neither of C.I. Acid Red 18 nor C.I. Acid Blue 80
molecules, regardless of the ammonia plasma treatment time.

Results and Discussion 80
450 500 550 600 650 7000,0
0,1
0,2
0,3
0,4
0,5
0,6
0,7
0,8
0,9
1,0
K
/S
Wavelength (nm)
Unmodified PET 10 s 30 s 60 s 120 s 600 s
450 500 550 600 650 7000,0
0,1
0,2
0,3
0,4
0,5
0,6
0,7
0,8
0,9
1,0
K/S
Wavelength (nm)
Unmodified PET 10 s 30 s 60 s 120 s 600 s
450 500 550 600 650 7000,0
0,2
0,4
0,6
0,8
1,0
K/S
Wavelength (nm)
Unmodified PET 0.1 wt. % 0.5 wt. % 1 wt. % 3 wt. %
450 500 550 600 650 7000,0
0,1
0,2
0,3
0,4
0,5
0,6
0,7
0,8
0,9
1,0
K/S
Wavelength (nm)
Unmodified PET 0.1 wt. % 0.5 wt. % 1 wt. % 3 wt. %
450 500 550 600 650 7000,0
0,2
0,4
0,6
0,8
1,0
1,2
1,4
1,6
1,8
2,0
K/S
Wavelength (nm)
Unmodified PET 0.1 wt. % 0.5 wt. % 1 wt. % 3 wt. %
450 500 550 600 650 7000,0
0,2
0,4
0,6
0,8
1,0
1,2
1,4
1,6
1,8
2,0
K/S
Wavelength (nm)
Unmodified PET 0.1 wt. % 0.5 wt. % 1 wt. % 3 wt. %
Figure 4.33 K/S absorption spectra of different PET fabrics printed with C.I. Acid Red 18 after ammonia plasma treatment (a), PDADMAC coating (c), PVAm coating (e), and printed with C.I. Acid Blue 80 after ammonia plasma treatment (b), PDADMAC coating (d) PVAm coating (f).
(a) (b)
(e) (f)
(c) (d)

Results and Discussion 81
Since the negatively charged dye anions exhibit electrostatic attraction towards the
positively charged groups, such as protonated amine (Figure 4.34). Therefore, it may be
postulated that the surface functional groups introduced by ammonia plasma treatment are
insufficient and not effective in fixing dye molecules on the PET fabric surface. The most
plausible explanation based on the XPS results (Figure 4.4). The ammonia plasma
treatment introduces a great variety of different nitrogen-containing functional groups
rather than amine groups, which are needed as anchoring sites for the binding between the
PET fabric surface and anionic dyes.
In contrast to the ammonia plasma-treated PET fabric, it was found that the printed
PDADMAC-treated PET (Figures 4.33c-d) and PVAm-treated PET fabrics (Figure 4.33e-
f) exhibited K/Smax values remarkably higher than the unmodified PET fabric. The results
indicated that K/Smax values depend on the amount of accessible functional groups within
the surface, which can chemically bind acid dye molecules. Therefore, The K/Smax values
increases gradually with increasing the concentration of polyelectrolyte solution from 0.1
to 3 wt. %. Moreover, when the polyelectrolyte-anchoring layer on the PET fabric is in
contact with water of anionic dye printing pastes, it swells and dye molecules become
embedded in this layer. As a result, good fixation of the dye molecules is achieved. This
explanation is supported by the dependence of K/S max values on the adsorbed amount of
polyelectrolyte as shown in the Figure 4.33. The modified PET fabric surfaces with
3 wt. % polyelectrolyte solution has the highest K/Smax among all fabric samples. The
extent of improvement in K/Smax values reflects the positive impacts of these modification
approaches.
Figure 4.34 The binding mechanism of acid dye with modified PET fabric surface.
PET NH2 PET NH3
i) Protonation and cation formation
ii) Dissociation of dye molecules
Dye SO3Na Dye SO3 Na
iii) Fiber/Dye bonding
PET NH3 Dye SO3 PET NH3 O3S Dye

Results and Discussion 82
It is clearly seen from Figure 4.33 that, the PVAm-treated PET fabric exhibited K/Smax
values significantly higher than the PDADMAC-treated PET fabric for C.I. Acid Red 18
(Figure 4.33c,e) and C.I. Acid Blue 80 (Figure 4.33d,f). For instance, the K/Smax value was
1.8 for PVAm-treated PET printed with C.I. Acid Red 18 compared to 0.9 in the case of
PDADMAC-treated PET fabric obtained with 3 wt. % polyelectrolyte concentration. In
other words, the PDADMAC-treated PET fabric may have a lower accessibility of acid
dyes compared with PVAm-treated PET fabric. The variation between PDADMAC and
PVAm comes from the strong interactions of PDADMAC toward its Cl counter ions and
consequently forms weaker complexes with anionic sulphonic acid groups in dye structure.
This can be also attributed to, as discussed before, the adsorbed amount of PVAm is higher
than the adsorbed amount of PDADMAC. Then, PVAm layer provides more anchoring
sites for anionic dye molecules.
It is important to note that the coloration of PET fabric becomes dependent on the
properties of the top layer rather than its chemical structure. Accordingly, it can be
concluded that creating a tailor-made surface with PVAm or PDADMAC layer improve
the coloration of PET fabric toward anionic acid dyes without changes in the bulk
properties.
4.3.2 Anionic reactive dyes
As a part, of continuing interest in exploring the viability of the plasma-based modified
PET fabric surface toward anionic dyes. The amino groups are studied to immobilize
anionic reactive dyes onto ammonia plasma-treated PET or PVAm-treated PET fabrics via
covalent bonds. This class of dyes is commonly used for cellulosic substrates coloration.
Figure 4.36 shows the K/S absorption spectrum of three sets of PET fabrics: the
unmodified PET, ammonia plasma-treated PET and PVAm-treated PET fabrics printed
with two types of anionic reactive dyes. C.I. Reactive violet 2 and C.I. Reactive Blue 5 are
typical MCT dyes as well as C.I. Reactive Violet 5 and C.I. Reactive Black 5 dyes are
typical VS dye (Figure 4.35).

Results and Discussion 83
Cu
HN
N
N
N
R
Cl
NN
NaO3SNaO3S
O O
N
H
SO3H
N
H
N
N
N
Cl
HN
SO3H
O
O
NH2
SO3H
R= (C6H5O– and – NH2)
C.I. Reactive Violet 2 C.I. Reactive Blue 5
C.I. Reactive Violet 5
C.I. Reactive Black 5
Figure 4.35 Chemical structures of anionic reactive dyes used in this work to color ammonia plasma-treated and polyelectrolyte-modified PET fabrics. Dyes C.I. Reactive Violet 2 and C.I. Reactive Blue 5 are typical MCT dyes, while C.I. Reactive Violet 5 and C.I. Reactive Black 5 are VS dyes.
The results obtained with anionic reactive dyes reveal a behavior similar to anionic acid
dyes (Figure 4.33). As shown in Figure 4.36, irrespective of the used dye structure, K/Smax
values are always noticed higher for prints obtained using PVAm-treated PET fabrics as
compared to unmodified and ammonia plasma-treated PET fabric.
NH2
N N S
O
O
CH2 CH2 O S
O
O
ONa
SO3Na
NNS
O
O
CH2CH2OS
O
O
O
OH
NaO3S
Na
OHS
O
O
OS
O
O
O
HN
O
OH
SO3NaNaO3S
NN
Na

Results and Discussion 84
450 500 550 600 650 7000,0
0,2
0,4
0,6
0,8
1,0
1,2
1,4
1,6
1,8
2,0
K/S
Wavelength (nm)
Unmodified PET 0.1 wt. % 0.5 wt. % 1 wt. % 3 wt. %
450 500 550 600 650 7000,0
0,2
0,4
0,6
0,8
1,0
1,2
1,4
1,6
1,8
2,0
2,2
2,4
2,6
2,8
3,0
K/S
Wavelength (nm)
Unmodified PET 0.1 wt. % 0.5 wt. % 1 wt. % 3 wt. %
450 500 550 600 650 7000,0
0,2
0,4
0,6
0,8
1,0
1,2
1,4
1,6
1,8
K/S
Wavelength (nm)
Unmodified PET 0.1 wt. % 0.5 wt. % 1 wt. % 3 wt. %
450 500 550 600 650 7000,0
0,2
0,4
0,6
0,8
1,0
1,2
1,4
1,6
1,8
2,0
2,2
K/S
Wavelength (nm)
Unmodified PET 0.1 wt. % 0.5 wt. % 1 wt. % 3 wt. %
450 500 550 600 650 7000,0
0,2
0,4
0,6
0,8
1,0
1,2
1,4
1,6
1,8
2,0
K/S
Wavelength (nm)
Unmodified PET 10 s 30 s 60 s 120 s 600 s
450 500 550 600 650 7000,0
0,2
0,4
0,6
0,8
1,0
1,2
1,4
1,6
1,8
K/S
Wavelength (nm)
Unmodified PET 10 s 30 s 60 s 120 s 600 s
(a) (b)
(c) (d)
(e) (f)
Figure 4.36 K/S absorption spectra of ammonia plasma-treated PET fabric printed with C.I.
Reactive Blue 5 (a) and with C.I. Reactive Violet 2 (b). K/S absorption spectra of PVAm-treated PET printed with C.I. Reactive Blue 5 (c), C.I. Reactive Violet 2 (d), C.I. Reactive Violet 5 (e) and C.I. Reactive Black 5 (f).

Results and Discussion 85
NH2 NH2 NH2
MCT dye Cl
NH2 NH2 NH2
MCT dye Cl
NH2 NH2 NH2
VS dye SO2 CH CH2
NH2 NH2 NH2
VS dye SO2 CH CH2
H
Additionally, it is clearly seen in Figure 4.36 that the K/Smax values of the printed fabrics
increase with increasing concentration of PVAm solution from 0.1 to 3 wt. %. For
instance, the K/Smax value of about 2 was obtained by 3 wt. % compared to about 0.6 for
0.1 wt. % PVAm-treated PET printed with C.I. Reactive Violet 5. This could be attributed
to the relatively higher primary amino groups, which in turn brings a significant increase in
the dye binding sites.
Different binding mechanisms govern the fixation of different anionic reactive dye systems
according to the scheme shown in (Figure 4.37).
Figure 4.37 Schematic representation of the binding mechanism of (a) MCT dyes and (b) VS dyes
with modified PET fabric surfaces containing –NH2 groups.
Coloration with reactive dyes differs from all other applications of water-soluble dyes
insofar as the final goal is to achieve a dye/fiber covalent bond. The covalent bonds are
usually formed as depicted in Figure 4.37, where amino groups representing the fiber
nucleophiles are involved in nucleophilic substitution (Figure 4.37a) or addition reactions
(Figure 4.37b). In nucleophilic substitution reactions a leaving group in the reactive dye
systems basing on halogenated nitrogen heterocyclic, is displaced as a result of an
interaction with a nucleophilic group such as,–NH2, on the modified PET fabric surface
under alkaline conditions.
The second pivotal dye/fiber reaction includes nucleophilic addition reaction involving an
activated double bond. The sulphatoethylsulphone group of C.I. Reactive Violet 5 and C.I.
Reactive black 5 is readily β-eliminated under alkaline conditions to produce an activated
(a) (b)

Results and Discussion 86
VS group. The schematic representation of the reaction of VS group with the amino groups
present on the modified PET fabric surfaces shown in Figure 4.37b.
Table 4.4 gives the λmax values of the investigated dyes in aqueous solution and for the
dye/polycation pairs on PET fabric surface. It was observed that the λmax values of the dyes
on polyelectrolyte-modified PET fabric shift to longer wavelengths. In the published
literature (211), the previously reported results explained the new absorption spectra of the
anionic acid dye/cationic polyelectrolyte pairs by the intermolecular interaction of the
cationic sites on polyelectrolytes with the anionic sulfonate groups (-SO3¯ ) of anionic dye
molecules. In addition, there have been many other reports concerning bathochromic
spectral shifts, which depend on the aggregation and adsorption state of dyes on the
external surface or embedded in a polyelectrolyte layer (212-214). Besides the aggregations,
the red shift of anionic acid dye/PVAm pairs can be explained in terms of a large number
of primary amino groups involved in electron pair donor-acceptor interaction with
π-system (215) in C.I. Acid Red 18 and C.I. Acid Blue 80.
The observed red shift of reactive dyes on PVAm-treated PET fabric is invoked as
evidence for the intermolecular interaction between the reactive dyes and primary amino
groups on PVAm-treated PET fabric surface. That interaction resulted in an increase in the
electron density on the dye chromphore.
Table 4.4 UV/Vis absorption maxima λmax of anionic dyes in aqueous solution and on modified PET fabrics with different cationic polyelectrolytes.
Dye used λmax in H2O
[nm]
λmax of the dye/PDADMAC pairs on PET fabric
[nm]
λmax of the dye/PVAm pairs on PET fabric
[nm] C.I. Acid Red 18 507 512 511
C.I. Acid Blue 80 581, 625 587, 640 587, 640
C.I. Reactive violet 2 551 Not applied 580
C.I. Reactive Blue 5 600 Not applied 630
C.I. Reactive violet 5 560 Not applied 580
C.I. Reactive Black 5 597 Not applied 610

Results and Discussion 87
4.3.3 Fastness properties of colored PET fabrics
The permanency of the bond between the dye molecules and the surface of different
modified PET fabrics can be investigated by the fastness tests of printed PET fabrics.
Table 4.5 depicts the color fastness results to washing and rubbing of printed
polyelectrolyte-modified PET fabrics using C.I. Acid Red 18 and C.I. Acid Blue 80. The
fastness properties were visually assessed using standard gray scale (175; 176). The color
fastness ratings for the unmodified and ammonia plasma-treated PET fabrics are not given
since there is no affinity between the used dyes and PET surfaces. The gray scale ranges
from 5, for no shade change, to 1, for a severe shade change with half points (between 4
and 5, 3 and 4, 2 and 3, 1 and 2) in between.
Table 4.5 Color fastness properties of different modified PET fabrics printed with C.I. Acid Red 18 and C.I. Acid Blue 80.
Pol
yele
ctro
lyte
Polyelectrolyte
con. (wt. %)
C.I. Acid Red 18 C.I. Acid Blue 80
Washing
fastness
Rubbing
fastness
Washing
fastness
Rubbing
fastness
Alteration Dry Wet Alteration Dry Wet
PD
AD
MA
C 0.1 2 2-3 2 2 2-3 2
0.5 2 2-3 2 2 2-3 2
1 2-3 2-3 2 2-3 2-3 2
3 2-3 3 2 2-3 3 2-3
PV
Am
0.1 2-3 2-3 2 2-3 2-3 2
0.5 3 2-3 2 2-3 2-3 2
1 3 3 2-3 3 3 2-3
3 3 3 2-3 3 3 2-3
It was observed that, the color fastness to washing of printed polyelectrolyte-modified PET
fabrics in terms of shade change (alteration) is comparable for two dyes. Gray scale ratings
of alteration vary in the range between moderate (2) to good (3). The lower ratings in
washing fastness can be explained by the positively charged sites introduced onto PET
fabric by cationic PELs can be occupied by OH¯ at the pH 10 of fastness test, and a large
amount of dye desorbs into the soap solution, which makes alteration rating lower than
expected from previous reported results (216).

Results and Discussion 88
Another property of the printed polyelectrolyte-modified PET fabrics that deserves
assessment is fastness to rubbing. Rubbing fastness of the samples is assessed in terms of
dry and wet rubbing. Table 4.5 indicates that polyelectrolyte-modified PET fabrics printed
using C.I. Acid Red 18 and C.I. Acid Blue 80 show comparable rubbing fastness
properties. In all cases, the rubbing fastness results range between moderate (2) and good
(3). The lower ratings in rubbing fastness can be explained as the positively charged sites,
which are introduced either by PDADMAC or by PVAm, are concentrated on the surface
of the PET fabric. Consequently, much acid dyes are attracted at the modified PET fabric
surface. This is the reason for the reduction in rubbing fastness. When the printed samples
were rubbed by a test-fabric, a large amount of dye was transferred to the test-fabric.
Rating of the obtained fastness properties reflects that, the polyelectrolyte layer coating the
PET fabric surface plays a significant role in fastness properties. The wash fastness
properties of the printed PET fabrics modified with PVAm are better than those modified
with PDADMAC. These results again suggest that the stability of PVAm layer improves
the fastness properties to washing.
The stability of the polyelectrolyte coating layer was ascertained by XPS measurements.
The [N]:[C] atomic ratios (Table 4.6) for different polyelectrolyte-modified PET fabrics
were compared before and after washing under similar conditions of color fastness to
washing test (pH10, 40 °C for 30 min).
Table 4.6 The effect of rinsing on [N]:[C] atomic ratio determined by XPS. The unmodified and different modified PET fabric surfaces with PDADMAC or PVAm rinsed at 40 °C, pH 10 for 30 min.
Unmodified PET PDADMAC(a) PVAm(a) Before
washing
After
washing
Before
washing
After
washing
Before
washing
After
washing
[N]:[C] 0 0 0.05 0.03 0.1 0.09
(a) Polyelectrolyte-treated PET fabric obtained with 3 wt. % PDADMAC or PVAm after oxygen plasma (600 W, 15 s).
In the case of PDADMAC-treated PET fabric, it was found that the [N]:[C] atomic ratio is
significantly decreased from 0.05 to 0.03. However, in the case of PVAm-treated PET
fabric there is a marginal loss in [N]:[C] atomic ratio from 0.1 to 0.09. It should be noted
that, even the [N]:[C] atomic ratio decreased to 0.09, it is still higher than 0.03 in the case

Results and Discussion 89
of PDADMAC-treated PET fabric. This result indicates that PDADMAC coated layer was
not stable enough when submitted to washing in an alkaline environment. As the OH¯ can
solvate the electrostatic interaction between quaternary ammonium groups and negatively
charged groups on the plasma modified PET fabric surface. However, the covalent amide
bond enhances the stability of the PVAm coating layer on the PET fabric. This calls for the
potential value of PVAm-treated PET fabric.
Table 4.7 summarizes color fatness to washing and rubbing of PVAm-treated PET fabric
printed with different four reactive dyes. In terms of the gray scale assessment, the color
change of the printed samples is comparable for all dyes and range between good (3) and
very good (4).
Table 4.7 Color fastness properties of PVAm-treated PET fabrics printed with different reactive
dyes.
Dye PVAm con.
(wt. %)
Washing fastness Rubbing fastness
Alteration Dry Wet
C.I. Reactive Blue 5
0.1 3 3 2-3 0.5 3-4 3 2-3 1 3-4 3 2-3 3 4 3 2-3
C.I. Reactive Violet 2
0.1 3-4 3 2-3 0.5 3-4 3 2-3 1 4 3 2-3 3 4 3 2-3
C.I. Reactive Violet 5
0.1 3-4 3 2-3 0.5 3-4 3 2-3 1 4 3 2-3 3 4 3 2-3
C.I. Reactive Black 5
0.1 3-4 3 2-3 0.5 4 3 2-3 1 4 3 2-3 3 4 3 2-3
The higher fastness obtained for the PET fabric modified with PVAm using reactive dyes
may be due to the formation of strong covalent bonds between the reactive dyes and
PVAm modified PET fabric. In addition, the formation of ionic bonds between the
protonated amino groups on PET surface and the anionic sites on the reactive dyes. On the
other hand, the rubbing fastness ratings for printed PVAm-treated PET are slightly lower
than of wash fastness. As suggested previously, the decrease in rubbing fastness can be

Results and Discussion 90
attributed to the higher dye concentration and coloration on the surface of the
PVAm-treated PET.
From these findings, it was demonstrated that the anchoring PVAm layer onto PET fabric
surface modified with low-pressure oxygen plasma is an efficient approach for improving
the interactions of PET fabrics with different anionic dyes. PET fabric modified with this
synthetic route present the highest concentration of primary amino groups as determined
by XPS measurements. This provides an efficient way to improve the surface interactions
with anionic dyes as determined by K/S measurements and good stability. Modified PET
fabric surface with PVAm may find numerous applications to overcome other problems
related to PET coloration. Therefore, in this next section, an attempt was also made to
solve another limitation of PET fabrics coloration.
4.4 Surface functionalization of PET/wool blend fabric with PVAm
PET/wool blends have gained considerable share textile industries because they possess a
number of undeniable advantages over fabrics composed only of one of these two fibers.
However, one of the major problems that restrict the application of PET/wool textiles is
that two classes of dyes are required for coloration to produce solid shades because of the
vastly different physicochemical nature of the two components (217). PET/wool blend
fabrics are most frequently colored using disperse dyes for the PET component and acid
dyes for the wool, this greatly hinders simultaneous process of coloration.
In the present work, it is interesting to explore on the viability of using PVAm to modify
PET/wool blend fabric and to attain solid shades on PET/wool blend fabric using one class
of dyestuffs, i.e. acid dyes. Applying 3 wt. % PVAm onto the oxygen plasma-treated PET
fabrics (600 W, 15 s) was selected for the further experiments.
4.4.1 XPS characterization
The oxygen plasma treatment of the PET/wool surface fabric followed by immobilizing of
the positively charged polyelectrolyte PVAm was ascertained via XPS analysis. The
elemental surface compositions and the corresponding atomic ratios are reported for the
unmodified PET/wool, oxygen plasma-treated PET/wool and the PVAm-treated PET/wool
blend fabrics (Table 4.8). The detected sulfur in PET/wool blend fabrics originates from
thio-ester bonds between fatty acids and protein matrix of the epicuticle and from disulfide
bonds in the protein layer of the epicuticle (218). Nitrogen in the unmodified blend fabric
arises from epicuticle protein material, positioned under fatty acid layer (41).
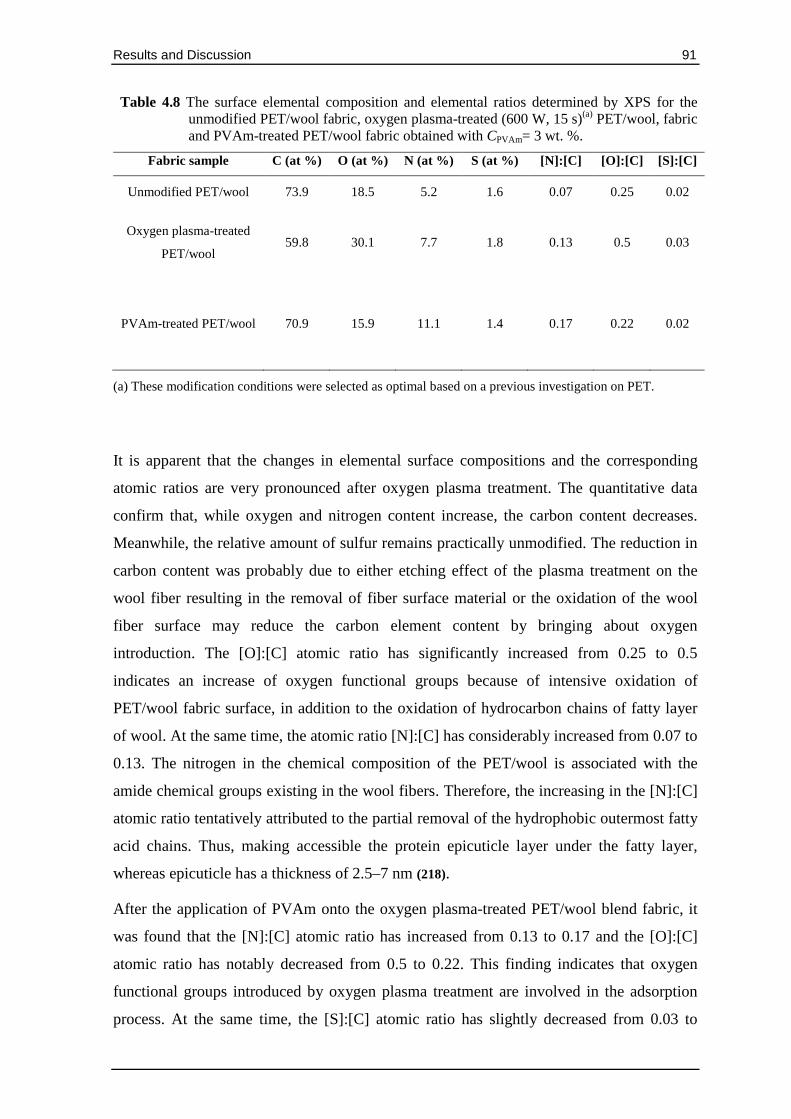
Results and Discussion 91
Table 4.8 The surface elemental composition and elemental ratios determined by XPS for the unmodified PET/wool fabric, oxygen plasma-treated (600 W, 15 s)(a) PET/wool, fabric and PVAm-treated PET/wool fabric obtained with CPVAm= 3 wt. %.
Fabric sample C (at %) O (at %) N (at %) S (at %) [N]:[C] [O]:[C] [S]:[C]
Unmodified PET/wool 73.9 18.5 5.2 1.6 0.07 0.25 0.02
Oxygen plasma-treated
PET/wool 59.8 30.1 7.7 1.8 0.13 0.5 0.03
PVAm-treated PET/wool 70.9 15.9 11.1 1.4 0.17
0.22
0.02
(a) These modification conditions were selected as optimal based on a previous investigation on PET.
It is apparent that the changes in elemental surface compositions and the corresponding
atomic ratios are very pronounced after oxygen plasma treatment. The quantitative data
confirm that, while oxygen and nitrogen content increase, the carbon content decreases.
Meanwhile, the relative amount of sulfur remains practically unmodified. The reduction in
carbon content was probably due to either etching effect of the plasma treatment on the
wool fiber resulting in the removal of fiber surface material or the oxidation of the wool
fiber surface may reduce the carbon element content by bringing about oxygen
introduction. The [O]:[C] atomic ratio has significantly increased from 0.25 to 0.5
indicates an increase of oxygen functional groups because of intensive oxidation of
PET/wool fabric surface, in addition to the oxidation of hydrocarbon chains of fatty layer
of wool. At the same time, the atomic ratio [N]:[C] has considerably increased from 0.07 to
0.13. The nitrogen in the chemical composition of the PET/wool is associated with the
amide chemical groups existing in the wool fibers. Therefore, the increasing in the [N]:[C]
atomic ratio tentatively attributed to the partial removal of the hydrophobic outermost fatty
acid chains. Thus, making accessible the protein epicuticle layer under the fatty layer,
whereas epicuticle has a thickness of 2.5–7 nm (218).
After the application of PVAm onto the oxygen plasma-treated PET/wool blend fabric, it
was found that the [N]:[C] atomic ratio has increased from 0.13 to 0.17 and the [O]:[C]
atomic ratio has notably decreased from 0.5 to 0.22. This finding indicates that oxygen
functional groups introduced by oxygen plasma treatment are involved in the adsorption
process. At the same time, the [S]:[C] atomic ratio has slightly decreased from 0.03 to

Results and Discussion 92
0.02. This indicates that sulfur in cysteic acid residues, which produced by oxidation of the
cystine residues, may be also involved in the adsorption process (45).
On the basis of the above results, a number of conclusions about the structural changes in
PET/wool blend fabric surface following oxygen plasma treatment can be drawn. Besides
modification of wool fibers in the blend sample using oxygen plasma would result in
partial removal of the hydrophobic fatty layer, the newly oxygen functional groups were
formed. These structural changes can be confirmed by the results of the electrokinetic
measurements (Figure 4.38) and kinetics measurements of wetting (Figure 4.39).
4.4.2 Electrokinetic measurements
It is reported that streaming potential measurements are used to monitor the surface charge
during different surface modification steps of PET fabric. In the same way, the presence of
a PVAm layer on the PET/wool blend fabric was ascertained by the streaming-potential
measurements. In which, the IEP values were determined by measuring the zeta-potential
as a function of pH. The ζ–pH plot of the blend fabric samples modified with oxygen
plasma and followed by loading of PVAm from its aqueous solution (3 wt. %) is shown in
Figure 4.38.
The electrokinetic investigation of PET/wool blend fabric after oxygen plasma treatment
shows that the IEP value shifts in the direction of more acidic pH (from about 4 for the
unmodified PET/wool blend fabric to 3 for PET/wool fabric after oxygen plasma
treatment). This can be attributed to the existence of negatively charged groups, such as
–SO3 and –COO after oxygen plasma treatment. The formation of –SO3 groups may
result from oxidation of disulphide bonds in wool fibers to form strongly acidic sulphonic
acid groups (219). These results indicate that PET/wool blend fabric seems to be negatively
charged and can electrostatically interact with the positively charged PVAm
macromolecules.
The application of the PVAm has the expected effect of displacing the function ζ= ζ(pH)
towards a higher pH value. Actually, the IEP is shifted to a much higher value of pH 9.
The changes of the electrokinetic surface properties clearly showed that a significant
amount of PVAm bound to the surface. This implies that the number of free amino groups
of the PVAm dominates the outermost surface lead to charge reversal of negatively
charged plasma-treated PET/wool blend fabric.

Results and Discussion 93
Figure 4.38 ζ-pH dependence for the unmodified PET/wool fabric, oxygen plasma- modified (600 W, 15s) PET/wool fabric and PVAm-treated PET/wool fabric obtained with CPVAm = 3 wt. %.
4.4.3 Kinetics measurements of wetting
Figure 4.39 reveals a clear difference between the unmodified PET/wool and oxygen
plasma-treated blend fabrics. The unmodified PET/wool blend fabric is highly
hydrophobic, showing no wetting at all. This can be attributed to the combined effect of
hydrophobic nature of PET and wool fiber surfaces. The hydrophobic nature of wool fibers
is owing to the specific properties of its exocuticles and epicuticles. The exocuticle is
hydrophobic because it contains a high degree (about 35%) of disulphite cross-linking in
the A-layer. The epicuticle surrounds each cuticle cell of the wool fiber, and it consists of
fatty acid (about 25% by mass), the main component of which is 18-methyleicosanoic
acid. Fatty acid chains of 18-methyleicosanoic acid are covalently bound to the wool fiber
as a thio-ester to cysteine and are oriented away from the fiber to produce a “polyethylene
like” layer at the fiber surface, thus making the epicuticle hydrophobic. On the contrary,
the oxygen plasma-treated PET/wool fabric is hydrophilic, with wetting time of < 0.1 s at
conditions were studied for 100 % PET (600 W, 15s), resulting in relatively quick water
absorption, thus the capability to transport liquids through pore system, this being a
prerequisite for effective PVAm adsorption.
3 4 5 6 7 8 9 10-80
-70
-60
-50
-40
-30
-20
-10
0
10
20
30
40
ζ (m
V)
pH
Unmodified PET/Wool blend 600W, 15 s 3 wt.% PVAm

Results and Discussion 94
Figure 4.39 Contact angles of water droplets in dependence on resting time on the unmodified PET/wool fabric and oxygen plasma-treated (600 W, 15 s) PET/wool fabric. The error of each measurement is ± 2°.
4.4.4 Surface morphology
Figure 4.40 shows the morphologies of the unmodified and different modified PET/wool
blend fabric surface. Figures 4.40a and b show SEM images of the unmodified PET/wool
fabric at magnification of 1000X, 5000X respectively. The SEM images at magnification
of 1000X and 5000X show the arrangement of PET and wool fibers within a woven fabric
structure. The fibers are relatively parallel.
In the case of the PET component of blend fabric, SEM images do not reveal significant
differences between unmodified (Figure 4.40c) and oxygen plasma-treated surfaces (600
W, 15 s) (Figure 4.40d). On the other hand, the oxygen plasma treatment leads to a rougher
surface in the case of the wool component of blend fabric (Figures 4.40f-g), by introducing
groove along the fiber because of the etching effect of plasma, which cause the partial
removal of the cuticle surface. The grooving effect induced by the oxygen plasma may
increase the nitrogen content, as expected from the XPS findings.
After oxygen plasma treatment and subsequent PVAm loading, SEM images show the
uniform coatings onto the PET component (Figure 4.40e) and wool component (Figure
4.40h). This implies that PVAm forms adhered layer on PET/wool blend fabric. The
0,01 0,1 1
0
20
40
60
80
100
120
140
Con
tact
ang
le (
deg)
Time (s)
Unmodified PET/wool blend 600 W , 15 s

Results and Discussion
presence of this layer on the surface of both fibers w
attached to it.
Figure 4.40 SEM images of PET/wool fabrics: (a) the unmodified (1000X), (b) the unmodified (5000X), (C) unmodified PET component (50000X),component (50000oxygen plasma-component, and (h)
(c)
(a)
presence of this layer on the surface of both fibers would render the dye molecules
SEM images of PET/wool fabrics: (a) the unmodified (1000X), (b) the unmodified unmodified PET component (50000X), (d) the
component (50000X), (e) oxygen plasma-treated (600 W, 15 s) PET componenttreated (600 W, 15 s) wool component, (g)
component, and (h) PVAm-treated wool component.
(d)
(b)
95
ould render the dye molecules
SEM images of PET/wool fabrics: (a) the unmodified (1000X), (b) the unmodified the unmodified wool
(600 W, 15 s) PET component, (f) ) PVAm-treated PET

Results and Discussion
4.4.5 Evaluation of PVAm coating stability
The stability of the obtained PVAm layer under the similar conditions of standard wash
fastness tests was evaluated (pH 10 at 40 °C for 30 min). As shown in Table 4.9, the XPS
results revealed no significant changes in
result, it can be concluded that the PVAm layer is stable.
(a) The unmodified and PVAm-treated
Table 4.9 The effect of washing on the [N]:[C] elemental ratio determined by XPS.
Unmodified PET/wool blend
Before washing
[N]:[C] 0.07
(g)
(e)
Figure 4.40 (Continued.)
Evaluation of PVAm coating stability
The stability of the obtained PVAm layer under the similar conditions of standard wash
fastness tests was evaluated (pH 10 at 40 °C for 30 min). As shown in Table 4.9, the XPS
no significant changes in [N]:[ C] before and after washing
result, it can be concluded that the PVAm layer is stable.
treated PET/wool fabrics washed at 40°C, pH 10 for 30 min.
The effect of washing on the [N]:[C] elemental ratio determined by XPS.
Unmodified PET/wool blend PVAm (3 wt. %)
Before washing After washing Before washing
0.07 0.16
(f)
(h)
96
The stability of the obtained PVAm layer under the similar conditions of standard wash
fastness tests was evaluated (pH 10 at 40 °C for 30 min). As shown in Table 4.9, the XPS
C] before and after washing. From this
10 for 30 min.
The effect of washing on the [N]:[C] elemental ratio determined by XPS.(a)
wt. %)
After washing
0.15

Results and Discussion 97
450 500 550 600 650 7000
1
2
3
4
5
6
7
8
K/S
Wavelength (nm)
Unmodified PET/Wool 3 wt. %
450 500 550 600 650 7000
1
2
3
4
5
6
7
8
K/S
Wavelength (nm)
Unmodified PET/Wool 3 wt. %
4.4.6 Printing properties of PET/wool blend fabric
Figure 4.41 depicts the effect of an applied surface modification method on the K/S
absorption spectra of PET/wool blend fabric printed with C.I. Acid Red 18 ( Figure 4.41a)
and C.I. Acid Blue 80 (Figure 4.41b). It is clear that the two acid dyes showed a higher
K/Smax on the PVAm-treated PET/wool blend fabric as compared to the unmodified
PET/wool blend fabric. For instance, K/Smax values increase with C.I. Acid Red 18 from 5
for the unmodified to 7.1 for modified PET/wool blend fabrics. It is worthy to mention
that, the higher K/Smax values of the unmodified PET/wool with both C.I. Acid Red 18 and
C.I. Acid Blue 80 compared with unmodified PET fabric (Figure 4.41) reflect the positive
impact of the contribution of wool component in blend samples along with its high affinity
for anionic acid dyes.
These significant increases in K/Smax values are a direct consequence of modifying
PET/wool blend fabric surface by loading PVAm layer. The most probable mechanism of
the interaction between PVAm layer and dye is likely to be ionic interaction of the anionic
sulfonate groups (−SO3¯ ) of anionic dye molecules with protonated amino groups of
PVAm layer on the modified fabrics in acid medium. Therefore, the loading PVAm
enables additional quantity of acid dyes to be bound to the fabric. This result confirms the
positive effect of coating PET/wool blend fabric surface with PVAm layer on coloration
properties.
Figure 4.41 K/S absorption spectra of the unmodified PET/wool fabric and PVAm-treated
PET/wool obtained with CPVAm = 3 wt. % printed with C.I. Acid Red 18 (a) and C.I. Acid Blue 80 (b).
(a) (b)

Results and Discussion 98
Additionally, from the Figure 4.42, it can be observed that the color of the unmodified
PET/wool blend fabric is light and non-uniform. On the other hand, the color of the
PVAm-treated PET/wool blend fabric is heavy, solid and uniform. This gives an
intuitionist proof that loading PVAm can improve coloration of PET/wool blend fabric.
Moreover, the obtained findings show that after PVAm treatment it is possible to color
PET/wool blend fabric with only one acid dye, which shows substantivity only to wool
fibers. Thus, the coloration becomes independent of the chemical structure of PET or wool
fibers because only the PVAm coating layer is colored without changes in the bulk
properties of blend fabric.
Figure 4.42 Digital photos of the unmodified PET/wool blend fabric and PVAm-treated PET/wool blend fabric printed with C.I. Acid Red 18 (a), C.I. Acid Blue 80 (b).
4.4.7 Fastness properties of colored PET/wool blend fabric.
The color fastness to washing and rubbing of the unmodified PET/wool and PVAm-treated
PET/wool blend fabrics printed with C.I. Acid Red 18 and C.I. Acid Blue 80 were tested
(Table 4.10). The fastness properties were visually assessed using a standard gray scale
(175; 176).
Unmodified PET/wool fabric PVAm-modified PET/wool fabric
Unmodified PET/wool fabric PVAm-modified PET/wool fabric
(a)
(b)

Results and Discussion 99
Table 4.10 Color fastness properties of PVAm-treated PET/wool blend fabric printed with C.I. Acid Red 18 and C.I. Acid Blue 80.
PET/wool fabric
C.I. Acid Red 18 C.I. Acid Blue 80 Washing fastness
Rubbing fastness
Washing fastness
Rubbing fastness
Alteration Dry Wet Alteration Dry Wet
Unmodified 3-4 3 3 3-4 3 3
PVAm-treated PET/wool (a) 3-4 3 2-3 3-4 3 2-3
(a) PVAm-treated PET/wool fabric obtained by coating oxygen plasma-treated PET/wool fabric with PVAm from 3 wt.% aqueous solution .
It was observed that the washing and rubbing fastness ratings for the two dyes obtained
with PVAm-treated PET fabrics were the same as the ratings of the unmodified blend
fabric. This implies that the dye-substrate bonding mechanism, in principle, remains the
same. For the PVAm-treated PET/wool blend fabric, the rubbing fastness results range
between moderate (2) and good (3). The lower ratings in rubbing fastness can be explained
by the high dye concentration (dye accumulation) on the fabric surface of the printed
modified blend fabric.

Summary and Outlook 100
5 Summary and Outlook
The surface chemistry plays a very important role in the performance of polymeric
materials during their applications. Among all polymers, poly(ethylene terephthalate)
(PET) is the main synthetic polymer in fiber industries and the production of fabrics. It is
also used in other industries including packaging, construction and automotive.
Unfortunately, PET materials exhibit poor wetting with polar liquids and show low
adhesion in composites and joins. These limitations in functional properties of PET fabrics
cannot be compensated by a direct modification to adjust the fiber surface to requested and
specific applications because PET surfaces are not endowed surface groups necessary for
surface reactions. However, it is essential for PET fabric to undergo pretreatment prior
modification reactions. The largely surface inertness of PET fibers and fabrics created
numerous scientific and technical challenges to overcome problems in the PET's
disadvantageous properties such as less wearing comfort, limitation in coloration
properties, build-up of electrostatic charges, insufficient soil release and poor washability.
Nevertheless, the PET surface inertness has constrained uses of PET fabrics for the further
application in garments and other industries. Actually, the effective and efficient
modification of PET is a challenge to overcome its limited reactivity and provide more
flexibility in their uses. Surface modifications seem to be attractive tools with this
objective because they are guaranteeing to maintenance the key bulk properties.
The current work aimed at the endowing PET fabrics surface with accessible amine
functionalities. For the introduction of amine functionalities, two plasma-based approaches
have been successfully achieved. In the first approach, the PET fabric surface is directly
exposed to the low-pressure ammonia plasma treatment, leading to surfaces preferably
containing primary amino groups and some other nitrogen-containing groups. In the
second approach, the PET fabric surface was modified by low-pressure oxygen plasma in
order to introduce oxygen-containing functional groups such as carboxylic groups. These
carboxylic groups can act as an anchor for the adsorption of cationic polyelectrolytes from
aqueous solution to PET fabric surface. Afterwards, an appropriate annealing procedure
was used at 120 °C for 1 h to stabilize the polymer layer on PET fabric surface.
Cationic polyelectrolytes used in this study were poly(diallyldimethylammonium chloride)
(PDADMAC) with a molar mass of 200000-350000 g/mol as an example of strong

Summary and Outlook 101
polyelectrolytes and poly(vinyl formamide-co-vinyl amine) (PVAm) with 340000 g/mol as
an example of weak polyelectrolytes.
In addition to surface modification of PET fabric, attention was directed towards the
characterization of the different modified PET fabrics surface by a combination of various
surface-sensitive techniques such as X-ray photoelectron spectroscopy (XPS),
electrokinetic measurements and time-dependent contact angle studies. Finally, the amine
functionalities introduced by different surface modifications were used for the subsequent
immobilization of anionic dye molecules such as acid and reactive dyes to evaluate the
efficiency of different surface modifications. The reaction of the modified PET fabric
surfaces with anionic dyestuffs can be considered as a model reaction allowing to evaluate
the surface reactivity and to show the possibility for the large molecules to get access to the
reactive surface centers.
The main results of different surface modifications can be summarized as follows:
1. The surface chemical compositions of ammonia plasma and polyelectrolyte-modified
PET fabrics were evaluated by XPS and were compared to the unmodified PET fabric.
In the wide-scan XPS spectra of different modified PET fabrics surface, one additional
peak was appeared for N 1s adjacent to the characteristic main two peaks of carbon
(C 1s) and oxygen (O 1s) of unmodified PET. The N 1s peak indicates that the
nitrogen-containing functional groups were introduced onto the surface of PET fabric.
2. The PET fabric surface modified by oxygen plasma has been characterized by XPS. It
was determined that oxygen plasma induced the formation of additional polar groups,
such as carboxylic acid groups. In comparison with the unmodified PET fabric, the
[O]:[C] atomic ratio was increased by two-fold at 600 W for 15 s.
3. In comparison with the unmodified PET fabric surface, the elemental surface
compositions of surface region and the corresponding atomic ratios of ammonia plasma
and polyelectrolyte-modified PET fabrics displayed that the [N]:[C] atomic ratio is
reached to 0.19 after ammonia plasma treatment for 600 s. In the case of coating with
cationic polyelectrolytes, the [N]:[C] atomic ratio is reached to 0.05 and 0.1 after
modification with 3 wt. % PDADMAC and 3 wt. % PVAm, respectively. Therefore, it
could be an indication of a successful formation of the PDADMAC or PVAm layer
covering the PET fabric surface.

Summary and Outlook 102
4. Additionally, the incorporation of the Brønsted acidic or basic groups were analyzed by
streaming potential measurements that are very sensitive to analyze charge formation
processes on solid surfaces. The change of the interfacial charge at the PET fabric
surfaces was studied after different surface modifications, which causes remarkable
shifts of the isoelectric points (IEP) compared to the unmodified PET fabric. It was
found that the IEP value for the unmodified PET was around pH 4. The IEP value for
ammonia plasma-treated PET fabric surfaces shifted to about pH 6.5 after 600 s plasma
treatment time. After coating oxygen plasma-treated PET fabric surfaces with cationic
polyelectrolytes, the IEP value is significantly shifted from 2.6 for the oxygen plasma-
treated PET fabric surface to 10.8 of PDADMAC-treated PET fabric surface obtained
with CPDADMAC = 3 wt.%. In the case of PVAm adsorption on plasma-treated PET, the
IEP value shifted to 9.3 obtained after modification of surface with CPVAm = 3 wt. %.
5. The shift of the IEP can be considered as the formation of more closed and dense
polyelectrolyte layer on the fabric’s surface shielding charges of the oxygen plasma-
treated PET fabric surface. These findings were supported by SEM investigations.
6. The plasma-treated surfaces were found to be relatively stable over 14 days of storage
in air.
7. The effectiveness of different modified PET fabrics with regard to wettability was
investigated by the time-dependent contact angle measurements. It was found that,
different surface modifications induced conversion of PET fabric from hydrophobic to
hydrophilic substrate and keeping intact its bulk properties.
8. Contrary to ammonia plasma treatment, polyelectrolyte-modified PET fabric surface
leads to a more defined surface chemistry.
The main results of surface activity of modified PET fabrics towards anionic dyes can be
summarized as follows:
1. The ability of amine functionalities created by different surface modifications to interact
with different classes of anionic dyes was compared. It was shown that ammonia
plasma treatments had no positive effect on the fixation of both neither acidic dyes nor
reactive dye molecules regardless of the ammonia plasma treatment time. In contrast to
ammonia plasma-treated PET, it was found that color strength (K/Smax) values obtained

Summary and Outlook 103
from K/S absorption spectra of PET fabrics coated with either PDADMAC or PVAm
was remarkably increased compared to that of the unmodified PET fabric surface.
2. It was found that the type of polyelectrolyte played a role in color strength results. The
results show that regardless of the concentration of polyelectrolyte solution, the color
strength values were much higher for the PVAm-treated PET fabrics printed with C.I.
Acid Red 18 or C.I. Acid Blue 80 as compared to those of the PDADMAC-treated PET
fabrics.
3. The permanency of the bond between the dye molecules and the surface of different
modified PET fabrics can be investigated by the fastness tests of printed PET fabrics to
washing and rubbing. A high coloration fastness indicated a strong dye molecule
bonding, which in turn, is an indication of permanency of the amine functionalities. The
color fastness values to the washing of the PVAm-treated PET fabrics printed with
anionic reactive dyes were in the range between good to very good as compared to
moderate to good in the case of anionic acid dyes.
Finally, it was demonstrated that anchoring PVAm layer onto PET fabric surface modified
with low-pressure oxygen plasma is an efficient approach to improve coloration behavior
and to overcome different problems related to PET fabrics coloration, such as coloration of
PET/wool blend fabric with a single class of dyes.
For future studies, it is proposed that the anchoring PVAm layer onto PET fabric surface
may allow another potential application of modified PET fabric bearing primary amino
groups. These anchoring groups could be offered new possibilities for creation of smart
textiles based on PET fabrics with multifunctional properties such as chameleon textiles.
This group of smart textiles changes their color when external stimuli such as pH
(halochromism) or temperature (thermochromism) are applied. In addition, due to their
good chemical reactivity, primary amino groups are widely used in biochemistry for
covalent coupling of biological active molecules.

References 104
6 References
[1] Guimond, S., Hanselmann, B., Amberg, M., and Hegemann, D., Pure and Applied Chemistry 2010, 82, 6, 1239-1245.
[2] Jovancic, P., Jocic, D., Trajkovic, R., and Drobnjak, S., Journal of the Textile Institute 1993, 84, 1, 49-56.
[3] Kan, C. W., Chan, K., Yuen, C. W., and Miao, M. H., Journal of Materials Processing Technology 1998, 82, 1-3, 122-126.
[4] Shishoo, R., Plasma technologies for textiles, Woodhead, Cambridge, 2007.
[5] Scheirs, J. and Long, T. E., Modern polyesters: chemistry and technology of polyesters and copolyesters, John Wiley & Sons, Hoboken, NJ, 2003.
[6] Wei, Q., Surface modification of textiles, CRC Press, Boca Raton, 2009.
[7] Pastore, C. M., Kiekens, P., and NetLibrary, I., Surface characteristics of fibers and textiles, M. Dekker, New York, 2001.
[8] Avny, Y. and Rebenfeld, L., Journal of Applied Polymer Science 1986, 32, 3, 4009-4025.
[9] Ellison, M. S., Fisher, L. D., Alger, K. W., and Zeronian, S. H., Journal of Applied PolymerScience 1982, 27, 1, 247-257.
[10] Bui, L. N., Thompson, M., McKeown, N. B., Romaschin, A. D., and Kalman, P. G., Analyst 1993, 18, 5, 463-474.
[11] Fukai, R., Dakwa, P. H. R., and Chen, W., Journal of Polymer Science Part A-Polymer Chemistry 2004, 42, 21, 5389-5400.
[12] Croll, T. I., O'Connor, A. J., Stevens, G. W., and Cooper-White, J. J., Biomacromolecules 2004, 5, 2, 463-473.
[13] Hakeim, O. A., El-Gabry, L., and Abou-Okeil, A., Journal of Applied Polymer Science 2008, 108, 4, 2122-2127.
[14] Walawska, A., Filipowska, B., and Rybicki, E., Fibres & Textiles in Eastern Europe 2003, 11, 2, 71-74.
[15] Dave, J., Kumar, R., and Srivastava, H. C., Journal of Applied Polymer Science 1987, 33, 2, 455-477.
[16] Holmes, S. A. and Zeronian, S. H., Journal of Applied Polymer Science 1995, 55, 11, 1573-1581.
[17] Richter, P., Chemiefasern/Textilindustrie 1991, 41, 9, E129-E133.
[18] O'Neill, A. and Cavaco-Paulo, A., Biocatalysis and Biotransformation 2004, 22, 5-6, 353-356.

References 105
[19] Kan, C. W., Chan, K., Yuen, C. W. M., and Miao, M. H., Journal of Materials Processing Technology 1998, 83, 1-3, 180-184.
[20] Abidi, N. and Hequet, E., Journal of Applied Polymer Science 2004, 93, 1, 145-154.
[21] Bhat, N. V. and Benjamin, Y. N., Textile Research Journal 1999, 69, 1, 38-42.
[22] Wong, K. K., Tao, X. M., Yuen, C. W., and Yeung, K. W., Textile Research Journal 1999, 69, 11, 846-855.
[23] Radetic, M., Jocic, D., Jovancic, P., Trajkovic, R., and Petrovic, Z. L., Textile Chemist and Colorist & American Dyestuff Reporter 2000, 32, 4, 55-60.
[24] Hopkins, J., Boyd, R. D., and Badyal, J. P., Journal of Physical Chemistry 1996, 100, 16, 6755-6759.
[25] Wang, M. J., Chang, Y. I., and Poncin-Epaillard, F., Surface and Interface Analysis 2005, 37, 3, 348-355.
[26] Desmet, T., Morent, R., De Geyter, N., Leys, C., Schacht, E., and Dubruel, P., Biomacromolecules 2009, 10, 9, 2351-2378.
[27] Luo, S. and van Ooij, W. J., Journal of Adhesion Science and Technology 2002, 16, 13, 1715-1735.
[28] Rogers, M. E., Long, T. E., and NetLibrary, I., Synthetic methods in step-growth polymers, Wiley-Interscience, Hoboken, N.J, 2003.
[29] Mark, H. and Stafford, W. G., Collected Papers Of Wallace Hume Carothers On High Polymeric Substances, Interscience Publishers Inc., New York, 1940.
[30] Chemical Market Reporter, Chemical Market Reporter 2004, 265, 10, 27.
[31] Wilks, E. S., Industrial Polymers Handbook, Vol. 1, Wiley-VCH, Weinheim, 2001.
[32] Eberle, H., Hermeling, H., Hornberger, M., Menzer, D., and Ring, W., Clothing Technology, Vol. 4, Europa-Lehrmittel, Vollmer 1995.
[33] Koslowski, H. J., Chemiefaser Lexikon, Vol. 11, Deutscher Fachverlag 1997.
[34] Odian, G. G. and NetLibrary, I., Principles of polymerization, 4th ed., Wiley, Hoboken, N.J, 2004.
[35] McIntyre, J. E., "Polyester fibres," Handbook of Fibre Chemistry Marcel Dekker Inc, New York, 1998, pp. 1-69.
[36] Mohapatra, C. R., Text.Dyer Printer 1984, 21, 21-25.
[37] Oerlikon, "The Fiber Year 2006/2007," 7, 2007.
[38] Cheetham, R. C., Dyeing fibre blends: the processing of blends, unions and mixtures containing natural or man-made fibres, Van Nostrand, London, 1966.

References 106
[39] Aspland, J. R., Text.Chem.Colorist 1993, 25, 11, 34.
[40] Shore, J., Dyeing of Synthetic Polymer Fibres, Bradford 1979.
[41] Negri, A. P., Cornell, H. J., and Rivett, D. E., Textile Research Journal 1993, 63, 2, 109-115.
[42] Maclaren, J. A. and Milligan, B., Wool science: the chemical reactivity of the wool fibre, Science Press, Marrickville, N.S.W, 1981.
[43] Christie, R. M., Colour chemistry, Royal Society of Chemistry, Cambridge, 2001.
[44] Onions, W. J., Wool: an introduction to its properties, varieties, uses and production, E. Benn, London, 1962.
[45] Molina, R., Jovancic, P., Jocic, D., Bertran, E., and Erra, P., Surface and Interface
Analysis 2003, 35, 2, 128-135.
[46] Lewis, D. M., Wool dyeing, Society of Dyers and Colourists, West Yorkshire, 1992.
[47] Shore, J., Colorants and auxiliaries organic chemistry and application properties, Society of Dyers and Colourists, West Yorshire, England, 1990.
[48] L.Rebenfeld, Encyclopedia of Polymer Science and Engineering, edited by
H.F.Mark John Wiley & Sons, New York, 1985.
[49] Nunn, D. M., the Dyeing of synthetic-polymer and acetate fibres, Dyers Co. Publications Trust, Bradford, West Yorkshire, 1979.
[50] Minghua, M., Yuyu,S., and Gang. S., Dyes and Pigments 2003, 58, 1, 27-35.
[51] Wakida, T., Lee, M., Niu, S., Kobayashi, S., and Ogasawara, S., Sen’i Gakkaishi 1994, 50, 421-423.
[52] Wakida, T., Cho, S., Choi, S., Tokino, S., and Lee, M., Textile Research Journal 1998, 68, 11, 848-853.
[53] Aksit, A. C. and Onar, N., Journal of Applied Polymer Science 2008, 109, 1, 97-105.
[54] Patel, A., "New applications of dyes in the textile industry," International conference on indian dyestuff industry, 2006.
[55] McIntyre, J. E., Synthetic fibres nylon, polyester, acrylic, polyolefin, CRC Press, Boca Raton, 2005.
[56] Chao, Y. C., and Lin. S. M., Dyes and Pigments, 1998, 37, 357-371.
[57] Choudhury, A. K. R., Textile preparation and dyeing, Science Publishers, Enfield, NH, 2006.

References 107
[58] Ruppert, S., Mueller, B., Banners, T., and Schollmeyer, E., Text.Praxis Int. 1994, 49, 614.
[59] Shore, J., Cellulosics dyeing, Society of Dyers and Colourists, Bradford, West Yorkshire, England, 1995.
[60] Broadbent, A. D., Basic principles of textile coloration, Society of Dyers and Colourists, Bradford, England, 2001.
[61] Van der Schueren, L. and De Clerck, K., Textile Research Journal 2010, 80, 7, 590-603.
[62] Miles, L. W. C., Textile printing, 1st ed., Society of Dyers and Colourists, Bradford, 1994.
[63] Miles, L. W. C., Textile printing, Rev. 2nd ed., Society of Dyers and Colourists, Bradford, 2003.
[64] Lacasse, K. and Baumann, W., Textile chemicals environmental data and facts, Springer, Berlin, 2004.
[65] Lapasin, R. and Pricl, S., Rheology of industrial polysaccharides theory and
applications, 1st ed., Blackie Academic & Professional, London, 1995. [66] Kokol, V., Carbohydrate Polymers 2002, 50, 3, 227-236.
[67] Sostar, S. and Schneider, R., Dyes and Pigments 1999, 41, 3, 167-175.
[68] McLachlan, J., Plant and Soil 1985, 89, 1-3, 137-157.
[69] Sinha, E., Journal of Industrial Textiles 2009, 38, 4, 317-339.
[70] Yamaguchi, T., Nakao, S. I., and Kimura, S., Journal of Polymer Science Part A-Polymer Chemistry 1996, 34, 7, 1203-1208.
[71] Fridman, A. A., Plasma chemistry, Cambridge University Press, Cambridge, 2008.
[72] Conrads, H. and Schmidt, M., Plasma Sources Science & Technology 2000, 9, 4, 441-454.
[73] Bogaerts, A., Neyts, E., Gijbels, R., and van der Mullen, J., Spectrochimica Acta Part B-Atomic Spectroscopy 2002, 57, 4, 609-658.
[74] Lieberman, M. A. and Lichtenberg, A. J., Principles of plasma discharges and materials processing, 2nd ed., Wiley-Interscience, Hoboken, N. J, 2005.
[75] Fisher, E. R., Plasma Processes and Polymers 2004, 1, 1, 13-27.
[76] Siow, K. S., Britcher, L., Kumar, S., and Griesser, H. J., Plasma Processes and Polymers 2006, 3, 6-7, 392-418.
[77] Sacher, E., Progress in Surface Science 1994, 47, 3, 273-300.
[78] Liston, E. M., The journal of adhesion. 1989, 30, 199-218.

References 108
[79] McCord, M. G., Hwang Y. J., Hauser, P. J., Qiu, Y., Cuomo, J. J., Hankins, O. E., Bourham, M. A., and Canup, L. K., Textile Research Journal 2002, 72, 6, 491-498.
[80] Poll,H., Schladitz,U., and Schreiter, S., Surface & Coatings Technology 2001, 142-144, 489-493.
[81] Ferrero, F., Polymer Testing 2003, 22, 5, 571-578.
[82] Morent, R., De Geyter, N., Verschuren, J., De Clerck, K., Kiekens, P., and Leys, C., Surface & Coatings Technology 2008, 202, 14, 3427-3449.
[83] Wrobel, A. M., Kryszewski, M., Rakowski, W., Okoniewski, M., and Kubacki, Z., Polymer 1978, 19, 8, 908-912.
[84] Costa, T. H. C., Feitor, M. C., Alves, C., Freire, P. B., and de Bezerra, C. M., Journal of Materials Processing Technology 2006, 173, 1, 40-43.
[85] Gupta, B., Hilborn, J., Hollenstein, C., Plummer, C. J. G., Houriet, R., and Xanthopoulos, N., Journal of Applied Polymer Science 2000, 78, 5, 1083-1091.
[86] El-Zawahry, M. M., Ibrahim, N. A., and Eid, M. A., Polymer-Plastics Technology and Engineering 2006, 45, 10, 1123-1132.
[87] Raffaele-Addamo, A., Selli, E., Barni, R., Riccardi, C., Orsini, F., Poletti, G., Meda, L., Massafra, M. R., and Marcandalli, B., Applied Surface Science 2006, 252, 6, 2265-2275.
[88] Nitschke, M., Konig, U., Lappan, U., Minko, S., Simon, F., Zschoche, S., and Werner, C., Journal of Applied Polymer Science 2007, 103, 1, 100-109.
[89] Lappan, U., Nitschke, M., Pleul, D., Simon, F., and Uhlmann, S., Plasmas and Polymers 2001, 6, 4, 211-220.
[90] Tseng, H. J., Hsu, S. H., Wu, M. W., Hsueh, T. H., and Tu, P. C., Fibers and Polymers 2009, 10, 1, 53-59.
[91] Bratskaya, S., Marinin, D., Nitschke, M., Pleul, D., Schwarz, S., and Simon, F., Journal of Adhesion Science and Technology 2004, 18, 10, 1173-1186.
[92] Fleer, G. J., Polymers at interfaces, 1st ed., Chapman & Hall, London, 1993.
[93] Jonsson, B., Surfactants and polymers in aqueous solution, John Wiley, Chichester, 1998.
[94] Dobrynin, A. V. and Rubinstein, M., Progress in Polymer Science 2005, 30, 11, 1049-1118.
[95] Schmitz, K. S., Macro-ion characterization from dilute solutions to complex fluids, American Chemical Society, Washington, DC, 1994.
[96] Butler, G. B., Cyclopolymerization and cyclocopolymerization, M. Dekker, New
York, 1992.

References 109
[97] Baran, S. and Gregory, D., Colloid Journal 1996, 58, 1, 9-14.
[98] Dawson, D. J., Gless, R. D., and Wingard, R. E., Journal of the American Chemical Society 1976, 98, 19, 5996-6000.
[99] Dawson, D. J., Otteson, K. M., Wang, P. C., and Wingard, R. E., Macromolecules 1978, 11, 2, 320-324.
[100] Oda, H., Dyes and Pigments 2005, 66, 2, 103-108.
[101] Tsatsaroni, E. G. and Eleftheriadis, I. C., Dyes and Pigments 2004, 61, 2, 141-147.
[102] Ciferri, A., Supramolecular polymers, Marcel Dekker, New York, 2000.
[103] Klein, J. and Kumacheva, E., Science 1995, 269, 5225, 816-819.
[104] Israels, R., Leermakers, F. A. M., and Fleer, G. J., Macromolecules 1994, 27, 11, 3087-3093.
[105] Taddei, P., Monti, P., Freddi, G., Arai, T., and Tsukada, M., Journal of Molecular Structure 2003, 650, 1-3, 105-113.
[106] Zhu, Y. Q., Kang, E. T., Neoh, K. G., Chan, L., Lai, D. M. Y., and Huan, A. C. H., Applied Surface Science 2004, 225, 1-4, 144-155.
[107] Amjad, Z., The science and technology of industrial water treatment, CRC Press, Boca Raton, FL, 2010.
[108] Pasquier, N., Keul, H., Heine, E., and Moeller, M., Biomacromolecules 2007, 8, 9, 2874-2882.
[109] Wang, C. X. and Chen, S. L., Aatcc Review 2004, 4, 5, 25-28.
[110] Zhao, H. Z., Luan, Z. K., Gao, B. Y., and Yue, Q. Y., Journal of Applied Polymer Science 2002, 84, 2, 335-342.
[111] Petzold, G., Mende, M., Lunkwitz, K., Schwarz, S., and Buchhammer, H. M., Colloids and Surfaces A-Physicochemical and Engineering Aspects 2003, 218, 1-3, 47-57.
[112] Rosunee, S., Carr, C. M., Hibbert, S., and Jones, C., Journal of Materials Science 2003, 38, 10, 2179-2185.
[113] Blackburn, R. S. and Burkinshaw, S. M., Journal of Applied Polymer Science 2003, 89, 4, 1026-1031.
[114] Wandrey, C., Hernandez-Barajas, J., and Hunkeler, D., Radical Polymerisation Polyeletrolytes 1999, 145, 123-182.
[115] Thome, J., Hollander, A., Jaeger, W., Trick, I., and Oehr, C., Surface and Coatings Technology 2003, 174-175, 584-587.
[116] Anonymous, Chem.Eng.News 1968, 46, 38.

References 110
[117] Lancaster, J. E., Baccei, L., and Panzer, H. P., Journal of Polymer Science Part C-Polymer Letters 1976, 14, 9, 549-554.
[118] Mortimer, D. A., Polym.Int 1990, 25, 1, 29-41.
[119] Wandrey, C. and Gornitz, E., Acta Polymerica 1992, 43, 6, 320-326.
[120] Negi, Y., Harada, S., and Ishizuka, O., Journal of Polymer Science Part A-1-Polymer Chemistry 1967, 5, 8, 1951.
[121] Hofmann, K., Kahle, I., Simon, F., and Spange, S., Beilstein Journal of Organic Chemistry 2010, 6, 79.
[122] Voigt, I., Simon, F., Estel, K., and Spange, S., Langmuir 2001, 17, 10, 3080-3086.
[123] Spange, S., Meyer, T., Voigt, I., Eschner, M., Estel, K., Pleul, D., and Simon, F., Polyelectrolytes with Defined Molecular Architecture 2004, 165, 43-78.
[124] Baranovsky, V. Y., Kazarin, L. A., Litmanovich, A. A., and Papisov, I. M., European Polymer Journal 1984, 20, 2, 191-194.
[125] Dragan, E. S., Mihai, M., and Airinei, A., Journal of Polymer Science Part A-Polymer Chemistry 2006, 44, 20, 5898-5908.
[126] Simon, F., Dragan, E. S., and Bucatariu, F., Reactive & Functional Polymers 2008, 68, 7, 1178-1184.
[127] Mengel, C., Esker, A. R., Meyer, W. H., and Wegner, G., Langmuir 2002, 18, 16, 6365-6372.
[128] Dragan, E. S., New trends in ionic (Co)polymers and hybrids, Nova Science Publishers, New York, 2007.
[129] Bayer, E., Geckeler, K., and Weingartner, K., Makromolekulare Chemie-Macromolecular Chemistry and Physics 1980, 181, 3, 585-593.
[130] Hart, R., Makromolekulare Chemie 1959, 32, 1, 51-56.
[131] Badesso, R. J., Nordquist, A. F., Pinschmidt, R. K., and Sagl, D. J., Hydrophilic Polymers 1996, 248, 489-504.
[132] Pinschmidt, R. K., Renz, W. L., Carroll, W. E., Yacoub, K., Drescher, J., Nordquist, A. F., and Chen, N., Journal of Macromolecular Science-Pure and Applied Chemistry 1997, A34, 10, 1885-1905.
[133] Gu, L., Zhu, S., and Hrymak, A. N., Journal of Applied Polymer Science 2002, 86, 13, 3412-3419.
[134] Serizawa, T., Yamamoto, K., and Akashi, M., Langmuir 1999, 15, 13, 4682-4684.
[135] Spange, S., Wolf, S., and Simon, F., Progress in Colloid and Polymer Science 2006, 132, 110-116.

References 111
[136] Yamamoto, K., Imamura, Y., Nagatomo, E., Serizawa, T., Muraoka, Y., and Akashi, M., Journal of Applied Polymer Science 2003, 89, 5, 1277-1283.
[137] Roth, I. and Spange, S., Macromolecular Rapid Communications 2001, 22, 15, 1288-1291.
[138] Kugel, R., In "Metachromasy as an Indicator of Polycation Conformations in Aqueous Solution," Focus on ionic polymer, edited by E. S. Dragan Research Signpost, Kerala, India, 2006, pp. 93-116.
[139] Hochberg, G. C., Colloid and Polymer Science 1994, 272, 4, 409-415.
[140] Gummow, B. D. and Roberts, G. A. F., Makromolekulare Chemie-Rapid Communications 1985, 6, 6, 381-386.
[141] Tashiro, T., Journal of Applied Polymer Science 1990, 39, 11-12, 2279-2291.
[142] Advincula, R. C., Fells, E., and Park, M. K., Chemistry of Materials 2001, 13, 9, 2870-2878.
[143] Strekowski, L., Heterocyclic polymethine dyes synthesis, properties and applications, Springer, Berlin, 2008.
[144] Takagishi, T., Sugimoto, T., Hayashi, A., and Kuroki, N., Journal of Polymer
Science Part A-Polymer Chemistry 1983, 21, 8, 2311-2322.
[145] Kim, W. S., Seo, K. H., and Lim, Y. J., Journal of Polymer Science Part A-Polymer Chemistry 1989, 27, 1, 389-392.
[146] Petzold, G., Dutschk, V., Mende, M., and Miller, R., Colloids and Surfaces A-Physicochemical and Engineering Aspects 2008, 319, 1-3, 43-50.
[147] Ujiie, H., Digital printing of textiles, CRC Press, Boca Raton, 2006.
[148] Tusek, L., Nitschke, M., Werner, C., Stana-Kleinschek, K., and Ribitsch, V., Colloids and Surfaces A-Physicochemical and Engineering Aspects 2001, 195, 1-3, 81-95.
[149] Roth, J., Albrecht, V., Nitschke, M., Bellmann, C., Simon, F., Zschoche, S., Michel, S., Luhmann, C., Grundke, K., and Voit, B., Langmuir 2008, 24, 21, 12603-12611.
[150] Burtovyy, O., Klep, V., Chen, H. C., Hu, R. K., Lin, C. C., and Luzinov, I., Journal of Macromolecular Science Part B-Physics 2007, 46, 1, 137-154.
[151] Pleul, D. and Simon, F., In “X-Ray Photoelectron Spectroscopy," Polymer Surfaces and Interfaces, edited by M. Stamm Springer-Verlag Berlin, Heidelberg, 2008, pp. 71.
[152] Sabbatini, L. and Zambonin, P. G., Surface characterization of advanced polymers, VCH, Weinheim Germany, 1993.

References 112
[153] Brune, D., Surface characterization a user's sourcebook, Scandinavian Science Publisher, Oslo, 1997.
[154] Beamson, G. and Briggs, D. J., High resolution XPS of organic polymers the
Scienta ESCA300 database, Wiley, Chichester England, 1992. [155] Shirley, D. A., Phys.Rev B 1972, 5, 12, 4709-4714.
[156] Favia, P., Stendardo, M. V., and d'Agostino, R., Plasmas Polym 1996, 1, 2, 91-112.
[157] Choukourov, A., Kousal, J., Slavinska, D., Biederman, H., Fuoco, E. R., Tepavcevic, S., Saucedo, J., and Hanley, L., Vacuum 2004, 75, 3, 195-205.
[158] Nitschke, M., Schmack, G., Janke, A., Simon, F., Pleul, D., and Werner, C., Journal of Biomedical Materials Research 2002, 59, 4, 632-638.
[159] Keen, I., Broota, P., Rintoul, L., Fredericks, P., Trau, M., and Grondahl, L., Biomacromolecules 2006, 7, 2, 427-434.
[160] Ribitsch, V. and Stana-Kleinschek, K., Textile Research Journal 1998, 68, 10, 701-707.
[161] Janhom, S., Watanesk, R., Watanesk, S., Griffiths, P., Arquero, O. A., and Naksata, W., Dyes and Pigments 2006, 71, 3, 188-193.
[162] Campagne, C., Devaux, E., Perwuelz, A., and Caze, C., Polymer 2002, 43, 25, 6669-6676.
[163] Stawski, D. and Bellmann, C., Colloids and Surfaces A-Physicochemical and Engineering Aspects 2009, 345, 1-3, 191-194.
[164] Grundke, K., In "Characterization of Polymer Surfaces by Wetting and Electrokinetic Measurements - Contact Angle, Interfacial Tension, Zeta Potential," Polymer Surfaces and Interfaces, edited by M. Stamm Springer-Verlag Berlin, Heidelberg, 2008, pp. 103.
[165] Fadel, H., Schwarz, S., Lunkwitz, K., and Jacobasch, H. J., Angewandte Makromolekulare Chemie 1998, 263, 79-84.
[166] Stern, O. Z., Elektrochemistry 1924, 30, 508-516.
[167] Grahame, D. C., Journal of Chemical Physics 1948, 16, 12, 1117-1123.
[168] Jacobasch, H. J., Simon, F., Werner, C., and Bellmann, C., Technisches Messen 1996, 63, 12, 447-452.
[169] Dutschk, V., Sabbatovskiy, K. G., Stolz, M., Grundke, K., and Rudoy, V. M., Journal of Colloid and Interface Science 2003, 267, 2, 456-462.
[170] Zenkiewicz, M., Czuprynska, J., Polanski, J., Karasiewicz, T., and Engelgard, W., Radiation Physics and Chemistry 2008, 77, 2, 146-153.

References 113
[171] Zukiene, K., Jankauskaite, V., and Petraitiene, S., Applied Surface Science 2006, 253, 2, 966-973.
[172] Amirshahi, S. H. and Pailthorpe, M. T., Dyes and Pigments 1994, 26, 2, 121-128.
[173] Alvarez, J. and Symonowicz, B. L., AUTEX Research Journal 2003, 3, 2, 72.
[174] Grum, C. J., Optical radiation measurments, Academic press, New York, 1980.
[175] Zhang, Y. Q., Westland, S., Cheung, V., Burkinshaw, S. M., and Blackburn, R. S., Coloration Technology 2009, 125, 6, 357-365.
[176] Xin, J. H. and Textile Institute, Total colour management in textiles, Woodhead Publishing in association with the Textile Institute, Cambridge, 2006.
[177] Chan, C. M., Ko, T. M., and Hiraoka, H., Surface Science Reports 1996, 24, 1-2, 3-54.
[178] Arefi-Khonsari, F., Tatoulian, M., Kurdi, J., Ben-Rejeb, S., and Amouroux, J., J.Photopolym.Sci.Technol 1998, 11, 277-292.
[179] Narushima, K., Yamashita, N., Fukuoka, M., Inagaki, N., Isono, Y., and Islam, M. R., Japanese Journal of Applied Physics Part 1-Regular Papers Brief Communications & Review Papers 2007, 46, 7A, 4238-4245.
[180] Gerenser, L. J., Grace, J. M., Apai, G., and Thomson, P. M., Surface and Interface Analysis 2000, 29, 1, 12-22.
[181] Pavon-Djavid, G., Gamble, L. J., Ciobanu, M., Gueguen, V., Castner, D. G., and Migonney, V., Biomacromolecules 2007, 8, 11, 3317-3325.
[182] Gupta, B., Hilborn, J. G., Bisson, I., and Frey, P., Journal of Applied Polymer Science 2001, 81, 12, 2993-3001.
[183] Morent, R., De Geyter, N., Leys, C., Gengembre, L., and Payen, E., Surface & Coatings Technology 2007, 201, 18, 7847-7854.
[184] Truica-Marasescu, F., Girard-Lauriault, P. L., Lippitz, A., Unger, W. E. S., and Wertheimer, M. R., Thin Solid Films 2008, 516, 21, 7406-7417.
[185] Girard-Lauriault, P. L., Desjardins, P., Unger, W. E. S., Lippitz, A., and Wertheimer, M. R., Plasma Processes and Polymers 2008, 5, 7, 631-644.
[186] Sarra-Bournet, C., Turgeon, S., Mantovani, D., and Laroche, G., Plasma Processes and Polymers 2006, 3, 6-7, 506-515.
[187] Kuhn, G., Weidner, S., Decker, R., Ghode, A., and Friedrich, J., Surface & Coatings Technology 1999, 116, 796-801.
[188] Joshi, R., Schulze, R. D., Meyer-Plath, A., and Friedrich, J. F., Plasma Processes and Polymers 2008, 5, 7, 695-707.
[189] Nitschke, M. and Meichsner, J., Journal of Applied Polymer Science 1997, 65, 2, 381-390.

References 114
[190] Vesel, A., Junkar, I., Cvelbar, U., Kovac, J., and Mozetic, M., Surface and Interface Analysis 2008, 40, 11, 1444-1453.
[191] Inagaki, N., Narushima, K., Hashimoto, H., and Tamura, K., Carbon 2007, 45, 4, 797-804.
[192] Bubert, H., Ai, X., Haiber, S., Heintze, M., Bruser, V., Pasch, E., Brandl, W., and Marginean, G., Spectrochimica Acta Part B-Atomic Spectroscopy 2002, 57, 10, 1601-1610.
[193] Rulison, K. C., Laboratory Services and Instrumentation for Surface Science, Technical Note 302, Charlotte, NC, Krüss USA, 1996.
[194] Lane, J. M. and Hourston, D. J., Progress in Organic Coatings 1993, 21, 4, 269-284.
[195] Le, Q. T., Pireaux, J. J., and Caudano, R., Journal of Adhesion Science and Technology 1997, 11, 5, 735-751.
[196] Bhat, N. V. and Upadhyay, D. J., Journal of Applied Polymer Science 2002, 86, 4, 925-936.
[197] Gerenser, L. J., Journal of Adhesion Science and Technology 1993, 7, 10, 1019-1040.
[198] Strobel, M., Lyons, C. S., Strobel, J. M., and Kapaun, R. S., Journal of Adhesion Science and Technology 1992, 6, 4, 429-443.
[199] Leroux, F., Perwuelz, A., Campagne, C., and Behary, N., Journal of Adhesion Science and Technology 2006, 20, 9, 939-957.
[200] Borcia, G., Anderson, C. A., and Brown, N. M. D., Applied Surface Science 2004, 225, 1-4, 186-197.
[201] Boenig, H. V., Fundamentals of plasma chemistry and technology, Technomic Pub. Co, Lancaster, 1988.
[202] Kuzuya, M., Ishikawa, M., Noguchi, A., Ito, H., Kamiya, K., and Kawaguchi, T., Journal of Materials Chemistry 1991, 1, 3, 387-391.
[203] Yasuda, H., Plasma polymerization, Academic Press, Orlando, 1985.
[204] Wakida, T., Takeda, K., Tanaka, I., and Takagishi, T., Textile Research Journal 1989, 59, 1, 49-53.
[205] Petzold, G., Schwarz, S., Buchhammer, H. M., and Lunkwitz, K., Angewandte Makromolekulare Chemie 1997, 253, 1-15.
[206] Kotz, J., Kosmella, S., and Beitz, T., Progress in Polymer Science 2001, 26, 8, 1199-1232.
[207] Bohme, U. and Scheler, U., Advances in Colloid and Interface Science 2010, 158, 1-2, 63-67.

References 115
[208] Rosunee, S., Carr, C. M., Hibbert, S., and Jones, C., Journal of Materials Science 2003, 38, 2179-2185.
[209] Schonhoff, M., Current Opinion in Colloid & Interface Science 2003, 8, 1, 86-95.
[210] Kostler, S., Ribitsch, V., Stana-Kleinschek, K., Jakopic, G., and Strnad, S., Colloids and Surfaces A-Physicochemical and Engineering Aspects 2005, 270, 107-114.
[211] Shen, J. J., Ren, L. L., and Zhuang, Y. Y., Journal of Hazardous Materials 2006, 136, 3, 809-815.
[212] Ogawa, M., Kawai, R., and Kuroda, K., Journal of Physical Chemistry 1996, 100, 40, 16218-16221.
[213] Ogawa, M., Chemistry of Materials 1996, 8, 7, 1347
[214] Takagi, S., Shimada, T., Eguchi, M., Yui, T., Yoshida, H., Tryk, D. A., and Inoue, H., Langmuir 2002, 18, 6, 2265-2272.
[215] Voigt, I., Simon, F., Esthel, K., Spange, S., and Friedrich, M., Langmuir 2001, 17, 26, 8355-8361.
[216] Bairagi, N., Gulrajani, M. L., Deopura, B. L., and Shrivastava, A., Coloration Technology 2005, 121, 6, 320-324.
[217] Dong, Y., Lyoo, W. S., and Jang, J., Fibers and Polymers 2010, 11, 2, 213-217.
[218] Molina, R., Espinos, J. P., Yubero, F., Erra, P., and Gonzalez-Elipe, A. R., Applied Surface Science 2005, 252, 5, 1417-1429.
[219] Cook, H. D., and Smith, I.T., Appl.Polym.Symp 1971, 18, 663-672.

Selbständigkeitserklärung 116
7 Selbständigkeitserklärung
Hiermit erkläre ich des Eides statt, die vorliegende Arbeit selbstständig und ohne
unerlaubte Hilfsmittel durchgeführt zu haben.
Chemnitz, den 01.11.2011 Tarek Salem

Curriculum Vitae 117
8 Curriculum Vitae
Personal Data
Name: Tarek Sayed Mohamed Salem
Date of Birth: 10th October 1974
Place of Birth: Kaluibya, Egypt
Nationality : Egyptian
Marital Status: Married
Permanent address: National Research Centre, Tahrir St., Dokki-Cairo 12311-Egypt Textile Research Division
E-mail: [email protected], [email protected]
Education
1993-1997 B.Sc. [Chemistry] with degree (very good with honors), Chemistry department, faculty of Science, Cairo University, Egypt.
2001-2004 M.Sc. [Organic Chemistry], Chemistry department, Faculty of Science, Cairo University, Egypt.
Thesis is entitled “Studies on heat transfer printing of some natural and synthetic fabrics”.
3/2009-2011 Doctoral candidate in Chemistry department, faculty of Science, Chemnitz University, Germany.
Research Experiences
2002-2004 Assistant researcher, Textile research division, dyeing, printing and auxiliaries dept., NRC. Cairo, Egypt.
2004-2007 Researcher assistant, Textile research division, dyeing, printing and auxiliaries dept., NRC. Cairo, Egypt.
2007-2011 Guest Scientist in the polymer Interfaces dept. Leibniz-Institute for polymer research Dresden e.V., Germany

Publications from this work 118
Publications from this work
List of publications
1. Tarek Salem, Steffi Uhlmann, Mirko Nitschke, Alfredo Calvimontes, Rolf-Dieter
Hund, Frank Simon “Modification of plasma pre-treated PET fabrics with poly-
DADMAC and its surface activity towards acid dyes” Progress in Organic
Coatings 72 (2011) 168– 174.
2. Tarek Salem, Dieter Pleul, Mirko Nitschke, Frank Simon “Interaction of anionic
dyes with polyester surface modified by low pressure plasma-based
treatments” Applied surface science (2011) submitted for publication.
Contributions to workshops/conferences
Talk
1. Tarek Salem, Steffi Uhlmann, Mirko Nitschke, Alfredo Calvimontes, Rolf-Dieter
Hund, and Frank Simon.” Modification of plasma pre-treated PET fabrics with
poly-DADMAC and its surface activity towards acid dyes” the XXX FATIPEC
congress, November 9 - 11, 2010, Genoa, Italy.
2. Tarek Salem “PET surface properties affected by Low temperature plasma
modification“ XVI. Erfahrungsaustausch Oberflächentechnologie mit Plasma- und
Ionenstrahlprozessen,March 10-12, 2009, Mühlleithen / Vogtland, Germany.
Poster
1. Tarek Salem, Steffi Uhlmann, Mirko Nitschke, Alfredo Calvimontes, Rolf-Dieter
Hund, and Frank Simon.” Surface modification of PET to improve their
printing behavior ” 16th Neues Dresdner Vakuumtechnisches Kolloquium, October
16 - 17, 2008, Dresden, Germany.
Poster-talk
1. Tarek Salem, Dieter Pleul and Frank Simon.”Plasma-based surface
functionalization of polyester/wool fabric and its interaction with acid dyes”
5th Aachen-Dresden International Textile conference, November 24-25, 2011,
Aachen, Germany.

Publications from this work 119
2. Tarek Salem, Dieter Pleul, Mirko Nitschke, Rolf-Dieter Hund, and Frank Simon.
” Printing behavior of polyester fabrics modified with low-pressure plasma
based treatments” 4th Aachen-Dresden International Textile conference,
November 25 - 26, 2010, Aachen, Germany.
3. Tarek Salem, Steffi Uhlmann, Mirko Nitschke, Alfredo Calvimontes, Rolf-Dieter
Hund, and Frank Simon.” Modification of plasma pre-treated PET fabrics with
poly-DADMAC and its surface activity towards acid dyes” 3rd Aachen-Dresden
International Textile conference, November 26 - 27, 2009, Aachen, Germany.