surface modification of polyester fabrics by ozone and its
TRANSCRIPT

materials
Article
Surface Modification of Polyester Fabrics by Ozone and ItsEffect on Coloration Using Disperse Dyes
Rafaela Stefanie Gabardo 1, Dayane Samara de Carvalho Cotre 1 , Manuel José Lis Arias 2,* ,Murilo Pereira Moisés 3, Bruna Thaisa Martins Ferreira 4 , Rafael Block Samulewski 3 , Juan P. Hinestroza 5
and Fabricio Maestá Bezerra 1
�����������������
Citation: Gabardo, R.S.; de Carvalho
Cotre, D.S.; Lis Arias, M.J.; Moisés,
M.P.; Martins Ferreira, B.T.;
Samulewski, R.B.; Hinestroza, J.P.;
Bezerra, F.M. Surface Modification of
Polyester Fabrics by Ozone and Its
Effect on Coloration Using Disperse
Dyes. Materials 2021, 14, 3492.
https://doi.org/10.3390/ma14133492
Academic Editor: Gerald
Anthony Murphy
Received: 30 April 2021
Accepted: 18 June 2021
Published: 23 June 2021
Publisher’s Note: MDPI stays neutral
with regard to jurisdictional claims in
published maps and institutional affil-
iations.
Copyright: © 2021 by the authors.
Licensee MDPI, Basel, Switzerland.
This article is an open access article
distributed under the terms and
conditions of the Creative Commons
Attribution (CC BY) license (https://
creativecommons.org/licenses/by/
4.0/).
1 Textile Engineering (COENT), Universidade Tecnológica Federal do Paraná (UTFPR),Apucarana 86812-460, Brazil; [email protected] (R.S.G.);[email protected] (D.S.d.C.C.); [email protected] (F.M.B.)
2 Textile Research Institute of Terrassa (INTEXTER-UPC), Terrassa, 0822 Barcelona, Spain3 Chemistry Graduation (COLIQ), Universidade Tecnológica Federal do Paraná (UTFPR),
Apucarana 86812-460, Brazil; [email protected] (M.P.M.); [email protected] (R.B.S.)4 Graduate Program in Chemical Engineering (PEQ-UEM), State University of Maringá (UEM),
Maringá 87020-900, Brazil; [email protected] Department of Fiber Science and Apparel Design, Cornell University, Ithaca, NY 14853, USA;
[email protected]* Correspondence: [email protected]; Tel.: +34-937-398-045
Abstract: Polyester fibers (PES) are the most consumed textile fibers due to their low water absorption;non-ionic character and high crystallinity. However, due to their chemical structure, the chemicalinteractions between polyester, finishing products, and dyes are quite challenging. We report on theuse of ozone to modify the surface of polyester fibers with the goal of improving the interaction ofthe modified surface with finishing compounds and dyes. We used C.I. Disperse Yellow 211 to dyeozone-treated polyester fabrics and evaluated the effects of ozone treatment using FTIR-ATR, Ramanspectroscopy, SEM imaging, rubbing tests, and capillarity measurements. We evaluated the dyeingperformance via color analysis, and determined the dyeing kinetics. Experimental results indicatethat the modification of polyester fabrics with ozone is a feasible pre-treatment that improves dyeingefficiency allowing better solidity of color and a decrease in the amount of dye required.
Keywords: dyeing; surface modification; ozone; polyester
1. Introduction
Most waste generated by the textile industry [1], is composed of organic and inor-ganic compounds generated during textile dyeing [2,3]. These compounds are difficult toeliminate by traditional effluent treatment processes [2,4–6], due to the excessive content ofsuspended solids, and the presence of surfactants, detergents, and dyes [7]. The textile sec-tor is also characterized by high competition, stimulated by economic, consumerism, andglobalization factors, seeking improvements to reduce its expenses and costs, maintainingthe quality of the product and contributing to sustainability [8].
Among the materials used by the textile industry, polyester is considered the mostconsumed synthetic fiber in the world, being able to integrate different types of productsthat unfold in the textile chain [9]. However, the dyeing of polyester fibers with disperseddyes is a complex process as it resembles a solid-on-solid dispersion and encountersconsiderable difficulties due to the absence of reactive sites, which gives this type of fibera hydrophobic character [10]. In this context, it is possible to make a modification onthe polyester fiber in order to improve its hydrophilicity and, consequently, facilitate theabsorption of the dyes.
Many publications have shown the difficulty for treatment of textile effluents, pointingout to the excess content of solids present, in addition of surfactants, detergents, and
Materials 2021, 14, 3492. https://doi.org/10.3390/ma14133492 https://www.mdpi.com/journal/materials

Materials 2021, 14, 3492 2 of 12
dyes [3,6,9,10]. An alternative to facilitate treatment is to reduce the consumption of dyeswithout losing the characteristics of the article, especially the coloring. Thus, surfacemodification processes can create reactive sites and increase the adsorption of dye bythe fiber hence reducing the amount of pollutants in the effluents. In the search for newtechnologies to improve the dyeing process, the use of ozone gas (O3) has emerged as aviable alternative [11], as ozone treatments have the capability to improve the wettabilityof the polyester fibers [12,13], and to use less water during the dyeing process [9,14–17].
According to Wakida et al. [18], ozone treatments alter both, the fiber’s surface and itsinternal structure [19]. Several authors [10,17,20] have also found that ozone treatment hasthe potential of lower energy consumption during the processing of polyester fibers.
Thus, it is expected that from the use of polyester surface modification with ozone, itwill be possible to obtain a more hydrophilic fabric, making it possible to have a dyeingprocess with less amounts of dye. The absorption of dyes into porous media comprisesseveral steps. Initially, there is mass transfer from the bulk liquid media (dyeing bath),through the boundary layer to the external surface of the fiber, followed by diffusional dyetransport inside the fiber.
Kinetic models describing this absorption phenomena use two approaches: (i) Modelsbased on adsorption reaction models such as the pseudo-first order (PFO) [21] and pseudosecond order (PSO) [22], models which assume that the adsorption process is exclusivelycontrolled by the adsorption rate of the solute on the surface of the adsorbent, and neglectintraparticle diffusion and external mass transfer; (ii) intra-particle diffusion models, whichassume that equilibrium between fluid and surface concentrations of dye, are instanta-neously reached inside the pores [23], therefore simplifying the dyeing process to a simplemass transfer process.
In this paper, we report on the use of ozone gas to modify surface of polyester fibers,and the effect of this ozone pre-treatment on the dyeing of these fibers using disperse dyes.
2. Materials and Methods2.1. Materials
Polyester plain weave 100% (160 ± 5 gm−2), 20 Tex warp yarn (24 yarns/cm), 6.25 Texweft yarn (24 yarns/cm) were provided by the Polytechnic University of Catalunya (UPC),C.I. Disperse Yellow 211 dye was provided by Golden Technology (São José dos Campos,Brazil). Blue Turquoise Solae GLL, (NH4)2SO4, and sodium bisulphite, were purchasedfrom Sigma Aldrich (Saint Louis, MO, USA).
2.2. Polyester Modification by O3
Ozone modification was performed using a UV-SURF X4 (UV-Consulting PeschlEspaña, Spain) equipment, 17 W power, and an emission spectrum varying from 185 to254 nm. Polyester samples of 10 cm × 20 cm were inserted into the equipment’s chamberand exposed for 20, 30, and 45 min to ozone produced by low-pressure mercury lamps.
2.3. Evaluation of Modified Fabric
FTIR-ATR spectroscopy was performed using a Frontier—Perkin Elmer, 64 scans witha resolution of 1 cm−1 using attenuated total reflectance (ATR) in the range between 650and 4000 cm−1. Raman spectroscopy measurements were carried out using an Alpha300 R spectrometer—Witec, containing a double monochromator, a 532 nm laser and amicroscope with a 20× objective lens; 532 nm laser excitation lines were used. The laserpower on the surface of the samples was approximately 7.5 mW cm−2 with an integrationtime of 3 s and a total of 10 scans. Zeta potential measurements were obtained in a ZetasizerNano from Malvern Instruments. The readings were performed in triplicate on both sidesof each sample at pH 6 and 25 ◦C. For the capillarity tests, a method was adapted fromstandard JIS L 1907—(Testing methods for water absorbency of textiles). Samples werecut into 20 × 2.5 cm strips and 1 cm of this strip was immersed in a solution containing a

Materials 2021, 14, 3492 3 of 12
reactive dye Blue Turquoise Solae GLL. After 10 min, the height of the dye absorbed bycapillarity was measured.
2.4. Dyeing
We perform the exhaustion dyeing experiments in a Mathis ALT-1-B mug machine,with a bath ratio of 1:30 (m:v) and 5 g of fabric sample. Total of 2 g·L−1 of ammoniumsulfate (pH control 5–5.5), 1.5 g·L−1 of non-ionic wetting agent, and 1% of w (over fiberweight) of C.I. Dispersed yellow 211 dye were added at 130 ◦C for 30 min. At the end of theprocess, reductive washing was performed using a solution containing 2 g·L−1 of sodiumhydrosulfite and 3 g·L−1 of sodium hydroxide (50◦ BÉ) at 80 ◦C for 20 min.
2.5. Evaluation of Polyester Fabrics after Dyeing2.5.1. Color Rating
The color evaluation of the samples was performed using a DataColor spectropho-tometer, spectraflesh model SF650X, and the i7 Delta Color software. The evaluation wasperformed under illuminant D65, which generates trichromatic coordinates, arranged inthe CIE L*a*b* space. The color difference between the treated and untreated samples wascalculated using ∆E and ∆Ecmc.
The color strength was calculated using Equation (1) and the percentage of dyereduction was obtained via Equation (2).
Strenght(%) =
(KS sample
KS standard
)× 100 (1)
where K/S is assumed to represent the color intensity.
Q% =100− Strenght (%)
Strength (%)(2)
For Equation (2), in order to obtain the same color strength, if Q% > 0, it indicates thatthe amount of dye required must be increased and for values of Q% < 0, the amount of dyemust be reduced.
2.5.2. Morphological Analysis
The surface of the fabric samples was imaged using a scanning electron microscopy(SEM Quanta 250) with an accelerating voltage of 20 kV, Spot 3.5, and magnification levelsof 1500 and 4000×.
2.5.3. Fastness to Rubbing Tests
The color fastness to rubbing test was carried out on a KIMAK crock meter (Kimak,Brazil), under dry and wet conditions. The specimens were compared to the gray scale(BSI Standards) in accordance to the Test for colour fastness—Part X12: Colour fastness torubbing, ISO 105-X12 [24].
2.5.4. Dyeing Kinetics
Kinetic data were obtained using a Smart Liquor equipment (Mathis®). During thedyeing process, the equipment measures the absorbance of the bath and generates dyedepletion curves as a function of time at a rate of 6 scans per minute. These data wereused to study the kinetics of the process by fitting to three kinetic models: pseudo-firstorder [21], pseudo-second order [22], and Weber and Morris intraparticle model (WM) [25].
3. Results3.1. Evaluation of Surface Modification
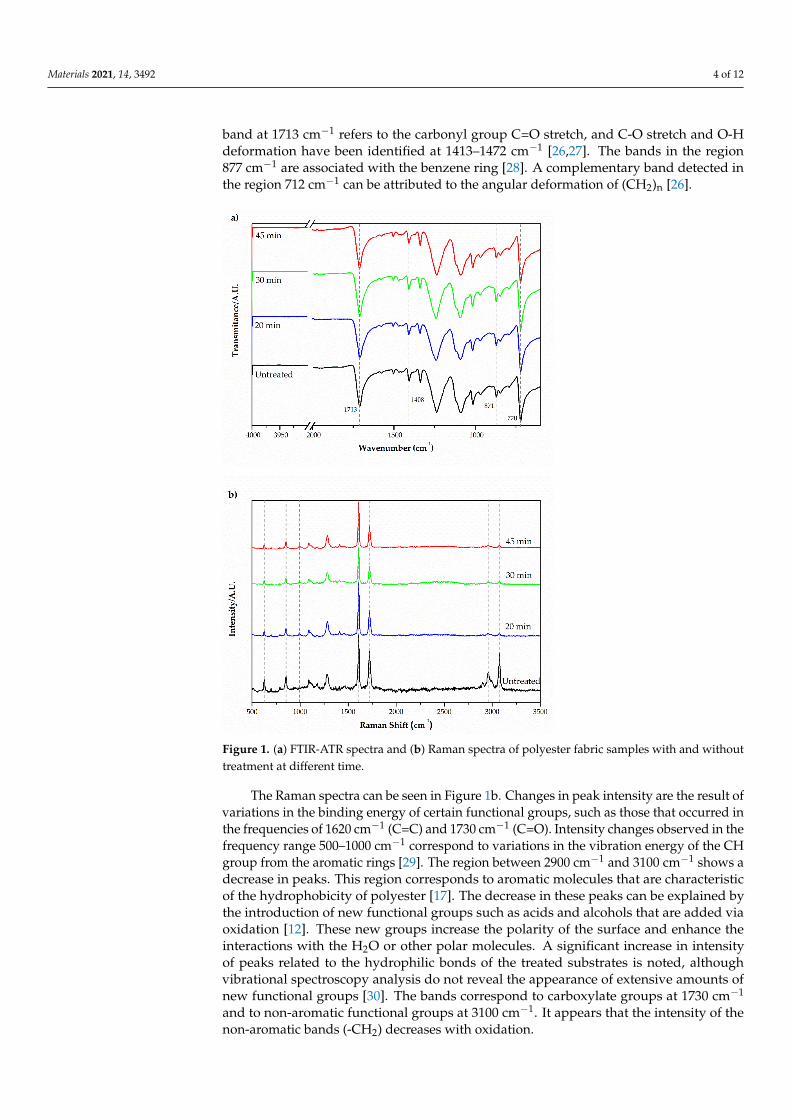
FTIR-ATR spectra of the samples is shown in Figure 1a. The characteristic bandshave been identified and correlated with the chemical structure of the polyester fiber. The
Materials 2021, 14, 3492 4 of 12
band at 1713 cm−1 refers to the carbonyl group C=O stretch, and C-O stretch and O-Hdeformation have been identified at 1413–1472 cm−1 [26,27]. The bands in the region877 cm−1 are associated with the benzene ring [28]. A complementary band detected inthe region 712 cm−1 can be attributed to the angular deformation of (CH2)n [26].
Materials 2021, 14, x FOR PEER REVIEW 4 of 14
depletion curves as a function of time at a rate of 6 scans per minute. These data were used to study the kinetics of the process by fitting to three kinetic models: pseudo-first order [21], pseudo-second order [22], and Weber and Morris intraparticle model (WM) [25].
3. Results 3.1. Evaluation of Surface Modification
FTIR-ATR spectra of the samples is shown in Figure 1a. The characteristic bands have been identified and correlated with the chemical structure of the polyester fiber. The band at 1713 cm−1 refers to the carbonyl group C=O stretch, and C-O stretch and O-H deformation have been identified at 1413–1472 cm−1 [26,27]. The bands in the region 877 cm−1 are associated with the benzene ring [28]. A complementary band detected in the region 712 cm−1 can be attributed to the angular deformation of (CH2)n [26].
Figure 1. (a) FTIR-ATR spectra and (b) Raman spectra of polyester fabric samples with and without treatment at different time.
Figure 1. (a) FTIR-ATR spectra and (b) Raman spectra of polyester fabric samples with and withouttreatment at different time.
The Raman spectra can be seen in Figure 1b. Changes in peak intensity are the result ofvariations in the binding energy of certain functional groups, such as those that occurred inthe frequencies of 1620 cm−1 (C=C) and 1730 cm−1 (C=O). Intensity changes observed in thefrequency range 500–1000 cm−1 correspond to variations in the vibration energy of the CHgroup from the aromatic rings [29]. The region between 2900 cm−1 and 3100 cm−1 shows adecrease in peaks. This region corresponds to aromatic molecules that are characteristicof the hydrophobicity of polyester [17]. The decrease in these peaks can be explained bythe introduction of new functional groups such as acids and alcohols that are added viaoxidation [12]. These new groups increase the polarity of the surface and enhance theinteractions with the H2O or other polar molecules. A significant increase in intensityof peaks related to the hydrophilic bonds of the treated substrates is noted, althoughvibrational spectroscopy analysis do not reveal the appearance of extensive amounts ofnew functional groups [30]. The bands correspond to carboxylate groups at 1730 cm−1
and to non-aromatic functional groups at 3100 cm−1. It appears that the intensity of thenon-aromatic bands (-CH2) decreases with oxidation.

Materials 2021, 14, 3492 5 of 12
Change in the surface of polyester fabric can also be probed via Zeta potential mea-surements. The values for Zeta potential and pH before and after a 20 min of ozoneexposure can be seen in Table 1. Table 1 illustrates a significant decrease in the Zeta poten-tial after ozone exposure. In addition, the pH referring to the zero-charge potential of thesurface, also decreases upon ozone exposure. With an increase in the number of carboxylicfunctional groups, an increase in the negativity of the Zeta potential is expected as thedissociation of the functional groups in the water/fabric interface leads to the formation ofnegatively charged groups. The decrease in the pH value of the neutral surface corroboratesthe previous spectroscopy measurements. The increase in the number of carboxylic groups,as observed by Raman spectroscopy, leads to an increase in the possibility of deprotonationand, consequently to a decrease in the values of pH and Zeta potential.
Table 1. Results of Zeta potential of polyester samples before and after 20 min of ozone treatment.
Sample Side Potential Zeta/mV pH
Untreated A −3.92 ± 0.08 6.14 ± 0.03B −3.65 ± 0.02 6.15 ± 0.03
Ozone 20 min treated A −8.22 ± 0.26 6.04 ± 0.03B −7.46 ± 0.15 6.05 ± 0.03
Figure 2 illustrates the dyeing mechanism for C.I. Disperse Yellow 211 dye andpolyester fiber. The ozone modification creates highly polar ions of carboxylate andhydroxyl groups on the surface of the polyester which increase the hydrophilicity of thesamples. Burkinshaw [31] showed that polyester fibers and dyes of the dispersed typehave weak interactions (London type). However, with the modification of the surface byozone, carboxylate groups offer possibilities for stronger interactions, such as hydrogenbonding between the surface -OH groups and the functional groups highlighted in redin Figure 3. It is also possible that an azo-hydrazone resonance d from the disperse dyecould contribute to the formation of hydrogen bonding with ester and carboxylate groupsof modified polyester, hence contributing to better interaction between dye and fabric.
Materials 2021, 14, x FOR PEER REVIEW 6 of 14
Figure 2. Dyeing mechanism of the C.I. Disperse Yellow 211 dye and polyester fibers.
These structural changes revealed by the infrared and Raman spectroscopy as well as the Zeta potential measurements may be reflected in the capillarity of the textile sample; Table 2 shows a capillarity analysis of the samples. Sample expose to ozone exhibits greater absorption as the oxidation induced by the ozone treatment appears to cause changes in both the surface and the internal structure of the polymer [32]. According to Burkinshaw [31], polyester has a low water adsorption due to the hydrophobicity of its surface groups, hence ozone treatment, which produces carboxyl and hydroxyl groups, may impart greater hydrophilicity [20]. We also observed that after a prolonged exposure of the fabric to ozone, a loss of absorption occurs. This behavior may be explained as ra-diation can causes degradation and erosion in the specimens [12].
Table 2. Capillarity tests for polyester fabrics as a function of ozone treatment at different exposure times.
Sample Absorption Height (cm) Untreated 0
Ozone treated 20 min 2 Ozone treated 30 min 1 Ozone treated 45 min 0.5
Figure 2. Dyeing mechanism of the C.I. Disperse Yellow 211 dye and polyester fibers.

Materials 2021, 14, 3492 6 of 12
Materials 2021, 14, x FOR PEER REVIEW 8 of 14
Figure 3. Scanning electron microscopy images of polyester fabrics after reducing bath. (a) Original simple, non-treated (b) treated with Ozone 20 min.
Table 5 shows the results from the friction fastness test according to ISO 105-X12 [24]. The sample exposed to 20 min of ozone, had a gray scale score of 5 for both tests, dry and wet, so, no color change was detected after the rubbing. The same behavior was noted for the sample exposed to ozone for 45 min.
Table 5. Polyester fabric friction fastness score of samples.
Sample Score Dry Score Wet Untreated 4 4
Ozone treated 20 min 5 5 Ozone treated 30 min 4 5 Ozone treated 45 min 4 4
The time required for maximum dye adsorption is called equilibrium time, after which the adsorption remains constant. Figure 4a shows the adsorption times for two samples of fabric, one being treated with ozone and one without treatment. Figure 4a shows an equilibrium time of 72 min for both samples. The kinetic data for the dyeing processes was analyzed according to the kinetic models of pseudo-first order, pseudo-second order, and the Weber and Morris intraparticle diffusion models. The fitting results are shown in Figure 4.
Table 6 shows the parameters of the kinetic models obtained by adjusting the models to the experimental data for the untreated and treated samples. None of the adopted mod-els showed good agreement, indicating that the dye adsorption process may be taking place in more than one stage. In the case of polyester, the interaction of the dispersed dye with the fiber occurs as a function of temperature, since its increase causes the fibers to swell, allowing the dye to be inserted [35]. As swelling is not uniform, and the initial in-teraction between dye and fiber is greater on the surface layer, it can be understood that there is more than one diffusion process. These processes occur until the formation of the horizontal asymptote, with qe = 40.23 g·kg−1 and 44.55 g·kg−1 for treated and untreated ma-terial, an increase in adsorption of 10.74%. These results are similar to those reported by
Figure 3. Scanning electron microscopy images of polyester fabrics after reducing bath. (a) Originalsimple, non-treated (b) treated with Ozone 20 min.
These structural changes revealed by the infrared and Raman spectroscopy as well asthe Zeta potential measurements may be reflected in the capillarity of the textile sample;Table 2 shows a capillarity analysis of the samples. Sample expose to ozone exhibitsgreater absorption as the oxidation induced by the ozone treatment appears to causechanges in both the surface and the internal structure of the polymer [32]. According toBurkinshaw [31], polyester has a low water adsorption due to the hydrophobicity of itssurface groups, hence ozone treatment, which produces carboxyl and hydroxyl groups,may impart greater hydrophilicity [20]. We also observed that after a prolonged exposureof the fabric to ozone, a loss of absorption occurs. This behavior may be explained asradiation can causes degradation and erosion in the specimens [12].
Table 2. Capillarity tests for polyester fabrics as a function of ozone treatment at different expo-sure times.
Sample Absorption Height (cm)
Untreated 0Ozone treated 20 min 2Ozone treated 30 min 1Ozone treated 45 min 0.5
3.2. Color Analysis
All samples had an ∆E > 1, which characterizes that none of the samples dyed after thesurface modification has the same color as the standard sample. However, when analyzedusing the CMC method, only sample 1 has ∆ECMC > 1. The CMC method has a bettercolorimetric correlation between visual and tolerance assessments [33]. The sample exposedto 20 min to ozone showed a more reddish color (∆a = 2.57) and a greater color strength, of108.65%. The data in Table 3 is in agreement with data reported by Fattahi et al. [13], whoalso showed that a pre-treatment with ozone increases the intensity of the color.

Materials 2021, 14, 3492 7 of 12
Table 3. Color assessment of ozone-treated polyester fabrics compared to untreated fabric.
ParametersOzone Treated (min)
20 30 40
∆L 0.04 0.89 0.96∆a 2.57 0.96 1.00∆b 1.44 2.13 1.99∆C 1.19 2.02 1.87∆H −2.70 −1.17 −1.20∆E 2.95 2.52 2.40
∆ECMC 1.36 0.90 0.87Strength (%) 108.65 104.08 103.58
Table 4 shows the values of the percentage of dye reduction in the bath, in which theuntreated fiber was considered as the standard condition.
Table 4. Correction of the dyeing bath in % of dye to be removed.
Ozone Treated Sample (min) % Dye to Be Removed from the Bath
20 −7.96%30 −3.92%45 −3.46%
According to Table 4, an increase in the time of exposure of the fabric to ozone, meansa decrease in the dye to be removed from the bath. These values do illustrate the benefitsof ozone treatment and are in agreement with the Rahmatinejad et al.’s [14].
The results of the color evaluation also indicate an ozone exposure of 20 min shouldnot be exceeded in order to avoid changes in the color shade and are in agreement with thework of Eren and Anis [17]. These results confirm that the modification of the polyesterstructure by ozone can save energy and time, since it is possible to dye faster and to reducethe amount of dye required [10].
Figure 3 shows the morphology of the samples. The images show an agglomerateddye clusters in the fibers that received the ozone treatment (Figure 3b). The increase in thedye-fiber interaction can be related to the formation of carboxylate groups during the ozoneexposure [34] which contribute to increased hydrophilicity and enable greater penetrationof the dye into the fiber.
Table 5 shows the results from the friction fastness test according to ISO 105-X12 [24].The sample exposed to 20 min of ozone, had a gray scale score of 5 for both tests, dry andwet, so, no color change was detected after the rubbing. The same behavior was noted forthe sample exposed to ozone for 45 min.
Table 5. Polyester fabric friction fastness score of samples.
Sample Score Dry Score Wet
Untreated 4 4Ozone treated 20 min 5 5Ozone treated 30 min 4 5Ozone treated 45 min 4 4
The time required for maximum dye adsorption is called equilibrium time, after whichthe adsorption remains constant. Figure 4a shows the adsorption times for two samplesof fabric, one being treated with ozone and one without treatment. Figure 4a shows anequilibrium time of 72 min for both samples. The kinetic data for the dyeing processeswas analyzed according to the kinetic models of pseudo-first order, pseudo-second order,and the Weber and Morris intraparticle diffusion models. The fitting results are shown inFigure 4.

Materials 2021, 14, 3492 8 of 12
Materials 2021, 14, x FOR PEER REVIEW 9 of 14
Lee et al. [32], which indicate an increase in dye adsorption as a function of ozone expo-sure.
Figure 4. (a) Adsorption shape of DY211 dye in treated and untreated polyester fabric over time;(b) kinetic models adjustment for sample without treatment; (c) kinetic models adjustment fortreated sample.

Materials 2021, 14, 3492 9 of 12
Table 6 shows the parameters of the kinetic models obtained by adjusting the modelsto the experimental data for the untreated and treated samples. None of the adoptedmodels showed good agreement, indicating that the dye adsorption process may be takingplace in more than one stage. In the case of polyester, the interaction of the disperseddye with the fiber occurs as a function of temperature, since its increase causes the fibersto swell, allowing the dye to be inserted [35]. As swelling is not uniform, and the initialinteraction between dye and fiber is greater on the surface layer, it can be understood thatthere is more than one diffusion process. These processes occur until the formation of thehorizontal asymptote, with qe = 40.23 g·kg−1 and 44.55 g·kg−1 for treated and untreatedmaterial, an increase in adsorption of 10.74%. These results are similar to those reported byLee et al. [32], which indicate an increase in dye adsorption as a function of ozone exposure.
Table 6. Kinetic parameters for the non-linear models of adsorption.
Sample Parameter PFO PSO WM
Untreated
qe 59.51493 ± 7.20762 98.38993 ± 17.53605 -k1 0.01403 ± 0.00274 - -k2 - 0.00009 ± 0.00004 -
KWM - - 4.18392 ± 0.15833R2 0.93991 0.93357 0.84508
Ozone treated 20 min
qe 62.80174 ± 7.535222 101.90946 ± 18.4794 -k1 0.00316 ± 0.00316 - -k2 - 0.00010 ± 0.00005 -
KWM - - 4.69444 ± 0.19026R2 0.92747 0.91937 0.83371
PFO = pseudo-first order model; PSO = pseudo-second order model; WM = Weber and Morris intraparticle diffusion model.
According to the Weber and Morris model, if the plot qt vs. t1/2 is linear and passesthrough the origin, intra-particle diffusion is the rate-limiting step. However, multi-linearities are observed in Figure 5, indicating that at least three adsorption steps occurduring the dyeing processes with different intraparticle diffusion rates. Each of the linearsections was evaluated separately and the parameters obtained are listed in Table 7.
Table 7. Parameters of the intraparticle kinetic models together with its regression coefficients ofadsorption data sample without treatment and 20′ ozone treatment.
Sample Parameter
Untreated
K1 (mg g−1 min−0.5) 1.6041 ± 0.1315R2 0.9751
K2 (mg g−1 min−0.5) 9.9810 ± 0.3385R2 0.9886
K3 (mg g−1 min−0.5) 5.1431 ± 0.2383R2 0.9831
Ozone treated 20 min
K1 (mg g−1 min−0.5) 2.5028 ± 0.2429R2 0.9546
K2 (mg g−1 min−0.5) 13.8194 ± 0.5721R2 0.9898
K3 (mg g−1 min−0.5) 6.0526 ± 0.1408R2 0.9957

Materials 2021, 14, 3492 10 of 12Materials 2021, 14, x FOR PEER REVIEW 11 of 14
Figure 5. Intra-particle kinetic diffusion for dye adsorption in (a) untreated and (b) ozone-treated polyester.
The first portion of the plot in Figure 5 is generally attributed to the diffusion of the dye through the diffusional boundary layer that exists at the fiber’ surface. In this section we observe that the lowest diffusion rate is due to the existence of a major effective re-sistance to the dye particle’s diffusion. The linear portion of the first step does not pass through the origin indicating that intraparticle transport is not the only rate-limiting step and that there is some degree of boundary layer control [35].
The second portion describes the adsorption of the dye onto sites localized on the fiber surface [36] and has the highest diffusion rate due to a smaller resistance to reach adsorption sites. That is the case for both treated and untread samples. This process takes place fast until it reaches saturation of the fiber surface, followed by diffusion of the dye molecules inside the fiber (the third portion). The third section illustrates a process that follows a slower rate due to the presence of fewer adsorption sites available.
Figure 5. Intra-particle kinetic diffusion for dye adsorption in (a) untreated and (b) ozone-treated polyester.
The first portion of the plot in Figure 5 is generally attributed to the diffusion ofthe dye through the diffusional boundary layer that exists at the fiber’ surface. In thissection we observe that the lowest diffusion rate is due to the existence of a major effectiveresistance to the dye particle’s diffusion. The linear portion of the first step does not passthrough the origin indicating that intraparticle transport is not the only rate-limiting stepand that there is some degree of boundary layer control [35].
The second portion describes the adsorption of the dye onto sites localized on thefiber surface [36] and has the highest diffusion rate due to a smaller resistance to reachadsorption sites. That is the case for both treated and untread samples. This process takesplace fast until it reaches saturation of the fiber surface, followed by diffusion of the dyemolecules inside the fiber (the third portion). The third section illustrates a process thatfollows a slower rate due to the presence of fewer adsorption sites available.
4. Conclusions
We report on the modification of polyester fabrics with ozone and the dyeing ofthe modified fabrics with the C.I. Disperse Yellow 211 dye. We observed molecular andtopographical changes in the polyester fabric after ozone exposure. While FT-IR and Raman

Materials 2021, 14, 3492 11 of 12
spectra do not reveal the appearance of extensive amounts of new functional groups on thetreated fabrics, Raman spectra shows that the intensity of the non-aromatic bands decreaseswith oxidation and oxidized groups are created by ozonolysis, with a significant increasein the intensity of peaks related to the hydrophilic bonds. Friction fastness tests shows thatupon 20 min of ozone exposure, the specimens have a score of 5 for both tests, dry and wet.Kinetic data show that dye adsorption process can be explained by a three-steps Weberand Morris intraparcicle diffusion model. The amount of dye adsorption at equilibrium ishigher by a 10.74% for the untreated samples confirming that ozone treatment may be anefficient means to reduce the amount of dye used. We assume that this increase is due toan increase in hydrogen bond interactions after ozone treatment. To emphasize the natureof structural changes and the different possibilities of interaction between dye and fabric,we will use aromatic dyes, without hydrogen bond probability, for future work to improvethe understanding of this process. This work shows that ozone treatment is a good wayto reduce inputs in the dyeing processes and also wastewater treatment expenses, thus,reducing the environmental impacts of the textile industry as well as potentially decreasingthe processing costs.
Author Contributions: Conceptualization and methodology, D.S.d.C.C. and F.M.B.; validation,M.J.L.A. and J.P.H.; formal analysis, R.S.G., M.P.M. and R.B.S.; investigation, R.S.G. and B.T.M.F.;resources, R.S.G.; data curation, F.M.B.; writing—original draft preparation, R.S.G., D.S.d.C.C.;writing—review and editing, M.J.L.A., J.P.H. and F.M.B.; visualization, R.B.S.; supervision, M.P.M.;project administration, F.M.B.; funding acquisition, M.J.L.A. All authors have read and agreed to thepublished version of the manuscript.
Funding: This research was funded by Golden Technology LTDA.
Institutional Review Board Statement: Not applicable.
Informed Consent Statement: Not applicable.
Data Availability Statement: Not applicable.
Acknowledgments: We appreciate the support of the “Laboratório Multiusuário de Apoio à Pesquisada UTFPR Campus Apucarana (LAMAP)”.
Conflicts of Interest: The authors declare no conflict of interest.
References1. Navaneetha Pandiyaraj, K.; Vasu, D.; Ramkumar, M.C.; Deshmukh, R.R.; Ghobeira, R. Improved Degradation of Textile Effluents
via the Synergetic Effects of Cu-CeO2 Catalysis and Non-Thermal Atmospheric Pressure Plasma Treatment. Sep. Purif. Technol.2021, 258, 118037. [CrossRef]
2. Khan, S.; Anas, M.; Malik, A. Mutagenicity and Genotoxicity Evaluation of Textile Industry Wastewater Using Bacterial and PlantBioassays. Toxicol. Rep. 2019, 6, 193–201. [CrossRef] [PubMed]
3. Samuchiwal, S.; Bhattacharya, A.; Malik, A. Treatment of Textile Effluent Using an Anaerobic Reactor Integrated with ActivatedCarbon and Ultrafiltration Unit (AN-ACF-UF Process) Targeting Salt Recovery and Its Reusability Potential in the Pad-BatchProcess. J. Water Process Eng. 2020, 40, 101770. [CrossRef]
4. Chequer, F.M.D.; Dorta, D.J.; Oliveira, D.P. de Azo Dyes and Their Metabolites: Does the Discharge of the Azo Dye into WaterBodies Represent Human and Ecological Risks? Adv. Treat. Text. Effl. 2011, 28–48. [CrossRef]
5. Carneiro, P.A.; Umbuzeiro, G.A.; Oliveira, D.P.; Zanoni, M.V.B. Assessment of Water Contamination Caused by a MutagenicTextile Effluent/Dyehouse Effluent Bearing Disperse Dyes. J. Hazard. Mater. 2010, 174, 694–699. [CrossRef]
6. Pang, Y.L.; Abdullah, A.Z. Current Status of Textile Industry Wastewater Management and Research Progress in Malaysia:A Review. Clean Soilairwater 2013, 41, 751–764. [CrossRef]
7. Lade, H.S.; Waghmode, T.R.; Kadam, A.A.; Govindwar, S.P. Enhanced Biodegradation and Detoxification of Disperse Azo DyeRubine GFL and Textile Industry Effluent by Defined Fungal-Bacterial Consortium. Int. Biodeterior. Biodegrad. 2012, 72, 94–107.[CrossRef]
8. De Souza, O.; de Oliveira, L.J. GlobalizaçãO e relações de consumo: ServidãO moderna e degradação ambiental. Rev. DireitoAmbient. Soc. 2016, 6. Available online: http://www.ucs.br/etc/revistas/index.php/direitoambiental/article/view/4258(accessed on 18 December 2020).

Materials 2021, 14, 3492 12 of 12
9. Burkinshaw, S.M.; Liu, K.; Salihu, G. The Wash-off of Dyeings Using Interstitial Water Part 5: Residual Dyebath and Wash-offLiquor Generated during the Application of Disperse Dyes and Reactive Dyes to Polyester/Cotton Fabric. Dye. Pigment. 2019,171, 106367. [CrossRef]
10. Eren, H.A. Afterclearing by Ozonation: A Novel Approach for Disperse Dyeing of Polyester. Coloration Technol. 2006, 122, 329–333.[CrossRef]
11. Choi, H.; Kim, Y.Y.; Lim, H.; Cho, J.; Kang, J.W.; Kim, K.S. Oxidation of Polycyclic Aromatic Hydrocarbons by Ozone in thePresence of Sand. Water Sci. Technol. 2001, 43, 349–356. [CrossRef] [PubMed]
12. Jang, J.; Jeong, Y. Nano Roughening of PET and PTT Fabrics via Continuous UV/O3 Irradiation. Dye. Pigment. 2006, 69, 137–143.[CrossRef]
13. Fattahi, F.; Izadan, H.; Khodami, A. Investigation into the Effect of UV/Ozone Irradiation on the Dyeing behaviour of Poly(LacticAcid) and Poly(Ethylene Terephthalate) Substrates. Prog. Colorcolorants Coat. 2012, 5, 15–22. [CrossRef]
14. Rahmatinejad, J.; Khoddami, A.; Mazrouei-Sebdani, Z.; Avinc, O. Polyester Hydrophobicity Enhancement via UV-OzoneIrradiation, Chemical Pre-Treatment and Fluorocarbon Finishing Combination. Prog. Org. Coat. 2016, 101, 51–58. [CrossRef]
15. Atav, R.; Yurdakul, A. Effect of the Ozonation Process on the Dyeability of Mohair Fibres. Coloration Technol. 2011, 127, 159–166.[CrossRef]
16. Atav, R.; Namirti, O. Effect of Ozonation Process on Dyeing of Polyamide Fabrics with a Natural Dye: Walnut Rind/EfectulProcesului de Ozonizare Asupra Vopsirii Tesaturilor de Poliamida Cu Colorant Natural Din Coaja de Nuca. Ind. Text. 2016, 67,233–237.
17. Eren, H.A.; Anis, P. Surface Trimer Removal of Polyester Fibers by Ozone Treatment. Text. Res. J. 2009, 79, 652–656. [CrossRef]18. Wakida, T.; Lee, M.; Jeon, J.H.; Tokuyama, T.; Kuriyama, H.; Ishida, S. Ozone-Gas Treatment of Wool and Silk Fabrics. J. Fiber Sci.
Technol. 2004, 60, 213–219. [CrossRef]19. He, Z.; Li, M.; Zuo, D.; Xu, J.; Yi, C. Effects of Color Fading Ozonation on the Color Yield of Reactive-Dyed Cotton. Dye. Pigment.
2019, 164, 417–427. [CrossRef]20. Dos Santos, V.L.V.F.; Barcellos, I.O.; Piccoli, H.H.; dos Santos, V.L.V.F.; Barcellos, I.O.; Piccoli, H.H. Pre-Alvejamento de Materiais
Têxteis Com Ozônio e Avaliação de Suas Propriedades de Superfície, Físicas e Tintoriais. Matéria 2017, 22. [CrossRef]21. Lagergren, S. Zur theorie der sogenannten adsorption gelöster stoffe, kungliga svenska vetenskapsakademiens. Handlingar 1898,
24, 1–39.22. Ho, Y.S.; McKay, G. Pseudo-Second Order Model for Sorption Processes. Process Biochem. 1999, 34, 451–465. [CrossRef]23. Largitte, L.; Pasquier, R. A Review of the Kinetics Adsorption Models and Their Application to the Adsorption of Lead by an
Activated Carbon. Chem. Eng. Res. Des. 2016, 109, 495–504. [CrossRef]24. Test for Colour Fastness—Part X12: Colour Fastness to Rubbing; ISO 105 X12; ISO: London, UK, 2016.25. Plazinski, W.; Dziuba, J.; Rudzinski, W. Modeling of Sorption Kinetics: The Pseudo-Second Order Equation and the Sorbate
Intraparticle Diffusivity. Adsorption 2013, 19, 1055–1064. [CrossRef]26. Fechine, G.J.M.; Rabello, M.S.; Souto-Maior, R.M. The Effect of Ultraviolet Stabilizers on the Photodegradation of Poly(Ethylene
Terephthalate). Polym. Degrad. Stab. 2002, 75, 153–159. [CrossRef]27. Edge, M.; Wiles, R.; Allen, N.S.; McDonald, W.A.; Mortlock, S.V. Characterisation of the Species Responsible for Yellowing in Melt
Degraded Aromatic Polyesters—I: Yellowing of Poly(Ethylene Terephthalate). Polym. Degrad. Stab. 1996, 53, 141–151. [CrossRef]28. Iyer, P.B.; Iyer, K.R.K.; Patil, N.B. An Infrared Technique for the Quick Analysis of Cotton–Polyester Blends. J. Appl. Polym. Sci.
1976, 20, 591–595. [CrossRef]29. Costa, T.H.C.; Feitor, M.C.; Alves Junior, C.; Bezerra, C.M. Caracterização de Filmes de Poliéster Modificados Por Plasma de O2 a
Baixa Pressão. Matéria 2008, 13, 65–76. [CrossRef]30. Van Geluwe, S.; Vinckier, C.; Braeken, L.; Van der Bruggen, B. Ozone Oxidation of Nanofiltration Concentrates Alleviates
Membrane Fouling in Drinking Water Industry. J. Membr. Sci. 2011, 378, 128–137. [CrossRef]31. Burkinshaw, S.M. Polyester Fibres. In Physico-Chemical Aspects of Textile Coloration; John Wiley & Sons Ltd.: Hoboken, NJ, USA,
2016; pp. 359–426. ISBN 978-1-118-72565-8.32. Lee, M.; Lee, M.S.; Wakida, T.; Tokuyama, T.; Inoue, G.; Ishida, S.; Itazu, T.; Miyaji, Y. Chemical Modification of Nylon 6 and
Polyester Fabrics by Ozone-Gas Treatment. J. Appl. Polym. Sci. 2006, 100, 1344–1348. [CrossRef]33. Ruyter, I.E.; Nilner, K.; Moller, B. Color Stability of Dental Composite Resin Materials for Crown and Bridge Veneers. Dent. Mater.
1987, 3, 246–251. [CrossRef]34. Gupta, B.; Hilborn, J.; Hollenstein, C.; Plummer, C.J.G.; Houriet, R.; Xanthopoulos, N. Surface Modification of Polyester Films by
RF Plasma. J. Appl. Polym. Sci. 2000, 78, 1083–1091. [CrossRef]35. Özcan, A.S.; Özcan, A. Adsorption Behavior of a Disperse Dye on Polyester in Supercritical Carbon Dioxide. J. Supercrit. Fluids
2005, 35, 133–139. [CrossRef]36. Lis, M.J.; Valldeperas, J.; Carrillo, F. Análisis cinético y matemático de la tintura de tencel con colorantes directos. Boletín Intexter
2006, 6, 130.