plankton metabolism in surface waters of the tropical and
TRANSCRIPT

AQUATIC MICROBIAL ECOLOGYAquat Microb Ecol
Vol. 62: 1–12, 2011doi: 10.3354/ame01451
Published January 4
INTRODUCTION
Photosynthetic ocean plankton account for approxi-mately half of the total oxygen production and carbonfixation on Earth (Falkowski 1994), and a major frac-tion of this productivity occurs in the oligotrophic gyresthat encompass ~40% of the planet’s surface area(Field et al. 1998). Biomass and metabolism in oceanicecosystems are dominated by planktonic microorgan-isms and the activities of these microorganisms controlthe net balance between carbon fixation and respira-tion (Duarte & Cebrian 1996, Falkowski et al. 2008).Throughout much of the world’s oceans, gross primaryproduction (GPP) and plankton community respiration(R) are tightly coupled in space and time; the balance
© Inter-Research 2011 · www.int-res.com*Corresponding author. Email: [email protected]
FEATURE ARTICLE
Plankton metabolism in surface waters of thetropical and subtropical Pacific Ocean
Donn A. Viviani, Karin M. Björkman, David M. Karl, Matthew J. Church*
Department of Oceanography, University of Hawaii, Honolulu, Hawaii 96822, USA
ABSTRACT: We measured plankton metabolism andevaluated changes in plankton community structurewithin the central Pacific Ocean during a trans-equato-rial cruise from the South Pacific Subtropical Gyre(SPSG) to the North Pacific Subtropical Gyre (NPSG).Rates of net community production (NCP) and respira-tion (R) were determined in near-surface ocean waters,based on light–dark bottle measurements of oxygenproduction and consumption. Gross primary produc-tion (GPP) was computed, where GPP = NCP + R. Ratesof GPP and R in the oligotrophic SPSG and NPSG weretightly coupled, resulting in NCP that was either zeroor slightly negative. These subtropical waters werecharacterized by very low concentrations of inorganicnutrients (e.g. nitrate+nitrite range: 0.004 to 0.033µmol l–1). Within the relatively nutrient-enriched equa-torial waters (e.g. nitrate+nitrite concentrations range:0.67 to 5.7 µmol l–1), GPP exceeded R by up to 5-fold,resulting in positive NCP. GPP varied ~16-fold (0.25 to4.05 µmol O2 produced l–1 d–1) while R varied ~5-fold(0.31 to 1.56 µmol O2 consumed l–1 d–1). Picoplanktoncell abundances and diagnostic pigment biomarkerswere used to determine regional differences in phyto-plankton community structure. In the near-equatorialwaters, abundances of Synechococcus and photosyn-thetic picoeukaryotes increased up to 100- and 10-fold,respectively, and diagnostic pigment biomarkers foreukaryotic phytoplankton (including diatoms, pelago-phytes, and haptophytes) also increased. These resultsindicate that variability in nutrient availability consti-tutes an important regulator of net productivity andplankton community structure in large regions of theopen ocean.
KEY WORDS: Gross primary production · Respiration ·Net community production · Equatorial Pacific · Subtropical gyres
Resale or republication not permitted without written consent of the publisher
Satellite (SeaWiFS) ocean color image of the Pacific Oceansuperimposed on a diatom assemblage viewed by epifluores-cence microscopy. Cruise track occupied during this studydepicted by the white dashed line on the SeaWiFS image.
Ocean color image: NASA; diatom photo: Rachel Foster
OPENPEN ACCESSCCESS

Aquat Microb Ecol 62: 1–12, 2011
between these 2 ecosystem processes is termed netcommunity production (NCP). Small changes in NCP,favoring either net production or net respiration, canhave large consequences on the carbon and oxygenstorage potentials of the ocean (del Giorgio & Duarte2002). As a result, it is vital to understand the temporaland spatial scales over which oxygenic photosynthesisis coupled to R.
In vast regions of the oceans, rates of primary pro-duction are limited by the supply of inorganic nutrientsto the well-lit regions of the euphotic zone. Despite lownutrient concentrations, various lines of evidence sug-gest microorganism growth rates in these systems arenear maximal (Goldman et al. 1979, Laws et al. 1987);presumably maintained in large part by active recy-cling of nutrients (Azam et al. 1983, Goldman 1988).Other studies argue that the low nutrient conditionsobserved throughout large regions of the world’soceans restrict plankton growth rates (Marañón 2005).
In the past decade, there has been considerable con-troversy over the metabolic state of these oligotrophicregions. Numerous geochemical approaches, typicallyintegrating estimates of production and respirationover weekly to monthly time scales, suggest oceanecosystems are slightly net autotrophic, demonstratingpositive NCP, and therefore capable of supporting car-bon export to the deep sea (Jenkins & Goldman 1985,Siegenthaler & Sarmiento 1993, Carlson et al. 1994,Michaels et al. 1994, Emerson et al. 1997, Luz & Barkan2000, Emerson et al. 2002, Karl et al. 2003, Riser &Johnson 2008). Other studies, relying on incubationexperiments to measure biological oxygen productionand consumption over hourly to daily time scales, oftendemonstrate that oligotrophic ocean ecosystems aresignificantly net heterotrophic, whereby organic mat-ter and oxygen are consumed more rapidly than locallyproduced (del Giorgio et al. 1997, Duarte & Agusti1998, Serret et al. 2001, del Giorgio & Duarte 2002,Robinson et al. 2002, Williams et al. 2004). To date, itremains unclear why these various measures of plank-ton metabolism provide fundamentally different con-clusions regarding the net metabolic state of the sea.
In the present study, we sought to examine spatialvariability in rates of GPP, NCP, and R in the near-surface waters of remote regions in the Pacific Ocean.We report results obtained from a trans-equatorialresearch cruise through biogeochemically distinctregions of the tropical and subtropical Pacific Oceanbetween 16° S and 22.75° N. By evaluating planktonmetabolism relative to distributions of nutrients andplanktonic microorganisms, the resulting data provideinsight into the coupling between nutrient availability,plankton biomass, and alterations in phytoplanktoncommunity structure as factors controlling the netmetabolism of the Pacific Ocean.
MATERIALS AND METHODS
Sampling scheme, determinations of nutrients, pig-ments, and adenosine-5’-triphosphate concentrations.All sampling took place between ~16°S and 22.75° Naboard the RV ‘Kilo Moana’ in April and May 2007(Fig. 1). Metabolic rate measurements were conductedat 13 stations. At 12 of these stations, seawater forassessment of metabolic rates was collected from theship’s uncontaminated flow-through seawater intakesystem (~7 m depth); at the northern-most station(22.75° N, 158° W), seawater was collected from 5 mdepth using a conductivity-temperature-density (CTD)rosette sampler equipped with 10 l polyvinyl chloridebottles. In addition, at 8 stations, samples were col-lected from vertical profiles using a CTD rosette systemto characterize upper ocean (0 to 200 m) biogeochem-istry (e.g. nutrient, particulate matter, and pigment con-
2
Fig. 1. Cruise transect (black line) with stations for metabolicrate measurements in the Pacific Ocean plotted on a map ofnear-surface ocean chlorophyll a concentrations in April 2007(Acker & Leptoukh 2007) derived from MODIS satellite oceancolor. D: stations where samples were collected from near-surface waters; J: stations where CTD vertical profiles
were conducted; m: Station ALOHA (22.75° N, 158° W)

Viviani et al: Plankton productivity in the Pacific Ocean
centrations) along the cruise transect. Seawater sam-ples for determination of nutrient concentrations (ni-trate+nitrite, N+N; soluble reactive phosphorus, SRP;and silicic acid, Si(OH)4
–2) were collected in 125 or500 ml acid-washed polyethylene bottles and frozenupright for analysis in the shore-based laboratory. N+Nconcentrations were measured using the high sensitiv-ity chemiluminescent technique (Garside 1982, Dore &Karl 1996), which has a detection limit of ~2 nmol l–1.SRP samples were analyzed using the magnesium-in-duced co-precipitation method (MAGIC; Karl & Tien1992), which has a detection limit of ~3 nmol l–1.Si(OH)4
–2 concentrations were measured in a 10 cm cellusing the molybdate blue spectrophotometric tech-nique described by Strickland & Parsons (1972), whichhas a detection limit of ~0.1 µmol l–1.
Seawater samples for HPLC determination of phyto-plankton pigment concentrations were collected in 4 lcarboys, filtered onto 25 mm glass-fiber filters (GF/F,Whatman), flash frozen in liquid nitrogen and thenstored at –80°C. Once on land, pigments were ana-lyzed as in Bidigare et al. (2005). Seawater samples forsubsequent quantification of cellular adenosine-5’-triphosphate (ATP) concentrations were pre-filteredthrough a 202 µm Nitex mesh to exclude zooplankton,and collected into acid-washed 4 l polyethylene bot-tles. Of these subsamples, 1 l was vacuum filtered onto47 mm GF/F filters (Whatman); filters were placed inVacutainer (Becton Dickinson) test tubes containing5 ml boiling Tris buffer (pH 7.4, 0.02 M) and extractedfor 5 min, then frozen until analyzed at the shore-basedlaboratory. ATP concentrations were quantified as inKarl & Holm-Hansen (1978). Samples for quantificationof particulate carbon (PC) concentrations were col-lected in 10 l carboys, pre-filtered through a 202 µmNitex mesh to exclude large zooplankton and collectedonto combusted 25 mm GF/F glass-fiber filters. Carbonand nitrogen concentrations were determined by com-bustion using an Exeter CE440 Elemental Analyzer.
Measurements of plankton metabolism. Determina-tions of GPP, NCP and R were based on light–dark bot-tle oxygen production and consumption measurements(Carritt & Carpenter 1966, Williams et al. 2004). Thesemeasurements provided estimates of NCP, the balanceof oxygen produced and consumed in the light bottleincubations relative to a time zero; R, total oxygen con-sumption in the dark bottle incubation relative to atime zero; and GPP, calculated as NCP + R, which con-strains the total oxygen production inclusive of res-piratory losses. Metabolic rate measurements wereconducted from near-surface waters at 13 stations.Rates are reported as changes in O2 concentration perliter per day.
Seawater for rate determinations was collected into25 l carboys, and replicate 125 ml borosilicate flasks
were subsampled from the carboys. At each sampling,8 replicate time-zero bottles were immediately fixedwith Winkler oxygen reagents, 8 replicate bottles werefilled and incubated under simulated in situ irradiance,and 8 replicates were placed in opaque containers andincubated in the dark. At 12 stations, bottles were incu-bated for 24 h in shipboard surface seawater flow-through incubators shaded with blue Plexiglas screen-ing to ~30% incident irradiance. At the northern-moststation (22.75° N, 158° W) bottles were incubated insitu for 24 h on a free-drifting surface tethered array asdescribed in Williams et al. (2004); we did not directlycompare rates measured on the in situ array to thosedetermined by shipboard incubations.
Picoplankton community structure. Cellular abun-dance and composition of the picoplankton assem-blage were determined using flow cytometry. Forthese determinations, seawater was sampled from theCTD rosette bottles into 15 ml polyethylene centrifugetubes; 2 ml were subsampled into 2 ml Cryovials andfixed with 30 µl of 16% paraformaldehyde, immedi-ately flash-frozen in liquid nitrogen and stored at–80°C until shore-based analysis. In the laboratory,samples were thawed and counted on a CytopeiaInflux Mariner flow cytometer using a 488 nm solid-state laser for excitation, triggering on forward scatter.The enumeration and fluorescence data were analyzedusing FlowJo software (Tree Star, www.flowjo.com).Forward light scatter (FLS), red fluorescence (692 nm)and orange fluorescence (580 nm) were detected andquantified. Populations were enumerated by doublediscrimination of flow cytometry-derived character-istics. Specifically, abundances of non-pigmentedpicoplankton (hereafter referred to as heterotrophicbacteria) were determined based on SyberGreen I(Molecular Probes) stained total cell abundances fol-lowing subtraction of unstained Prochlorococcus cellcounts. Chlorophyll-containing cells were broadlyclassified into one of 3 groups (Prochlorococcus, Syne-chococcus, and picoeukaryotes) based on FLS and rel-ative fluorescence. Synechococcus was further distin-guished by orange fluorescence. Picoeukaryotes weredifferentiated from the relatively smaller cyanobacte-ria by greater FLS and red fluorescence.
RESULTS
Upper ocean hydrography and nutrient concentrations
Samples were collected within biogeochemically dis-tinct regions of the subtropical and tropical Pacific, in-cluding the low-nutrient waters of the subtropical Northand South Pacific, and the relatively nutrient-enriched
3

Aquat Microb Ecol 62: 1–12, 2011
waters in the equatorial divergence. Measurementsof plankton metabolism were conducted at 4 stationssampled in the Western Pacific Warm Pool of theSouth Pacific Subtropical Gyre (SPSG). The near-surfaceocean waters within this region were characterized bywarm sea surface temperatures (SST >28°C), elevatedsalinity, and low concentrations of inorganic nutrients(concentrations of N+N ≤0.033 µmol l–1, SRP ≤0.18 µmoll–1, and Si(OH)4
–2 ≤0.77 µmol l–1; Table 1). A total of 6stations were sampled in the near-equatorial regionwhere the upper ocean exhibited features consistentwith upwelling of cooler, nutrient-enriched waters(Fig. 2). Between 5° S and 10° N, near-surface concen-trations of N+N were as much as 2 orders of magnitudegreater (>3 µmol l–1) than those observed in thesubtropical gyres, while concentrations of SRP andSi(OH)4
–2 increased by as much as 3-fold (maximalvalues of 0.45 µmol l–1 and 2.06 µmol l–1, respectively;Table 1). North of the equatorial divergence, near-surface nutrient concentrations decreased to concentra-tions typical of the North Pacific Subtropical Gyre(NPSG). A total of 3 stations were sampled in thesewaters in which near-surface N+N, SRP, and Si(OH)4
–2
concentrations were ≤0.01 µmol l–1, ≤0.13 µmol l–1, and≤1.97 µmol l–1, respectively.
Phytoplankton pigments, particulate carbon, andpicoplankton community structure
Consistent with the observed meridional changes inupper ocean hydrography and nutrients, concentra-
tions of chlorophyll a (chl a) also demonstrated strongregional differences. In the NPSG and SPSG, chl aconcentrations in the near-surface waters were low(<90 ng l–1), increasing into the dimly-lit regions of theupper ocean (Fig. 2). In contrast, in the near-surfaceequatorial waters, concentrations of chl a increasedmore than 6-fold (range: 155 to 294 ng l–1) relative tothose measured in the subtropical gyres (Fig. 2,Table 2). Particulate carbon (PC) varied from 1.7 to4.4 µmol C l–1, with peak concentrations observed inthe southern equatorial waters (3 to 5° S). Concentra-tions of particulate ATP, a proxy for total cellular bio-mass, tended to be low (range: 20 to 39 ng l–1) in thenear-surface waters in the SPSG and NPSG, increasingby up to 2-fold in the equatorial waters (Table 2).
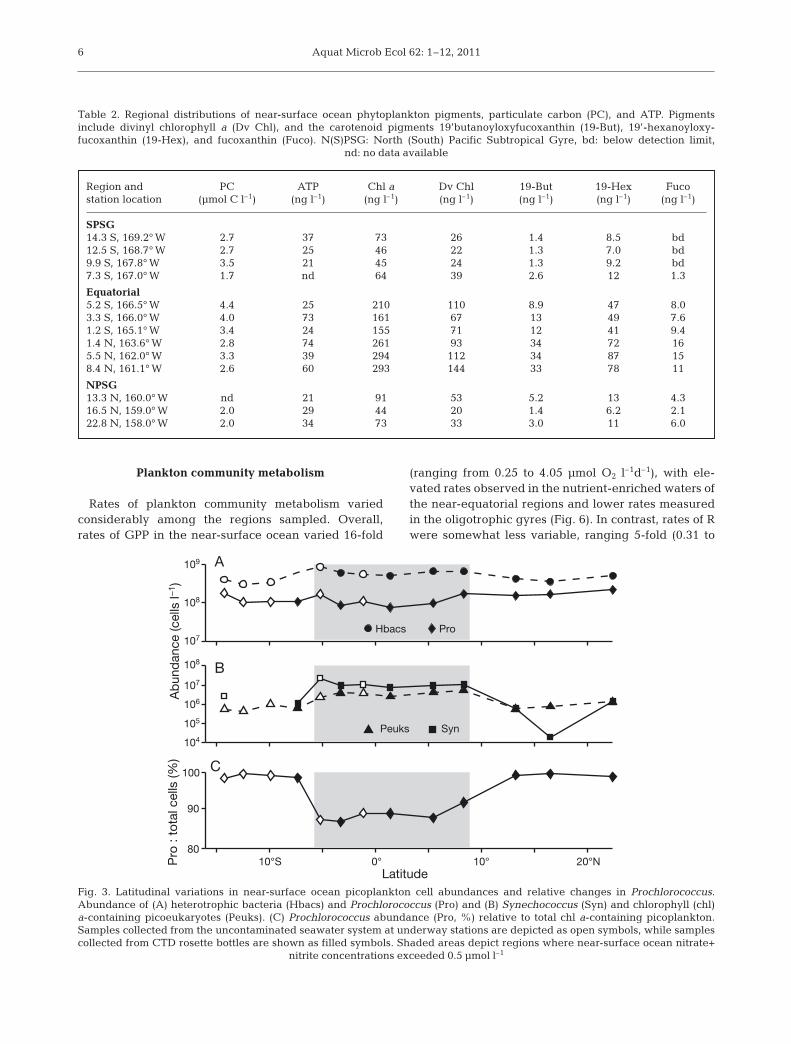
Flow cytometric enumeration of picoplankton re-vealed that Prochlorococcus were consistently themost abundant chlorophyll-containing cells in allregions sampled (Fig. 3). Prochlorococcus abundancesranged between 0.8 × 10⁸ and 2.0 × 10⁸ cells l–1, withcell abundances decreasing from subtropical gyres tonear-equatorial waters. Upper ocean concentrations ofSynechococcus and phototrophic picoeukaryotes inthe SPSG and NPSG were low or not detected (Fig. 3),with abundances of both groups increasing by morethan 100- and 10-fold, respectively, in the near-equatorial waters (Fig. 3). Synechococcus and pico-eukaryote together accounted for a small fraction (1 to8%) of photosynthetic picoplankton abundance in thesubtropical gyres; however, their relative contribu-tions increased to 13% in the near-equatorial waters(Fig. 3). These changes in the partitioning of pico-plankton in the equatorial region were driven bylarge increases in Synechococcus and picoeukaryoteabundance superimposed on modest decreases inProchlorococcus abundances. Although Prochlorococ-cus cell abundances decreased slightly in the near-equatorial waters, relative fluorescence associatedwith these cells increased more than 3-fold in theN+N enriched waters of the equatorial region (Fig. 4).Moreover, flow cytometric measurements of Prochlo-rococcus cell FLS, a proxy for cell size, also increasedin the near-equatorial waters (Fig. 4). On average,heterotrophic bacterial abundances varied less than2-fold between subtropical gyres and equatorialwaters (averaging 3.9 × 10⁸ cells l–1 compared to 6.3 ×10⁸ cells l–1, respectively).
Analyses of HPLC phytoplankton pigment concen-trations provided additional information on regionalvariations in phytoplankton community structure.Concentrations of pigments that serve as biomarkerproxies for various classes of eukaryotic phytoplanktonincreased in the near-equatorial waters (Table 2). Rel-ative to concentrations of total chl a, the carotenoidpigments 19’-butanoyloxyfucoxanthin (a biomarker
4
Region and N+N SRP Si(OH)4–2
station location (µmol l–1) (µmol l–1) (µmol l–1)
SPSG14.3° S, 169.2° W 0.027 0.122 0.6212.5° S, 168.7° W 0.033 0.134 0.569.9° S, 167.8° W 0.026 0.153 0.777.3° S, 167.0° W 0.006 0.175 0.69
Equatorial5.2° S, 166.5° W 0.67 0.251 1.103.3° S, 166.0° W 4.62 0.393 1.821.2° S, 165.1° W 3.51 0.371 1.571.4° N, 163.6° W 5.66 0.450 2.065.5° N, 162.0° W 2.91 0.174 1.768.4° N, 161.1° W 0.90 0.170 1.10
NPSG13.3° N, 160.0° W 0.009 0.132 1.9716.5° N, 159.0° W 0.006 0.104 1.1622.8° N, 158.0° W 0.004 0.095 0.95
Table 1. Near-surface ocean measurements of nutrientconcentrations at stations sampled for metabolic balancemeasurements. N(S)PSG: North (South) Pacific SubtropicalGyre, N+N: nitrate+nitrite, SRP: soluble reactive phosphorus

Viviani et al: Plankton productivity in the Pacific Ocean
proxy for pelagophytes), 19’-hexanoyloxyfucoxanthin(a biomarker proxy for prymnesiophytes), and fuco-xanthin (a biomarker proxy for diatoms) all increasedin the northern regions of the near-equatorial waters(Fig. 5). Despite decreases in Prochlorococcus cellabundances, concentrations of divinyl chl a, a diagnos-tic pigment for Prochlorococcus, increased in the equa-
torial waters (Table 2). This observation is consistentwith the apparent increases in the relative per cell flu-orescence of Prochlorococcus (Fig. 3); normalization ofdivinyl chl a concentrations to Prochlorococcus cellabundances revealed up to 5-fold increases in thepigmentation of Prochlorococcus in the northern equa-torial waters.
5
Fig. 2. Contour plots depicting latitudinal variation in (A) upper ocean (0 to 150 m) temperature, (B) concentrations of nitrate + ni-trite and (C) chlorophyll (chl) a. White dotted lines represent stations where vertical profiles were collected, while black asterisksdepict stations sampled for metabolic rate measurements. Solid black line depicts regional changes in the depth of the mixed
layer determined based on a 0.125 unit change in potential density
Aquat Microb Ecol 62: 1–12, 2011
Plankton community metabolism
Rates of plankton community metabolism variedconsiderably among the regions sampled. Overall,rates of GPP in the near-surface ocean varied 16-fold
(ranging from 0.25 to 4.05 µmol O2 l–1d–1), with ele-vated rates observed in the nutrient-enriched waters ofthe near-equatorial regions and lower rates measuredin the oligotrophic gyres (Fig. 6). In contrast, rates of Rwere somewhat less variable, ranging 5-fold (0.31 to
6
Region and PC ATP Chl a Dv Chl 19-But 19-Hex Fucostation location (µmol C l–1) (ng l–1) (ng l–1) (ng l–1) (ng l–1) (ng l–1) (ng l–1)
SPSG14.3 S, 169.2° W 2.7 37 73 26 1.4 8.5 bd12.5 S, 168.7° W 2.7 25 46 22 1.3 7.0 bd9.9 S, 167.8° W 3.5 21 45 24 1.3 9.2 bd7.3 S, 167.0° W 1.7 nd 64 39 2.6 12 1.3
Equatorial5.2 S, 166.5° W 4.4 25 210 110 8.9 47 8.03.3 S, 166.0° W 4.0 73 161 67 13 49 7.61.2 S, 165.1° W 3.4 24 155 71 12 41 9.41.4 N, 163.6° W 2.8 74 261 93 34 72 165.5 N, 162.0° W 3.3 39 294 112 34 87 158.4 N, 161.1° W 2.6 60 293 144 33 78 11
NPSG13.3 N, 160.0° W nd 21 91 53 5.2 13 4.316.5 N, 159.0° W 2.0 29 44 20 1.4 6.2 2.122.8 N, 158.0° W 2.0 34 73 33 3.0 11 6.0
Table 2. Regional distributions of near-surface ocean phytoplankton pigments, particulate carbon (PC), and ATP. Pigmentsinclude divinyl chlorophyll a (Dv Chl), and the carotenoid pigments 19’butanoyloxyfucoxanthin (19-But), 19’-hexanoyloxy-fucoxanthin (19-Hex), and fucoxanthin (Fuco). N(S)PSG: North (South) Pacific Subtropical Gyre, bd: below detection limit,
nd: no data available
Ab
und
ance
(cel
ls l−
1 )
Hbacs
A
B
C
Pro
104
105
106
107
107
108
108
109
Peuks Syn
10°S 0° 10° 20°N80
90
100
Latitude
Pro
: to
tal c
ells
(%)
Fig. 3. Latitudinal variations in near-surface ocean picoplankton cell abundances and relative changes in Prochlorococcus.Abundance of (A) heterotrophic bacteria (Hbacs) and Prochlorococcus (Pro) and (B) Synechococcus (Syn) and chlorophyll (chl)a-containing picoeukaryotes (Peuks). (C) Prochlorococcus abundance (Pro, %) relative to total chl a-containing picoplankton.Samples collected from the uncontaminated seawater system at underway stations are depicted as open symbols, while samplescollected from CTD rosette bottles are shown as filled symbols. Shaded areas depict regions where near-surface ocean nitrate+
nitrite concentrations exceeded 0.5 µmol l–1

Viviani et al: Plankton productivity in the Pacific Ocean
1.56 µmol O2 l–1 d–1). On average, rates of R weregreater in the near-equatorial waters, but there wereno statistical differences (1-way ANOVA, p > 0.05) in Ramong any of the regions sampled. Rates of NCP var-ied ~4-fold, and imbalances in GPP and R in the near-equatorial waters resulted in positive NCP in thisregion (Fig. 6), with rates increasing up to 3.00 µmolO2 l–1 d–1. In contrast, in the low nutrient subtropicalgyres, NCP was either statistically indistinguishablefrom zero or slightly negative (ranging from 0.48 to–1.31 µmol O2 l–1 d–1).
In general, NCP was significantly greater than zero(1-way ANOVA, p < 0.05) in those regions where N+Nconcentrations exceeded 0.5 µmol l–1, chl a concentra-tions were >0.15 µg l–1, and GPP was >1.88 µmol l–1
d–1. Rates of chl a-normalized GPP varied ~4-fold(ranging from 5.2 to 23 mol O2 (g chl a)–1 d–1; Fig. 6) buton average there were no significant regional differ-ences in these rates (1-way ANOVA, p > 0.05). In con-
7
10°S 0° 10° 20°N
0
1
2
3
4
5
6
Rela
tive
scatt
er
and
flu
ore
scence
Latitude
C
Red fluorescence
Forward scatter
100
100 101 102 103 104 100 101 102 103 104
101
102
103
104
FLS FLS
Red
flu
ore
scence
Station 4: Equatorial
AStation 7: NPSG
BPeuks Peuks
ProPro
Syn Syn
Beads Beads
Fig. 4. Scatter plots of red fluorescence and forward light scatter (FLS; excitation by 488 nm laser) associated with specific groupsof pigmented picoplankton at representative stations in (A) near-equatorial and (B) subtropical waters; also shown are 2 µmflow cytrometry alignment beads. (C) Flow cytometrically determined variations in relative fluorescence and FLS scatter by
populations of Prochlorococcus. Further abbreviations and details as in Fig. 3
0.2
0.4
0.6
0.8 A
B
Div
inyl
:Ch
l a (g
:g)
19
-Bu
t:C
hl a
(g:g
)
19
-Hex
:Ch
l a (g
:g)
Fu
co:C
hl a
(g:g
)
0.1
0.2
0.3
0.4Divinyl:Chl a19-Hex:Chl a
0
0.05
0.1
0.15
Latitude10°S 0° 10° 20°N
0
0.05
0.1
0.1519-But:Chl aFuco:Chl a
Fig. 5. Phytoplankton pigment biomarker distributions. Con-centration ratios of (A) divinyl chl a and 19’-hexanoyloxy-fucoxanthin (19-Hex) relative to total chl a, and (B) 19’-butanoyloxyfucoxanthin (19-But) and fucoxanthin (Fuco)
relative to total chl a. Shaded regions as in Fig. 3

Aquat Microb Ecol 62: 1–12, 2011
trast, normalization of GPP to concentrations of partic-ulate carbon revealed more than a 5-fold increase inthese carbon-normalized rates in the near-equatorialwaters. Correlation analyses indicated a positive rela-tionship between NCP and the abundances ofpicoeukaryotes (Table 3), as well as concentrations ofnutrients and various algal pigments (Table 3). In con-trast, only weak relationships were observed betweenrates of R and variations in SST, non-pigmentedpicoplankton, or chl a (Table 3).
DISCUSSION
Across approximately 5200 km of the subtropicaland tropical Pacific Ocean, we observed strongregional changes in rates of plankton metabolism thatcoincided with variations in nutrient availability andphytoplankton biomass and community structure. Ingeneral, NCP was positive (net autotrophic) in thenear-equatorial waters, where rates of GPP were ele-vated, nutrient concentrations were relatively en-riched, and larger phytoplankton comprised a greaterfraction of photosynthetic biomass (as observed bothby flow cytometry and inferred from increases ineukaryotic phytoplankton pigments). In contrast, NCPappeared closely balanced or slightly negative (netheterotrophic) in the low-nutrient subtropical gyres,where GPP was lower and the picoplanktonic cyano-bacteria Prochlorococcus comprised a dominant frac-
8
−3
−2
−1
0
1
2
3
4
5 A
B
GP
P, N
CP
and
R(µ
mo
l O2
l−1
d−
1 )
Respiration GPP NCP
0
5
10
15
20
25
30
GP
P:C
hl a
(mo
l O2
g C
hl−
1 d
−1 )
GP
P:R
Latitude
0
1
2
3
4
5
6
7
10°S 0° 10° 20°N
Fig. 6. Latitudinal variations in near-surface ocean planktonmetabolism (µmol O2 l–1 d–1). (A) Rates of gross primary pro-duction (GPP), net community production (NCP), and respira-tion (R) at stations sampled along cruise transect. (B) Ratio ofGPP:R (open bars) and chlorophyll (chl) a normalized rates ofGPP (open circles and dashed line). Shaded areas as in Fig. 3
T R NCP GPP N+N SRP Si Chl a Dv 19- 19- Fuco ATP Hbacs Pro Syn PeuksChl But Hex
T 1.00R –0.35 1.00NCP –0.05 0.13 1.00GPP 0.04 –0.18 0.95 1.00N+N 0.05 –0.23 0.75 0.82 1.00SRP 0.25 –0.44 0.64 0.76 0.92 1.00Si –0.34 0.07 0.65 0.62 0.75 0.62 1.00Chl a 0.01 0.01 0.85 0.83 0.63 0.50 0.56 1.00Dv Chl 0.05 –0.03 0.75 0.74 0.47 0.42 0.47 0.96 1.0019-But –0.08 0.06 0.87 0.84 0.67 0.48 0.59 0.95 0.86 1.0019-Hex 0.03 –0.04 0.84 0.84 0.70 0.55 0.59 0.99 0.92 0.96 1.00Fuco –0.21 –0.04 0.87 0.88 0.76 0.61 0.73 0.93 0.83 0.92 0.93 1.00ATP –0.02 0.04 0.58 0.55 0.72 0.60 0.45 0.58 0.46 0.67 0.63 0.60 1.00Hbacs 0.14 –0.17 0.46 0.50 0.32 0.36 0.31 0.75 0.82 0.51 0.70 0.64 0.26 1.00Pro –0.55 0.32 –0.35 –0.44 –0.65 –0.63 –0.37 –0.23 –0.11 –0.33 –0.34 –0.27 –0.34 0.06 1.00Syn 0.24 –0.30 0.50 0.59 0.41 0.51 0.30 0.72 0.78 0.47 0.67 0.60 0.23 0.95 –0.04 1.00Peuks 0.00 –0.14 0.68 0.72 0.61 0.50 0.48 0.86 0.85 0.81 0.89 0.79 0.57 0.69 –0.21 0.65 1.00
Table 3. Correlation matrix depicting relationships between plankton metabolism and biogeochemical properties sampled alongthe cruise transect. Numbers represent correlation coefficients; abbreviations are temperature (T), respiration (R), net communityproduction (NCP), gross primary production (GPP), nitrate+nitrite (N+N), soluble reactive phosphorus (SRP), Si(OH)4
–2 (Si),chlorophyll a (chl a), divinyl chlorophyll a (Dv Chl), 19’butanoyloxyfucoxanthin (19-But), 19’-hexanoyloxyfucoxanthin (19-Hex),fucoxanthin (Fuco), adenosine triphosphate (ATP), heterotrophic bacteria (Hbacs), Prochlorococcus (Pro), Synechococcus (Syn),
and picoeukaryotes (Peuks)

Viviani et al: Plankton productivity in the Pacific Ocean
tion of photosynthetic biomass. These results suggestthat both nutrient availability and the nature and struc-ture of plankton food webs play important roles inshaping the net productivity of the sea.
The present study provides insight into how regionalchanges in phytoplankton community structure (taxacomposition and biomass) map onto variations inplankton community metabolism in near-surfacewaters of the Pacific Ocean. Although Prochlorococcusdominated the chl a-containing picoplankton in allregions sampled, their relative contributions to totalphotosynthetic picoplankton abundances decreasedfrom ~99% in the subtropical gyres to ~85% in equato-rial waters. Further insight into regional differences inthe composition of phytoplankton taxa were obtainedfrom analyses of specific phytoplankton pigment bio-markers. In the subtropical gyres, peak concentrationsof chl a were observed in the dimly-lit regions of theupper ocean, while chl a concentrations in the equato-rial region generally peaked near the ocean’s surface.This upward shift in total chl a suggests that phyto-plankton biomass increased in the relatively nutrient-enriched, near-equatorial waters. Similarly, concentra-tions of ATP, a proxy for total cellular biomass, alsoincreased by up to 2-fold in the equatorial waters.Coinciding with the observed increases in chl a,concentrations of several diagnostic pigments, charac-teristic of various classes of eukaryotic phytoplankton,also increased in near-equatorial waters. In particular,concentrations of pigments found in pelagophytes,prymnesiophytes, dinoflagellates, chromophytes, anddiatoms all increased, suggesting that the relativelynutrient-enriched waters of the equatorial Pacificsupport a functionally diverse phytoplankton commu-nity in which the larger, eukaryotic phytoplanktonplay an increased role in controlling photosyntheticproduction.
These findings are consistent with a metagenomicsequencing effort conducted on samples from ourcruise (Hewson et al. 2009). Hewson et al. (2009) iden-tified unique spatial partitioning of various Prochloro-coccus ecotypes, with near-surface waters of the sub-tropical gyres dominated by ecotypes most similar toProchlorococcus strains AS9601, MIT9301, and MIT9312; ecotypes most similar to strains MIT9515 andCCMP1986 were more prevalent in the near-equator-ial waters. These results provide additional evidencethat Prochlorococcus speciation broadly maps ontobasin-scale ocean physical and biogeochemical fea-tures (Bouman et al. 2006, Johnson et al. 2006, Hick-man et al. 2010). In addition to meridional changes inProchlorococcus ecotypes, Hewson et al. (2009) ob-served variations in Synechococcus population distrib-utions, with distributions of genes most similar tomarine Synechococcus strains WH7805 and WH7803
becoming increasingly prevalent in the near-surfacewaters of the equatorial region. Moreover, the samestudy noted greater contribution of sequences appar-ently derived from eukaryotic cells in the equatorialwaters than in the subtropical gyres (Hewson et al.2009). Together, these studies suggest a minor role forSynechococcus and chl a-containing picoeukaryotebiomass in the subtropical gyres, but that the contribu-tion of these groups increased markedly in the nutri-ent-enriched equatorial waters. Intriguingly, despitespatial variations in cellular abundances and biomassof photosynthetic plankton, heterotrophic bacterialabundances varied <2-fold between distinct oceanicregions. Such data may support the hypothesis that thebiomass and production of photosynthetic microorgan-isms, specifically Synechococcus and picoplanktoniceukaryotes, are more sensitive to regional variations innutrient supply than heterotrophic bacterial biomass orplanktonic respiratory activities.
One of the primary motivations for the present studywas to better understand the spatial coupling in photo-synthetic production and community respiration in thesea. We restricted our analyses to the well-lit, near-surface waters; in general, we found that throughoutthe subtropical gyres where picoplankton dominatedphotosynthetic biomass, rates of GPP and R were lowand comparable in magnitude. In contrast, in near-equatorial waters where larger phytoplankton weremore numerous, rates of GPP were strongly decoupledfrom R. The resulting NCP of the subtropical gyres wasstatistically indistinguishable from zero, or slightlynegative (net heterotrophic), while decoupling of GPPand R in the near-equatorial waters resulted in positiverates of NCP (with rates ranging from 0.60 to 3.00 µmolO2 l–1 d–1).
These results are consistent with previous studiesthat have examined regional variations in planktonmetabolism in other regions of the world’s oceans(Duarte et al. 2001, Serret et al. 2001, Arístegui & Har-rison 2002, Robinson et al. 2002, Serret et al. 2006,Morán et al. 2007, Gist et al. 2009), where netautotrophic conditions frequently prevail in regionswhere concentrations of chl a are relatively enrichedand nutrients are actively supplied to the near-surfacewaters. In the subtropical Atlantic, Robinson et al.(2002) observed mixed layer rates of R ranging from1.0 to 4.8 µmol O2 l–1 d–1, while GPP ranged from 0.3to 1.0 µmol O2 l–1 d–1. In contrast, this same studyreported rates of R in upwelling regions of the centralAtlantic varying between 1.1 and 11.3 µmol O2 l–1 d–1,while GPP was more variable, ranging between 1.9and 30.2 µmol O2 l–1 d–1. Juranek & Quay (2010) uti-lized the oxygen isotope anomaly technique to derivehigh frequency estimates of GPP from cruises transectthrough the subtropical and tropical Pacific. These
9

Aquat Microb Ecol 62: 1–12, 2011
authors estimated that on average, mixed layer rates ofGPP increased 2- to 3-fold in the equatorial waterscompared the SPSG and NPSG. These same cruisetransects were used in another study to derive esti-mates of NCP based on dissolved inorganic carbonpool 13C/12C mixed layer isotope ratios (Quay et al.2009); these authors estimate that on average, NCPincreased ~2-fold from the subtropics into the near-equatorial waters. Notably, these authors consistentlyobserved positive NCP in all regions studied; the rea-sons underlying differences in the estimates of the netmetabolic state of the ocean, derived from bottle O2
incubations versus such geochemical approaches,remain unknown but fundamental to our understand-ing of ocean carbon cycling.
As has been described for other areas of the world’soceans, we observed that regional differences in NCPwere largely dictated by variations in GPP more sothan R (Arístegui & Harrison 2002, González et al.2002, Agustí & Duarte 2005). On average, we foundthat rates of GPP increased 3- to 4-fold between thesubtropical gyres and equatorial waters, while rates ofR in either region were generally varying <2-fold. Inthe subtropical North Atlantic, Serret et al. (2001,2002) observed up to 4-fold greater variability in ratesof GPP relative to R. Similarly, in both oligotrophic andupwelling regions of the Atlantic Ocean, Arístegui &Harrison (2002) concluded GPP was always more vari-able than R, a finding these authors attribute to differ-ences in the time and space scales over which theseprocesses are coupled. Measurements of planktonmetabolism conducted at a series of coastal sites alongthe western Antarctic shelf also revealed that rates ofGPP and NCP tended to be more variable than R(Agusti et al. 2004). Moreover, these authors observedthat GPP and NCP were positively related, while GPPand R were not, suggesting GPP was the predominantcontrol on NCP. Consistent with these reports, we alsofound that in large regions of the low-nutrient subtrop-ical gyres of the Pacific, rates of R and GPP were eitherbalanced (NCP = 0) or slightly net heterotrophic, whileactive nutrient input to the well-lit upper ocean in theequatorial waters increased GPP and resulted instrongly positive NCP.
A number of studies have sought to identify factorscontrolling the balance of GPP and R in open oceansystems. In a recent meta-analysis of plankton meta-bolism measurements in various marine environ-ments, Duarte & Regaudie-de-Gioux (2009) found thatthe threshold rate of GPP required to achieve meta-bolic balance (GPP = R) was widely variable amongoceanic regions. Globally, this threshold averaged1.09 µmol O2 l–1 d–1, while the oligotrophic waters ofthe Pacific demonstrated some of the lowest thresh-olds of GPP (0.84 µmol O2 l–1 d–1). Compilation of our
measurements in both the nutrient-depleted subtropi-cal gyres and relatively nutrient-enriched waters ofthe equatorial region indicated that at rates of GPP<0.73 µmol O2 l–1 d–1, R tended to balance or exceedGPP. González et al. (2002) and Gist et al. (2009) con-cluded that variability in GPP in oligotrophic regionsof the North Atlantic was predominately controlled byvariations in the supply of nutrients to the upperocean. Similar conclusions were reached by McAn-drew et al. (2007) based on a series of nutrient pertur-bation experiments conducted in the oligotrophicNPSG. These authors observed large increases in GPPwith comparatively smaller changes in R followingaddition of nutrient-enriched deep sea water to upperocean plankton assemblages.
Our data suggest that physical and biological pro-cesses supplying nutrients to the well-lit upper oceanform important controls on the magnitude of GPP.However, the results of the present study do not allowus to determine whether the uncoupling of GPP and Rin the near-equatorial waters stemmed from increasesin the net growth rates of photosynthetic microorgan-isms, or whether the observed increases in GPPreflected increases in the biomass of photosyntheticmicroorganisms. Various lines of evidence, includingpigment determinations and flow cytometric charac-terizations of cell abundances and sizes, suggestphytoplankton biomass in the near-equatorial stationswas elevated relative to the subtropical gyres. Con-centrations of chl a increased by more than 6-fold inthe relatively nutrient-enriched near-equatorial wa-ters, with larger, eukaryotic phytoplankton appearingincreasingly abundant in these waters. Intriguingly,Chl a-normalized rates of GPP varied ~4-fold along thecruise transect, but these rates did not demonstratesignificant regional variability; however, coincidingwith increases in total chl a, the composition of thephytoplankton taxa also changed, making it difficult todetermine whether changes in chl a provide an ade-quate proxy for assessing regional variations in phyto-plankton biomass. Normalization of GPP to PC concen-trations suggested that on a per unit biomass basis, thenear-equatorial waters were as much as ~5-fold moreproductive than the oligotrophic gyres.
There was also evidence suggesting that phyto-plankton physiology varied markedly among theregions sampled in the present study. Flow cytometricdetermination of relative fluorescence and FLS indi-cated that populations of Prochlorococcus in the higherproductivity waters near the equator were larger, andtheir relative fluorescence was brighter, than thosefound in the oligotrophic gyres. Similarly, Prochloro-coccus cell-normalized concentrations of divinyl chl aincreased in the equatorial waters, suggesting regionalchanges in the photophysiology of these picoplank-
10

Viviani et al: Plankton productivity in the Pacific Ocean
tonic assemblages. Such photophysiological changesmight be indicative of spatial variability in photosyn-thetic plankton growth and hence alterations in ratesof GPP.
Taken together, several prominent patterns emergefrom our observations of plankton metabolism and bio-geochemical variability in the Pacific Ocean. Rates ofGPP tended to be greatest in those regions whereplankton biomass was elevated, and larger celled,eukaryotic phytoplankton became increasingly abun-dant; these regions coincided with areas where nutri-ent concentrations were relatively enriched. In con-trast to regional variations in photosynthetic micro-organism biomass and production, rates of R and abun-dances (and presumably biomass) of heterotrophicbacteria were considerably less variable. As a result,throughout the equatorial waters where nutrients wereactively supplied to the upper ocean, imbalances inGPP and R resulted in positive NCP. These data sug-gest latitudinal variations in nutrient supply influencethe biomass and metabolism of photosynthetic plank-ton to a much greater degree than for heterotrophicmicroorganisms.
Heterotrophic bacteria can be major contributors toplankton community respiration (Robinson & Williams2005). The growth, biomass, and respiratory activitiesof these picoplankton appear controlled by a myriad ofbiotic and abiotic processes. Picoplankton-based foodwebs typically demonstrate weak oscillations in bio-mass, likely owing to strong top-down control of popu-lation sizes (Ducklow 1999). In contrast, populationdynamics associated with the biomass of larger, photo-synthetic plankton often appears strongly controlledby bottom-up processes, namely those influencingnutrient and light availability to the upper ocean. Suchprocesses appear to permit expansion of phytoplank-ton biomass through disruption of trophodynamicequilibrium, for example decoupling of phytoplanktongrowth and removal. Our observations suggest that bymodifying the structure and function of the phyto-plankton food web, physical control of nutrient avail-ability plays a key role in regulating GPP and R, andthus net fluxes of carbon and oxygen in large regionsof the Pacific Ocean.
Acknowledgements. We thank the various scientists and staffwho contributed to the CMORE BULA cruise. In particular, R.Bidigare, S. Curless, C. Mahaffey, A. Harlan, S. Christensen,B. Watkins, E. Grabowski, K. Doggett, and L. Fujieki providedsample analyses or logistical support for the project. The com-ments of 3 reviewers improved the manuscript. The Centerfor Microbial Oceanography: Research and Education (C-MORE) provided support for this cruise. We also extend ourgratitude to the officers and crew of RV ‘Kilo Moana’. Fundingfor this study derived from the National Science Foundation(to M.J.C. and D.M.K.), with additional support from the Gor-don and Betty Moore Foundation (to D.M.K.).
LITERATURE CITED
Acker JG, Leptoukh G (2007) Online analysis enhances use ofNASA earth science data. EOS Trans AGU 88, doi:10.1029/2007EO020003
Agustí S, Duarte CM (2005) Threshold of gross primary pro-duction for planktonic metabolic balance in the SouthernOcean: an experimental test. Limnol Oceanogr 50:1334–1339
Agustí S, Satta MP, Mura MP (2004) Summer community res-piration and pelagic metabolism in upper surface Antarc-tic waters. Aquat Microb Ecol 35:197–205
Arístegui J, Harrison WG (2002) Decoupling of primary pro-duction and community respiration in the ocean: implica-tions for regional carbon studies. Aquat Microb Ecol 29:199–209
Azam F, Fenchel T, Field JG, Gray JS, Meyer-Reil LA,Thingstad F (1983) The ecological role of water-columnmicrobes in the sea. Mar Ecol Prog Ser 10:257–263
Bidigare RR, Van Heukelem L, Trees CC (2005) Analysis ofalgal pigments by high performance liquid chromatogra-phy. In: Andersen RA (ed) Algal culturing techniques.Elsevier Academic Press, San Diego, CA, p 327–346
Bouman HA, Ulloa O, Scanlan DJ, Zwirglmaier K and others(2006) Oceanographic basis of the global surface distribu-tion of Prochlorococcus ecotypes. Science 312:918–921
Carlson CA, Ducklow HW, Michaels AF (1994) Annual flux ofdissolved organic carbon from the euphotic zone in thenorthwestern Sargasso Sea. Nature 371:405–408
Carritt DE, Carpenter JH (1966) Comparison and evaluationof currently employed modifications of the Winklermethod for determining dissolved oxygen in seawater; aNASCO report. J Mar Res 24:286–318
del Giorgio PA, Duarte CM (2002) Respiration in the openocean. Nature 420:379–384
del Giorgio PA, Cole JJ, Cimbleris A (1997) Respiration ratesin bacteria exceed phytoplankton production in unpro-ductive aquatic systems. Nature 385:148–151
Dore JE, Karl DM (1996) Nitrite distributions and dynamics atstation ALOHA. Deep-Sea Res II 43:385–402
Duarte CM, Agustí S (1998) The CO2 balance of unproductiveaquatic ecosystems. Science 281:234–236
Duarte CM, Cebrian J (1996) The fate of marine autotrophicproduction. Limnol Oceanogr 41:1758–1766
Duarte CM, Regaudie-de-Gioux A (2009) Thresholds of grossprimary production for the metabolic balance of marineplanktonic communities. Limnol Oceanogr 54:1015–1022
Duarte MC, Agustí S, Arístegui J, González N, Anadon R(2001) Evidence for a heterotrophic subtropical northeastAtlantic. Limnol Oceanogr 46:425–428
Ducklow HW (1999) The bacterial component of the oceaniceuphotic zone. FEMS Microbiol Ecol 30:1–10
Emerson S, Quay P, Karl D, Winn C, Tupas L, Landry M (1997)Experimental determination of the organic carbon fluxfrom open-ocean surface waters. Nature 389:951–954
Emerson S, Stump C, Johnson B, Karl DM (2002) In situ deter-mination of oxygen and nitrogen dynamics in the upperocean. Deep-Sea Res I 49:941–952
Falkowski PG (1994) The role of phytoplankton photosynthe-sis in global biogeochemical cycles. Photosynth Res 39:235–258
Falkowski PG, Fenchel T, Delong EF (2008) The microbialengines that drive Earth’s biogeochemical cycles. Science320:1034–1039
Field CB, Behrenfeld MJ, Randerson JT, Falkowski P (1998)Primary production of the biosphere: integrating terres-trial and oceanic components. Science 281:237–240
11

Aquat Microb Ecol 62: 1–12, 2011
Garside C (1982) A chemi-luminescent technique for thedetermination of nanomolar concentrations of nitrate andnitrite in sea-water. Mar Chem 11:159–167
Gist N, Serret P, Woodward EMS, Chamberlain K, Robinson C(2009) Seasonal and spatial variability in plankton pro-duction and respiration in the Subtropical Gyres of theAtlantic Ocean. Deep-Sea Res II 56:931–940
Goldman JC (1988) Spatial and temporal discontinuities ofbiological processes in pelagic surface waters. In: Roth-schild BJ (ed) Towards a theory on biological and physicalprocesses in the world ocean. Kluwer Academic Publish-ers, Dordrecht, p 273–296
Goldman JC, McCarthy JJ, Peavey DG (1979) Growth rateinfluence on the chemical composition of phytoplankton inoceanic waters. Nature 279:210–215
González N, Anadón R, Marañón E (2002) Large-scale vari-ability of planktonic net community metabolism in theAtlantic Ocean: importance of temporal changes in olig-otrophic subtropical waters. Mar Ecol Prog Ser 233:21–30
Hewson I, Paerl RW, Tripp HJ, Zehr JP, Karl DM (2009)Metagenomic potential of microbial assemblages in thesurface waters of the central Pacific Ocean tracks variabil-ity in oceanic habitat. Limnol Oceanogr 54:1981–1994
Hickman AE, Dutkiewicz S, Williams RG, Follows MJ (2010)Modeling the effects of chromatic adaptation on phyto-plankton community structure in the oligotrophic ocean.Mar Ecol Prog Ser 406:1–17
Jenkins WJ, Goldman JC (1985) Seasonal oxygen cycling and pri-mary production in the Sargasso Sea. J Mar Res 43: 465–491
Johnson ZI, Zinser ER, Coe A, McNulty NP, Woodward EMS,Chisholm SW (2006) Niche partitioning among Prochloro-coccus ecotypes along ocean-scale environmental gradi-ents. Science 311:1737–1740
Juranek LW, Quay PD (2010) Basin-wide photosynthetic pro-duction rates in the subtropical and tropical Pacific Oceandetermined from dissolved oxygen isotope ratio measure-ments. Global Biogeochem Cycles 24:GB2006 doi: 10.1029/2009GB003492
Karl DM, Holm-Hansen O (1978) Methodology and measure-ment of adenylate energy charge ratios in environmentalsamples. Mar Biol 48:185–197
Karl DM, Tien G (1992) MAGIC: a sensitive and precisemethod for measuring dissolved phosphorus in aquaticenvironments. Limnol Oceanogr 37:105–116
Karl DM, Laws EA, Morris P, Williams PJleB, Emerson S(2003) Global carbon cycle (communication arising): meta-bolic balance of the open sea. Nature 426:32
Laws EA, Ditullio GR, Redalje DG (1987) High phytoplanktongrowth and production rates in the North Pacific Subtrop-ical Gyre. Limnol Oceanogr 32:905–918
Luz B, Barkan E (2000) Assessment of oceanic productivitywith the triple-isotope composition of dissolved oxygen.Science 288:2028–2031
Marañón E (2005) Phytoplankton growth rates in the Atlanticsubtropical gyres. Limnol Oceanogr 50:299–310
McAndrew PM, Björkman KM, Church MJ, Morris PJ,Jachowski N, Williams PJleB, Karl DM (2007) Metabolicresponse of oligotrophic plankton communities to deepwater nutrient enrichment. Mar Ecol Prog Ser 332:63–75
Michaels AF, Bates NR, Buesseler KO, Carlson CA, Knap AH(1994) Carbon-cycle imbalances in the Sargasso Sea.Nature 372:537–540
Morán XAG, Perez V, Fernandez E (2007) Mismatch betweencommunity respiration and the contribution of heterotro-phic bacteria in the NE Atlantic open ocean: What causeshigh respiration in oligotrophic waters? J Mar Res 65:545–560
Quay PD, Stutsman J, Feely RA, Juranek LW (2009) Net com-munity production rates across the subtropical and equa-torial Pacific Ocean estimated from air–sea δ13C dis-equilibrium. Global Bigeochem Cycles 23:GB2006 doi:10.1029/2008GB003193
Riser SC, Johnson KS (2008) Net production of oxygen in thesubtropical ocean. Nature 451:323–325
Robinson C Williams PJleB (2005) Respiration and its mea-surement in surface marine waters. In: Williams PJleB, delGiorgia PA (eds) Respiration in aquatic ecosystems.Oxford University Press, Oxford, p 147–180
Robinson C, Serret P, Tilstone G, Teira E, Zubkov MV, ReesAP, Woodward EMS (2002) Plankton respiration in theeastern Atlantic Ocean. Deep-Sea Res I 49:787–813
Serret P, Robinson C, Fernandez E, Teira E, Tilstone G (2001)Latitudinal variation of the balance between planktonphotosynthesis and respiration in the eastern AtlanticOcean. Limnol Oceanogr 46:1642–1652
Serret P, Fernández E, Robinson C (2002) Biogeographic dif-ferences in the net ecosystem metabolism of the openocean. Ecology 83:3225–3234
Serret P, Fernández E, Robinson C, Woodward EMS, Pérez V(2006) Local production does not control the balancebetween plankton photosynthesis and respiration in theopen Atlantic Ocean. Deep-Sea Res II 53:1611–1628
Siegenthaler U, Sarmiento JL (1993) Atmospheric carbondioxide and the ocean. Nature 365:119–125
Strickland JD, Parsons TR (1972) A practical handbook ofseawater analysis. Fisheries Research Board of Canada,Ottawa, ON
Williams PJleB, Morris PJ, Karl DM (2004) Net communityproduction and metabolic balance at the oligotrophic site,station ALOHA. Deep-Sea Res I 51:1563–1578
12
Editorial responsibility: Craig Carlson,Santa Barbara, California, USA
Submitted: March 18, 2010; Accepted: August 24, 2010Proofs received from author(s): October 25, 2010