plankton community respiration along a nutrient · pdf fileplankton community respiration...
TRANSCRIPT

Vol. 61: 75-85, 1990 MARINE ECOLOGY PROGRESS SERIES Mar. Ecol. Prog. Ser.
Published March 8
Plankton community respiration along a nutrient gradient in a shallow Danish estuary
Lillian Magelund Jensen*, Kaj Sand-Jensen, Steen Marcher, Mads Hansen
Freshwater Biological Laboratory, University of Copenhagen, Helsingersgade 51. DK-3400 Hillered, Denmark
ABSTRACT: Plankton community respiration was examined in a shallow, very eutrophic Danish estuary during April to September. Maximum rates (3.98 g O2 m-3 d-l) were measured during the phytoplank- ton spring bloom in the most eutrophicated inner parts. Community respiration was significantly related to biomass and gross productivity of phytoplankton and net production of bacterioplankton. The relationship was weak to temperature and bacterial biomass. Regression analysis suggested that phytoplankton and bacteria, on average, accounted for 64 to 83 % of the community respiration at the 2 most eutrophic localities. The regressions also provided estimates of mean phytoplankton respiration (0.76 mg O2 mg-l chlorophyll a h-', 6.0 % of gross productivity), mean bacterial respiration (1.4 times net production) and mean bacterial growth yield (42 %). Pelagic respiration exceeded benthic respira- tion and became proportionally larger with increasing eutrophication and phytoplankton productivity in the inner parts of the estuary. These results stress the importance of phytoplankton blooms for pelagic respiration, overall oxygen balances and oxygen depletion phenomena.
INTRODUCTION
Oxygen consumption during respiratory degradation of organic compounds in plankton communities is the essential counterpart to photosynthetic carbon assimi- lahon. Photosynthetic and respiratory rates define the trophic status of pelagic environments and the differ- ence between them describes the actual export or degradation of imported organic compounds.
Traditionally, the emphasis on pelagic metabolism has been on primary productivity because of the ease of 14C-measurements compared with the difficult and less sensitive respiratory measurements (Williams 1984). Technical improvements of dissolved oxygen measure- ments by electrodes and Winkler titration (Talling 1973, Bryan et al. 1976, Griffith 1984, Langdon 1984) now allow sensitive measurements of dark oxygen con- sumption even in oligotrophic waters.
The eutrophication problems emerging worldwide in coastal marine waters, and the associated risk of severe oxygen depletion phenomena, have accentuated the need for accurate measurements and robust predic- tions of pelagic oxygen consumption. Many estuaries and coastal waters now experience severe oxygen
Present address: Institute of Biology and Chemistry, Univer- sity of Roskilde, PO Box 260, DK-4000 Roslulde, Denmark
depletion episodes every year resulting in profound changes in the abundance of many marine species, including several of economic importance (Anon. 1984, Officer et al. 1984, Larsson et al. 1985). Oxygen consump- tion has increased both in the water column and the sediment of eutrophicated regions, and pelagic respira- tion is frequently the dominant process (Westernhagen et al. 1986).
Several functional groups of organisms are involved in plankton community respiration. Direct respiration measurements in size-fractions have shown high activities of phytoplankton and bacteria (Williams 1981). Measurements of high biomass and net produc- tion of free-living bacteria subsequently led to the realization that a large proportion of primary productiv- ity is channeled through the microbial food webs of bacteria and heterotrophic flagellates (Azam et al. 1983, Fenchel 1988) in addition to the direct macrozoo- plankton-fish food chain (Steele 1974).
Respiratory processes in oceanic waters and in coast- al waters without substantial input of easily degradable organic compounds from land and benthic plants rely on photosynthetic products from phytoplankton. Dark respiration of phytoplankton is linearly related to their growth rate (cf. Langdon 1988), and thus to their photo- synthetic output, and bacterial metabolism is greatly dependent on utilization of extracellular products of
O Inter-Research/Printed in F. R. Germanv

76 Mar Ecol. Prog. Ser 61 75-85. 1990
photosynthetic origin (cf. Larsson & Hagstrom 1979, 1982). Because phytoplankton and bacteria are usually the main respiring organisms and zooplankton con- tributes much less to plankton community respiration (Williams 1984) we would anticipate a close coupling between phytoplankton productivity and community respiration. This coupllng is also facilitated in the shal- low estuary examined here because the water column is without any permanent thermo- or halocline (Borum 1985).
Biomass and productivity of phytoplankton and bac- teria are therefore likely to be good descriptors of plankton community respiration. For bacteria the coupling to production should be closer than to biomass because of the presence of a variable and often large proportion of inactive bacteria, and because active bac- teria have variable turnover rates (Riemann et al. 1984).
We examined plankton community respiration at 4 locations along a nutrient gradient in the highly eu- trophic Roskilde Fjord. Our purposes were to describe levels and seasonal variations of community respiration and to analyze the relationship to biomass and produc- tivity of phytoplankton and bacteria. An empirical regression model of community respiration was used to estimate the proportions of ~ h ~ t o ~ l a n k t o n and bat- Fig. 1 Map of Roskilde Fjord. Denmark, indicating the 4 terial respiration. Finally, plankton community respira- sampling stations located in basins from the inner to the outer tion was compared with plankton primary productivity part
and benthic respiration to assess the overall oxygen balance of the water column and the sediments.
MATERIALS AND METHODS
Study sites. Roskilde Fjord is a narrow, shallow and soft-bottom estuary connected with Kattegat via the outer part of Isefjord, Denmark (Fig. 1). The tidal amplitude is less than 10 cm. We examined 4 locations situated in natural basins from the less saline (ca 10 %) and very nutrient-rich inner part (Stn 1) to the more saline (ca 19 %D) and less nutrient-rich outer part (Stn 4) (Table 1). Concentrations of inorganic-nitrogen were very high in winter and early spring following run-off from surrounding agricultural areas and concentrations declined greatly after the spring bloom of planktonic diatoms (Table 1 in Borum 1985). Concentrations of inorganic-phosphate were never limitlng to algal growth and concentrations increased during summer due to release from sediments (Table 1 in Borum 1985).
Water sampling. Water was collected with a 5 1 perspex sampler from 3 depths (Stn 1) and 4 depths (Stns 2, 3 and 4) evenly distributed in the shallow water column (4.1 to 8.0 m, Table 1). Community respiration was measured at every depth but other vanables were measured on integrated samples. Measurements of temperature, sal~nity, chemical and biol.oglca1 vanables
usually showed no changes with depth through the water column during this and previous investigations (Borum 1985). During calm periodes, however, depth changes were sometimes observed particularly for community respiration. Samples were collected between 10:OO and 14:OO h and measurements were started immediately (community respiration) or within 1 to 4 h.
Community respiration. Water samples were trans- ferred to a darkened 5 1 perspex cylinder, thoroughly mixed and equipped with a floating lid to avoid oxygen exchange during the following procedure. Water was siphoned via a gas-tight tube through the lid and into 125 m1 darkened Jena glass bottles. Bottles were incu- bated under waler in dark thermoboxes filled with ambient seawater during transport and subsequently under circulation in a thermostated incubator in the laboratory. The bottles were ~ncubated for 24 h at in situ temperature (f 1 "C). The initial and final concen- trations of oxygen were measured on duplicate bottles, from every depth, with a micro-Winkler technique using starch as a visible indicator of the endpoint. We calculated the mean community respiration for the water column from the 3 or 4 sets of measurements with depth each consisting of 2 inltial and 2 final oxygen bottles. The precision of the method required a differ- ence between initial and final samples of 32 mg O2 m-3
Jensen et al.: Plankton community respiration 7 ;
to be significant at the 95 % confidence limit. This is similar to the sensitivity reported by Schwaerter et al. (1988) using amperometric endpoint detection. Oxygen consumption rates were much higher in the estuary, between 220 and 3980 mg O2 m-3 d-l .
Bacterial biomass and net production. Bacteria cell numbers and mean volun~es were determined by epi- fluorescence microscopy on formalin fixed preparations stained with acridine orange (Hobbie et al. 1977). Samples were treated by a deflocculant and by ultrasound before filtration, following Velji (1983). to ensure a more even distribution of bacteria on the filter. The bacterial cells were counted in duplicate samples in several microscopic fields (> 10) containing a total of ca 200 cells. Cell volume was measured 3 times during the investigation by photography of acridine orange preparations compared with filtrates of 1.0 pm latex spheres. The dimensions of bacteria were measured (length and width) and the volume calculated following Fuhrman (1981). Cell volume varied considerably within each sample and there were no significant differences with time and among stations. We used a mean cell volume of 0.063 pm3 in subsequent calcula- tions of biomass and production of bacteria. Biovolume was converted to carbon biomass by a conversion fac- tor, 0.35 pg C pm-3, found for this particular estuary (Bjarnsen 1986).
Bacterial net production was measured by (3H)thy- midine incorporation into cold trichloroacetic acid (TCA) precipitate (Fuhrman & Azam 1980). Triplicate samples of 25 m1 were incubated with 7.8 nM (methyl- 3H) thymidine for 30 min, fixed by 1 % formalin, and 10 m1 subsamples were filtered onto 0.45 pm cellulose nitrate filters. The filters were washed 5 times with 1 m1 5 % ice-cold TCA and radioassayed by liquid scintilla- tion counting (Riemann 1984). Triplicate blanks pre- fixed with formalin were treated like the samples.
(3H)thymidine incorporation was converted into cell production applying an empirical factor, 1.1 X 10¹⁸ cells produced per m01 thymidine, determined in the estuary (Riemann et al. 1987), and into carbon production by multiplying by 0.063 l ~ m 3 cell-' and 0.35 pg C pm-3.
Phytoplankton biomass and gross productivity. Phytoplankton biomass as chlorophyll a was measured by ethanol extraction of duplicate filtered samples (Jes- persen & Christoffersen 1987). Primary production was measured by 14C-incorporation into particulate material in 25 to 30 m1 glass bottles in an incubator at in situ temperature following recommendations in Nielsen e t al. (1981) and Anon. (1983). Bottles were incubated for 2 h in duplicate at photon flux densities between 0 and 547 pE m-2 S-' provided by fluorescent light tubes. Dissolved inorganic carbon was measured on an infrared gas analyzer (Vermaat & Sand-Jensen 1987). Conversion of incubator measurements to In situ estimates of daily primary productivity was based on continuous measurements of surface photon flux density (400 to 700 nm) at Hydrotechnical Laboratory close to Roskilde Fjord and measurements of the vertical diffusive attenuation coefficient of photons (400 to 700 nm) through the water column at every sampling date.
RESULTS
Light, temperature and plankton community structure
Roskilde Fjord has high nutrient levels, high light attenuation and high biomass and productivity of phy- toplankton and bacteria (Tables 1 and 2). Moreover, there is a clear gradient in trophic status from the inner (Stn 1) to the outer parts (Stn 4). Mean levels of phyto- plankton biomass and gross productivity declined 5 to 6-fold along the gradient; bacterial net production
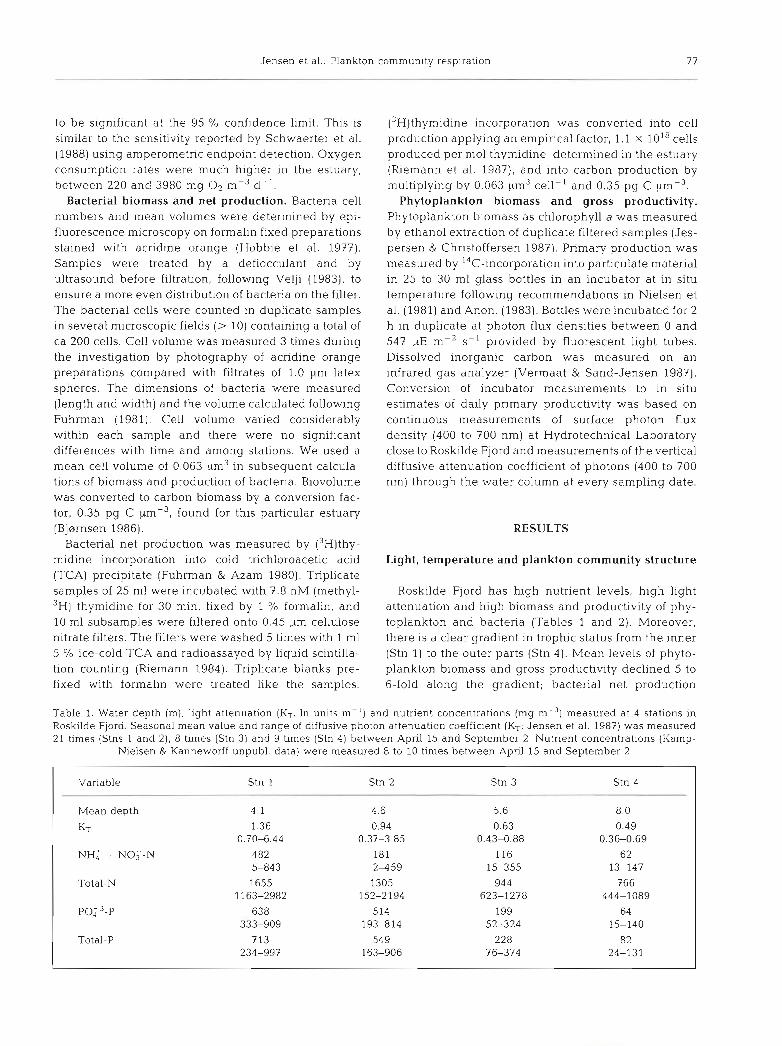
Table 1. Water depth (m), hght attenuation (KT, In units m- ' ) and nutrient concentrations (mg m-" measured at 4 stations in Roskilde Fjord. Seasonal mean value and range of diffusive photon attenuation coefficient (KT; Jensen e t al. 1987) was measured 21 times (Stns 1 and 2). 8 times (Stn 3) and 9 times (Stn 4) between April 15 and September 2. Nutrient concentrations (Kamp-
Nielsen & Kanneworff unpubl. data) were measured 8 to 10 times between April 15 and September 2
Variable Stn 1 Stn 2 Stn 3 Stn 4
Mean depth 4.1 4.6 5.6 8.0
KT 1.36 0.94 0.63 0.49 0.70-6.44 0.37-3.85 0.43-0.88 0.36-0.69
NH: + N03-N 4 82 181 116 62 5-843 2-459 15-355 13-147
Total-N 1655 1305 944 766 1163-2982 152-2194 623-1278 444-1089
PO;~-P 638 514 199 64 333-909 193-814 52-324 15-140
Total-P 713 54 9 228 82 234-997 163-906 76-374 24-131
-

7 8 Mar Ecol. Prog. Ser. 61: 75-85, 1990
Table 2. Community respiration (mg O2 m-.' h- ' ) , phytoplankton biomass (mg chl a m-3), phytoplankton gross productivity at light saturation (mg C m ' h-'), bacterial biomass (mg C m-3) and bacterial net production (mg C m-3 h-') at Stns 1 ( n = 21), 2 (n = 21), 3 (n = 8) and 4 (n = 9) in Roskilde Fjord. Coefficients of variation (CV) for 59 pairs of measurements (CV = SD/X). Seasonal mean values and ranges of measurements between April 15 and September 2. (For community respiration the number of duplicates was 207)
Variable Stn 1 Stn 2 Stn 3 Stn 4 CV ("10)
Community respiration 59.6 34.3 22.5 22 9 10.4 11.7-165.8 10.0-117.1 9.2-42.5 9.6-61.3 0-75
Phytoplankton biomass 39.9 14.2 7.2 7.0 2.9 7.7-165 3.2-103 1.8-20.2 4.6-15.6 0-17
Phytoplankton gross produ.ctivity 172.9 69.4 45.4 28.9 4.8 35.8-362 12.4-360 10 6-129 17.1-44.6 0-29
Bacterial biomass 25 1 210 192 107 12.4 32-240 67-389 74-326 53-148 0.27
Bacterial net production 5.8 3.6 2.0 1.5 8.0 1.6-11.0 0.62-7.3 1.0-3.5 0.57-2.2 0-34
decl~ned 4-fold; and bacterial biomass dropped 2.5- fold. The reproducibility of these measurements was high, i.e. the mean coefficients of variation (CV) of the duplicate measurements were 2.9, 4.8, 8.0 and 12.4 % respectively (Table 2) .
The seasonal patterns of surface light, water temper- ature and phytoplankton biomass are shown in Figs. 2 and 3. Water temperatures increased from ca 5 "C in mid April to ca 17 'C in mid June and fluctuated about this value until September (Fig. 2). Phytoplankton bio- mass showed a pronounced spring bloom at all 4 loca- tions shortly after the ice disappeared and declined to 3 to 4-fold lower summer levels (Fig. 3).
Community respiration and correlation among variables
Community respiration was very high In the estuary and followed the same gradient as biomasses and pro- ductivities of phytoplankton and bacteria (Table 2) . Mean community respiration was 59.6 mg O2 m-3 h-' (1430 mg O2 m-3 d-') at Stn 1 and almost 3-fold lower at Stn 4 (22.9 mg O2 m-3 h-'; 550 mg O2 m-.' d-l) . 'The maximum community respiration occurred during the phytoplankton spring bloom attaining levels of 166 and 117 mg O2 m-3 h-' (3980 and 2810 mg O2 m-3 d-l) at Stns 1 and 2, respectively (Fig. 4). The reproducibility of community respiration measurements was high, with a mean CV of only 10.4 % (Table 2) .
Simple correlation analysis based on 59 measure- ments at all 4 1ocati.ons between April 15 a n d Sep- tember 2 showed that community respiration was sig- nificant[~ correlated with, phytoplankton biomass (r = 0.79). phytoplankton productivity (r = 0.68) and bac- terial net production (r = 0.59), but not with bacterial
Fig. 2. Surface 11ght (upper) and water temperature (lower) in Roskilde Fjord between April 15 and September 2. Surface light was measured as photon flux density (400 to 700 nm) at the nearby Hydrotechnical Laboratory and daily values were averaged over 7 d. Water temperature is the mean and range
at all 4 locations between 10:OO and 15.00 h

Jensen et a1 . Plankton commun~ty respiration 7 9
- St. 1 --- St. 2
l I l I I
....... - :\ St. 3
I : ---- St. 4
: \ I 't 1 :....\...
, . / I . I . \, **m.
I: -. I .
\, -. ................... . .
- /\, 8 \':= .' m: , ".\. -. . P. ..l *.:.
I 1 I 1 1
Fig. 3. Phytoplankton biomass (mg chl a m-3) at 4 locations in Fig. 4. Plankton community respiration (mg Oz m-3 h-') at 4 Roskilde Fjord between April 15 and September 2 locations in Roskilde Fjord between April 15 and September 2
biomass (r = 0.16) or water temperature (-0.04, Table 3). In addition, phytoplankton biomass, phytoplankton productivity and bacterial net production were signifi- cantly intercorrelated (r = 0.47 and 0.89 respectively), as were bacterial net production and bacterial biomass (r = 0.52, Table 3).
The high levels of community respiration, phyto- plankton biomass and phytoplankton productivity at low temperature in spring resulted in a negative corre- lation with temperature (r = -0.04, -0.24, -0.11, respectively, Table 3). Bacterial biomass and bacterial net production showed a less pronounced spring max-
imum (data not shown) and accordingly, a small posi- tive temperature correlation (r = 0.39 and 0.22 respec- tively, Table 3) .
We examined more closely the relationship of com- munity respiration with phytoplankton biomass, phyto- plankton productivity and bacterial net production by linear regression analysis (Table 4 ) . Because we had 21 measurements over the season (April to September) at Stns 1 and 2 and only 8 to 9 at Stns 3 and 4, we performed the analysis for Stns 1 and 2 separately, and for all 4 locations together. The relationships of com- munity respiration with phytoplankton biomass and
Table 3. Correlation coefficients between plankton community respiration, phytoplankton biomass (PB) and gross productivity (PGP), bacterial biomass (BB) and net production (BNP), and water temperature in Roslulde Fjord between April 15 and
September 2 (n = 59)
Variable PB PGP BB BNP Temp
Community respiration 0.79" ' 0.68" ' 0.16 0.59- ' -0.04 Phytoplankton biomass - 0.89' 0.07 0.47 ' -0.24 Phytoplankton gross productivity - 0.16 0.50" ' -0.11 Bacterial biomass - 0.52"' 0.39' ' Bacterial net production - 0.22

80 Mar. Ecol. Prog. Ser 61: 75-85, 1990
Table 4. l n e a r regression analysis (from the equation y = a ( f SE) X + b (+ SE)] between plankton community respiration (CR) and 3 significantly related variables: phytoplankton biomass (PB), phytoplankton gross productivity (PGP) and bacterial net production (BNP). Relationships were based on measurements at Stn 1, Stn 2 and all 4 locations together in Roslulde Fjord
between April 15 and September 2. Units as in Table 2
Locality Linear regression R* n F
Stn 1 CR = 0.76' ' ' (0.16) PB + 29" (8) CR = 0.16' (0.06) PGP + 32' (13) CR = 7.8' ' (2.6) BNP + 14 (16)
Stn 2 CR = 0.91" ' (0.17) PB + 21 ' ' ' (4) CR = 0.24' " (0.05) PGP + 18. (5) CR = 0.46 (3.0) BNP + 33' (13)
Stns 1 4 CR = 0.87"' (0.09) PB + 21"' (3) CR = 0.21 ' ' ' (0.03) PGP + 20' ' ' (4) CR = 7.2"' (1.3) BNP + 12' (6)
Significant at ' p <0.05, " p <0.01, ' " p<0.001
productivity were highly significant (p < 0.001) at Stns 1 and 2, and a t all locations together. The relationship of community respiration with bacterial net production was significant at Stn 1 and all locations together, but not at Stn 2. Phytoplankton biomass was the best single predictor of community respiration with values of 0.56, 0.61 and 0.63. The relationship of community respiration with phytoplankton biomass and productiv- ity was reliable since the coefficients of respiration to phytoplankton biomass (0.76 to 0.91 mg O2 mg-l chl a h-') and phytoplankton gross productivity (0.16 to 0.24 mg O2 mgP1 C) were both relatively constant and agreed with previous laboratory measurements (see 'Discussion' - 'Phytoplankton and bacteria in pelagic respiration'). In all 9 equations there was a positive 'background' respiration that was significantly differ- ent from zero in 8 cases (Table 4) . This suggested that phytoplankton or bacteria did not account for all respiratory activity.
We combined the 2 functional groups by multiple linear regression analysis of community respiration
versus phytoplankton biomass and bacterial net pro- duction or phytoplankton productivity and bacterial net production (Table 5). This analysis reduced the varia- tion in community respiration not accounted for by the 2 independent variables and also reduced the back- ground respiration. The equations including phyto- plankton biomass and bacterial net production (R2 =
0.62, 0.65 and 0.69) were superior to those including phytoplankton productivity and bacterial net produc- tion ( R ~ = 0.42, 0.55 and 0.57, Table 5). The main descriptors in the equations were phytoplankton bio- mass and productivity rather than bacterial net pro- duction. The coefficient of respiration to bacterial net production, however, was significant in 4 out of 6 equations, and background respiration had declined to between 7 and 16 mg O2 m-3 h-' and was only significantly dfferent from zero in 1 of the 6 equations (Table 5).
The measured community respiration was compared with that calculated from the 2 multiple regression equations (Eqs. 5 and 6, Table 5) that comprised the
Table 5 Multiple linear regression analysis [from the equation y = a , (f SE) X , + a2 (?SE) x2 + b (&SE)] of plankton community respiration (CR) in relation to phytoplankton biomass (PB) and bacterial net production (BNP) or phytoplankton gross productivity (PSP) and bacterial net production (BNP). Relationships were based on measurements at Stn 1, Stn 2 , and all four locations
together in Roslulde Fjord between April 15 and September 2. Units as in Table 2
Locality Multiple regression R2 n F
Stn 1 (1) CR = 0.63"' (0.15) PB + 4.6' (2.0) BNP + 8 (12) 0.65 2 1 17.0 (2) CR = 0.10 (0.06) PGP + 6.1' (2.6) BNP + 7 (16) 0.42 21 6.6
Stn 2 (3) CR = 0.91' " (0.17) PB + 1.1 (2.0) BNP + 17 (8) 0.62 2 1 14.7 (4) CR = 0.24 ' ' ' (0 05) PGP + 1.8 (2.1) BNP + l l (10) 0 57 2 1 12.1
Stns 1-4 (5) CR = 0.72' ' ' (0.09) PB + 3.4' ' (1.0) BNP + 11 ' ' (4) 0.69 59 62.6 (6) CR = 0.15" ' (0.03) PGP + 4 1" (1 3) BNP -L 9 (5) 0 55 59 34.3
Significant at ' p < 0.05, " p < 0.01, " ' p <0.001
Jensen et al.: Plankton community respiration 8 1
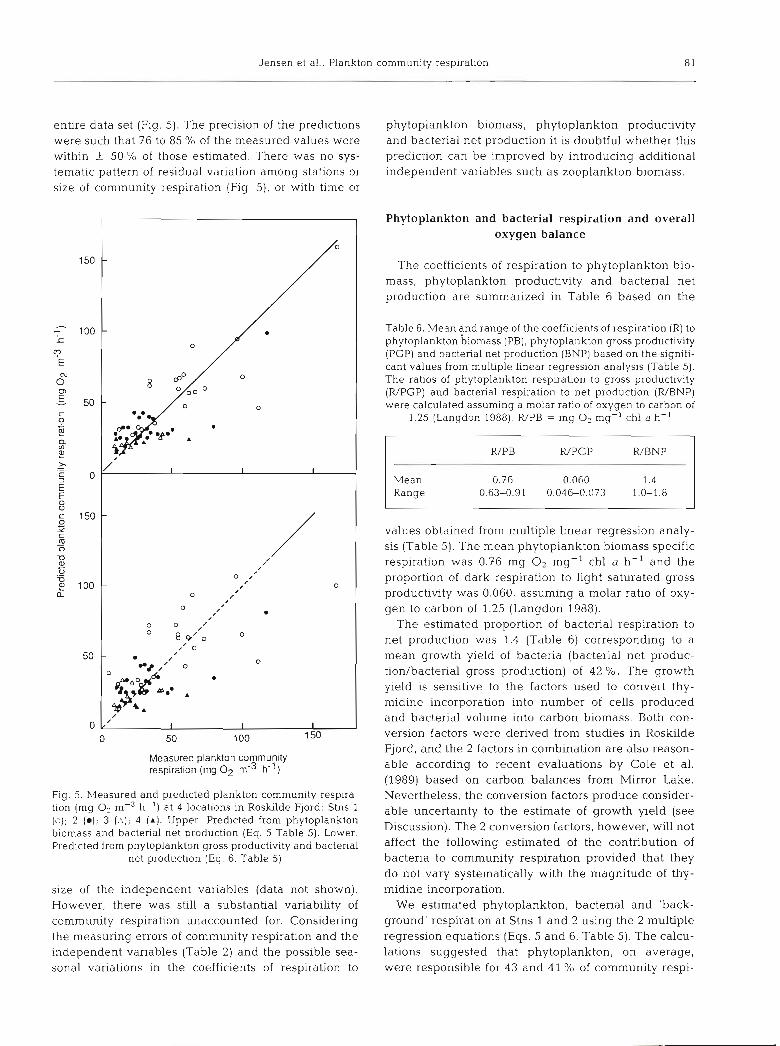
entlre data set (Fig. 5). The precision of the predictions phytoplankton biomass, phytoplankton productivity were such that 76 to 85 % of the measured values were and bacterial net production it is doubtful whether this within k 50 % of those estimated. There was no sys- prediction can be improved by introducing additional tematic pattern of residual variation among stations or independent variables such as zooplankton biomass. slze of community respiration (Fig 5), or with time or
/ The coefficients of respiration to phytoplankton bio- mass, phytoplankton productivity and bacterial net production are summarized in Table 6 based on the
Phytoplankton and bacterial respiration and overall
Measured plankton community respiration (mg O2 m-3 h-')
/o
Fig. 5. Measured and predicted plankton comnlunity respira- tion (mg O2 m-3 h-') at 4 locations in Roskilde Fjord: Stns 1 (2); 2 (a); 3 ( A ) ; 4 (A). Upper: Predicted from phytoplankton biomass and bacterial net production (Eq. 5 Table 5). Lower: Predicted from phytoplankton gross productivity and bacterial
net production (Eq. 6, Table 5)
oxygen balance
size of the independent variables (data not shown). However, there was still a substantial variability of community respiration unaccounted for. Considering the measuring errors of community respiration and the independent variables (Table 2) and the possible sea- sonal variations in the coefficients of respiration to
Table 6. Mean and range of the coefficients of respiration (R) to phytoplankton biomass (PB), phytoplankton gross productivity (PGP) and bacterial net production (BNP) based on the signifi- cant values from multiple linear regression analysis (Table 5 ) . The ratios of phytoplankton respiration to gross productivity (RIPGP) and bacterial respiration to net production (R/BNP) were calculated assuming a molar ratio of oxygen to carbon of
1.25 (Langdon 1988). WPB = mg O2 mg-' chl a h-' 1 R/:. WPGP W:: 1 Mean 0.060 Range 0.63-0.91 0.046-0.073 1.0-1.8
values obtained from multiple linear regression analy- sis (Table 5). The mean phytoplankton biomass specific respiration was 0.76 mg O2 mg-' chl a h-' and the proportion of dark respiration to light saturated gross productivity was 0.060, assuming a molar ratio of oxy- gen to carbon of 1.25 (Langdon 1988).
The estimated proportion of bacterial respiration to net production was 1.4 (Table 6) corresponding to a mean growth yield of bacteria (bacterial net produc- tiodbacterial gross production) of 42 %. The growth yield is sensitive to the factors used to convert thy- midi.ne incorporation into number of cells produced and bacterial volume into carbon biomass. Both con- version factors were derived from studies in Roskilde Fjord, and the 2 factors in combination are also reason- able according to recent evaluations by Cole et al. (1989) based on carbon balances from Mirror Lake. Nevertheless, the conversion factors produce consider- able uncertainty to the estimate of growth yield (see Discussion). The 2 conversion factors, however, will not affect the following estimated of the contribution of bacteria to community respiration provided that they do not vary systematically with the magnitude of thy- midine incorporation.
We estimated phytoplankton, bacterial and 'back- ground' respiration at Stns 1 and 2 using the 2 multiple regression equations (Eqs. 5 and 6, Table 5). The calcu- lations suggested that phytoplankton, on average, were responsible for 43 and 4 1 O/O of community respi-
82 mar Ecol. Prog. Ser 61 75-85, 1990
ration at Stn 1, bacteria for 35 and 42 %, and 22 and 17 % of the respiration were not accounted for. At Stn 2, the estimated mean contributions were 26 and 29 % for phytoplankton, 38 and 43 O/O for bacteria and 28 and 36 % were not accounted for.
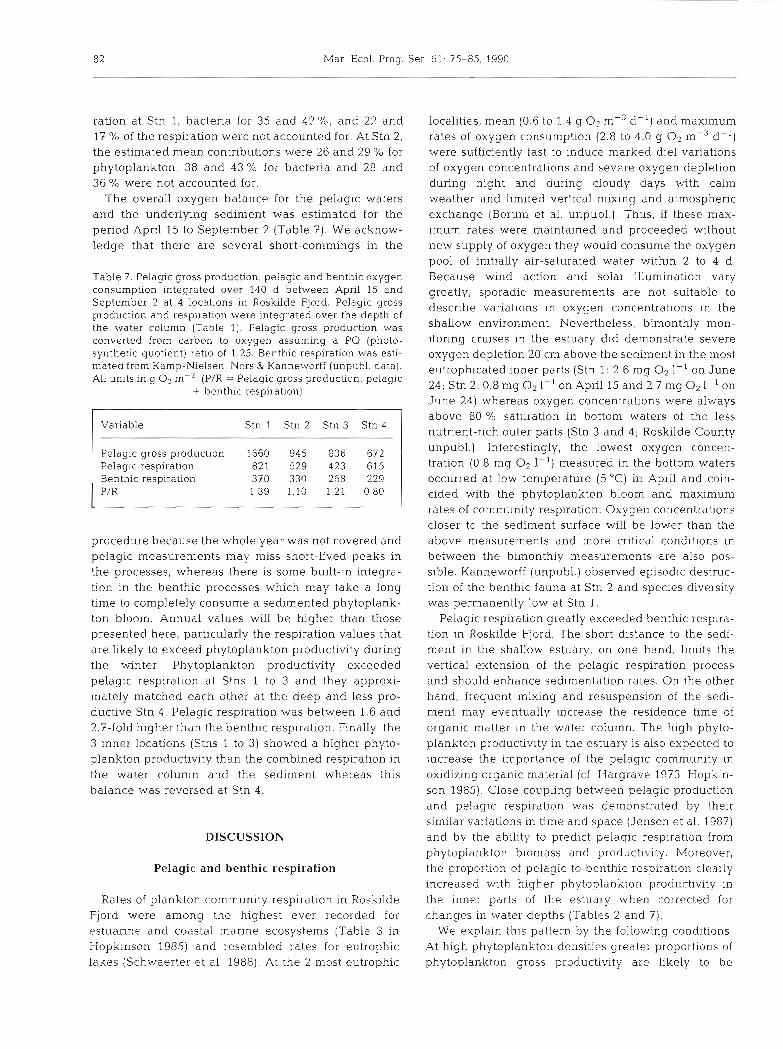
The overall oxygen balance for the pelagic waters and the underlying sediment was estimated for the period April 15 to September 2 (Table 7) . We acknow- ledge that there are several short-commings in the
Table 7. Pelagic gross production, pelagic and benthic oxygen consurnpbon integrated over 140 d between April 15 and September 2 at 4 locations in Roskilde Fjord. Pelagic gross production and respiration were integrated over the depth of the water column (Table 1). Pelagic gross production was converted from carbon to oxygen assuming a PQ (photo- synthetic quotient) rat10 of 1.25. Benthic respiration was esti- mated from Kamp-Nielsen, Nors & Kanneworff (unpubl. data). All units in g O2 m-' (P/R = Pelagic gross production: pelagic
+ benthic respiration)
1 Variable Stn l Stn 2 Stn 3 Stn 4
Pelagic gross production 1660 945 836 672 Pelagic respiration 821. 529 423 615 Benthic respiration 370 330 268 229 P/R 1.39 1.10 1.21 0.80
procedure because the whole year was not covered and pelagic measurements may miss short-lived peaks in the processes, whereas there is some built-in integra- tion in the benthic processes which may take a long time to completely consume a sedimented phytoplank- ton bloom. Annu.al values will be higher than those presented here, particularly the respiration values that are likely to exceed phytoplankton productivity during the winter Phytoplankton productivity exceeded pelagic respiration at Stns 1 to 3 and they approxi- mately matched each other at the deep and less pro- ductive Stn 4. Pelagic respiration was between 1.6 and 2.7-fold higher than the benthic respiration. Finally, the 3 inner locations (Stns 1 to 3) showed a higher phyto- plankton productivity than the combined respiration in the water column and the sediment whereas this balance was reversed at Stn 4.
DISCUSSION
Pelagic and benthic respiration
Rates of plankton community respiration in Roskilde Fjord were among the highest ever recorded for estuarine and coastal marine ecosystems (Table 3 in Hopklnson 1985) and resembled rates for eutrophic lakes (Schwaerter et al. 1988). At the 2 most eutrophic
localities, mean (0.6 to 1.4 g O2 m-3 d-l) and maximum rates of oxygen consumption (2.8 to 4.0 g 0 2 m-3 d-l) were sufficiently fast to induce marked die1 variations of oxygen concentrations and severe oxygen depletion during night and during cloudy days with calm weather and limited vertical mixing and atmospheric exchange (Borum et al. unpubl.). Thus, if these max- imum rates were maintained and proceeded without new supply of oxygen they would consume the oxygen pool of initially air-saturated water within 2 to 4 d . Because wind action and solar illumination vary greatly, sporadic measurements are not suitable to describe variations in oxygen concentrations in the shallow environment. Nevertheless, bimonthly mon- itoring cruises in the estuary did demonstrate severe oxygen depletion 20 cm above the sediment in the most eutrophicated inner parts (Stn l : 2.6 mg O2 1-' on June 24; Stn 2: 0.8 mg O2 1-I on April 15 and 2.7 mg O2 1 - I on June 24) whereas oxygen concentrations were always above 80 % saturation in bottom waters of the less nutrient-rich outer parts (Stn 3 and 4; Roskilde County unpubl.). Interestingly, the lowest oxygen concen- tration (0.8 mg 0 2 1-l) measured in the bottom waters occurred at low temperature (5 "C) in April and coin- cided with the phytoplankton bloom and maximum rates of community respiration. Oxygen concentrations closer to the sediment surface will be lower than the above measurements and more critical conditions in between the bimonthly measurements are also pos- sible. Kanneworff (unpubl.) observed episodic destruc- tion of the benthic fauna at Stn 2 and species diversity was permanently low at Stn 1.
Pelagic respiration greatly exceeded benthic respira- tion in Roskilde Fjord. The short distance to the sedi- ment in the shallow estuary, on one hand, limits the vertical extension of the pelagic respiration process and should enhance sedimentation rates. On the other hand, frequent mixing and resuspension of the sedi- ment may eventually increase the residence time of organic matter in the water column. The high phyto- plankton productivity in the estuary is also expected to increase the importance of the pelagic community in oxidizing organic material (cf. Ilargrave 1973, Hopkin- son 1985). Close coupling between pelagic production and pelagic respiration was demonstrated by their similar variations in time and space (Jensen et al. 1987) and by the ability to predict pelagic respiration from phytoplankton biomass and productivity. Moreover, the proportion of pelagic to benthic respiration clearly increased with high.er phytoplankton productivity in the inner parts of the estuary when corrected for changes in water depths (Tables 2 and 7) .
We explain this pattern by the following conditions. At high phytoplankton densities greater proportions of phytoplankton gross productivity are likely to be
Jensen et a1 . Plankton comn~un~ty respiration 83
respired by phytoplankton because of poor light pene- tration in the water column and because phytoplankton respiration constitutes a large proportion of community respiration. Respiration of sedinlents receiving a sur- plus of degradable organic material, on the other hand, is likely to be constrained by oxygen availability because of slow diffusive supply. h4oi-eover, benthic macroinvertebrates are important for ventilation of sed- iments and they often disappear under very eutrophic conditions. The benthic fauna, for example, was greatly decimated at Stn 1.
The predictions of pelagic resplration established for Roskilde Fjord were based on easily accessible inde- pendent variables and the predictions probably apply to other phytoplankton-rich, shallow, and well-mixed temperate waters. However, they need to be tested and eventually altered to be of more general use in areas with different mixing patterns and smaller phytoplank- ton productivities. In particular, temporal and spatial separations between photosynthesis and respiration will be more significant in larger and deeper stratified waters (Officer et al. 1984). Also, there may be other fundamental differences because of the highly eutrophic conditions in Roskilde Fjord compared with most other marine systems.
Phytoplankton and bacteria in pelagic respiration
Phytoplankton and bacteria were the 2 main func- tional groups of respiring orgamsms in the plankton community in Roskilde Fjord according to our estimates. Pelagic respiration not accounted for by these organisms was est~mated to mean values between 17 and 36 % of total respiration at the 2 most eutrophic localities, and in addition to random residual variation involve respiration of heterotrophic flagel- lates, ciliates and crustacean zooplankton. The overall importance of phytoplankton and bacteria in plankton respiration was supported in several ways. Size- fractionation of pelagic respiration in Roskilde Fjord at Stns 1 and 2 (Jensen et al. unpubl.) showed the same dominant contribution of phytoplankton and bacteria and the results were quantitatively in close agreement with the regression estimates. Previous size-fractiona- tion experiments in eutrophic marine waters and in lakes (Williams 1984, Schwaerter et al. 1988) show the high respiratory activity of the 2 functional groups and stress the major importance of free-living bacteria in utilizing dissolved organic compounds.
The maximum community respiration occurred during the phytoplankton spring bloom at low temperatures (5 to 7 "C). Pronounced spring blooms are typical of most temperate coastal waters and the highest respiratory rates are likely to be associated with the development or
collapse of these blooms (Lancelot & Billen 1984). h s k s of oxygen deplet~on are usually searched for during high temperatures and stratified conditions during summer and early autumn. Severe oxygen depletion, however, may develop during all major bloom events in conjunc- tion with short-term reduction of turbulent mixing (e .g . the observations at Stns 1 and 2). Recent observations of oxygen depletion in the Danish Kattegat and Great-Belt area during the early spring bloom (Nielsen 1988), also support this view.
Estimates of phytoplankton and bacterial respiration derived from the regression models were in overall agreement with previous laboratory measurements. The mean biomass specific respiration rate for phyto- plankton (0.76 mg O2 mg-' chl a h-' , Table 6) was within the range of 0.1 to 1 mg O2 mg-l chl a h-' given by Harns (1978) and corresponded with the mean maintenance respiration of 0.66 mg O2 mg-' chl a h-' for 1 2 species in laboratory culture compiled by Lang- don (1988, his Table 6). The proportion of phytoplank- ton respiration to Light saturated productivity derived from the regression models was 0.060 (Table 6) . Again, this value agrees with proportions found by other authors: 0.05 to 0.10 (Laws 1975), 0.04 to 0.07 (Harns &
Piccinin 1977), and 0.06 (Holligan 1984). Phytoplank- ton respiration is composed of two components: maintenance respiration, which is perhaps variable among species, and growth resplration, which may be proportional to growth (Langdon 1988). Biomass and production specific respiration rates may therefore vary seasonally with species composition, growth dynamics, and light availability of the phytoplankton assemblage. This would produce considerable scatter in the rela- tionship between measured and estimated community respiration.
The mean ratio of respiration to net production of bacteria obtained by multiple regression analysis was 1.4 (Table 6) and mean bacteria growth yield was 42 %. The mean bacterial growth yield attained by size- fractlonation technique in Roskilde Fjord was 46% (Sand-Jensen et al. unpubl.). We acknowledge that there are many assumptions and potential errors associated with these growth yield estimates including: the conversion factors for estimating bacterial net pro- duction, the generated regression models, the oxygen/ carbon ratios applied, and analytical errors. Neverthe- less, the estimates of bacterial growth yield attained are clearly reasonable and within the wide limits of 20 to 80 % cited by most previous authors (cf. B j~rnsen 1986). Bacterial growth yield may vary depending on substrate composition and its carbon/nitrogen ratio (Goldmann et al. 1987) and temperature. Methodologi- cal problems, however, also affect the results. Very high estimates (65 to 78 Oh) have been obtained in incubations of a few hours of bacteria with radio-

84 Mar. Ecol. Prog. Ser. 61 75-85, 1990
labelled substrates but they c a n b e viewed a s estimates of u p t a k e efficiences rather t h a n growth yield (Bjornsen 1986). By contrast, mean growth yields of 21 O/O were obtained b y carbon mass balances of bacteria cultures supplied with filtered wate r from Rosiulde Fjord (Bjnrn- s e n 1986). Only future direct measurements c a n con- firm our findings a n d reveal the natural variations of bacterial growth yield.
CONCLUSIONS
Pelagic respiration w a s very high a n d exceeded benthic respiration in t h e phytoplankton-rich inner parts of Roskilde Fjord. W e a r g u e that pelagic respira- tion increased relative to benthic respiration w t h increasing eutrophication. This w a s because t h e pro- portion of gross productivity respired by phytoplankton increased, oxygen availability constrained benthic a n d not pelagic respiration, a n d benthic macroinvertebrate populations w e r e reduced a t t h e most eutrophic site.
Pelagic respiration w a s closely related to seasonal a n d spatial changes in biomass a n d gross production of phytoplankton a n d ne t production of bacter iain Roskilde Fjord. T h e relationship to bacterial biomass w a s poor, probably because of variable growth rates a n d the presence of m a n y inactive bacteria. T h e relationship to temperature w a s negat ive because pelagic respiration p e a k e d dur ing t h e spring bloom of phytoplankton. High pelagic respiration rates a r e therefore associated with formation a n d collapse of phytoplankton blooms, inde- p e n d e n t of temperature a n d the time of year. Multiple regression models of community respiration versus bio- mass or gross production of phytoplankton a n d net production of bacteria based o n 59 d a t a se t provided m e a n est imates of phytoplanktion respiration (0.76 m g O2 mg-' chl a h-' , 6.O0/0 of gross productivity) a n d bacterial growth yield (42 %) that corresponded with previous laboratory estimates. W e acknowledge that these values may c h a n g e with time a n d space because of variable species composition a n d resource availabilities.
Acknowledgements. This study was supported by the Danish Environment Protection Agency. We thank F. Pedersen, P. K. Bjornsen and H. J. Hansen for help during the work and P K Bjornsen and M. Sendergaard for valuable suggestions on the manuscript.
LITERATURE CITED
Anon. (1983). Dansk Standard. DS.293. Vandundersegelser. Planktonalgers kulstofassimilation I inkubator med 14C metoden, Dansk StandardiseringsrBd, Copenhagen, p. 1-17 (in Danish)
Anon. (1984). Iltsvind og fiskeded i 1981. The National Agency of Environmental Protection, Denmark (in Dan~sh)
Azam, F., Fenchel, T., Field, J . G., Gray, J. S , Meyer-Reil, L. A., Thingstad, F. (1983). The ecological role of water- column microbes in the sea. Mar Ecol. Prog. Ser. 10: 257-263
Bj~rnsen, P. K (1986). Bacterioplankton growth yield in con- tinuous seawater cultures. Mar Ecol. Prog. Ser. 30. 191-196
Borum, J. (1985). Development of epiphytic communities on eelgrass (Zostera marina) along a nutrient gradient in a Danish estuary. Mar Biol. 87: 223-241
Bryan, J. R.. Riley, J . P., Williams, P. J., le B. (1976). A Winkler procedure for making precise measurements of oxygen concentrations for productivity and related stuches. J. exp. mar. Biol Ecol. 21. 191-197
Cole, J . J. , Caraco, N. F., Strayer, D L., Ochs, C., Nolan, S. (1989). A detailed organic carbon budget as an ecosystem level calibration of bacterial respiration in an oligotrophic lake during midsummer Limnol. Oceanogr. 34: 286-296
Fenchel, T (1988). Marine plankton food chains. A. Rev. Ecol Syst. 19: 19-38
Fuhrman, J. A. (1981). Influence of method on the apparent size distribution of bacterioplankton cells: epifluorescence microscopy compared to scanning electron microscopy. Mar. Ecol. Prog. Ser. 5: 103-106
Fuhrrnan, J. A., Azam, F. (1980). Bacterioplankton secondary production estimates for coastal waters off British Colorn- bia, Antarctica and California. Appl. envir Microbiol. 39: 1085-1095
Goldman, J. C., Caron, D. A., Dennett. M. R. (1987). Regula- tion of gross growth efficiency and ammonium regenera- tion in bacteria by substrate C:N ratio. Lirnnol. Oceanogr. 32: 1239-1252
Griff~th, P. C. (1984). A high-precision respirometer for measuring small rates of change in the oxygen concen- tration of natural waters. Limnol. Oceanogr 33: 632-638
Hargrave, B. T. (1973). Coupling carbon flow through some pelagic and benthic communities. J Fish. Res. Bd Can. 30: 1317-1326
Harris, G. P. (1978). Photosynthesis, productivity and growth: the physiological ecology of phytoplankton. Arch. Hy- drobiol. (Beih. Ergebn Lirnnol.) 10: 1-171
Harris, G. P., Plccinin, B. B. (1977). Photosynthes~s by natural phytoplankton populations. Arch. Hydrobiol. 80: 405-457
Hobbie, J. E., Daley, R. J. , Jasper, S. (1977). Use of nucleopore filters for counting bacteria fluorescence microscopy. Appl. envir Microbiol. 33: 1225-1228
Holligan, P. M. (1984). Photosynthesis. respiration and nitro- gen supply of plankton populations in stratified frontal and tidally mixed shelf waters. Mar. Ecol. Prog. Ser. 17: 201-213
Hopkinson, C. S., Jr (1985). Shallow water benthic and pelagic metabolism: evidence of heterotrophy in the nearshore Georgia Bight. Mar Biol. 87: 19-32
Jensen, L. M., Marcher, S , Hansen, M (1987). Produktion og o m s ~ t n i n g of organisk stof i de frie vandmasser 1 Roskilde Fjord. MS. Thesis, Freshwater Biological Laboratory, Uni- versity of Copenhagen (in Danish)
Jespersen, A., Kristoffersen, K. (1987). Measurements of chlorophyll-a from phytoplankton using ethanol as extrac- tion solvent. Arch. Hydrobiol. 109: 44-54
Lancelot, C., Billen, G. (1984). Activity of heterotrophic bac- teria and its coupling to primary production during the sprlng phytoplankton bloom in the southern bight of the North Sea. Lirnnol. Oceanogr. 29: 721-730
Langdon, C. (1984). Dissolved oxygen monitoring system using a pulsed electrode: design, performance and evalua- tion Deep-Sea Res. 31. 1357-1367

Jensen et a1 . Plankton community respiration 85
Langdon, C. (1988) On the causes of interspecific differences in the growth-irradiance relationship for phytoplankton. 2. A general review. J. Plankton Res. 10- 1291-1312
Larsson, U, , Hagstrom, A (1979). Phytoplankton exudate release as an energy source for the growth of pelagic bactena Mar Biol 52: 199-206
Larsson, U , Hagstrom, A. (1982) Fractionated phytoplankton primary production, exudate release, and bacterial pro- duction in a Baltic eutrophication gradient Mar Biol. 67. 57-70
Larsson, V R., Elmgren, R., Wulff, F. (1985) Eutrophication and the Baltic Sea: causes and conseqenses. Ambio 14. 10-14
Laws, E A. (1975). The importance of respiration losses in controlling the size dstribubon of marine phytoplankton. Ecology 56. 4 1 9 4 2 7
Nlelsen, G. A. (1988) Arsrapport 1987. The National Agency of Environmental Protection, Denmark (in Danish)
Nielsen, G. A., Jacobsen, T. S. , Gargas, E., Buch, E. (1981) The Belt Project. Evaluation of physical, chemical and biolog~cal measurements. The National Agency of Enwonmenta l Protection, Denmark
Officer, C. B , Biggs, R B., Toft, J . L , Cronin, L. E , Tyler, M. A., Boynton, W. R. (1984). Chesapeake Bay anoxia: ongin, development and significance. Science, N.Y 223: 22-27
Riemann, B. (1984). Determining growth rates of natural assemblages of freshwater bacteria by means of 3H-thy- midine incorporation into DNA: comments on methodol- ogy. Arch. Hydrobiol. (Beih. Ergebn. Limnol.) 19: 67-80
h e m a n n , B., Bjsrnsen, P. K. , Newell, S., Fallon, R. (1987). Calculation of cell production of coastal manne bacteria based on measured incorporation of 3H-thymidine. Limnol. Oceanogr 32: 4 7 1 4 7 6
This article was subm~t t ed to the edltor
f i emann , B., Nielsen, P., Jeppesen, M, , Marcussen, B., Fuhr- man, J . A. (1984) Die1 changes in bacterial biomass and growth rates in coastal environments, determined by means of thymidine incorporation into DNA, frequency of dlviding cells (FDC), and microautoradiography. Mar. Ecol. Prog. Ser 17: 227-235
Schwaerter, S. . Ssndergard, M , Riemann, B., Jensen, L M. (1988). Respiration in eutrophic lakes. the contnbut~on of bactenoplankton and bacterial growth yield. J . Plankton Res. 10. 515-531
Steele, J . H. (1974). The structure of marine ecosystems. Blackwell Scientific Publications, Oxford
Talling, J . F. (1973). The application of some electrochemical methods to the measurement of photosynthes~s and respi- ration in freshwaters. Freshwat. Biol. 3: 335-362
Velji, M. I. (1983). Improved microscopic enumeration of attached aquahc bacteria following deflocculant and ultrasound treatment. MS. Thesls, Simon Fraser Univer- sity, Canada
Vermaat, J . E., Sand-Jensen, K. (1987). Survival, metabolism and growth of Ulva lactura under u ln ter conditions; a laboratory study of bottle necks in the life cyclus. Mar. Biol. 95: 55-61
Westernhagen, H V., Hickel, W., Bauerfeind, E., Niermann, V , Kriinche, I . (1986). Sources and effects of oxygen deficiencies in the south-eastern North Sea. Ophelia 26: 457-473
Williams, P. J . , le B. (1981). Microbial contribution to overall marine plankton metabolism. direct measurements of respiration. Oceanol. Acta. 4: 359-364
Williams, P. J . , le B. (1984). A review of measurements of respiratlon rates of manne plankton populations. In: Hob- ble J E , Williams, P J . , le B. (eds.) Heterotrophic activity m the sea. Plenum Press, New York. p. 357-389
Manuscript first received: J u n e 13, 1989 Revised verslon accepted: December 21, 1989