picoscope 6 user's guide - welcome to physics...
TRANSCRIPT

Copyright © 2007-2012 Pico Technology Ltd. All rights reserved.
PicoScope 6
User's Guide
psw.en-22
PC Oscilloscope Software


IPicoScope 6 User's Guide
Copyright © 2007-2012 Pico Technology Ltd. All rights re se rved. psw.en
Table of Contents....................................................................................................................................11 Welcome
....................................................................................................................................22 PicoScope 6 overview
....................................................................................................................................33 Introduction
........................................................................................................................................41 Leg al statement
........................................................................................................................................52 Contact information
........................................................................................................................................53 How to use this manual
........................................................................................................................................64 System requirements
....................................................................................................................................74 Using PicoScope for the first time
....................................................................................................................................85 PicoScope and oscilloscope primer
........................................................................................................................................81 Oscilloscope basics
........................................................................................................................................92 PC Oscilloscope basics
........................................................................................................................................93 PicoScope basics ......................................................................................................................................................................101 Capture modes ......................................................................................................................................................................112 How do capture modes work with views?
........................................................................................................................................124 PicoScope window
........................................................................................................................................135 Scope view
........................................................................................................................................146 MSO view ......................................................................................................................................................................151 Dig ital view ......................................................................................................................................................................162 Dig ital context menu
........................................................................................................................................177 XY view
........................................................................................................................................188 Trig g er marker
........................................................................................................................................189 Post-trig g er arrow
........................................................................................................................................1910 Spectrum view
........................................................................................................................................2011 Persistence mode
........................................................................................................................................2112 Measurements table
........................................................................................................................................2213 Resolution enhancement
........................................................................................................................................2314 Pointer tool tip
........................................................................................................................................2415 Sig nal rulers
........................................................................................................................................2516 Time rulers
........................................................................................................................................2617 Ruler leg end
........................................................................................................................................2618 Frequency leg end
........................................................................................................................................2719 Properties sheet
........................................................................................................................................2720 Custom probes
........................................................................................................................................2821 Maths channels
........................................................................................................................................2922 Reference waveforms
........................................................................................................................................3023 Serial decoding
........................................................................................................................................3124 Mask limit testing
........................................................................................................................................3225 Alarms
........................................................................................................................................3326 Buffer Navig ator

Table of ContentsII
Copyright © 2007-2012 Pico Technology Ltd. All rights re se rved.psw.en
....................................................................................................................................346 Menus
........................................................................................................................................351 File menu ......................................................................................................................................................................361 Save As dialog ......................................................................................................................................................................412 Startup Setting s menu
........................................................................................................................................422 Edit menu ......................................................................................................................................................................421 Notes area
........................................................................................................................................433 Views menu ......................................................................................................................................................................441 Custom g rid layout dialog
........................................................................................................................................454 Measurements menu ......................................................................................................................................................................461 Add / Edit Measurement dialog ......................................................................................................................................................................472 Advanced measurement setting s
........................................................................................................................................495 Tools menu ......................................................................................................................................................................501 Custom Probes dialog ......................................................................................................................................................................642 Maths Channels dialog ......................................................................................................................................................................743 Reference Waveforms dialog ......................................................................................................................................................................764 Serial Decoding dialog ......................................................................................................................................................................845 Alarms dialog ......................................................................................................................................................................866 Masks menu ......................................................................................................................................................................897 Macro Recorder ......................................................................................................................................................................908 Preferences dialog
........................................................................................................................................1016 Help menu
........................................................................................................................................1027 Connect Device dialog
........................................................................................................................................1038 Converting files in Windows Explorer
....................................................................................................................................1057 Toolbars and buttons
........................................................................................................................................1061 Buffer Navig ation toolbar
........................................................................................................................................1072 Channels toolbar ......................................................................................................................................................................1081 Channel Options menu ......................................................................................................................................................................1142 Dig ital Inputs button
........................................................................................................................................1163 PicoLog 1000 Series Channels toolbar ......................................................................................................................................................................1171 PicoLog 1000 Series Dig ital Outputs control
........................................................................................................................................1184 USB DrDAQ Channels toolbar ......................................................................................................................................................................1191 USB DrDAQ RGB LED control ......................................................................................................................................................................1202 USB DrDAQ Dig ital Outputs control
........................................................................................................................................1215 Capture Setup toolbar ......................................................................................................................................................................1231 Spectrum Options dialog ......................................................................................................................................................................1252 Persistence Options dialog
........................................................................................................................................1276 Measurements toolbar
........................................................................................................................................1287 Sig nal Generator button ......................................................................................................................................................................1281 Sig nal Generator dialog (PicoScope devices) ......................................................................................................................................................................1302 Sig nal Generator dialog (USB DrDAQ) ......................................................................................................................................................................1313 Arbitrary waveform files ......................................................................................................................................................................1324 Arbitrary Waveform Generator window ......................................................................................................................................................................1355 Demo Sig nals menu ......................................................................................................................................................................1366 Demo Sig nals dialog
........................................................................................................................................1378 Start / Stop toolbar
........................................................................................................................................1389 Trig g ering toolbar ......................................................................................................................................................................1401 Advanced Trig g ering dialog ......................................................................................................................................................................1412 Advanced trig g er types
........................................................................................................................................14710 Zooming and Scrolling toolbar

IIIPicoScope 6 User's Guide
Copyright © 2007-2012 Pico Technology Ltd. All rights re se rved. psw.en
......................................................................................................................................................................1481 Zoom Overview
....................................................................................................................................1498 How to...
........................................................................................................................................1501 How to chang e to a different device
........................................................................................................................................1512 How to use rulers to measure a s ig nal
........................................................................................................................................1523 How to measure a time difference
........................................................................................................................................1534 How to move a view
........................................................................................................................................1545 How to scale and offset a s ig nal
........................................................................................................................................1596 How to set up the spectrum view
........................................................................................................................................1607 How to find a g litch using persistence mode
........................................................................................................................................1648 How to set up a Mask Limit Test
........................................................................................................................................1679 How to save on trig g er
....................................................................................................................................1719 Reference
........................................................................................................................................1711 Measurement types ......................................................................................................................................................................1721 Scope measurements ......................................................................................................................................................................1732 Spectrum measurements
........................................................................................................................................1752 Sig nal g enerator waveform types
........................................................................................................................................1763 Spectrum window functions
........................................................................................................................................1774 Trig g er timing (part 1)
........................................................................................................................................1785 Trig g er timing (part 2)
........................................................................................................................................1796 Serial protocols ......................................................................................................................................................................1801 CAN Bus protocol ......................................................................................................................................................................1822 I²C Bus protocol ......................................................................................................................................................................1833 RS232/UART protocol ......................................................................................................................................................................1844 SPI Bus protocol
........................................................................................................................................1857 Device feature table
........................................................................................................................................1868 Command-line syntax
........................................................................................................................................1889 Application Error dialog
........................................................................................................................................18910 Glossary
....................................................................................................................................191Index


PicoScope 6 User's Guide 1
Copyright © 2007-2012 Pico Technology Ltd. All rights re se rved. psw.en
1 WelcomeWelcome to PicoScope 6, the PC Oscilloscope software from PicoTechnology.
With a scope device from Pico Technology, PicoScope turns your PCinto a powerful PC Oscilloscope with all the features andperformance of a bench-top oscilloscope at a fraction of the cost.
How to use this manualWhat's new in this version?Using PicoScope for the first time
psw.en-22 : 12.1.12, S/W 6.7
9
9
8
5
2
7

PicoScope 6 overview2
Copyright © 2007-2012 Pico Technology Ltd. All rights re se rved.psw.en
2 PicoScope 6 overviewPicoScope 6 is a major new release of PicoScope, Pico Technology's software for PCOscilloscopes.
Higher performance
Faster capture rates, making it easier to see fast-moving signalsFaster data processingBetter support for the latest PicoScope USB oscilloscopes
Improved usability and appearance
Clearer graphics and textTool tips and help messages to explain all featuresEasy point-and-click tools for panning and zooming
New features
The latest Windows .NETtechnology enabling us todeliver updates more quickly
Multiple views of the samedata, with individual zoomand pan settings for eachview
Custom probes manager tomake it easy for you to useyour own probes and sensorswith PicoScope
Advanced triggeringconditions including pulse,window and logic
Properties sheet displayingall settings at a glance
Spectrum mode with afully optimized spectrumanalyzer
Per-channel lowpass filtering Math channels for creating mathematical functions ofinput channels
Reference waveforms forstoring copies of inputchannels
Arbitrary waveform designer for oscilloscopes with a
built-in arbitrary waveformgenerator
Rapid trigger mode tocapture a sequence ofwaveforms with the minimumpossible dead time
Windows Explorer integration to show files as pictures
and convert to other formats
Command-line options forconverting files
Zoom overview for rapidlyadjusting the zoom to showany part of the waveform
Serial decoding for RS232,
I2C and other formats, in realtime
Mask limit testing to showwhen a signal goes out ofbounds
Buffer navigator forsearching the waveformbuffer
Alarms to alert you when aspecified event occurs
See the Release Notes on our website for the latest information on your version ofPicoScope 6.
13
50
140
27 10
112
28
29
132
138
189
103
186 148
30 31
33 32

PicoScope 6 User's Guide 3
Copyright © 2007-2012 Pico Technology Ltd. All rights re se rved. psw.en
3 IntroductionPicoScope is a comprehensive software application for Pico Technology PCOscilloscopes. Used with an oscilloscope device from Pico Technology, it creates avirtual oscilloscope, spectrum analyzer and multimeter on your PC.
PicoScope 6 supports the devices listed in the Device feature table. It runs on anycomputer with Windows XP SP2 or later, Windows Vista or Windows 7. (See Systemrequirements for further recommendations.)
Legal statementContact informationHow to use this manual
How to use PicoScope 6
Getting started: see using PicoScope for the first time , and PicoScope'sFeatures.For further information: see descriptions of Menus and Toolbars , and theReference section.For step-by-step tutorials, see the "How to " section.
185
6
4
5
5
7
8
34 105
171
149

Introduction4
Copyright © 2007-2012 Pico Technology Ltd. All rights re se rved.psw.en
3.1 Legal statementThe material contained in this release is licensed, not sold. Pico Technology grants alicence to the person who installs this software, subject to the conditions listed below.
Access. The licensee agrees to allow access to this software only to persons whohave been informed of these conditions and agree to abide by them.
Usage. The software in this release is for use only with Pico products or with datacollected using Pico products.
Copyright. Pico Technology claims the copyright of, and retains the rights to, allmaterial (software, documents etc) contained in this release. You may copy anddistribute the entire release in its original state, but must not copy individual itemswithin the release other than for backup purposes.
Liability. Pico Technology and its agents shall not be liable for any loss, damage orinjury, howsoever caused, related to the use of Pico Technology equipment orsoftware, unless excluded by statute.
Fitness for purpose. No two applications are the same: Pico Technology cannotguarantee that its equipment or software is suitable for a given application. It is yourresponsibility, therefore, to ensure that the product is suitable for your application.
Mission-critical applications. This software is intended for use on a computer thatmay be running other software products. For this reason, one of the conditions of thelicence is that it excludes usage in mission-critical applications, for example life-supportsystems.
Viruses. This software was continuously monitored for viruses during production, butyou are responsible for virus-checking the software once it is installed.
Support. If you are dissatisfied with the performance of this software, please contactour technical support staff, who will try to fix the problem within a reasonable time. Ifyou are still dissatisfied, please return the product and software to your supplier within14 days of purchase for a full refund.
Upgrades. We provide upgrades, free of charge, from our web site atwww.picotech.com. We reserve the right to charge for updates or replacements sentout on physical media.
Trademarks. Windows is a registered trademark of Microsoft Corporation. PicoTechnology, PicoScope and PicoLog are internationally registered trade marks.

PicoScope 6 User's Guide 5
Copyright © 2007-2012 Pico Technology Ltd. All rights re se rved. psw.en
3.2 Contact informationAddress: Pico Technology
James HouseColmworth Business ParkST. NEOTSCambridgeshirePE19 8YPUnited Kingdom
Phone:Fax:
+44 (0) 1480 396395+44 (0) 1480 396296
Office hours: 09:00 to 17:00 Mon-Fri
Technical support email:Sales email:
[email protected]@picotech.com
Web site: www.picotech.com
3.3 How to use this manualIf you are using a PDF viewer to read this manual, you can turn the pages of themanual as if it were a book, using the Back and Forward buttons in your viewer.These buttons should look something like this:
or Back
or Forward
You can also print the entire manual for reading away from your computer. Look for a Print button similar to this:
For your first introduction to PicoScope, we suggest that you start with these topics:
Using PicoScope for the first timeOscilloscope basicsPC Oscilloscope basicsPicoScope basics
7
8
9
9

Introduction6
Copyright © 2007-2012 Pico Technology Ltd. All rights re se rved.psw.en
3.4 System requirementsTo ensure that PicoScope operates correctly, you must have a computer with at leastthe minimum system requirements to run your Windows operating system, which mustbe one of the versions listed in the following table. The performance of the oscilloscopewill be better with a more powerful PC, and will benefit from a multi-core processor.
Item Minimum specification Recommendedspecification
Operating system Windows XP SP2, Windows Vista or Windows 7; 32 or 64-bitedition
Processor 300 MHz 1 GHz
Memory 256 MB 512 MB
Free disk space* 1 GB 2 GB
Ports USB 2.0 compliant port
* The PicoScope software does not use all the disk space specified in the table. Thefree space is required to make Windows run efficiently.

PicoScope 6 User's Guide 7
Copyright © 2007-2012 Pico Technology Ltd. All rights re se rved. psw.en
4 Using PicoScope for the first timeWe have designed PicoScope to be as easy as possible to use, even for newcomers tooscilloscopes. Once you have followed the introductory steps listed below, you willsoon be on your way to becoming a PicoScope expert.
1. Install the software. Load the CD-ROM that is included with your scopedevice, then click the "Install Software" link and follow the on-screeninstructions.
2. Plug in your scope device. Windows will recognise it and prepare yourcomputer to work with it. Wait until Windows tells you that the device isready to use.
3. Click the new PicoScope icon on your Windows desktop.
4. PicoScope will detect your scope device and prepare to display awaveform. The green Start button will be highlighted to show thatPicoScope is ready.
5. Connect a signal to one of the scope device's input channels and seeyour first waveform! To learn more about using PicoScope, please readthe PicoScope Primer.
Problems?
Help is at hand! Our technical support staff are always ready to answer your telephonecall during office hours (see our Contact Details ). At other times, you can leave amessage on our support forum or send us an email.
137
8
5

PicoScope and oscilloscope primer8
Copyright © 2007-2012 Pico Technology Ltd. All rights re se rved.psw.en
5 PicoScope and oscilloscope primerThis chapter explains the fundamental concepts that you will need to know beforeworking with the PicoScope software. If you have used an oscilloscope before, thenmost of these ideas will be familiar to you. You can skip the Oscilloscope basicssection and go straight to the PicoScope-specific information . If you are new tooscilloscopes, please take a few minutes to read at least the Oscilloscope basicsand PicoScope basics topics.
5.1 Oscilloscope basicsAn oscilloscope is a measuring instrument that displays a graph of voltage againsttime. For example, the picture below shows a typical display on an oscilloscope screenwhen a varying voltage is connected to one of its input channels.
Oscilloscope displays are always read from left to right. The voltage-time characteristicof the signal is drawn as a line called the trace. In this example, the trace is blue andbegins at point A. If you look to the left of this point, you will see the number "0.0" onthe voltage axis, which tells you that the voltage is 0.0 V (volts). If you look belowpoint A, you will see another number "0.0", this time on the time axis, which tells youthat the time is 0.0 ms (milliseconds) at this point.
At point B, 0.25 milliseconds later, the voltage has risen to a positive peak of 0.8 volts.At point C, 0.75 milliseconds after the start, the voltage has dropped to a negativepeak of -0.8 volts. After 1 millisecond, the voltage has risen back to 0.0 volts and anew cycle is about to begin. This type of signal is called a sine wave, and is one of alimitless range of signal types that you will encounter.
Most oscilloscopes allow you to adjust the vertical and horizontal scales of the display.The vertical scale is called the voltage range (in this example at least, althoughscales in other units, such as milliamperes, are possible). The horizontal scale is calledthe timebase and is measured in units of time - in this example, thousandths of asecond.
8
9
8
9
189

PicoScope 6 User's Guide 9
Copyright © 2007-2012 Pico Technology Ltd. All rights re se rved. psw.en
5.2 PC Oscilloscope basicsA PC Oscilloscope is a measuring instrument that consists of a hardware scope deviceand an oscilloscope program running on a PC. Oscilloscopes were were originally stand-alone instruments with no signal processing or measuring abilities, and with storageonly available as an expensive extra. Later oscilloscopes began to use new digitaltechnology to introduce more functions, but they remained highly specialised andexpensive instruments. PC Oscilloscopes are the latest step in the evolution ofoscilloscopes, combining the measuring power of Pico Technology's scope devices withthe convenience of the PC that's already on your desk.
+ =PC scope device PC Oscilloscope
5.3 PicoScope basicsPicoScope can produce a simple display such as the example in the Oscilloscope basics
topic, but it also has many advanced features. The screen shot below shows thePicoScope window. Click on any of the underlined labels to learn more. See PicoScopewindow for an explanation of these important concepts.
Note: Other buttons may appear in the PicoScope main window depending on thecapabilities of the oscilloscope that is connected, and on the settings applied to thePicoScope program.
8
12

PicoScope and oscilloscope primer10
Copyright © 2007-2012 Pico Technology Ltd. All rights re se rved.psw.en
5.3.1 Capture modesPicoScope can operate in three capture modes: scope mode, spectrum mode andpersistence mode. The mode is selected by buttons in the Capture Setup Toolbar
.
In scope mode, PicoScope displays a main scope view, optimises its settings foruse as a PC Oscilloscope, and allows you to directly set the capture time. You canstill display one or more secondary spectrum views.
In spectrum mode, PicoScope displays a main spectrum view, optimises itssettings for spectrum analysis, and allows you to directly set the frequency range ina similar way to a dedicated spectrum analyser. You can still display one or moresecondary scope views.
In persistence mode , PicoScope displays a single, modified scope view in whichold waveforms remain on the screen in faded colors while new waveforms are drawnin brighter colors. See also: How to find a glitch using persistence mode and thePersistence Options dialog .
When you save waveforms and settings , PicoScope only saves data for the modethat is currently in use. If you wish to save settings for both capture modes, then youneed to switch to the other mode and save your settings again.
See also: How do capture modes work with views?
121
13
19
20
160
125
35
11

PicoScope 6 User's Guide 11
Copyright © 2007-2012 Pico Technology Ltd. All rights re se rved. psw.en
5.3.2 How do capture modes work with views?The capture mode tells PicoScope whether you are mainly interested in viewingwaveforms (scope mode ) or frequency plots (spectrum mode ). When you selecta capture mode, PicoScope sets up the hardware appropriately and then shows you a view that matches the capture mode (a scope view if you selected scope mode orpersistence mode , or a spectrum view if you selected spectrum mode). The restof this section does not apply in persistence mode, which allows only a single view.
Once PicoScope has shown you the first view, you can, if you wish, add more scope orspectrum views, regardless of the capture mode you are in. You can add and removeas many extra views as you wish, as long as one view remains that matches thecapture mode.
Examples showing how you might select the capture mode and open additionalviews in PicoScope. Top: persistence mode (one view only). Middle: scope mode.
Bottom: spectrum mode.
When using a secondary view type (a spectrum view in scope mode, or a scope view inspectrum mode), you may see the data compressed horizontally rather than displayedneatly as in a primary view. You can usually overcome this by using the zoom tools.
10
10 10
13
20 19

PicoScope and oscilloscope primer12
Copyright © 2007-2012 Pico Technology Ltd. All rights re se rved.psw.en
5.4 PicoScope windowThe PicoScope window shows a block of data captured from the scope device .When you first open PicoScope it contains one scope view , but you can add moreviews by clicking Add view in the Views menu . The screen shot below shows allthe main features of the PicoScope window. Click on the underlined labels for moreinformation.
To arrange the views within the PicoScope window
If the PicoScope window contains more than one view , PicoScope arranges them ina grid. This is arranged automatically, but you can customize it if you wish. Eachrectangular space in the grid is called a viewport . You can move a view to adifferent viewport by dragging its name tab (show me ), but you cannot move itoutside the PicoScope window. You can also put more than one view in a viewport, bydragging a view and dropping it on top of another.
For further options, right-click on a view to obtain the View menu , or select Viewfrom the Menu bar , then select one of the menu options to arrange the views.
190
13
43
190
190 190
153
43
34

PicoScope 6 User's Guide 13
Copyright © 2007-2012 Pico Technology Ltd. All rights re se rved. psw.en
5.5 Scope viewA scope view shows the data captured from the scope as a graph of signal amplitudeagainst time. (See Oscilloscope basics for more on these concepts.) PicoScopeopens with a single view, but you can add more views by using the views menu .Similar to the screen of a conventional oscilloscope, a scope view shows you one ormore waveforms with a common horizontal time axis, with signal level shown on one ormore vertical axes. Each view can have as many waveforms as the scope device haschannels. Click on one of the labels below to learn more about a feature.
Scope views are available regardless of which mode - scope mode or spectrum mode - is active.
8
43
10
10

PicoScope and oscilloscope primer14
Copyright © 2007-2012 Pico Technology Ltd. All rights re se rved.psw.en
5.6 MSO viewApplicability: mixed-signal oscilloscopes (MSOs ) only
The MSO view shows mixed analog and digital data on the same timebase.
Digital Inputs button : Switches digital view on and off, and opens theDigital Setup dialog.
Analog view: Shows the analog channels. The same as a standard scopeview .
Digital view: Shows the digital channels and groups. See digital view .
Splitter: Drag up and down to move the partition between analog anddigital sections.
189
114 15
114
13
15

PicoScope 6 User's Guide 15
Copyright © 2007-2012 Pico Technology Ltd. All rights re se rved. psw.en
5.6.1 Digital viewLocation: MSO view
Note 1: You can right-click on the digital view to obtain the Digital Context Menu.
Note 2: If the digital view is not visible when required, check that (a) the DigitalInputs button is activated and (b) at least one digital channel is selected fordisplay in the Digital Setup dialog .
Digital channel: Displayed in the order in which they appear in the Digital Setupdialog , where they can be renamed.
Digital group: Groups are created and named in the Digital Setup dialog .You can expand and collapse them in the digital view using the and buttons.
14
16
114
114
114
114

PicoScope and oscilloscope primer16
Copyright © 2007-2012 Pico Technology Ltd. All rights re se rved.psw.en
5.6.2 Digital context menuLocation: right-click on digital view
Sub View: Analog: View or hide the analogscope view.
Digital: View or hide the digitalscope view.
Also available from the Views menu.Format: The numerical format in which group
values are displayed in the digitalscope view.
Draw Groups: By Values: Draw groups withtransitions only where the valuechanges:
By Time: Draw groups with transitionsspaced equally in time, once persampling period. You will usually needto zoom in to see the individualtransitions:
By Level: Draw groups as analoglevels derived from the digital data:
15
13
15
43
15

PicoScope 6 User's Guide 17
Copyright © 2007-2012 Pico Technology Ltd. All rights re se rved. psw.en
5.7 XY viewAn XY view, in its simplest form, shows a graph of one channel plotted againstanother. XY mode is useful for showing phase relationships between periodic signals(using Lissajous figures) and for plotting I-V (current-voltage) characteristics ofelectronic components.
In the example above, two different periodic signals have been fed into the two inputchannels. The smooth curvature of the trace tells us that the inputs are roughly orexactly sine waves. The three loops in the trace show that Channel B has about threetimes the frequency of Channel A. We can tell that the ratio is not exactly threebecause the trace is slowly rotating, although you cannot see that in this staticpicture. Since an XY view has no time axis, it tells us nothing about the absolutefrequencies of the signals. To measure frequency, we need to open a Scope view .
How to create an XY view
There are two ways to create an XY view.
Use the Add View > XY command on the Views menu . This adds a new XY viewto the PicoScope window without altering the original scope or spectrum viewor views. It automatically chooses the two most suitable channels to place on the Xand Y axes. Optionally, you can change the X axis channel assignment using the X-Axis command (see below).
Use the X-Axis command on the Views menu . This converts the current scopeview into an XY view. It maintains the existing Y axes and allows you to choose anyavailable channel for the X axis. With this method, you can even assign a mathchannel or a reference waveform to the X axis.
13
43
13 19
43
28 29

PicoScope and oscilloscope primer18
Copyright © 2007-2012 Pico Technology Ltd. All rights re se rved.psw.en
5.8 Trigger markerThe trigger marker shows the level and timing of the trigger point.
The height of the marker on the vertical axis shows the level at which the trigger isset, and its position on the time axis shows the time at which it occurs.
You can move the trigger marker by dragging it with the mouse or, for more accuratecontrol, by using the buttons on the Triggering toolbar .
Other forms of trigger marker
If the scope view is zoomed and panned so that the trigger point is off the screen, theoff-screen trigger marker (shown above) appears at the side of the graticule toindicate the trigger level.
In post-trigger delay mode, the trigger marker is temporarily replaced by the post-trigger arrow while you adjust the post-trigger delay.
When some advanced trigger types are in use, the trigger marker changes to awindow marker, which shows the upper and lower trigger thresholds.
For more information, see the section on Trigger timing .
5.9 Post-trigger arrowThe post-trigger arrow is a modified form of the trigger marker that appearstemporarily on a scope view while you are setting up a post-trigger delay, ordragging the trigger marker after setting up a post-trigger delay. (What is a post-trigger delay? )
The left-hand end of the arrow indicates the trigger point,and is aligned with zero on the time axis. If zero on thetime axis is outside the scope view, then the left-handend of the post-trigger arrow appears like this:
The right-hand end of the arrow (temporarily replacing the trigger marker ) indicatesthe trigger reference point.
Use the buttons on the Triggering toolbar to set up a post-trigger delay.
138
18
141
177
18
13
178
13
18
138

PicoScope 6 User's Guide 19
Copyright © 2007-2012 Pico Technology Ltd. All rights re se rved. psw.en
5.10 Spectrum viewA spectrum view is one view of the data from a scope device. A spectrum is adiagram of signal level on a vertical axis plotted against frequency on the horizontalaxis. PicoScope opens with a scope view, but you can add a spectrum view by usingthe views menu . Similar to the screen of a conventional spectrum analyser, aspectrum view shows you one or more spectra with a common frequency axis. Eachview can have as many spectra as the scope device has channels. Click on one of thelabels below to learn more about a feature.
Unlike in the scope view, in the spectrum view the data is not clipped at the limits ofthe range displayed on the vertical axis, so you can apply axis scaling or offset to seemore data. Vertical axis labels are not provided for data outside what is considered tobe the 'useful' range, but rulers will still work outside this range.
Spectrum views are available regardless of which mode - Scope Mode or SpectrumMode - is active.
For more information, see: How to set up the spectrum view and SpectrumOptions dialog.
43
10
10
159
123

PicoScope and oscilloscope primer20
Copyright © 2007-2012 Pico Technology Ltd. All rights re se rved.psw.en
5.11 Persistence modePersistence mode superimposes multiple waveforms on the same view, with morefrequent data or newer waveforms drawn in brighter colors than older ones. This isuseful for spotting glitches, when you need to see a rare fault event hidden in a seriesof repeated normal events.
Enable persistence mode by clicking the Persistence Mode button on theCapture Setup toolbar . With the persistence options set at their default values,the screen will look something like this:
The colors indicate the frequency of the data. Red is used for the highest-frequencydata, with yellow for intermediate frequencies and blue for the least frequent data. Inthe example above, the waveform spends most of its time in the red region, but noisecauses it to wander occasionally into the blue and yellow regions. These are thedefault colors, but you can change them using the Persistence Options dialog .
This example shows persistence mode in its most basic form. See the PersistenceOptions dialog for ways to modify the display to suit your application, and How tofind a glitch using persistence mode for a worked example.
121 125
125
125
160

PicoScope 6 User's Guide 21
Copyright © 2007-2012 Pico Technology Ltd. All rights re se rved. psw.en
5.12 Measurements tableA measurements table displays the results of automatic measurements. Each viewcan have its own table, and you can add, delete or edit measurements from this table.
Measurements table columns
Name The name of the measurement that you selected in the AddMeasurement or Edit Measurement dialog. An "F" after thename indicates that the statistics for this measurement are filtered .
Span The section of the waveform or spectrum that you want to measure.This is 'Whole trace' by default.
Value The live value of the measurement, from the latest capture
Min The minimum value of the measurement since measuring began
Max The maximum value of the measurement since measuring began
Average The arithmetic mean of the measurements from the last n captures,where n is set in the General page of the Preferences dialog
σ The standard deviation of the measurements from the last ncaptures, where n is set in the General page of the Preferencesdialog
CaptureCount
The number of captures used to create the statistics above. This startsat 0 when triggering is enabled, and counts up to the number ofcaptures specified in the General page of the Preferences dialog.
To add, edit or delete measurements
See: Measurements toolbar .
To change the width of a measurement column
Drag the vertical separator between column headings to createthe column width you need, as shown opposite.
To change the update rate of the statistics
The statistics (Min, Max, Average, Standard Deviation) are based on the number ofcaptures shown in the Capture Count column. You can change the maximum capturecount using the Capture Size control in the General page of the Preferences dialog.
13
46 46
48
91 90
190
91 90
91 90
127
91 90

PicoScope and oscilloscope primer22
Copyright © 2007-2012 Pico Technology Ltd. All rights re se rved.psw.en
5.13 Resolution enhancementResolution enhancement is a technique for increasing the effective verticalresolution of the scope at the expense of high-frequency detail. Selecting resolutionenhancement does not change the scope's sampling rate or the number of samplesavailable.
For this technique to work, the signal must contain a very small amount of Gaussiannoise, but for many practical applications this is generally taken care of by the scopeitself and the noise inherent in normal signals.
The resolution enhancement feature uses a flat moving-average filter. This acts as alow-pass filter with good step response characteristics and a very slow roll-off fromthe pass-band to the stop-band.
Some side-effects will be observed when using resolution enhancement. These arenormal and can be counteracted by reducing the amount of enhancement used,increasing the number of samples captured or changing the timebase. Trial and error isusually the best way to find the optimum resolution enhancement for your application.The side-effects include:
Widened and flattened impulses (spikes)Vertical edges (such as those of square waves) turned into straight-line slopesInversion of the signal (sometimes making it look as if the trigger point is on thewrong edge)A flat line (when there are not enough samples in the waveform)
Procedure
Click the Channel Options button in the Channel Setup toolbar .Use the Resolution Enhancement control in the Advanced Options menu toselect the effective number of bits, which can be equal to or greater than the vertical resolution of your scope device.
107
108
189

PicoScope 6 User's Guide 23
Copyright © 2007-2012 Pico Technology Ltd. All rights re se rved. psw.en
Quantifying Resolution Enhancement
The table below shows the size of the moving-average filter for each resolutionenhancement setting. A bigger filter size requires a higher sampling rate to represent agiven signal without significant side-effects (as detailed above).
Resolutionenhancement
e (bits)
Number ofvalues
n
0.5 2
1.0 4
1.5 8
2.0 16
2.5 32
3.0 64
3.5 128
4.0 256
Example. Your scope device is a PicoScope 5204 (resolution = 8 bits). You haveselected an effective resolution of 9.5 bits. The resolution enhancement is therefore:
e = 9.5 – 8.0 = 1.5 bits.
The table shows that this is achieved using a moving average of:
n = 8 samples.
This number gives a guide to what sort of filtering effect the resolution enhancementwill have on the signal. The best way of seeing the actual low-pass filter effect is toadd a spectrum view and look at the shape of the noise floor (try dragging the y-axisupwards to see the noise more clearly).
5.14 Pointer tool tipThe pointer tool tip is a box that displays the horizontal and vertical axis values atthe mouse pointer location. It appears temporarily when you click the background of a view .
Pointer tool tipin a scope view
190

PicoScope and oscilloscope primer24
Copyright © 2007-2012 Pico Technology Ltd. All rights re se rved.psw.en
5.15 Signal rulersThe signal rulers (sometimes called cursors) help you measure absolute and relativesignal levels on a scope , XY or spectrum view .
In the scope view above, the two colored squares to the left of the vertical axis arethe ruler drag-handles for channel A. Drag one of these downwards from its restingposition in the top left corner, and a signal ruler (a horizontal dashed line) will extendfrom it.
Whenever one or more signal rulers is in use, the ruler legend appears. This is atable showing all of the signal ruler values. If you close the ruler legend using the Close button, all the rulers are deleted.
Signal rulers also work in spectrum and XY views.
Ruler tool tip
If you move the mouse pointer over one of the rulers, PicoScope displays a tool tipwith the ruler number and the signal level of the ruler. You can see an example of thisin the picture above.
13 17 19
13
26
19 17
190

PicoScope 6 User's Guide 25
Copyright © 2007-2012 Pico Technology Ltd. All rights re se rved. psw.en
5.16 Time rulersThe time rulers measure time on a scope view or frequency on a spectrum view .
In the scope view above, the two white squares on the time axis are the time rulerhandles. When you drag these to the right from the bottom left corner, verticaldashed lines called time rulers appear. The rulers work in the same way on a spectrumview , but the ruler legend shows their horizontal positions in units of frequencyrather than time.
Ruler tool tip
If you hold the mouse pointer over one of the rulers, as we did in the example above,PicoScope displays a tool tip with the ruler number and the time value of the ruler.
Ruler legend
The table at the top of the view is the ruler legend. In this example, the table showsthat time ruler 1 is at 148.0 microseconds, ruler 2 is at 349.0 microseconds and thedifference between them is 201.0 microseconds. Clicking the Close button on the rulerlegend also deletes all the rulers.
Frequency legend
The frequency legend in the bottom right-hand corner of a scope view shows 1/ ,where is the difference between the two time rulers. The accuracy of this calculationdepends on the accuracy with which you have positioned the rulers. For greateraccuracy with periodic signals, use the frequency measurement function built in toPicoScope.
13 19
13
19
172

PicoScope and oscilloscope primer26
Copyright © 2007-2012 Pico Technology Ltd. All rights re se rved.psw.en
5.17 Ruler legendThe ruler legend is a box that displays the positions of all the rulers you haveplaced on the view . It appears automatically whenever you position a ruler on theview:
Editing
You can adjust the position of a ruler by editing any value in the first two columns. To
insert a Greek µ (the micro symbol, meaning one millionth or x 10-6), type the letter 'u'.
Tracking rulers
When two rulers have been positioned on one channel, the Lock button appearsnext to that ruler in the ruler legend. Clicking this button causes the two rulers to trackeach other: dragging one causes the other one to follow it, maintaining a fixed
separation. The button changes to when the rulers are locked.
TIP: To set up a pair of tracking rulers with a known distance between them, firstclick the Lock button, then edit the two values in the ruler legend so that the rulersare the desired distance apart.
See also: frequency legend .
5.18 Frequency legend
The frequency legend appears when you have placed two time rulers on a scopeview . It shows 1/ in hertz (the SI unit of frequency, equal to cycles per second),where is the time difference between the two rulers. You can use this to estimatethe frequency of a periodic waveform, but you will get more accurate results bycreating a frequency measurement using the Add Measurements button on theMeasurements toolbar .
For frequencies up to 1.666 kHz, the frequency legend can also show the frequency inRPM (revolutions per minute). The RPM display can be enabled or disabled in the Preferences > Options dialog .
24
190
26
25
13
127
100
PicoScope 6 User's Guide 27
Copyright © 2007-2012 Pico Technology Ltd. All rights re se rved. psw.en
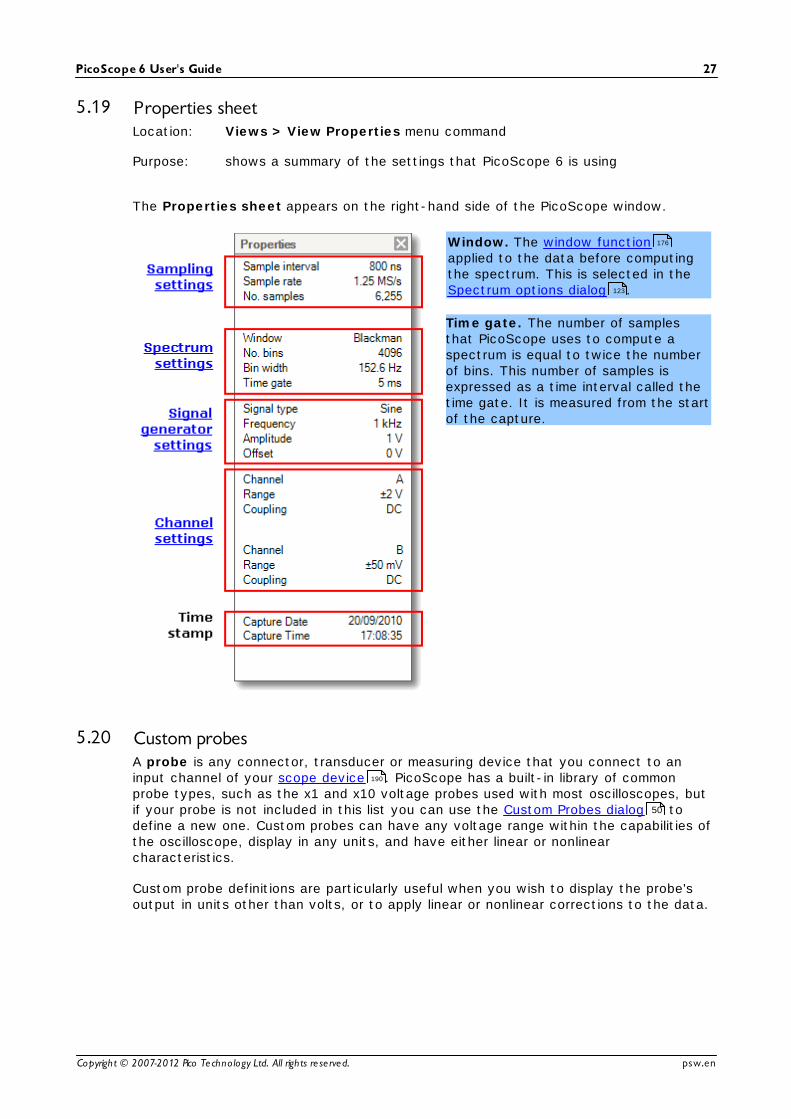
5.19 Properties sheetLocation: Views > View Properties menu command
Purpose: shows a summary of the settings that PicoScope 6 is using
The Properties sheet appears on the right-hand side of the PicoScope window.
Window. The window functionapplied to the data before computingthe spectrum. This is selected in the Spectrum options dialog .
Time gate. The number of samplesthat PicoScope uses to compute aspectrum is equal to twice the numberof bins. This number of samples isexpressed as a time interval called thetime gate. It is measured from the startof the capture.
5.20 Custom probesA probe is any connector, transducer or measuring device that you connect to aninput channel of your scope device . PicoScope has a built-in library of commonprobe types, such as the x1 and x10 voltage probes used with most oscilloscopes, butif your probe is not included in this list you can use the Custom Probes dialog todefine a new one. Custom probes can have any voltage range within the capabilities ofthe oscilloscope, display in any units, and have either linear or nonlinearcharacteristics.
Custom probe definitions are particularly useful when you wish to display the probe'soutput in units other than volts, or to apply linear or nonlinear corrections to the data.
176
123
190
50

PicoScope and oscilloscope primer28
Copyright © 2007-2012 Pico Technology Ltd. All rights re se rved.psw.en
5.21 Maths channelsA maths channel is a mathematical function of one or more input signals. The functioncan be as simple as "Invert A", replacing the Invert button on a conventionaloscilloscope, or a complex function that you define. It can be displayed in a scope ,XY or spectrum view in the same way as an input signal, and like an input signalit has its own measurement axis, scaling and offset button and color . PicoScope6 has a set of built-in math channels for the most important functions, including "A+B" (the sum of channels A and B) and "A-B" (the difference between channels A andB). You can also define your own functions using the equation editor , or loadpredefined maths channels from files .
The picture below is a three-step guide to using maths channels:
1. Tools > Maths Channels command. Click this to open the Maths Channelsdialog , shown at top right in the picture above.
2. Maths Channels dialog . This lists all the available maths channels. In theexample above, only the built-in functions are listed.
3. Maths channel. Once enabled, a maths channel appears in the selected scopeor spectrum view. You can change its scale and offset as with any otherchannel. In the example above, the new maths channel (bottom) is defined as A-B,the difference between input channels A (top) and B (middle).
You may occasionally see a flashing warning symbol like this- - at the bottom ofthe maths channel axis. This means that the channel cannot be displayed becausean input source is missing. For example, this occurs if you enable the A+B functionwhile channel B is set to Off.
13
17 19
154 71
68
66
49
64
64
13
19 154

PicoScope 6 User's Guide 29
Copyright © 2007-2012 Pico Technology Ltd. All rights re se rved. psw.en
5.22 Reference waveformsA reference waveform is a stored copy of an input signal. You can create one byright-clicking on the view, selecting the Reference Waveforms command andselecting which channel to copy. It can be displayed in a scope or spectrum view inthe same way as an input signal, and like an input signal it has its own measurementaxis, scaling and offset button and color .
For more control over Reference Waveforms, use the Reference Waveforms dialog asshown below.
1. Reference Waveforms button. Click this to open the Reference Waveformsdialog , shown on the right in the picture above.
2. Reference Waveforms dialog . This lists all the available input channels andreference waveforms. In the example above, input channels A and B are switchedon, so they appear in the Available section. The Library section is empty to beginwith.
3. Duplicate button. When you select an input channel or reference waveform andclick this button, the selected item is copied to the Library section.
4. Library section. This shows all your reference waveforms. Each one has a checkbox that controls whether or not the waveform appears on the display.
5. Reference waveform. Once enabled, a reference waveform appears in theselected scope or spectrum view. You can change its scale and offset aswith any other channel. In the example above, the new reference waveform(bottom) is a copy of channel A.
6. Axis control button. Opens an axis scaling dialog allowing you to adjust scale,offset and delay for this waveform.
154 75
74
74
13 19 154
110

PicoScope and oscilloscope primer30
Copyright © 2007-2012 Pico Technology Ltd. All rights re se rved.psw.en
5.23 Serial decodingYou can use PicoScope to decode data from a serial bus such as I2C or CAN Bus. Unlikea conventional bus analyzer, PicoScope lets you see the high-resolution electricalwaveform at the same time as the data. The data is integrated into the scope view, sothere's no need to learn a new screen layout.
How to use Serial Decoding
1. Select the Tools > Serial Decoding menu command.
2. Complete the Serial Decoding dialog .
3. Choose to display the data In View, In Window , or both.
4. You can decode multiple channels in different formats simultaneously. Use theDecoding tab below the "In Window" data table (shown in the picture above) toselect which channel of data to display in the table.
49
76
79

PicoScope 6 User's Guide 31
Copyright © 2007-2012 Pico Technology Ltd. All rights re se rved. psw.en
5.24 Mask limit testingMask limit testing is a feature that tells you when a waveform or spectrum goesoutside a specified area, called a mask, drawn on the scope view or spectrum view
. PicoScope can draw the mask automatically by tracing a captured waveform, oryou can draw it manually. Mask limit testing is useful for spotting intermittent errorsduring debugging, and for finding faulty units during production testing.
To begin, go to the main PicoScope menu and select Tools > Masks > AddMasks. This opens the Mask Library dialog . When you have selected, loaded orcreated a mask, the scope view will appear as follows:
(A) Mask Shows the allowed area (in white) and the disallowedarea (in blue). Right-clicking the mask area andselecting the Edit Mask command takes you to the EditMask dialog . You can change the mask colors withthe Tools > Preferences > Colors dialog; add,remove and save masks using the Masks menu ; andhide and display masks using the Views > Masks menu
.
(B) Failed waveforms If the waveform enters the disallowed area, it iscounted as a failure. The part of the waveform thatcaused the failure is highlighted, and persists on thedisplay until the capture is restarted.
(C) Measurements table The number of failures since the start of the currentscope run is shown in the Measurements table .You can clear the failure count by stopping andrestarting the capture using the Start/Stop button .The measurements table can display othermeasurements at the same time as the mask failurecount.
13
19
49 86
86
87
49 90 98
86
43
21
137
171

PicoScope and oscilloscope primer32
Copyright © 2007-2012 Pico Technology Ltd. All rights re se rved.psw.en
5.25 AlarmsAlarms are actions that PicoScope can be programmed to execute when certainevents occur. Use the Tools > Alarms command to open the Alarms dialog ,which configures this function.
The events that can trigger an alarm are:
Capture - when the oscilloscope has captured a complete waveform or block ofwaveforms.Buffers Full - when the waveform buffer becomes full.Mask(s) Fail - when a waveform fails a mask limit test .
The actions that PicoScope can execute are:
BeepPlay SoundStop CaptureRestart CaptureRun ExecutableSave Current BufferSave All Buffers
See Alarms dialog for more details.
84
10
106
31
84

PicoScope 6 User's Guide 33
Copyright © 2007-2012 Pico Technology Ltd. All rights re se rved. psw.en
5.26 Buffer NavigatorThe PicoScope waveform buffer can hold up to 10,000 waveforms, subject to theamount of available memory in the oscilloscope. The Buffer Navigator helps you toscroll through the buffer quickly to find the waveform you want.
To begin, click the Buffer Navigator button in the Buffer Navigation toolbar .This opens the Buffer Navigator window:
Click on any one of the visible waveforms to bring it to the front of the navigator forcloser inspection, or use the controls:
Buffers to show If any of the channels has a mask applied, then you canselect the channel from this list. The Buffer Navigator will thenshow only the waveforms that failed the mask test on thatchannel.
Start: Scroll to waveform number 1.
Backward: Scroll to the next waveform on the left.
Zoom in:
Change the scale of the waveforms in the Buffer Navigatorview. There are three zoom levels: Large: default view. One waveform fills the height of thewindow.Medium: a medium-sized waveform above a row of smallwaveforms.Small: a grid of small waveforms. Click on the top or bottom rowof images to scroll the grid up or down.
Zoom out:
Forward: Scroll to the next waveform on the right.
End:
Scroll to the last waveform in the buffer. (The number ofwaveforms depends on the Tools > Preferences > General > Maximum Waveforms setting and on the type ofscope connected.)
Click anywhere on the main PicoScope window to close the Buffer Navigator window.
106
31
49 90
91

Menus34
Copyright © 2007-2012 Pico Technology Ltd. All rights re se rved.psw.en
6 MenusMenus are the quickest way to get to PicoScope's main features. The Menu bar isalways present at the top of the PicoScope main window, just below the window's titlebar. You can click any of the menu items, or press the Alt key and then navigate tothe menu using the arrow keys, or press the Alt key followed by the underlined letter inone of the menu items.
The list of items in the menu bar may vary depending on the windows that you haveopen in PicoScope.

PicoScope 6 User's Guide 35
Copyright © 2007-2012 Pico Technology Ltd. All rights re se rved. psw.en
6.1 File menuLocation: Menu bar > File
Purpose: gives access to file input and output operations
Connect Device. This command appears only when there is no scope deviceconnected. It opens the Connect Device dialog , which allows you toselect the scope device you wish to use.
Open. Allows you to select the file you want to open. PicoScope can open.psdata and .psd files, which contain both waveform data and scope device
settings, and .pssettings and .pss files, which contain only scope device
settings. You can create your own files using the Save and Save As...commands, described below. If the file was saved using a different scopedevice from the one that is presently connected, PicoScope may need tomodify the saved settings to suit the present device.
Hint: Use the Page Up and Page Down keys to cycle through all thewaveform files in the same directory.
Save All Waveforms. Saves all waveforms using the filename shown in thetitle bar.
Save All Waveforms As. Opens the Save As dialog , which allows you tosave the settings, waveforms, custom probes and math channels for all views
in various formats. Only the waveforms for the mode currently in use(Scope Mode or Spectrum Mode ) will be saved.
Save Current Waveform As. Opens the Save As dialog , which allows youto save the settings, waveforms, custom probes and math channels for allviews in various formats. Only the waveforms for the mode currently in use(Scope Mode or Spectrum Mode ) will be saved.
In persistence mode , this command is called Save Persistence As andsaves only the data for this mode.
Startup Settings. Opens the Startup Settings menu.
Print Preview. Opens the Print Preview window, which allows you to seehow your workspace will be printed when you select the Print command.
34
102
36
12
121 121
36
121 121
20
41

Menus36
Copyright © 2007-2012 Pico Technology Ltd. All rights re se rved.psw.en
Print. Opens a standard Windows Print dialog, which allows you to choose aprinter, set printing options and then print the selected view.
Recent Files. A list of recently opened or saved files. This list is compiledautomatically, but you can clear it using the Files page of the Preferencesdialog.
Exit. Close PicoScope without saving any data.
6.1.1 Save As dialogLocation: Menu bar > File > Save All Waveforms As or Save Current
Waveform As
Purpose: allows you to save your waveforms and settings (including customprobes and active math channels) to a file in various formats
Type your chosen file name in the File name box, and then select a file format in theSave as type box. You can save data in the following formats:
Data files (.psdata) Stores waveforms and settings from thecurrent scope device. Can be opened on anycomputer running PicoScope.
Settings files (.pssettings) Stores all settings (but not waveforms) fromthe current scope device. Can be opened onany computer running PicoScope.
90
34 35
38
PicoScope 6 User's Guide 37
Copyright © 2007-2012 Pico Technology Ltd. All rights re se rved. psw.en
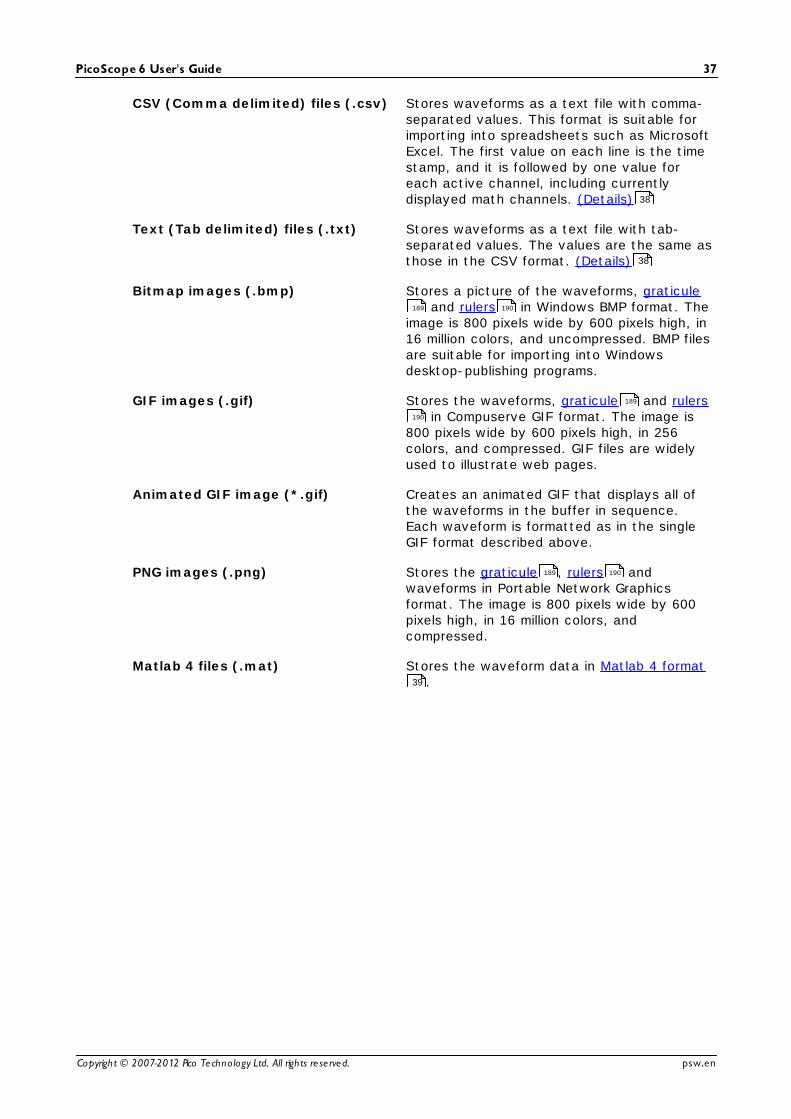
CSV (Comma delimited) files (.csv) Stores waveforms as a text file with comma-separated values. This format is suitable forimporting into spreadsheets such as MicrosoftExcel. The first value on each line is the timestamp, and it is followed by one value foreach active channel, including currentlydisplayed math channels. (Details)
Text (Tab delimited) files (.txt) Stores waveforms as a text file with tab-separated values. The values are the same asthose in the CSV format. (Details)
Bitmap images (.bmp) Stores a picture of the waveforms, graticule and rulers in Windows BMP format. The
image is 800 pixels wide by 600 pixels high, in16 million colors, and uncompressed. BMP filesare suitable for importing into Windowsdesktop-publishing programs.
GIF images (.gif) Stores the waveforms, graticule and rulers in Compuserve GIF format. The image is
800 pixels wide by 600 pixels high, in 256colors, and compressed. GIF files are widelyused to illustrate web pages.
Animated GIF image (*.gif) Creates an animated GIF that displays all ofthe waveforms in the buffer in sequence.Each waveform is formatted as in the singleGIF format described above.
PNG images (.png) Stores the graticule , rulers andwaveforms in Portable Network Graphicsformat. The image is 800 pixels wide by 600pixels high, in 16 million colors, andcompressed.
Matlab 4 files (.mat) Stores the waveform data in Matlab 4 format.
38
38
189 190
189
190
189 190
39

Menus38
Copyright © 2007-2012 Pico Technology Ltd. All rights re se rved.psw.en
6.1.1.1 File formats for exported data
PicoScope 6 can export raw data in either text or binary format: -
Text-based file formats
Easy to read without special toolsCan be imported into standard spreadsheet applicationsFiles are very large if there are many samples in the data (so files are limited toabout 1 million values per channel)
Text file format details
Binary file format
Files remain relatively small and can even be compressed in some situations (thismeans that the amount of saved data is unlimited)Either a special application is required to read the files or the user must write aprogram to read the data from the file
If you need to save more than 64 K values per channel, then you must use a binary file
format such as the Matlab® MAT-file format.
Binary file format details
Data types for storing PicoScope 6 data
Regardless of whether the data types were loaded from a binary file or from a text-based file, we recommend the following data formats for storing the values loaded froma PicoScope 6 data file: -
Sampled data (such as voltages) should use 32-bit single-precision floating-pointdata types.Times should use 64-bit double-precision floating-point data types.
6.1.1.1.1 Text formats
Text-format files exported by PicoScope 6 are encoded in UTF-8 format by default.This is a popular format which is capable of representing a huge range of characters,whilst still retaining some compatibility with the ASCII character set if only standardWestern European characters and numbers are used in the file.
CSV (comma-separated values)
CSV files store data in the following format: -
Time, Channel A, Channel B(µs), (V), (V)-500.004, 5.511, 1.215-500.002, 4.724, 2.130-500, 5.552, 2.212…
There is a comma after each value on a line to represent a column of data and acarriage return at the end of the line to represent a new row of data. The 1 millionvalues per channel limit prevents excessively large files being created.
38
39
38

PicoScope 6 User's Guide 39
Copyright © 2007-2012 Pico Technology Ltd. All rights re se rved. psw.en
Note. CSV files are not the best choice of format if you are working in a language thatuses the comma character as the decimal point. Instead, try using the tab-delimitedformat which works in almost the same way.
Tab-delimited
Tab-delimited files store data in the following format: -
Time(µs)
Channel A(V)
Channel B(V)
500.004 5.511 1.215-500.002 4.724 2.130-500 5.552 2.212…
The files have a tab character after each value on a line to represent a column of dataand a carriage return at the end of the line to represent a new row of data. These fileswork in any language and are a good choice for sharing data internationally. The 1million values per channel limit prevents excessively large files being created.
6.1.1.1.2 Binary formats
PicoScope 6 can export data in version 4 of the .mat binary file format. This isan open format and the full specification is freely available from the www.mathworks.com website. PicoScope 6 saves data into the MAT-File format in aspecific way, which is detailed below.
Importing into Matlab
Load the file into your workspace using this syntax: -
load myfile
Each channel’s data is stored in an array variable named by the channel. So, thesampled data for channels A to D would be in four arrays named A, B, C and D.
There is only one set of time data for all channels and this is loaded in one of twopossible formats:
1. A start time, an interval and a length. The variables are named Tstart, Tintervaland Length.
2. An array of times (sometimes used for ETS data). The time array is named T.
If the times are loaded in as Tstart, Tinterval and Length then you can use thefollowing command to create the equivalent array of times: -
T = [Tstart : Tinterval : Tstart + (Length – 1) * Tinterval];
Exploring the file format
The full file specification, available from www.mathworks.com, is comprehensive so thisguide does not describe the entire format. Instead, this guide describes enough of theformat to allow you to get data from the file and use it in your own program.
The variables described above (under Importing into Matlab ) are stored in a series ofdata blocks, each preceded by a header. Each variable has its own header and datablock and the corresponding variable names are stored with them (such as A, B,Tstart). The following sections describe how to read each variable from the file.
38
39

Menus40
Copyright © 2007-2012 Pico Technology Ltd. All rights re se rved.psw.en
The order of the data blocks is not specified, so programs should look at the variablenames to decide which variable is currently being loaded.
The headerThe file consists of a number of data blocks preceded by 20-byte headers. Eachheader contains five 32-bit integers (as described in the table below).
Bytes Value
0 – 3 Data format (0, 10 or 20)
4 – 7 Number of values
8 – 11 1
12 – 15 0
16 – 19 Name length
Data formatThe ‘Data format’ in the first 4-bytes describes the type of numerical data in the array.
Value Description
0 Double (64-bit floating point)
10 Single (32-bit floating point)
20 Integer (32-bit)
Number of valuesThe ‘Number of values’ is a 32-bit integer describing the number of numerical values inthe array. This value may be 1 for variables that only describe one value; but forarrays of samples or times, expect this to be a large number.
Name lengthThe ‘Name length’ is the length of the name of the variable as a null-terminated 1-byteper character ASCII string. The last null terminating character (‘\0’) is included in the‘Name length’ so if the variable name is “TStart” (same as ‘TStart\0’) then the namelength will be 7.
The data blockThe data block begins with the name of the variable (such as A, Tinterval) and youshould read in the number of bytes described by the ‘Name length’ part of the header(not forgetting that the last byte in the string is ‘\0’ if your programming languageneeds to take account of this).
The remaining part of the data block is the actual data itself, so read in the number ofvalues described in the ‘Number of values’ part of the header. Remember to takeaccount of the size of each value as described in the ‘Data format’ part of the header.
Channel data such as voltages, in variables such as A and B, are stored as 32-bitsingle-precision floating-point data types. Times such as Tstart, Tinterval and T arestored as 64-bit double-precision floating-point data types. Length is stored as a 32-bit integer.

PicoScope 6 User's Guide 41
Copyright © 2007-2012 Pico Technology Ltd. All rights re se rved. psw.en
6.1.2 Startup Settings menuLocation: Menu bar > File > Startup Settings
Purpose: allows you to load, save and restore the PicoScope 6 startup settings
Save Startup Settings. Saves your current settings ready for when you next selectLoad Startup Settings. These settings are remembered from one session of PicoScope6 to the next.
Load Startup Settings. Returns to the settings you created with the Save StartupSettings command.
Reset Startup Settings. Deletes the startup settings you created with the SaveStartup Settings command, and restores the installation default settings.
34 35

Menus42
Copyright © 2007-2012 Pico Technology Ltd. All rights re se rved.psw.en
6.2 Edit menuLocation: Menu bar > Edit
Purpose: gives access to the clipboard-related and note editing functions
Copy as Image. Copies the active view to the clipboard as a bitmap. You can thenpaste the image into any application that accepts bitmap images.
Copy as Text. Copies the data in the active view to the clipboard as text. You canpaste the data into a spreadsheet or other application. The text format is the same asthat used by the Save As dialog when you select the .txt format.
Copy Entire Window as Image. This copies a picture of the PicoScope window to theclipboard, and is equivalent to pressing Alt-PrtScn on a full-size keyboard. You canthen paste the picture into any application that can display pictures, such as a wordprocessor or desktop publishing program.
Notes. Opens a Notes area at the bottom of the PicoScope window. You can typeor paste your own notes in this area.
6.2.1 Notes areaLocation: Menu bar > Edit > Notes
Purpose: a text box for typing your own notes
A Notes area can be displayed at the bottom of the PicoScope window. You can enterany text you wish in this area. You can also copy text from another program and pasteit here.
34
36
42
34 42

PicoScope 6 User's Guide 43
Copyright © 2007-2012 Pico Technology Ltd. All rights re se rved. psw.en
6.3 Views menuLocation: Menu bar > Views, or right-click on a
view
Purpose: controls the layout of the current view, which is a rectangular area of thePicoScope window that display scope,spectrum or other kinds of data
The contents of the Views menu may vary dependingon where you click and how many views are open. If thecurrent view contains a Measurements table , acombined Measurements menu and Views menuwill appear.
Add View: Add a view of the selected type(scope , XY or spectrum ).In automatic grid layout mode (thedefault), PicoScope rearranges thegrid to make room for the newview, up to a limit of four views.Any further views will be added astabs in existing viewports . Ifyou have selected a fixed gridlayout, PicoScope will not changeit.
Sub View: (Mixed signal oscilloscopesonly) Switch the analog viewand digital view on and offindependently.
Rename View: Change the standard 'Scope' or 'Spectrum' label to a title ofyour choice.
Close View: Remove a view from the PicoScope window. In automatic gridlayout mode (the default), PicoScope rearranges the grid tomake the best use of the remaining space. In fixed grid layoutmode (if you have selected a grid fixed layout), PicoScope willnot change the grid.
Channels: Select which channels are visible in the current view. Eachview, when created, shows all the input channels, but youcan switch them on and off using this command. Only theinput channels that are enabled (not set to "Off" in the Channel Setup Toolbar ) are available for viewing. TheChannels menu also list math channels and referencewaveforms . You can select up to 8 channels in any view.
X-Axis: Select any suitable channel to drive the X axis. By default,the X axis represents time. If you select an input channelinstead, the scope view will become an XY view that plotsone input against another. A quicker way to create an XYview is to use the Add View command (see above).
34
190
190
21
45
13 17 19
190
14
13
15
107
28
29
17

Menus44
Copyright © 2007-2012 Pico Technology Ltd. All rights re se rved.psw.en
Grid Layout: The grid layout defaults to "Automatic" mode, in whichPicoScope automatically arranges views in a grid. You canalso select one of the standard grid layouts or create acustom layout, which PicoScope will preserve as you add orremove views.
Arrange Grid Layout: Adjust the grid layout to fit the number of views. Moves anytabbed views to empty viewports. Overrides any previouschoice of grid layout.
Reset View Sizes: If you have resized any of the views by dragging the verticalor horizontal separator bars between viewports, this optionresets all the viewports to their original sizes.
Move View To: Move a view to a specified viewport. You can achieve thesame effect by dragging the view by its name tab anddropping it in a new viewport. See How to move a view .
Arrange views: If multiple views are stacked in the same viewport, movethem into their own viewports.
Auto-arrange Axes: Scale and offsets all traces to fill the view and avoidoverlaps.
Reset View Layout: Reset the scale factor and offset of the selected view totheir default values.
View Properties: Show the Properties sheet , which lists scope settings thatare normally hidden.
Reference Waveforms: Copy one of the available channels to a new ReferenceWaveform and add it to the view.
Masks: Select which masks (see Mask Limit Testing ) are visible.
Add Measurement: See Measurements menu .Edit Measurement:Delete Measurement:
6.3.1 Custom grid layout dialogLocation: right-click on view > Views menu > Grid Layout > Custom
layout... or Menu bar > Views > Grid Layout
Purpose: if the Grid Layout section of the Views menu does not contain thelayout you want, this dialog gives further options
You can lay out the view grid with any number of rows and columns up to 4 by 4.You can then drag the views to different locations in the grid.
153
27
29
31
45
43
34 43
43
190

PicoScope 6 User's Guide 45
Copyright © 2007-2012 Pico Technology Ltd. All rights re se rved. psw.en
6.4 Measurements menuLocation: Menu bar > Measurements
Purpose: controls the Measurements table
Add measurement. Adds a row to the measurements table , andopens the Edit Measurement Dialog . You can also find this button onthe Measurements toolbar .
Edit measurement. This takes you to the Edit Measurement Dialog .You can find this button on the Measurements toolbar , or you can edita measurement by double-clicking on a row of the measurements Table.
Delete measurement. Removes the selected row from themeasurements table . You can also find this button on theMeasurements toolbar .
Grid font size. Sets the font size for the entries in the measurementstable .
Column Auto-width. If this button is pressed, the columns of themeasurements table will continually adjust to fit the contentswhenever the table changes. Click again to release the button.
34
21
21
46
127
46
127
21
21
127
21
21
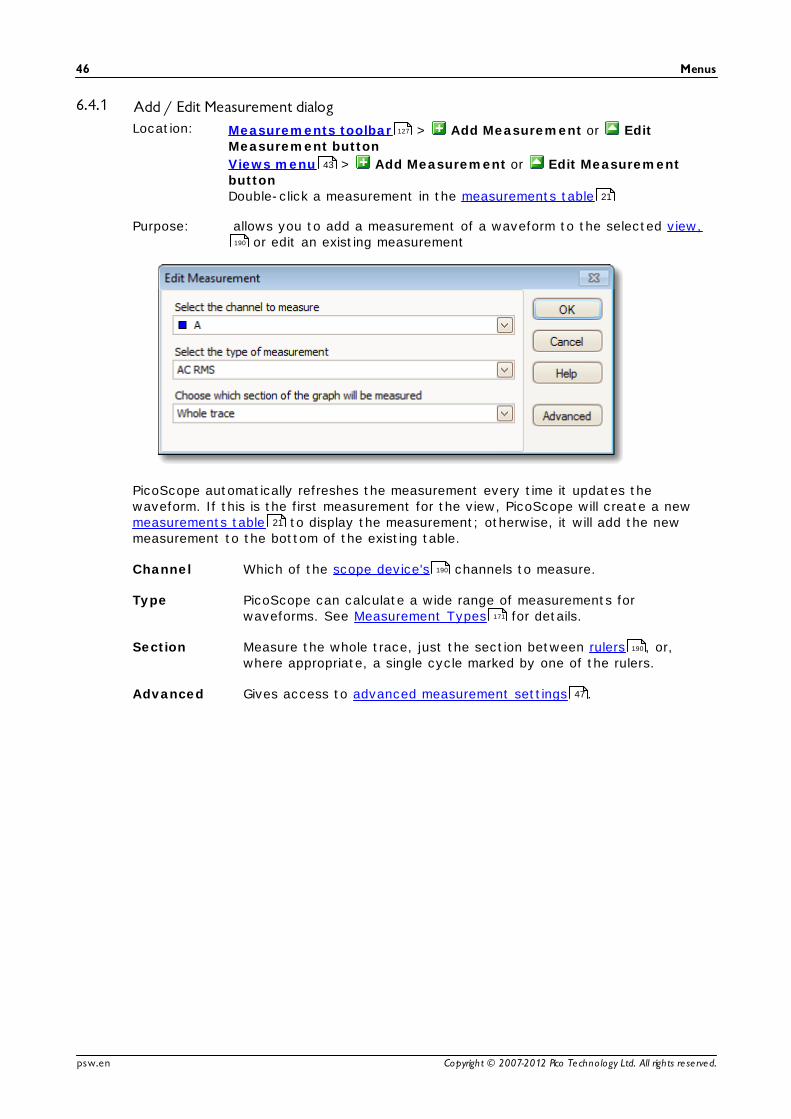
Menus46
Copyright © 2007-2012 Pico Technology Ltd. All rights re se rved.psw.en
6.4.1 Add / Edit Measurement dialogLocation: Measurements toolbar > Add Measurement or Edit
Measurement button
Views menu > Add Measurement or Edit MeasurementbuttonDouble-click a measurement in the measurements table
Purpose: allows you to add a measurement of a waveform to the selected view, or edit an existing measurement
PicoScope automatically refreshes the measurement every time it updates thewaveform. If this is the first measurement for the view, PicoScope will create a new measurements table to display the measurement; otherwise, it will add the newmeasurement to the bottom of the existing table.
Channel Which of the scope device's channels to measure.
Type PicoScope can calculate a wide range of measurements forwaveforms. See Measurement Types for details.
Section Measure the whole trace, just the section between rulers , or,where appropriate, a single cycle marked by one of the rulers.
Advanced Gives access to advanced measurement settings .
127
43
21
190
21
190
171
190
47

PicoScope 6 User's Guide 47
Copyright © 2007-2012 Pico Technology Ltd. All rights re se rved. psw.en
6.4.2 Advanced measurement settingsLocation: Add Measurement or Edit Measurement dialog > Advanced
Purpose: adjusts parameters of certain measurements such as filtering and spectrum analysis
Threshold Some measurements, such as Rise Time and Fall Time, can bemade using different thresholds. Select the appropriate oneshere. When comparing rise and fall times with manufacturers'specifications, it is important to use the same thresholds for allmeasurements.
Spectrum Span When measuring peak-related parameters such as 'Frequency atPeak' in a spectrum view , PicoScope can search for a peaknear to the specified ruler location. This option tellsPicoScope how many frequency bins to search. The default is 5,which tell PicoScope to search from 2 bins below to 2 binsabove the ruler frequency, giving a total range of 5 binsincluding the ruler frequency.
46
19
173 19
25

Menus48
Copyright © 2007-2012 Pico Technology Ltd. All rights re se rved.psw.en
Filter control PicoScope can low-pass filter the statistics to produce morestable and more accurate numbers. Filtering is not available onall measurement types.Enable Filter - check to enable low-pass filtering, if available.An "F" will appear after the measurement name in the measurements table .Automatic - check to set the low-pass filter characteristicsautomatically
Cutoff Frequency The filter cut-off frequency normalised to the measurementrate. Range: 0 to 0.5.
Filter Size The number of samples used to construct the filter
Harmonic Control These options apply to distortion measurements in spectrumviews . You can specify which harmonics PicoScope uses forthese measurements.
Highest Harmonic The highest harmonic to include when calculating distortionpower
Search Range The number of frequency bins to search, centred on theexpected frequency, when looking for a harmonic peak
Harmonic NoiseFloor
The level in dB above which signal peaks will be counted asharmonics
21
19

PicoScope 6 User's Guide 49
Copyright © 2007-2012 Pico Technology Ltd. All rights re se rved. psw.en
6.5 Tools menuLocation: Menu bar > Tools
Purpose: gives access to assorted tools for signal analysis
Custom Probes : Define new probes and copy, delete, move and editexisting ones.
Maths Channels : Add or edit a channel that is a mathematical function ofone or more other channels.
Reference Waveforms : Create, load or save a channel as a copy of anexisting channel.
Serial Decoding : Decode and display the contents of serial data streamsuch as CAN bus.
Alarms : Specify actions to be taken on certain events.
Masks : Perform mask limit testing on a waveform. This detect whenthe waveform departs from a specified shape.
Macro Recorder : Save a frequently-used sequence of operations.
Preferences : Set various options that control PicoScope's behaviour.
34
27
28
29
30
32
31 31
89
90

Menus50
Copyright © 2007-2012 Pico Technology Ltd. All rights re se rved.psw.en
6.5.1 Custom Probes dialogLocation: Tools > Custom Probes, or click the Channel Options button
( )
Purpose: allows you to select predefined probes and set up custom probes
The selection of probes shown may vary depending on the version of the PicoScopesoftware that you are using.
Understanding the probe list
All the probes that PicoScope knows about are listed under three main headings: Built-in, Library and Loaded. The probe list is preserved between sessions, so thatPicoScope will never forget your custom probes unless you delete them.
Built-in probes. The built-in probes are supplied by Pico Technology and do notchange unless you download an authorised update from us. As a safeguard,PicoScope does not allow you to edit or delete these probes. If you want to modifyone of them, you can copy it to your library by clicking Duplicate, and then edit thecopy in your library.Library probes. These are the probes that you have created using any of themethods described in this topic. You can edit, delete or duplicate any of theseprobes by clicking the appropriate button in this dialog.Loaded probes. Probes in PicoScope data files (.psdata) or settings files
(.pssettings) that you have opened appear here until you copy them to your
library. You cannot edit or delete these probes directly, but you can click Duplicateto copy them to your library where you can edit them. You can also import probesfrom the custom ranges stored in PicoScope 5 .psd and .pss files, but these lack
some of the features provided by PicoScope 6. (See "Upgrading from PicoScope 5" for more details.)
49
27
2

PicoScope 6 User's Guide 51
Copyright © 2007-2012 Pico Technology Ltd. All rights re se rved. psw.en
Adding a new probe to your library
There are three ways to create a new probe:
1. Use the Duplicate button as described above.
2. Click New Probe... to define a new probe.
3. Click Import to load a probe definition from a *.psprobe file and add it to your
library. These files are normally supplied by Pico, but you can also create your ownby defining a new probe and then clicking Export.
Methods 2 and 3 open the Custom Probe Wizard to guide you through the probedefinition process.
6.5.1.1 Custom Probe wizard
Location: Custom Probes dialog > New Probe
Purpose: allows you to define custom probes and set up custom ranges
The first dialog in the series is either the Create a new Custom Probe dialog or theEdit an existing Custom Probe dialog .
6.5.1.1.1 Create New Custom Probe dialog
Location: Custom Probes dialog > New Probe
Purpose: introduces you to the process for creating a new custom probe
How to use the dialog
Click Next to continue to the Probe Output Units dialog .
51
50
27
51
52
50
53

Menus52
Copyright © 2007-2012 Pico Technology Ltd. All rights re se rved.psw.en
6.5.1.1.2 Edit Existing Custom Probe dialog
Location: Custom Probes dialog > Edit
Purpose: introduces you to the process for editing an existing custom probe
How to use the dialog
Click Next to continue to the Probe Output Units dialog , where you can edit thecustom probe.
Click Jump forward... if you have already set up the custom probe's basiccharacteristics and want to add or change a custom range manually.
50
27
53

PicoScope 6 User's Guide 53
Copyright © 2007-2012 Pico Technology Ltd. All rights re se rved. psw.en
6.5.1.1.3 Probe Output Units dialog
Location: Create new Custom Probe dialog > Next
Purpose: allows you to choose the units that PicoScope will use to display theoutput of your custom probe
How to use the dialog
To choose a standard SI unit, click Use a standard unit from the list and selectone from the list.To enter a custom unit, click Use the custom unit defined below and type theunit name and symbol.
Click Next to continue to the Scaling Method dialog .Click Back to return to the Create New Custom Probe dialog if this is a newprobe, or the Edit Existing Custom Probe dialog if this is an existing probe.
51
27
54
51
52

Menus54
Copyright © 2007-2012 Pico Technology Ltd. All rights re se rved.psw.en
6.5.1.1.4 Scaling Method dialog
Location: Probe Output Units dialog > Next
Purpose: allows you to define the characteristic that PicoScope will use toconvert the custom probe 's voltage output to a measurement on thedisplay
How to use the dialog
If you do not require any scaling or offset, click the Don't apply any scalingbutton.
If the probe requires linear scaling, click the Use a linear equation button andenter the gradient (or scale factor) m and the offset c in the equation y = mx + c,where y is the displayed value and x is the probe's voltage output.
If you wish to apply a nonlinear function to the probe's output, choose Use a look-up table..., then click the Create a Lookup Table... button to create a new lookuptable. This will take you to the Lookup-table Scaling dialog .
Click Next to continue to the Range Management dialog .Click Back to return to the Probe Output Units dialog .
53
27
55
56
53

PicoScope 6 User's Guide 55
Copyright © 2007-2012 Pico Technology Ltd. All rights re se rved. psw.en
6.5.1.1.4.1 Lookup-table Scaling dialog
Location: Scaling Method dialog > Create a Look-up Table or Edit theLookup Table...
Purpose: creates a look-up table to calibrate a custom probe
Editing the Look-up Table
First, select suitable values in the Input units and Scaled units drop-down boxes. Forexample, if your probe is a current clamp that outputs one millivolt per ampere over therange -600 to +600 amperes, select Input units of millivolts and Output units ofamperes.
Next, enter some data in the scaling table. Click the first empty cell at the top of thetable and type "-600", then hit the Tab key and type "-600". When you are ready toenter the next pair of values, press the Tab key again to start a new row. You canalso right-click on the table to obtain a more detailed menu of options, as shown in thepicture. In the example above, we have entered a slightly nonlinear response; if theresponse had been linear then it would have been easier to use the linear option in the Scaling Method Dialog .
Import/Export
Using the Import and Export buttons, you can fill the look-up table from data in acomma-separated or tab-delimited text file, and save the look-up table to new file.
Finishing
Clicking OK or Cancel will return you to the Scaling Method dialog .
54
27
54
54

Menus56
Copyright © 2007-2012 Pico Technology Ltd. All rights re se rved.psw.en
6.5.1.1.5 Range Management dialog
Location: Scaling Method dialog > Next
Purpose: allows you to override PicoScope's automatic range-creation feature forcustom probes. In most cases, the automatic procedure will besufficient.
How to use the dialog
If you select Let the software manage my ranges for me automatically, thenclicking Next will take you to the Custom Probe Identification dialog . PicoScope'sautomatic ranges should be ideal for most applications.
If you select I will manage the Custom Probe Ranges manually, clicking Nextwill take you to the Manual Ranges Setup dialog .
Click Back to return to the Scaling Method dialog .
What is Auto-ranging?
When the Auto-ranging function is selected, PicoScope continually monitors the inputsignal and adjusts the range when necessary to allow it to display the signal withmaximum resolution. This function is available on all standard ranges, and can be usedwith custom ranges only if you select Let the software manage my ranges for meautomatically in this dialog.
54
62
57
54

PicoScope 6 User's Guide 57
Copyright © 2007-2012 Pico Technology Ltd. All rights re se rved. psw.en
6.5.1.1.6 Manual Ranges Setup dialog
Location: Range Management dialog > Advanced > Next
Purpose: creates ranges manually for your custom probe
How to use the dialog
If you wish, you can click Auto Generate Ranges and the program will create anumber of ranges for the selected device. This will create the same list of ranges thatyou would have obtained by selecting Let the software manage my ranges for meautomatically in the previous dialog. When you select a range, a diagram below thelist will show its relationship to the scope device's input range — this is explainedfurther under Edit range dialog . You can then edit the ranges by clicking Edit, oryou can also add a new range by clicking New Range. Both of these buttons take youto the Edit Range dialog .
Click Next to continue to the Filter Method dialog .
Click Back to return to the Range Management dialog .
How to use a new custom range
After you have createda custom range, it willappear in the drop-down list of ranges inthe channels toolbar,like this:
56
27
58
58
61
56
107
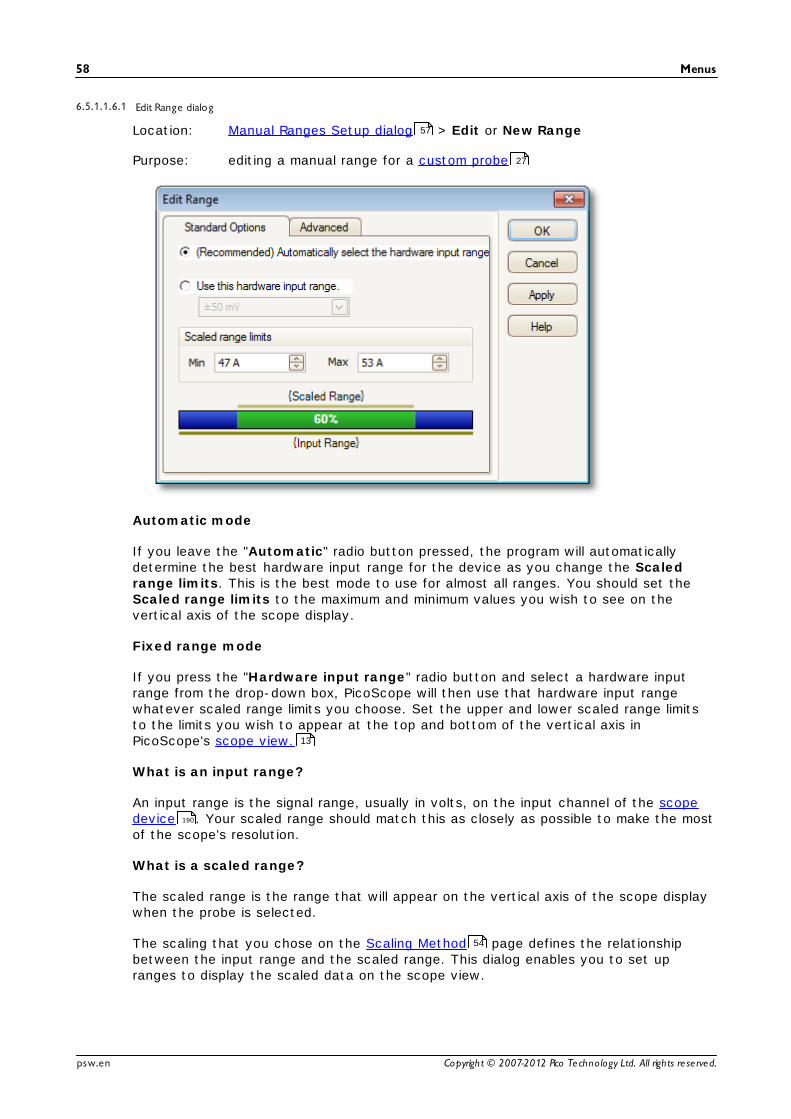
Menus58
Copyright © 2007-2012 Pico Technology Ltd. All rights re se rved.psw.en
6.5.1.1.6.1 Edit Range dialog
Location: Manual Ranges Setup dialog > Edit or New Range
Purpose: editing a manual range for a custom probe
Automatic mode
If you leave the "Automatic" radio button pressed, the program will automaticallydetermine the best hardware input range for the device as you change the Scaledrange limits. This is the best mode to use for almost all ranges. You should set theScaled range limits to the maximum and minimum values you wish to see on thevertical axis of the scope display.
Fixed range mode
If you press the "Hardware input range" radio button and select a hardware inputrange from the drop-down box, PicoScope will then use that hardware input rangewhatever scaled range limits you choose. Set the upper and lower scaled range limitsto the limits you wish to appear at the top and bottom of the vertical axis inPicoScope's scope view.
What is an input range?
An input range is the signal range, usually in volts, on the input channel of the scopedevice . Your scaled range should match this as closely as possible to make the mostof the scope's resolution.
What is a scaled range?
The scaled range is the range that will appear on the vertical axis of the scope displaywhen the probe is selected.
The scaling that you chose on the Scaling Method page defines the relationshipbetween the input range and the scaled range. This dialog enables you to set upranges to display the scaled data on the scope view.
57
27
13
190
54

PicoScope 6 User's Guide 59
Copyright © 2007-2012 Pico Technology Ltd. All rights re se rved. psw.en
The range utilisation bar
This diagram at the bottom of the dialog shows how well the input range of the deviceis matched to the scaled range.
• Green - The section of the input range that is used by the scaled range. Thisshould be as large as possible, to maximise the use of the scope device'sresolution.
• Blue - Areas of the input range that are not being used. These indicate wastedresolution.
• Grey - Parts of the scaled range that are not covered by the input range. Thesewill result in wasted space on the graph. The range utilisation bar may notrepresent these areas accurately when non-linear scaling is being used, so youshould always test the scaled range limits on the scope view.
Advanced tab
FinishingClicking OK or Cancel will return you to the Manual Ranges Setup dialog .
60
57

Menus60
Copyright © 2007-2012 Pico Technology Ltd. All rights re se rved.psw.en
6.5.1.1.6.2 Edit Range dialog (Advanced tab)
Location: Manual Ranges Setup dialog > Edit or New Range > Advancedtab
Purpose: configuring advanced options for custom probes
These options are for factory use and we recommend that you do not change them.
Finishing
Clicking OK or Cancel will return you to the Manual Ranges Setup dialog .
57
27
57
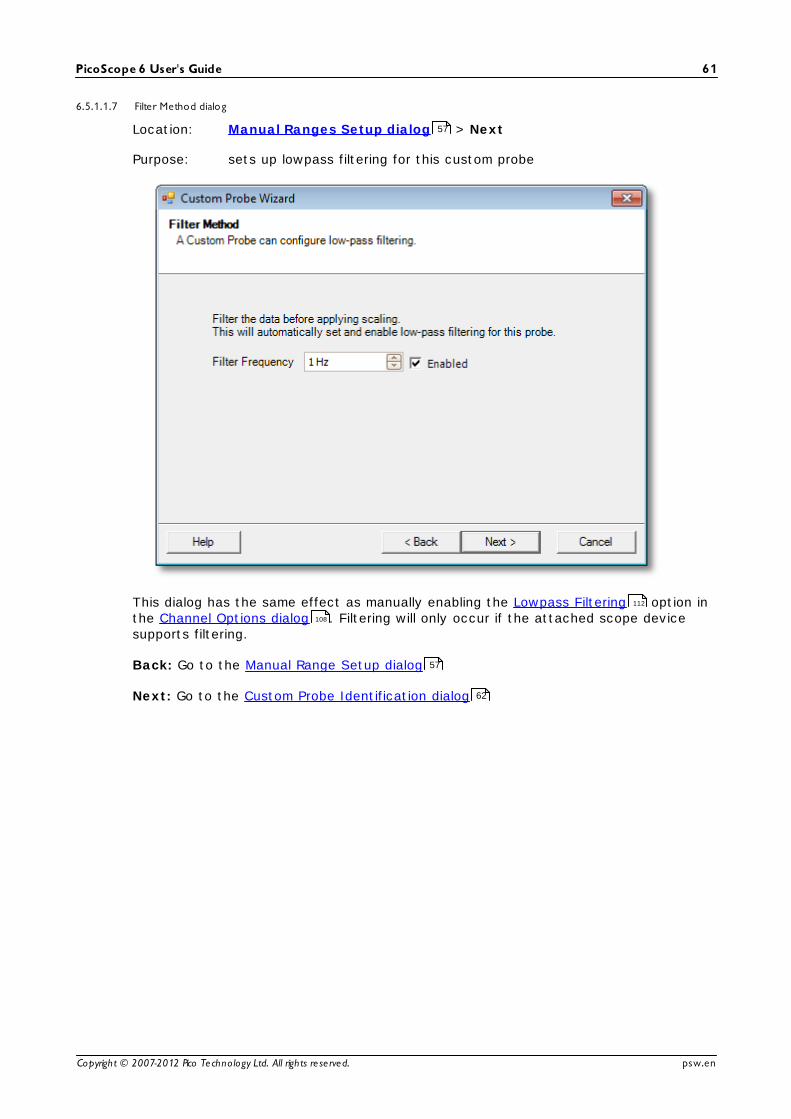
PicoScope 6 User's Guide 61
Copyright © 2007-2012 Pico Technology Ltd. All rights re se rved. psw.en
6.5.1.1.7 Filter Method dialog
Location: Manual Ranges Setup dialog > Next
Purpose: sets up lowpass filtering for this custom probe
This dialog has the same effect as manually enabling the Lowpass Filtering option inthe Channel Options dialog . Filtering will only occur if the attached scope devicesupports filtering.
Back: Go to the Manual Range Setup dialog
Next: Go to the Custom Probe Identification dialog
57
112
108
57
62

Menus62
Copyright © 2007-2012 Pico Technology Ltd. All rights re se rved.psw.en
6.5.1.1.8 Custom Probe Identification dialog
Location: Range Management dialog > Next
Purpose: entering text to identify the custom probe
How to use the dialog
Click Back to return to the Filter Method dialog .
The probe name will appear in the probe list.The description is not used in the present version of the software.
Fill in the text fields and click Next to continue to the Custom Probe Finished dialog.
56
27
61
63

PicoScope 6 User's Guide 63
Copyright © 2007-2012 Pico Technology Ltd. All rights re se rved. psw.en
6.5.1.1.9 Custom Probe Finished dialog
Location: Custom Probe Identification dialog > Next
Purpose: signals the end of the custom probe setup procedure
How to use the dialog
Click Back to return to the Custom Probe Identification dialog .
Click Finish to accept your custom probe settings and return to the Custom Probesdialog .
62
27
62
50

Menus64
Copyright © 2007-2012 Pico Technology Ltd. All rights re se rved.psw.en
6.5.2 Maths Channels dialogLocation: Menu bar > Tools > Maths Channels
Purpose: creating , editing and controlling maths channels , which arevirtual channels generated by mathematical functions of input channels
Maths Channel list The main area of the Maths Channels dialog is the MathsChannel list, which shows all the built-in, library and loadedmaths channels . To choose whether or not a channel appearsin the main PicoScope window , click the appropriate check boxand then OK. You can have up to 8 channels in any view,including input channels and maths channels. If you try to enablea 9th channel, PicoScope will open a new view.
Built In: these maths channels are defined by PicoScope andcannot be changed
Library: these are the maths channels that you define using theCreate or Duplicate button, Edit, or load with the Importbutton
Loaded: these are the maths channels present in any PicoScopesettings or data files that you have loaded
Create Opens the Maths Channel Wizard , which guides you throughthe process of creating or editing a maths channel. The newchannel will appear under "Library" in the Maths Channel list.
34 49 28
66 66 28
28
12
66
PicoScope 6 User's Guide 65
Copyright © 2007-2012 Pico Technology Ltd. All rights re se rved. psw.en
Edit Opens the Maths Channel Wizard to allow you to edit theselected maths channel. You must first select a channel in the Library section of the Maths Channel list. If the channel youwant to edit is in the Built In or Loaded section, first copy it tothe Library section by clicking Duplicate, then select it andclick Edit.
Delete Permanently deletes the selected maths channel. Only mathschannels in the Library section can be deleted.
Duplicate Creates a copy of the selected maths channel. The copy isplaced in the Library section, from where you can edit it byclicking Edit.
Import Opens a .psmaths math channel file and places the maths
channels it contains in the Library section.
Export Saves all maths channels from the Library section to a new.psmaths file.
66

Menus66
Copyright © 2007-2012 Pico Technology Ltd. All rights re se rved.psw.en
6.5.2.1 Maths Channel Wizard
Location: Channel Setup toolbar > Maths Channels button
Purpose: creating, editing and controlling maths channels, which are virtualchannels generated by mathematical functions of input channels
1. Introduction
2. Equation
3. Channel name
4. Units and range
5. Finished
107
67
68
71
72
73
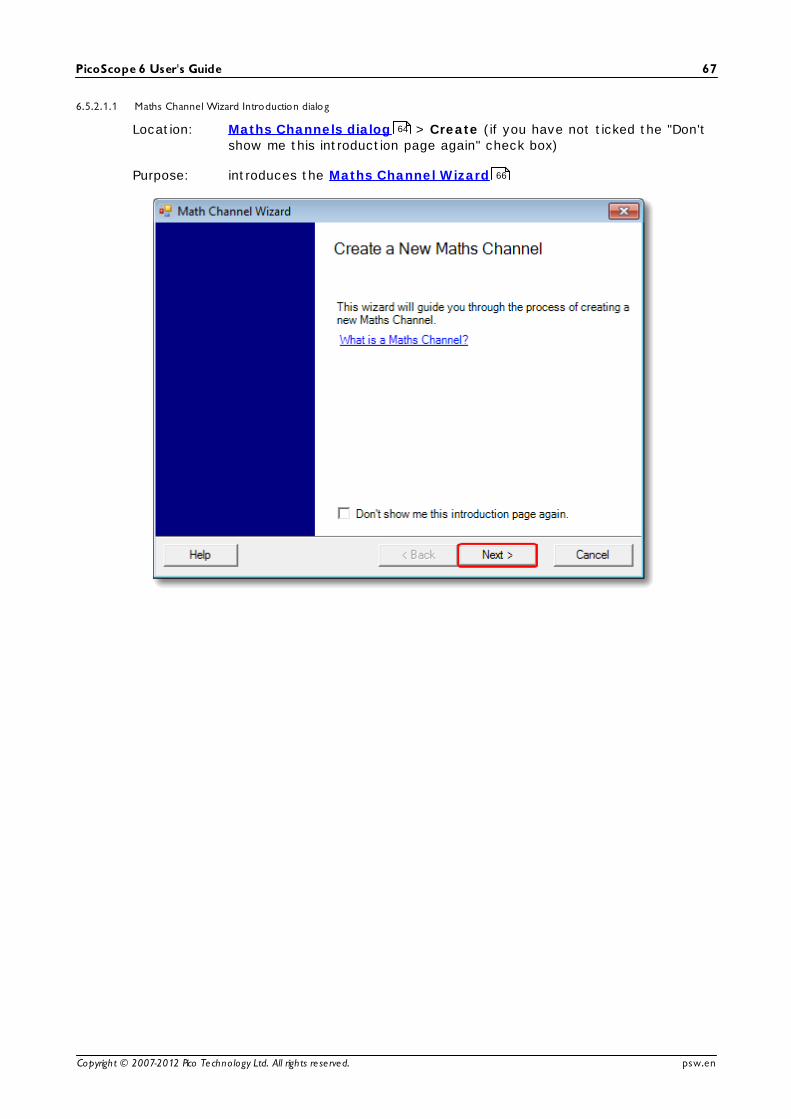
PicoScope 6 User's Guide 67
Copyright © 2007-2012 Pico Technology Ltd. All rights re se rved. psw.en
6.5.2.1.1 Maths Channel Wizard Introduction dialog
Location: Maths Channels dialog > Create (if you have not ticked the "Don'tshow me this introduction page again" check box)
Purpose: introduces the Maths Channel Wizard
64
66

Menus68
Copyright © 2007-2012 Pico Technology Ltd. All rights re se rved.psw.en
6.5.2.1.2 Maths Channel Wizard Equation dialog
Location: Maths Channel Wizard
Purpose: allows you to enter or edit the equation for a maths channel . You cantype directly into the equation box, or click the calculator buttons and
let the program insert the symbols for you. A red error indicator willappear to the right of the equation box if the equation contains a syntaxerror.
Basic view
Maths Channel Wizard Equation dialog, basic view
Basic buttons
Button Equation DescriptionClear Equation. Clears the entire contents of theequation box.Clear. Clears the single character to the left of thecursor.
+ Add
- Subtract (or negate)
* Multiply
/ Divide
...A...D Input Channels. The number of buttons varies
according to the number of channels on youroscilloscope.
..., T Other Operands. Shows a drop-down list ofavailable inputs to equations, including referencewaveforms and Time.
(...) Brackets. Expressions within brackets will beevaluated before the expressions to either side.
66
28
29
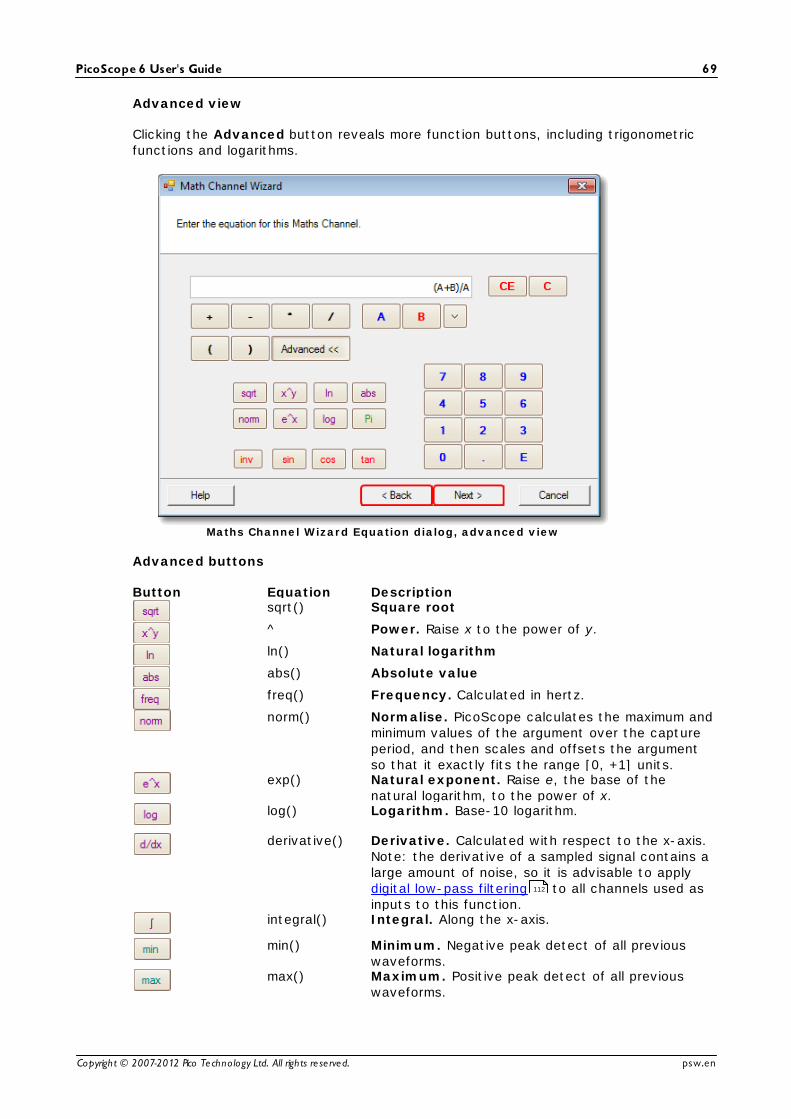
PicoScope 6 User's Guide 69
Copyright © 2007-2012 Pico Technology Ltd. All rights re se rved. psw.en
Advanced view
Clicking the Advanced button reveals more function buttons, including trigonometricfunctions and logarithms.
Maths Channel Wizard Equation dialog, advanced view
Advanced buttons
Button Equation Descriptionsqrt() Square root
^ Power. Raise x to the power of y.
ln() Natural logarithm
abs() Absolute value
freq() Frequency. Calculated in hertz.
norm() Normalise. PicoScope calculates the maximum andminimum values of the argument over the captureperiod, and then scales and offsets the argumentso that it exactly fits the range [0, +1] units.
exp() Natural exponent. Raise e, the base of thenatural logarithm, to the power of x.
log() Logarithm. Base-10 logarithm.
derivative() Derivative. Calculated with respect to the x-axis. Note: the derivative of a sampled signal contains alarge amount of noise, so it is advisable to apply digital low-pass filtering to all channels used asinputs to this function.
integral() Integral. Along the x-axis.
min() Minimum. Negative peak detect of all previouswaveforms.
max() Maximum. Positive peak detect of all previouswaveforms.
112

Menus70
Copyright © 2007-2012 Pico Technology Ltd. All rights re se rved.psw.en
average()Average. Arithmetic mean of all previouswaveforms.
peak()Peak detect. Display maximum-to-minimum rangeof all previous waveforms.
piPi. The ratio of a circle's circumference to itsdiameter.Inverse. Modifies the sin, cos and tan buttons toasin, acos and atan.
sin() Sine. The operand is in radians.
cos() Cosine. The operand is in radians.
tan() Tangent. The operand is in radians.
...0..9 0 to 9. The decimal digits.
. Decimal point
E Exponent. aEb means a × 10b.
Additional functions
There are a few equation features that can only be entered using the text box.
Hyperbolic functions. You can enter the sinh(), cosh() and tanh() operators toobtain hyperbolic functions.
Signum function. The sign() operator returns the sign of its input. The result is +1when the input is positive, -1 when the input is negative, and 0 when the input is 0.

PicoScope 6 User's Guide 71
Copyright © 2007-2012 Pico Technology Ltd. All rights re se rved. psw.en
6.5.2.1.3 Maths Channel Wizard Name dialog
Location: Maths Channel Wizard
Purpose: allows you to enter or edit the name and color of a maths channel
PicoScope initially sets the name to the text of the equation, but you can edit it toanything you like. The name will appear in the channel list in the Maths Channels dialog
. You can set the color of the trace to one of the standard colors in the drop-down-list, or click Custom to choose any possible color allowed by Windows.
66
28
64

Menus72
Copyright © 2007-2012 Pico Technology Ltd. All rights re se rved.psw.en
6.5.2.1.4 Maths Channel Wizard Units and Range dialog
Location: Maths Channel Wizard
Purpose: allows you to specify the measurement units and the range of values todisplay for a maths channel
Units, Long Name: This is for your reference only.
Units, Short Name: This will be displayed on the measurement axis in scope andspectrum views, in the ruler legend and in the measurements table .
Range: If you leave the check box empty, PicoScope will choose the most appropriaterange for the measurement axis. If you prefer to set your own values for the minimumand maximum extremes of the measurement axis, tick the check box and enter them inthe Min and Max boxes.
66
28
13
19 26 21

PicoScope 6 User's Guide 73
Copyright © 2007-2012 Pico Technology Ltd. All rights re se rved. psw.en
6.5.2.1.5 Maths Channel Wizard Finished dialog
Location: Maths Channel Wizard
Purpose: shows you the settings for the maths channel that you have justcreated or edited
Back. Click this button to return to previous dialogs in the Maths Channel Wizard if you wish to change any of the settings.
Finish. Click this button to accept the settings shown and return to the MathsChannels dialog . If you want the new or edited channel to appear on the scope orspectrum display, remember to tick the appropriate check box in the channel list. Youcan change them later by clicking the Maths Channels button in the Channel Setuptoolbar .
66
28
66
64
107

Menus74
Copyright © 2007-2012 Pico Technology Ltd. All rights re se rved.psw.en
6.5.3 Reference Waveforms dialogLocation: Tools > Reference Waveforms
Purpose: enables you to create, edit and control reference waveforms ,which are stored copies of input channels
ReferenceWaveforms list
The main area of the Reference Waveforms dialog is theReference Waveforms list, which shows all the available inputchannels and the library and loaded reference waveforms . Tochoose whether or not a waveform appears in the main PicoScopewindow , click the appropriate check box and then OK. You canhave up to 8 channels in any view, including input channels, mathchannels and reference waveforms. If you try to enable a 9thchannel, PicoScope will open a new view.
Available: these input channels are suitable as sources for referencewaveforms
Library: these are the reference waveforms that you have definedusing the Duplicate button or loaded with the Import button
Loaded: these are the reference waveforms present in anyPicoScope settings or data files that you have loaded
Edit Opens the Edit Reference Waveform dialog to allow you to editthe selected reference waveform. You must first select a waveform inthe Library section of the Reference Waveforms list. If thewaveform you want to edit is in the Loaded section, first copy it tothe Library section by clicking Duplicate, then select it and clickEdit.
Delete Permanently deletes the selected reference waveform. Only referencewaveforms in the Library section can be deleted.
49 29
75 29
29
12
75

PicoScope 6 User's Guide 75
Copyright © 2007-2012 Pico Technology Ltd. All rights re se rved. psw.en
Duplicate Creates a copy of the selected input channel or reference waveform.The copy is placed in the Library section, from where you can edit itby clicking Edit. A quicker way to do the same thing is to right-clickon the view, select Reference Waveforms and then click thechannel that you wish to copy.
Import Opens a .psreference reference waveform file and places the
waveforms it contains in the Library section.
Export Saves all reference waveforms from the Library section to a new.psreference or Matlab 4 .mat file.
6.5.3.1 Edit Reference Waveform dialog
Location: Reference Waveforms dialog > Edit
Purpose: allows you to edit the name and color of a reference waveform
Name. PicoScope initially names the waveform after the input channel used as itssource, but you can edit it to anything you like. Here we have named it"sine". The name will appear in the waveform list in the ReferenceWaveforms dialog .
Color: You can set the color of the trace to one of the standard colors in thedrop-down-list, or click Custom to choose any color allowed by Windows.
74
29
74

Menus76
Copyright © 2007-2012 Pico Technology Ltd. All rights re se rved.psw.en
6.5.4 Serial Decoding dialogLocation: Tools > Serial Decoding
Purpose: lets you choose which channels to use for serial decoding and setother options
The following formats are supported:
I2CCAN BusRS232 (UART)SPI
Protocols table
This is where you select which channels to decode, and what serial protocol to use foreach channel. All the available channels are listed in the Channels column.
If the channel you want to use is not listed, enable it first by using the Channelstoolbar . For each channel that you want to decode, click in the Protocols column. A drop-down list will appear, containing all the protocols that PicoScope understands. Thelist may vary depending on which version of PicoScope you are using. For multi-
channel protocols like I2C and SPI, select the data channel. Any other channels willbe specified later.
49
30
182
180
183
184
107

PicoScope 6 User's Guide 77
Copyright © 2007-2012 Pico Technology Ltd. All rights re se rved. psw.en
Select the protocol you wish to use. A Settings panel for the selected channel willthen appear below the table in the dialog.
Settings panel
The settings panel shows all the adjustable settings for the selected channel. Theoptions available depend on the protocol selected.
Information panel
You do not need to take action on the messages in this panel. If the number ofsamples is too small then PicoScope will automatically adjust the capture settings toimprove the signal quality. If the number of samples is larger than necessary, this isharmless and no adjustment will be made.
Common settings
These apply to all serial data formats.
Refresh. When you have entered the necessary information, PicoScopeanalyzes the incoming signal and chooses the best settings for serial decoding. IfPicoScope is unable to decode the data, try improving the signal quality and thenclick the Refresh button to analyze the signal again. For best results, click theAuto Setup button in the Capture Setup toolbar in the main PicoScope window
before entering serial decoding mode. This will ensure that the signal iscaptured with enough detail for accurate decoding.
Display. Choose where you want to display the data: In View, In Window , orboth.
In View shows the data in logic-analyzer style, on the same time axis as theanalog waveform.
Hover the mouse pointer over any decoded packet to display its contents.Click-and-drag the decoded data up or down the scope view.If the In Window display is visible, double-click on any packet tohighlight it in the table.
In Window displays the decoded data in a table in the serial data window ,with advanced search and filtering functions.
CAN Bus settings
PicoScope can decode either the CAN H or the CAN L signal. Select which one you areusing in the Protocols table.
Threshold. A voltage halfway between the high and low logic levels. If you are notsure, set this to halfway between the maximum and minimum voltages that you seeon the waveform.
Baud Rate. The speed of data transmission in symbols per second. Set this tomatch the speed of the data bus.
I2C Settings
Clock Channel. Which channel is connected to the SCL signal.
Clock Threshold. The threshold voltage to use for the SCL signal.
121
12
79
79
79
180
182

Menus78
Copyright © 2007-2012 Pico Technology Ltd. All rights re se rved.psw.en
Data Threshold. The threshold voltage to use for the SDA signal.
Settings. Opens the I2C Settings dialog .
RS232/UART Settings
Threshold. A voltage halfway between the high and low logic levels. If you are notsure, set this to halfway between the maximum and minimum voltages that you seeon the waveform.
Baud Rate. The speed of data transmission in symbols per second. Set this tomatch the speed of the data bus.
Bit Definitions. Opens the Bit Definitions dialog for setting up RS232 formatparameters.
SPI Settings
Clock Channel. Which channel is connected to the clock signal (SCLK or CLK).
Clock Threshold. The threshold voltage to use for the clock signal.
Data Threshold. The threshold voltage to use for the data signal (SDI, DI, SI,SDO, DO or SO).
CS Channel. Which channel to use for the chip select (CS, SS or STE) signal, ifpresent.
CS Threshold. The threshold voltage to use for the chip select signal.
Settings. Opens the Settings dialog .
83
183
81
184
82

PicoScope 6 User's Guide 79
Copyright © 2007-2012 Pico Technology Ltd. All rights re se rved. psw.en
6.5.4.1 Serial Data window
Location: Channels toolbar > Serial Decoding button > select In Window inthe Serial Decoding dialog
Purpose: shows decoded serial data in alphanumeric format and allowsadvanced filtering and searching
For more information on the format of the table for each serial protocol, see Serialprotocols .
If you also selected In View in the Serial Decoding dialog, the data will also appearin graphical form on the scope view. You can click on one of the data packets in thescope view to go to the corresponding row in the table, or you can double-click a rowin the table to zoom to the corresponding frame in the scope view.
Control bar
The controls in the control bar are as follows:
Export Save the decoded data to a Microsoft Excel spreadsheet.
Accumulate By default, PicoScope clears the table each time the scope capturesa new buffer full of data. Click this button to enter Accumulatemode, which continues adding serial frames to the end of the tableuntil you click the button again.
View Controls which details of the data appear in the table. The sub-menus are as follows:
Frames/Packets: which types of frames or packets are displayedFields: which columns appear in the data tableDisplay Format: hexadecimal, binary, ASCII or decimal formatFont Size: the character size used in the table
Link This drop-down list selects or opens aspreadsheet file that maps numbers tostrings. For example, if you wish to display aCAN packet of type 41 (hex) as "HeadlightsOn", then enter "41" in the first column of thefile and "Headlights On" in the second.
107
76
30
179

Menus80
Copyright © 2007-2012 Pico Technology Ltd. All rights re se rved.psw.en
This button creates a sample spreadsheet fileto which you can add your own list ofnumber-string pairs.
Start from... Use this button to enter a condition that PicoScope will wait forbefore collecting data. When PicoScope detects a packet thatmatches this condition, it will collect all subsequent data (subject tofiltering, if used - see above) and display it in the table.
Filter Click to show the filter bar, which allows you to enter arbitrary dataabove each column in the table. The table will display only thosepackets that match the data you have entered. For example,entering "6C7" in the filter box at the top of the ID column will causeonly frames with an ID of 6C7 to be displayed.
Statistics Toggle the statistics columns that list measurements such as packetstart and end times, and signal voltages.
Search Search for any data value in a specified column of the table.
Refresh Instructs PicoScope to decode the raw data again. This is necessaryif you have changed the Start from... condition, for example.
Clear Clear all data and settings in the table. New data will appear the nexttime that the scope captures a waveform.
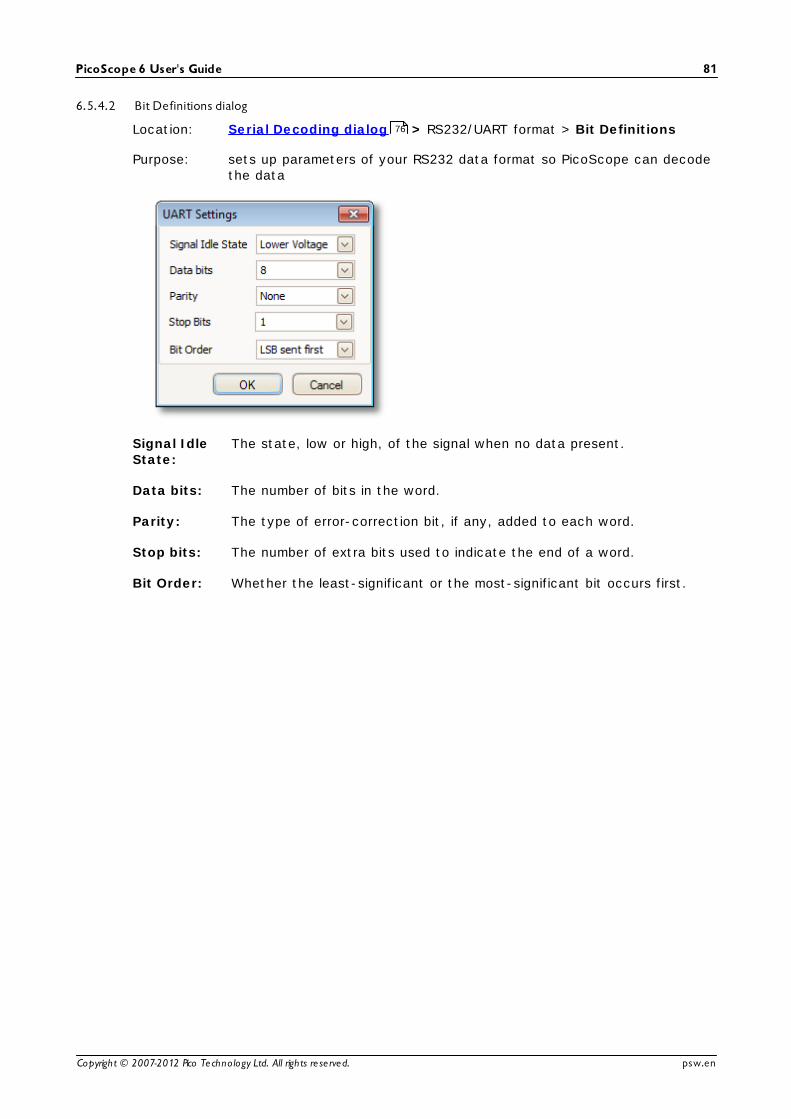
PicoScope 6 User's Guide 81
Copyright © 2007-2012 Pico Technology Ltd. All rights re se rved. psw.en
6.5.4.2 Bit Definitions dialog
Location: Serial Decoding dialog > RS232/UART format > Bit Definitions
Purpose: sets up parameters of your RS232 data format so PicoScope can decodethe data
Signal IdleState:
The state, low or high, of the signal when no data present.
Data bits: The number of bits in the word.
Parity: The type of error-correction bit, if any, added to each word.
Stop bits: The number of extra bits used to indicate the end of a word.
Bit Order: Whether the least-significant or the most-significant bit occurs first.
76

Menus82
Copyright © 2007-2012 Pico Technology Ltd. All rights re se rved.psw.en
6.5.4.3 Settings dialog
Location: Serial Decoding dialog > select SPI format > Settings
Purpose: sets up parameters of your SPI data format so PicoScope can decodethe data
Sample Clock on: Which edge of the clock to use.
Chip Select State: The polarity of the chip select (CS) signal, if used.
Data bits: The number of bits in the word. Choose from the drop-downlist or type a number directly into the box.
Bit Order: Whether the least-significant or the most-significant bitoccurs first.
76

PicoScope 6 User's Guide 83
Copyright © 2007-2012 Pico Technology Ltd. All rights re se rved. psw.en
6.5.4.4 I2C Settings dialog
Location: Serial Decoding dialog > select I2C format > Settings
Purpose: sets up parameters of your I2C data format so PicoScope can decodethe data
Display Address as: 7 bit Slave Address: displays as an 8-bit number by addingleading zeroes to the 7-bit address.8 bit Read/Write Address: displays as an 8-bit numberconsidering the Read/Write~ bit.
76

Menus84
Copyright © 2007-2012 Pico Technology Ltd. All rights re se rved.psw.en
6.5.5 Alarms dialogLocation: Tools > Alarms
Purpose: gives access to the alarms feature, which specifies actions to be takenon various events
Event: Select the event that will trigger the alarm:
Capture: when a waveform is captured. If triggering isenabled, this option corresponds to a trigger event. You cantherefore use this function to save a file on each trigger event.
Buffers Full: when the number of waveforms in the waveformbuffer reaches the maximum waveform count .
Mask(s) Fail: when any channel fails a mask test .
(Actions list): Add an action to this list by clicking Add. Whenever the specifiedevent occurs, PicoScope will execute the all the actions in the listfrom top to bottom.
NOTE: For an action to execute, its check box must be set.
Apply: Set up the scope according to the settings in this dialog.
Add: Add an event to the Actions list. Possible events are:
Beep: activate the computer's built-in sounder. 64-bit PCsredirect this sound to the headphone output.
Play Sound: specify the name of a .wav sound file to play.
Stop Capture: equivalent to pressing the red Stop button.
49
138
106 91
31

PicoScope 6 User's Guide 85
Copyright © 2007-2012 Pico Technology Ltd. All rights re se rved. psw.en
Restart Capture: equivalent to pressing the green Start button.Use only if the Stop Capture action was used earlier in the list.
Run Executable: run the specified EXE, COM or BAT program file.You can type the %file% variable after the program name to pass
the name of the last file saved as an argument to the program.PicoScope will stop capturing while the program runs, and resumeafter the program terminates.
Save Current Buffer: save the current waveform from the bufferas a .psdata, .pssettings, .csv or .mat file. You can use the
%buffer% variable to insert the buffer index number into the
filename, or the %time% variable to insert the time of capture.
Save All Buffers: save the entire waveform buffer as a .psdata,
.pssettings, .csv or .mat file.

Menus86
Copyright © 2007-2012 Pico Technology Ltd. All rights re se rved.psw.en
6.5.6 Masks menuLocation: Tools > Masks
Purpose: gives control over Mask Limit Testing
Add Masks: Add a mask to the display using the Mask Library dialog .
Clear Mask: Remove the mask from the display.
Save Mask: Save the displayed mask to disk as a .mask file.
6.5.6.1 Mask Library dialog
Location: Menu bar > Tools > Masks
Purpose: allows you to create, export and import masks for Mask Limit Testing
Channel: Select the channel to which you want to apply the mask.
Availablemasks:
The Library section shows all the masks that you have saved in thepast and not deleted. The Loaded section shows all the masks currentlyin use.
Generate: Create a new mask based on the last waveform captured from theselected channel. Opens the Generate Mask dialog .
Import: Load a mask that has previously been saved as a .mask file.
Export: Save a mask as a .mask file for future import.
49
31
86
34 49
31
88

PicoScope 6 User's Guide 87
Copyright © 2007-2012 Pico Technology Ltd. All rights re se rved. psw.en
Apply: Use the selected mask on the selected channel but remain in the MaskLibrary dialog.
OK: Use the selected mask on the selected channel and return to the scopeview .
6.5.6.2 Editing a mask
To edit a mask in Mask Limit Testing mode, right-click on the scope view andselect Edit Mask:
A mask is made up of one or more shapes called polygons. Click on the polygon youwish to edit. PicoScope will then draw edit handles on the selected mask polygon anddisplay the mask edit box. If you drag any of the handles to edit the polygon, thestatistical results will be updated immediately.
The mask edit box looks like this:
Normal viewMinimized
view
If the edit box is not immediately visible, it may have been minimized; in which case,
click the restore button: . If you edit the coordinates of a vertex, the statisticalresults will be updated immediately. You can also export the mask to a .mask file with
the export button: . Use the + and - buttons to add or remove vertices. Theminimize button has its usual function. To leave mask editing mode, close the mask editbox with the close (X) button.
13
31 13

Menus88
Copyright © 2007-2012 Pico Technology Ltd. All rights re se rved.psw.en
To add or remove an entire polygon, right-click the scope view and select either the Add Mask Polygon or the Remove Mask Polygon command:
6.5.6.3 Generate Mask Dialog
Location: Mask Library dialog > Generate
Purpose: allows you to set parameters for the automatically generated mask.PicoScope will then create a new mask based on the last capturedwaveform
Name: PicoScope automatically chooses a name for the new mask, but you canchange it to anything you like here.
X Offset: The horizontal distance between the waveform and the mask.
Y Offset: The vertical distance between the waveform and the mask.
86

PicoScope 6 User's Guide 89
Copyright © 2007-2012 Pico Technology Ltd. All rights re se rved. psw.en
6.5.7 Macro RecorderLocation: Tools > Macro Recorder
Purpose: records a sequence of commands to be replayed later
The Macro Recorder helps when you wish to execute a series of commandsrepeatedly. It saves all commands to a .psmacro file, which can be modified using anXML editor.
Execute in real time: Play back the macro at the same speed as when recorded.Without this option, playback will be as fast as possible.
49

Menus90
Copyright © 2007-2012 Pico Technology Ltd. All rights re se rved.psw.en
6.5.8 Preferences dialogLocation: Menu bar > Tools > Preferences
Purpose: Allows you to set options for the PicoScope software. Click one of thetabs in the picture below to learn more.
34 49

PicoScope 6 User's Guide 91
Copyright © 2007-2012 Pico Technology Ltd. All rights re se rved. psw.en
6.5.8.1 General page
Location: Preferences dialog
Purpose: contains general controls for PicoScope
Reset 'Don't show this again' dialogsRestore any missing dialogs that you asked PicoScope not to show again.
Reset preferencesSet all preferences back to their default values.
Waveform BufferMaximum Waveforms: This is the maximum number of waveforms that PicoScopewill store in the waveform buffer . You can select a number from 1 to themaximum allowed by the oscilloscope that is connected: see the scopespecifications for details). The actual number of waveforms stored depends on theavailable memory and the number of samples in each waveform.
Collection Time UnitsChange the mode of the Timebase control in the Capture Setup toolbar .
Times per division: the Timebase control displays time units per division - forexample, '5 ns /div'. Most laboratory oscilloscopes display timebase settings in thisway.
Total collection time: the Timebase control displays time units for the entirewidth of the scope view - for example, '50 ns'.
Measurement StatisticsCapture Size - the number of successive captures that PicoScope uses tocalculate the statistics in the Measurements Table . A larger number producesmore accurate statistics but causes them to be updated less frequently.
90
106
121
21

Menus92
Copyright © 2007-2012 Pico Technology Ltd. All rights re se rved.psw.en
6.5.8.2 Power management page
Location: Preferences dialog
Purpose: controls features of the oscilloscope that affect its power consumption
Capture Rate
This control limits the speed at which PicoScope captures data from the scope device.The other PicoScope settings, the type of scope device and the speed of thecomputer will all affect whether this limit can actually be reached. PicoScopeautomatically selects the appropriate limit according to whether your computer isrunning on batteries or on mains (line) power.
The settings are in captures per second. By default, the capture rate is set to"Unlimited" when your computer is running on Mains (line) power, for maximumperformance. If other applications run too slowly on your PC whilst PicoScope iscapturing, then reduce the capture rate limit. When your computer is running on Battery power, PicoScope imposes a performance limit to save the battery. You canincrease this limit manually, but this will cause the battery power to drain very quickly.
90
190

PicoScope 6 User's Guide 93
Copyright © 2007-2012 Pico Technology Ltd. All rights re se rved. psw.en
6.5.8.3 Sampling page
Location: Preferences dialog
Purpose: controls the sampling behaviour of the oscilloscope
Slow Sampling Transition
In normal (fast) sampling mode, PicoScope collects enough data to fill the screen andthen redraws the whole view at once. This method is suitable for fast timebases, whenthe screen is redrawn many times each second, but with slow timebases it can cause aunacceptable delay before the data appears on the screen. To avoid this delay,PicoScope automatically switches to slow sampling mode, in which the scope traceadvances gradually across the screen as the scope captures data.
The Collection Time control lets you select the timebase at which PicoScope switchesto slow sampling mode.
Slow Sampling Display
When this box is checked, PicoScope displays the previous waveform in the bufferwhile gradually redrawing the new waveform over the top of it. Thus, at any time, theleft-hand side of the view shows the beginning of the new waveform, while the right-hand side shows the end of the previous waveform. A vertical bar separates the twowaveforms.
90

Menus94
Copyright © 2007-2012 Pico Technology Ltd. All rights re se rved.psw.en
Sin(x)/x Interpolation
When the number of pixels across the scope view is greater than the number ofsamples in the waveform buffer, PicoScope interpolates - that is, it fills the spacebetween the samples with estimated data. It can either draw straight lines betweenthe samples (linear interpolation) or connect them with smooth curves (sin(x)/xinterpolation). Linear interpolation makes it easier to see where the samples are, whichis useful for high-accuracy measurements, but results in a jagged waveform. Sin(x)/xinterpolation gives a smoother waveform but disguises the true locations of thesamples, so should be used with care when the number of samples on the screen islow.
You can adjust the number of samples below which sin(x)/x interpolation is switchedon. Sin(x)/x interpolation is used only on the scope's fastest timebase.

PicoScope 6 User's Guide 95
Copyright © 2007-2012 Pico Technology Ltd. All rights re se rved. psw.en
6.5.8.4 Keyboard page
Location: part of the Preferences dialog
Purpose: displays, and allows you to edit, keyboard shortcuts
A keyboard shortcut is a combination of keys that can be pressed on the keyboard toactivate a PicoScope function.
Keyboard Shortcuts All available PicoScope operations and their associatedkeyboard shortcuts (if defined) are listed. To edit or add akeyboard shortcut:
Scroll the list of PicoScope commands until the requiredcommand is visible.Select the required command.Select the 'Press shortcut keys:' box.Press the required key combination on the keyboard.Click Assign.
90

Menus96
Copyright © 2007-2012 Pico Technology Ltd. All rights re se rved.psw.en
6.5.8.5 Regional & Language page
Location: part of the Preferences dialog
Purpose: lets you select the language and other location-dependent settings forPicoScope's user interface
Language Select, from the drop-down box, the language you wish touse for the PicoScope 6 user interface. PicoScope will askyou to restart the program before switching to the newlanguage.
Measurement System Select metric or U.S. units.
90

PicoScope 6 User's Guide 97
Copyright © 2007-2012 Pico Technology Ltd. All rights re se rved. psw.en
6.5.8.6 Printing page
Location: part of the Preferences dialog
Purpose: lets you enter the details that will appear at the bottom of printedoutput
Default PrintSettings
When you print a view from the File menu , these details will beadded to the bottom of the page.
90
35

Menus98
Copyright © 2007-2012 Pico Technology Ltd. All rights re se rved.psw.en
6.5.8.7 Colors page
Location: part of the Preferences dialog
Purpose: lets you set the colors for various parts of the user interface
Custom Colors
These controls let you specify the colors for various parts of the PicoScope screen:
Channels the trace color for each scope channel
Digital Channels if you have a mixed-signal oscilloscope (MSO), the color ofeach channel can be set here
Masks the mask areas in Mask Limit Testing
Misc miscellaneous items:
Grid lines the horizontal and vertical lines on the graticule
Background the area behind the waveforms and graticule. (In persistencemode this setting can be overridden by the PersistenceOptions dialog .)
Live trigger the trigger marker for the current trigger position
Trigger secondary trigger marker (appears when the live trigger hasmoved since the last waveform capture)
Horizontal axis the numbers across the bottom of each view , which usuallyindicate time measurements
Rulers the horizontal and vertical rulers that you can drag intoposition to help measure features on the waveform
90
13
14
31
189
20
125
18
13
190

PicoScope 6 User's Guide 99
Copyright © 2007-2012 Pico Technology Ltd. All rights re se rved. psw.en
Persistence the three colors to use for each channel in digital color persistence mode . The top color is used for the mostfrequently hit pixels, the middle and bottom colors for the lessand least frequently hit pixels.
Line Thickness
These controls let you specify the thickness of the lines drawn on the scope andspectrum views:
Channel the waveforms and spectrum traces for all scope channelsGrid Lines the horizontal and vertical lines on the graticuleMarkers the horizontal and vertical rulers that you can drag into
position to help measure features on the waveform
Reset Colors to Default
Resets all of the color and line thickness settings to their default values.
20
13
19
189
190

Menus100
Copyright © 2007-2012 Pico Technology Ltd. All rights re se rved.psw.en
6.5.8.8 Options page
Location: part of the Preferences dialog
Purpose: lets you set various options that control the way that PicoScope 6works
Device Startup Settings
Remember Last Device. This option is used when PicoScope finds more than onescope device connected to the computer. If the check box is ticked, PicoScope willattempt to use the same device that was used last time. Otherwise it will use the firstdevice available.
Advanced Features
The advanced capture modes are enabled by default in PicoScope 6 and disabled bydefault in PicoScope 6 Automotive. Regardless of the version that you have, you canenable or disable these features using the following options:
Spectrum Spectrum view and spectrum analyser featuresPersistence Digital Color, Analog Intensity and custom persistence display
modesZoom Overview A window that appears when you zoom in , to help to move
around large waveforms with the minimum of mouse clicksRPM Revolutions per minute, displayed alongside hertz in the frequency
legendTrigger Delay The time-delay control in the Triggering toolbar .Rapid Trigger The 'Rapid' entry in the Trigger mode control in the Triggering
toolbar .
Recent Files
The maximum number of files listed in the File > Recent Files menu. Click thebutton to clear the list.
90
10
19 19
20
148
26
138
138
35

PicoScope 6 User's Guide 101
Copyright © 2007-2012 Pico Technology Ltd. All rights re se rved. psw.en
6.6 Help menuLocation: Menu bar > Help
Purpose: gives access to the PicoScope 6 User's Guide and related information
User's Guide This is the main help manual, containing complete information on theprogram. Contents, Index and Search are shortcuts to variousfunctions of the help viewer.
Check forUpdates
Connect to the Pico Technology website and look for a newerversion of the PicoScope software. Requires an internet connection.
AboutPicoScope
Show version numbers of the PicoScope software and anyoscilloscope that is connected.
34

Menus102
Copyright © 2007-2012 Pico Technology Ltd. All rights re se rved.psw.en
6.7 Connect Device dialogLocation: Menu bar > File > Connect Device
or plug in a new device
Purpose: when PicoScope finds more than one available scope device , thisdialog allows you to select which one to use
See "How to change to a different device " if you wish to switch to a different scopedevice later.
Procedure
To restrict the selection to a particular series of devices, click on the device drop-down box and select a device series; otherwise, click the Find All button.Wait for a list of devices to appear in the grid.Select one device and click the OK button.PicoScope will open a scope view for the selected scope device.Use the toolbars to set up the device and the scope view to display yoursignals.
Demonstration mode
If you start PicoScope with no device connected, or with more than one deviceconnected, the Connect Device dialog automatically appears with a'Demo' (demonstration) device as one of the options. This is a virtual device that youcan use to experiment with the features of PicoScope. If you select the Demo deviceand click OK, PicoScope adds a Demo Signal Generator button to the toolbar. Usethis button to set up the test signals from your Demo device.
34 35
190
150
13
105 13
135

PicoScope 6 User's Guide 103
Copyright © 2007-2012 Pico Technology Ltd. All rights re se rved. psw.en
6.8 Converting files in Windows ExplorerYou can convert PicoScope data files to other formats for use in other applications, orto different forms of data for use with PicoScope.
The easiest way to do this conversion is through the context menu in WindowsExplorer. The context menu is the menu that pops up when you right-click it with themouse or activate it with the "menu" button on a Windows keyboard. When you installPicoScope, a "Convert" entry is added to the context menu to enable you to convertPicoScope data files.
The PicoScope context menu in Windows Explorer
Converting to PicoScope 6.2.4 format
The example above shows four pre-existing PicoScope data files represented bystandard PicoScope icons. PicoScope 6.2.4 introduced a new feature that allowsPicoScope data files to appear as waveforms instead of icons. To enable this featurefor old data files, you need to convert them to the new format using the context menuof Windows Explorer.
If PicoScope is running, close it.In Windows Explorer, right-click a PicoScope data file.
Select Convert > All waveforms > .psdata. A PicoScope icon will appear in theWindows notification area while the conversion is in progress.PicoScope will ask you to confirm that you wish to overwrite the .psdata file with anew version. Click Yes.Wait for Windows Explorer to update the display.Repeat for all .psdata files.

Menus104
Copyright © 2007-2012 Pico Technology Ltd. All rights re se rved.psw.en
The .psdata files should now appear as in this picture:
Converting to other formats
For all of these conversions, you can choose either "All waveforms" or "Currentwaveform". A .psdata file can contain either a single waveform or the entire contentsof the waveform buffer, which can hold a number of waveforms from successive triggerevents. If the .psdata file contains more than one waveform, then you can choose toconvert all of them or just the one that was last viewed in PicoScope.
Right-click a PicoScope data file.To convert all waveforms in the file, select Convert > All waveforms or Convert >
Current waveform and then the file format that you require. A PicoScope icon will appear in the Windows notification area while the conversion is in progress.
Complex operations
For more complex operations, such as converting all files in a directory, you can runPicoScope in a command window (see Command-line syntax ).186

PicoScope 6 User's Guide 105
Copyright © 2007-2012 Pico Technology Ltd. All rights re se rved. psw.en
7 Toolbars and buttonsA toolbar is a collection of buttons and controls with related functions. PicoScope 6contains the following toolbars:
Buffer Navigation toolbarChannel Setup toolbarMeasurements toolbarCapture Setup toolbarStart / Stop toolbarTriggering ToolbarZooming and Scrolling toolbarSignal Generator button
106
107
127
121
137
138
147
128

Toolbars and buttons106
Copyright © 2007-2012 Pico Technology Ltd. All rights re se rved.psw.en
7.1 Buffer Navigation toolbarThe Buffer Navigation toolbar allows you to select a waveform from the waveformbuffer.
What is the waveform buffer?
Depending on the settings you have chosen, PicoScope may store more than onewaveform in its waveform buffer. When you click the Start button or change acapture setting , PicoScope clears the buffer and then adds a new waveform to iteach time the scope device captures data. This continues until the buffer is full or youclick the Stop button. You can limit the number of waveforms in the buffer to anumber between 1 and 10,000 using the General preferences page.
You can review the waveforms stored in the buffer using these buttons:
First waveform button. Display waveform 1.
Previous waveform button. Display the previous waveform in the buffer.
Waveform number indicator. Show which waveform is currentlydisplayed, and how many waveforms the buffer holds. You can edit thenumber in the box and press Enter, and PicoScope will jump to thespecified waveform.
Next waveform button. Display the next waveform in the buffer.
Last waveform button. Display the last waveform in the buffer.
Buffer Navigator button. Open the Buffer Navigator window forquick selection of buffer waveforms.
137
121
137
91
33

PicoScope 6 User's Guide 107
Copyright © 2007-2012 Pico Technology Ltd. All rights re se rved. psw.en
7.2 Channels toolbarThe Channels toolbar controls the settings for each vertical input channel . Thescreen shot below shows the toolbar for a two-channel scope device , but differentscope devices may have different numbers of channels. (See also PicoLog 1216 toolbar
that is used for the PicoLog 1000 Series.)
Each channel has its own set of buttons:
Channel Options button. Opens the Channel Options menuwith options for probes, resolution enhancement , scalingand filtering.
Range control. Sets up the scope device to capture signals overthe specified range of values. The list of options depends on the
selected scope device and probe . A red warning symbol - - appears if the input signal exceeds the selected range. If youselect Auto, PicoScope will continually adjust the vertical scale sothat the height of the waveform fills as much of the view aspossible.
Coupling Control. Sets up the input circuitry.AC coupling : rejects frequencies below about 1 Hz. DC coupling : accepts all frequencies from DC to the scope'smaximum bandwidth.50 DC: low-impedance option (see Device feature table ).Accelerometer: switches on the current source output for IEPE-enabled scopes such as the PicoScope 4224 IEPE. The User's Guidefor the oscilloscope has details of the IEPE channel specifications.Frequency: enable the built-in frequency counter if available. Onlyone channel at a time can be operated in this mode. Foravailability, see Device feature table .
Digital Inputs button (MSO only).
189
190
116
108
190 22 110
190 190
189
189
185
185
114 189

Toolbars and buttons108
Copyright © 2007-2012 Pico Technology Ltd. All rights re se rved.psw.en
7.2.1 Channel Options menuThe Channel Options menu appears when you click the Channel Options button
(for example: ) on the Channels toolbar .
Probe list. Indicates the probe currently in use andallows you to select a different one. Use it to tellPicoScope what type of probe is connected to achannel. By default, the probe is assumed to be x1,which means that a one-volt signal at the input tothe probe will appear as one volt on the display.
Expand probe list. Click this to select from a list ofprobes.
Open Custom Probes dialog. The Custom Probesdialog allows you to edit your library of customprobes.
Resolution enhance. Allows you to increase theeffective resolution of your scope device using Resolution enhancement . The number in this boxis a target value that the software will attempt touse whenever possible.
Axis Scaling. These are the axis scaling controlsthat allow you to set the scale and offset for eachvertical axis individually.
107
50
22
110

PicoScope 6 User's Guide 109
Copyright © 2007-2012 Pico Technology Ltd. All rights re se rved. psw.en
Analog Options. Options that can be applied to theoscilloscope input hardware, if the oscilloscopehardware supports them.
DC Offset: an offset voltage added to the analoginput before digitization. For availability, see the Device feature table.Bandwidth Limit: a fixed-frequency single-poleanalog filter. This can be useful for rejecting noiseand harmonics that would otherwise cause aliasing.For availability, see the Device feature table.
Lowpass Filtering. An independent digital lowpassfilter for each input channel, with programmablecut-off frequency. This can be useful for removingnoise from your signal to make more accuratemeasurements. Not all scopes support this feature.
185
185
112

Toolbars and buttons110
Copyright © 2007-2012 Pico Technology Ltd. All rights re se rved.psw.en
7.2.1.1 Axis scaling controls
The axis scaling controls are control boxes that let you change the scale and offsetof each vertical axis individually. If the axis belongs to a reference waveform thenyou can also adjust its delay relative to the live waveforms.
Controls for a livewaveform
Controls for a referencewaveform
There are two ways to open the axis scaling control: -
For any channel displayed in a view : click the coloured scaling button ( ) atthe bottom of the vertical axisFor any input channel: Click the Channel Options button in the Channels toolbar
Scale control. Increase to magnify the waveform, decrease to reduceit. The vertical axis rescales accordingly so that you can always read
the correct voltage from the axis. Click the reset button ( ) to returnto a scale of 1.0. The scaling button always shows the selected scale.
Offset control. Increase to move the waveform up the display,decrease to move it down. The vertical axis shifts accordingly so thatyou can always read the correct voltage from the axis. Adjusting thiscontrol is equivalent to clicking and dragging the vertical axis. Click the
reset button ( ) to return to an offset of 0.00%.
Delay control (for reference waveforms only). Increase to move thewaveform to the left relative to the timing reference point, decrease to
move it to the right. Click the reset button ( ) to return to a delay of 0s.
The location of the timing reference point depends on which triggermode PicoScope is in. If the trigger mode is None then the delay ismeasured relative to the left-hand edge of the display. In all othertrigger modes, the delay is measured relative to the trigger marker.
Send to back. Draws the channel behind all others. Use if the channel isobscuring another channel of interest.
29
190
108
107
138
18

PicoScope 6 User's Guide 111
Copyright © 2007-2012 Pico Technology Ltd. All rights re se rved. psw.en
Bring to front. Draws the channel in front of all others. Use if thechannel is hidden behind another.

Toolbars and buttons112
Copyright © 2007-2012 Pico Technology Ltd. All rights re se rved.psw.en
7.2.1.2 Lowpass filtering
The lowpass filtering feature can reject high frequencies from any selected inputchannel. The filtering control is found in the Advanced Channel Options dialog ,
which is opened by clicking the Channel Options button ( ) for the relevantchannel on the Channels toolbar . The control determines the cut-off frequency ofthe filter, which must be below half the sampling rate shown in the Properties sheet
.
For availability, see the Device feature table.
Lowpass filtering is useful for rejecting noise. The split screenshot below shows theeffect of applying a 1 kHz lowpass filter on a noisy signal. The underlying shape of thesignal is preserved but the high-frequency noise is eliminated:
Left: before lowpass filtering. Right: after 1 kHz lowpass filtering.
108
107
27
185

PicoScope 6 User's Guide 113
Copyright © 2007-2012 Pico Technology Ltd. All rights re se rved. psw.en
Filter details
The lowpass filtering algorithm is chosen according to the ratio of the selected cut-offfrequency (f
C) to the sampling rate (f
S), as follows:
fC / f
SFilter type Description
0.0 to 0.1 Moving average A moving average filter is used for low cut-offfrequencies. The length of the filter is adjusted toachieve the selected cut-off frequency, which is isdefined as the first minimum in the frequencyresponse. There is significant signal leakage abovethe cut-off frequency. This filter changes a verticaledge into a linear slope.
0.1 to < 0.5 FIR A finite impulse response filter is used for medium tohigh cut-off frequencies. This has a monotonic roll-off above the cut-off frequency and thereforesuffers from less leakage than the moving averagefilter.
You can force PicoScope to use one or other of the filter types by adjusting the Samples control in the Capture Setup toolbar to make the ratio f
C/f
S fall into one
of the two ranges shown in the table. As the table shows, the cut-off frequency mustbe below half the sampling frequency.
121
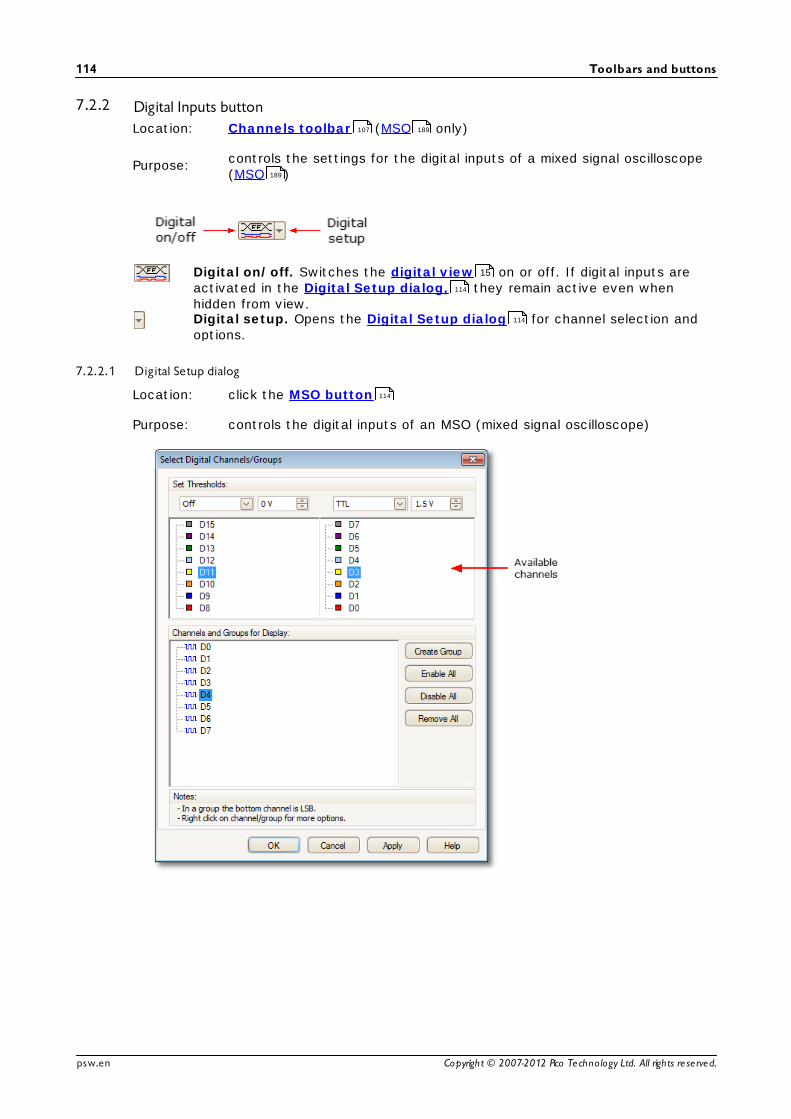
Toolbars and buttons114
Copyright © 2007-2012 Pico Technology Ltd. All rights re se rved.psw.en
7.2.2 Digital Inputs buttonLocation: Channels toolbar (MSO only)
Purpose:controls the settings for the digital inputs of a mixed signal oscilloscope(MSO )
Digital on/off. Switches the digital view on or off. If digital inputs areactivated in the Digital Setup dialog, they remain active even whenhidden from view.Digital setup. Opens the Digital Setup dialog for channel selection andoptions.
7.2.2.1 Digital Setup dialog
Location: click the MSO button
Purpose: controls the digital inputs of an MSO (mixed signal oscilloscope)
107 189
189
15
114
114
114

PicoScope 6 User's Guide 115
Copyright © 2007-2012 Pico Technology Ltd. All rights re se rved. psw.en
Set Thresholds
Choose the digital threshold voltage from the drop-down list, or select the Customthreshold and set your own voltage using the numeric entry control. The presetthresholds are:
TTL:CMOS:ECL:PECL:LVPECL:LVCMOS 1.5 V:LVCMOS 1.8 V:LVCMOS 2.5 V:LVCMOS 3.3 V:LVDS:0V Differential:
1.5 V2.5 V-1.3 V3.7 V2 V750 mV0.9 V1.25 V1.65 V100 mV0 V
Each port has its ownindependent threshold. Port0 contains channels D7...D0and Port 1 containschannels D15...D8.
Available Channels
This section lists the available digital input channels. They will not be displayed unlessyou add them to the Channels and Groups for Display section of the dialog. Clickand drag individual channels into the Channels and Groups for Display section, orselect a range of channels and drag them all at once, or double-click a channel to addit directly.
Channels and Groups for Display
This section lists the digital channels that have been selected for display. Any groupsof channels that you have defined will also be listed here.
indicates a digital channel.
indicates a group of digital channels. By default, channels added to a groupare placed with the most significant bit at the top of the list.
To rename a channel or group, click the name and type. For other operations,right-click the channel or group for a menu of actions:
Enable: Show the channel. All channels in the list areenabled by default.
Disable: Hide the channel from display.Invert: Reverse the polarity of this channel. Useful for
active-low signals.Rename: Type a new name for the channel.Reverse Channel Order: (Groups only) Reverse the order of channels in the
group.Remove: Remove channel from the list.

Toolbars and buttons116
Copyright © 2007-2012 Pico Technology Ltd. All rights re se rved.psw.en
7.3 PicoLog 1000 Series Channels toolbarThe Channels toolbar controls the settings for each vertical input channel . Thetoolbar has a different appearance for PicoLog 1000 Series Data Loggers than forPicoScope oscilloscopes (see Channels toolbar for the standard version).
Channel control. This control contains two buttons in one rectangularoutline. Click the small triangle on the left to open the Channel Optionsdialog with options for probes, resolution enhancement , scalingand filtering. Click the channel name to toggle the channel on or off.
Digital Outputs button. For controlling the 2 or 4 digital outputs of thePicoLog 1000 Series device. Opens the Digital Outputs dialog .
189
107
108 190 22 110
117

PicoScope 6 User's Guide 117
Copyright © 2007-2012 Pico Technology Ltd. All rights re se rved. psw.en
7.3.1 PicoLog 1000 Series Digital Outputs controlLocation:
click the Digital Outputs button on the Channels toolbar
Purpose: controls the data logger 's built-in signal generator
Digital Outputs dialog for thePicoLog 1216
The range of controls available depends on which model of data logger you have.
Basic controls
PWM. Some digital outputs on some devices can be set togenerate a pulse-width modulated waveform. This is a logicsignal that is toggled with a specified period and duty cycle. Theaverage value of the signal is proportional to its duty cycle, so itcan be processed by an external low-pass filter to produce asignal that is proportional to the duty cycle.
Off: Set the digital output manually using the DigitalOutputs slider (see below).PWM: Use the digital output as a PWM output withcontrollable Period and Duty Cycle (see below).
Period. Select the duration of one cycle of the PWM output.
Duty Cycle. The percentage of the PWM signal period that thesignal spends at the logic high level. For example, if the period is1 ms and the duty cycle 25%, then the signal will spend 25% of1 ms = 250 s of each cycle at the logic high level, and theremaining 750 s at the logic low level. The voltages of the logichigh and low levels are specified in the User's Guide for the datalogger, but are typically 0 volts (low) and 3.3 volts (high). Usingour example figures, the average value of the PWM output will be25% x 3.3 volts = 0.825 volts.
Digital Outputs PicoLog PC Data Loggers have one or more digital outputscapable of driving low-current loads.
Each output (unless set to PWM mode: see above) can be set toa high or low logic level by moving the slider.
116
189

Toolbars and buttons118
Copyright © 2007-2012 Pico Technology Ltd. All rights re se rved.psw.en
7.4 USB DrDAQ Channels toolbarThe Channels toolbar for the USB DrDAQ controls the settings for each input andoutput channel :
Sound waveform sensor control. The small arrow sets options for thesound waveform input (measured in uncalibrated amplitude units) using theon-board microphone. Click the channel name to toggle the channel on oroff.
Sound level sensor control. The small arrow sets options for the soundlevel input (measured in decibels) using the on-board microphone. Click thechannel name to toggle the channel on or off.
Scope input control. The small arrow sets options for the oscilloscope input(the BNC socket marked Scope), with options for probes and scaling .Click the channel name to toggle the channel on or off.
Resistance input control. The small arrow sets options for the 0 to 1 Mresistance-measuring input on the screw-terminal block. Click the channelname to toggle the channel on or off.
pH input control. The small arrow sets options for the pH and ORP(oxidation/reduction potential) measuring input. Click the channel name totoggle the channel on or off.
Temperature sensor control. The small arrow sets options for the on-board temperature sensor. Click the channel name to toggle the channel onor off.
Light sensor control. The small arrow sets options for the on-board lightlevel sensor. Click the channel name to toggle the channel on or off.
External sensor controls. The small arrows set options for external sensorinputs 1 to 3. Click the channel name to toggle the channel on or off.
Signal generator button. Opens the Signal Generator dialog , whichallows you to set the characteristics of the signal generator output.
RGB LED button. Opens the RGB LED Control dialog , which allows youto set the colour of the on-board LED.
Digital Outputs button. Opens the Digital Outputs dialog , which allowsyou to control the states of the four digital outputs.
189
190 110
128
119
74

PicoScope 6 User's Guide 119
Copyright © 2007-2012 Pico Technology Ltd. All rights re se rved. psw.en
7.4.1 USB DrDAQ RGB LED control
Location: USB DrDAQ Channels toolbar > RGB LED button:
Purpose:allows you to set the colour of the on-board LED to any one of 16.7million colours
Enable LED Control: Box checked: you can set the on-board RGB LED to anycolourBox clear: the LED has its normal function of flashing toindicate data capture on the input channels
Other controls: Experiment with these to see what they do!
118

Toolbars and buttons120
Copyright © 2007-2012 Pico Technology Ltd. All rights re se rved.psw.en
7.4.2 USB DrDAQ Digital Outputs control
Location: USB DrDAQ Channels toolbar > Digital Outputs button:
Purpose: allows you to set the characteristics of the four digital outputs on thescrew-terminal block.
Each output has its own set of controls:
PWM/Out Control: Set to Out: you can set the output to either a fixed logic low(near 0 V) or a fixed logic high (near 3.3 V)Set to PWM: the output is a two-level waveform (alternatingbetween 0 V and 3.3 V) with variable Duty Cycle and Period.The signal can be filtered to produce a DC level proportionalto the duty cycle.
Period: the time between successive pulses on the output
Duty Cycle: the percentage of the Period for which the output is high.
118

PicoScope 6 User's Guide 121
Copyright © 2007-2012 Pico Technology Ltd. All rights re se rved. psw.en
7.5 Capture Setup toolbarThe Capture Setup toolbar controls the time-related or frequency-related settings ofyour oscilloscope.
Scope Mode
In scope mode, the toolbar looks like this:
(See below for different versions of the toolbar in spectrum mode and persistencemode .)
Scope Mode. Sets up PicoScope to operate as an oscilloscope .Use the Auto Setup button to optimise the settings. If you wish,you can add a secondary spectrum view from the context menu(by right-clicking on the scope view).
Persistence Mode. Toggles persistence mode , which allows oldtraces to remain on the screen in faded colors while new traces aredrawn on top in brighter colors. The use of colors is controlled bythe Persistence Options dialog. PicoScope will remember any viewsthat were open, so that you can return to them by clicking the Persistence Mode button again.
Spectrum Mode. Sets up PicoScope to operate as a spectrumanalyser . Use the Auto Setup button to optimise the settings. Ifyou wish, you can add a secondary scope view from the contextmenu (by right-clicking on the scope view).
Auto Setup. Searches for a signal on one of the enabled inputchannels, then sets up the timebase and signal range to display thesignal correctly.
Home. Restores PicoScope to its default settings. Equivalent to theFile > Startup Settings > Load Startup Settings command.
Timebase control. Sets the time represented by a single division ofthe horizontal axis when the horizontal zoom control is set to x1.The timebases available depend on the type of scope device youare using.
Choosing a timebase of 200 ms/div or slower causes PicoScope toswitch to a different mode of data transfer. The internal details ofthis are taken care of by PicoScope, but the slow mode limits thesampling rate to a maximum of 1 million samples per second.
You can change this control to display the total time across thescope view, rather than the time per division, using the CollectionTime Units control in the General page of the Preferences dialog
.
Horizontal zoom control. Zooms the view, in the horizontal
direction only, by the specified amount. Click the and buttons
to adjust the zoom factor, or the button to reset.
10
122
20
10
19
20
10
13
35
190
91
90

Toolbars and buttons122
Copyright © 2007-2012 Pico Technology Ltd. All rights re se rved.psw.en
Samples control. Sets the maximum number of samples that will becaptured for each channel. If this is larger than the number of pixelsacross the scope view then you can zoom in to see more detail. Theactual number of samples captured is displayed on the Propertiessheet, and may be different from the number requested here,depending on which timebase is selected and which scope device isin use.
Spectrum Mode
In spectrum mode, the Capture Setup toolbar looks like this:
Frequency range control. Sets the frequency range across thehorizontal axis of the spectrum analyser when the horizontal zoomcontrol is set to x1.
Spectrum Options. Appears if a spectrum view is open,regardless of whether scope mode or spectrum mode isselected. It opens the Spectrum Options dialog .
Persistence Mode
In persistence mode, the Capture Setup toolbar looks like this:
Persistence Options. Opens the Persistence Options dialog ,which controls several parameters affecting the way that PicoScoperepresents old and new data in persistence mode.
27
10
19
10 10
123
20
125

PicoScope 6 User's Guide 123
Copyright © 2007-2012 Pico Technology Ltd. All rights re se rved. psw.en
7.5.1 Spectrum Options dialogThis dialog appears when you click the Spectrum Options button in the CaptureSetup toolbar . It is available only when a spectrum view is open. It containscontrols that determine how PicoScope converts the source waveform in the currentscope view to a spectrum view.
Spectrum Bins
The number of frequency bins into which the spectrum is divided.This control sets the maximum number of frequency bins, whichthe software may or may not be able to provide depending onother settings. The main constraint is that the number of binscannot greatly exceed half the number of samples in the sourcewaveform.
If the source waveform contains fewer samples than required(that is, fewer than twice the number of frequency bins), thenPicoScope zero-pads the waveform up to the next power of two.For example, if the scope view contains 10,000 samples, and youset Spectrum Bins to 16384, then PicoScope zero-pads thewaveform to 16,384 samples, which is the nearest power of twoabove 10,000. It then uses these 16,384 samples to provide8,192 frequency bins, not the 16,384 requested.
If the source waveform contains more samples than required,then PicoScope uses as many samples as necessary, startingfrom the beginning of the waveform buffer. For example, if thesource waveform contains 100,000 samples and you request16,384 frequency bins, PicoScope needs only 2 x 16,384 =32,768 samples, so it uses the first 32,768 samples from thewaveform buffer and ignores the rest. The amount of dataactually used is displayed as the Time Gate setting in theProperties sheet.
Window Function
Allows you to choose one of the standard window functions toreduce the effect of operating on a time-limited waveform. See Window functions.
Display Mode
You can choose Magnitude, Average or Peak Hold.
Magnitude: the spectrum view shows the frequency spectrum ofthe last waveform captured, whether live or stored in the waveform buffer.
121 19
27
176
106

Toolbars and buttons124
Copyright © 2007-2012 Pico Technology Ltd. All rights re se rved.psw.en
Average: the spectrum view shows an rolling average of spectracalculated from all the waveforms in the waveform buffer . Thishas the effect of reducing the noise visible in the spectrum view.To clear the averaged data, click Stop and then Start, orchange from Average mode to Magnitude mode.
Peak Hold: the spectrum view shows a rolling maximum of thespectra calculated from all the waveforms in the buffer. In thismode, the amplitude of any frequency band in the spectrum viewwill either stay the same or increase, but never decrease, overtime. To clear the peak hold data, click Stop and then Start,
or change from Peak Hold mode to Magnitude mode.
Note: when you switch to Average or Peak Hold mode, there maybe a noticeable delay while PicoScope processes the entirecontents of the waveform buffer, which may contain manywaveforms, to build up the initial display. If this occurs, aprogress bar appears at the bottom of the window to show thatPicoScope is busy:
Scale Specifies the labelling and scaling of the vertical (signal) axis.This can be one of the following:
Linear:The vertical axis is scaled in volts.
Logarithmic:The vertical axis is scaled in decibels, referred to the levelselected below in the Logarithmic unit control.
dBV: Reference level is 1 volt.
dBu: Reference level is 1 milliwatt with a load resistance of600 ohms. This corresponds to a voltage of about 775 mV.
dBm: Reference level is one milliwatt into the specified loadimpedance. You can enter the load impedance in the boxbelow the Logarithmic unit control.
Arbitrary dB: Reference level is an arbitrary voltage, whichyou can specify in the box below the Logarithmic unitcontrol.
106
137 137
137
137

PicoScope 6 User's Guide 125
Copyright © 2007-2012 Pico Technology Ltd. All rights re se rved. psw.en
7.5.2 Persistence Options dialog
This dialog appears when you click the Persistence Options button in theCapture Setup toolbar . It is available only when persistence mode is selected.It controls the colors and fading algorithm used to distinguish new or frequent datafrom old or intermittent data in the persistence view.
Mode Digital Color. This mode uses a range of colors to indicate thefrequency of waveform data. Red is used for the most frequent data,and less frequent data is represented successively by yellow and blue.
Analog Intensity. This mode uses color intensity to indicate the age ofwaveform data. The latest data is drawn at full intensity in the selectedcolor for that channel, with older data being represented by palershades of the same color.
Advanced. This mode opens up a Custom Options section at thebottom of the dialog that let you customise the persistence modedisplay.
Decay Time The time, in milliseconds, taken for waveform data to fade frommaximum intensity to minimum intensity or from red to blue. The longerthe decay time, the longer the older waveforms will remain on thescreen.
Saturation The intensity or color with which new waveforms are drawn.
DecayedIntensity
The intensity or color to which the oldest waveforms decay when thedecay time expires. If the decayed intensity is zero, then olderwaveforms will be completely erased from the display after the decaytime. For non-zero values of decayed intensity, old waveforms willremain indefinitely on the screen at that intensity unless overwritten bynew ones.
121 20

Toolbars and buttons126
Copyright © 2007-2012 Pico Technology Ltd. All rights re se rved.psw.en
Custom Options
Line Drawing The type of line drawn between samples that are adjacent in time.Phosphor Emulation. Joins each pair of sample points with a line whoseintensity varies inversely with the slew rate.Constant Density. Joins each pair of sample points with a line ofuniform color.Scatter. Draws sample points as unconnected dots.
ColorScheme
Phosphor. Uses a single hue for each channel, with varying intensity.Color. Uses a color from red to blue to represent the age of eachwaveform.
Background Black. Overrides the Color Preferences dialog . This is the default.White. Overrides the Color Preferences dialog .User Preference. Sets the background color to the preference set inthe Colors page of the Preferences dialog .
Data Hold This option is enabled only when Persistence Mode (see below) is setto Time Delay.
Decay Timeout. Old waveforms fade until they reach DecayedIntensity and then disappear.Infinite. Old waveforms fade until they reach Decayed Intensity andthen remain indefinitely unless overwritten by new waveforms.
PersistenceMode
Frequency. Points on the display are drawn with a color or intensitythat depends on the frequency with which they are hit by waveforms.Time Delay. Points on the display are drawn at full intensity when hitby a waveform, and are then allowed to decay to Decayed Intensity.The behaviour after this depends on the Data Hold setting (see above).
98
98
98 90

PicoScope 6 User's Guide 127
Copyright © 2007-2012 Pico Technology Ltd. All rights re se rved. psw.en
7.6 Measurements toolbarThe Measurements toolbar controls the measurements table .
It contains the following buttons:
Add Measurement Adds a row to the table, and then opens the AddMeasurement dialog.
Edit Measurement Opens the Edit Measurement dialog for the currentlyselected measurement. You can also edit a measurementby double-clicking on a row of the measurements table.
Delete Measurement Deletes the currently selected row from the measurements table .
21
46
46
21
21

Toolbars and buttons128
Copyright © 2007-2012 Pico Technology Ltd. All rights re se rved.psw.en
7.7 Signal Generator buttonThe Signal Generator button allows you to set up your scope device's test signalgenerator, if it has one, or the demo signal settings if PicoScope is in demo mode .
If your scope has a built-in signal generator then clicking the Signal Generatorbutton opens the Signal Generator dialog .
If PicoScope is in demo mode then clicking the Signal Generator button opens theDemo Signals menu .
7.7.1 Signal Generator dialog (PicoScope devices)Location:
click the Signal Generator button on the toolbar
Purpose: controls the scope device's built-in signal generator
Signal generator dialog for thePicoScope 5204
Not all scope devices have a signal generator, and those that do have a varying rangeof controls in the signal generator dialog. See the Device feature table for details.
Basic controls
Signal On. Tick this box to enable the signal generator.
Signal Type. Select the type of signal to be generated. The listof signal types depends on the capabilities of the scopedevice.
190
189
128
189
135
128
190
185
175

PicoScope 6 User's Guide 129
Copyright © 2007-2012 Pico Technology Ltd. All rights re se rved. psw.en
Import. Opens a file selection dialog that allows you to importan arbitrary waveform file . The file will be loaded into thearbitrary waveform generator and the generator switched on.This button is available only if your scope has an arbitrarywaveform generator .
Arbitrary. Opens the Arbitrary Waveform window . Thisbutton is available only if your scope has an arbitrary waveformgenerator .
Start Frequency. Type in this box or use the spin buttons toselect the frequency. If the scope device has a frequency sweepgenerator, then this box sets the start frequency of the sweep.
Amplitude. The amplitude of the waveform measured from peakto peak. For example, if Amplitude is 1 V and Offset is 0 V, theoutput will have a negative peak of -0.5 V and a positive peak of+0.5 V.
Offset. The mean value of the signal. For example, when Offsetis 0 V, a sine or square wave will have equal positive andnegative peak voltages.
Sweep mode controls
Active. Tick this box to enable sweep mode. If the box is notticked, the generator will operate at a fixed frequency set bythe Start Frequency control.
Sweep Type. Specifies the direction in which the frequency isswept.
Stop Frequency. In sweep mode, the generator stops increasingthe frequency when it reaches the Stop Frequency.
Frequency Increment. In sweep mode, the generator increasesor decreases the frequency by this amount every IncrementTime Interval.
Increment Time Interval. In sweep mode, the generatorincreases or decreases the frequency by Frequency Incrementeach time this interval ends.
131
189
189
132
189

Toolbars and buttons130
Copyright © 2007-2012 Pico Technology Ltd. All rights re se rved.psw.en
7.7.2 Signal Generator dialog (USB DrDAQ)Location:
click the Signal Generator button on the USB DrDAQChannels toolbar
Purpose: controls the USB DrDAQ's built-in signal generator
Signal generator dialogfor the USB DrDAQ
Basic controls
Signal On. Tick this box to enable the signal generator.
Signal Type. Select the shape of the waveform to be generated.
Arbitrary. Opens the Arbitrary Waveform window , allowingyou to define your own waveform shape.
Frequency. Type in this box or use the spin buttons to selectthe frequency of the output waveform.
Amplitude. The amplitude of the waveform measured from peakto peak. For example, if Amplitude is 1 V and Offset is 0 V, theoutput will have a negative peak of -0.5 V and a positive peak of+0.5 V.
Offset. The mean value of the signal. For example, when Offsetis 0 V, a sine or square wave will have equal positive andnegative peak voltages.
128
118
132

PicoScope 6 User's Guide 131
Copyright © 2007-2012 Pico Technology Ltd. All rights re se rved. psw.en
7.7.3 Arbitrary waveform filesSome PicoScope PC Oscilloscopes have an arbitrary waveform generator (AWG),which is enabled using the Signal Generator dialog . PicoScope can program theAWG with a standard waveform, such as a sine or square wave, or an arbitrarywaveform that you create or import from a text file.
A text file for PicoScope 6 is a list of decimal floating-point values, as in this example:
0.00.30.90.60.60.0-0.30.00.00.0
The file may have between 10 and 8,192 values, as many it needs to define thewaveform. Each line may have more than one value, in which case the values must beseparated by tabs or commas.
The values are samples between -1.0 and +1.0 and must be equally spaced in time.The output is scaled to the amplitude selected in the Signal Generator dialog. andthe selected offset is added if necessary. For example, if the signal generatoramplitude is set to "1 V" and the offset to "0 V", then a sample value of -1.0corresponds to an output of -1.0 V and a sample of +1.0 corresponds to an outputof +1.0 V.
The file should contain exactly one cycle of the waveform, which will then be playedback at the speed specified in the Signal Generator dialog . In the example above,the signal generator was set to 1 kHz, so one cycle of the waveform lasts for 1 ms.There are 10 samples in the waveform, so each sample lasts for 0.1 ms.
189
128
128
128

Toolbars and buttons132
Copyright © 2007-2012 Pico Technology Ltd. All rights re se rved.psw.en
7.7.4 Arbitrary Waveform Generator windowLocation: Signal Generator dialog > Arbitrary
Purpose: allows you to import, edit, draw and export arbitrary waveforms to loadinto your scope's arbitrary waveform generator . You can also importand export the data in CSV format for use in other applications.
Once the desired waveform appears in the window, click OK or Apply to start using it.
Toolbar buttons
Import from channel. Opens the Import from Channeldialog , which lets you copy a waveform from the scopeinto the arbitrary waveform window.
Import. Displays an Open dialog to allow you to import anarbitrary waveform from a text file .
Export. Displays a Save As dialog to allow you to save thearbitrary waveform as a text file .
Freehand drawing. Enters freehand drawing mode. in whichyou can draw any waveform shape using the mouse.
Straight-line drawing. Enters straight line mode, in whichyou can click on the waveform to draw a straight line fromthe previous point. To start a new series of lines, click thebutton again.
Samples. The number of samples in the arbitrary waveform.Each sample represents the signal value at a given instant intime, and the samples are equally spaced in time. Forexample, if there are 1024 samples and the arbitrarywaveform generator is set to play back at 1 kHz, theneach sample represents (1/1 kHz ÷ 1024) or about 0.98microseconds.
128
189
189
134
131
131
128

PicoScope 6 User's Guide 133
Copyright © 2007-2012 Pico Technology Ltd. All rights re se rved. psw.en
Bit stream. Draws a sequence of bits according to binary orhex data that you specify. The logic high and low levels areadjustable.
Clear. Deletes the arbitrary waveform.
Normalize. Adjusts the waveform vertically so that itoccupies the full [-1,+1] range.
Undo and Redo. The Undo button reverses the last changemade to the arbitrary waveform. The Redo button reversesthe last action of the Undo button.
Zoom tools. To zoom the time axis in or out, click the "+"or "-" zoom button and then click on the waveform area.Click the "100%" button to restore the time axis to itsoriginal scale.
Waveform settings
Standard waveform shapes. Draw a standard waveformwith the settings specified in the numerical controls belowthe toolbar. The current waveform will be erased.
Cycles. The number of cycles to draw. This control is usedin conjunction with the Standard waveform shapesbuttons. Select one of the standard waveform shapes andthen enter the number of cycles, and PicoScope will drawthe requested number of cycles of the waveform.
Minimum. When one of the Standard waveform shapesbuttons is pressed, this control sets the minimum signallevel.
Maximum. When one of the Standard waveform shapesbuttons is pressed, this control sets the maximum signallevel.
Duty cycle. When a square, triangular or ramp waveform isselected using one of the Standard waveform shapesbuttons, this control sets the duty cycle of the signal. Dutycycle is defined as the time that the signal spends abovezero volts divided by the total cycle time. Thus, asymmetrical square or triangular wave has a duty cycle of50%. Reducing the duty cycle shortens the positive part ofthe cycle and lengthens the negative part, and increasingthe duty cycle does the opposite.
Other buttons
OK Copies the waveform from the graphical editor into thearbitrary waveform generator and returns to the main PicoScope window.
Apply Copies the waveform from the graphical editor into thearbitrary waveform generator and remains in the ArbitraryWaveform Generator window.
12

Toolbars and buttons134
Copyright © 2007-2012 Pico Technology Ltd. All rights re se rved.psw.en
7.7.4.1 Import from a Channel dialog
Location:Arbitrary Waveform window > Import from a Channel button ( )
Purpose:allows you to copy captured data from a scope channel to the ArbitraryWaveform window
Select Channel: You can import the latest waveform from any available channel.
Select Samples: By default, the entire capture is imported. This control allows youto specify a subset of the capture, either between specifiedsample numbers or between rulers. The subset will be scaled to fitthe number of samples specified in the Samples control in theArbitrary Waveform window .
132
132
132

PicoScope 6 User's Guide 135
Copyright © 2007-2012 Pico Technology Ltd. All rights re se rved. psw.en
7.7.5 Demo Signals menuLocation: start PicoScope with no scope connected
> Connect Device dialog > select "demo device"
> Signal Generator button
Purpose: allows you to set up test signals so that you can experiment withPicoScope when no scope device is connected
When you click the Signal Generator button , a drop-down list of all theavailable channels in the demo device appears, like this:
Click one of the channels to open the Demo Signals dialog , which will allow you toset up a signal from that channel.
102
189
128
128
136

Toolbars and buttons136
Copyright © 2007-2012 Pico Technology Ltd. All rights re se rved.psw.en
7.7.6 Demo Signals dialogLocation: start PicoScope with no scope device plugged in
> Connect Device dialog> select "DEMO" device
> Signal Generator button ( )> select channel
Purpose: controls one channel of the "demo" signal source, a feature of PicoScopethat creates a variety of test signals to simulate a scope device
Signal On: Tick this box to enable the demo signal source.
Signal type: Select from a list of standard signal types.
Arbitrary Waveform: Open the Arbitrary Waveform Editor.
Frequency: Type your desired frequency in hertz, or use the spinbuttons.
Amplitude: Type your desired amplitude in volts, or use the spinbuttons.
Offset: Enter a number to add a d.c. offset to the demo signal. Bydefault, the demo signals have a mean value of zero volts.
102
135
132

PicoScope 6 User's Guide 137
Copyright © 2007-2012 Pico Technology Ltd. All rights re se rved. psw.en
7.8 Start / Stop toolbarThe Start / Stop toolbar allows you to start and stop the scope device . Clickanywhere on the toolbar, or press the space bar, to start or stop sampling.
Start icon. Highlighted if the oscilloscope is sampling.
Stop icon. Highlighted if the oscilloscope is stopped.
190
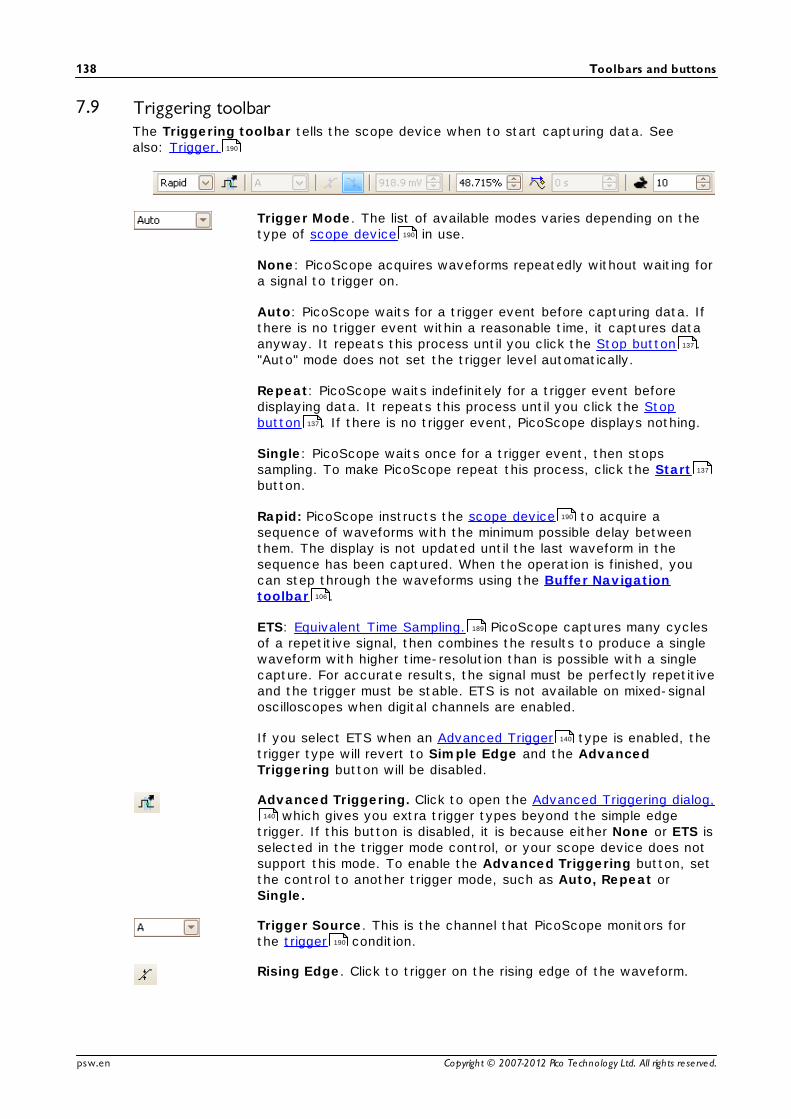
Toolbars and buttons138
Copyright © 2007-2012 Pico Technology Ltd. All rights re se rved.psw.en
7.9 Triggering toolbarThe Triggering toolbar tells the scope device when to start capturing data. Seealso: Trigger.
Trigger Mode. The list of available modes varies depending on thetype of scope device in use.
None: PicoScope acquires waveforms repeatedly without waiting fora signal to trigger on.
Auto: PicoScope waits for a trigger event before capturing data. Ifthere is no trigger event within a reasonable time, it captures dataanyway. It repeats this process until you click the Stop button ."Auto" mode does not set the trigger level automatically.
Repeat: PicoScope waits indefinitely for a trigger event beforedisplaying data. It repeats this process until you click the Stopbutton . If there is no trigger event, PicoScope displays nothing.
Single: PicoScope waits once for a trigger event, then stopssampling. To make PicoScope repeat this process, click the Startbutton.
Rapid: PicoScope instructs the scope device to acquire asequence of waveforms with the minimum possible delay betweenthem. The display is not updated until the last waveform in thesequence has been captured. When the operation is finished, youcan step through the waveforms using the Buffer Navigationtoolbar .
ETS: Equivalent Time Sampling. PicoScope captures many cyclesof a repetitive signal, then combines the results to produce a singlewaveform with higher time-resolution than is possible with a singlecapture. For accurate results, the signal must be perfectly repetitiveand the trigger must be stable. ETS is not available on mixed-signaloscilloscopes when digital channels are enabled.
If you select ETS when an Advanced Trigger type is enabled, thetrigger type will revert to Simple Edge and the AdvancedTriggering button will be disabled.
Advanced Triggering. Click to open the Advanced Triggering dialog, which gives you extra trigger types beyond the simple edge
trigger. If this button is disabled, it is because either None or ETS isselected in the trigger mode control, or your scope device does notsupport this mode. To enable the Advanced Triggering button, setthe control to another trigger mode, such as Auto, Repeat orSingle.
Trigger Source. This is the channel that PicoScope monitors forthe trigger condition.
Rising Edge. Click to trigger on the rising edge of the waveform.
190
190
137
137
137
190
106
189
140
140
190

PicoScope 6 User's Guide 139
Copyright © 2007-2012 Pico Technology Ltd. All rights re se rved. psw.en
Falling Edge. Click to trigger on the falling edge of the waveform.
Trigger Level. Sets the trigger level. You can also set thetrigger level by dragging the trigger marker up or down on thescreen.
Pre-trigger Time (0% to 100%). This parameter controls how muchof the waveform appears before the trigger point. It defaults to50%, which puts the trigger marker in the middle of the screen.You can also control this parameter by dragging the trigger marker
to the left or right.
Post-trigger Delay Enable. Click this button to toggle the Post-trigger Delay control (see next item).
Post-trigger Delay. The post-trigger delay is the time thatPicoScope waits after the trigger point before sampling. You canalso modify this parameter by dragging the trigger marker whilethe Post-trigger Delay button is enabled. As you drag the marker,you will see the post-trigger arrow displayed briefly. For thiscontrol to have an effect, you must first make sure that the Post-trigger Delay button is enabled.
See the reference topic "Trigger Timing " for information on howthe Pre-trigger Time and Post-trigger Delay controls interact.
Rapid Captures. In Rapid trigger mode, this is the number ofwaveforms to capture in a sequence. They will be captured with theminimum possible dead time between them.
190
18
18
18
18
18
177
189
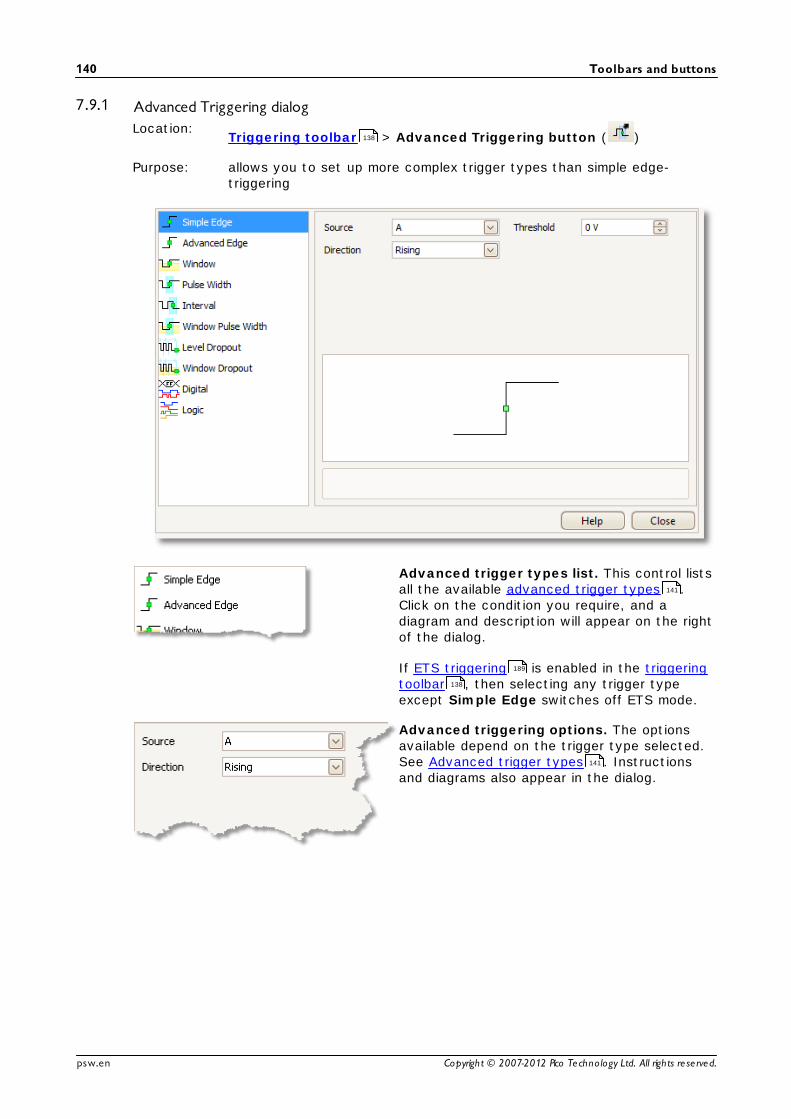
Toolbars and buttons140
Copyright © 2007-2012 Pico Technology Ltd. All rights re se rved.psw.en
7.9.1 Advanced Triggering dialogLocation:
Triggering toolbar > Advanced Triggering button ( )
Purpose: allows you to set up more complex trigger types than simple edge-triggering
Advanced trigger types list. This control listsall the available advanced trigger types .Click on the condition you require, and adiagram and description will appear on the rightof the dialog.
If ETS triggering is enabled in the triggeringtoolbar , then selecting any trigger typeexcept Simple Edge switches off ETS mode.
Advanced triggering options. The optionsavailable depend on the trigger type selected.See Advanced trigger types . Instructionsand diagrams also appear in the dialog.
138
141
189
138
141

PicoScope 6 User's Guide 141
Copyright © 2007-2012 Pico Technology Ltd. All rights re se rved. psw.en
7.9.2 Advanced trigger typesThe advanced trigger types can be switched on in the Advanced Triggering dialog.
For all trigger types except Digital, the first step is to select which signal the scopeshould use as the trigger; so set Source to either A, B, Ext or AuxIO. These namescorrespond to the BNC input connectors on the scope device. Then choose one of thetrigger types below.
Simple Edge. This type provides the same Rising and Falling edge triggersthat are available from the Triggering toolbar . It is included in this dialog asan alternative method of setting up the Simple Edge trigger.
You can set the trigger Threshold while in the advanced triggering dialog, oralternatively you can drag the Trigger marker on the scope view.
This is the only trigger type that is compatible with ETS mode.
Advanced Edge. This trigger type adds an extra Rising or Falling edge trigger,and Hysteresis, to the Simple Edge trigger. The Rising or Falling optiontriggers on both edges of a waveform, and is useful for monitoring pulses of bothpolarities at once. Hysteresis is described in a separate topic.
Window. This trigger type detects when the signal enters or leaves a specifiedvoltage window. The Direction control specifies whether the trigger shoulddetect the signal entering the window, leaving it, or both. Threshold 1 andThreshold 2 are the upper and lower voltage limits of the window. The order inwhich you specify the two voltages does not matter. Hysteresis can be setto reduce the number of false triggers on a noisy signal, and is described in aseparate topic.
Pulse Width. This trigger type detects pulses of a specified width.
First set the Pulse Direction to either Positive or Negative according to thepolarity of the pulse you are interested in.
Next, set one of the four Condition options:
Greater than triggers on pulses wider than the specified time.
Less than triggers on pulses that are narrower (useful for findingglitches).
Inside time range triggers on pulses that are wider than Time 1 but nowider than Time 2 (useful for finding pulses that meet a specification).
Outside time range does the opposite: it triggers on pulses that areeither narrower than Time 1 or wider than Time 2 (useful for findingpulses that violate a specification).
Next, set the trigger Threshold in volts or other units, or drag the Triggermarker on the scope view.
Finally, set up Time 1 (and Time 2 if present) to define the pulse width.
Interval. This type lets you search for two successive edges of the samepolarity that are separated by a specified interval of time.
140
144
138
18
189
143
143
18

Toolbars and buttons142
Copyright © 2007-2012 Pico Technology Ltd. All rights re se rved.psw.en
First, set the Starting edge to either Rising or Falling according to the polarityof the edges you are interested in.
Next, select one of the four Condition options:
Greater than triggers when the second edge occurs later than Time 1after the first edge (useful for detecting missing events).
Less than triggers when the second edge occurs earlier than Time 1after the first edge (useful for detecting timing violations and spuriousedges).
Inside time range triggers when the second edge is later than Time 1after the first edge and earlier than Time 2 (useful for finding validedges).
Outside time range triggers when the second edge is earlier thanTime 1 after the first edge or later than Time 2 (useful for findingspurious edges).
Finally, set up Time 1 (and Time 2 if present) to define the time interval.
Window pulse width. This is a combination of the window trigger and the pulsewidth trigger. It detects when the signal enters or leaves a voltage range for aspecified period of time.
Level dropout. This detects an edge followed by a specified time with noedges. It is useful for triggering on the end of a pulse train.
Window dropout. This is a combination of the window trigger and the dropouttrigger. It detects when the signal enters a specified voltage range and staysthere for a specified time. This is useful for detecting when a signal gets stuckat a particular voltage.
Runt. Detects a pulse that crosses one threshold and then falls below the samethreshold, without crossing the second threshold. This is typically used forfinding pulses that fail to reach a valid logic level.
Digital. (MSO devices only) Triggers on a combination of the state of the digitalinputs and a transition (edge) on one digital input. See Digital trigger.
Logic. This detects a logical combination of the scope's inputs. The conditionsthat can be applied to each input vary: analog inputs can be edge-, level- orwindow-qualified; EXT and D15...D0 (if present) are level-qualified with avariable threshold; and AUXIO is level-qualified with a fixed TTL threshold. See Logic trigger .
144
145

PicoScope 6 User's Guide 143
Copyright © 2007-2012 Pico Technology Ltd. All rights re se rved. psw.en
7.9.2.1 Hysteresis
Hysteresis is a feature of the advanced trigger types in PicoScope 6 that reducesfalse triggering on noisy signals. When hysteresis is enabled, a second trigger thresholdvoltage is used in addition to the main trigger threshold. The trigger fires only when thesignal crosses the two thresholds in the correct order. The first threshold arms thetrigger, and the second causes it to fire. An example will help to illustrate how thisworks.
Noisy signal with a single threshold
Consider the very noisy signal above. It is difficult to trigger reliably on this signal witha normal rising edge trigger because it crosses the trigger threshold, the red line in thispicture, several times in one cycle. If we zoom in on the highlighted parts of the signal,we will see how hysteresis can help.
Noisy signal with hysteresis threshold
In these zoomed-in views, the original threshold is the lower red line. The upper red lineis the second threshold used by the hysteresis trigger.
The signal rises across the lower threshold at (1) and (2), arming the trigger but notfiring it. At (3) the signal finally crosses the upper threshold, firing the trigger. On thefalling edge of the signal, at (4) and (5), rising edges of noise pulses cause the signalto cross the upper and lower thresholds, but in the wrong order, so the trigger is notarmed and does not fire. Thus the trigger occurs at only one well-defined point in thecycle (3), despite the noise on the signal.
Hysteresis is enabled by default for all the advanced trigger types. The Hysteresiscontrols in the Advanced triggering dialog let you change the hysteresis voltage as
a percentage of full scale. The trigger marker shows the size of the hysteresiswindow.
141
140

Toolbars and buttons144
Copyright © 2007-2012 Pico Technology Ltd. All rights re se rved.psw.en
7.9.2.2 Digital trigger dialog
Location:Advanced triggering dialog > Digital and Logic buttons
Purpose: sets up triggering on digital inputs
Applicability: MSO devices only
Pattern table
Lists all available inputs as selected in the Digital Setup dialog . Each one can bemonitored for a low or high level or a rising or falling edge, or ignored. Any number oflevels can be specified, but no more than one transition (edge).
D7 = X (don't care)
D7 = 0 (low level)
D7 = 1 (high level)
D7 = R (rising edge)
D7 = F (falling edge)
Pattern summary
This section contains the same settings as the pattern table but in a more conciseformat.
The numerical format to use for this section: Binary orHex(adecimal).The complete triggering pattern and transition. In Binary mode the bits are labelled as follows:
X = don't care0 = binary 01 = binary 1R = rising edgeF = falling edge
140 144
189
114

PicoScope 6 User's Guide 145
Copyright © 2007-2012 Pico Technology Ltd. All rights re se rved. psw.en
7.9.2.3 Logic trigger dialog
Location:Advanced triggering dialog > Logic button
Purpose: sets up triggering on a combination of inputs
Applicability: all devices with more than one active input
Input controls
There is a set of controls for each active input of the oscilloscope. The selection ofinputs depends on the model of oscilloscope in use. The selection of controls(thresholds, hysteresis, window mode and so on) for each input also depends on thehardware capabilities of the oscilloscope.
Channel A
Channel B
Channel C
Channel D
EXT input (if present )
AUX input (if present )
Digital inputs (mixed-signal oscilloscopes only). The controlshere are the same as those in the Digital Trigger dialog.Check this box to include the relevant input in the LogicTrigger condition. If the box is not checked, the input will beignored by the Logic Trigger.
140
185
185
189
144

Toolbars and buttons146
Copyright © 2007-2012 Pico Technology Ltd. All rights re se rved.psw.en
Logic control
Specifies the Boolean operation used to combine the inputtrigger conditions. Only inputs with the 'Used' box checked(see above) are included in the trigger logic.
AND: all of the input trigger conditions must be metNAND: none of the input trigger conditions must be metOR: one or more of the input trigger conditions must be
metNOR: none of the input trigger conditions must be metXOR: exactly one of the input trigger conditions must be
metXNOR: all but one of the input trigger conditions must be met

PicoScope 6 User's Guide 147
Copyright © 2007-2012 Pico Technology Ltd. All rights re se rved. psw.en
7.10 Zooming and Scrolling toolbarThe Zooming and Scrolling toolbar allows you to move around a scope view orspectrum view . Each button has a keyboard shortcut, as listed below.
Ctrl+SorEsc
Normal Selection tool. Restores the pointer to its normalappearance. You can use this pointer to click buttons, drag rulersand operate any other controls in the PicoScope window.
Ctrl+D Hand tool. Turns the pointer into a hand ( ) that you can use toclick and drag the view to pan it vertically and horizontally when youare zoomed in. You can also pan using the scroll bars. Press the Esckey to return to the Normal Selection tool.
Ctrl+M Marquee Zoom tool. This button turns the pointer into a marquee
zoom tool: . Use it to draw a box (called a marquee) on the viewand PicoScope will magnify that box to fill the view. Scroll bars willappear, which you can drag to pan around in the view, or you canpan by using the Hand tool (see above). Zooming in also opens theZoom Overview window. Press the Esc key to return to theNormal Selection tool.
If you point to the time axis, the pointer changes into the horizontal
marquee zoom tool ( ), which restricts zooming to the horizontalaxis. This lets you zoom in by an arbitrary amount without disturbingthe vertical zoom factor.
Ctrl+I Zoom-in tool. Turns the pointer into a zoom-in tool: . Click on theview with this tool to zoom in to the specified location. Zooming inalso opens the Zoom Overview window.
If you point to the time axis, the pointer changes into the horizontal
zoom-in tool ( ), which restricts zooming to the horizontal axis. Thislets you zoom in without disturbing the vertical zoom factor.
Ctrl+O Zoom-out tool. Turns the pointer into a zoom-out tool: . Click onthe view with this tool to zoom out around the specified location.
If you point to the time axis, the pointer changes into the horizontal
zoom-out tool ( ), which restricts zooming to the horizontal axis.This lets you zoom out without disturbing the vertical zoom factor.
Undo zoom. Returns the view to the previous zoom and pansettings.
Ctrl+U Zoom to full view. Resets the view to normal size. The view will nolonger have scroll bars, and panning will no longer be possible.
13
19
190
148
148

Toolbars and buttons148
Copyright © 2007-2012 Pico Technology Ltd. All rights re se rved.psw.en
7.10.1 Zoom OverviewWhenever you zoom in using the Zooming and Scrolling toolbar , the ZoomOverview window should appear*:
The Zoom Overview shows the full waveformson all enabled channels. The rectangle indicatesthe area that is visible in the current view.
You can move around the waveform by draggingthe rectangle.
You can also adjust the zoom factor by draggingthe edges of the rectangle to resize it.
Minimize button: reduce the Zoom Overviewwindow in size without affecting the zoomsettings.
Close button: close the Zoom Overview windowand return the zoom factor to 100%.
*Note: if the Zoom Overview does not appear, the feature may have been switchedoff. Check the Zoom Overview option in Tools > Preferences > Options .
147
49 90 100

PicoScope 6 User's Guide 149
Copyright © 2007-2012 Pico Technology Ltd. All rights re se rved. psw.en
8 How to...This chapter explains how to perform some common tasks.
Change to a different scope deviceUse rulers to measure a signalMeasure a time differenceMove a viewHow to scale and offset a signalHow to set up the spectrum viewFind a glitch using persistence modeSet up a Mask Limit TestSave on trigger
150
151
152
153
154
159
160
164
167

How to...150
Copyright © 2007-2012 Pico Technology Ltd. All rights re se rved.psw.en
8.1 How to change to a different deviceUnplug the old device .Cancel the Check USB cable dialog.Plug in the new device.PicoScope will detect the new device and begin to use it.
190

PicoScope 6 User's Guide 151
Copyright © 2007-2012 Pico Technology Ltd. All rights re se rved. psw.en
8.2 How to use rulers to measure a signalUsing a single ruler for signal-to-ground measurements
Look at the Channels toolbar to find the color code for the channel you wishto measure:
Find the ruler handle (the small colored square in the top-left or top-right corner ofthe scope view or spectrum view ) of this color:
Drag the ruler handle downwards. A signal ruler (horizontal broken line) will appearacross the view. Release the ruler handle when the ruler is where you want it.
Look at the ruler legend (the small table that appears on the view). It shouldhave a row marked by a small colored square matching the color of your rulerhandle. The first column shows the signal level of the ruler.
Using two rulers for differential measurements
Follow the steps above for "using a single ruler".Drag the second ruler handle of the same color downwards until its ruler is at thesignal level to be measured.Look at the ruler legend again. The second column now shows the signal level ofthe second ruler, and the third column shows the difference between the two rulers.
107 189
13 19
24
26
26

How to...152
Copyright © 2007-2012 Pico Technology Ltd. All rights re se rved.psw.en
8.3 How to measure a time differenceFind the time ruler handle (the small white square in the bottom left corner of thescope view ).
Drag the ruler handle to the right. A time ruler (vertical broken line) will appear onthe scope view. Release the ruler handle when the ruler is at the time you wish touse as the reference.
Drag the second white ruler handle to the right until its ruler is at the time to bemeasured.Look at the ruler legend (the small table that appears on the scope view). Itshould have a row marked by a small white square. The first two columns show thetimes of the two rulers, and the third column shows the time difference.
The frequency legend shows 1/ , where is the time difference.
You can use a similar method to measure a frequency difference on a spectrum view.
13
25
26
26
19

PicoScope 6 User's Guide 153
Copyright © 2007-2012 Pico Technology Ltd. All rights re se rved. psw.en
8.4 How to move a viewYou can easily drag a view from one viewport to another. This example showsfour viewports, which contain scope views called "Scope 1" to "Scope 4". Supposethat you wish to move the "Scope 4" view to the top left viewport.
1. Click on the name tab of the "Scope 4" view andhold the mouse button down.
2. Drag the mouse pointer to the new location nextto the name tab of the "Scope 1" view.
3. Release the mouse button, and the view willmove to the new location.
12 190
13
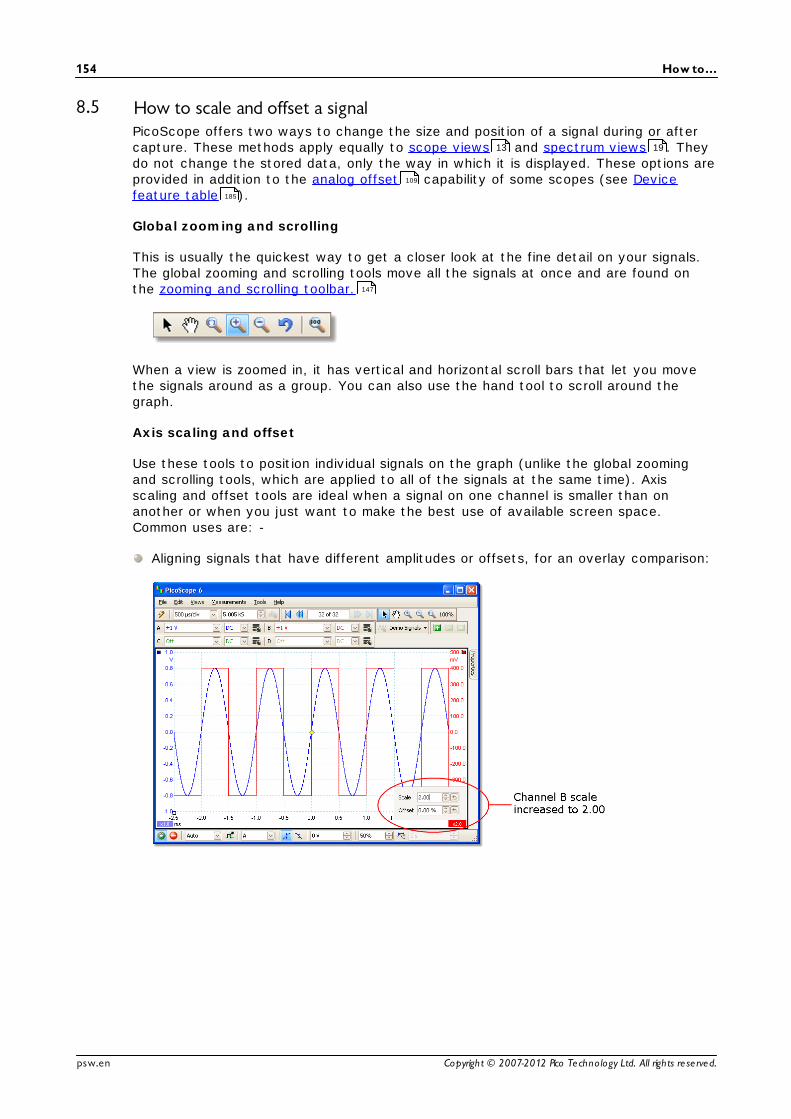
How to...154
Copyright © 2007-2012 Pico Technology Ltd. All rights re se rved.psw.en
8.5 How to scale and offset a signalPicoScope offers two ways to change the size and position of a signal during or aftercapture. These methods apply equally to scope views and spectrum views . Theydo not change the stored data, only the way in which it is displayed. These options areprovided in addition to the analog offset capability of some scopes (see Devicefeature table ).
Global zooming and scrolling
This is usually the quickest way to get a closer look at the fine detail on your signals.The global zooming and scrolling tools move all the signals at once and are found onthe zooming and scrolling toolbar.
When a view is zoomed in, it has vertical and horizontal scroll bars that let you movethe signals around as a group. You can also use the hand tool to scroll around thegraph.
Axis scaling and offset
Use these tools to position individual signals on the graph (unlike the global zoomingand scrolling tools, which are applied to all of the signals at the same time). Axisscaling and offset tools are ideal when a signal on one channel is smaller than onanother or when you just want to make the best use of available screen space.Common uses are: -
Aligning signals that have different amplitudes or offsets, for an overlay comparison:
13 19
109
185
147

PicoScope 6 User's Guide 155
Copyright © 2007-2012 Pico Technology Ltd. All rights re se rved. psw.en
Arranging the signals in their own rows for side-by-side comparison:
Click the scaling button at the bottom of the axis you wish to modify, and theaxis scaling controls will appear. To adjust the offset without using the axis scalingcontrols, click on the vertical axis and drag it up or down.
How to use these tools together
These global and axis-specific tools work smoothly together and make it easy to movearound your data once you know how. We will take a look at a common example ofusage to explain how the tools can be used together.
Consider this common setup where all 4 channels are being displayed on the centrelineof the graph.
110

How to...156
Copyright © 2007-2012 Pico Technology Ltd. All rights re se rved.psw.en
Step 1. Arrange the signals into rows using the axis offset tool, so we can clearlysee them all side by side.
Step 2. Scale the signals so that they have roughly equal amplitudes. Thiseliminates the overlap and makes the smaller signal easier to read.

PicoScope 6 User's Guide 157
Copyright © 2007-2012 Pico Technology Ltd. All rights re se rved. psw.en
Step 3. Now we want to take a closer look at a specific time range of the signal ingreater detail. We don’t want to mess around with the neat axis scaling and offsetthat we have spent time creating, so instead we use the global windowed-zoom toolto select a specific section of the entire graph to zoom.
We can of course use the scrollbars or the hand tool to navigate around this zoomedview without ever changing our carefully arranged signals. Clicking the Zoom 100%button will take us back to the full view of our data; and again, this happens withoutaffecting our axis scaling and offset set-up.

How to...158
Copyright © 2007-2012 Pico Technology Ltd. All rights re se rved.psw.en
How is this different from scaling my data with a Custom Probe?
You can create a Custom Probe to apply scaling to the raw data. A Custom Probemay change the scale and position of data on the graph but it has a few importantdifferences from the other scaling methods.
Custom Probe scaling is a permanent transformation. The scaling is applied when thedata is captured and cannot be changed afterwards.The actual data values themselves are changed so the graph axes may no longerdisplay the voltage range of the device.Custom Probe scaling can be nonlinear and so may alter the shape of the signal.
Custom Probes are useful when you want to represent the characteristics of a physicalprobe or transducer that you plug into your scope device. All of the zooming, scrolling,scaling and offset tools still apply to data that has been scaled with a Custom Probe inexactly the same way that they would apply to the raw data.
27

PicoScope 6 User's Guide 159
Copyright © 2007-2012 Pico Technology Ltd. All rights re se rved. psw.en
8.6 How to set up the spectrum viewCreating a spectrum view
First, ensure that the trigger mode is not set to ETS , as it is not possible to opena spectrum view in ETS trigger mode.
There are three ways to open a spectrum view :
Click the Spectrum Mode button in the Capture Setup toolbar . We recommendusing this method to get the best spectrum analysis performance from your scope.Once in Spectrum Mode, you can still open a scope view to see your data in thetime domain, but PicoScope optimizes the settings for the spectrum view.
Go to the Views menu select Add view, then select Spectrum.
This method opens a spectrum view in the currently selected mode, whether this isScope Mode or Spectrum Mode. For best results, we recommend that you switch toSpectrum Mode, as described in the method immediately above.
Right-click on any view , select Add view, then select Spectrum. The menu issimilar to the Views menu shown above.
Configuring the spectrum view
See Spectrum Settings dialog .
Selecting the source data
PicoScope can produce a spectrum view based on either live or stored data. IfPicoScope is running (the Start button is pressed in), the spectrum view representslive data. Otherwise, with PicoScope stopped (the Stop button pressed in), theview represents data stored in the currently selected page of the waveform buffer.When PicoScope is stopped, you can use the buffer controls to scroll through thebuffer and the spectrum view will be recalculated from the waveform currentlyselected.
138 189
19
121
43
13
43
123
19
137
137
106

How to...160
Copyright © 2007-2012 Pico Technology Ltd. All rights re se rved.psw.en
8.7 How to find a glitch using persistence modePersistence mode helps you find rare events hidden in otherwise repetitivewaveforms. In normal scope mode, such an event may appear on the display for afraction of a second, too quickly for you to press the space bar to freeze it on thescreen. Persistence mode keeps the event on the display for a predetermined time,allowing you to set up the trigger options to capture it more reliably.
Step-by-step guide
Set up the scope to trigger on a repetitive waveform like the one below. Wesuspect that there are occasional glitches but we can see nothing wrong yet, so weshall use persistence mode to investigate.Click the Persistence Mode button to continue.
20
10

PicoScope 6 User's Guide 161
Copyright © 2007-2012 Pico Technology Ltd. All rights re se rved. psw.en
Our original scope view is replaced by a persistence view, as shown below.Immediately, we can see three pulses with different shapes. At this point we havethe Saturation control in Persistence Options turned up to maximum to help usspot the various waveforms easily.
125

How to...162
Copyright © 2007-2012 Pico Technology Ltd. All rights re se rved.psw.en
Now that we have found some glitches, we will turn the Saturation control down tominimum. Click the Persistence options button to open the Persistence Optionsdialog , and then use the slider to adjust the saturation. The display thenappears as below.
The waveforms are now darker but have a wider range of colors and shades. Themost frequently occurring waveform is shown in red, and is the normal shape of thepulse. A second waveform is drawn in light blue to shows that it occurs lessfrequently, and it shows us that there is an occasional jitter of about 10 ns in thepulse width. The third waveform is drawn in dark blue because it occurs lessfrequently than the other two, and indicates that there is an occasional runt pulseabout 300 mV lower in amplitude than normal.
125

PicoScope 6 User's Guide 163
Copyright © 2007-2012 Pico Technology Ltd. All rights re se rved. psw.en
Persistence mode has done its job. We have found our glitches, and now we wantto examine them in more detail. The best way to do this is to switch back to normal scope mode , so that we can use the advanced triggering and automaticmeasurement functions built in to PicoScope.
Click the Scope Mode button. Set up an advanced pulse-width trigger to look for apulse wider than 60 ns. PicoScope then finds the runt pulse straight away.
We can now add automatic measurements or drag the rulers into place to analyse therunt pulse in detail.
10 141
21
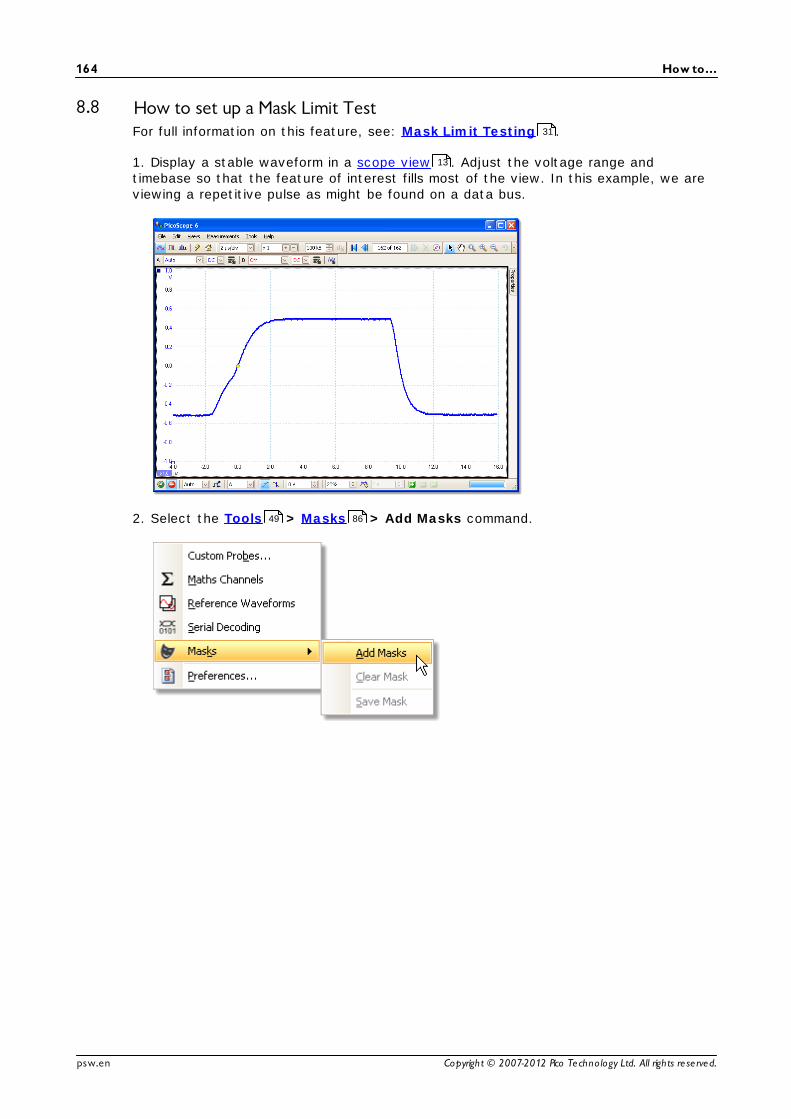
How to...164
Copyright © 2007-2012 Pico Technology Ltd. All rights re se rved.psw.en
8.8 How to set up a Mask Limit TestFor full information on this feature, see: Mask Limit Testing .
1. Display a stable waveform in a scope view . Adjust the voltage range andtimebase so that the feature of interest fills most of the view. In this example, we areviewing a repetitive pulse as might be found on a data bus.
2. Select the Tools > Masks > Add Masks command.
31
13
49 86

PicoScope 6 User's Guide 165
Copyright © 2007-2012 Pico Technology Ltd. All rights re se rved. psw.en
3. You should now be in the Mask Library dialog :
Channel A is selected by default. You can change this if you want to apply the maskto a different channel.
4. Click the Generate button to open the Generate Mask dialog :
86
91

How to...166
Copyright © 2007-2012 Pico Technology Ltd. All rights re se rved.psw.en
5. For now, accept the default settings and click Generate. Then click OK in the MaskLibrary dialog to return to the scope view:
You now have a mask drawn around the original waveform.
6. PicoScope stops capturing when you enter the Mask Library dialog , so pressthe space bar to restart. If any captured waveform fails to fit inside the mask, theoffending parts are drawn in a contrasting color. The Measurements table shows thenumber of failures:
7. You now have a functioning mask limit test. Please read the Mask Limit Test topicfor information on editing, importing and exporting masks. It is also possible to set up a Mask Limit Test on a spectrum or XY view.
86
86
21
31
19 17

PicoScope 6 User's Guide 167
Copyright © 2007-2012 Pico Technology Ltd. All rights re se rved. psw.en
8.9 How to save on triggerSave-on-trigger is just one of a number of functions that are possible with the Alarms
feature.
1. Set up PicoScope to display your waveform, and enable triggering:
2. Select the Tools > Alarms command:
84
49 84

How to...168
Copyright © 2007-2012 Pico Technology Ltd. All rights re se rved.psw.en
3. You should now be in the Alarms dialog :
4. Set Event to Capture:
84

PicoScope 6 User's Guide 169
Copyright © 2007-2012 Pico Technology Ltd. All rights re se rved. psw.en
5. Select the first item in the Actions list, click Edit, and change Action to SaveCurrent Buffer:
6. Click the button to the right of the File box and enter the name and location ofthe file to save:
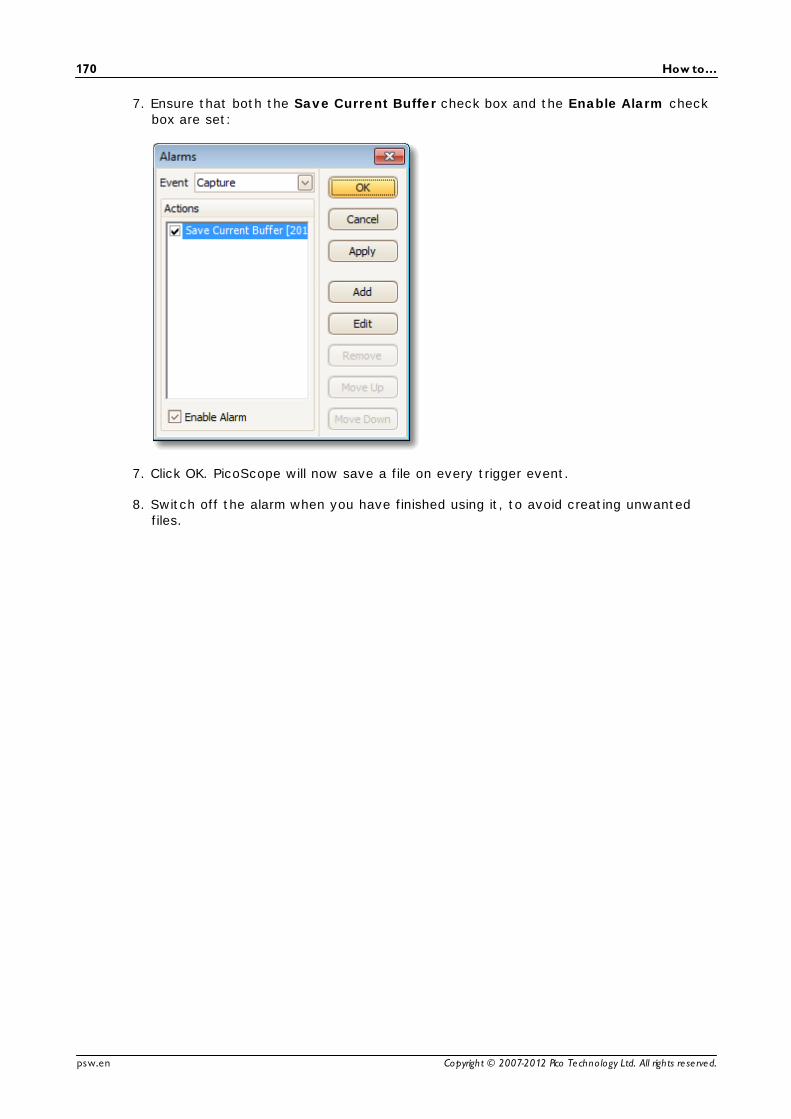
How to...170
Copyright © 2007-2012 Pico Technology Ltd. All rights re se rved.psw.en
7. Ensure that both the Save Current Buffer check box and the Enable Alarm checkbox are set:
7. Click OK. PicoScope will now save a file on every trigger event.
8. Switch off the alarm when you have finished using it, to avoid creating unwantedfiles.

PicoScope 6 User's Guide 171
Copyright © 2007-2012 Pico Technology Ltd. All rights re se rved. psw.en
9 ReferenceThis is where you can find detailed information on the operation of PicoScope.
Measurement typesSpectrum window functionsSerial protocolsTrigger timingCommand-line syntaxGlossary
9.1 Measurement typesThe Edit Measurement dialog allows you to select one of a range of measurementsthat PicoScope can calculate for the selected view. The list of measurements availabledepends on whether the view is a scope view (see scope measurements ) or aspectrum view (see spectrum measurements ).
171
176
179
177
186
189
46
13 172
19 173
Reference172
Copyright © 2007-2012 Pico Technology Ltd. All rights re se rved.psw.en
9.1.1 Scope measurementsAC RMS. The root mean square (RMS) value of the waveform minus the DC Average.It is equivalent to a ripple measurement.
Cycle Time. PicoScope will attempt to find a repeated pattern in the waveform andmeasure the duration of one cycle.
DC Average. The mean value of the waveform.
Duty Cycle. The amount of time that a signal spends above its mean value, expressedas a percentage of the signal period. A duty cycle of 50% means that the high time isequal to the low time.
Falling Rate. The rate at which the signal level falls, in signal units per second. Clickthe Advanced button in the Add Measurement or Edit Measurement dialog tospecify the signal level thresholds for the measurement.
Frequency. The number of cycles of the waveform per second.
Fall Time. The time the signal takes to fall from the upper threshold to the lowerthreshold. Click the Advanced button in the Add Measurement or EditMeasurement dialog to specify the signal level thresholds for the measurement.
High Pulse Width. The amount of time that the signal spends above its mean value.
Low Pulse Width. The amount of time that the signal spends below its mean value.
Maximum. The highest level reached by the signal.
Minimum. The lowest level reached by the signal.
Peak To Peak. The difference between maximum and minimum.
Rise Time. The time the signal takes to rise from the lower threshold to the upperthreshold. Click the Advanced button in the Add Measurement or EditMeasurement dialog to specify the signal level thresholds for the measurement.
Rising Rate. The rate at which the signal level rises, in signal units per second. Clickthe Advanced button in the Add Measurement or Edit Measurement dialog tospecify the signal level thresholds for the measurement.
True RMS. The root mean square (RMS) value of the waveform, including the DCcomponent.
Mask Failures. A special measurement that counts the number of failed waveforms inMask Limit Testing mode. This measurement is added to the table automaticallywhen you use Mask Limit Testing, so there is usually no need to select it manually.
31

PicoScope 6 User's Guide 173
Copyright © 2007-2012 Pico Technology Ltd. All rights re se rved. psw.en
9.1.2 Spectrum measurementsTo add a spectrum measurement, open a spectrum view and then click the AddMeasurement button. You can use these measurements in either scope mode orspectrum mode .
Frequency at peak. The frequency at which the peak signal value appears.
Amplitude at peak. The amplitude of the peak signal value.
Average amplitude at peak. The amplitude of the peak signal value averaged over anumber of captures.
Total power. The power of the whole signal captured in the spectrum view, calculatedby adding the powers in all of the spectrum bins.
Total Harmonic Distortion (THD). The ratio of the sum of harmonic powers to thepower at the fundamental frequency.
Total Harmonic Distortion plus Noise (THD+N). The ratio of the harmonic powerplus noise to the fundamental power. THD+N values are always greater than the THDvalues for the same signal.
Spurious-free Dynamic Range (SFDR). This is the ratio of the amplitude of thespecified point (normally the peak frequency component) and the frequency componentwith the second largest amplitude (call it "SFDR frequency"). The component at the"SFDR frequency" is not necessarily a harmonic of the fundamental frequencycomponent. For example, it might be a strong, independent noise signal.
Signal+Noise+Distortion to Signal+Noise Ratio (SINAD). The ratio, in decibels, ofthe signal-plus-noise-plus-distortion to noise-plus-distortion.
Signal to Noise Ratio (SNR). The ratio, in decibels, of the mean signal power to themean noise power. Hanning or Blackman windows are recommended because of theirlow noise.
19
127 10
10

Reference174
Copyright © 2007-2012 Pico Technology Ltd. All rights re se rved.psw.en
Intermodulation Distortion (IMD). A measure of the distortion caused by thenonlinear mixing of two tones. When multiple signals are injected into a device,modulation or nonlinear mixing of these two signals can occur. For input signals atfrequencies f1 and f2, the two second-order distortion signals will be found atfrequencies: f3 = (f1 + f2) and f4 = (f1 - f2).
IMD is expressed as the dB ratio of the RMS sum of the distortion terms to the RMSsum of the two input tones. IMD can be measured for distortion terms of any order, butthe second-order terms are most commonly used. In the second-order case, theintermodulation distortion is given by:
where
F3 and F4 are the amplitudes of the two second-order distortion terms (atfrequencies f3 and f4 defined above)
and
F1 and F2 are the amplitudes of the input tones (at frequencies f1 and f2, asmarked by the frequency rulers in the spectrum window).
For reference, the third-order terms are at frequencies (2F1 + F2), (2F1 - F2), (F1 +2F2) and (F1 - 2F2).
Note: Hanning or Blackman windows are recommended because of their low noise. AnFFT size of 4096 or greater is recommended in order to provide adequate spectralresolution for the IMD measurements.
Mask Failures. See Mask Limit Testing .31

PicoScope 6 User's Guide 175
Copyright © 2007-2012 Pico Technology Ltd. All rights re se rved. psw.en
9.2 Signal generator waveform typesThe list of waveform types available in the Signal Generator dialog variesaccording to the type of oscilloscope connected. The full list is as follows:
Sine Sinusoid
Square Square wave
Triangle Symmetrical triangle wave
RampUp Rising sawtooth
RampDown Falling sawtooth
Sinc sin(x)/x, truncated on the x axis
GaussianThe 'bell curve' of the normal distribution,truncated on the x axis
HalfSine A rectified sinusoid
WhiteNoiseRandom samples at the maximum update rate ofthe AWG
PRBSPseudo-random binary sequence - a randomsequence of bits with adjustable bit rate
DCVoltageConstant voltage, adjustable using the Offsetcontrol
ArbitraryAny waveform created by the arbitrary waveformeditor
128

Reference176
Copyright © 2007-2012 Pico Technology Ltd. All rights re se rved.psw.en
9.3 Spectrum window functionsTo create a spectrum view , PicoScope captures a block of sampled data over afinite time interval and then uses a Fast Fourier Transform to compute its spectrum.The algorithm assumes a signal level of zero at all times outside the captured timeinterval. Typically, this assumption causes sharp transitions to zero at either end of thedata, and these transitions have an effect on the computed spectrum, creatingunwanted artefacts such as ripple and gain errors. To reduce these artefacts, thesignal can be faded in and out at the start and end of the block. There are severalcommonly used "window functions" that can be convolved with the data to effect thisfading, and which are chosen according to the type of signal and the purpose of themeasurement.
The Window Functions control in the Spectrum Options dialog lets you select oneof the standard window functions for spectrum analysis. The following table showssome of the figures of merit used to compare the functions.
Window Main peakwidth (bins@ -3 dB)
Highest side lobe(dB)
Side lobe roll-off(dB/octave)
Notes
Blackman 1.68 -58 18 often used for audio work
Gaussian 1.33 to 1.79 -42 to -69 6 gives minimal time andfrequency errors
Triangular 1.28 -27 12 also called Bartlett window
Hamming 1.30 -41.9 6 also called raised sine-squared; used in speechanalysis
Hann 1.20 to 1.86 -23 to -47 12 to 30 also called sine-squared; usedfor audio & vibration
Blackman-Harris 1.90 -92 6 general-purpose
Flat-top 2.94 -44 6 negligible pass-band ripple;used mainly for calibration
Rectangular 0.89 -13.2 6 no fading; maximalsharpness; used for shorttransients
19
123

PicoScope 6 User's Guide 177
Copyright © 2007-2012 Pico Technology Ltd. All rights re se rved. psw.en
9.4 Trigger timing (part 1)The pre-trigger time control and post-trigger delay control functions are describedindividually under "Triggering toolbar" , but the interaction between the two controlsis also important to understand. Here is a screen shot of a scope view with post-trigger delay enabled:
Note 1. The trigger reference point ( ) does not lie on the waveform. This is becausethe post-trigger delay is set to 200 µs, which means that the trigger occurred200 µs before the reference point, somewhere off the left-hand edge of thescope view. The time axis is aligned so that the trigger reference point is at200 µs.
Note 2. The pre-trigger delay is set to 25%, which makes the trigger reference pointappear 25% of the way across the scope view from the left-hand edge.
Note 3. PicoScope limits the trigger-to-reference-point delay to a multiple of the totalcapture time. Once you have reached this limit, the program will not let youincrease the pre-trigger delay, and if you increase the post-trigger delay,PicoScope will reduce the pre-trigger delay to stop the total exceeding thelimit. The multiple is typically 100 in most trigger modes, and 1 in ETSmode.
138
13
13
189

Reference178
Copyright © 2007-2012 Pico Technology Ltd. All rights re se rved.psw.en
9.5 Trigger timing (part 2)"Trigger timing (part 1) " introduced the concepts of pre-trigger delay and thepost-trigger delay . This diagram below shows how they are related.
The pre-trigger delay positions the scope view in relation to the trigger referencepoint so that you can choose how much of the waveform should be before thereference point, and how much after it.
The post-trigger delay is like the delayed trigger of a conventional oscilloscope.PicoScope waits for this time after the trigger event before drawing the triggerreference point. Scope devices have a limit to the number of sampling intervals thatcan elapse between the trigger event and the end of the capture, so the software mayadjust the pre-trigger delay to keep within this limit.
Tip: If you have set up a post-trigger delay, you can click the post-trigger delaybutton while the scope is running whenever you want to switch between viewing thetrigger event and the trigger reference point.
177 138
138
13

PicoScope 6 User's Guide 179
Copyright © 2007-2012 Pico Technology Ltd. All rights re se rved. psw.en
9.6 Serial protocolsThe serial decoding function can decode the following serial protocols:
CAN BusI2C BusRS-232 (UART)SPI Bus
30
180
182
183
184

Reference180
Copyright © 2007-2012 Pico Technology Ltd. All rights re se rved.psw.en
9.6.1 CAN Bus protocolYou can decode CAN Bus data using the serial decoding feature built intoPicoScope.
About CAN Bus
CAN (Controller Area Network) Bus is a serial protocol used in automotive andindustrial machinery to allow microcontrollers to communicate with each other. Thestandard was originally developed in 1983 by Robert Bosch GmbH. It typically usesdifferential signalling (with signals named CAN H and CAN L) to increase noiseimmunity. PicoScope supports CAN Bus bit rates from 10 kbit/s to 1 Mbit/s.
The in-window view of the data looks like this:
The columns in the data table are as follows:
Column DescriptionNo. Serial number of the frame (decimal). If Accumulate mode is off,
this counts from the start of the selected waveform. IfAccumulate mode is on, this counts from the start of the firstwaveform in the waveform buffer.
ID Identifier (hexadecimal). Should be unique for a specified datatype. Base frames have an 11-bit identifier, and extended frameshave a 29-bit identifier.
Frame CAN Bus data is divided into frames, each consisting of a numberof bits. A frame can be any of the following types:
Data: contains data destined for a nodeRemote: a request for the transmission of a specific identifierError: transmitted by a node that detects an errorOverload: inserted to add a delay between framesInterframe: time interval preceding data frames and remoteframes
Any frame can also be a base frame or an extended frame.
RTR Remote transmission request
SRR Used only in extended frames
IDE Identifier extension bit
R0 Reserved bit
R1 Reserved bit, extended frames only
30

PicoScope 6 User's Guide 181
Copyright © 2007-2012 Pico Technology Ltd. All rights re se rved. psw.en
DLC Data length code. Indicates the number of bytes of data.
Data bytes The data content of the message, DLC bytes long (hexadecimal)
CRC Sequence A cyclic redundancy check of the data (hexadecimal)
CRC Delimiter A fixed bit following the CRC Sequence field
Ack Slot Node asserts this bit to acknowledge receipt
Ack Delimiter A fixed bit following the Ack Slot field
Error Set if PicoScope detects an error
Start Time Value of PicoScope timebase at start of frame
End Time Value of PicoScope timebase at end of frame

Reference182
Copyright © 2007-2012 Pico Technology Ltd. All rights re se rved.psw.en
9.6.2 I²C Bus protocol
You can decode I2C Bus data using the serial decoding feature built intoPicoScope.
About I2C Bus
I2C (Inter-Integrated Circuit) Bus is a serial protocol used mainly in consumerelectronics for communications between devices on the same circuit board, andbetween computers and displays. The standard was originally developed in the 1980sby Philips. It uses two signals: clock (SCL) and data (SDA). Speeds up to 3.4 Mbit/sare possible.
The in-window view of the data looks like this:
The columns in the data table are as follows:
Column DescriptionNo. Serial number of the packet (decimal). If Accumulate mode is off,
this counts from the start of the selected waveform. If Accumulate mode is on, this counts from the start of the firstwaveform in the waveform buffer.
Packet Packet type: Start, Stop, Address, Data or Unknown.
Address Shown for address packets.
Read/Write Polarity of the Read/Write flag.
Data bytes Contents of data packets.
Acknowledge Whether the destination acknowledged the packet.
Baud Rate The signalling rate detected for this packet.
Start Time Time according to PicoScope timebase at start of frame.
End Time Time according to PicoScope timebase at end of frame.
30

PicoScope 6 User's Guide 183
Copyright © 2007-2012 Pico Technology Ltd. All rights re se rved. psw.en
9.6.3 RS232/UART protocolYou can decode RS232 (UART) data using the serial decoding feature built intoPicoScope.
About RS232
RS232 is the serial data standard used by UARTs (Universal Asynchronous Receiver/Transmitters) in the "serial" or "COM" ports once commonly found on computers. Itwas developed in the 1960s for connecting modems to terminals. The full standarduses a voltage swing of ±12 V, larger than most other standards. Data rates of 115kbit/s are possible. The simplest RS232 connection consists of two signals: Rx(receive) and Tx (transmit).
The in-window view of the data looks like this:
The columns in the data table are as follows:
Column DescriptionNo. Serial number of the packet (decimal). If Accumulate mode is off,
this counts from the start of the selected waveform. If Accumulate mode is on, this counts from the start of the firstwaveform in the waveform buffer.
Packet Packet type: all packets in this format are classified as Data.
Start Bit If present, this is the fixed "1" bit at the start of the word.
Data bytes Contents of data packets.
Parity Bit The error-correction bit, if present, at the end of the word.
Stop Bit If present, this is the fixed "1" bit at the end of the word.
Error Indicates whether there was a data error.
Start Time Time according to PicoScope timebase at start of frame.
End Time Time according to PicoScope timebase at end of frame.
30

Reference184
Copyright © 2007-2012 Pico Technology Ltd. All rights re se rved.psw.en
9.6.4 SPI Bus protocolYou can decode SPI Bus data using the serial decoding feature built intoPicoScope.
About SPI Bus
SPI (Serial Peripheral Interface) Bus is a serial data standard used for communicationbetween microprocessors and peripheral devices. It was developed by Motorola. Theoriginal standard uses a 4-wire link, although 3-wire and 2-wire versions are also used.
The in-window view of the data looks like this:
The columns in the data table are as follows:
Column DescriptionNo. Serial number of the packet (decimal). If Accumulate mode is off,
this counts from the start of the selected waveform. If Accumulate mode is on, this counts from the start of the firstwaveform in the waveform buffer.
Packet Packet type: Start, Stop, Address, Data or Unknown.
Data bytes Contents of data packets.
Start Time Time according to PicoScope timebase at start of frame.
End Time Time according to PicoScope timebase at end of frame.
30

PicoScope 6 User's Guide 185
Copyright © 2007-2012 Pico Technology Ltd. All rights re se rved. psw.en
9.7 Device feature tableSome PicoScope 6 features require special hardware and are not therefore available onall devices. Available features are indicated in the table below.
Feature ADC-212[3]
USBDr
DAQ
PicoLog
1000
PicoScope2000
PicoScope3000
PicoScope3000A/B
PicoScope4000
PicoScope5000
PicoScope6000
DC Offset 5
Bandwidth limit
Lowpass filtering
50Ω DC inputs
Frequency counter
Signal generator 2
Signal generator sweep mode 4
Arbitrary waveform generator 2
Digital inputs 1
EXT input 5 6
AUX input/output
Advanced triggers 7
Runt pulse triggering 1
1. PicoScope 2205 MSO only.2. PicoScope 4226, 4227 only.3. PicoScope Automotive only.4. PicoScope 3205, 3206 only.5. PicoScope 2206 to 2208 only.6. PicoScope 4226, 4227, 4262 only.7. PicoScope 2204 to 2208 only.
109
109
112
107
107
128
128
132
114
140
141

Reference186
Copyright © 2007-2012 Pico Technology Ltd. All rights re se rved.psw.en
9.8 Command-line syntaxTo display the GUI
picoscope <filename>
<filename> Specifies a single .psdata or .pssettings file.
Example: picoscope C:\Temp\source.psdata
To display help
picoscope /?
Shows help on all command line options.
To convert psdata files
picoscope /C,/c
Converts a psdata file from one format to another. Cannot be used with /p[rint].
Syntax:
PicoScope /c[onvert] <names> [/d <names>] /f <format> [/q] [/b [<n>[:<m>]] | [all]] [/v <viewportname>]
<names> Specifies a list of one or more directories or psdata files.Wildcards may be used to specify multiple files. If adirectory is specified, all psdata files within that directorywill be specified. This is a mandatory argument.
/d <names> Destination. Default is input filename with new extension.
/f <format> Destination format: csv, txt, png, bmp, gif, a[nimated]gif, psdata, pssettings, matlab. This is a mandatoryargument.
/q Quiet mode. Do not ask before overwriting files. Thedefault is to prompt.
/b [<n>[:<m>]]|all Waveform number n, waveform range n to m or allwaveforms. The default is the current waveform.
/v <viewportname> View to convert. Default is current view.
Example:
PicoScope /c C:\Temp\source.psdata /f png /b 5:9 /v Scope2

PicoScope 6 User's Guide 187
Copyright © 2007-2012 Pico Technology Ltd. All rights re se rved. psw.en
To print a view
picoscope /P,/p
Prints a view in the psdata file. Cannot be used with /c[onvert].
Syntax:
picoscope /p[rint] <names> [/b [<n>[:<m>]] | all] [/v <viewportname>]
<names> Specifies a list of one or more directories or .psdata files.Wildcards may be used to specify multiple files. If adirectory is specified, all .psdata files within thatdirectory will be specified. This is a mandatory argument.
/b [<n>[:<m>]]|all Waveform number n, waveform range n to m or allbuffers. Default is current waveform.
/v <viewportname> View to convert. Default is current view.
Example:
picoscope /p C:\Temp\source.psdata /b 5:9 /v Scope2

Reference188
Copyright © 2007-2012 Pico Technology Ltd. All rights re se rved.psw.en
9.9 Application Error dialogIf there is a problem with PicoScope and the program needs to close, the ApplicationError dialog appears:
It would be very helpful to us if you could send us a report of the problem. All you needto do is click the Send Report button, then save the .zip file in a place where you
can easily find it again, such as on your desktop. Then, email the ..zip file to us at
[email protected] and we will do the rest. Don't worry if you can't think of acomment to enter in the text box: just leave it empty and send the report to usanyway.

PicoScope 6 User's Guide 189
Copyright © 2007-2012 Pico Technology Ltd. All rights re se rved. psw.en
9.10 GlossaryAC coupling. In this mode, the scope device rejects very low signal frequencies belowabout 1 hertz. This allows you to use the full resolution of the scope to measure a.c.signals accurately, ignoring any d.c. offset. You cannot measure the signal level withrespect to ground in this mode.
AWG. An arbitrary waveform generator (AWG) is a circuit that can generate awaveform of almost any shape. It is programmed with a data file, supplied by the user,which defines the output voltage at a number of equally spaced points in time. Thecircuit uses this data to reconstruct the waveform with a specified amplitude andfrequency.
Axis. A line marked with measurements. PicoScope shows one vertical axis for eachchannel that is enabled in a view, giving measurements in volts or other units. Eachview also has a single horizontal axis, which is marked in units of time for a scope view,or units of frequency for a spectrum view.
Channel. A scope device has one or more channels, each of which can sample onesignal. High-speed scope devices typically have one BNC connector per channel.
CSV. Comma-separated values. A form of text file containing a list of values separatedby commas and line-breaks. CSV format is used for importing and exporting PicoScope arbitrary waveform files . You can also export PicoScope waveforms in CSV format.CSV files can be imported into spreadsheets and other programs.
DC coupling. In this mode, the scope device measures the signal level relative tosignal ground. This shows both d.c. and a.c. components.
Dead time. The time between the end of one capture and the start of the next. Toobtain the minimum possible dead time, use Rapid trigger mode.
Demo mode. If PicoScope is started when no scope device is plugged in, it allows youto select a "demo device", a virtual scope unit that you can use to test the software.The program is then in "demo" (short for "demonstration") mode. This mode provides asimulated, configurable signal source for each input channel of the demo device.
ETS. Equivalent Time Sampling. A method of increasing the effective sampling rate ofthe scope. In a scope view, the program captures several cycles of a repetitive signal,then combines the results to produce a single waveform with higher time-resolutionthan a single capture. For accurate results, the signal must be perfectly repetitive andthe trigger must be stable.
Graticule. The horizontal and vertical dashed lines in every view. These help youestimate the amplitude and time or frequency of features on the waveform.
Grid. The arrangement of viewports. The number of grid rows and the number of gridcolumns can each be either 1, 2, 3 or 4.
In focus. PicoScope can display several views, but only one view is in focus at anytime. When you click a toolbar button, it will usually affect only the view that is infocus. To bring a view into focus, click on it.
MSO. Mixed-signal oscilloscope. An instrument that captures and displays analog anddigital signals on the same timebase.
PC Data Logger. A measuring instrument consisting of a hardware interface and thePicoLog software running on a PC. You can also use the device with the PicoScopesoftware to create a multi-channel voltage input oscilloscope.
131

Reference190
Copyright © 2007-2012 Pico Technology Ltd. All rights re se rved.psw.en
PC Oscilloscope. A measuring instrument consisting of a scope device and thePicoScope software running on a PC. A PC Oscilloscope has the same functions as atraditional bench-top oscilloscope but is more flexible and cost-effective. You canimprove its performance by upgrading the PC using standard parts from any computershop, or by purchasing a new scope device, and you can upgrade the software bydownloading an update from Pico Technology.
Probe. An accessory that attaches to your oscilloscope and picks up a signal to bemeasured. Probes are available to pick up any form of signal, but they always deliver avoltage signal to the oscilloscope. PicoScope has built-in definitions of standardprobes, but also allows you to define custom probes.
Progressive mode. Normally, PicoScope redraws the waveform in a scope view manytimes every second. At timebases slower than 200 ms/div, however, it switches toprogressive mode. In this mode, PicoScope updates the scope view continuously aseach capture progresses, rather than waiting for a complete capture before updatingthe view.
Resolution enhancement. Collecting samples at a faster rate than requested, thencombining the excess samples by averaging. This technique can increase the effectiveresolution of a scope device when there is a small amount of noise on the signal. (Moredetails.)
Ruler. A vertical or horizontal dashed line that can be dragged into place on awaveform in a view. PicoScope displays the signal level, time value or frequency valueof all rulers in the Ruler Legend box.
Scope device. The box from Pico Technology that you plug into the USB or parallelport of your computer. With the help of the PicoScope software, the scope deviceturns your computer into a PC Oscilloscope.
Standard deviation. A statistical measure of the spread of a set of samples. Thestandard deviation of the set is defined as:
,
where is the arithmetic mean of all the samples. The units of the standard deviationvalue are the same as those of the original samples.
Tool tip. A label that appears when you move the mouse pointer over some parts ofthe PicoScope screen, such as buttons, controls and rulers.
Trigger. The part of an oscilloscope that monitors an incoming signal and decides whento begin a capture. Depending on the trigger condition that you set, the scope maytrigger when the signal crosses a threshold, or may wait until a more complex conditionis satisfied.
Vertical resolution. The number of bits that the scope device uses to represent thesignal level. This number is fixed by the design of the device, but a greater effectivenumber can be obtained in some cases by using resolution enhancement .
View. A presentation of data from a scope device. A view may be a scope view , anXY view or a spectrum view .
Viewport. The views in the PicoScope window are arranged in a grid, and eachrectangular area in the grid is called a viewport.
190
22
22
13
17 19
12 189

PicoScope 6 User's Guide 191
Copyright © 2007-2012 Pico Technology Ltd. All rights re se rved. psw.en
Index
%%buffer% variable 84
%file% variable 84
%time% variable 84
..bmp files, saving 36
.csv files, saving 36
.gif files, saving 36
.mask files 86
.png files, saving 36
.psdata files
converting 103, 186
saving 36
.psmaths files 64, 68, 71
.psreference files 74
.pssettings files, saving 36
.txt files, saving 36
550Ω DC inputs 185
AAC coupling 189
AC power 92
Accelerometer inputs 107
Access 4
Add Measurement dialog 46
Adding a measurement 46
Address of company 5
Advanced measurement settings 47
Advanced triggering 138, 140
types 141
Advanced triggers 185
Alarms 32, 84
Save on trigger 167
Analog intensity 125
Analog offset 108
Animated GIF 36
Arbitrary waveform generator 128, 185
editing window 132
files 131
importing from channel 134
Average (statistics) 21
AWG 189
Axis 13, 17, 19, 189
auto-arrange 43
horizontal 13, 17, 19
offset 154
scaling 154
scaling controls 110
vertical 13, 17, 19
BBandwidth limit 185
Bandwidth limiter 108
Battery power 92
Beep 84
Binary files, exporting 39
Bit Definitions dialog 81
Bit stream 132
Bring channel to front 110
Buffer Navigation toolbar 106
Buffer Navigator 33
CCAN Bus protocol 180
Capture count 21
Capture modes 10, 11
Capture rate preference 92
Capture Setup toolbar 121
Capture size preference 91
Changing device 150
Channel 189
selecting in a view 43
Channel Options
button 107
menu 108
Channel ordering 110
Channel settings
in Properties sheet 27
Channel warning symbol 28
Channels toolbar
PicoLog 1000 Series 116
standard 107
USB DrDAQ 118
Clipboard 42
Close file 35
Collection time units 91
Color preferences 98
Column auto-width 45
Command line syntax 186
Connect Device dialog 35, 102
Contact information 5
Converting data files 103, 186

Index192
Copyright © 2007-2012 Pico Technology Ltd. All rights re se rved.psw.en
Copy
as image 42
as text 42
Copyright 4
Coupling control 107
Create New Custom Probe dialog 51
CSV files, exporting 38
Cursors (see Rulers) 24, 25, 26
Custom grid layout dialog 44
Custom Probe Manager 49
Custom Probe wizard 51
Create New Custom Probe dialog 51
Edit Existing Custom Probe dialog 52
Edit Range dialog 58
Edit Range dialog (Advanced tab) 60
Finished dialog 63
Lookup-table Scaling dialog 55
Manual Ranges Setup dialog 57
Probe ID dialog 62
Probe Output Units dialog 53
Range Management dialog 56
Scaling Method dialog 54
Custom probes 27
dialog 50
saving 35
DData files
converting 103
DC coupling 189
DC Offset 185
Dead time 189
Decoding tab 30
Default Print Settings 97
Demo device 135
Demo mode 135, 136, 189
Demo Signals
dialog 136
menu 135
Device feature table 185
Device, how to change 150
Digital color 125
Digital inputs 185
Digital Inputs button 107, 114
Digital outputs 117
USB DrDAQ 120
Digital Setup dialog 114
Digital trigger dialog 144
Digital view 15
context menu 16
DrDAQ 118
Dropout trigger 141
EEdge trigger 141
Edit Existing Custom Probe dialog 52
Edit menu 42
Edit Range dialog 58
Edit Range dialog (Advanced tab) 60
Edit Reference Waveform dialog 75
Effective resolution 22
Email addresses 5
Equation dialog 68
Equivalent-time sampling 138
ETS 138, 189
and Advanced Triggering 140
Exit 35
Exporting data 38
binary format 39
text format 38
FFall time
threshold 47
Falling edge button 138
Fax number 5
File conversion 103
File menu 35
Filter Method dialog 61
Filtering 108
channels 112
measurements 21
statistics 47
Fitness for purpose 4
Focus 189
Frequency counter 107, 185
Frequency difference, measuring 152
Frequency legend 25, 26
Frequency rulers 25
Functions, mathematical 68
GGeneral preferences 91
Generate mask 86
Generate Mask dialog 88
Glitches, finding 141
Glossary 189
Graticule 13, 17, 19, 189
Grid 189
layout 43, 44
Groups, digital input 114

PicoScope 6 User's Guide 193
Copyright © 2007-2012 Pico Technology Ltd. All rights re se rved. psw.en
HHand tool 147
Harmonic control for measurements 47
Help menu 101
Horizontal axis 13, 17, 19
House current 92
Hysteresis 143
II²C Bus protocol 182
I2C settings 83
I2C Settings dialog 83
IEPE inputs 107
Image, saving as 36
Import from a Channel dialog 134
Input impedance 107
Interpolation
linear 93
sin(x)/x 93
Interval trigger 140, 141
Introduction 3
Invert button 28
KKeyboard shortcuts 95, 147
LLanguage preferences 96
LED
on USB DrDAQ 119
Legal statement 4
Liability 4
Line thicknesses 98
Lissajous figures 17
Logic trigger 141
Logic trigger dialog 145
Lookup-Table Scaling dialog 55
Lowpass filtering 61, 108, 112, 185
MMacro Recorder 89
Mains power 92
Manual Ranges Setup dialog 57
Marquee Zoom tool 147
Mask Limit Testing 31, 49
How To 164
Masks
colors 31, 98
displaying 43
editing 87
export 86
generate 86
import 86
in Buffer Navigator 33
library dialog 86
menu 86
polygons 87
selection dialog 31
Math channels 49
button 107
saving 35
Maths Channel Wizard
Equation dialog 68
Finished dialog 73
Introduction dialog 67
Name and Color dialog 71
overview 66
Units and Range dialog 72
Maths channels 64
Built In 64
dialog 64
Library 64
Loaded 64
overview 28
Matlab 4 files
exporting 39, 74
Max (statistics) 21
Maximum Waveforms preference 91
Measurement statistics
capture size 91
Measurement system
selecting 96
Measurements
adding 21, 45, 46
advanced settings 47
deleting 21, 45
editing 21, 45
filtering 21
font size 45
list of types 171
menu 45
scope 172
spectrum 173
statistics 21
table 21
toolbar 127
Menus 34
Metric measurements 96
Min (statistics) 21

Index194
Copyright © 2007-2012 Pico Technology Ltd. All rights re se rved.psw.en
Missing events, finding 141
Mission-critical applications 4
MSO setup 114
MSO view 14
NNew features 2
Normal Selection tool 147
Notes area 42
OOffset 154
analog 108
Open file 35
Oscilloscope 8
Overrange indicator 13, 107
PPage Down key 35
Page Up key 35
Panning 148
Pattern trigger 144
PC Oscilloscope 9
Persistence mode 20
button 121
enabling and disabling 100
options 125
PicoLog 1000 Series 116, 117
PicoScope 9
how to use 3, 7, 8
main window 12
version 6 1, 2
Pointer tool tip 23
Polygon 87
Post-trigger delay 177
arrow 18
control 138, 177
Power Management preferences 92
Preferences 49
capture rate 92
colours 98
Default Print Settings 97
device selection 100
dialog 90
general 91
keyboard 95
language 96
persistence modes 100
power management 92
sampling 93
spectrum modes 100
Pre-trigger delay 177
control 138, 177
Printing 35
from command line 186
from menu 35
preferences 97
preview 35
Probe 189
custom 27
Probe ID dialog 62
Probe Output Units dialog 53
Progress bar 123
Progressive mode 189
Properties sheet 27
displaying 43
Pulse width trigger 140, 141
PWM output
PicoLog 1000 Series 117
USB DrDAQ 120
RRange control 107
Range Management dialog 56
Rapid trigger mode 138
Reference manual 101
Reference waveforms 49
adding 43
delay 110
dialog 74
Library 74
Loaded 74
overview 29
using in equations 68
Reset 'Don't show this again' dialogs 91
Resolution enhancement 22, 108, 189
Revolutions per minute 26
RGB LED on USB DrDAQ 119
Rise time
threshold 47
Rising edge button 138
RPM 26, 100
RS232
protocol 183
settings 81
Rulers 13, 17, 19
definition 189
deleting 24, 25
handles 13, 17, 19
legend 26
lock button 26

PicoScope 6 User's Guide 195
Copyright © 2007-2012 Pico Technology Ltd. All rights re se rved. psw.en
Rulers 13, 17, 19
time 13, 19
voltage 13, 17, 19
Runt pulse trigger 141
SSampling preferences 93
Sampling rate 121
Save As 35
dialog 36
Save file 35
Save on trigger 84, 167
Scaling 9, 154
button 110
Scaling Method dialog 54
Scope device 189
Scope measurements
AC volts 172
Cycle time 172
DC volts 172
Duty cycle 172
Fall time 172
Falling rate 172
Frequency 172
High pulse width 172
Low pulse width 172
Maximum 172
Minimum 172
Peak to peak 172
Rise time 172
Rising rate 172
Scope mode 10
button 121
Scope view 11, 13
Scrolling 154
Selection tool, normal 147
Send channel to back 110
Serial decoding 30, 49
data window 79
dialog 76
protocols 179
Serial number
of oscilloscope 101
Settings
saving 35
Settings dialog 82
Signal difference, how to measure 151
Signal generator
button 128
dialog 128
USB DrDAQ 130
Waveform types 175
Signal generator sweep mode 185
Signal rulers 13, 17, 19, 24
Sinx(x)/x preferences 93
Slow sampling transition 93
Smoothing 93
Software version 1
Sound file 84
Space bar 137
Spectrum measurements
Amplitude at peak 173
Frequency at peak 173
Intermodulation Distortion (IMD) 173
Signal to Noise Ratio (SNR) 173
Spurious-free Dynamic Range (SFDR) 173
Total Harmonic Distortion (THD) 173
Total Harmonic Distortion plus Noise (THD+N) 173
Total power 173
Spectrum mode 10
button 121
enabling and disabling 100
Spectrum options
bins 123
dialog 123
display mode 123
scale 123
Spectrum view 11, 19
how to set up 159
SPI Bus protocol 184
SPI settings 82
Spreadsheet, exporting to 36
Spurious edges, finding 141
Standard deviation 21, 189
Start/Stop toolbar 137
Startup Settings menu 41
State trigger 144
Statistics 21
filtering 47
Support 4
Symbols
red warning 13
yellow warning 28
System requirements 6
TTelephone number 5
Text files, exporting 36, 38
Threshold for measurements 47
Thresholds, digital input 114
Time difference, how to measure 152

Index196
Copyright © 2007-2012 Pico Technology Ltd. All rights re se rved.psw.en
Time gate 27
Time rulers 13, 19, 25
Timebase controls 121
Tool tip 189
Toolbars 105
Tools menu 49
Trace 8
Tracking rulers 26
Trademarks 4
Trigger 138, 177, 189
advanced 138, 140
dropout 141
dual-edge 140
edge 141
glitches 141
interval 140, 141
logic 141
marker 18
missing events 141
mode control 138
pulse width 140, 141
reference point 177
runt pulse 141
timing 177
toolbar 138
window 141
Triggering
digital 144
UU.S. measurements 96
UART
protocol 183
settings 81
Undo zoom 147
Upgrades 4
Usage 4
USB DrDAQ 118
'Used' check box 145
VValid edges, finding 141
Version 1
Version 6 update 2
Version number
hardware 101
software 101
Vertical axis 13, 17, 19
Vertical resolution 189
View 189
enabling sub-views 43
how to move 153
menu 43
scope 13
selecting channels 43
spectrum 19
XY 17
Viewport 189
Viruses 4
WWarning symbol 107
red 13
yellow 28
Waveform 8, 13
saving 35
Waveform buffers
number of 91
What's new 2
Window functions 123, 176
Window trigger 141
XX axis, configuring 43
X-Axis command 17
XY view 17
ZZooming 154
undo 147
Zoom overview 148
Zooming and Scrolling toolbar 147
Z-ordering 110

PicoScope 6 User's Guide 197
Copyright © 2007-2012 Pico Technology Ltd. All rights re se rved. psw.en

Pico TechnologyJames House
Colmworth Business ParkST. NEOTS
Cambridg eshirePE19 8YP
United King domTel: +44 (0) 1480 396 395Fax: +44 (0) 1480 396 296
<%WEBADDRESS%>
Copyright © 2007-2012 Pico Technology Ltd. All rights reserved.
psw.en-22
12.1.12