phenotypic and genetic effects of disposition a thesis
TRANSCRIPT

PHENOTYPIC AND GENETIC EFFECTS OF DISPOSITION
ON BEEF TENDERNESS AND QUALITY ATTRIBUTES
A Thesis presented to the Faculty of the Graduate School
University of Missouri
In Partial Fulfillment
of the Requirements for the Degree
Master of Science
by
TASIA MARIE TAXIS
Drs. Jeremy F. Taylor and Robert L. Weaber,
Thesis Advisors
DECEMBER 2011
The undersigned, appointed by the Dean of the Graduate School, have
examined the thesis entitled
PHENOTYPIC AND GENETIC EFFECTS OF DISPOSITION
ON BEEF TENDERNESS AND QUALITY ATTRIBUTES
Presented by Tasia Marie Taxis
A candidate for the degree of Master of Science
And hereby certify that in their opinion it is worthy of acceptance.
Dr. Robert L. Weaber
Dr. Jeremy F. Taylor
Dr. Robert D. Schnabel
Dr. Mark R. Ellersieck
DEDICATION
This thesis is dedicated to my family and friends who have provided me with
encouragement throughout the completion of my degree. My parents, Craig and Mary
Ann Taxis have instilled in me the values of hard work and responsibility, and always
encouraged me to pursue my dreams; my brother, Travis Taxis for his inspiration,
persistence, and understanding; Liz Kolb and Chad Stauffer for their friendship, listening
ears, and continuous support; and Drs. Eduardo Casas and Chris Bidwell for pushing me
towards a Master’s degree. I could not have accomplished my goals without your
continuous support. All of you have played pivotal roles in making me the person I am
today and in helping me reach this important stepping stone in life – for that I will forever
be grateful.
ii
ACKNOWLEDGEMENTS
There are many individuals who have played important roles over the past several
years in assisting me to reach this point. While it is impossible to thank everyone, I would
like to express my appreciation to several individuals for their assistance and guidance
towards my Master’s experience. Foremost, I would like to thank my advisor, Dr. Bob
Weaber for his guidance, patience, and enthusiasm for me to succeed. I know it was
difficult to support a graduate student from another state, especially since it was the last
few months of my degree. I’d also like to thank my co-advisor, Dr. Jerry Taylor. Both Dr.
Weaber and Dr. Taylor have provided me with opportunities to become more
comfortable working cattle, present my research at a variety of conferences, network with
other scientists and companies, and expand my knowledge and understanding of both
animal science and genomics. I would also like to thank Dr. Bob Schnabel and Dr. Mark
Ellersieck for being committee members and providing help and humor when needed.
I would like to thank Dr. Carol Lorenzen, who taught me about Warner-Bratzler
shear force, as well as everyone that helped collect the measurements. A special thank
you needs to go to Catie Selby who was always willing to assist me on any part of the
project.
I also like to thank a few of the people who helped me gain experiences other than
in bovine genomics. Dr. Dave Patterson, Dr. Mike Smith, and Daniel Mallory encouraged
me to attend AI school and learn about estrous synchronization protocols. Dr. Cliff
Murphy instructed me in palpation techniques. Dr. Bill Lamberson and Dr. Smith also
provided me with opportunities to become a teaching assistant in statistics, genetics, and
reproductive management classes in the department.
It was with the help of all the listed individuals, and many that are not, that I have
learned how to be a true professional and example of excellence in the scientific
community. I not only received an education, but gained relationships that I hope to never
lose. Thank you.
iii
TABLE OF CONTENTS
ACKNOWLEDGEMENTS ............................................................................................. ii
LIST OF TABLES ........................................................................................................... vi
LIST OF FIGURES ....................................................................................................... viii
ABBREVIATIONS .......................................................................................................... ix
ABSTRACT ...................................................................................................................... xi
CHAPTER
LITERATURE REVIEW 1 ............................................................................................. 1
Introduction ..................................................................................................................... 1
Tenderness ....................................................................................................................... 3
Temperament ................................................................................................................. 13
Research Objectives ...................................................................................................... 22
iv
CHAPTER 2
QUANTITATIVE ANALYSIS OF PHENOTYPIC AND GENETIC
RELATIONSHIPS BETWEEN TEMPERAMENT AND TENDERNESS TRAITS
IN BEEF CATTLE ......................................................................................................... 25
Record Collection ...................................................................................................... 29
Statistical Models ...................................................................................................... 31
Exit Velocity Models ................................................................................................. 42
Warner-Bratzler Shear Force Models ........................................................................ 44
CHAPTER 3
GWAS FOR TEMPERAMENT AND TENDERNESS TRAITS ............................... 56
GWAS for EV and Habituation ................................................................................. 65
GWAS for APSF ....................................................................................................... 67
Summary ........................................................................................................................ 25
Introduction ................................................................................................................... 27
Materials and Methods .................................................................................................. 29
Results and Discussion .................................................................................................. 40
Summary ........................................................................................................................ 56
Introduction ................................................................................................................... 58
Materials and Methods .................................................................................................. 59
Results and Discussion .................................................................................................. 65
Conclusions ................................................................................................................... 69

v
LITERATURE CITED .................................................................................................. 75

vi
LIST OF TABLES
Table Page
1.1 Chute and Pen score rubrics ………………………………………… 24
2.1 Total animal counts cross classified with phenotypic observations.... 46
2.2 Statistical models used to analyze average peak shear force
(APSF), Warner-Braztler shear force (WBSF), exit velocity 1
(EV1), exit velocity 2 (EV2) and the corresponding number of
observations for each trait…...……………………………..……… 47
2.3 Model 1 estimates of heritability, phenotypic and genetic
correlations ± standard error between average peak shear
force (APSF), exit velocity 1 (EV1), and exit velocity 2 (EV2).….. 48
2.4 Model 2 estimates of heritability, phenotypic and genetic
correlations ± standard error between average peak shear
force (APSF) and exit velocity (EV)………………….…………… 49
2.5 Model 3 estimates of heritability, phenotypic and genetic
correlations ± standard error between Warner-Bratzler shear
force (WBSF) and exit velocity (EV)…………………..………….. 50
2.6 Model 4 estimates of heritability, phenotypic and genetic
correlations ± standard error between average peak shear
force (APSF) and exit velocity (EV)……………..………………… 51
2.7 Log-likelihood at convergence, number of variance parameters
estimated and residual degrees of freedom, and Bayesian
Information Criteria (BIC) for models of tenderness and
temperament evaluated………………………………….…….….… 52
vii
3.1 Average posterior means of genetic variance, residual variance,
…heritability, and percent of SNP markers selected in the Bayes-C
and Bayes-Cp analyses of exit velocity (EV), habituation, and
average peak shear force (APSF)………………………………...... 70
3.2 Accuracies of molecular breeding values (MBV) produced in
all three-fold cross validation GWAS for the exit velocity (EV)
phenotype in the Bayes-Cp analysis….…………………………... 71
3.3 Accuracies of molecular breeding values (MBV) produced in
all three-fold cross validation GWAS for the habituation
phenotype in the Bayes-Cp analysis……………………………… 72
3.4 Accuracies of molecular breeding values (MBV) produced in
all three-fold cross validation GWAS for the average peak
shear force (APSF) phenotype in the Bayes-Cp Analysis………… 73
3.5 Chromosome number and location of the most commonly
detected single-nucleotide polymorphism (SNP) markers
associated with average peak shear force (APSF)………………… 74
viii
LIST OF FIGURES
Figure Page
2.1 Histogram of average peak shear force (APSF) demonstrating
the normal distribution of the phenotypic observations
in the data….………………………………………………………. 53
2.2 Histogram of exit velocity 1 (EV1) and exit velocity 2 (EV2)
demonstrating the normal distribution of the phenotypic
observations of EV1 and EV2 in the data…………………..……... 54
2.3 Mean phenotypic exit velocity (EV) by average peak shear
force (APSF) phenotype illustrating the distribution of acceptable
and unacceptable steaks across a range of average EV
observations……………………….……………………………...... 55
ix
ABBREVIATIONS
AAA American Angus Association
ADG Average Daily Gain
AMSA American Meat Science Association
APSF Average Peak Shear Force
ASA American Simmental Association
BIC Bayesian Information Criteria
BIF Beef Improvement Federation
BIGS Bioinformatics to Implement Genomic Selection
CG Contemporary Group
EPD Estimated Progeny Difference
EV Exit Velocity
FT Flight Time
G-BLUP Genomic Best Linear Unbiased Prediction
GWAS Genome-Wide Association Study
LD Longissimus dorsi
LM Longissimus muscle
MBV Molecular Breeding Value
x
NALF North American Limousin Foundation
QTL Quantitative Trait Loci
SNP Single-Nucleotide Polymorphism
WBSF Warner-Bratzler Shear Force
xi
PHENOTYPIC AND GENETIC EFFECTS OF DISPOSITION
ON BEEF TENDERNESS AND QUALITY ATTRIBUTES
Tasia Marie Taxis
Drs. Jeremy F. Taylor and Robert L. Weaber
ABSTRACT
Cattle temperament (exit velocity; EV) and steak tenderness (Warner-Bratzler
shear force) have been shown to be associated in Bos indicus cattle (Behrends et al.,
2009). Both traits potentially provide opportunities for improvement among beef herds
and are profitable to producers. The American Simmental Association (ASA) provided
records which included pedigree information, multiple WBSF core values, reported as
average peak shear force (APSF), and a maximum of two EV measurements taken 42
days apart. Bayesian Information Criteria (Gilmour et al., 2006) values were utilized to
evaluate the fit of alternative statistical models to the data. A near zero genetic correlation
was estimated between APSF and EV. Moderate heritability estimates were found for
both APSF and EV. DNA was extracted from tissue samples and genotyped using the
Illumina BovineSNP50 BeadArray (San Diego, CA, USA; Matikumalli et al., 2009).
Genome-wide association studies were conducted to identify genomic regions harboring
loci associated with either of the traits. Only 70 (0.167%) of the 42,351 tested SNP
markers were associated with variation in APSF (n = 957), and 2 (0.006%) of the SNP
markers were associated with variation in EV (n = 599). The difference between pairs of

xii
EV measurements (n = 587) was also analyzed as a measure of habituation to human
handing, and 2 (0.006%) of the SNP markers were found to be associated.

1
CHAPTER 1
LITERATURE REVIEW
Introduction
Steak tenderness and cattle temperament are two traits that when improved among
a beef herd can be profitable to the producer. Standardization of both traits has been
studied since the 1900s. In the late 1920s, Warner-Bratzler shear force became the
method to measure beef tenderness, and is the most widely used method in beef research
today. The trait is moderately heritable, which provides the opportunity for selection for
tenderness. With the advent of SNP Chip technology, two main candidate genes, µ-
calpain (CAPN1) and calpastatin (CAST), have been found to be associated with
tenderness, and some breed associations have published molecular breeding values
(MVB) for this trait. Temperament became of interest to breed associations in the 1980s
and researchers are still establishing a standardized measurement protocol. Exit velocity
is the only objective measurement used to date, and therefore has been highly used in
research studies. Temperament has been a particular focus in Bos indicus cattle, and has
been shown to be moderately heritable. Correlations between exit velocity and other
production traits have been found, including tenderness. Chapter 2 examines the genetic
and phenotypic correlations among these traits as well as the heritability of Warner-

2
Bratzler shear force and exit velocity in Bos taurus cattle, specifically Angus, Simmental,
or Angus × Simmental crossed breeds. Chapter 3 completed a genome-wide association
study to detect single-nucleotide polymorphism markers associated with temperament or
tenderness in Simmental × Angus crossbred cattle.

3
Tenderness
In the late 1920s K. F. Warner and his associates first established the idea of
shearing a piece of cooked meat to produce an indication of tenderness (Wheeler et al.,
1997). After the Warner Bratzler shear force (WBSF) apparatus was invented, blade
thickness, sharpness, and the size and shape of the hole in the shear blade were perfected
by Bratzler (Wheeler et al., 1996). To date, WBSF is the most widely used instrumental
measure of meat tenderness (Wheeler et al., 1997). However, each institution uses
varying protocols for WBSF measurements. The diversity in protocols makes it virtually
impossible to directly compare shear force values among data published by different
institutions. An important recommendation from the National Beef Tenderness
Conference (1994) was to standardize a WBSF measurement protocol. For producers as
well as industry to provide tender beef, an understanding of the factors that influence
tenderness need to be accurately defined and measured across institutions. Most recently,
research focus has been placed on the cooking and coring factors affecting the WBSF
measurements.
The cooking process has been scrutinized because when considering a set
protocol, thawing conditions, cooking method, cooking rate, and degree of doneness all
affect steak tenderness (Wheeler et al., 1997). Steaks are often aged and then frozen in
research, while in industry practices steaks are usually never frozen. Some research
shows that freezing steaks after they’ve been aged results in a lower WBSF (Law et al.,
1967), however, conclusions from other research are varied. Pearson and Miller (1950)
found detrimental effects on tenderness of freezing steaks, while others have found no
4
difference in WBSF values between frozen and fresh steaks (Smith et al., 1969; Obuz and
Dikeman, 2003). While all these studies are similar in many aspects, they utilized varying
postmortem aging intervals, and the length of postmortem aging affects WBSF values.
The average aging of fresh beef at retail in the United States is approximately 18 to 22
days (Shanks et al., 2002). Therefore, most researchers utilize a 14 to 21 day aging period
to simulate industry conditions (Shanks et al., 2002). The research that has compared
frozen to fresh steaks in this postmortem aging interval has found no difference in WBSF
values.
Another factor that needs to be standardized in the WBSF protocol is the method
of cooking. Each shear force machine produces a different consistency and repeatability
measure. Machinery used to cook the steaks includes open hearth electric broilers,
tabletop convection broil ovens, belt grills, and forced-air convection ovens. The open
hearth electric broilers and convection ovens have reduced repeatability and inconsistent
cooking (Wheeler et al., 1997; Lawrence et al., 2001). It seems that the belt grills are
consistent and the repeatability of WBSF measurements produced by these cooking
instruments is higher than for the other machinery. The belt grill runs the steaks on
Teflon-coated conveyor belts between electrically-heated metal plates. When the grill is
set to 163°C, the repeatability is significantly improved (Wheeler et al., 1997; Lawrence
et al., 2001). A less expensive option to the belt grill is a clam-shell grill. This machine
has acceptable repeatability and is considered a viable WBSF cookery method (Yancey et
al., 2011).

5
End-point temperature is yet another cooking factor that affects WBSF
measurements. It’s been shown that higher end point cooking temperatures result in
higher shear force measurements (Wheeler et al., 1999; Yancey et al., 2011). It is
important that the end point temperature used mimics the consumer’s cooking preference.
Since each consumer’s preference varies, this may be the most challenging factor to
standardize.
In the last few years, researchers have focused on this by comparing WBSF
measurements to trained sensory panel ratings. Schmidt et al. (2010) found that
consumers preferred the texture of rare and medium rare steaks with end point
temperatures of 60°C and 66°C, respectively. Warner-Bratzler shear force values were
comparable between steaks cooked to 60°C, 71°C, and 74°C (Schmidt et al., 2010).
Wheeler et al. (1997) suggested grouping steaks into three groups (WBSF < 3.0-kg, 3.0
to 5.7-kg, or > 5.7-kg) based upon consumer’s acceptance level; the lowest WBSF group
is 100% acceptable while the highest WBSF is 100% unacceptable to consumers.
However, drawing conclusions between a subjective and objective measure will pose a
challenge in standardizing end-point temperature.
Although now better standardized, coring has also been a factor of concern for
WBSF measurements. Core location and orientation have both been shown to affect
WBSF measurements. Kerth et al. (2002) found a lateral to medial tenderness gradient
across steaks. However, Wheeler et al. (1996) found no such gradient. Whichever the
case, when multiple cores are taken from a random dispersal over the entire steak, a
maximum of six cores sheared from each steak is all that is needed for the best
6
repeatability (Wheeler et al., 1996). When cores are removed parallel to the fiber
orientation, the WBSF value is greater than that of cores taken perpendicular to the steak
surface (Murray et al., 1983; Wheeler et al., 1994). The cores producing the most
accurate and repeatable tenderness measures are those sheared parallel to the long axis of
the muscle fibers (Wheeler et al., 1997). Other factors investigated in obtaining cores
include the difference between hand and machine sampled cores, carcass maturity, and
fiber diameter (Tuma et al., 1962; Francis et al., 1981; Wheeler et al., 1994).
It is important that the protocol for WBSF measurement be standardized but also
be utilized across all institutions. In the 2005 National Beef Quality Audit, inadequate
beef tenderness was ranked the second top quality challenge or concern of beef producers
(including seedstock producers, cow-calf producers, stocker/backgrounders, and feedlot
operators). Both stockers/backgrounders and feedlot operators indicated that they tried
various practices to improve this challenge, one of which was to collect and use carcass
data (Shook et al., 2008). A protocol for WBSF needs to be documented across all
institutions to ensure accurate, precise, and comparable data from all research institutions
or progress cannot be made.
The American Meat Science Association (AMSA) in its 1995 guidelines for
cookery, sensory, and tenderness recommended some guidelines for WBSF. Beef
samples are suggested to be cut 2.54-cm thick, vacuum packaged and aged for 14 days.
When cooking steaks, AMSA does not recommend using an air convection oven, but if
using a belt grill to set it at 163°C (Lawrence et al., 2001; Yancey et al., 2011). The
steaks should be cooked to a 71°C internal temperature (Wheeler et al., 1997). After the
7
cooked steaks are chilled 24 hours at 3°C, six 1.27-cm diameter cores that represent the
entire steak should be removed parallel to the muscle fibers (Wheeler et al. 1997;
Otremba et al., 1999; Wheeler et al., 1999). The AMSA suggests that coring through the
center of the shears using a calibrated Universal Testing Machine with a Warner-Bratzler
shear attachment (V-notch blade) at 200 to 250-mm/min crosshead speed (Wheeler et al.,
1997; Wheeler et al., 1999; Obuz and Dikeman, 2003). The protocol used for all WBSF
measurements in the following studies followed the protocol outlined by Dikeman et al.
(2005), which closely follows all of the AMSA recommendations as well as the proposed
shear force procedures for meat tenderness measurements (Wheeler et al., 2005).
Since beef packers, restaurateurs, and retailers rank tenderness as one of the
highest beef quality concerns, it is beneficial for producers to produce a consistently
tender product (Lusk et al., 2001). Platter et al. (2005) concluded that as shear force
increased, the probability of the consumers buying the steak greatly decreased.
Consumers were willing to pay an average of $7.20 for a WBSF value < 3.40-kg,
whereas the consumer would pay approximately $3.00 less for a steak with a WBSF
value > 5.40-kg. If together, scientists and producers could improve product consistency
and eating quality, a higher demand for the product would arise. Therefore, scientists
should feel compelled to concentrate on not only the details and factors of WBSF
measurements, but also the genetic variation and heritability of the trait.
WBSF measurements vary across breeds, but more so between Bos taurus and
Bos indicus cattle. As the amount of Bos indicus breed increases in the individual animal,
the less tender is the meat. In other words, the higher the influence of Bos taurus breeding
8
in an animal, the more tender is the steak (Crouse et al., 1989; Miller et al., 1996).
Johnston et al. (2001) found that the average measure of WBSF was 6.93-kg with
heritability of 0.19 across a few Bos indicus breeds (Belmont Red, Brahman, and Santa
Gertrudis). These results were similar to other papers showing Brahman with an average
WBSF measurement of 7.76-kg (Burrow et al., 2001). Crouse et al. (1989) found that
Brahman had an average WBSF measurement of 5.88-kg. Bos taurus WBSF
measurements range from 4.41 to 5.62-kg. This includes the Hereford (4.40-kg), Angus
(4.41-kg), Limousin (5.62-kg), Simmental (5.49-kg), Piedmontese (5.40-kg), and
Charolais (5.17-kg) cattle breeds (Crouse et al., 1989; Burrow et al., 2001).
Heritabilities found by Minick et al. (2004) were Angus (0.33), Simmental (0.16),
Hereford (0.11), and Charolais (0.46). Aass et al. (2010) found the heritability of
tenderness in Norwegian Red cattle to be 0.23. While it is evident that WBSF values are
higher in Bos indicus breeds of cattle, the heritability estimates vary in both Bos indicus
and Bos taurus. Within Bos taurus cattle, Angus appears to be more tender than
Limousin, Gelbvieh, Simmental, and Charolais (Page et al., 2004).
Estimates suggest that 12 to 43% of the variation in beef tenderness is due to
additive genetics (Minick et al., 2004). Due to the moderate heritability of beef
tenderness and the goal for better productivity, the Carcass Merit Program was initiated.
The primary objective of the program was to genetically identify superior animals in the
United States beef cattle population that would produce progeny with the greatest
potential for meeting consumer demands. Warner-Bratzler shear force was included
among carcass trait measures in hopes of identifying genetic markers associated with beef
9
tenderness between breeds. At the 54th
Annual Reciprocal Meat Conference in 2001, the
project had identified 6 quantitative trait loci (QTL) that were segregating between breeds
for WBSF measurements. The U.S. Meat Animal Research Center has also identified two
loci that effect the WBSF measurement of the longissimus muscle (LM) (Smith et al.,
2000). Currently, the gene CAPN1, which encodes for µ-calpain, and its inhibitor
calpastatin (CAST) are the two principle candidate genes identified with 14 day
postmortem tenderness in beef (Casas et al., 2003; Page et al., 2004; Casas et al., 2006).
Tenderness of beef is dependent on the proteolytic breakdown of muscle during
the postmortem interval. CAPN1, found in the central region of BTA29, is orthologous to
regions on HSA11 (Smith et al., 2000), and has been termed the most important enzyme
in beef tenderness (White et al., 2005). CAPN1 is an intracellular cysteine protease, and
codes for the enzyme µ-calpain. µ-calpain is a calcium-activated protease which is
activated with micromolar concentrations of Ca2+
in the early postmortem period. When
calcium binds to µ-calpain, the enzyme becomes active. This active state enables µ-
calpain to breakdown the myofibrillar structures in muscle, ultimately causing the
muscle/steak to become more tender (Koohmaraie, 1996; Kemp et al., 2010). Calpastatin
is also responsible for the tenderness of beef (Zhou and Hickford, 2008; Kemp et al.,
2010). Calpastatin is encoded by the CAST gene, which is located on BTA7 (Schenkel et
al., 2006). Calpastatin is an unstructured protein until it binds to an active state µ-calpain
molecule. Once bound, it adopts a structure which inhibits µ-calpain activity. Higher
levels of calpastatin lead to reduced activity of µ-calpain, therefore reducing proteolysis
which is required for tender meat (Camou et al., 2007; Kemp et al., 2010). Marker-
10
assisted selection for beef tenderness became possible when single-nucleotide
polymorphisms (SNP) within the CAPN1 and CAST genes were associated with WBSF.
For marker-assisted selection to produce the greatest impact in the cattle industry, marker
panels need to be useful across breeds. Two SNP markers have been utilized in the
CAPN1 gene, CAPN1-316 and CAPN1-530. A homozygous CC animal at CAPN1-316
and a GG animal at CAPN1-530 have been shown to have lower WBSF measurements of
0.30-kg and 0.20-kg, respectively, in all seven of the most popular Bos taurus breeds in
the United States (Page et al., 2004; Corva et al., 2007; Café et al., 2010). However,
variation in CAPN1-530 is rare among British breeds (Corva et al., 2007). Currently,
GeneSTAR (Pfizer Genetics Ltd.) and Igenity (Merial Ltd.) are two genomic companies
that provide tests that associate markers within CAST and CAPN1 genes with beef
tenderness for producers to implement marker-assisted selection (Zhou and Hickford,
2008; Kemp et al., 2010). The GeneSTAR Tenderness 2 (Bovigen LLC,
www.bovigen.com) test uses a marker CAST-T1 for the calpastatin gene, and the two
previously described markers for the µ-calpain gene (Van Eenennaam et al., 2007; Zhou
and Hickford, 2008). The substitution of a T allele in the CAST-T1 marker was associated
with a decrease of 0.15-kg in WBSF measurements. When a C allele was substituted in
both the µ-calpain marker locations a decrease of 0.34-kg in WBSF was found (Van
Eenennaam et al., 2007; Johnston and Graser, 2010). The Igenity TenderGENE (Merial,
http://www.igenity.com) test produced similar results. Igenity uses one CAST marker
(G/C SNP in intron 5) to determine variability in WBSF (Zhou and Hickford, 2008). The
company also uses two µ-calpain markers, CAPN1-316 and CAPN1-4751. Tenderness

11
improved 0.19-kg with each increase of the C allele in the calpastatin SNP markers
(Schenkel et al., 2006; Van Eenennaam et al., 2007). When there was an increase in of
one G allele at in the CAPN1-316 gene and one C allele at the markerCAPN1-4751,
WBSF measurements were decreased by 0.33-kg. In both tests, CAPN1 has a greater
effect than CAST on tenderness. The CAPN1-316/4751 C/C haplotype is associated with
the lowest WBSF and the C/T haplotype is rarely seen in both Bos taurus and Bos indicus
breeds (Van Eenennaam et al., 2007; Café et al., 2010). CAPN1 has a greater influence on
WBSF measurements and a high G/T haplotype frequency (> 0.50) present in the US
populations. The beef industry has the opportunity to make improvements in tenderness
by selecting for the C/C haplotype. It is also important to note that both companies used
Bos taurus or Bos indicus × Bos taurus cross populations for validation, and the alleles
were variable at all loci. This variation is not found in purebred Bos indicus populations
(Van Eenennaam et al., 2007). Because allele frequencies are variable in different breeds,
one genetic test to improve WBSF measurements may not work across all breeds of
cattle.
When results from the SNP panels are combined and the net genetic effects are
estimated across loci, they are referred to as molecular breeding values (MBV). Weaber
and Lusk (2010) estimated the possible value of genetic improvement and revenue from
utilizing MBVs in selection decisions in beef herds. By selecting the top 10% of MBV
ranked bulls with heifer replacement based on MBV, WBSF was reduced by 7.2% and
$11.3 billion in national benefits were projected in 20 years. A less aggressive selection
approach of selecting bulls with the top 50% of MBVs and without heifer replacement

12
using MBVs, WBSF was reduced by 2.5% and projected $5.3 billion in national benefits
by year 20. The projected benefits were distributed to consumers (31%), the retailers
(10%), the packing sector (3%), the feedlot sector (7%), and to all other firms involved in
supplying feeder cattle (49%). As mentioned earlier, genetic improvement of WBSF is
difficult because beef tenderness is a complex trait affected by many factors, both
environmental and genetic (Minick et al., 2004; Weaber and Lusk, 2010). The phenotypic
data are difficult and expensive to collect. To measure WBSF, cattle must be followed to
the packing plant for collection of steak samples. Following collection, each steak must
be aged, cooked, and then sheared. Also, the packing industry is reluctant to remove these
samples, because it significantly degrades the total value of the product (Weaber and
Lusk, 2010). Most SNP markers are associative rather than causative (Weaber and Lusk,
2010). However, when a MBV is used in combination with an expected progeny
difference, accuracy of genetic predictors is enhanced. . Utilizing these technologies
provides the best estimates of each animal’s genetic merit, and will lead to faster herd
improvement.
13
Temperament
According to Burrow (1997), temperament is defined as an animal’s behavioral
response to human handling. Aggressive cattle pose problems to the humans who are
handling them, as well to farm equipment and the animal’s own safety. Calmer
temperament animals adapt more easily and become less stressed with repeated handling
while the more excitable animals have a greater difficulty adapting to repeated handling
procedures (Grandin, 1997). Temperament in beef cattle is associated with performance,
health, and carcass quality traits (Café et al., 2011; Curley et al., 2006; Nkrumah et al.,
2007). Since temperament is measured early in an animal’s life, and is associated with
other production traits, disposition measurements are an economically relevant trait that
should be considered by beef producers when breeding or purchasing cattle (Beckman et
al., 2007).
There are many proposed subjective and objective methods for measuring
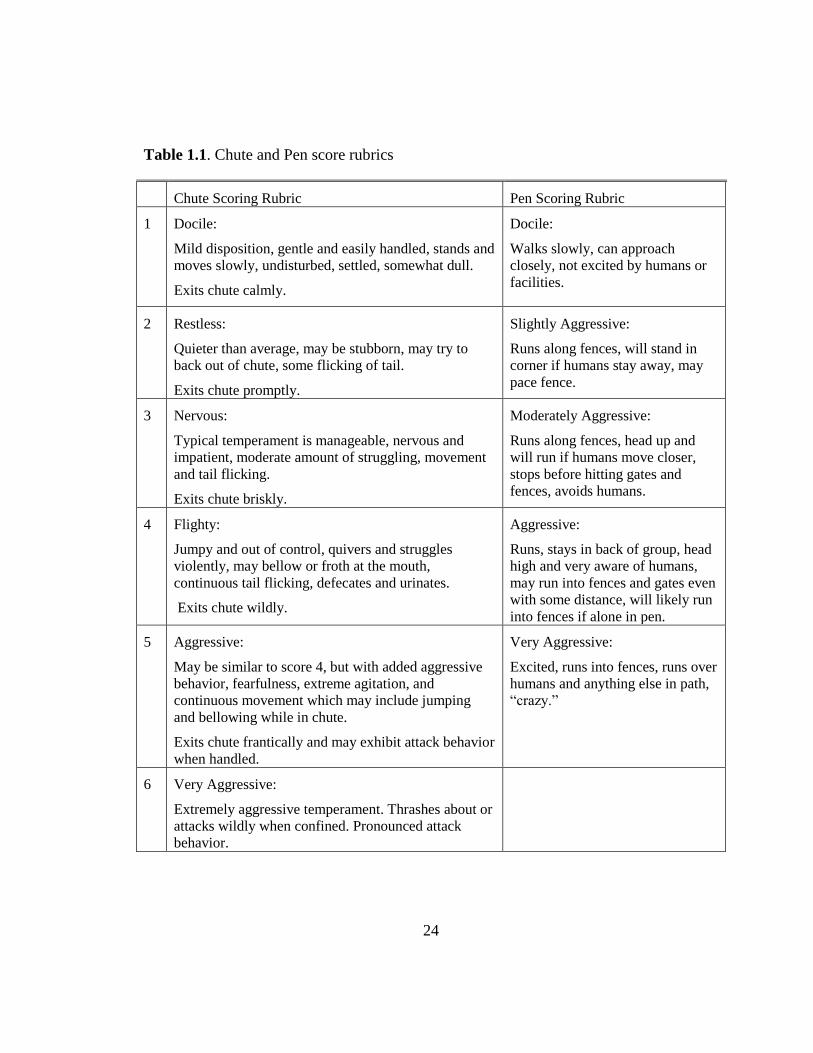
temperament in cattle. The subjective measurements include crush test, chute score, and
pen score. The crush test ranks the overall temperament of an animal via its movements
while entering and individually confined in a crush, or working chute (Burrow, 2003;
Kilgour et al., 2006). The willingness of the animal to enter the crush is ranked on a 1
(enters without hesitation) to a 4 (strenuous resistance) scale. While confined in the crush
for 2 minutes, the animal’s movement is scored on a 1 (no movement) to a 7 (struggles
violently and attempts to jump out) scale. If an animal bellows, kicks, or kneels, its
movement score is increased by 1, and if the animal lies down, the movement score is
increased by 2. The total of these scores is the crush score (Kilgour et al., 2006). The
14
chute score is taken when the animal is confined but not restrained in a working chute
(Curley et al., 2006). The score is ranked on a scale of 1 (calm) to 6 (extremely excited).
Pen score is a visual assessment of the animal while being confined in a pen, usually with
4 or 5 other animals. Handlers approach the groups of animals, and then record the
animal’s temperament on a scale of 1 (calm) to 5 (extremely excited). A more in depth
description of each scale of temperament for both the chute score and pen score are
shown in Table 1.1. The Beef Improvement Federation (BIF) suggests scoring beef cattle
temperament while an animal is in a squeeze chute, using a scale of 1 (calm) to 6
(extremely excited). Several breed organizations, such as the American Angus
Association (AAA) and the North American Limousin Foundation (NALF) have adopted
BIF’s recommended method for subjectively scoring temperament. Other subjective
measures include the French score, milking temperament, and auction ring behavior
(Lewis and Hurnik, 1998; Sapa et al., 2006; Lanier et al., 2000). All three are based on a
similar numeric scale of 1 through 4 or 1 through 5.The docility test is a mix of subjective
and objective measurements to record an animal’s temperament. This test measures
locomotion, changes in mobility, and aggressiveness towards humans (Burrow, 1997;
Beckman et al., 2007). The animal is placed in a pen and a handler attempts to confine
the animal in a corner. The aggressive score is a subjective test which indicates how
threatening the animal is toward the handler. The running time, or the time the animal is
in motion, and the number of escapes is recorded during the first 30 seconds from the
beginning of the test and then in the presence of a motionless handler for another 30
seconds. Then, the handler is to try to confine the animal in a corner of the pen while
15
trying to touch/stroke the animal. The amount of time the animal is in motion and the
escapes per minute is then calculated. These measurements are combined to approximate
a normal distribution for the complete docility score (Sapa et al., 2006).
Subjective measures of temperament in production situations have been called the
“trouble makers.” Not only are they time-consuming and difficult to implement,
subjective measurements are always subject to human error or bias (Curley et al., 2006).
Also, the crush test and chute score may not accurately reflect an animal’s behavior while
not in the crush or chute. Some cattle demonstrate a freeze response when restrained, and
may appear to have a calmer temperament score than they should receive (Burrow and
Corbet, 2000; Burrow, 2003). After observing that animals remain calm while being
weighed but leave the weigh scale at different speeds, Burrow et al. (1988) proposed the
use of exit velocity (EV) as an objective measure of temperament in cattle. Exit velocity
is the rate (m/s) at which animals exit the working chute and covers the distance of 1.7-m
(Burrow et al., 1988; Curley et al., 2006). Two light beams are focused on infra-red
sensors spaced at the chute (head bail) and 1.7-m away from the head bail. The sensors
have an on/off mechanism, so as the animal breaks the light beam, the timing apparatus
stops and a connected computer records the time (Burrow et al., 1988; Curley et al.,
2006; Beckman et al., 2007). The time it takes the animal to pass between the two sets of
infra-red sensors is recorded and called flight time (FT). Flight time is recorded in
hundredths of a second and converted into a velocity (m/s) termed EV. Consequently, the
poorer the temperament of an individual animal, the higher the EV value (Beckman et al.,
2007). It is important to determine the correct time in the animal’s life to measure EV. At
16
weaning, there is no difference in EV between the sexes of the animals, but the
measurements become significantly different between sexes by 18 months of age
(Burrow et al., 1988; Burdick et al., 2009). At weaning, EV differs between individual
animals, but by 18 months of age the differences becomes moderately variable (Burrow
et al., 1988). It makes sense to measure the EV of animals at weaning. Not only do
producers take weights at around this age, but the variation between animals is expressed,
and isn’t influenced by the sex of the animal. It has also been noted that while the EV
changes through an animal’s life span, it is not significantly different from weaning to
later in life (Fell et al., 1999; Behrends et al., 2009).
The different methods to measure temperament, both subjective and objective,
have different heritability estimates. The crush test has heritability estimates of 0.03 and
0.46 in Bos taurus and Bos indicus cattle, respectively (Beckman et al., 2007). Chute
scores and docility test heritabilities were estimated to be 0.20 (Nelore), and 0.22
(Limousin), respectively (Carneiro et al., 2006; Beckman et al., 2007). Exit velocity has
heritability estimates of 0.40 among Bos indicus breeds, 0.36 in the Canadian Beef Cattle
Reference herd, and 0.35 among Bos taurus breeds (Burrow and Corbet, 2000; Beckman
et al., 2007). When EV is taken at weaning, Burrow et al. (1988) reported a heritability of
0.54 in Bos indicus breeds. Other studies report similar heritability estimates for
temperament using EV; 0.49 in Bos taurus breed crosses (Nkrumah et al., 2007) and 0.31
in Bos taurus × Bos indicus breed crosses (Johnston et al., 2003a; Kadel et al., 2006).
Animals with a higher Bos indicus content have a higher heritability for temperament
(Burrow and Corbet, 2000). Not only is EV the most heritable and repeatable
17
measurement of temperament in both Bos indicus and Bos taurus breeds, it has the ability
to easily be implemented into a production system (Burrow and Corbet, 2000; Curley et
al., 2006; Muller and von Keyserlingk, 2006). Exit velocity appears to be the best
available measurement for incorporating temperament into breeding programs (Burrow
and Corbet, 2000; Fell et al., 1999).
In 1998, the NALF implemented the first estimated progeny difference (EPD) for
docility in beef cattle in their national cattle evaluation. The EPD describes the additional
percentage of a sires progeny that will fall into the calmest chute score (Beckman, 2008;
Beckman et al., 2007). According to NALF, there has been a 15% increase in the mean
docility EPD over the past twenty years (NALF, 2006). In 2008, the AAA followed
NALF’s lead and released a docility EPD sire listing in their national cattle evaluation
(Beckman, 2008). The American Salers Association also has routine genetic evaluations
for docility.
In Holstein cattle, three quantitative trait loci (QTL), on BTA5, BTA18, and
BTA29, have been associated with temperament (Hiendleder et al., 2003). The Canadian
Beef Cattle reference herd found QTLs associated with temperament on BTA1, BTA5,
BTA9, BTA11, BTA14, and BTA15 (Schmutz et al., 2001). Currently, no causal
mutations in genes have been identified for temperament in cattle.
While some work has been conducted to implement selection for temperament, it
is important when designing cattle breeding programs, to understand the relationship
between different traits. Selection to improve one trait may lead to changes (favorable or
unfavorable) in another trait. While most of the beef cattle temperament research has
18
been conducted using Bos indicus influenced breeds, conclusions on correlations between
traits in Bos taurus cattle are likely to be similar.
The correlations between growth, fertility, and carcass quality traits with
temperament have been most frequently studied. Poorer temperament animals (animals
with higher EVs) spend less time eating (Café et al., 2011), possibly due to a loss of
appetite (Carneiro et al., 2006). Café et al. (2011) found that Brahman cattle spent 4.6-
min/day less time eating for each m/s increase in EV and a 17.6-min/day decrease in
Angus cattle. The decrease in time spent eating could also explain the reduced dry matter
intake (370-g for every m/s increase in EV) and feed conversion efficiencies found in
poorer temperament animals (Burrow, 2003; Nkrumah et al., 2007; Café et al., 2011). It
is also not surprising to see correlations with temperament and average daily gain (ADG)
(Voisinet et al., 1997; Fell et al., 1999; Lanier et al., 2000; Burrow, 2003; Carneiro et al.,
2006; Muller and von Keyserlingk, 2006; Behrends et al., 2009; Café et al., 2011). A
poorer temperament in purebred Bos indicus cattle, Bos indicus × Bos taurus cattle, and
Bos taurus purebred animals was associated with a decrease of 0.38, 0.19, and 1.46-
kg/day in ADG (Voisinet et al., 1997; Fell et al., 1999; Burrow, 2003). Burrow (1997)
suggested that selection for high growth rates should improve an animal’s temperament.
Some studies have shown that animals with a faster EV have elevated physiological
concentrations of plasma cortisol (Fell et al., 1999; Curley et al., 2006). A difference of
61.4-nmol/L was seen before weaning and 168.1-nmol/L at feedlot entry in Angus ×
Hereford cattle (Fell et al., 1999). Elevated cortisol for a short period of time is not
detrimental to the long-term health of the animal and may even enhance immune function

19
(Burdick et al., 2009). However, Beckman et al. (2007) found that animals with poorer
temperament had a lower immune function.
The dairy industry has investigated the milk production of nervous or aggressive
animals. When dairy cattle are stressed, oxytocin secretion is reduced leading to a 25 to
30% decrease in milk production (Voisinet et al., 1997; Lanier et al., 2000; Curley et al.,
2006). Therefore, milk yield and milk flow is decreased (Burrow, 1997; Hiendleder et al.,
2003; Muller and von Keyserlingk, 2006). Reproductive traits are affected by the
temperament of the animal in artificial insemination programs. Calmer animals (lower
EV) cycled more often, were more often visually detected to be in estrus, had an
increased number of perceivable estrum, and higher conception rates (Burrow et al.,
1988; Carneiro et al., 2006); however, there was no difference in pregnancy rates
(Burrow et al., 1988). The conclusion of a higher conception rate but not pregnancy rate
could be due to the fact that calmer animals are more tolerant of human contact and are
therefore more likely to be inseminated at the appropriate time. Scrotal circumference
was also weakly but favorably correlated with exit velocity (Burrow, 2001).
Transporting cattle induces a great amount of stress on the animal. The more
docile animals lose less weight during transit and less time is needed for the animal to
regain weight after arrival (Burrow, 2003). Greater travel distances, inadequate handling
facilities at packing plants, and higher speeds of plant operations all result in greater
animal stress resulting in poorer meat quality. Wilder temperament animals have an
average of 1.5-kg more bruise trim per carcass due to injuries sustained during
transportation (Burrow, 1997; Curley et al., 2006). This results in a negative correlation
20
between temperament and carcass weight (Nkrumah et al., 2007; Ribeiro et al., 2007;
Behrends et al., 2009; Café et al., 2011;). Café et al. (2011) found a 9.9-kg difference in
the carcass weight of Brahman cattle with each m/s increase in EV. Ribeiro et al. (2007)
reported that steers with a calmer temperament had a 9.2% heavier hot carcass weight. As
well as having heavier carcass weights, calmer animals also had larger ultrasound
longissimus muscle (LM) and carcass LM areas (Nkrumah et al., 2007). A favorable
correlation was reported between temperament and carcass quality measured as yield
grade, dressing percentages, and carcass marbling score (Burrow, 2003; Nkrumah et al.,
2007; Ribeiro et al., 2007). Alteration of steak taste and eating quality is also associated
with temperament. Pre-slaughter stress can deplete muscle glycogen, which results in the
meat having a higher pH (Burrow, 1997; Carneiro et al., 2006; Café et al., 2011).
Beckman et al. (2007) concluded that docile calves returned $62.19 per head more than
did temperamental calves when sold as beef.
In tropically adapted beef breeds a strong correlation exists between temperament
and steak tenderness. Studies have found that the genetic correlation between
temperament, measured as FT, and tenderness measured as Warner-Bratzler shear force
(WBSF) was -0.42 with FT taken post-weaning and -0.32 with FT taken at the start of
finishing (Kadel et al., 2006). These results are similar to those of Behrends et al. (2009)
who reported genetic correlation between EV and WBSF of 0.24 and 0.35. The
correlations are opposite in sign because a higher EV results in a lower FT. Kadel et al.
(2006) also estimated a phenotypic correlation of -0.02 and -0.04 between WBSF and
temperament measured as EV taken post-weaning and WBSF and EV taken at the start of
21
finishing, respectively. Ribeiro et al. (2007) concluded that WBSF values were 10.7 to
19.3% lower in calmer steers.
Café et al. (2010) looked for the effects of SNP markers for tenderness on
temperament in a Brahman cattle herd. Bos indicus breeds have greater calpastatin
activity than do Bos taurus breeds, which may explain why they also produce tougher
steaks. Four tenderness markers were used in the study; calpastatin (CAST), calpain 3
(CAPN3), and two markers in the µ-calpain region (CAPN1-4851 and CAPN1-316) to
determine marker effects on temperament. CAPN1-4751 was the only marker to be
associated with both tenderness and temperament. With two favorable alleles for WBSF
at CAPN1-4751, animals had a greater EV than those with zero or one favorable allele.
CAPN3 showed a tendency (p = 0.08) for cattle with one favorable WBSF allele to have a
lower EV. For this study, selection to improve tenderness in Brahman cattle using
favorable CAPN1-4751 and CAPN3 alleles would have favorable effects on
temperament.
22
Research Objectives
Chapter 2 explores the phenotypic and genetic correlations between temperament
and tenderness in Bos taurus cattle, specifically in purebred Angus, Simmental, and
Angus × Simmental crossbred animals. The first objective was to investigate and
compare statistical methods to analyze the dataset, which included multiple records for
both temperament and tenderness. Secondly, the statistical models were used to estimate
genetic parameters, including heritability and genetic and phenotypic correlations, among
the two traits. Results from these studies could provide tools suitable for selection of
animals that influence producer profit and herd performance.
Chapter 3 describes a genome-wide association study (GWAS) performed using
the Illumina BovineSNP50 BeadArray (San Diego, CA, USA; Matikumalli et al., 2009).
The objective of the study was to conduct a GWAS to detect single-nucleotide
polymorphism (SNP) markers associated with temperament or tenderness in Simmental ×
Angus crossed cattle. Strong associations between SNP markers in linkage disequilibrium
with particular quantitative trait loci may provide some evidence of a candidate gene
harbored in the region.
The overall goal of the study was to develop the most accurate estimates of
genetic merit for each animal. These estimates will enhance a producer’s ability to
improve herd performance and net profit. Understanding the nature of correlations
between traits will present the possibility of influencing one trait with an early selection
process on the other trait. For example, if there is a positive genetic correlation between
the traits, selection on temperament could be implemented at weaning, which then would

23
influence tenderness, which is measured at the end of the animal’s life. Increasing the
accuracy of genetic predictions, by utilizing marker-assisted selection through molecular
breeding values, may allow for faster genetic improvement in a herd.
24
Table 1.1. Chute and Pen score rubrics
Chute Scoring Rubric Pen Scoring Rubric
1 Docile:
Mild disposition, gentle and easily handled, stands and
moves slowly, undisturbed, settled, somewhat dull.
Exits chute calmly.
Docile:
Walks slowly, can approach
closely, not excited by humans or
facilities.
2 Restless:
Quieter than average, may be stubborn, may try to
back out of chute, some flicking of tail.
Exits chute promptly.
Slightly Aggressive:
Runs along fences, will stand in
corner if humans stay away, may
pace fence.
3 Nervous:
Typical temperament is manageable, nervous and
impatient, moderate amount of struggling, movement
and tail flicking.
Exits chute briskly.
Moderately Aggressive:
Runs along fences, head up and
will run if humans move closer,
stops before hitting gates and
fences, avoids humans.
4 Flighty:
Jumpy and out of control, quivers and struggles
violently, may bellow or froth at the mouth,
continuous tail flicking, defecates and urinates.
Exits chute wildly.
Aggressive:
Runs, stays in back of group, head
high and very aware of humans,
may run into fences and gates even
with some distance, will likely run
into fences if alone in pen.
5 Aggressive:
May be similar to score 4, but with added aggressive
behavior, fearfulness, extreme agitation, and
continuous movement which may include jumping
and bellowing while in chute.
Exits chute frantically and may exhibit attack behavior
when handled.
Very Aggressive:
Excited, runs into fences, runs over
humans and anything else in path,
“crazy.”
6 Very Aggressive:
Extremely aggressive temperament. Thrashes about or
attacks wildly when confined. Pronounced attack
behavior.
25
CHAPTER 2
QUANTITATIVE ANALYSIS OF PHENOTYPIC
AND GENETIC RELATIONSHIPS BETWEEN
TEMPERAMENT AND TENDERNESS TRAITS IN
BEEF CATTLE
Summary
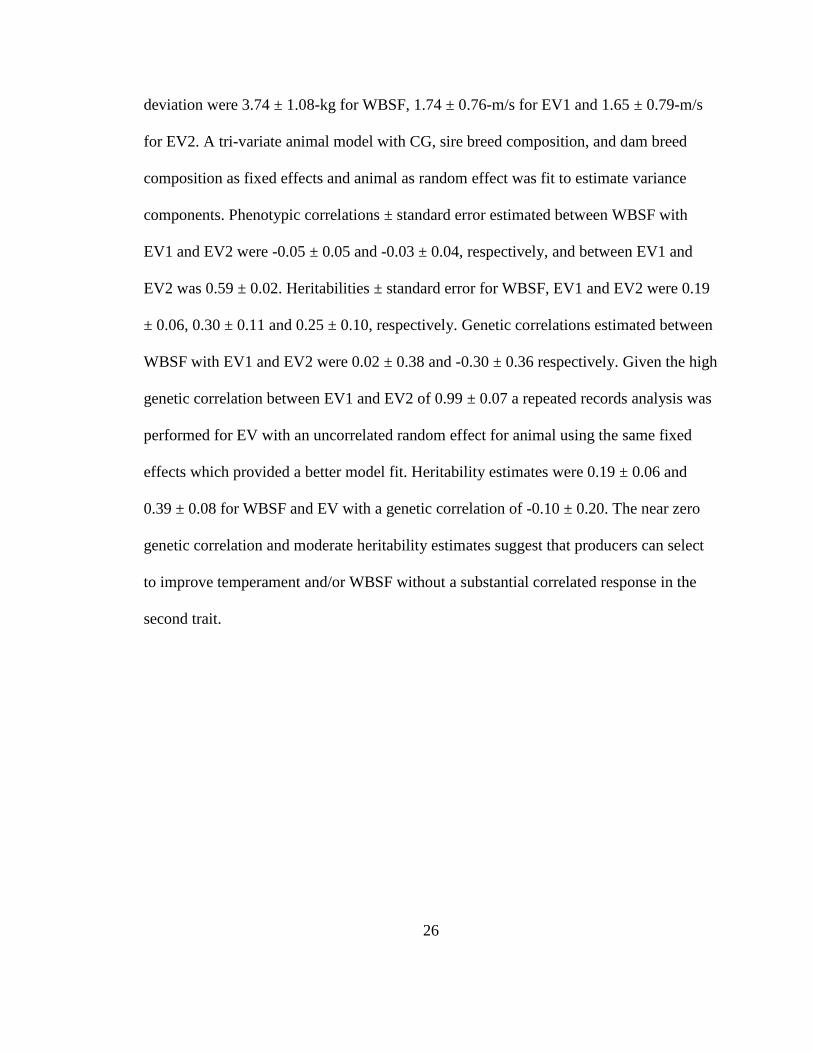
Tenderness is a primary meat palatability attribute affecting the consumer
satisfaction of beef. Beef cattle temperament has been associated with a variety of
performance measures. Australian researchers found a strong negative association (-0.54)
between Warner-Bratzler shear force (WBSF) and flight times for tropically adapted Bos
indicus influenced breeds. Performance data and pedigree records were provided by the
American Simmental Association (ASA) to elucidate the relationship between
temperament and tenderness in Bos taurus breeds. Data included WBSF records from
ASA’s carcass merit program and a subset collected at the University of Illinois. Exit
velocities were recorded when cattle went on trial (EV1) and 42 days later (EV2). Single
animal and single sire contemporary groups (CG) were removed from the data set leaving
2,819 WBSF, 917 EV1, and 976 EV2 phenotypes in 176 CG for evaluation. A pedigree
was formed with 13,418 animals including 2,488 sires. Phenotypic means ± standard
26
deviation were 3.74 ± 1.08-kg for WBSF, 1.74 ± 0.76-m/s for EV1 and 1.65 ± 0.79-m/s
for EV2. A tri-variate animal model with CG, sire breed composition, and dam breed
composition as fixed effects and animal as random effect was fit to estimate variance
components. Phenotypic correlations ± standard error estimated between WBSF with
EV1 and EV2 were -0.05 ± 0.05 and -0.03 ± 0.04, respectively, and between EV1 and
EV2 was 0.59 ± 0.02. Heritabilities ± standard error for WBSF, EV1 and EV2 were 0.19
± 0.06, 0.30 ± 0.11 and 0.25 ± 0.10, respectively. Genetic correlations estimated between
WBSF with EV1 and EV2 were 0.02 ± 0.38 and -0.30 ± 0.36 respectively. Given the high
genetic correlation between EV1 and EV2 of 0.99 ± 0.07 a repeated records analysis was
performed for EV with an uncorrelated random effect for animal using the same fixed
effects which provided a better model fit. Heritability estimates were 0.19 ± 0.06 and
0.39 ± 0.08 for WBSF and EV with a genetic correlation of -0.10 ± 0.20. The near zero
genetic correlation and moderate heritability estimates suggest that producers can select
to improve temperament and/or WBSF without a substantial correlated response in the
second trait.
27
Introduction
Beef producers constantly search for new selection strategies which will affect
herd performance and improve profitability. Temperament is a trait of recent interest to
producers. Not only are producers interested in improving the behavior of their animals,
they are concerned with the impact that selection of temperament will have on other
correlated traits. Australian researchers have found an association between temperament
and steak tenderness. A 0.24 to 0.35 correlation was recorded between temperament (exit
velocity; EV) and steak tenderness (Warner-Bratzler shear force; WBSF) in tropically
adapted Bos indicus influenced cattle breeds (Behrends et al., 2009). Temperament,
measured as EV, is best measured before cattle acclimate to the production system, and
therefore can be recorded at weaning (Behrends et al., 2009). Warner-Bratzler shear force
is widely used to measure the tenderness of meat, which has been shown to be one of the
highest beef quality concerns influencing consumer acceptability of beef (Crouse et al.,
1989; Lusk et al., 2001). If this magnitude and direction of correlation between
temperament and tenderness exists in Bos taurus cattle, it will be possible for producers
to make early selection decisions that favorably influence their herd performance.
Industry wide improvements in WBSF may increase the demand for beef and prices
received by producers (Weaber and Lusk, 2010). Exit velocity and WBSF have been
analyzed using repeated measures mixed models as well as multi-variate linear mixed
models (Burrow et al., 2001; Curley et al., 2006; Kadel et al., 2006; Burdick et al., 2009;
Café et al., 2010; Weaber and Creason, 2010). The objectives of this paper were to: (1)
investigate and compare statistical methods to analyze the dataset, which included

28
multiple records for both traits; and (2) estimate genetic parameters, including
heritabilities, genetic and phenotypic correlations for tenderness and temperament traits.
29
Materials and Methods
Record Collection
Data for this study were provided by the American Simmental Association
(ASA), and included performance records collected from 2001 through 2008 (Pollak et
al., 2001). These included records from ASA’s Carcass Merit Program (n = 3,776). The
animals were purebred Angus, purebred Simmental, or Angus × Simmental crossbreds.
Performance records included a temperament measure and a steak tenderness measure.
Cattle temperament is most usefully measured objectively as an exit velocity (EV) which
has been shown to be better than any of the other subjective measures (Curley et al.,
2006). Exit velocity is the rate (m/s) at which an animal exits the working chute and
covers a distance of 1.7-m (Burrow et al., 1988; Curley et al., 2006). Elapsed time was
recorded in thousandths of a second by a simple electronic system (Polaris Timing
System, FarmTek, Wylie, TX). Two light beams are focused on infra-red sensors spaced
at the chute (head bail) and 1.7-m away from the head bail. The sensors trigger an on/off
mechanism, so that as the animal breaks the light beam, the timing apparatus stops and a
connected computer records the time (Burrow et al., 1988; Curley et al., 2006; Beckman
et al., 2007). The elapsed time required for the animal to pass between the two sets of
infra-red sensors is recorded, and is termed the animal’s flight time (FT). Exit velocity is
computed as the distance traversed divided by FT and is reported as m/s (Beckman et al.,
2007). In this study, EV was measured at most of two times, on the first day of a feeding
trial (EV1) and 42 days (EV2) later at the midpoint of the trial. Warner-Bratzler shear
force (WBSF) is the most widely used measure of beef tenderness. The protocol used for
30
all WBSF measurements followed the protocol outlined by Dikeman et al. (2005), which
closely follows the American Meat Science Association (AMSA) recommendations as
well as the proposed shear force procedures for meat tenderness measurements (Wheeler
et al., 2005). The longissimus dorsi (LD) muscle was collected at the slaughter plant, and
on return to the research institution, 2.54-cm steaks were cut and immediately vacuum-
packaged. The steaks were aged at 2°C for 14 days and then thawed for 24 hours. The
steaks were then cooked on a convection conveyor oven (XLT Oven Model 1832-EL,
BOFI, Inc., Wichita, KS) to an internal temperature of 71°C (medium degree of
doneness). After the steaks were taken off the conveyor oven, internal temperatures were
measured with a hand-held thermometer using a wire thermocouple (HH-21, Omega
Engineering, Stamford, CT USA), and after the post-cooking temperature rise was
complete, this temperature was recorded in order to adjust the WBSF measurement. The
steaks were next chilled at 2°C for 24 hours. An average of eight 1.27-cm steak cores
were removed parallel to the muscle fiber orientation of each steak using a hand-held
coring device. Each core was then sheared using a United-Smart 1 Test System SSTM –
500 (United Calibration Crop., Huntington Beach, CA) with a head speed of 250-
mm/min, and shear force was recorded for each core.
31
Statistical Models
Over the years during which data were collected there was variation in the amount
of information collected on each animal, creating missing observations. Observations
taken on animals during the earlier years included only an EV1 measurement, whereas
later born animals had both EV1 and EV2 measurements recorded. Animals had WBSF
observations collected from 1 to 12 steak cores, with an average of 7.52 cores per steak.
Average peak shear force (APSF) was calculated as the average of all cores taken on an
individual animal. Because each animal had the possibility for multiple measurements in
both performance traits, 4 statistical models were evaluated to determine the best models
of this data. Table 2.1 provides the counts of animals cross classified with various
measurements available in the dataset. Contemporary groups (CG) were assigned by
providing a unique identifier for animals with common year of birth and herd of origin.
After single animal and single sire CGs were removed, the dataset included 3,042 total
animals with 13,418 animals represented in a 29 generation pedigree. The pedigree file
included 2,488 sires, 1,115 paternal grand-sires, 1,671 paternal grand-dams, 6,952 dams,
1,580 maternal grand-sires, and 3,663 maternal grand-dams. Each of the 176 CGs
consisted of an average of 17.28 animals, but ranged from 2 to 126 animals. ASREML
software version 3.0 (VSN International Ltd., Hemel Hempstead, UK) was utilized to
estimate phenotypic and genetic variances as well as heritability.
32
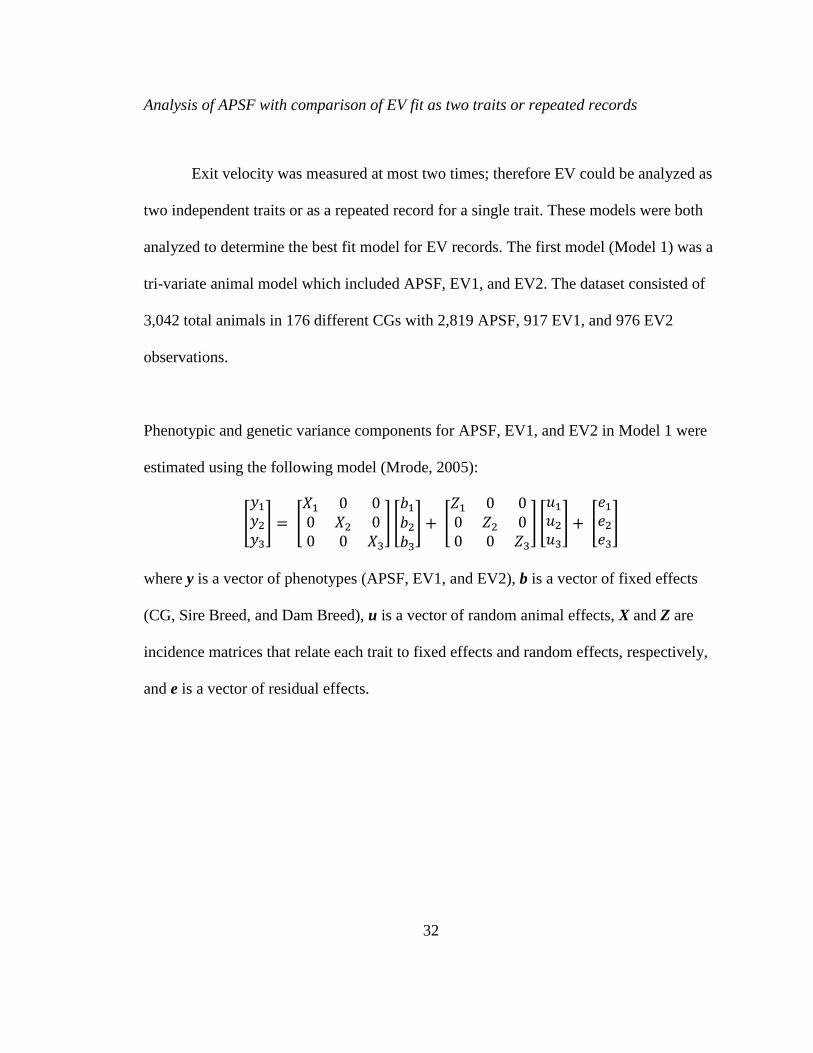
Analysis of APSF with comparison of EV fit as two traits or repeated records
Exit velocity was measured at most two times; therefore EV could be analyzed as
two independent traits or as a repeated record for a single trait. These models were both
analyzed to determine the best fit model for EV records. The first model (Model 1) was a
tri-variate animal model which included APSF, EV1, and EV2. The dataset consisted of
3,042 total animals in 176 different CGs with 2,819 APSF, 917 EV1, and 976 EV2
observations.
Phenotypic and genetic variance components for APSF, EV1, and EV2 in Model 1 were
estimated using the following model (Mrode, 2005):
[
] [
] [
] [
] [
] [
]
where y is a vector of phenotypes (APSF, EV1, and EV2), b is a vector of fixed effects
(CG, Sire Breed, and Dam Breed), u is a vector of random animal effects, X and Z are
incidence matrices that relate each trait to fixed effects and random effects, respectively,
and e is a vector of residual effects.
33
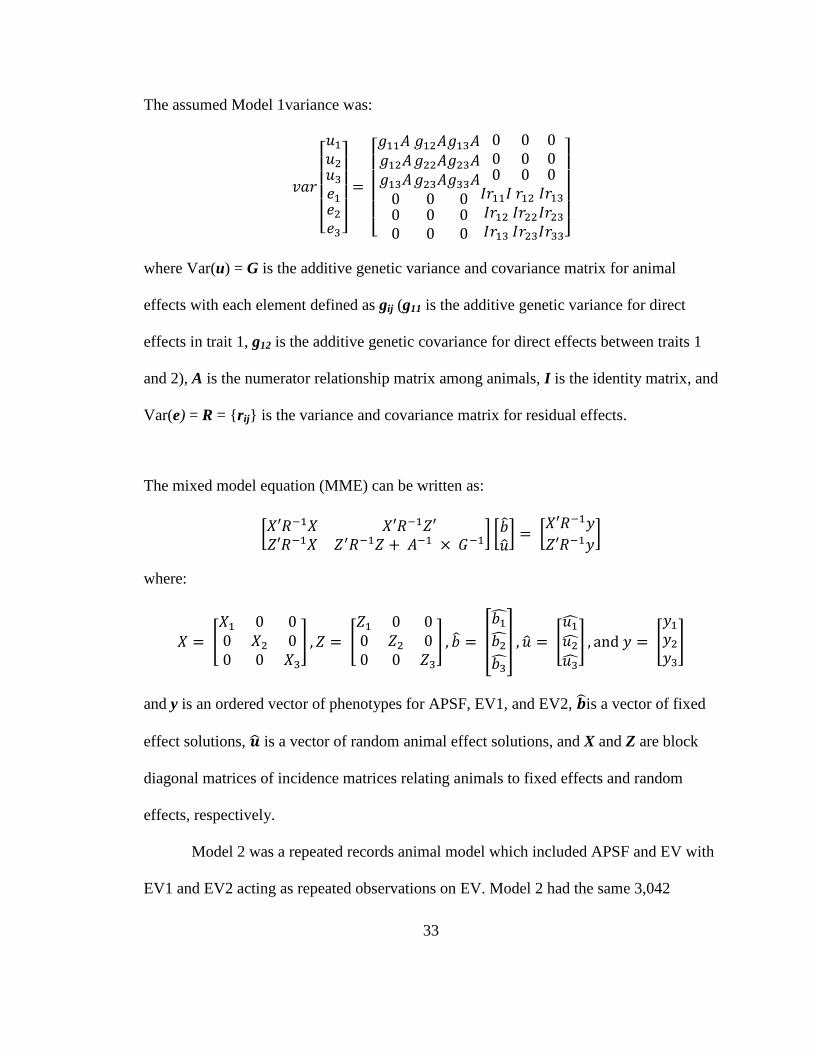
The assumed Model 1variance was:
[
]
[
]
where Var(u) = G is the additive genetic variance and covariance matrix for animal
effects with each element defined as gij (g11 is the additive genetic variance for direct
effects in trait 1, g12 is the additive genetic covariance for direct effects between traits 1
and 2), A is the numerator relationship matrix among animals, I is the identity matrix, and
Var(e) = R = {rij} is the variance and covariance matrix for residual effects.
The mixed model equation (MME) can be written as:
[ ] [
] [
]
where:
[
] [
] [
] [
] [
]
and y is an ordered vector of phenotypes for APSF, EV1, and EV2, is a vector of fixed
effect solutions, is a vector of random animal effect solutions, and X and Z are block
diagonal matrices of incidence matrices relating animals to fixed effects and random
effects, respectively.
Model 2 was a repeated records animal model which included APSF and EV with
EV1 and EV2 acting as repeated observations on EV. Model 2 had the same 3,042
34
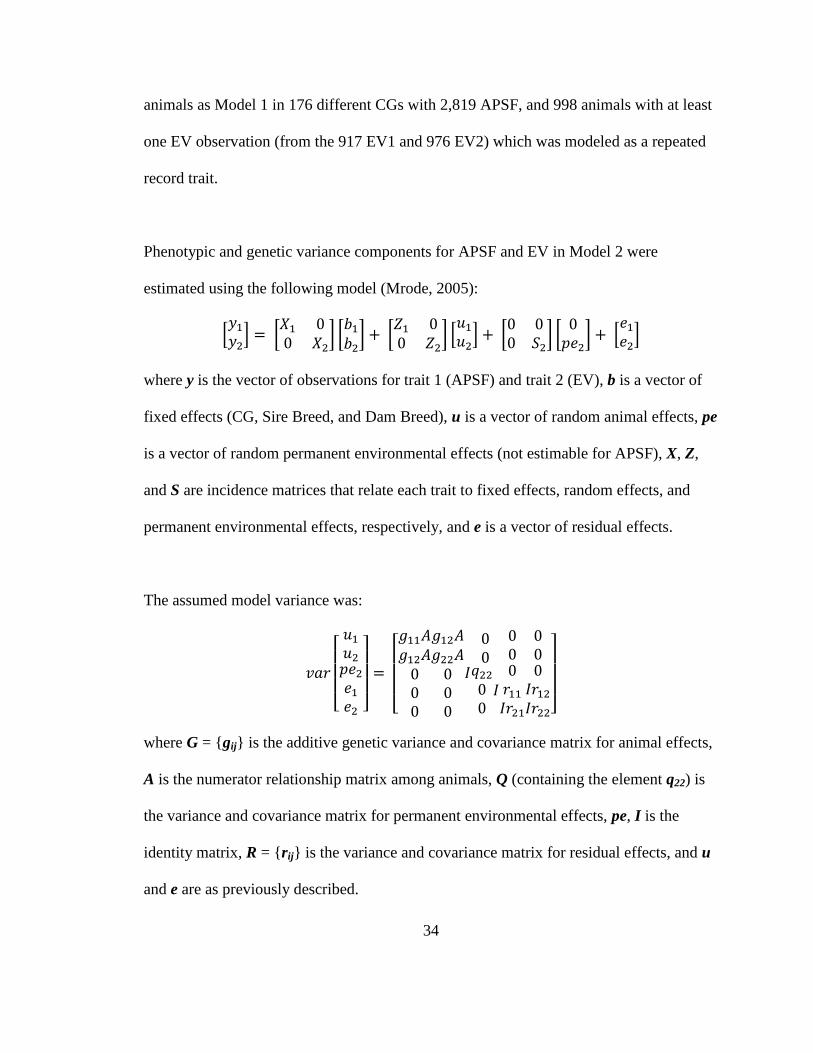
animals as Model 1 in 176 different CGs with 2,819 APSF, and 998 animals with at least
one EV observation (from the 917 EV1 and 976 EV2) which was modeled as a repeated
record trait.
Phenotypic and genetic variance components for APSF and EV in Model 2 were
estimated using the following model (Mrode, 2005):
[
] [
] [
] [
] [
] [
] [
] [
]
where y is the vector of observations for trait 1 (APSF) and trait 2 (EV), b is a vector of
fixed effects (CG, Sire Breed, and Dam Breed), u is a vector of random animal effects, pe
is a vector of random permanent environmental effects (not estimable for APSF), X, Z,
and S are incidence matrices that relate each trait to fixed effects, random effects, and
permanent environmental effects, respectively, and e is a vector of residual effects.
The assumed model variance was:
[
]
[
]
where G = {gij} is the additive genetic variance and covariance matrix for animal effects,
A is the numerator relationship matrix among animals, Q (containing the element q22) is
the variance and covariance matrix for permanent environmental effects, pe, I is the
identity matrix, R = {rij} is the variance and covariance matrix for residual effects, and u
and e are as previously described.
35
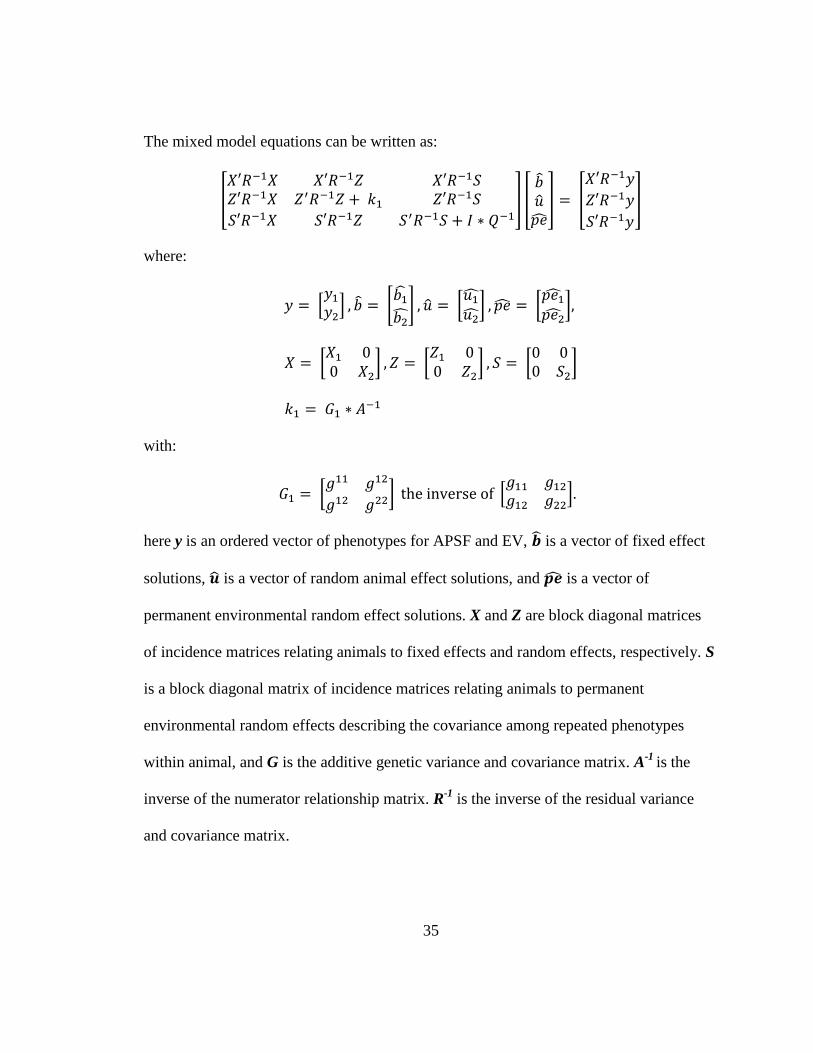
The mixed model equations can be written as:
[
] [
] [
]
where:
[
] [
] [
] [
]
[
] [
] [
]
with:
[
] [
]
here y is an ordered vector of phenotypes for APSF and EV, is a vector of fixed effect
solutions, is a vector of random animal effect solutions, and is a vector of
permanent environmental random effect solutions. X and Z are block diagonal matrices
of incidence matrices relating animals to fixed effects and random effects, respectively. S
is a block diagonal matrix of incidence matrices relating animals to permanent
environmental random effects describing the covariance among repeated phenotypes
within animal, and G is the additive genetic variance and covariance matrix. A-1
is the
inverse of the numerator relationship matrix. R-1
is the inverse of the residual variance
and covariance matrix.

36
The Bayesian Information Criteria (BIC) was used to evaluate which model
provided the best fit to the data (Gilmour et al., 2006). BIC was computed for each model
and the model with the smallest BIC was chosen as the preferred model.
BIC was computed as:
where is the model log-likelihood, is the number of variance parameters in the
model, and the residual degrees of freedom.
37
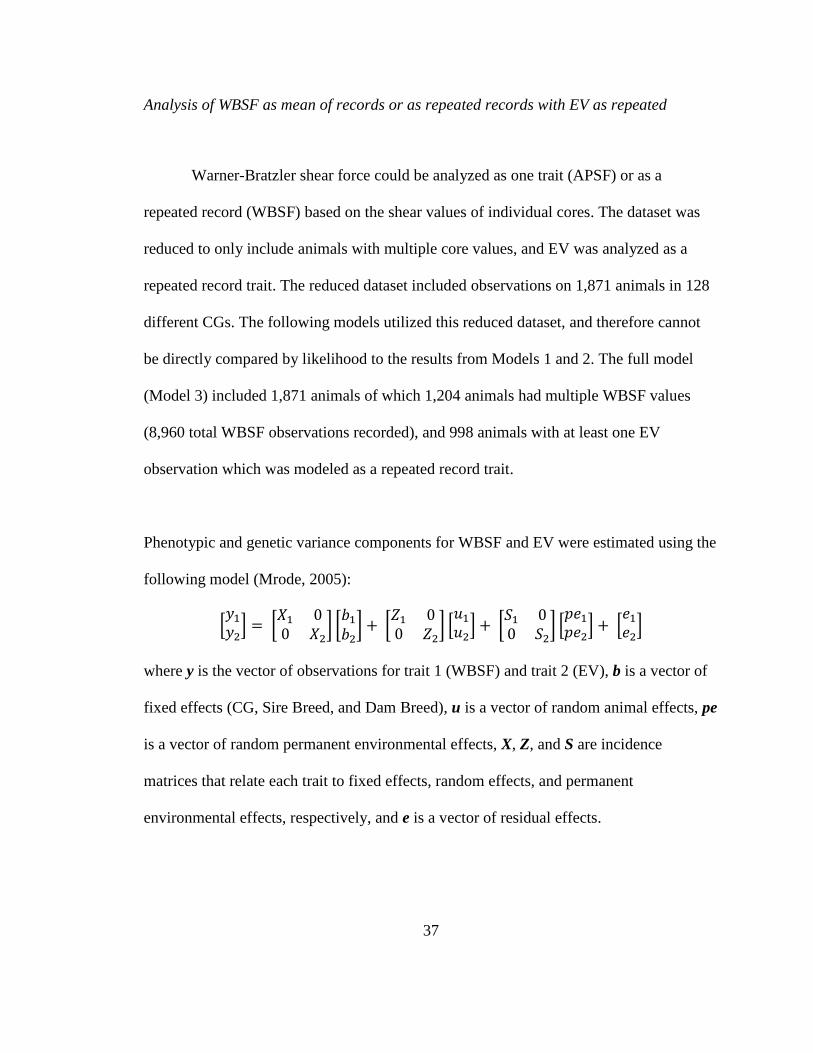
Analysis of WBSF as mean of records or as repeated records with EV as repeated
Warner-Bratzler shear force could be analyzed as one trait (APSF) or as a
repeated record (WBSF) based on the shear values of individual cores. The dataset was
reduced to only include animals with multiple core values, and EV was analyzed as a
repeated record trait. The reduced dataset included observations on 1,871 animals in 128
different CGs. The following models utilized this reduced dataset, and therefore cannot
be directly compared by likelihood to the results from Models 1 and 2. The full model
(Model 3) included 1,871 animals of which 1,204 animals had multiple WBSF values
(8,960 total WBSF observations recorded), and 998 animals with at least one EV
observation which was modeled as a repeated record trait.
Phenotypic and genetic variance components for WBSF and EV were estimated using the
following model (Mrode, 2005):
[
] [
] [
] [
] [
] [
] [
] [
]
where y is the vector of observations for trait 1 (WBSF) and trait 2 (EV), b is a vector of
fixed effects (CG, Sire Breed, and Dam Breed), u is a vector of random animal effects, pe
is a vector of random permanent environmental effects, X, Z, and S are incidence
matrices that relate each trait to fixed effects, random effects, and permanent
environmental effects, respectively, and e is a vector of residual effects.
38
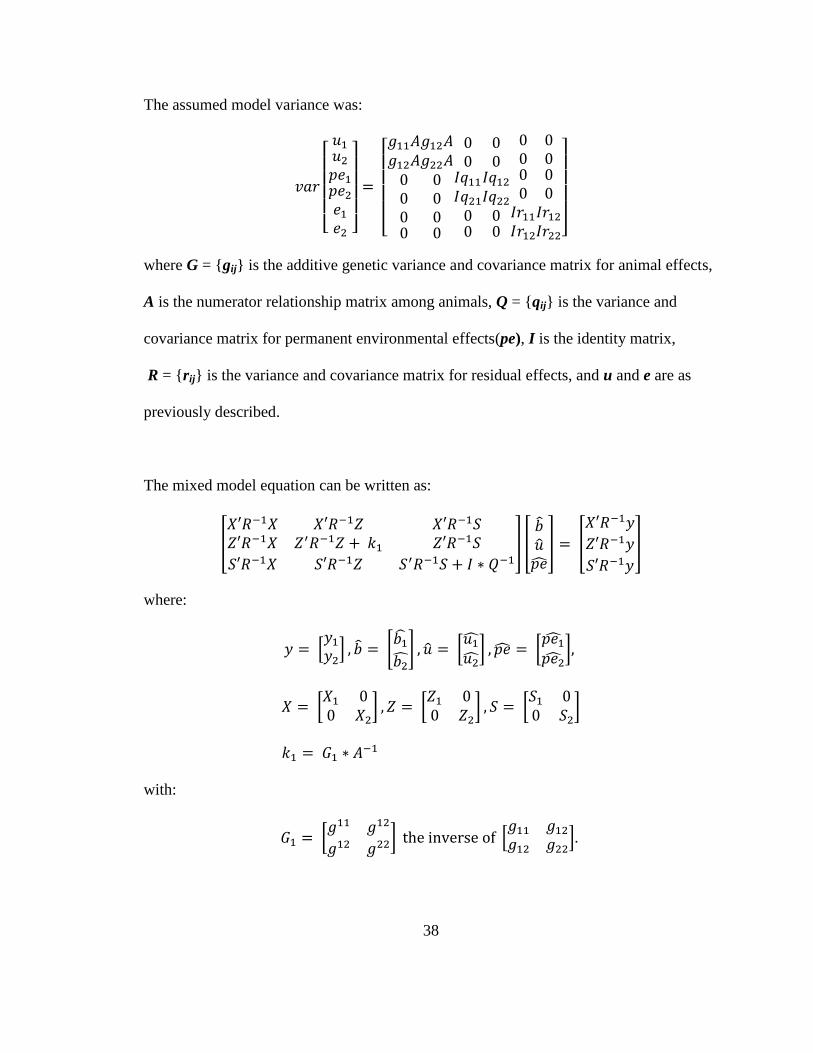
The assumed model variance was:
[
]
[
]
where G = {gij} is the additive genetic variance and covariance matrix for animal effects,
A is the numerator relationship matrix among animals, Q = {qij} is the variance and
covariance matrix for permanent environmental effects(pe), I is the identity matrix,
R = {rij} is the variance and covariance matrix for residual effects, and u and e are as
previously described.
The mixed model equation can be written as:
[
] [
] [
]
where:
[
] [
] [
] [
]
[
] [
] [
]
with:
[
] [
]
39
here y is an ordered vector of phenotypes for WBSF and EV, is a vector of fixed effect
solutions, is a vector of random animal effect solutions, and is a vector of
permanent environmental random effect solutions. X and Z are block diagonal matrices
of incidence matrices relating animals to fixed effects and random effects, respectively. S
is a block diagonal matrix of incidence matrices relating animals to permanent
environmental random effects describing the covariance among repeated phenotypes
within animal, and G is the additive genetic variance and covariance matrix. A-1
is the
inverse of the numerator relationship matrix. R-1
is the inverse of the residual variance
and covariance matrix.
The reduced model (Model 4) included the same 1,871 animals as Model 3. APSF
was calculated from the 8,690 WBSF values on 1,204 animals, and the same 998 animals
with at least one EV observation from Model 3 were analyzed as a repeated record trait.
This model followed the same parameterization as previously described for Model 2, but
was applied to a reduced dataset. The variance components for APSF and EV were
estimated using the model previously described in Model 2. A comparison of BIC values
was used to determine whether the full (Model 3) or the reduced model (Model 4)
provided the best data fit (Gilmour et al., 2006).

40
Results and Discussion
Table 2.2 shows the count of observations for each trait used in each statistical
model. Wheeler et al. (1997) concluded that steak tenderness was considered acceptable
to consumers if it was less than 4.30-kg and unacceptable if greater than this amount. The
APSF in this dataset ranged from an acceptable (1.43-kg) to an unacceptable (6.61-kg)
and was nearly normally distributed as demonstrated in Figure 2.1. Average peak shear
force measurements in other studies were 4.41-kg and 4.49-kg in purebred Angus and
Simmental herds, respectively (Burrow et al., 2001). A low percentage (6%) of the steaks
in this study would have been considered unsatisfactory by consumers. In retail, 2 to 11%
of the steaks are classified as unsatisfactory, because the APSF exceeds 4.30-kg (Savell
et al., 2006; Wheeler et al., 1997).
Behrends et al. (2009) recorded EV1 in the range from 1.19 to 5.85-m/s and EV2
to range from 1.01 to 5.24-m/s in Bos indicus cattle. Exit velocity 1 ranged from 0.07 to
4.48-m/s, and EV2 ranged from 0.09 to 4.63-m/s. The EV data were slightly bimodal,
shown in Figure 2.2, but no transformation to the data was preformed, therefore a normal
distribution was assumed. Phenotypic means and standard deviations for EV1, EV2, and
APSF were 1.74 ± 0.76-m/s, 1.65 ± 0.79-m/s, and 3.74 ± 1.08-kg, respectively. In Bos
indicus crossed breeds, the standard deviation was found to be higher for the second
measurement, but this was not seen in this dataset. Bos indicus cattle are known to have
poorer temperaments than Bos taurus cattle and therefore may have less ability to
habituate to handling. The dataset used in this study contains only Bos taurus animals
which had similar EV and standard deviation observations at both observation times.

41
Reverter et al. (2003) found phenotypic correlations between FT and APSF were near
zero and supported by this data (Figure 2.3).

42
Exit Velocity Models
The EV models were examined to determine the best fit model for the multiple
EV observations. Results from Model 1 (tri-variate animal model) are shown in Table 2.3
and are in agreement with previous genetic correlation estimates between EV1 and EV2
which range from 0.60 to 0.78 in Bos indicus crossbreds (Burrow and Dillion, 1997). The
strong correlations between EV measurements in Model 2 were of interest. Model 2
estimated near zero phenotypic and genetic correlation between APSF and EV, as shown
in Table 2.4. Heritability estimates were 0.19 ± 0.06 and 0.39 ± 0.09 for APSF and EV,
respectively. The comparison of Bayesian Information Criteria (BIC) values was used to
conclude that Model 2, the two trait model with EV as a repeated record is preferred over
Model 1 (Table 2.7). Burrow and Dillion (1997) also concluded that FT was best
analyzed as a repeated record. Behrends et al. (2009) found genetic correlations of 0.24
and 0.35 between EV and APSF using two EV measurements. The genetic correlation
between FT and APSF was -0.42 when FT was taken post-weaning and -0.32 when FT
was taken at the start of finishing. Reverter et al. (2003) and Kadel et al. (2006) reported
a near zero phenotypic correlation between APSF and FT. The lower genetic correlations
estimated in these studies suggest that Bos taurus breeds do not behave the same as do
Bos indicus crossed breeds. Exit velocity has a heritability of 0.40 in Bos indicus breeds,
0.36 in the Canadian Beef Cattle Reference herd, and 0.35 among Bos taurus breeds
(Burrow and Corbet, 2000; Beckman et al., 2007). When EV is taken at weaning, Burrow
et al. (1988) found a heritability of 0.54 in Bos indicus breeds. Other studies have found
similar heritability estimates for temperament using EV; 0.49 in Bos taurus breed crosses
43
and 0.31 in Bos taurus and Bos indicus breed crosses (Johnston et al., 2003a; Reverter et
al., 2003; Kadel et al., 2006; Nkrumah et al., 2007). Animals with higher Bos indicus
content tend to have a higher heritability for temperament (Burrow and Corbet, 2000)
than Bos taurus breeds.

44
Warner-Bratzler Shear Force Models
The previous two statistical models analyzed EV as two correlated traits and as a single
trait with repeated records. The repeated record model provided a better fit. This result
motivated to consider WBSF in a similar fashion. Warner-Bratzler shear force is recorded
as multiple core values taken from the same steak. The following models analyze WBSF
as a single observation of average peak shear force (APSF), and as a repeated record
(WBSF) to determine the best fit for WBSF observations. The dataset was reduced to
include only animals that have multiple WBSF core value observations, as previously
explained. Four to 12 steak cores, an average of 7.52 cores, were taken from the 1,871
animals. Model 3 (WBSF and EV as repeated records) estimated near zero phenotypic
and genetic correlations between WBSF and EV. Heritability for WBSF was near zero,
but EV was moderately heritable, as shown in Table 2.5. Model 4 (APSF, EV as repeated
record) estimates were similar to results of Model 3, as shown in Table 2.6. The
phenotypic and genetic correlations are near zero, as estimated in the previous models,
Model 1 and Model 2 where EV was analyzed as a single record or repeated record,
respectively. Heritability for WBSF and APSF was near zero in both models, and because
the same EV observations were used in both Models 3 and 4, heritability estimates were
equivalent. The comparison of BIC values was used to conclude that Model 4 is preferred
over Model 3 (Table 2.7). The APSF or WBSF heritability estimates for Models 3 and 4
were near zero. Given the results from Models 1 and 2 which included more
observations, the lower heritability is most likely due to data sampling issues. There is a
trend for Simmental cattle to have lower heritability for WBSF. Minick et al. (2004)

45
found Angus-sired steers to have a heritability of 0.33 ± 0.25, while records on
Simmental-sired steers yielded a lower heritability (0.16 ± 0.14) estimate for APSF.
There is a close agreement between heritability estimates (0.31 ± 0.03) found in
temperate and tropically adapted breeds of cattle (Burrow et al., 1988; Burrow and
Corbet, 2000; Johnston et al., 2003a). Another paper estimated the heritability of APSF in
Simmental-sired cattle to be 0.08 (McClure et al., in press). Repeatability of WBSF was
estimated from Model 3 to be 0.85 and 0.84 for EV. The repeatability of FT in a Bos
indicus crossbred study was estimated to be 0.88 ± 0.01 (Burrow and Dillion, 1997).
These results suggest that only small increases in accuracy could be expected through the
use of repeated measures of EV.
While there is a strong genetic relationship between APSF and EV in Bos indicus
crossbred steers (Behrends et al., 2009; Burrows et al., 2001; Johnston 2003b), this study
found almost no relationship in Bos taurus. The near zero phenotypic and genetic
correlations estimated between beef tenderness and temperament in Bos taurus cattle
suggest that producers can select to improve either trait without observing a correlated
response in the other. The lack of any genetic relationship also means that producers
should not use EV as an indicator trait for WBSF. Selection for lower EV is not expected
to result in improvement in WBSF.
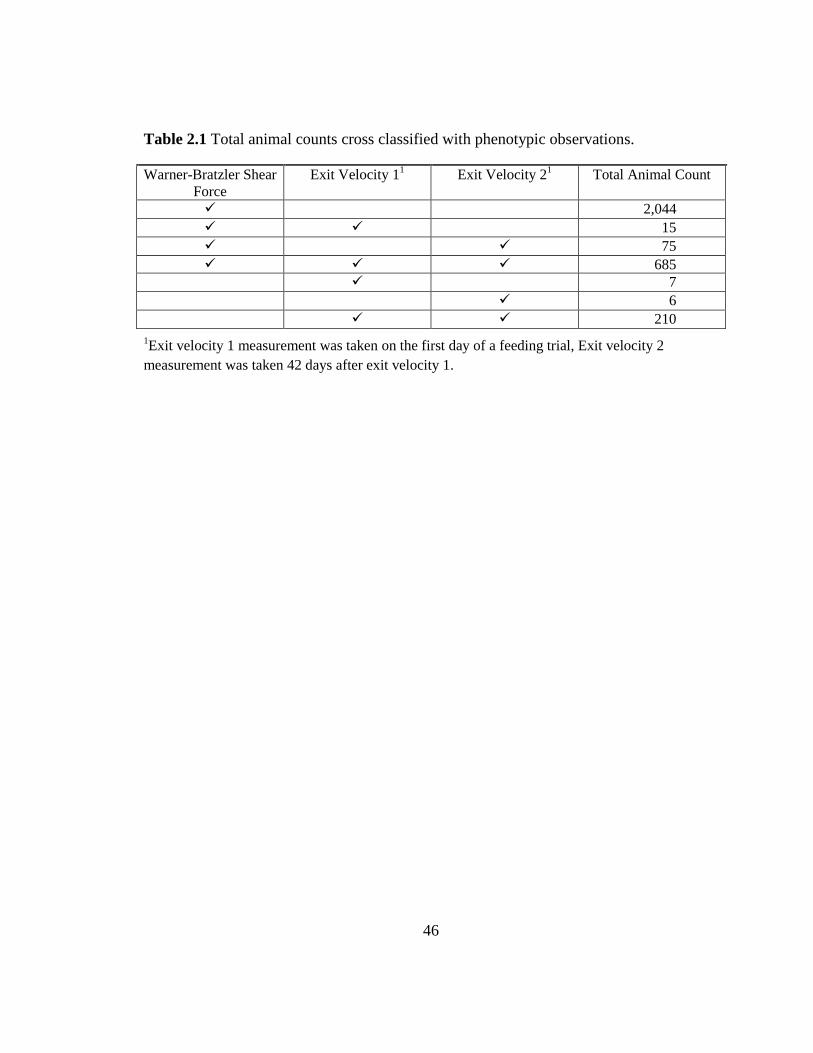
46
Table 2.1 Total animal counts cross classified with phenotypic observations.
Warner-Bratzler Shear
Force
Exit Velocity 11
Exit Velocity 21
Total Animal Count
2,044
15
75
685
7
6
210
1Exit velocity 1 measurement was taken on the first day of a feeding trial, Exit velocity 2
measurement was taken 42 days after exit velocity 1.

47
Table 2.2. Statistical models used to analyze average peak shear force (APSF), Warner-
Bratzler shear force (WBSF), exit velocity 1 (EV1)1, and exit velocity 2 (EV2)
2 and the
corresponding number of observations for each trait.
Statistical
Model3
Animals
with
Records in
Performance
File
Contemporary
Groups
WBSF
Core
Values
APSF Animals
with
WBSF
Cores
of
APSF
EV1 EV2 Animals
with
One or
More
EV
Model 1 3,042 176 2,819 917 976 998
Model 2 3,042 176 2,819 917 976 998
Model 3 1,871 128 8,690 1,204 917 976 998
Model 4 1,871 128 1,204 1,204 917 976 998
1 Exit velocity 1 measurements were taken the first day of a feeding trial.
2 Exit velocity 2 measurements were taken 42 days after exit velocity 1 (EV 1).
3 Model 1 (n = 3,042) was a tri-variate animal model including APSF, EV1, and EV2.
Model 2 (n = 3,042) analyzed APSF and exit velocity as a repeated record of EV1 and EV2.
Model 3 (n = 1,871) analyzed WBSF and EV as repeated record.
Model 4 (n = 1,871) analyzed APSF and EV as a repeated record.

48
Table 2.3. Model 11 estimates of heritability, phenotypic and genetic correlations
2 ±
standard error between average peak shear force (APSF), exit velocity 1 (EV1), and exit
velocity 2 (EV2)3.
APSF EV1 EV2
APSF 0.19 ± 0.06 -0.05 ± 0.05 -0.03 ± 0.04
EV1 0.02 ± 0.38 0.30 ± 0.11 0.59 ± 0.02
EV2 -0.30 ± 0.36 0.99 ± 0.07 0.25 ± 0.10
1 Model 1 (n = 3,042) was a tri-variate animal model which analyzed APSF, EV1, and EV2 as
single trait variables.
2 Phenotypic correlations are shown in the upper right portion of the table, genotypic correlations
are in the bottom left portion of the table, and heritability estimates are shown on the diagonal.
3 A log likelihood value of -6,662.71 was estimated at convergence.

49
Table 2.4. Model 21 estimates of heritability, phenotypic and genetic correlations
2 ±
standard error between average peak shear force (APSF) and exit velocity (EV)3.
APSF EV
APSF 0.19 ± 0.06 -0.08 ± 0.06
EV -0.10 ± 0.20 0.39 ± 0.09
1 Model 2 (n = 3,029) was a bivariate animal model which analyzed APSF as a single trait and EV
as a repeated record trait.
2 Phenotypic correlations are shown in the upper right corner of the table, genotypic correlations
are in the bottom left corner of the table, and heritability estimates are shown on the diagonal.
3 A log likelihood value of -6,575.00 was estimated at convergence.

50
Table 2.5. Model 31 estimates of heritability, phenotypic and genetic correlations ±
standard error between Warner-Bratzler shear force (WBSF) and exit velocity (EV).
WBSF EV
WBSF 0.06 ± 0.05 -0.09 ± 0.06
EV -0.63 ± 0.47 0.38 ± 0.09
1 Model 3 (n = 1,871) used a reduced dataset and analyzed WBSF as a repeated record and EV as
a repeated record.
2 Phenotypic correlations are shown in the upper right corner of the table, genotypic correlations
are in the bottom left corner of the table, and heritability estimates are shown on the diagonal.
3 A log likelihood value of -3,703.94 was estimated at convergence.
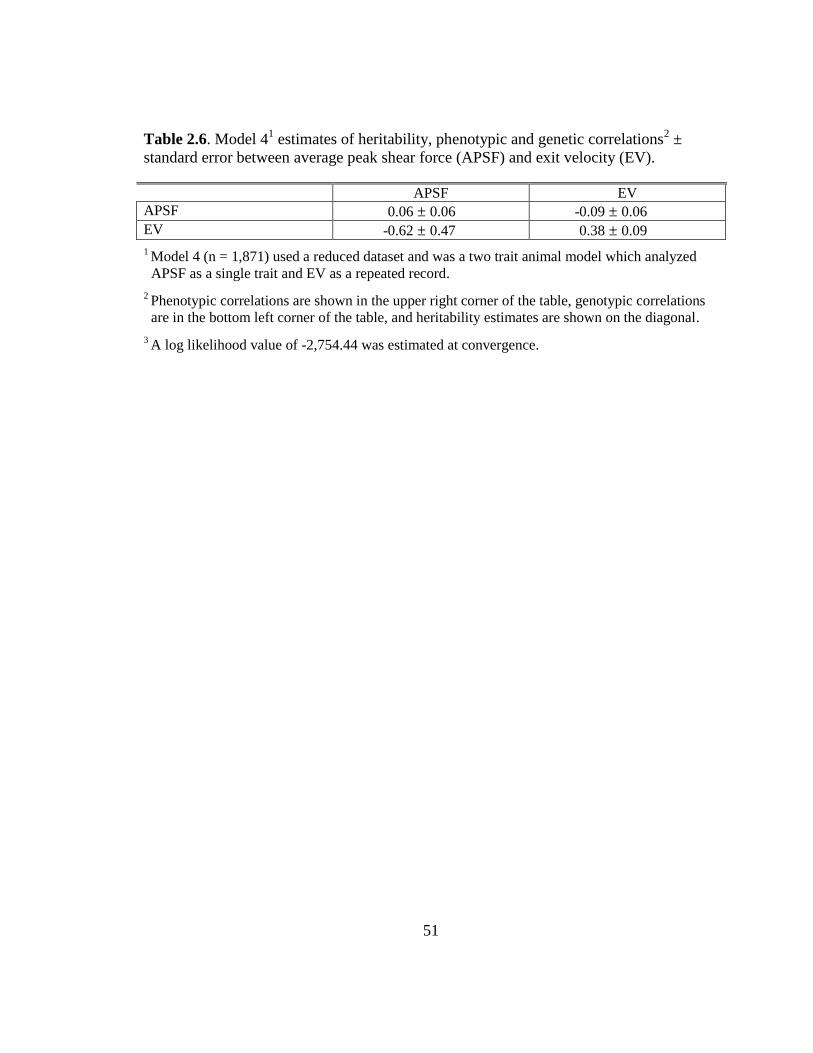
51
Table 2.6. Model 41 estimates of heritability, phenotypic and genetic correlations
2 ±
standard error between average peak shear force (APSF) and exit velocity (EV).
APSF EV
APSF 0.06 ± 0.06 -0.09 ± 0.06
EV -0.62 ± 0.47 0.38 ± 0.09
1 Model 4 (n = 1,871) used a reduced dataset and was a two trait animal model which analyzed
APSF as a single trait and EV as a repeated record.
2 Phenotypic correlations are shown in the upper right corner of the table, genotypic correlations
are in the bottom left corner of the table, and heritability estimates are shown on the diagonal.
3 A log likelihood value of -2,754.44 was estimated at convergence.
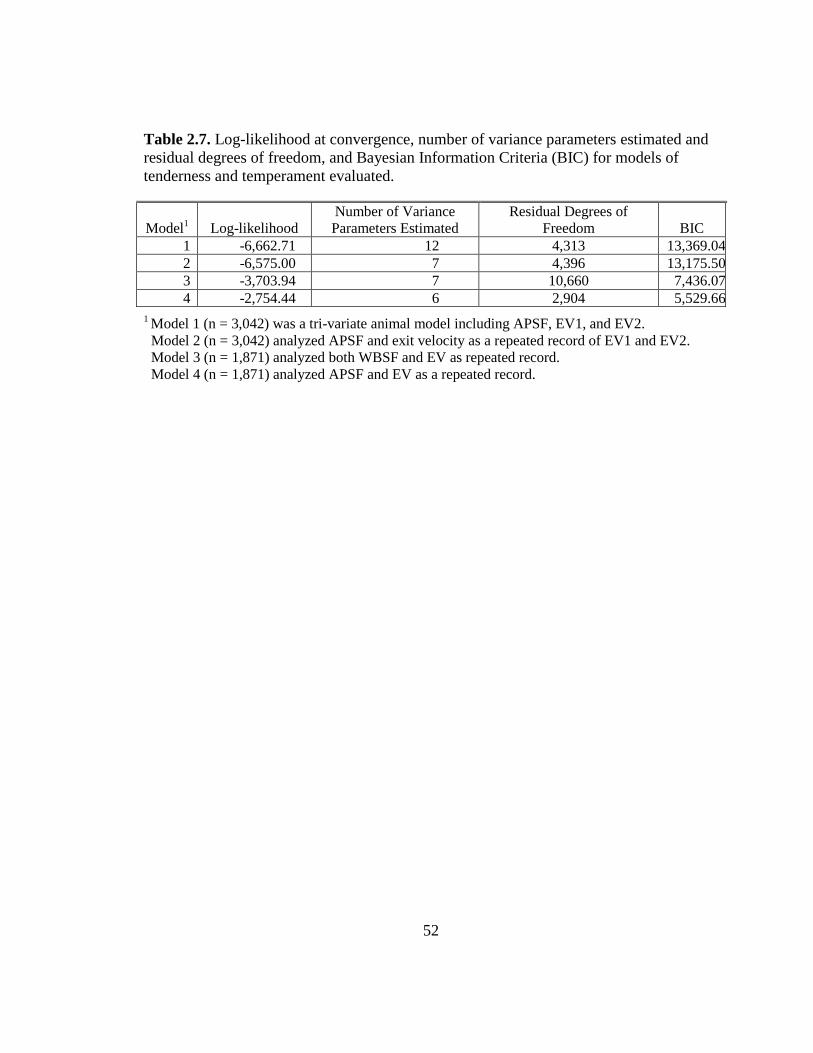
52
Table 2.7. Log-likelihood at convergence, number of variance parameters estimated and
residual degrees of freedom, and Bayesian Information Criteria (BIC) for models of
tenderness and temperament evaluated.
Model1
Log-likelihood
Number of Variance
Parameters Estimated
Residual Degrees of
Freedom BIC
1
-6,662.71 12 4,313 13,369.04
2
-6,575.00 7 4,396 13,175.50
3
-3,703.94 7 10,660 7,436.07
4
-2,754.44 6 2,904 5,529.66
1 Model 1 (n = 3,042) was a tri-variate animal model including APSF, EV1, and EV2.
Model 2 (n = 3,042) analyzed APSF and exit velocity as a repeated record of EV1 and EV2.
Model 3 (n = 1,871) analyzed both WBSF and EV as repeated record.
Model 4 (n = 1,871) analyzed APSF and EV as a repeated record.

53
Figure 2.1. Histogram of average peak shear force (APSF) demonstrating the normal
distribution of the phenotypic observations in the data. The dotted gray lines
indicate very tender ( < 3.2-kg), tender (3.2-kg to 3.9-kg), intermediate (3.9-kg to
4.6-kg), and tough ( > 4.6-kg) steaks according to Savell et al. (2006).
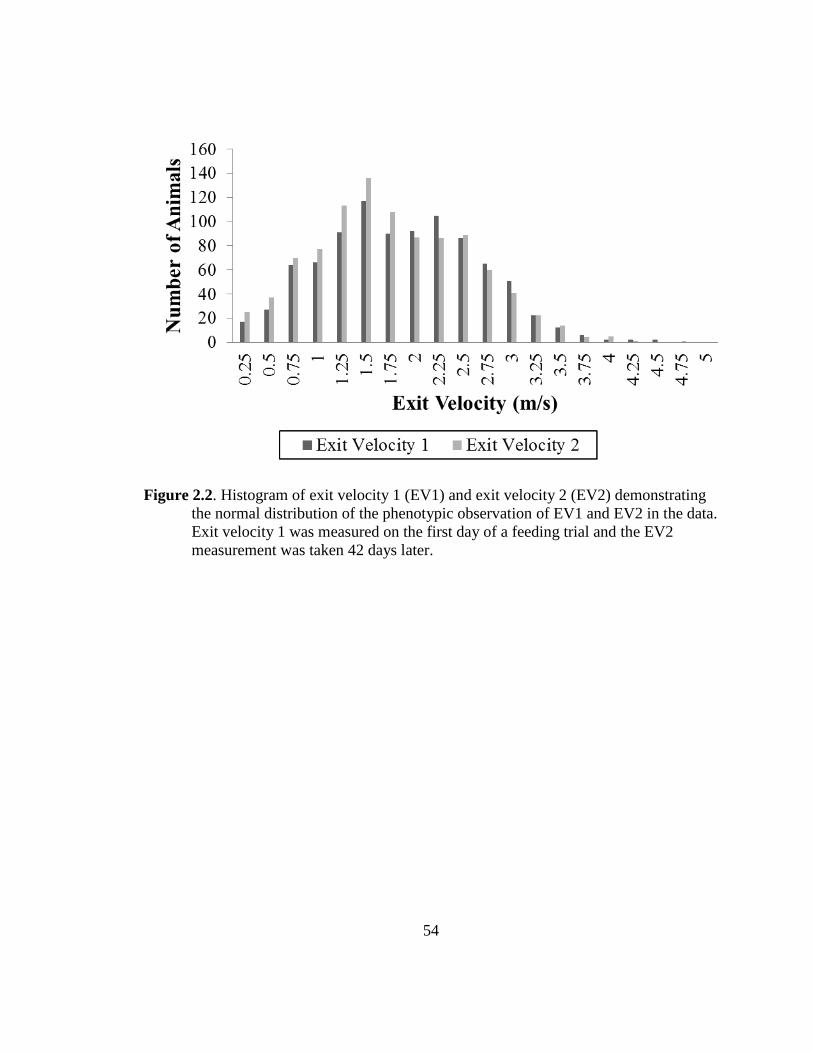
54
Figure 2.2. Histogram of exit velocity 1 (EV1) and exit velocity 2 (EV2) demonstrating
the normal distribution of the phenotypic observation of EV1 and EV2 in the data.
Exit velocity 1 was measured on the first day of a feeding trial and the EV2
measurement was taken 42 days later.
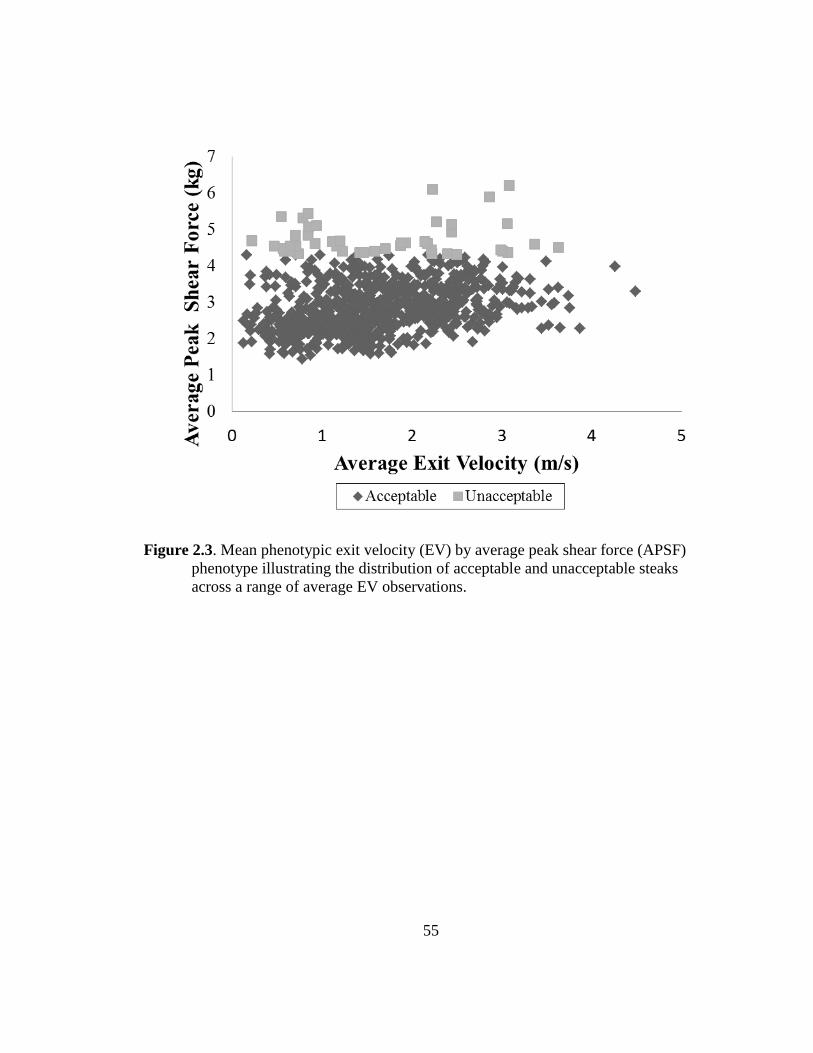
55
Figure 2.3. Mean phenotypic exit velocity (EV) by average peak shear force (APSF)
phenotype illustrating the distribution of acceptable and unacceptable steaks
across a range of average EV observations.
56
CHAPTER 3
GWAS FOR TEMPERAMENT AND TENDERNESS
TRAITS
Summary
A genome-wide association study (GWAS) was conducted for temperament and
beef tenderness traits utilizing genotypes generated by the Illumina BovineSNP50
BeadArray (San Diego, CA, USA; Matikumalli et al., 2009) to identify single-nucleotide
polymorphism (SNP) markers associated with phenotypic variation in exit velocity (EV;
temperament) and average peak shear force (APSF; tenderness) measurements. Two
Bayesian statistic models were used to estimate the proportion of markers, heritability,
and accuracy of SNP prediction equations (estimated as correlations between predicted
and true breeding value) developed in randomly assigned training populations. A three-
fold cross validation procedure was utilized for development of prediction equations
using training and validation populations. Bayes-C assumed that all SNP markers were
drawn from a population of markers with the same variance, and used all available
markers in the analysis. Bayes-Cπ assumed independent variances for each SNP marker
57
with estimates of variance produced for the (1 - π) proportion of markers with significant
effects. The remaining proportion, p, was assumed to have no effect on phenotype.
Temperament was measured as EV and recorded via two methods; (1) a single
measurement was analyzed as a phenotype and (2) the second as a difference between
two repeated EV measurements, spaced over 42 days, to analyze habituation to handling.
The GWAS revealed that for both EV and habituation, 2 (0.006%) of SNP markers from
the Illumina BovineSNP50 BeadArray contributed significantly to the additive genetic
variance for these traits. Heritability estimates varied between the two Bayesian models.
The EV heritability ± standard error estimates were 0.23 ± 0.0003 for the Bayes-C model
and 0.04 ± 0.00008 for Bayes-Cπ model. Habituation heritability ± standard error
estimate was 0.10 ± 0.0001 and 0.02 ± 0.00006 for the Bayes-C and Bayes-Cπ models,
respectively. The accuracy of molecular breeding value (MBV) predictions developed
during the training phase and evaluated in the validation dataset for EV averaged 0.45
(Bayes-Cπ), and near zero for habituation. Tenderness was measured by Warner-Bratzler
shear force (WBSF), and reported as APSF, the mean of WBSF produced on multiple
steak core samples. The variation in APSF was associated with 70 (0.167%) of the
markers on the Illumina BovineSNP50 BeadArray. Heritabilities for APSF were similar
between the two Bayesian models; 0.15 ± 0.002 (Bayes-C), 0.13 ± 0.0002 (Bayes-Cp).
Accuracy of MBVs for APSF was 0.27 in the three-fold validation. Correlations for both
EV and APSF were 0.10, and the correlation for habituation was zero.

58
Introduction
The Illumina BovineSNP50 BeadArray (San Diego, CA, USA; Matikumalli et al.,
2009) has been used by researchers to conduct genome-wide association studies (GWAS)
for a variety of traits in cattle. Cattle temperament is an often over looked trait for genetic
improvement. Docile temperaments can be beneficial to a production system. Calmer
animals adapt more easily and become less stressed with repeated handling as well as
pose fewer problems to handlers, farm equipment, and the animal’s safety (Grandin,
1997). Exit velocity, first explored by Burrow et al. (1988) is a reliable measure of
temperament. Beef tenderness, measured as Warner-Bratzler Shear Force, has been
evaluated across breeds and institutions. Beef tenderness influences beef quality,
palatability, and overall eating satisfaction, so much so that consumers are willing to pay
a premium for a tender steak (Lusk et al., 2001; Platter et al., 2005; McClure et al., in
press).
To allow beef producers to efficiently select for improvement in temperament or
tenderness using genetic markers, GWAS must be reliable and accurately predict the
genetic variation in the trait of interest. The primary objective of this study was to
conduct a GWAS to detect single-nucleotide polymorphism markers associated with
temperament or tenderness in Simmental × Angus crossbred cattle.
59
Materials and Methods
The animals (n = 3,042) used in Chapter 2 were reduced 1,432 animals on the
basis of the availability of at least one EV observation and/or WBSF observations for
each steak core. Animals were chosen for genotyping to represent an even distribution of
WBSF values. All animals were progeny of Simmental sires and Angus dams.
Temperament was measured as exit velocity (EV). Exit velocity is the rate (m/s) at which
animals exit the working chute and cover a distance of 1.7-m (Burrow et al., 1988; Curley
et al., 2006). The elapsed time is recorded in hundredths of a second by a simple
electronic system. Two light beams are focused on infra-red sensors spaced at the chute
(head bail) and 1.7-m away from the head bail. The sensors have an on/off mechanism, so
that as the animal breaks the light beam, the timing apparatus stops and a connected
computer records the time (Burrow et al., 1988; Curley et al., 2006; Beckman et al.,
2007). The elapsed time required for the animal to pass between the two sets of infra-red
sensors is recorded, and is termed the animal’s flight time (FT). Exit velocity is computed
as the distance traversed divided by FT and is reported as m/s (Beckman et al., 2007).
Each animal had the potential to have two EVs, one (EV1) indicating day one, and the
second (EV2) was measured on day 42 of the feeding period.
The protocol used for all Warner-Bratzler shear force (WBSF) measurements
followed the protocol outlined by Dikeman et al. (2005), which closely follows all of the
American Meat Science Association (AMSA) recommendations as well as the proposed
shear force procedures for meat tenderness measurements (Wheeler et al., 2005). The
longissimus dorsi (LD) muscle was collected at the slaughter plant, and once returned to

60
the research institution 2.54-cm steaks were cut and immediately vacuum-packaged. The
steaks were aged at 2°C for 14 days, thawed for 24 hours, and then then cooked on a
convection conveyor oven (XLT Oven Model 1832-EL, BOFI, Inc., Wichita, KS) to an
internal temperature of 71°C (medium degree of doneness). After the steaks were taken
from the conveyor oven, internal temperatures were measured with a hand-held
thermometer with a wire thermocouple (HH-21, Omega Engineering, Stamford, CT
USA), and after the post-cooking temperature rise was complete, this temperature was
recorded in order to adjust the WBSF measurement. The steaks were chilled at 2°C for 24
hours and an average of eight 1.27-cm steak cores were removed parallel to the muscle
fiber orientation using a hand-held coring device. Each core was then sheared using a
United-Smart 1 Test System SSTM–500 (United Calibration Crop., Huntington Beach,
CA) with a head speed of 250-mm/min, and shear force was recorded. Core shear force
values were averaged and reported as average peak shear force (APSF), which was used
in the analysis.
All DNA samples were genotyped at GeneSeek with the Illumina BovineSNP50
BeadArray (San Diego, CA, USA; Matikumalli et al., 2009) for 54,790 SNPs. The
resulting genotypes were then filtered to remove markers with a minor allele
frequency < 0.05, or were not mapped to chromosomes on the University of Maryland
sequence assembly (UMD3.1; Zimin et al., 2009). Subsets of the samples were genotyped
on versions 1 and 2 of the Illumina BovineSNP50 BeadArray and markers present on
both versions of the array were extracted for use in the GWAS. Genotypes were
processed through FastPHASE v 1.4.0 (FastPHASE; Scheet and Stephens, 2006) to

61
estimate haplotypes and missing genotypes. The number of clusters was set to 20, and the
command used was fastPHASE –T10 –K20 –eo –oFP_0101.OUT fastphase0101.inp.
After editing the genotypes, the dataset contained 42,351 SNPs for analysis.
Phenotype files were created to analyze all traits. Two EV phenotype files were
created. Results from the Chapter 2, which includes the animals in this study, estimated a
genetic correlation of 0.99 ± 0.07, and the phenotypic variance was similar between EV1
and EV2. The records for EV1 ranged from 0.07 to 4.48-m/s and 0.09 to 4.63-m/s for
EV2. The mean for both EV1 and EV2 was 1.70-m/s. Therefore, the first EV phenotype
used EV1 if it was present. If EV1 was not recorded, EV2 was used, and animals without
any EV measurement were deleted from the temperament phenotype file. This EV
phenotype file contained 734 animals. The variation in this phenotype file was used to
associate temperament with quantitative trait loci (QTL) in the genome. The second
temperament file was created from animals that had both EV1 and EV2 measurements.
Exit velocity 2 was subtracted from EV1 to produce a habituation score, and the file
contained 587 animals. The variation in this phenotype file was used to associate
habituation to human handling to QTLs in the genome. An APSF phenotype file was
created which contained 1,096 animals. Variation in APSF was associated with QTLs in
the genome. Uniform contemporary groups (CG) were assigned based on common year
of birth and herd of origin. Contemporary groups including a single animal were removed
from analysis, resulting in 599, 575, and 957 animals in the EV, habituation, and APSF
phenotype files, respectively.
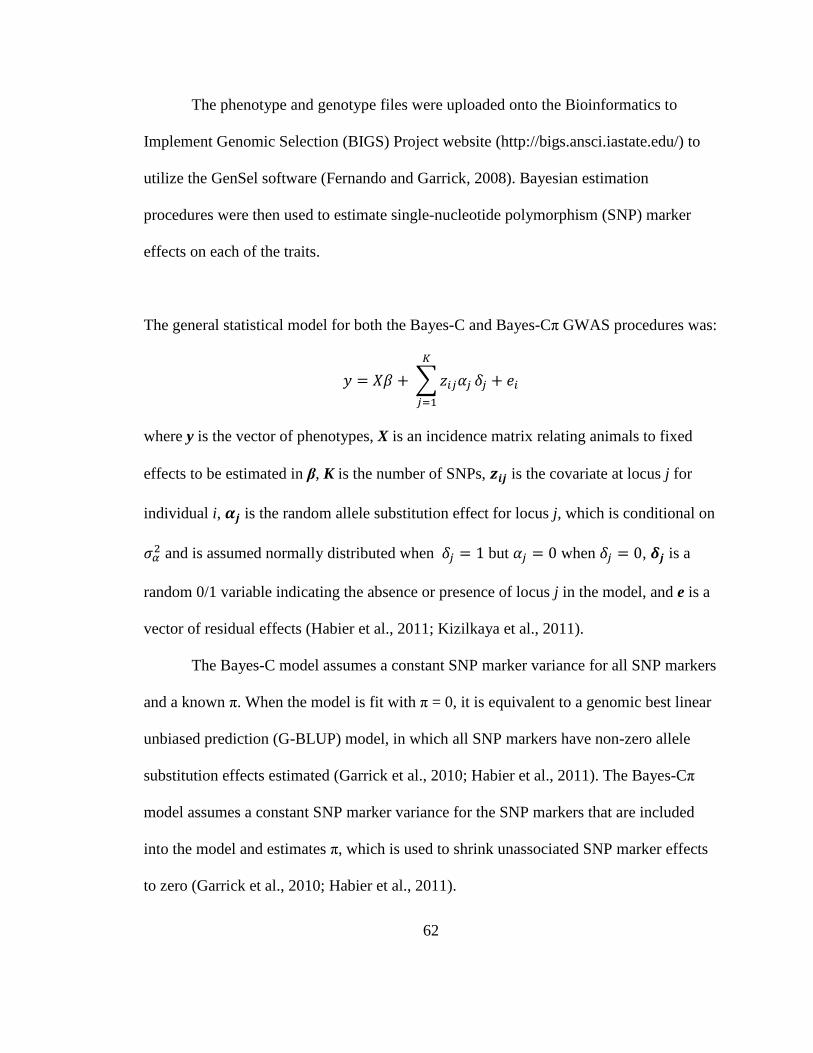
62
The phenotype and genotype files were uploaded onto the Bioinformatics to
Implement Genomic Selection (BIGS) Project website (http://bigs.ansci.iastate.edu/) to
utilize the GenSel software (Fernando and Garrick, 2008). Bayesian estimation
procedures were then used to estimate single-nucleotide polymorphism (SNP) marker
effects on each of the traits.
The general statistical model for both the Bayes-C and Bayes-Cπ GWAS procedures was:
∑
where y is the vector of phenotypes, X is an incidence matrix relating animals to fixed
effects to be estimated in β, K is the number of SNPs, is the covariate at locus j for
individual i, is the random allele substitution effect for locus j, which is conditional on
and is assumed normally distributed when but when , is a
random 0/1 variable indicating the absence or presence of locus j in the model, and e is a
vector of residual effects (Habier et al., 2011; Kizilkaya et al., 2011).
The Bayes-C model assumes a constant SNP marker variance for all SNP markers
and a known π. When the model is fit with π = 0, it is equivalent to a genomic best linear
unbiased prediction (G-BLUP) model, in which all SNP markers have non-zero allele
substitution effects estimated (Garrick et al., 2010; Habier et al., 2011). The Bayes-Cπ
model assumes a constant SNP marker variance for the SNP markers that are included
into the model and estimates p, which is used to shrink unassociated SNP marker effects
to zero (Garrick et al., 2010; Habier et al., 2011).
63
All phenotypes were analyzed using both the Bayes-C and Bayes-Cπ methods,
and contained CG as a fixed effect. Five analyses under both Bayesian models for each
phenotype were completed using various random number seeds to initialize the Markov
chains. The random number seed affects the SNP markers that are allocated at random to
the model to test their effects. A total of 160,000 Markov chain Monte Carlo (MCMC)
iterations, with a burn-in of 1,000 iterations, were completed for each analysis. Results
from each analysis included posterior distributions for the effects of each of the 42,351
SNP markers, and posterior means for the fixed effects which were used to correct the
trait values to phenotypes before the training and validation processes were executed. The
resulting phenotype file is corrected for fixed effects and mean zero. The animals in the
adjusted phenotype files were then randomly subdivided into thirds. Model training was
done in two-thirds of the data, and cross validation in the other third. Training and cross
validation was completed in five different random subdivisions of animals for each
phenotype. By changing the random number seed and reallocating animals into different
training and validation populations, the chance of Type-I errors are reduced, making it
less likely for a false discovery of associated SNP markers. The random number seed
affects the SNP markers that are allocated to the model at random to test their effect. By
subdividing the training and validation populations, the phenotypic variance is partitioned
differently. Only SNP markers with true large effects will be associated with the variation
in the trait in each analysis.
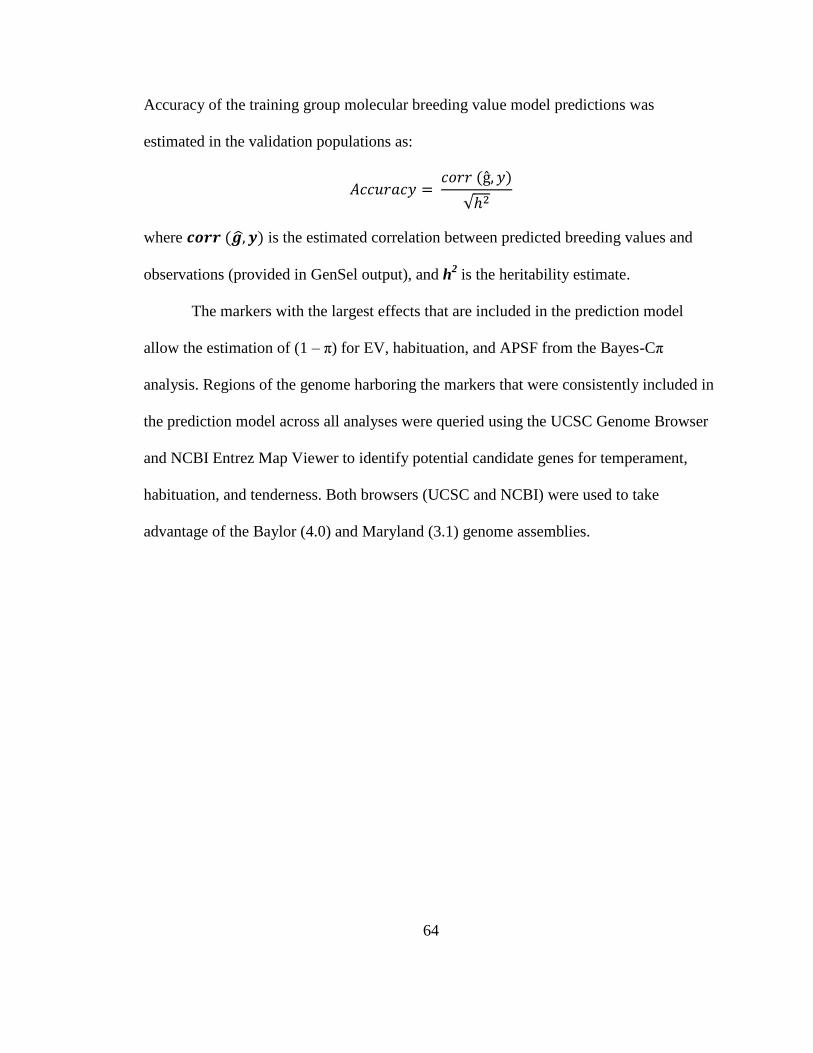
64
Accuracy of the training group molecular breeding value model predictions was
estimated in the validation populations as:
√
where is the estimated correlation between predicted breeding values and
observations (provided in GenSel output), and h2 is the heritability estimate.
The markers with the largest effects that are included in the prediction model
allow the estimation of (1 – p) for EV, habituation, and APSF from the Bayes-Cp
analysis. Regions of the genome harboring the markers that were consistently included in
the prediction model across all analyses were queried using the UCSC Genome Browser
and NCBI Entrez Map Viewer to identify potential candidate genes for temperament,
habituation, and tenderness. Both browsers (UCSC and NCBI) were used to take
advantage of the Baylor (4.0) and Maryland (3.1) genome assemblies.
65
Results and Discussion
GWAS for EV and Habituation
Observations in EV ranged from 0.07 to 4.26-m/s and had an average of 1.80 ±
0.83-m/s. Chapter 2 contained 399 more EV observations (between EV1 and EV2) which
ranged from 0.07 to 4.63-m/s with an average in both EV1 and EV2 of 1.70 ± 0.76-m/s.
The habituation observations ranged from -2.32 to 4.76-m/s and averaged -0.15-m/s.
Table 3.1 reports the average posterior means for variance components estimated by the
Bayes-C and Bayes-Cπ models for the EV and habituation phenotypes. The Bayes-Cπ
model results were assessed for EV, and 2 (0.006%) of the 42,351 markers were
associated with variation in the EV phenotype. The 2 (0.006%) markers explained a fairly
low estimated heritability (0.04 ± 0.0008) for EV, as opposed a moderate heritability
(0.23 ± 0.0003) when all markers were included via the Bayes-C model. Chapter 2
consisted of a larger group (n = 3,029) of animals from which the animals in this study
were derived (n = 599). The heritability estimate of 0.39 ± 0.09 for EV was recorded in
Chapter 2. The decrease in heritability estimates is a direct reflection of having fewer
animals in the analysis. Results from the two studies support the conclusion that EV is
moderate to lowly heritable, verifying that EV is extremely environmentally influenced.
In other studies, the heritability of EV has been estimated to be of 0.35 among Bos taurus
breeds (Burrow and Corbet, 2000; Beckman et al., 2007). Other studies have found
similar heritability estimates for measurements of temperament using EV; 0.49 in Bos
taurus breed crosses (Nkrumah et al., 2007) and 0.31 in Bos taurus and Bos indicus breed
crosses (Johnston et al., 2003a; Reverter et al., 2003; Kadel et al., 2006). The habituation

66
phenotype had a low estimated heritability, which is expected due to the genetic
correlation of 0.99 seen in Chapter 2. The estimated heritability utilizing all of the
markers (Bayes-C) was 0.10 ± 0.0001, while the Bayes-Cπ analysis estimated that only 2
(0.006%) of the markers had significant effects and yielded a heritability of 0.02 ±
0.00006. Accuracy of the training group prediction on the validation populations for EV
ranged from 0.05 to 0.94, with a mean of 0.45, and are also shown in Table 3.2. The low
average accuracy is a direct reflection of having too few animals in the analysis.
Habituation accuracies are shown in Table 3.3. The accuracy from training and validation
populations are near zero.
The EV phenotype resulted in 2 (0.006%) of the 42,351 markers being associated
with the phenotypic variance. The 2 markers most commonly associated with EV were
located on BTA10 (UMD3.1 location 88,813,187 bp) and BTA12 (UMD3.1 location
30,967,371 bp). The habituation phenotype resulted in 2 (0.006%) of the 42,351 markers
being associated with the phenotypic variance. The SNP markers with the largest effect
on the habituation phenotype data were mapped to BTA8 (UMD3.1 location 82,922,937
bp) and BTA12 (UMD3.1 location 59,185,443). None of the markers were consistently
identified during analysis of all training populations, and there was no overlap of markers
between the EV and habituation phenotypes. This result indicates the dataset was too
small to consistently identify even the largest effect QTL in EV and habituation.
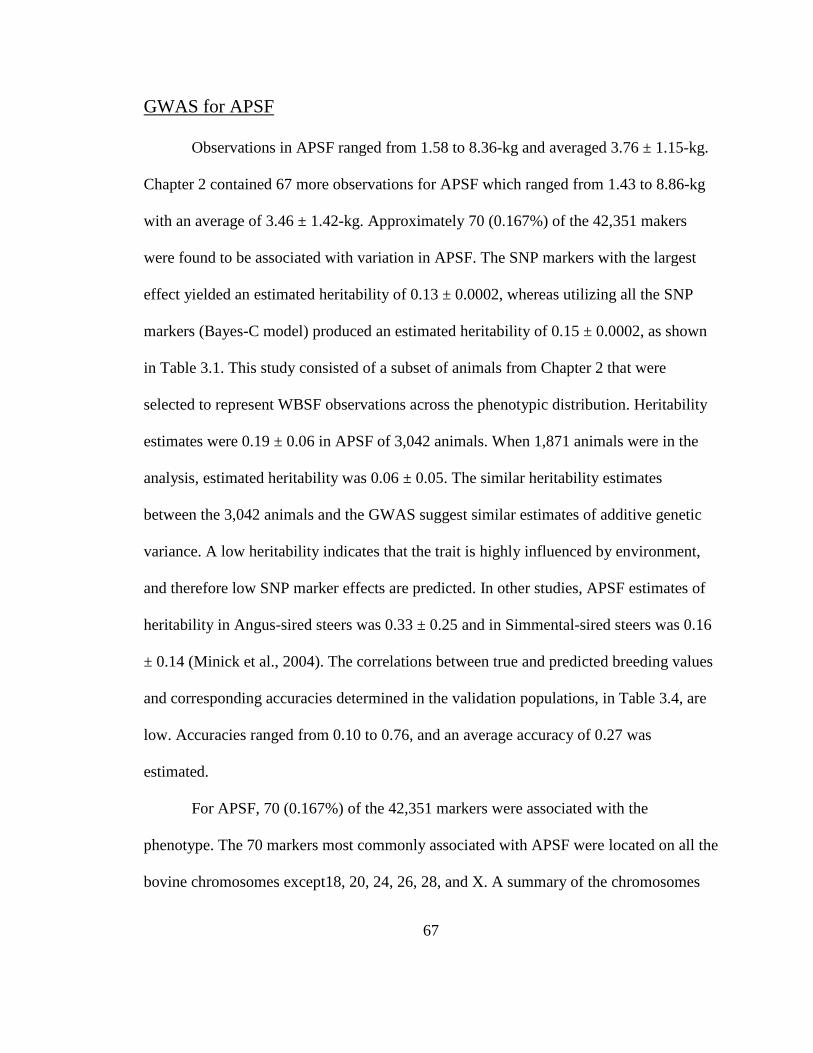
67
GWAS for APSF
Observations in APSF ranged from 1.58 to 8.36-kg and averaged 3.76 ± 1.15-kg.
Chapter 2 contained 67 more observations for APSF which ranged from 1.43 to 8.86-kg
with an average of 3.46 ± 1.42-kg. Approximately 70 (0.167%) of the 42,351 makers
were found to be associated with variation in APSF. The SNP markers with the largest
effect yielded an estimated heritability of 0.13 ± 0.0002, whereas utilizing all the SNP
markers (Bayes-C model) produced an estimated heritability of 0.15 ± 0.0002, as shown
in Table 3.1. This study consisted of a subset of animals from Chapter 2 that were
selected to represent WBSF observations across the phenotypic distribution. Heritability
estimates were 0.19 ± 0.06 in APSF of 3,042 animals. When 1,871 animals were in the
analysis, estimated heritability was 0.06 ± 0.05. The similar heritability estimates
between the 3,042 animals and the GWAS suggest similar estimates of additive genetic
variance. A low heritability indicates that the trait is highly influenced by environment,
and therefore low SNP marker effects are predicted. In other studies, APSF estimates of
heritability in Angus-sired steers was 0.33 ± 0.25 and in Simmental-sired steers was 0.16
± 0.14 (Minick et al., 2004). The correlations between true and predicted breeding values
and corresponding accuracies determined in the validation populations, in Table 3.4, are
low. Accuracies ranged from 0.10 to 0.76, and an average accuracy of 0.27 was
estimated.
For APSF, 70 (0.167%) of the 42,351 markers were associated with the
phenotype. The 70 markers most commonly associated with APSF were located on all the
bovine chromosomes except18, 20, 24, 26, 28, and X. A summary of the chromosomes
68
and marker locations are shown in Table 3.5. None of the markers were consistently
identified in all training populations. This result suggests that there was insufficient data
to consistently identify an effective QTL for APSF and that the SNP markers identified
maybe spurious. CAST (BTA7) and CAPN1 (BTA29) are the two most documented
genes with significant effect on WBSF, and were not found in the list of markers. This
may be because the number of animals in the analysis was too small to find an effect.
Alternatively, the animals in this analysis maybe fixed or have low variation in
haplotypes in the regions of these two genes. McClure et al. (in press) reports that the
CAST SNP included in the Illumina BovineSNP50 BeadArray explained a small
percentage (0.02%) of APSF phenotypic variation in Simmental cattle. The variation in
phenotype explained by the panel was subsequently lower in Simmental and Angus than
other breeds.
69
Conclusions
Like many studies in this area, the relatively small number of animals genotyped
substantially limits the ability of GWAS to identify genomic regions harboring QTL that
play major roles phenotypic variation. Results in Chapter 2, which included the pedigree
of these animals, reported a heritability estimate of temperament, when measured as an
EV, to be 0.39. The GWAS analysis, using fewer phenotypic records on a subset of
animals from Chapter 2, estimated the heritability to be 0.23. The estimate of APSF
heritability reported in Chapter 2 was 0.19, which is similar to the 0.15 heritability
estimates for APSF in this study. A recent study by McClure et al. (in press) estimated
the heritability of APSF in 516 Simmental animals to be 0.08 and in 651 Angus animals
to be 0.52. Information on these animals were also part of the Carcass Merit Project.
Accuracies of molecular breeding values are critical parameters for implementation of
genomic selection. Improved accuracies are required before any SNP markers on the
Illumina BovineSNP50 BeadArray are considered for selection to improve EV or APSF.
Due to the small sample size only 2 (0.006%) of the markers were found to
associate with the variation in EV, and 2 (0.006%) markers were associated with the
variation in habituation; however, 70 markers (0.167%) were associated with variation in
tenderness. Insufficient phenotypes were available to consistently identify QTL regions
underlying these traits. Similar additive genetic variance is seen in the APSF data
between Chapter 2 and this study, suggesting similar results if more phenotypes were
available.
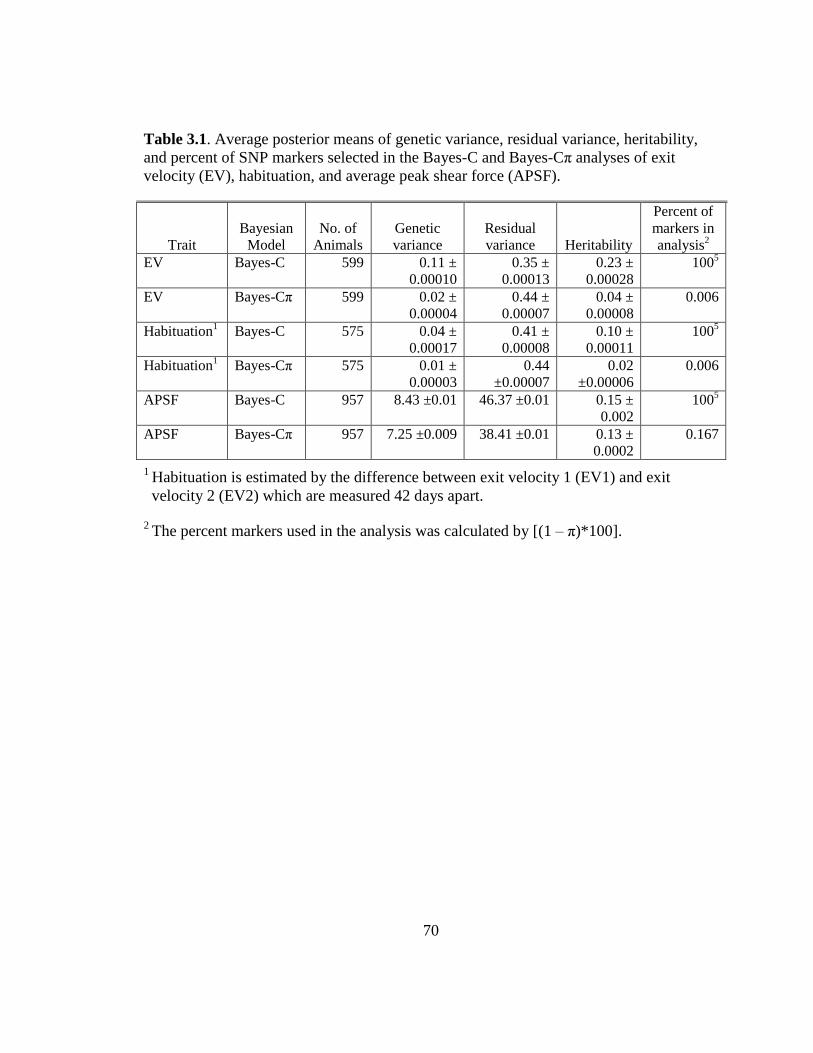
70
Table 3.1. Average posterior means of genetic variance, residual variance, heritability,
and percent of SNP markers selected in the Bayes-C and Bayes-Cp analyses of exit
velocity (EV), habituation, and average peak shear force (APSF).
Trait
Bayesian
Model
No. of
Animals
Genetic
variance
Residual
variance Heritability
Percent of
markers in
analysis2
EV Bayes-C 599 0.11 ±
0.00010
0.35 ±
0.00013
0.23 ±
0.00028
1005
EV Bayes-Cp 599 0.02 ±
0.00004
0.44 ±
0.00007
0.04 ±
0.00008
0.006
Habituation1 Bayes-C 575 0.04 ±
0.00017
0.41 ±
0.00008
0.10 ±
0.00011
1005
Habituation1 Bayes-Cp 575 0.01 ±
0.00003
0.44
±0.00007
0.02
±0.00006
0.006
APSF Bayes-C 957 8.43 ±0.01 46.37 ±0.01 0.15 ±
0.002
1005
APSF Bayes-Cp 957 7.25 ±0.009 38.41 ±0.01 0.13 ±
0.0002
0.167
1 Habituation is estimated by the difference between exit velocity 1 (EV1) and exit
velocity 2 (EV2) which are measured 42 days apart.
2 The percent markers used in the analysis was calculated by [(1 – p)*100].
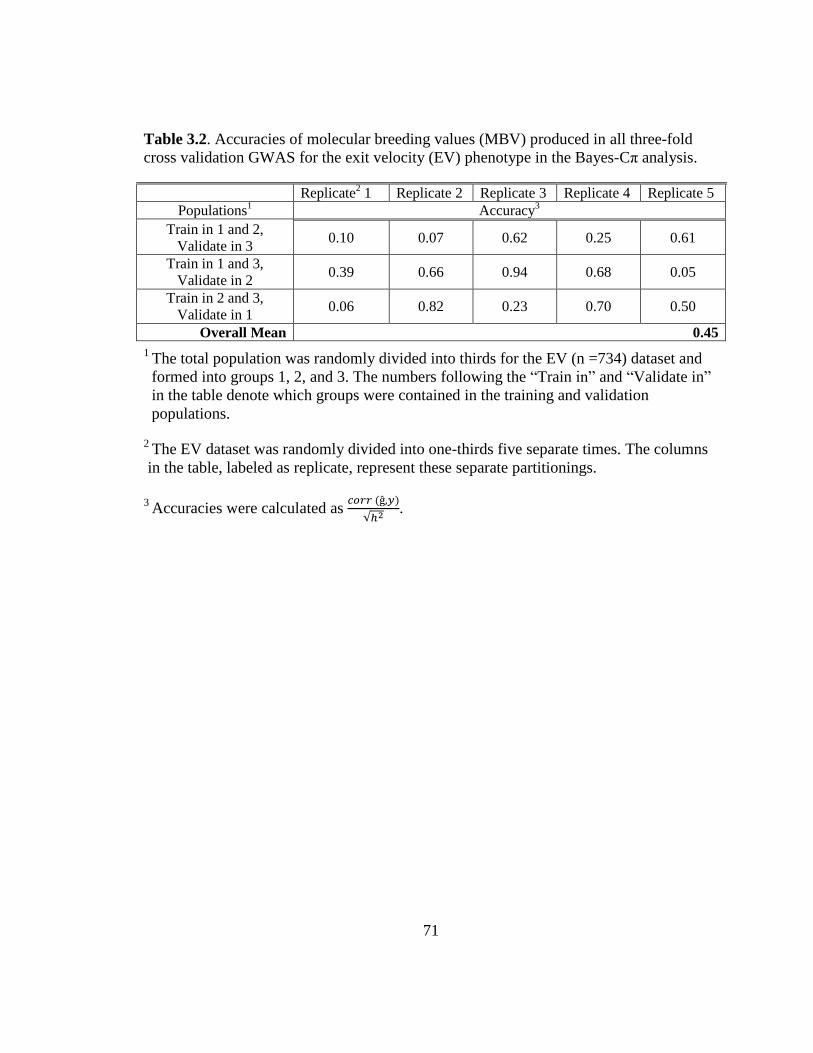
71
Table 3.2. Accuracies of molecular breeding values (MBV) produced in all three-fold
cross validation GWAS for the exit velocity (EV) phenotype in the Bayes-Cp analysis.
Replicate2 1
Replicate 2 Replicate 3 Replicate 4 Replicate 5
Populations1 Accuracy
3
Train in 1 and 2,
Validate in 3 0.10 0.07 0.62 0.25 0.61
Train in 1 and 3,
Validate in 2 0.39 0.66 0.94 0.68 0.05
Train in 2 and 3,
Validate in 1 0.06 0.82 0.23 0.70 0.50
Overall Mean 0.45
1 The total population was randomly divided into thirds for the EV (n =734) dataset and
formed into groups 1, 2, and 3. The numbers following the “Train in” and “Validate in”
in the table denote which groups were contained in the training and validation
populations.
2 The EV dataset was randomly divided into one-thirds five separate times. The columns
in the table, labeled as replicate, represent these separate partitionings.
3 Accuracies were calculated as
√ .

72
Table 3.3. Accuracies of molecular breeding values (MBV) produced in all three-fold
cross validation GWAS for the habituation phenotype in the Bayes-Cp analysis.
Replicate2 1
Replicate 2 Replicate 3 Replicate 4 Replicate 5
Populations1
Accuracy3
Train in 1 and 2,
Validate in 3 -0.05 -0.25 -0.10 0.75 -0.29
Train in 1 and 3,
Validate in 2 -0.09 0.46 0.52 0.43 -0.32
Train in 2 and 3,
Validate in 1 0.02 -0.41 -0.05 0.29 0.20
Overall Mean 0.07
1 The total population was randomly divided into thirds for the EV (n =587) dataset and
formed into groups 1, 2, and 3. The numbers following the “Train in” and “Validate in”
in the table denote which groups were contained in the training and validation
populations.
2 The EV dataset was randomly divided into one-thirds five separate times. The columns
in the table, labeled as replicate, represent these separate partitionings.
3 Accuracies were calculated as
√ .
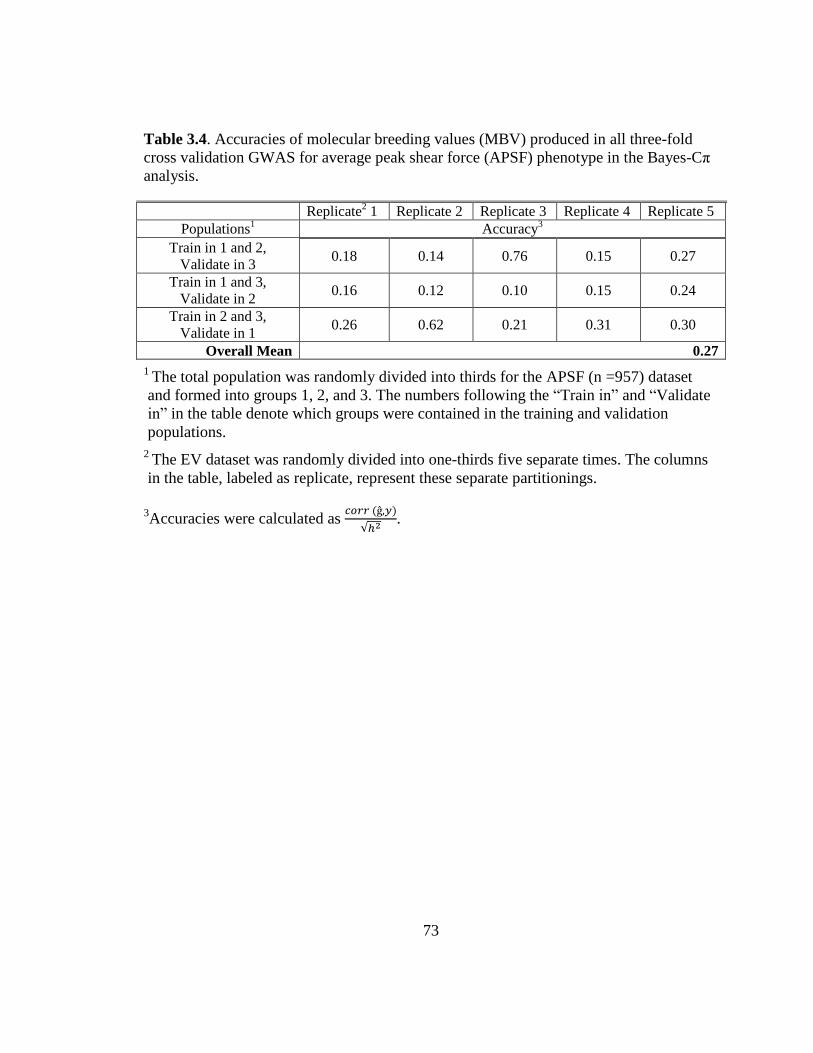
73
Table 3.4. Accuracies of molecular breeding values (MBV) produced in all three-fold
cross validation GWAS for average peak shear force (APSF) phenotype in the Bayes-Cp
analysis.
Replicate2 1
Replicate 2 Replicate 3 Replicate 4 Replicate 5
Populations1
Accuracy3
Train in 1 and 2,
Validate in 3 0.18 0.14 0.76 0.15 0.27
Train in 1 and 3,
Validate in 2 0.16 0.12 0.10 0.15 0.24
Train in 2 and 3,
Validate in 1 0.26 0.62 0.21 0.31 0.30
Overall Mean 0.27
1 The total population was randomly divided into thirds for the APSF (n =957) dataset
and formed into groups 1, 2, and 3. The numbers following the “Train in” and “Validate
in” in the table denote which groups were contained in the training and validation
populations.
2 The EV dataset was randomly divided into one-thirds five separate times. The columns
in the table, labeled as replicate, represent these separate partitionings.
3Accuracies were calculated as
√ .
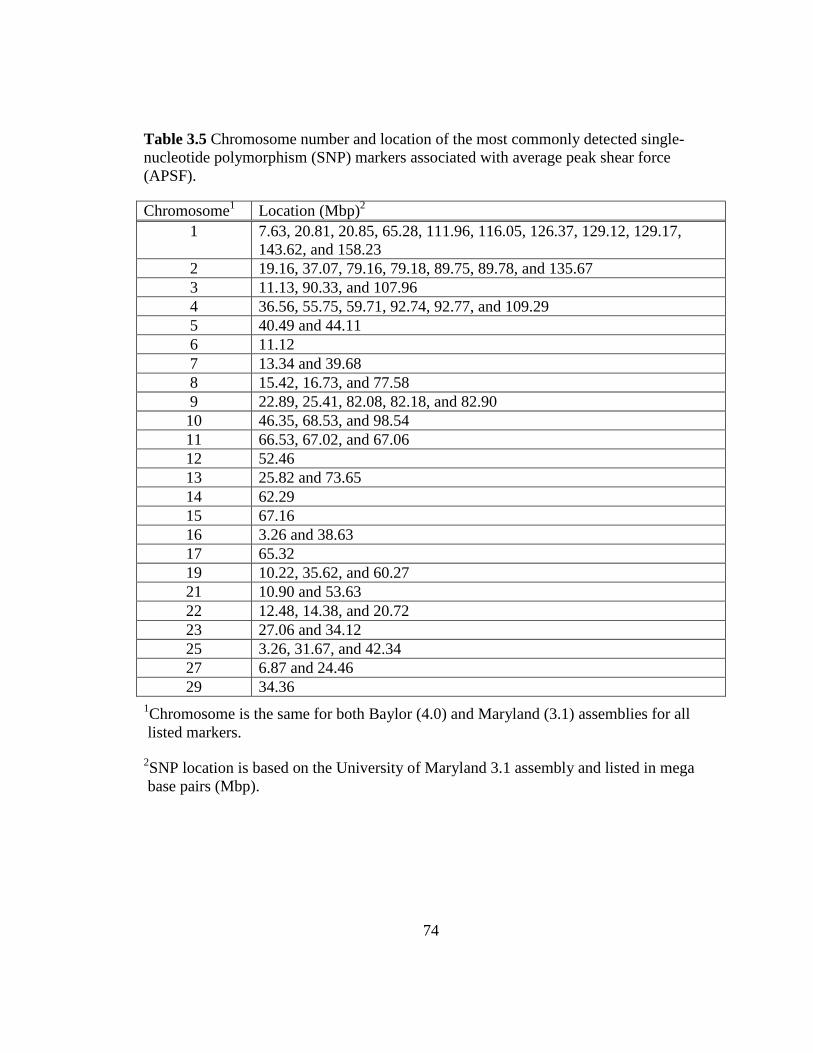
74
Table 3.5 Chromosome number and location of the most commonly detected single-
nucleotide polymorphism (SNP) markers associated with average peak shear force
(APSF).
Chromosome1
Location (Mbp)2
1 7.63, 20.81, 20.85, 65.28, 111.96, 116.05, 126.37, 129.12, 129.17,
143.62, and 158.23
2 19.16, 37.07, 79.16, 79.18, 89.75, 89.78, and 135.67
3 11.13, 90.33, and 107.96
4 36.56, 55.75, 59.71, 92.74, 92.77, and 109.29
5 40.49 and 44.11
6 11.12
7 13.34 and 39.68
8 15.42, 16.73, and 77.58
9 22.89, 25.41, 82.08, 82.18, and 82.90
10 46.35, 68.53, and 98.54
11 66.53, 67.02, and 67.06
12 52.46
13 25.82 and 73.65
14 62.29
15 67.16
16 3.26 and 38.63
17 65.32
19 10.22, 35.62, and 60.27
21 10.90 and 53.63
22 12.48, 14.38, and 20.72
23 27.06 and 34.12
25 3.26, 31.67, and 42.34
27 6.87 and 24.46
29 34.36
1Chromosome is the same for both Baylor (4.0) and Maryland (3.1) assemblies for all
listed markers.
2SNP location is based on the University of Maryland 3.1 assembly and listed in mega
base pairs (Mbp).

75
LITERATURE CITED
Aass, L., K. I. Hildrum, B. A. Aby, E. Sehested, K. Hollung, and E. Veiseth-Kent. 2010.
Genetic parameters for growth, Warner Bratzler shear force and the Calpain
system in beef. Page 94 in Proc. 9th
World Congr. on Genet. Appl. to Livest.
Prod., Leipzig, Germany.
Beckman, D. W., R. M. Enns, S. E. Speidel, B. W. Brigham, and D. J. Garrick. 2007.
Maternal effects of docility in Limousin cattle. J. Anim. Sci. 85: 650-657.
Beckman, D. W. 2008. Docility EPD: A tool for temperament. Pages 81-87 in 40th
Annu.
Meet. Proc., Calgary, Canada. Beef Improvement Federation.
Behrends, S. M., R. K. Miller, F. M. Rouquette, R. D. Randel, B. G. Warrington, T. D. A.
Forbes, T. H. Welsh, H. Lippke, J. M. Behrends, G. E. Carstens, and J. W.
Holloway. 2009. Relationship of temperament, growth, carcass characteristics and
tenderness in beef steers. Meat Sci. 81:433-438.
Burdick, N .C., J. P. Banta, D. A. Neuendorff, J. C. White, R. C. Vann, J. C. Laurenz, T.
H. Welsh, Jr. and R. D. Randel. 2009. Interrelationships among growth,
endocrine, immune, and temperament variables in neonatal Brahmah calves. J.
Anim. Sci. 87: 3202-3210.
Burrow, H. M., G. W. Seifert, and N. J. Corbet. 1988. A new technique for measuring
temperament in cattle. Proc. Aust. Soc. Anim. Prod. 17:154-157.
Burrow, H. M. 1997. Measurements of temperament and their relationships with
performance traits of beef cattle. Anim. Breed. Abstr. 65: 477-495.
Burrow, H. M., and R. D. Dillon. 1997. Relationship between temperament and growth in
a feedlot and commercial carcass traits of Bos indicus crossbreds. Aust. J.Exp.
Agric. 37: 407-411.
Burrow, H. M., and N. J. Corbet. 2000. Genetic and environmental factors affecting
temperament of Zebu and Zebu-derived beef cattle grazed at pasture in the
tropics. Aust. J. Agric. Res. 51: 155-162.
76
Burrow, H. M. 2001. Variances and covariances between productive and adaptive traits
and temperament in a composite breed of tropical beef cattle. Livest. Prod. Sci.
70: 213-233.
Burrow, H. M., S. S. Moore, D. J. Johnston, W. Barendse, and B. M. Bindon. 2001.
Quantitative and molecular genetic influences on properties of beef: a review.
Aust. J. Exp. Agric. 41: 893-919.
Burrow, H. 2003. Selecting quiet cattle boosts beef profits. Farming Ahead. 137: 69-70.
Café, L. M., B. L. McIntyre, D. L. Robinson, G. H. Geesink, W. Barendse, and P. L.
Greenwood. 2010. Production and processing studies on calpain-system gene
markers for tenderness in Brahman cattle: 1. Growth, efficiency, temperament,
and carcass characteristics. J. Anim. Sci. 88: 3047-3058.
Café, L. M., D. L. Robinson, D. M. Ferguson, B. L. McIntyre, G. H. Geesink, and P. L.
Greenwood. 2011. Cattle temperament: Persistence of assessments and
associations with productivity, efficiency, carcass and meat quality traits. J. Anim.
Sci. 89: 1452-1465.
Camou, J. P., S. W. Mares, J. A. Marchello, R. Vazquez, M. Taylor, V. F. Thompson, V.,
and D. E. Goll. 2007. Isolation and characterization of µ-calpain, m-calpain, and
calpastatin from postmortem muscle. I. initial steps. J. Anim. Sci. 85: 3400-3414.
Carneiro, R. L .R., N. F. Dibiasi, P. Tholon, S. A. Queiroz, and L. A. Fries. 2006.
Estimate of heritability to temperament in Nelore cattle.8th
World Congress on
Genet. Appl. to Livest. Prod., Belo Horizonte, Brasil.
Casas, E., S. D. Schackelford, J. W. Keele, M. Koohmaraie, T. P. L. Smith, and R. T.
Stone. 2003. Detection of quantitative trait loci for growth and carcass
composition in cattle. J. Anim. Sci. 81: 2976-2983.
Casas, E., S. N. White, T. L. Wheeler, S. D. Schackelford, M. Koohmaraie, D. G. Riley,
C. C. Chase, Jr. D. D. Johnson, and T. P. L. Smith. 2006. Effects of calpastatin
and m-calpain markers in beef cattle on tenderness traits. J. Anim. Sci. 84: 520-
525.

77
Corva, P., L. Soria, A. Schor, E. Villarreal, M. Cenci, M. Motter, C. Mezzadra, L.
Melucci, C. Miquel, E. Pavan, G. Depetris, F. Santini, and J. Naon. 2007.
Assocation of CAPN1 and CAST gene polymorphisms with meat tenderness in
Bos taurus beef cattle from Argentina. Genet. and Mol. Biol. 30:1064-1069.
Crouse, J. D., L. V. Cundiff, R. M. Koch, M. Koohmaraie, and S.C. Siedeman. 1989.
Comparisons of Bos indicus and Bos taurus inheritance for carcass beef
characteristics and meat palatability. J. Anim. Sci. 67: 2661-2668.
Curley, K. O., Jr. J. C. Paschal, T. H. Welsh, and R. D. Randel. 2006. Technical note:
Exit velocity as a measure of cattle temperament is repeatable and associated with
serum concentration of cortisol in Brahman bulls. J. Anim. Sci. 84: 3100-3103.
Dikeman, M. E., E. J. Pollak, Z. Zhang, D. W. Moser, C. A. Gill, and E. A. Dressler.
2005. Phenotypic ranges and relationships among caracass and meat palatability
traits for fourteen cattle breeds, and heritabilities and expected progeny
differences for Warner-Bratzler shear force in three beef cattle breeds. J. Anim.
Sci. 83: 2461-2467.
Fell L. R., I. G. Colditz, K. H. Walker, and D. L. Watson. 1999. Associations between
temperament, performance and immune function in cattle entering a commercial
feedlot. Aust. J. Exp. Agric. 39: 795-802.
Fernando, R. L., and D. J. Garrick. 2008. GenSel – User manual for a portfolio of
genomic selection related analyses. Animal Breeding and Genetics, Iowa State
University, Ames. http://taurus.ansci.iastate.edu/gensel Accessed Sept. 13, 2011.
Francis, S. J., D. M. Allen, C. L. Kastner, and P. E. De Felicio. 1981. The effect of coring
method on beef longissimus muscle shear force values. J. Anim. Sci. 52: 1294-
1297.
Garrick, D., R. L. Fernando, R. L., and J. Dekkers. 2010. Handbook GenSel short course
Genomic selection in livestock, Ames, Iowa.
Gilmour, A. R., B. J. Gogel, B. R. Cullis, and R. Thompson. 2006. ASReml User Guide
Release 2.0, VSN International Ltd, Hemel Hempstead, HP1 1ES, UK.
Grandin, T. 1997. Assessment of stress during handling and transport. J. Anim. Sci. 75:
249-257.
78
Habier, D., R. L. Fernando, K. Kizilkaya, and D. J. Garrick. 2011. Extension of the
Bayesian alphabet for genomic selection. BMC Bioinformatics 12:186-198.
Hiendleder S., H. Thomsen, N. Reinsch, J. Bennewitz, B. Leyhe-Horn, C. Looft, N. Xu,
I. Medjugorac, I. Russ, C. Kuhn, G. A. Brockmann, J. Blumel, B. Brenig, F.
Reinhardt, R. Reents, G. Averdunk, M. Schwerin, M. Forster, E. Kalm, and G.
Erhardt. 2003. Mapping of QTL for body conformation and behavior in cattle. J.
Hered. 94: 496-506.
Johnston, D. J., A. Reverter, D. L. Robinson, and D. M. Ferguson. 2001. Sources of
variation in mechanical shear force measures of tenderness in beef from tropically
adapted genotypes, effects of data editing and their implications for genetic
parameter estimation. Aust. J. Exp. Agric. 41: 991-996.
Johnston, D. J., A. Reverter, H. M. Burrow, W. H. Oddy, and D. L. Robinson. 2003a.
Genetic and phenotypic characterization of animal, carcass, and meat quality traits
from temperate and tropically adapted beef breeds. 1. Animal measures. Aust. J.
Agric. Res. 54: 107-118.
Johnston, D. J., A. Reverter, D. M. Ferguson, J. M. Thompson, and H. M. Burrow.
2003b. Genetic and phenotypic characterization of animal, carcass, and meat
quality traits from temperate and tropically adapted beef breeds. 3. meat quality
traits. Aust. J. Agric. Res. 54: 135-147.
Johnston, D. J., and H. –U. Graser. 2010. Estimated gene frequencies of GeneSTAR
markers and their size of effects on meat tenderness, marbling, and feed efficiency
in temperate and tropical beef cattle breeds across a range of production systems.
J. Anim. Sci. 88: 1917-1935.
Kadel, M. J., D. J. Johnston, H. M. Burrow, H. –U. Graser, and D. M. Ferguson. 2006
Genetics of flight time and other measures of temperament and their value as
selection criteria for improving meat quality traits in tropically adapted breeds of
beef cattle. Aust. J. Agric. Res. 57: 1029-1035.
Kaps, M. and W. Lamberson. 2004. Biostatistics for Animal Science. 1st ed. CABI
Publishing, Cambridge, MA.
Kemp, C. M., P. L. Sensky, R. G. Bardsley, P. J. Buttery, and T. Parr. 2010. Tenderness –
an enzymatic view. Meat Sci. 84:248-256.
79
Kerth, C. R., J. L. Montgomery, J. L. Lansdell, C. B. Ramsey, M. F. Miller. 2002. Shear
gradient in longissimus steaks. J. Anim. Sci. 80: 2390-2395.
Kilgour, R. J., G. J. Melville, and P. L. Greenwood. 2006. Individual differences in the
reaction of beef cattle to situations involving social isolation, close proximity of
humans, restraint and novelty. Appl. Anim. Behav. Sci. 99: 21-40.
Kizilkaya, K., R. G. Tait, D. J. Garrick, R. L. Fernando, J. M. and Reecy. 2011. Whole
genome analysis of infectious bovine keratoconjunctivitis in Angus cattle using
Bayesian threshold models. BMC Bioinformatics 5: S22-S25.
Koohmaraie, M. 1996. Biochemical factors regulating the toughening and tenderization
processes of meat. Meat Sci. 43: 193-201.
Lanier, J. L., T. Grandin, R. D. Green, D. Avery, and K. McGee. 2000. The relationship
between reaction to sudden, intermittent movements and sounds and
temperament. J. Anim. Sci. 78: 1467-1474.
Law, H. M., S. P. Yang, A. M. Mullins, and M. M. Fielder. 1967. Effect of storage and
cooking on qualities of loin and top round steaks. J. Food Sci. 32: 637-641.
Lawrence, T. E., D. A. King, E. Obuz, E. J. Yancey, and M. E. Dikeman. 2001.
Evaluation of electric belt grill, forced-air convection oven, and electric broiler
cookery methods for beef tenderness research. Meat Sci. 58: 239-246.
Lewis, N. J., and J. F. Hurnik. 1998. The effect of some common management practices
on the ease of handling of dairy cows. Appl. Anim. Behav. Sci. 58: 213-220.
Lusk, J. L., J. A. Fox, T. C. Schroeder, J. Mintert, and M. Koohmaraie. 2001. In-store
valuation of steak tenderness. Amer. J. Agr. Econ. 83: 539-550.
Matukumalli, L. K., C. T. Lawley, R. D. Schnabel, J. F. Taylor, M. F. Allen, M. P.
Heaton, J. O’Connell, S. S. Moore, T. P. Smith, T. S. Sonstegard, and C. P. Van
Tassell. 2009. Development and characterization of a high density SNP
genotyping assay for cattle. PLoS ONE 4:e5350.
80
McClure, M. C., H. R. Ramey, M. M. Rolf, S. D. McKay, J. E. Decker, R. H. Chapple, J.
W., Kim, T. M. Taxis, R. L. Weaber, R. D. Schnabel, and J. F. Taylor. In press.
Genome wide association analysis for quantitative trait loci influencing Warner
Bratzler shear force in five taurine cattle breeds. Anim. Genet.
Miller, R. K., J. F. Taylor, J. O. Sanders, D. K. Lunt, S. K. Davis, J. W. Turner, J. W.
Savell, F. Kallel, J. Ophir, and R. E. Lacey. 1996. Methods for improving meat
tenderness. Pages 106-113 in 49th
Annual Reciprocal Meat Conference Proc.,
Provo, Utah.
Minick, J. A., M. E. Dikeman, E. J. Pollak, and D. E. Wilson. 2004. Heritability and
correlation estimates of Warner-Bratzler shear force and carcass traits from
Angus-, Charolais-, Hereford-, and Simmental-sired cattle. Can. J. Anim. Sci. 84:
599-609.
Mrode, R. A. 2005. Linear Models for the Prediction of Animal Breeding Values. 2nd
ed.
CABI Publishing, Cambridge, MA.
Muller, R., and M. A. G. von Keyserlingk M.A.G. 2006. Consistency of flight speed and
its correlation to productivity and to personality in Bos taurus beef cattle. Applied
Anim. Behavior Sci. 99: 193-204.
Murray, A. C., J. E. Jeremiah, and A. H. Martin. 1983. Muscle fibre orientation and its
effect on measurements of tenderness of bovine longissimus dorsi muscle. J Food
Technol. 18: 607.
Nkrumah, J. D., D. H. Crews J. A. Basarab, M. A. Price, E. K. Okine, Z. Wang, C. Li,
and S. S. Moore. 2007. Genetic and phenotypic relationships of feeding behavior
and temperament with performance, feed efficiency, ultrasound, and carcass merit
of beef cattle. J. Anim. Sci. 85: 2382-2390.
North American Limousin Foundation. 2006. Limousin breeders improve temperament.
Limousin Breeder’s Edge. Vol. 2 NALF, Englewood, CO.
Obuz, E., and M. E. Dikeman. 2003. Effects of cooking beef muscles from frozen or
thawed states on cooking traits and palatability. Meat Sci. 65:993-997.
81
Otremba, M. M., M. E. Dikeman, G. A. Milliken, S. L. Stroda, J. A. Unruh, and E.
Chambers IV. 1999. Interrelationships among evaluations of beef longissimus and
semitendinosus muscle tenderness by Warner-Bratzler shear force, a descriptive-
texture profile sensory panel, and a descriptive attribute sensory panel. J. Anim.
Sci. 77: 865-873.
Page, B. T., E. Casas, R. L. Quaas, R. M. Thallman, T. L. Wheeler, S. D. Shackelford, M.
Koohmaraie, S. N. White, G. L. Bennett, J. W. Keele, M. E. Dikeman, and T. P.
L. Smith. 2004. Association of markers in the bovine CAPN1 gene with meat
tenderness in large crossbred populations that sample influential industry sires. J.
Anim. Sci. 82: 3474-4381.
Pearson, A. M., and J. I. Miller. 1950. The influence of rate of freezing and length of
freezer-storage upon the quality of beef on known origin. J. Anim. Sci. 9: 13-19.
Platter, W. J., J. D. Tatum, K. E. Belk, S. R. Koontz, P. L. Chapman, and G. C. Smith.
2005. Effects of marbling and shear force on consumers’ willingness to pay for
beef strip loin steaks. J. Anim. Sci. 83: 890-899.
Pollak, J. E., M. Dikeman, C. Gill, D. Moser, T. Holm, and E. Westcott. 2001. Update on
the Carcass Merit Project. Proc. Reciprocal Meat Conference. 54: 103-104.
Reverter, A., D. J. Johnston, D. M. Ferguson, D. Perry, M. E. Goddard, H. M. Burrow, V.
H. Oddy, J. M. Thompson, and B. M. Bidon. 2003. Genetic and phenotypic
characterization of animal, carcass, and meat quality traits from temperate and
tropically adapted beef breeds. 4. Correlations among animal, carcass, and meat
quality traits. Aust. J. Agric. Res. 54:149-158.
Ribeiro, F. R. B., G. E. Carstens, R. K. Miller, E. G. Brown, and P. A. Lancaster. 2007.
Relationships between temperament, carcass traits and tenderness in Santa
Gertrudis steers. No. 80. 60th
Reciprocal Meat Conference. Brookings, South
Dakota.
Sapa, J., K. Donoghue, and F. Phocas. 2006. Genetic parameters between sexes for
temperament traits in Limousin cattle. 8th
World Congress on Genet. Appl. to
Livest. Prod., Belo Horizonte, Brasil.
82
Savell, J. W., J. C. Brooks, R. J. Delmore, D. B. Griffin, B. L. Gwartney, D. S. Hale, W.
R. Henning, D. D. Johnson, R. Maddock, R. K. Miller, J. B. Morgan, C. L.
Lorenzen, J. O. Reagan, K. L. Voges, and B. Baird. 2006. Executive summary
2005 national beef tenderness survey. Accessed Nov. 11, 2011.
http://www.beefresearch.org/CMDocs/BeefResearch/2005%20National%20Beef
%20Tenderness%20Survey.pdf.
Scheet, P., and M. Stephens. 2006. A fast and flexible statistical model for large-scale
population genotypic data: applications to inferring missing genotypes and
haplotypic phase. Am. J. Hum. Genet. 78: 629-644.
Schenkel, F. S., S. P. Miller, Z. Jiang, I. B. Mandell, X. Ye, H. Li, and J. W. Wilton.
2006. Association of a single nucleotide polymorphism in the calpastatin gene
with carcass and meat quality traits of beef cattle. J. Anim. Sci. 84: 291-299.
Schmidt, T. B., M. W. Schilling, J. M. Behrends, V. Battula, V. Jackson, R. K. Sekhon,
and T. E. Lawrence. 2010. Use of cluster analysis and preference mapping to
evaluate consumer acceptability of choice and select bovine M. Longissimus
Lumborum steaks cooked to various end-point temperatures. Meat Sci. 84: 46-53.
Schmutz, S. M., J. M. Stookey, D. C. Winkelman-Sim, C. S. Waltz, Y. Plante, and F. C.
Buchanan. 2001. A QTL study of cattle behavioral traits in embryo transfer
families. J. Hered. 92: 290-292.
Shanks, B. C., D. M. Wulf, and R. J. Maddock. 2002. Technical note: The effect of
freezing on Warner-Bratzler shear force values of beef longissimus steaks across
several postmortem aging periods. J. Anim. Sci. 80: 2122-2125.
Shook, J. N., D. L. VanOverbeke, J. A. Scange, K. E. Belk, J. W. Savell, T. E. Lawrence,
J. B. Morgan, D. B. Griffin, D. S. Hale, and G. C. Smith. 2008. The National Beef
Quality Audit- 2005, phase I: views of producers, packers, and merchandisers on
current quality characteristics of the beef industry. The Prof. Anim. Sci. 24: 189-
197.
Smith, G. C., Z. L. Carpenter, and G. T. King. 1969 Considerations for beef tenderness
evaluations. J. of Food Sci. 34: 612-618.
Smith, T. P., E. Casas, C. E. Rexroad, III S. M. Kappes, J. W. Keele. 2000. Bovine
CAPN1 maps to a region of BTA29 containing a quantitative trait locus for meat
tenderness. J. Anim. Sci. 78: 2589-2594.
83
Tuma, H. J., J. H. Venable, P. R. Wuthier, and R. L. Henrickson. 1962. Relationship of
fiber diameter to tenderness and meatiness as influenced by bovine age. J. Anim.
Sci. 1: 33-36.
Van Eenennaam, A. L., J. Li, R. M. Thallman, R. L. Quaas, M. E. Dikeman, C. A. Gill,
D. E. Franke, and M. G. Thomas. 2007. Validation of commercial DNA tests for
quantitative beef quality traits. J. Anim. Sci. 85: 891-900.
Van Eenennaam, A. L. 2011. Improving EPD accuracy by combining EPD information
with DNA test results. Proc. of Applied Reproductive Strategies in Beef Cattle.
Joplin, Missouri.
Voisinet, B. D., T. Grandin, J. D. Tatum,S. F. O’Conner, and J. J. Struthers. 1997.
Feedlot cattle with calm temperaments have higher average daily gains than cattle
with excitable temperaments. J. Anim. Sci. 75: 892-896.
Weaber, R. L., and F. E. Creason. 2010. Phenotypic and genetic relationships among beef
cattle temperament and production traits. Proc. of XV Baltic Animal Breeding
and Genetics Conference. Riga, Latvia.
Weaber, R. L., and J. L. Lusk. 2010. The economic value of improvements in beef
tenderness by genetic marker selection. Amer. J. Agr. Econ. 92: 1456-1471
Wheeler, T. L., M. Koohmaraie, L. V. Cundiff, and M. E. Dikeman. 1994. Effects of
cooking and shearing methodology on variation in Warner-Bratzler shear force
values in beef. J. Anim. Sci. 72: 2325-2330.
Wheeler, T. L., S. D. Shackelford, and M. Koohmaraie. 1996. Sampling, cooking, and
coring effects on Warner-Bratzler shear force values in beef. J. Anim. Sci. 74:
1553-1562.
Wheeler, T. L., S. D. Shackelford, M. Koohmaraie. 1997. Standardizing collection and
interpretation of Warner-Braztler shear force and sensory tenderness data. Proc.
Reciprocal Meat Conference. 50: 68-77.
Wheeler, T. L., S. D. Shackelford, and M. Koohmaraie. 1999. Tenderness classification
of beef: III. Effect of the interaction between end point temperature and
tenderness on Warner-Bratzler shear force of beef longissimus. J. Anim. Sci. 77:
400-407.
84
Wheeler, T. L., S. D. Shackelford, and M. Koohmaraie. 2005. Shear force procedures for
meat tenderness measurement. Roman L. Hruska U. S. Meat Animal Research
Center.
White, S. S., E. Casas, T. L. Wheeler, S. D. Shackelford, M. Koohmaraie, D. G. Riley, C.
C. Chas, Jr. D. D. Johnson, J. W. Keele, and T. P. L. Smith. 2005. A new single
nucleotide polymorphism in CAPN1 extends the current tenderness marker test to
include cattle of Bos indicus, Bos taurus, and crossbred descent. J. Anim. Sci. 83:
2001-2008.
Yancey, J. W. S., M. D. Wharton, and J. K. Apple. 2011. Cookery method and end-point
temperature can affect the Warner-Bratzler shear force, cooking loss, and internal
cooked color of beef longissimus steaks. Meat Sci. 88: 1-7.
Zhou, H., and J. G. H. Hickford. 2008. Allelic variation of the bovine calpastatin (CAST)
gene. Mol. and Cell. Probes 22: 129-130.
Zimin A.V., A. L. Delcher, L. Florea, D. R. Kelley, M. C. Schatz, D. Puiu, F. Hanrahan,
G. Pertea, C. P. Van Tassell, T. S. Sonstegard, G. Marcais, M. Roberts, P.
Subramanian, J. A. Yorke, and S. L. Salzberg. 2009. A whole-genome assembly
of the domestic cow, Bos taurus. Genome Bio. 10: R42.