genetic and phenotypic population divergence on a ... · genetic and phenotypic population...
TRANSCRIPT

Molecular Ecology (2012) doi: 10.1111/j.1365-294X.2012.05581.x
Genetic and phenotypic population divergence on amicrogeographic scale in brown trout
RIKE B. STELKENS,* GEOFFREY JAFFUEL,* MATTHIAS ESCHER† and CLAUS WEDEKIND*
*Department of Ecology and Evolution, Biophore, University of Lausanne, CH-1015 Lausanne, Switzerland, †Aqua-Sana, 3214
Ulmiz, Switzerland
Corresponde
E-mail: rike.s
� 2012 Black
Abstract
Salmonid populations of many rivers are rapidly declining. One possible explanation is
that habitat fragmentation increases genetic drift and reduces the populations’ potential
to adapt to changing environmental conditions. We measured the genetic and eco-
morphological diversity of brown trout (Salmo trutta) in a Swiss stream system, using
multivariate statistics and Bayesian clustering. We found large genetic and phenotypic
variation within only 40 km of stream length. Eighty-eight percent of all pairwise FST
comparisons and 50% of the population comparisons in body shape were significant.
High success rates of population assignment tests confirmed the distinctiveness of
populations in both genotype and phenotype. Spatial analysis revealed that divergence
increased with waterway distance, the number of weirs, and stretches of poor habitat
between sampling locations, but effects of isolation-by-distance and habitat fragmen-
tation could not be fully disentangled. Stocking intensity varied between streams but did
not appear to erode genetic diversity within populations. A lack of association between
phenotypic and genetic divergence points to a role of local adaptation or phenotypically
plastic responses to habitat heterogeneity. Indeed, body shape could be largely explained
by topographic stream slope, and variation in overall phenotype matched the flow
regimes of the respective habitats.
Keywords: habitat fragmentation, isolation-by-distance, landscape genetics, local adaptation,
phenotypic plasticity, Salmo trutta
Received 31 March 2011; revision received 27 February 2012; accepted 4 March 2012
Introduction
Natural populations around the globe are increasingly
exposed to habitat-altering activities of humans (Kinni-
son et al. 2008; Smith & Bernatchez 2008) to the extent
that, in some environments, humans have become the
most important driver of phenotypic change (Hendry
et al. 2008). Strong anthropogenic impacts on ecosys-
tems can pose serious threats to biodiversity. One of
the most affected species groups are fish (Taylor et al.
2006; Meeuwig et al. 2008). Salmonid populations are
in decline worldwide for reasons often unidentified
but usually related to their commercial over-exploitation,
the extensive agricultural use of streams and lakes, and
energy generation (McGinnity et al. 2003; ICES 2006;
nce: Rike B. Stelkens;
well Publishing Ltd
Krkosek et al. 2007; Ford & Myers 2008). One of the
most common and problematic consequences for
natural populations is the fragmentation of habitat,
which often causes increased genetic drift. An erosion
of genetic variation and the loss of rare alleles and traits
can severely constrain the adaptability of populations,
especially when environmental conditions change
quickly (Ferguson 1989; Hedrick & Miller 1992;
Meldgaard et al. 2003). If fragmentation is extreme and
persists, inbreeding can lead to the fixation of deleteri-
ous alleles reducing the fitness of populations, for
example, by decreasing survival and fertility (Frankham
1995; Hedrick & Kalinowski 2000; Armbruster & Reed
2005; Charlesworth & Willis 2009). Especially when
populations are small, environmental or demographic
stochasticity can become the principal threat driving
entire populations to extinction (Lande 1992).

2 R. B . ST EL KEN S ET AL.
The use of geographical landscape data paired with
population genetics or genomics has become a popular
and efficient tool to interpret the effects of landscape
structures on population connectivity. Landscape genet-
ics seeks to understand how the interaction between
landscape features and evolutionary processes – such as
gene flow, genetic drift, and selection – shapes the spatial
distribution of genetic variation (Manel et al. 2003, 2010;
Cushman et al. 2006; Holderegger & Wagner 2006;
Lowry 2010; Storfer et al. 2010). Salmonid species make
an interesting case for investigating the effects of habitat
fragmentation on population structure because the linear
network of streams and lakes they inhabit makes the
identification of dispersal corridors straightforward.
Genetic differentiation in freshwater salmonids can
occur across short geographic distances. On the one
hand, the accurate natal homing abilities of many spe-
cies (Neville et al. 2006b) and the limited migratory
behaviour of resident populations (Northcote 1992) may
be sufficient to maintain genetic differentiation, even in
the absence of physical barriers to dispersal (Carlsson &
Nilsson 2000; Griffiths et al. 2009). In addition, diversi-
fying ecological selection can lead to local adaptation
and drive populations to diverge (Taylor 1991; Dionne
et al. 2008). In contrast, natural landscape features like
waterfalls and tributary networks (Kanno et al. 2011),
but also artificial structures such as dams, weirs and
gradation steps, may constrain gene flow and promote
population differentiation through drift (Meldgaard
et al. 2003). Brown trout (Salmo trutta) can show espe-
cially complex population structure, often with substan-
tial genetic differentiation within river catchment.
Another feature characteristic of brown trout popula-
tions is their vast phenotypic diversity (e.g. Hermida
et al. 2009) and large variation in life history strategies
(Nielsen et al. 2003). This variation has, since 1758, led
to ca. 50 different species descriptions for brown trout
(Ferguson 1989).
Brown trout-catches in the Aare river, Switzerland,
have decreased by more than 50% over the past
30 years, indicative of a dramatic population decline
(Fischnetz 2004; Burkhardt-Holm 2007). Although well
documented, a conclusive explanation for the decline is
lacking (Burkhardt-Holm et al. 2002; Borsuk et al. 2006;
Zimmerli et al. 2007). Artificial landscape structures
such as culverts (subterranean canalization of streams,
usually through concrete pipes), embankments, irriga-
tion, dams, weirs and grade control structures are ubiq-
uitous in the Aare catchment. Recent fine-scale
mapping of Swiss midland streams showed that 2.5 bar-
riers (of >50 cm height) interrupt every kilometre of
stream, and the total length of artificial stream sections
in Switzerland amount to a third of the Earth’s circum-
ference (14 000 km; Zeh-Weissmann et al. 2009).
Here, we provide a geographically fine-scaled investi-
gation of the influence of habitat fragmentation on the
genetic and phenotypic composition of brown trout
populations in the river Aare, a drainage system typical
for the Swiss prealpine and midlands. We investigate
the following: (i) the genetic diversity of brown trout
present in the catchment; (ii) their phenotypic diversity
in multivariate body shape; (iii) the impact of isolation-
by-distance, dispersal barriers, topographic stream slope
and stocking on diversity; and (iv) the association of
genetic and phenotypic divergence.
Methods
Sampling of biological material
Between June and October 2009, brown trout from 21
locations were collected from the main stem and the
tributaries of the river Aare between Lake Thun and
the city of Bern (Fig. 1, for sample sizes per site see
Table 1). The number and size of all fish that could be
collected by wading and electrofishing upstream a
100 m-stretch were recorded. For analysis purposes and
simplicity, each site is assumed to be a ‘population’,
representing a sample and not necessarily a biological
population. Of those individuals that, from the
observed size distribution, could be assumed as >1+ in
age, a random sample of a total of 603 S. trutta was
taken and given the following treatment: After light
anesthetization (0.5 mL ⁄ L Koi Med Sleep; Koipraxis,
Ulmiz, Switzerland) a digital photograph was taken of
the right body side with a size scale for later allometric
adjustment. A tissue sample was taken from the pelvic
fin and preserved in 99.9% ethanol. After sufficient
time to recover in a freshwater tank, all individuals
were released at the site of capture.
Microsatellite amplification
Genomic DNA was extracted using the DNeasy tissue kit
(Qiagen) following instructions of the manufacturer.
Individuals were genotyped at 11 microsatellite loci:
BS131, T3-13 (Estoup et al. 1998), Mst543AE, Str591INRA
(Presa & Guyomard 1996), Ssa171 (O’Reilly et al. 1996),
Omy5, Str12INRA (Gharbi et al. 2006), AETG1,
Str15INRA (Estoup et al. 1993), Sssosl41 (Slettan et al.
1995), Str58CNRS (Poteaux et al. 2000), according to the
protocol in Jacob et al. (2007). PCR reactions were done
in three multiplex reactions (multiplex 1: BS131,
Mst543AE, Ssa171, Omy5; multiplex 2: AETG1,
Str58CNRS, T3-13, Sssosl41; multiplex 3: Str15INRA,
Str591INRA, Str12INRA). PCR profiles were 35 iterations
of activation at 95�C for 15 min, denaturation at 94�C
for 30 s, annealing at 59�C (mix 1), 57�C (mix 2), or 56�C
� 2012 Blackwell Publishing Ltd
Giesse
Giesse Belp
Upper
Kiese
Rotache
AmletenbachLake Thun
5 km
Upper Worble
Lower Worble
Aare 208.1
Krebsbach
Aare 208.2
Aare 208.3
Aare 205.3
Aare 205.2
Lower
Aare 203.3
Aare 203.2
Aare 203.1
Zulg
Aare 205.1
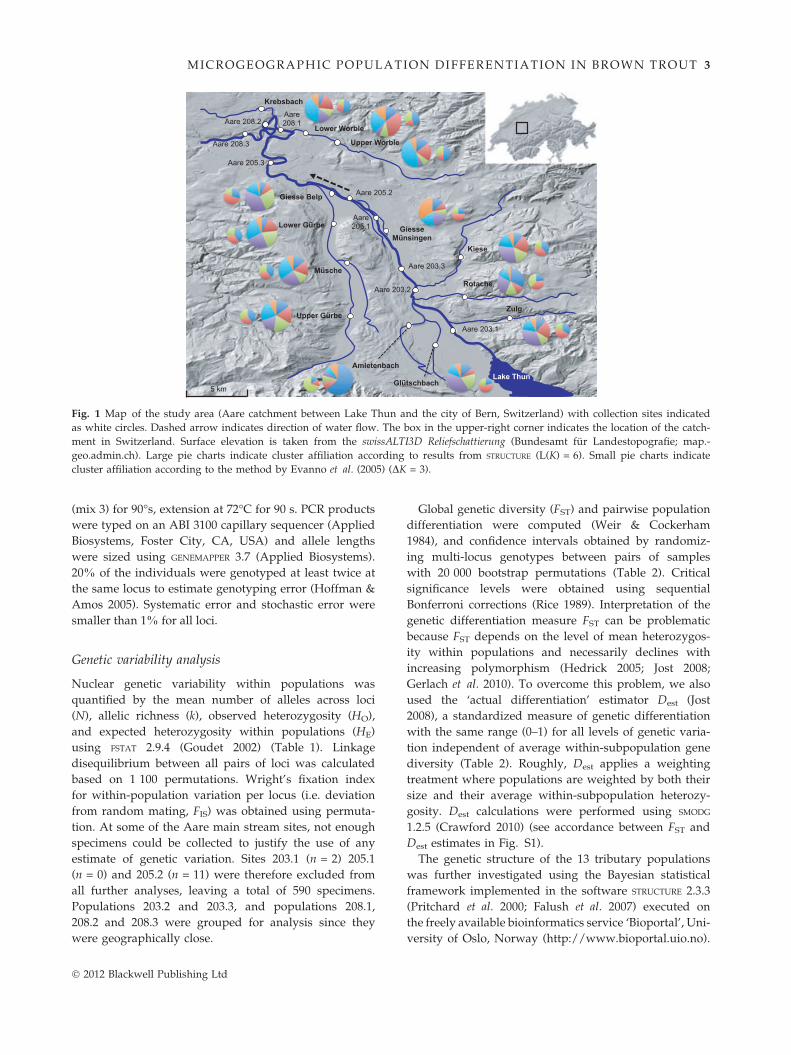
Fig. 1 Map of the study area (Aare catchment between Lake Thun and the city of Bern, Switzerland) with collection sites indicated
as white circles. Dashed arrow indicates direction of water flow. The box in the upper-right corner indicates the location of the catch-
ment in Switzerland. Surface elevation is taken from the swissALTI3D Reliefschattierung (Bundesamt fur Landestopografie; map.-
geo.admin.ch). Large pie charts indicate cluster affiliation according to results from STRUCTURE (L(K) = 6). Small pie charts indicate
cluster affiliation according to the method by Evanno et al. (2005) (DK = 3).
MI CROGEOGRAPHIC POPULATION DIFFERENTIATION I N BROWN TROUT 3
(mix 3) for 90�s, extension at 72�C for 90 s. PCR products
were typed on an ABI 3100 capillary sequencer (Applied
Biosystems, Foster City, CA, USA) and allele lengths
were sized using GENEMAPPER 3.7 (Applied Biosystems).
20% of the individuals were genotyped at least twice at
the same locus to estimate genotyping error (Hoffman &
Amos 2005). Systematic error and stochastic error were
smaller than 1% for all loci.
Genetic variability analysis
Nuclear genetic variability within populations was
quantified by the mean number of alleles across loci
(N), allelic richness (k), observed heterozygosity (HO),
and expected heterozygosity within populations (HE)
using FSTAT 2.9.4 (Goudet 2002) (Table 1). Linkage
disequilibrium between all pairs of loci was calculated
based on 1 100 permutations. Wright’s fixation index
for within-population variation per locus (i.e. deviation
from random mating, FIS) was obtained using permuta-
tion. At some of the Aare main stream sites, not enough
specimens could be collected to justify the use of any
estimate of genetic variation. Sites 203.1 (n = 2) 205.1
(n = 0) and 205.2 (n = 11) were therefore excluded from
all further analyses, leaving a total of 590 specimens.
Populations 203.2 and 203.3, and populations 208.1,
208.2 and 208.3 were grouped for analysis since they
were geographically close.
� 2012 Blackwell Publishing Ltd
Global genetic diversity (FST) and pairwise population
differentiation were computed (Weir & Cockerham
1984), and confidence intervals obtained by randomiz-
ing multi-locus genotypes between pairs of samples
with 20 000 bootstrap permutations (Table 2). Critical
significance levels were obtained using sequential
Bonferroni corrections (Rice 1989). Interpretation of the
genetic differentiation measure FST can be problematic
because FST depends on the level of mean heterozygos-
ity within populations and necessarily declines with
increasing polymorphism (Hedrick 2005; Jost 2008;
Gerlach et al. 2010). To overcome this problem, we also
used the ‘actual differentiation’ estimator Dest (Jost
2008), a standardized measure of genetic differentiation
with the same range (0–1) for all levels of genetic varia-
tion independent of average within-subpopulation gene
diversity (Table 2). Roughly, Dest applies a weighting
treatment where populations are weighted by both their
size and their average within-subpopulation heterozy-
gosity. Dest calculations were performed using SMODG
1.2.5 (Crawford 2010) (see accordance between FST and
Dest estimates in Fig. S1).
The genetic structure of the 13 tributary populations
was further investigated using the Bayesian statistical
framework implemented in the software STRUCTURE 2.3.3
(Pritchard et al. 2000; Falush et al. 2007) executed on
the freely available bioinformatics service ‘Bioportal’, Uni-
versity of Oslo, Norway (http://www.bioportal.uio.no).

Table 1 Location, coordinates, elevation at sampling site, number of individuals sampled, and neutral genetic variation parameters
of the study populations determined from eleven microsatellite loci
Sampling site Coordinates Elevation N indiv. N alleles k HO HE FIS %
Aare 208 Aare 208.3 7�25¢46,62¢¢46�58¢26,38¢¢
486 37 13.9 (5–26) 10.57 0.78 0.8 0.031 –
Aare 208.2 7�26¢37,97¢¢46�58¢42,03¢¢
488
Aare 208.1 7�27¢23,48¢¢46�58¢38,09¢¢
494
Aare 205 Aare 205.3 7�26¢51,32¢¢46�56¢45,17¢¢
513 22 10.4 (3–17) 9.65 0.72 0.76 0.051 –
Aare 203 Aare 203.3 7�33¢40,55¢¢46�50¢05,72¢¢
533 29 12 (5–21) 10.04 0.77 0.79 0.025 –
Aare 203.2 7�34¢20,28¢¢46�49¢07,00¢¢
535
Amletenbach 7�34¢04,73¢¢46�47¢05,95¢¢
554 57 11.54 (4–19) 8.61 0.72 0.76 0.054 83
Upper Gurbe 7�30¢56,03¢¢46�47¢19,25¢¢
570 63 15.82 (5–26) 10.6 0.77 0.8 0.027 68
Lower Gurbe 7�30¢4,19¢¢46�52¢59,37¢¢
523 32 12.18 (4–18) 10.04 0.77 0.8 0.021 61
Upper Worble 7�30¢14,30¢¢46�57¢54,67¢¢
545 43 13.09 (4–24) 9.63 0.79 0.79 )0.005 61
Lower Worble 7�29¢3,25¢¢46�58¢21,78¢¢
528 38 14 (4–28) 10.42 0.79 0.81 0.025 70
Kiese 7�37¢11,27¢¢46�50¢55,85¢¢
630 45 13.64 (4–22) 9.78 0.77 0.78 0.001 74
Giesse Belp 7�29¢58,69¢¢46�55¢7,35¢¢
523 20 7.82 (3–12) 7.62 0.74 0.73 )0.032 85
Giesse Munsingen 7�32¢44,00¢¢46�53¢5,33¢¢
537 40 13.18 (4–22) 9.90 0.69 0.77 0.105 72
Glutschbach 7�34¢35,59¢¢46�46¢9,22¢¢
558 32 10.73 (4–18) 8.79 0.67 0.74 0.080 77
Krebsbach 7�26¢39,44¢¢46�59¢47,94¢¢
549 34 12.55 (4–22) 10.03 0.74 0.79 0.064 68
Rotache 7�36¢52,71¢¢46�48¢29,31¢¢
596 35 12.45 (4–22) 9.51 0.74 0.78 0.040 67
Zulg 7�39¢35,25¢¢46�47¢3,47¢¢
635 30 11.45 (4–18) 9.45 0.70 0.77 0.089 65
Musche 7�30¢30,21¢¢46�50¢43,30¢¢
532 33 13.36 (5–24) 10.42 0.72 0.79 0.079 63
N indiv., sample size per location; N alleles, mean number of alleles across loci (range across loci in parentheses); k, allelic
richness; HE, gene diversity; HO, observed heterozygosity.
None of the FIS values differed significantly from zero, i.e. there were no signs for heterozygote deficits in any population.
Percentages in the last column represent population-specific assignment success in discriminant function analysis of principal
components (DAPC) using multivariate genotypes.
4 R. B . ST EL KEN S ET AL.
STRUCTURE evaluates the most likely structure without
prior information of the population affiliation of each
individual and provides an unbiased estimate of the
structure with respect to the sampled populations. We
used a burn-in period of 100 000 iterations and a sam-
pling period of 500 000 iterations in admixture models
(where a fraction of the genome of each individual is
equally likely to originate from each population under
consideration). We performed runs for 1 to 15 clusters
(K, the putative number of biological populations) with
six iterations for each K to quantify the variation in like-
lihood, and calculated the logarithm of the mean pos-
terior probability of the data L(K). To identify the most
likely number of K, we used the maximal value of L(K)
returned by STRUCTURE (e.g. Zeisset & Beebee 2001) and
calculated the DK statistic using the second-order rate
of change in log probability between successive K val-
ues following Evanno et al. (2005).
� 2012 Blackwell Publishing Ltd

Ta
ble
2E
stim
ates
of
pai
rwis
ep
op
ula
tio
nd
iffe
ren
tiat
ion
Aar
e
208
Aar
e
205
Aar
e
203
Am
lete
nb
ach
Up
per
Gu
rbe
Lo
wer
Gu
rbe
Up
per
Wo
rble
Lo
wer
Wo
rble
Kie
se
Gie
sse
Bel
p
Gie
sse
Mu
nsi
ng
enG
luts
chb
ach
Kre
bsb
ach
Ro
tach
eZ
ulg
Mu
sch
e
Aar
e20
8–
0.00
90.
021*
0.02
1*0.
003
0.00
4*0.
015*
0.01
1*0.
007*
0.01
5*0.
025*
0.02
6*0.
015*
0.02
1*0.
011*
0.01
0*
Aar
e20
50.
020
–0.
027*
0.03
5*0.
009*
0.01
6*0.
029*
0.03
2*0.
010*
0.02
8*0.
032
0.02
8*0.
029*
0.01
50.
013
0.01
7*
Aar
e20
30.
048
0.07
1–
0.03
1*0.
012*
0.02
8*0.
034*
0.02
4*0.
015*
0.04
4*0.
023*
0.03
6*0.
036*
0.02
0*0.
023*
0.01
4*
Am
lete
nb
ach
0.06
80.
108
0.08
9–
0.01
8*0.
025*
0.02
7*0.
022*
0.02
6*0.
042*
0.03
1*0.
036*
0.03
4*0.
035*
0.03
3*0.
021*
Up
per
Gu
rbe
0.00
80.
026
0.02
20.
063
–0.
008
0.01
4*0.
012*
0.00
5*0.
025*
0.01
8*0.
021*
0.01
50.
012*
0.00
9*0.
004
Lo
wer
Gu
rbe
0.00
60.
040
0.06
90.
079
0.00
8–
0.01
4*0.
015*
0.01
1*0.
032*
0.03
2*0.
029*
0.01
7*0.
020*
0.01
4*0.
007
Up
per
Wo
rble
0.04
20.
087
0.09
20.
093
0.02
40.
012
–0.
010*
0.02
4*0.
040*
0.03
4*0.
044*
0.01
20.
030*
0.02
4*0.
023
Lo
wer
Wo
rble
0.03
00.
109
0.06
20.
070
0.02
60.
065
0.03
8–
0.01
8*0.
042*
0.03
4*0.
044*
0.01
5*0.
028*
0.02
2*0.
017*
Kie
se0.
017
0.02
10.
026
0.07
70.
011
0.02
40.
069
0.06
2–
0.01
9*0.
027*
0.02
8*0.
021*
0.01
8*0.
009
0.00
9
Gie
sse
Bel
p0.
038
0.06
70.
104
0.10
10.
068
0.08
80.
130
0.12
30.
045
–0.
047*
0.04
3*0.
042*
0.04
8*0.
031*
0.03
5*
Gie
sse
Mu
nsi
ng
en
0.04
60.
089
0.04
50.
078
0.04
80.
092
0.08
00.
078
0.06
90.
110
–0.
027*
0.03
10.
028*
0.03
0*0.
020*
Glu
tsch
bac
h0.
077
0.05
60.
105
0.08
10.
067
0.07
80.
127
0.12
70.
084
0.07
80.
071
–0.
041*
0.03
0*0.
028*
0.02
7*
Kre
bsb
ach
0.03
90.
119
0.09
20.
110
0.05
50.
075
0.03
60.
063
0.06
90.
119
0.08
20.
105
–0.
033*
0.02
4*0.
020*
Ro
tach
e0.
077
0.04
20.
056
0.08
80.
036
0.05
50.
096
0.09
90.
047
0.14
50.
080
0.06
40.
117
–0.
019
0.01
7*
Zu
lg0.
034
0.02
90.
060
0.09
20.
026
0.03
60.
078
0.06
20.
016
0.07
90.
086
0.07
30.
058
0.05
1–
0.01
7*
Mu
sch
e0.
024
0.03
70.
026
0.06
50.
006
0.01
90.
067
0.07
30.
015
0.06
40.
044
0.07
00.
062
0.04
90.
040
–
FS
Tv
alu
esar
eab
ov
ed
iag
on
al;
Dest
val
ues
are
bel
ow
dia
go
nal
.
*Sig
nifi
can
ceat
the
5%n
om
inal
lev
elaf
ter
Bo
nfe
rro
ni
corr
ecti
on
(no
n-s
ign
ifica
nt
com
par
iso
ns
init
alic
s).
105
ou
to
f12
0p
airw
ise
po
pu
lati
on
com
par
iso
ns
wer
esi
gn
ifica
nt.
M I CROGEOGRAPHIC POPULATION DIFFERENTIATION I N BROWN TROUT 5
� 2012 Blackwell Publishing Ltd

6 R. B . ST EL KEN S ET AL.
To estimate the number of individuals correctly
assigned to their sample populations based on multi-
variate molecular data, we carried out a discriminant
function analysis on principal components of allelic
data from 11 microsatellites (DAPC; Jombart et al.
2010), using the R package adegenet (Jombart 2008).
Feeding PCs into a discriminant function analysis (DA)
holds the crucial advantage that all variables are uncor-
related.
Geometric morphometric analysis of shape
Of the 590 sampled individuals, 580 were phenotyped
for body shape using landmark-based geometric mor-
phometrics methods (photos of 10 individuals were of
too low quality). The position of the 13 landmarks
(Fig. 2) were chosen based on previously published
work on trout morphometrics (Varian & Nichols 2010).
Landmarks were placed on standardized digital pic-
tures on the right body side of each fish. Geometric
morphometric analysis was performed on the XY coor-
dinates of these landmarks using the software
tpsDig2.10 according to the protocol described in Stel-
kens et al. (2009). Non-shape variation, introduced
through variation in position, orientation, and size, was
mathematically removed using generalized procrustes
analysis (GPA; Rohlf & Slice 1990). GPA superimposes
landmark configurations by minimizing the sum of
squared distances between corresponding landmarks by
scaling, translating and rotating specimens onto a mean
consensus configuration calculated from all specimens.
To obtain partial warps, thin-plate spline (TPS) proce-
dure was applied using the software tpsRelw2.10. Par-
tial warps estimate the minimum bending energy
needed to deform an infinitely thin metal plate (i.e. the
landmark configuration of an individual fish) to adopt
2
4 3 5 6
7
8 9
10 11
12 13 1
Fig. 2 Position of the 13 landmarks used to describe body
shape variation. (1) anterior tip of snout, (2) centre of the eye,
(3) posterior end of neurocranium, (4) origin of dorsal fin, (5)
origin of adipose fin, (6) anterior attachment of dorsal mem-
brane of the caudal fin, (7) base of middle caudal rays (8) ante-
rior attachment of ventral membrane of the caudal fin, (9)
origin of anal fin, (10) origin of pelvic fin, (11) origin of pec-
toral fin, (12) posterior end of maxillary (13) posterior end of
brachiae (modified from Varian & Nichols 2010).
the shape of another landmark configuration (i.e. the
consensus configuration of all fish) while being con-
strained at particular points (i.e. the landmarks).
Among-population shape differences can also be
caused by shearing and stretching, affecting all land-
marks at once. These shape variables are called uniform
components. To test if there was significant variation
between populations in uniform components, we
applied MANOVA using population as factor and the
uniform components as response variables in JMP9 (SAS).
The analysis revealed significant differentiation between
populations in uniform components, which were there-
fore included in all downstream analyses. All partial
warps were regressed against size (a product of the size
of each individual and the centroid size) to remove
potential allometry effects. Residuals of each of these
regressions were extracted and principal component
analysis (PCA) was used, including all partial warp
residuals and the uniform components, to identify the
major axes of shape variation. After PCA, principal com-
ponents explaining more than 10% of the variance (PC1
and PC2) were maintained for downstream analysis. We
then carried out one-way ANOVAs using population as
factor and each PC as response variable to test if popula-
tions show significant variance in major body shape
components. Deformation grids in Fig. 3 were obtained
using the software tpsReg1.3, performing multivariate
multiple regression of shape (captured by partial warp
scores and the uniform shape components) onto PC1
and PC2, respectively. Posthoc Tukey–Kramer tests were
used for pairwise population comparisons. Canonical
linear discriminant analysis was used to explore if indi-
viduals could be correctly reassigned to their source
group based on principal components of shape.
Phenotypic variability analysis
The divergence in quantitative phenotypic traits
between populations was estimated by calculating pair-
wise PST estimates (the phenotypic surrogate for QST;
(Spitze 1993)). Because landmarks and associated mor-
phometric distances are non-independent, PST values
were estimated from the first two principal components
(PC1 and PC2). All analyses were run in R (R DCT
2006). Calculations were based on: PST = r2GB ⁄ (r2
GB
+ 2r2GW) with r2
GB as the average variance component
among populations, and r2GW as the average variance
component within populations (Lande 1992; Spitze
1993).
Sampling of landscape variables
Waterway distances between sampling sites and putative
barriers to trout dispersal were extracted from geographic
� 2012 Blackwell Publishing Ltd
Aare 208
Aare 205
Aare 203
Krebsbach
Lower Worble
Upper Worble
Giesse Belp
Rotache
Zulg
Amletenbach
Predatory type (large head, long jaws,
terminal mouth, fusiform body)
Benthic type (small head, short jaws,
subterminal mouth, narrow body)
Small head, round and deep body (typical female shape)
Large head, narrow body (typical male shape)
Kiese
PC
2 (1
0.2%
)
–4
–2
0
2
4
6
–6–6 –4 –2 0 2 4 6 8
PC1 (16.1%)
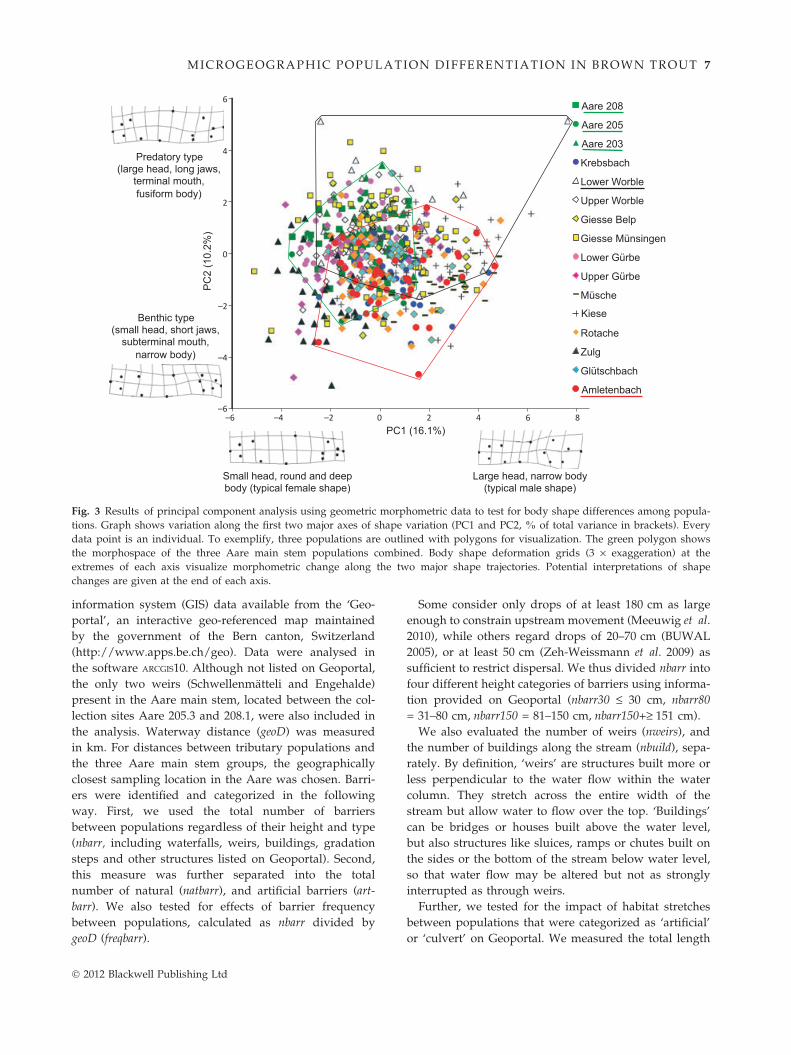
Fig. 3 Results of principal component analysis using geometric morphometric data to test for body shape differences among popula-
tions. Graph shows variation along the first two major axes of shape variation (PC1 and PC2, % of total variance in brackets). Every
data point is an individual. To exemplify, three populations are outlined with polygons for visualization. The green polygon shows
the morphospace of the three Aare main stem populations combined. Body shape deformation grids (3 · exaggeration) at the
extremes of each axis visualize morphometric change along the two major shape trajectories. Potential interpretations of shape
changes are given at the end of each axis.
MI CROGEOGRAPHIC POPULATION DIFFERENTIATION I N BROWN TROUT 7
information system (GIS) data available from the ‘Geo-
portal’, an interactive geo-referenced map maintained
by the government of the Bern canton, Switzerland
(http://www.apps.be.ch/geo). Data were analysed in
the software ARCGIS10. Although not listed on Geoportal,
the only two weirs (Schwellenmatteli and Engehalde)
present in the Aare main stem, located between the col-
lection sites Aare 205.3 and 208.1, were also included in
the analysis. Waterway distance (geoD) was measured
in km. For distances between tributary populations and
the three Aare main stem groups, the geographically
closest sampling location in the Aare was chosen. Barri-
ers were identified and categorized in the following
way. First, we used the total number of barriers
between populations regardless of their height and type
(nbarr, including waterfalls, weirs, buildings, gradation
steps and other structures listed on Geoportal). Second,
this measure was further separated into the total
number of natural (natbarr), and artificial barriers (art-
barr). We also tested for effects of barrier frequency
between populations, calculated as nbarr divided by
geoD (freqbarr).
� 2012 Blackwell Publishing Ltd
Some consider only drops of at least 180 cm as large
enough to constrain upstream movement (Meeuwig et al.
2010), while others regard drops of 20–70 cm (BUWAL
2005), or at least 50 cm (Zeh-Weissmann et al. 2009) as
sufficient to restrict dispersal. We thus divided nbarr into
four different height categories of barriers using informa-
tion provided on Geoportal (nbarr30 £ 30 cm, nbarr80
= 31–80 cm, nbarr150 = 81–150 cm, nbarr150+‡ 151 cm).
We also evaluated the number of weirs (nweirs), and
the number of buildings along the stream (nbuild), sepa-
rately. By definition, ‘weirs’ are structures built more or
less perpendicular to the water flow within the water
column. They stretch across the entire width of the
stream but allow water to flow over the top. ‘Buildings’
can be bridges or houses built above the water level,
but also structures like sluices, ramps or chutes built on
the sides or the bottom of the stream below water level,
so that water flow may be altered but not as strongly
interrupted as through weirs.
Further, we tested for the impact of habitat stretches
between populations that were categorized as ‘artificial’
or ‘culvert’ on Geoportal. We measured the total length

8 R. B . ST EL KEN S ET AL.
of culverts (cullength) and sections of artificial habitat
(arthab) between pairs of populations. Because every
150 m of artificial habitat and every 70 m of culverts
are considered equally inhibitive to gene flow as one
physical barrier (Zeh-Weissmann et al. 2009), arthab and
cullength were divided by 150 and 70, respectively, and
added to the total number of barriers (nbarrculart) to
obtain an overall measure of the fragmentation of the
dispersal routes between populations.
Besides the amount of barriers, the streams in this
study also differ substantially in their topographic slope
gradients. Some streams originate in steep areas of the
pre-Alps (e.g. Zulg) while others run in valleys (e.g.
Gurbe) or close and parallel to the Aare (Giesse Muns-
ingen, Giesse Belp; see Fig. 1). To account for this dif-
ference in stream ecology and the resulting variation in
trout habitat, we measured the elevation 2 km up- and
down-stream from each sampling site (Table 1), using
Google Earth. The difference in elevation was divided
by the total distance between the two reference points
(4 km) to obtain a measure of the slope of the stream.
Testing for relationships between landscape andpopulation structure
Dissimilarity matrices of all variables using Euclidian
distances were calculated to test for correlations between
landscape characteristics (waterway distances and the
different measures and types of barriers) and
genetic ⁄ phenotypic differentiation. Correspondence
between matrices was measured using Mantel (Mantel
1967; Legendre & Fortin 1989) and partial Mantel tests
(Smouse et al. 1986) as implemented in the ecodist pack-
age in R (Goslee & Urban 2007) with Pearson correlations.
P-values were obtained with 100 000 permutations.
Eleven different distance matrices were built from
comparisons between all possible pairs of populations,
and used as independent variables: (i) waterway dis-
tance (geoD); (ii) the total number of barriers (nbarr);
(iii) the total number of artificial barriers (artbarr); (iv)
the total number of natural barriers (natbarr); (v) the fre-
quency of barriers (freqbarr); (vi) different height catego-
ries of barriers (nbarr30, nbarr80, nbarr150, nbarr150 + );
(vii) the number of weirs (nweirs); (viii) the number of
buildings (nbuild); (ix) the length of artificial habitat (art-
hab); (x) the length of culverts (cullength); and (xi) a
cumulative measure of all dispersal barriers (nbarrculart;
calculations of each of these variables have been given
earlier). Note that, analyses involving arthab, cullength
and nbarrculart only include the 13 tributary popula-
tions because there was no geospatial data available on
habitat quality in the Aare main river.
Distance matrices used as response variables were: (i)
genetic differentiation between populations (genD)
containing pairwise Dest estimates; and (ii) phenotypic
differentiation (phenDPC1 and phenDPC2) containing
pairwise PST estimates based on either PC1 or PC2. The
association between phenotypic (phenD) and genetic
distances (genD) between populations was also exam-
ined in a Mantel test.
Barriers like waterfalls, weirs or gradation structures
with high drops may restrict dispersal only in the
upstream direction of water flow, which can cause com-
plex asymmetric patterns of gene flow among popula-
tions (Neville et al. 2006a). To take this potential
asymmetry in the effect of barriers into account we
compared, following Meeuwig et al. (2010), the differ-
entiation of populations separated by barriers in only
one direction of dispersal (where only one population
would have to face barriers when migrating upstream)
with the differentiation of populations separated by bar-
riers in both directions (where both populations would
have to face barriers migrating upstream). We predicted
the degree of differentiation to be larger in the second
group since gene flow is restricted in both directions.
Finally, we tested for effects of topographic stream
slope on body shape (mean PC2) and genetic diversity
(k, HE) in linear regressions.
Predictions with respect to genetic drift and selection
Analyses were run with the following predictions: (i) if
isolation-by-distance was driving population divergence,
pairwise Dest and PST estimates should increase with
increasing waterway distances; (ii) if genetic drift was
driving divergence, Dest and PST should increase with an
increasing number of dispersal-inhibiting barriers
between populations; (iii) if diversifying selection across
habitats played a more important role in population
divergence than genetic drift, geographic distance and
the extent of landscape fragmentation would be unlikely
to predict spatial patterns in neutral genetic and pheno-
typic variation; (iv) if selection was more important than
drift in shaping spatial population structure, phenotypic
population differentiation would not be reliably pre-
dicted by the extent of neutral genetic divergence; and
(v) the intensity of stocking per stream correlates nega-
tively with measures of genetic diversity because stock-
ing normally increases the variance in reproductive
success between individuals and hence reduces genetic
diversity (unless non-native individuals are used for
stocking which is not the case in this system).
Assessing the impact of stocking on diversity
In our study area, the Fisheries Inspectorate of the Bern
canton controls the stocking of brown trout. Their pol-
icy over the last decades stipulates that tributaries can
� 2012 Blackwell Publishing Ltd

MI CROGEOGRAPHIC POPULATION DIFFERENTIATION I N BROWN TROUT 9
only be stocked with offspring of wild spawners caught
from the respective stream, while the Aare main stream
can be stocked with offspring of spawners caught in the
Aare or tributaries (mainly Aare and Musche stock was
used in the Aare in the last 30 years). As a yearly rou-
tine, members of the Fisheries Inspectorate collect wild
spawners during the spawning season, use their
gametes for generating within-population crosses, and
raise the offspring of each stream separately until hatch-
ing. Some of these fish are stocked as alevins, but the
majority is stocked after six weeks of rearing in tanks
or as fingerlings after some weeks in streamlets. Since
mortality during this time is mostly not recorded, we
used the total number of alevins that were raised in the
hatchery since 1981 as a measure of overall stocking
intensity per experimental stream. The production of
alevins is summarized in Table S1. For the Aare main
stream, the numbers of Aare (but not Musche) individ-
uals released into each of the three Aare sectors were
available since 1986. We used these records to generate
a proportional distribution key of individuals into
sectors (Aare 203: 40.3%; Aare 205: 37.8%; Aare 208:
21.9%). Of the Musche stock released in the Aare, only
the total number of individuals for the entire Aare river
was available. We used the distribution key to estimate
the stocking effort of Musche stock into Aare sectors.
Individual numbers of Musche and Aare individuals
were then added to obtain the total stocking effort for
each Aare sector (Table S1). For Gurbe and Worble,
only the total number of individuals per tributary but
no sector-specific (‘Upper’ and ‘Lower’) numbers were
available. We thus assumed an even distribution of the
total number of stocked individuals across the two sam-
pling sites.
Assessing population densities
All sampling locations except Musche were electro-
fished in mid October 2009 (as described above). All
individuals were counted and released thereafter. The
tributaries are small enough so that fishing can be con-
sidered exhaustive and the total number of brown trout
per 100 m was taken as a proxy for population density
per location. There was no data available on population
density in the three Aare sectors. We tested for associa-
tions between stocking effort, population density, and
genetic diversity using linear regressions.
Results
Genetic diversity
The total number of alleles across populations ranged
from 4 to 28 alleles per locus. The mean number of
� 2012 Blackwell Publishing Ltd
alleles per locus ranged from 4.4 to 19.5 across popula-
tions. Allelic richness (k) per population ranged from
7.6 to 10.6. Mean HE across loci and populations was
0.78 ± 0.02, ranging from 0.73 to 0.81. Mean HO was
0.74 ± 0.03 ranging from 0.67 to 0.79. No linkage-dis-
equilibrium was found between any pairs of loci, and
no deviations from random mating were observed, nei-
ther among loci within populations nor among popula-
tions within loci. Based on the global test for
heterozygote deficit, there were no signs for severe
inbreeding (global FIS = 0.046, 95% CI: 0.011–0.08).
Overall, genetic population differentiation was moder-
ate (global FST = 0.022, 95% CI: 0.019–0.025), but as
many as 105 (88%) of the 120 possible pairwise popula-
tion comparisons were significant after Bonferroni cor-
rection for multiple testing (Table 2). Some population
pairs showed greater genetic dissimilarity than others,
yielding a range of discrete FST estimates from 0.003 to
0.048 (Dest estimates ranged from 0.006 to 0.145).
STRUCTURE results suggested that a K value of 6 best
describes the number of populations in the 13 tributar-
ies (large pie charts in Fig. 1 represent the affiliation of
each population to the six clusters). The estimated log
probability of the data L(K) is large at K of 6, after
which there is a break in the slope and variance
between replicate runs of K substantially increases
(Fig. S2a). The maximal value of L(K) returned by the
method of Evanno et al. (2005) was lower with only
three clusters (indicated as small pie charts in Fig. 1,
and the highest peak in Fig. S2b). Assignment test
using discriminant function analysis of principal com-
ponents (DAPC; Jombart et al. 2010) suggested that on
average 70% of all individuals could be correctly
assigned to their sampling-location using multivariate
genotypes (for population-specific assignment success
see percentages in Table 1).
Phenotypic diversity
We found pronounced differences in body shape
morphology among populations (Fig. 3). Analysis of
multitrait phenotypes produced two major axes of
shape variation. PC1 and PC2 explained 16.7% and
10.2% of total variance in the data set. One-way ANOVAs
of ‘population’ as factor on both PCs were highly signif-
icant (PC1: F15,579 = 25.2, P < 0.001; PC2: F15,579 = 16.2,
P < 0.001) indicating population-specific differences in
body shape. Discriminant analysis showed that 69% of
all individuals (401 out of 580) were correctly assigned
to the sampling locations using principal components of
body shape (Pillai’s Trace = 3.48, P < 0.001). Tukey–
Kramer tests showed that 50% (using PC1) and 43%
(using PC2) of all pairwise population comparisons
were significant. Figure 3 illustrates the morphospace

Stream slope
Mea
n P
C2
Fig. 4 The relationship between topographic stream slope and
body shape (mean PC2 within populations).
10 R. B . ST EL KEN S ET AL.
occupied by each population (e.g. the Aare main stem
populations, Lower Worble, and Amletenbach are high-
lighted as green, black and red polgyons, respectively).
Deformation grids in Fig. 3 (3 · exaggerated) show
body shape changes along the axes. PC1 mainly reflects
variation in shape related to sexual dimorphism: On the
positive end of PC1, individuals have large heads and
long jaws with a rather narrow and straight, almost
concave, body shape representing typical male traits.
On the negative end, representing the typical female
shape, fish have small heads, short jaws and rounded,
deep bodies. Only a subset of the phenotyped fish in
this study was sexed (n = 48), but sex explained signifi-
cant amounts of variance along PC1 in this subset
(t47 = 6.96, P < 0.001), suggesting that indeed most of
the variation along PC1 is due to sexual differences in
body shape (Fig. S3 shows photos of some specimens
distributed along PC1). Variation along PC2, however,
shows shape changes that are unrelated to sex. The
deformation grids demonstrate that individuals located
towards the negative extreme of PC2 have small heads
with a downward-pointing snout and an overall rather
square body shape with a straight back. Towards the
positive end of PC2, fish have larger heads with an
upwards pointing nose, a terminal mouth, a convex
back line, and an overall fusiform shape. The deforma-
tion along PC2 predicted from these grids is visualized
in Fig. S4, where photos of some specimens are plotted
and distributed along PC2 (females are shown on the
left, males on the right side of the graph to demonstrate
that shape changes along PC2 affect both females and
males similarly).
Effects of stream slope on diversity
Variation in body shape was explained by the topo-
graphic slope of the streams (mean PC2 within popula-
tions: r = 0.58, P = 0.018; Fig. 4). Populations inhabiting
steeper habitats show smaller heads and more down-
wards pointed mouths whereas populations in
shallower habitats have larger heads, terminal mouths
and deeper bodies. Genetic diversity was not signifi-
cantly affected by the slope of the streams (k and HE:
)0.01<r<0.01, P > 0.73).
Testing for the effects of habitat fragmentation andisolation-by-distance
Pairwise waterway distance between populations was
significantly positively related to their phenotypic
differentiation (Mantel tests of geoD on phenDPC2 (PST
estimates based on PC2): rM = 0.22, P = 0.03, 95% CI:
0.05–0.42; Fig. 5a). Although not significant, a positive
trend was also observed for the effect of waterway
distance on genetic differentiation (geoD on genD (Dest
estimates): rM = 0.14, P = 0.08, CI: 0.03–0.28).
Potential dispersal barriers were found every 846 m
of waterway, on average. The extent of genetic differen-
tiation increased significantly with the number of weirs
between populations (nweirs on genD: rM = 0.26,
P = 0.027, CI: 0.14–0.40; Fig. 5b). None of the other
potential barriers (nbarr, nbarrculart, natbarr, artbarr,
nbarr30, nbarr80, nbarr150, nbarr150 + , freqbarr, nbuild,
arthab) showed an effect on genetic or phenotypic
differentiation.
The number of dispersal barriers is often linked to
the total waterway distance between populations and
can thus confound the effects of isolation-by-distance
and habitat fragmentation. Indeed, the number of weirs
increased with increasing geographic distance between
populations (nweirs on geoD: rM = 0.51, P < 0.001, CI:
0.40–0.62, Fig. S5). We thus investigated the relation-
ship between the three distance matrices (nweirs, geoD,
genD). A partial Mantel test on the impact of weirs after
removing isolation-by-distance effects was close to
significance (nweir + geoD on genD: rM = 0.22, P = 0.06,
CI: 0.09–0.36). Partial Mantel test on isolation-by-dis-
tance after removing weir effects did not yield signifi-
cance (geoD + nweir on genD: rM = 0.01, P = 0.89, CI:
)0.07–0.11).
Individuals collected from the three locations along
the main stream may be less likely to represent biologi-
cal populations than individuals collected in the tribu-
taries since spatial connectivity in the main stream is
probably higher, potentially blurring isolation-by-
distance between locations. At the same time, diver-
gence between tributary populations may be caused by
the dendritic habitat structure itself (Carlsson et al.
1999; Kanno et al. 2011). We thus ran analyses exclud-
ing the three Aare main stem populations 208, 205, and
� 2012 Blackwell Publishing Ltd

Gen
etic
pop
ulat
ion
diffe
rent
iatio
n (c)
Waterway distance (km)
(b)
Gen
etic
pop
ulat
ion
diffe
rent
iatio
n
N of weirs
(d)
Phe
noty
pic
popu
latio
n di
ffere
ntia
tion
Genetic population differentiation
(a)
Phe
noty
pic
popu
latio
n di
ffere
ntia
tion
Waterway distance (km)
Fig. 5 Potential predictors of genetic and phenotypic population differentiation. Graphs show linear regression on untransformed
data with each data point representing a pairwise population comparison (Mantel statistics given in the text account for spatial auto-
correlation). a) The extent of phenotypic differentiation (PST based on PC2) between populations was significantly positively corre-
lated (in Mantel tests) to waterway distance (km). b) The extent of genetic differentiation (Dest) was significantly positively correlated
to the number of weirs. c) Genetic differentiation was significantly positively correlated to waterway distance. This graph shows a
subset of data including tributary populations only. d) Phenotypic (PST based on PC2) and genetic (Dest) differentiation were not
correlated.
MI CROGEO GRAPHIC POPULATI ON DIFFERE NTIATION IN BROWN TROUT 11
203. Tested on tributary populations only, divergence
increased both genetically (geoD on genD: rM = 0.26,
P = 0.018, CI: 0.13–0.47; Fig. 5c) and phenotypically
(geoD on phenDPC2: rM = 0.29, P = 0.023, CI: 0.014–0.58)
with waterway distance. The effect of weirs was again
close to significance (nweirs on genD: R = 0.25, P = 0.08,
CI: 0.12–0.43).
The longer the culverts were between populations,
the more different populations were phenotypically
(cullength on phenDPC2: rM = 0.41, P = 0.006, CI: 0.24–
0.57; note that this result includes only tributary
populations as no information on habitat quality was
available for the Aare main stream).
Using the entire data set, including the Aare main
stream populations, the extent of eco-morphological dif-
ferentiation between populations was not associated
with their genetic differentiation (genD on phenDPC1:
rM = )0.04, P = 0.78, CI: )0.13–0.15; genD on phenDPC2:
rM = )0.08, P = 0.37, CI: )0.16–0.03; Fig. 5d).
ANOVA testing for dispersal asymmetry (comparing
the differentiation of populations separated by barriers
in only one direction of dispersal with differentiation of
populations separated by barriers in both dispersal
directions) did not show significant differences between
� 2012 Blackwell Publishing Ltd
the two groups (F1,155 = 0.11, P = 0.74), suggesting that
dispersal asymmetry does not play a prominent role in
shaping population structure in this system.
In summary, genetic population divergence was posi-
tively related to the extent of fragmentation by weirs.
When tested among tributary populations, genetic
divergence also increased with waterway distance. In
addition, the longer the waterway distances between
populations, and the more culverts between them, the
higher their phenotypic divergence. However, effects of
waterway distance could not be conclusively disentan-
gled from effects of fragmentation by weirs.
Impact of population density and stocking
Genetic diversity increased with increasing population
density (k: r = 0.69, n = 12, P = 0.013; HE: r = 0.79,
P = 0.002; Fig. 6a, excluding Musche and Aare). Stock-
ing intensity did not significantly correlate with popula-
tion density (r = 0.23, n = 12, P = 0.46) or with the
observed genetic diversity in the tributaries, but there
was a positive trend (k: r = 0.52, n = 13, P = 0.068; HE:
r = 0.46, P = 0.11; Fig. 6b, the Aare populations were
excluded here due to the mixed origin of their stock).

(b)(a)
Fig. 6 The relationship between measures of genetic diversity (k: filled symbols, solid line; HE = open symbols, hatched line) and a)
population density; and b) between measures of genetic diversity and stocking intensity (total number of alevins produced in the
hatchery over the last 30 years; in thousands). Sample sizes vary because population density was not estimated for Musche (indi-
cated with stars). However, exceptionally high numbers of spawners can regularly be caught from this comparatively small stream,
further supporting the correlations in panel a. Lines represent significant regressions. See text for statistics.
12 R. B . ST EL KEN S ET AL.
FIS was not predicted by population density (r = )0.28,
n = 12, P = 0.39), stocking intensity (r = )0.12, n = 13,
P = 0.69), or the total number of females used for the
stocking program (r = 0.0, n = 13, P = 0.98).
Discussion
We investigated the genetic and phenotypic diversity
and population divergence of brown trout inhabiting a
40 km long stretch of the Aare river (Switzerland) and
its tributaries. We tested whether incorporating land-
scape features along dispersal corridors better correlates
with patterns of population differentiation than a pure
isolation-by-distance model.
Genetic and phenotypic diversity
We found overall high genetic diversity with no signs
of inbreeding, and only slight variation between popu-
lations in observed heterozygosity and allelic richness.
Global population differentiation was moderate (global
FST = 0.022) as expected for a network of salmonid pop-
ulations within the same catchment (Carlsson & Nilsson
2000; Jensen et al. 2005; Heggenes & Roed 2006;
Griffiths et al. 2009; Lehtonen et al. 2009; Hansen et al.
2010; Kanno et al. 2011). Populations differed consider-
ably both genetically and phenotypically. Eighty-eight
percent of all pairwise FST comparisons, and 50%
(along PC1) and 43% (along PC2) of all comparisons in
body shape were significant. The high success rates of
assignment tests using genotypic (70%) and phenotypic
data (69%) confirm the distinctiveness of populations.
The high rates of significant pairwise FST comparisons
found here (despite low global FST values) seem typical
for resident salmonids (100% of all pairwise population
comparisons were significant in Carlsson & Nilsson
2001; 100% in Jensen et al. 2005; 86% in Heggenes &
Roed 2006; 76% in Griffiths et al. 2009; 34% in Junge
et al. 2011).
These data suggest that brown trout in the Aare sys-
tem diverged genetically and phenotypically on a small
geographic scale (pairwise waterway distances between
populations ranged from 2–40 km), in agreement with
several studies on resident salmonid populations that
found geographical structuring on a similarly small spa-
tial scale (Estoup et al. 1998; Carlsson & Nilsson 2000;
Barson et al. 2009; Griffiths et al. 2009; Kanno et al.
2011).
Keller et al. (2011) recently presented evidence for
neutral and adaptive divergence to altitude in brown
trout in Switzerland. Their sampling region encom-
passed a geographically larger area including three cen-
tral European drainage systems (Rhone, Rhine and Po),
but also included individuals from two tributaries sam-
pled in this study (Kiese and Rotache). Our study takes
a magnifying glass to Keller et al.’s results, revealing
that considerable genetic and phenotypic variation
occurs even on a much smaller geographic dimension,
within the same area, demonstrating that even small
tributary populations, which may be low in productiv-
ity, can significantly contribute to the overall genetic
diversity of a region.
The microgeographic structuring found here speaks
for spatially restricted populations that do not
frequently disperse long distances. Whatever may be
the reason (e.g. ecological habitat preferences or physi-
cal barriers), constrained dispersal ranges and restricted
gene flow make these populations vulnerable to anthro-
pogenic change. Even though an increasing number of
studies demonstrates that salmonids can respond to
environmental change within 6–30 generations (Haugen
& Vøllestad 2000; Hendry et al. 2000; Quinn et al. 2001;
Unwin et al. 2003; Kinnison et al. 2008; Kavanagh et al.
2010; Fraser et al. 2011), the speed of adaptive evolution
depends on the interplay between gene flow, genetic
drift, the strength of selection and standing genetic vari-
ation (Adkison 1995; Hansen et al. 2002, 2007; Hendry
et al. 2007). In order for populations to be able to adapt
� 2012 Blackwell Publishing Ltd

MI CROGEO GRAPHIC POPULATI ON DIFFERE NTIATION IN BROWN TROUT 13
to changing environmental conditions, their genetic
diversity must be maintained. In this context, stocking
is a rather controversial practice (Araki et al. 2007;
Fraser 2008; Eldridge et al. 2009). Domestication selection
in hatcheries, or increased genetic drift caused by stock-
ing, can potentially lead to the loss of local adaptation
(Hansen et al. 2009; Muhlfeld et al. 2009), and hatchery
fish can have lower long-term fitness in the wild
(Poteaux et al. 1998; Hansen et al. 2001; Ruzzante et al.
2001). In contrast, stocking may, at times, save popula-
tions through ecological crises (e.g. when natural
spawning places are temporally lost).
The river Aare and most of its tributaries have been
systematically stocked since decades. Stocking typically
increases the variance in reproductive success between
individuals within a population, which is usually
expected to lead to an erosion of genetic diversity
(unless non-native individuals are used for stocking
which is not the case in this system) (Laikre et al. 2010).
Contrary to these expectations, we found positive
correlations between stocking intensity and genetic
diversity that were close to statistical significance. It is
likely that this pattern is caused by the fact that stock-
ing is more intense in rivers with larger populations,
and because larger census size increases genetic diver-
sity (supported here by the finding that diversity
increases with population density). These results leads
us to conclude that there is no significant stocking-
induced genetic drift, and that stocking is not likely to
be the driver of population divergence here.
Reliable long-term data on stocking effort are notori-
ously difficult to obtain and it is quite unusual for a
central European river system like the Aare to have
such detailed data on hatchery-raised breeding stock at
hand. However, our conclusions are based on compara-
bly rough measures of stocking intensities and widely
varying numbers across the last 30 years. Proportional
estimates of the number of wild versus stocked fish, for
instance, would be useful but were unavailable. In
addition, little is known about the effectiveness of the
stocking program in this region. It should be noted that
in the Aare system, any cross-stocking between tributar-
ies, which could erode genotypic and phenotypic diver-
sity over time (Largiader & Scholl 1995), is prohibited.
Any steward leasing a brook or streamlet, signs an
agreement that their entire stock is obtained from the
same state-run hatchery and this regulation has been
operative for decades (C. Kung, Head of Fisheries,
Berne canton, personal communication). The only
exception is the Aare main stem, which is regularly
stocked with fish from the Musche (because high num-
bers of spawners are caught in the Musche while the
number of spawners obtained in the Aare has been
continuously declining since the 1980s). However,
� 2012 Blackwell Publishing Ltd
increased similarity of the genetic composition of these
two populations, potentially caused by artificially
enhanced gene flow through stocking, was not identi-
fied here.
Divergence mechanisms
We could not disentangle the effects of isolation-
by-distance and habitat fragmentation on divergence
(pairwise waterway distances and the number of weirs
between populations covaried). We found that one type
of barrier, the number of weirs between populations,
may contribute to genetic differentiation. In agreement
with this, weirs (Meldgaard et al. 2003) and other geo-
morphological features (e.g. Ferguson 1989; Moran et al.
1995; Bouza et al. 1999; Ruzzante et al. 2001; Heggenes
& Roed 2006) have been identified to physically reduce
gene flow between salmonid populations. At the same
time, we found that waterway distance predicted
genetic population differentiation, at least among tribu-
tary populations. It has been suggested that the net-
work structure of tributaries can play a role in
population divergence (Carlsson et al. 1999; Kanno
et al. 2011), and movement between branch populations
may be limited due to ecological factors (habitat prefer-
ences and philopatry). With regard to phenotypic differ-
entiation, we found that the total length of culverts
(subterranean canalization) between sampling sites
correlated with divergence in overall body shape. In
summary, both artificially induced genetic drift due to
habitat fragmentation and natural effects of isolation-
by-distance may affect population divergence in this
system. Because the effects of geographical distance and
habitat fragmentation are confounded here and because
of its stocking history, the Aare river may not be the
ideal system to investigate the degrees with which drift
or selection contribute to population divergence.
Interestingly, the majority of studies on salmonid net-
works do not reveal isolation-by-distance effects (Ryman
1983; Crozier & Ferguson 1986; Ferguson 1989; Moran
et al. 1995; Hansen & Loeschcke 1996; Bouza et al. 1999;
Carlsson & Nilsson 2001; Castric et al. 2001; Ruzzante
et al. 2001; Meldgaard et al. 2003; Heggenes & Roed
2006), with a few exceptions (Estoup et al. 1998; Carls-
son & Nilsson 2000; Griffiths et al. 2009; Lehtonen et al.
2009). A possible explanation for this effect is that
isolation-by-distance can become obscured by analytical
artefacts, that is, insufficient resolution of molecular
markers, unsuitable statistical approaches (see for
review Jaquiery et al. 2011), and sampling regimes not
fine-scaled enough with respect to the geographical loca-
tions of the populations and their dispersal abilities
(Dungan et al. 2002; Anderson et al. 2010; Cushman &
Landguth 2010). We accounted for these potential

14 R. B . ST EL KEN S ET AL.
pitfalls here: We applied a fine-scaled geographic sam-
pling regime and used mostly large sample sizes. The
number of microsatellites used here (n = 11), the fact
that they were in linkage equilibrium and their level of
allelic information content is usually considered suffi-
cient to resolve population structure (e.g. Gomez-Uchida
et al. 2009; Griffiths et al. 2009; Taylor et al. 2011). Multi-
variate genotypes were assigned to their source popula-
tions with 70% success rate and DAPC ensured that the
variables entering the models were uncorrelated. Finally,
Mantel tests are conservative with regard to spatial
autocorrelation and false positives generated by the non-
independence of the pairwise data (Epperson 2010).
Functional interpretation of variation body shape
Ecological selection can lead to local adaptation or phe-
notypically plastic responses, allowing individuals to
have higher relative fitness in their native habitat than
non-natives (Kawecki & Ebert, 2004). As a consequence,
gene flow between populations may become reduced
due to selection against immigrants (Schluter 2000;
Hendry 2001, 2004; Nosil 2004; Rundle & Nosil 2005)
and lead to divergence among populations, even with-
out physical isolation (Piertney et al. 2001; Koskinen
et al. 2002; Irwin et al. 2005). It is possible that the mor-
phological differentiation we found between popula-
tions reflects some level of adaptive divergence or
plastic phenotype-habitat matching, instead of being the
mere byproduct of isolation-by-distance and habitat
fragmentation.
Our assessment of body shape revealed some inter-
esting morphological differences, allowing for some
speculation on the ecology of populations. While varia-
tion along PC1 was mainly explained by sexually
dimorphic traits, shape changes along PC2 point to
(genetic or plastic) adaptations of trophic and
swimming structures, affecting both males and females
similarly. Populations inhabiting tributaries with a stee-
per slope (e.g. Zulg) seem to have overall shallower
bodies, smaller heads and downward-pointing mouths.
These may well be adaptations to a life style in shallow
and fast flowing water, where feeding on food items
attached to the stream bed (like caddisfly larvae) and a
body shape that allows hiding behind rocks (e.g. like a
bottom dwelling sculpin) is advantageous. Populations
in slow flowing, wider and deeper streams (e.g. Giesse
Munsingen) have large heads and jaws with terminal or
upward pointing mouths, which may be adaptations to
a more predatory life style, for example, allowing them
to hunt for small fish in open water.
Variation in overall body shape is one of the best-
known morphological responses in salmonids to flow
regime (Riddell & Leggett 1981; Taylor 1991; Hendry
et al. 2000; Pakkasmaa & Piironen 2000; Langerhans
2008; Paez et al. 2008) and has been demonstrated to be
heritable several times independently (Hard et al. 1999;
Hendry 2001; Boulding et al. 2008; Varian & Nichols
2010). Fusiform shapes (such as those on the positive
end of PC2) are generally thought to improve sustained
swimming and foraging in open waters (Taylor & Foote
1991), which is consistent with the potential predatory
function of the large head and jaws we found here.
Also the size of the water body has been shown to
affect the body shape of salmonids. Larger streams (and
lakes) are typically inhabited by more robust fish with
larger heads, bodies and fins (Beacham & Murray
1987). With respect to head morphology, studies in
other species of fish have predicted (Wainwright &
Richard 1995) and confirmed (Nicieza 1995; Blackie
et al. 2003) that variation in head shape can reflect
adaptations to different dietary sources.
Though our results do not establish a causal relation-
ship between the ecological conditions these popula-
tions encounter and their body shape, the streams in
this study show pronounced differences not only in
slope, but also in other physical parameters (e.g. rate of
discharge, flow velocity, depth, width, substrate, degree
of shading, temperature; data not shown here). Hence,
it seems that there is great potential in this system for
phenotypic variation to be generated by local adapta-
tion and ⁄ or plasticity. In summary, the differences in
body shape found in different tributary populations
may be the result of population divergence mediated, at
least to a degree, by diversifying ecological selection for
(genetic or plastic) adaptation to flow velocity and die-
tary compounds.
Phenotypic divergence without genetic divergence
Phenotypic and genetic differentiation were not associ-
ated in our study. This may be because traits under
strong diversifying selection can display fine-scale spa-
tial variation without significant differentiation at neu-
tral loci, which would be in accordance with the above
finding that trophic and swimming structures varied
with ecological habitat heterogeneity, whereas genetic
differentiation did not. It has been demonstrated in
salmonids (Hendry et al. 2000; Junge et al. 2011) and
other species (Stockwell et al. 2003; Hairston et al. 2005)
that local adaptation can eventually overcome the
homogenizing effects of gene flow, but that the pheno-
typic response to environmental change generally
exceeds the genetic response in salmonids (Koskinen
et al. 2002; Rogers et al. 2002; McClelland & Naish
2007; Jensen et al. 2008; Kinnison et al. 2008) and other
species (e.g. Trussell & Smith 2000; Both & Visser 2001;
Reale et al. 2003).
� 2012 Blackwell Publishing Ltd

MI CROGEO GRAPHIC POPULATI ON DIFFERE NTIATION IN BROWN TROUT 15
Spatially structured, phenotypic diversity without sig-
nificant genetic divergence can also be the result of phe-
notypic plasticity. A recent review (Hutchings 2011) on
salmonids summarizes evidence that population differ-
ences in reaction norms can reflect adaptive responses
to local environments, and that phenotypic plasticity
itself is heritable. Hendry et al. (2008) and others (e.g.
Charmantier et al. 2008) argue that human-induced
environmental change can be bridged by the plasticity
of wild populations. The plastic response places the
population closer to a fitness peak, which may aid pop-
ulation persistence by weakening selection (Price et al.
2003; Chevin & Lande 2010; Luquet et al. 2011). It has
been shown that phenotypic plasticity can ‘rescue’ pop-
ulations from extinction by increasing survival in frag-
mented landscapes (Letcher et al. 2007). As a
consequence, the genetic response of traits under selec-
tion may be slowed down by plasticity (Price et al.
2003) explaining the lack of genetic population differen-
tiation. Our results are consistent with this slow-down
effect, but more detailed analyses are needed to deter-
mine if any of these mechanisms are operational.
Conclusions
Substantial genetic and phenotypic variation was found
among brown trout populations within a geographically
small area (within 40 km). Spatial substructure in
genetic and phenotypic diversity was correlated to frag-
mentation by weirs and, in the case of tributary popula-
tions, to isolation-by-distance effects. Phenotypic
divergence was also related to the length of poor habi-
tat between populations. Eco-morphological differences
in trophic and swimming structures among populations
could be largely explained by the topographic slope of
the streams, indicative of differences in trout habitat.
These differences speak for the presence of local adap-
tion or phenotypic plasticity to flow velocity, stream
size or dietary resources. The interdisciplinary approach
applied in this study, integrating population genetics,
multivariate phenotype analysis, and landscape analy-
sis, can serve to uncover cryptic genetic and phenotypic
diversity. A sound understanding of the degree and
scale of population divergence may be crucial for man-
agement and conservation.
Acknowledgements
We dedicate this paper to the memory of H. Walther who gen-
erously provided much advice and assistance in this and other
collaborations with the Reutigen Hatchery. We thank E. Baum-
gartner, K. Bettge, A. Brechon, P. Busser, E. Clark, R. Droz, A.
Escher, W. Grossenbacher, U. Gutmann, J. Hanimann, J. Knorr,
L. Kocjancic-Curty, C. Kropf, P. Landolf, S. Nussle, M. Pompini,
� 2012 Blackwell Publishing Ltd
A. Ross-Gillespie, F. Russier, M. Schmid, and K. von Wattenwyl
for support and assistance in the field and in the laboratory. We
thank C. Kung from the Fisheries Inspectorate Bern for permis-
sions, and C. Kung, U. Gutmann, and other staff of the Reutigen
Hatchery for sharing information on stocking programs since
1981. We are indebted to J.P. Danko, M. dos Santos, J. El-Assad,
A. Espindola, J. Goudet, S. Mariani, S. Nussle, C. Tanner,
E. Taylor, K.A. Young, and two anonymous reviewers for criti-
cal review and various helpful comments. This study complied
with the relevant ethical regulations imposed by the university,
canton, and country in which it was carried out. The Swiss
National Science Foundation, the Bern canton, and the Maison
de la Riviere provided funding.
References
Adkison MD (1995) Population differentiation in Pacific salmon:
local adaptation, genetic drift, or the environment? Canadian
Journal of Fisheries and Aquatic Sciences, 52, 2762–2777.
Anderson CD, Epperson BK, Fortin MJ et al. (2010)
Considering spatial and temporal scale in landscape-genetic
studies of gene flow. Molecular Ecology, 19, 3565–3575.
Araki H, Cooper B, Blouin MS (2007) Genetic effects of captive
breeding cause a rapid, cumulative fitness decline in the
wild. Science, 318, 100–103.
Armbruster P, Reed DH (2005) Inbreeding depression in
benign and stressful environments. Heredity, 95, 235–242.
Barson NJ, Haugen TO, Vollestad LA, Primmer CR (2009)
Contemporary isolation-by-distance, but not isolation-
by-time, among demes of European Grayling (Thymallus
thymallus, Linnaeus) with recent common ancestors.
Evolution, 63, 549–556.
Beacham TD, Murray CB (1987) Adaptive variation in body
size, age, morphology, egg size, and developmental biology
of chum salmon (Oncorhynchus keta) in British Columbia.
Canadian Journal of Fisheries and Aquatic Sciences, 44, 244–261.
Blackie CT, Weese DJ, Noakes DLG (2003) Evidence for
resource polymorphism in the lake charr (Salvelinus
namaycush) population of Great Bear Lake, Northwest
Territories, Canada. Ecoscience, 10, 509–514.
Borsuk ME, Reichert P, Peter A, Schager E, Burkhardt-Holm P
(2006) Assessing the decline of brown trout (Salmo trutta) in
Swiss rivers using a Bayesian probability network. Ecological
Modelling, 192, 224–244.
Both C, Visser ME (2001) Adjustment to climate change is
constrained by arrival date in a long-distance migrant bird.
Nature, 411, 296–298.
Boulding EG, Culling M, Glebe B et al. (2008) Conservation
genomics of Atlantic salmon: SNPs associated with QTLs for
adaptive traits in parr from four trans-Atlantic backcrosses.
Heredity, 101, 381–391.
Bouza C, Arias J, Castro J, Sanchez L, Martinez P (1999)
Genetic structure of brown trout, Salmo trutta L., at the
southern limit of the distribution range of the anadromous
form. Molecular Ecology, 8, 1991–2001.
Burkhardt-Holm P (2007) Project Fischnetz: decline of fish
catch in Switzerland. Aquatic Sciences, 69, 1–2.
Burkhardt-Holm P, Peter A, Segner H (2002) Decline of fish
catch in Switzerland - Project Fishnet: a balance between
analysis and synthesis. Aquatic Sciences, 64, 36–54.

16 R. B . ST EL KEN S ET AL.
BUWAL (2005) (Hrsg.) in Zusammenarbeit mit
BWG ⁄ EAWAG ⁄ AWEL 2005: Methoden zur Untersuchung und
Beurteilung der Fliessgewasser: Okomorphologie Stufe S. BUWAL-
Reihe Vollzug Umwelt. Bundesamt fur Umwelt, Wald und
Landschaft, Bern. 49 S.
Carlsson J, Nilsson J (2000) Population genetic structure of
brown trout (Salmo trutta L.) within a northern boreal forest
stream. Hereditas, 132, 173–181.
Carlsson J, Nilsson J (2001) Effects of geomorphological
structures on genetic differentiation among brown trout
populations in a Northern Boreal river drainage. Transactions
of the American Fisheries Society, 130, 36–45.
Carlsson J, Olsen KH, Nilsson J, Overli O, Stabell OB (1999)
Microsatellites reveal fine-scale genetic structure in stream-
living brown trout. Journal of Fish Biology, 55, 1290–1303.
Castric V, Bonney F, Bernatchez L (2001) Landscape structure
and hierarchical genetic diversity in the brook charr,
Salvelinus fontinalis. Evolution, 55, 1016–1028.
Charlesworth D, Willis JH (2009) The genetics of inbreeding
depression. Nature Reviews Genetics, 10, 783–796.
Charmantier A, McCleery RH, Cole LR et al. (2008) Adaptive
Phenotypic Plasticity in Response to Climate Change in a
Wild Bird Population. Science, 320, 800–803.
Chevin LM, Lande R (2010) When do adaptive plasticity and
genetic evolution prevent extinction of a density-regulated
population? Evolution, 64, 1143–1150.
Crawford NG (2010) SMOGD: software for the measurement of
genetic diversity. Molecular Ecology Resources, 10, 556–557.
Crozier WW, Ferguson A (1986) Electrophoretic examination of
the population structure of brown trout, Salmo trutta L., from
the Lough Neagh catchment, Northern Ireland. Journal of
Fish Biology, 28, 459–477.
Cushman SA, Landguth EL (2010) Scale dependent inference
in landscape genetics. Landscape Ecology, 25, 967–979.
Cushman SA, McKelvey KS, Hayden J, Schwartz MK (2006)
Gene flow in complex landscapes: testing multiple
hypotheses with causal modeling. American Naturalist, 168,
486–499.
Dionne M, Caron F, Dodson JJ, Bernatchez L (2008) Landscape
genetics and hierarchical genetic structure in Atlantic
salmon: the interaction of gene flow and local adaptation.
Molecular Ecology, 17, 2382–2396.
Dungan JL, Perry JN, Dale MRT et al. (2002) A balanced view
of scale in spatial statistical analysis. Ecography, 25, 626–640.
Eldridge WH, Myers JM, Naish KA (2009) Long-term changes
in the fine-scale population structure of coho salmon
populations (Oncorhynchus kisutch) subject to extensive
supportive breeding. Heredity, 103, 299–309.
Epperson BK (2010) Spatial correlations at different spatial
scales are themselves highly correlated in isolation by
distance processes. Molecular Ecology Resources, 10, 845–853.
Estoup A, Presa P, Krieg F, Vaiman D, Guyomard R (1993) (CT)n
and (GT)n microsatellites: a new class of genetic markers for
Salmo trutta L. (brown trout). Heredity, 71, 488–496.
Estoup A, Rousset F, Michalakis Y et al. (1998) Comparative
analysis of microsatellite and allozyme markers: a case study
investigating microgeographic differentiation in brown trout
(Salmo trutta). Molecular Ecology, 7, 339–353.
Evanno G, Regnaut S, Goudet J (2005) Detecting the number of
clusters of individuals using the software STRUCTURE: a
simulation study. Molecular Ecology, 14, 2611–2620.
Falush D, Stephens M, Pritchard JK (2007) Inference of
population structure using multilocus genotype data:
dominant markers and null alleles. Molecular Ecology Notes,
7, 574–578.
Ferguson A (1989) Genetic differences among brown trout
(Salmo trutta) stocks and their importance for the
conservation and managment of the species. Freshwater
Biology, 21, 35–46.
Fischnetz (2004) Final Report of Project Fischnetz (in German).
Eawag Dubendorf and BUWAL, Bern, Switzerland.
Ford JS, Myers RA (2008) A global assessment of salmon
aquaculture impacts on wild salmonids. PLoS Biology, 6, e33.
Frankham R (1995) Conservation genetics. Annual Review of
Genetics, 29, 305–327.
Fraser DJ (2008) How well can captive breeding programs
conserve biodiversity? A review of salmonids. Evolutionary
Applications, 1, 535–586.
Fraser DJ, Weir LK, Bernatchez L, Hansen MM, Taylor EB
(2011) Extent and scale of local adaptation in salmonid
fishes: review and meta-analysis. Heredity, 106, 404–420.
Gerlach G, Jueterbock A, Kraemer P, Deppermann J, Harmand
P (2010) Calculations of population differentiation based on
GST and D: forget GST but not all of statistics! Molecular
Ecology, 19, 3845–3852.
Gharbi K, Gautier A, Danzmann RG et al. (2006) A linkage
map for brown trout (Salmo trutta): chromosome
homeologies and comparative genome organization with
other salmonid fish. Genetics, 172, 2405–2419.
Gomez-Uchida D, Knight TW, Ruzzante DE (2009) Interaction
of landscape and life history attributes on genetic diversity,
neutral divergence and gene flow in a pristine community of
salmonids. Molecular Ecology, 18, 4854–4869.
Goslee SC, Urban DL (2007) The ecodist package for
dissimilarity-based analysis of ecological data. Journal of
Statistical Software, 22, 1–19.
Goudet J (2002) FSTAT 2.9.3.2, a program to estimate and test
gene diversities and fixation indices (updated from Goudet
1995).
Griffiths AM, Koizumi I, Bright D, Stevens JR (2009) A case of
isolation by distance and short-term temporal stability of
population structure in brown trout (Salmo trutta) within the
River Dart, southwest England. Evolutionary Applications, 2,
537–554.
Hairston NG, Ellner SP, Geber MA, Yoshida T, Fox JA (2005)
Rapid evolution and the convergence of ecological and
evolutionary time. Ecology Letters, 8, 1114–1127.
Hansen MM, Loeschcke V (1996) Genetic differentiation among
Danish brown trout populations, as detected by RFLP
analysis of PCR amplified mitochondrial DNA segments.
Journal of Fish Biology, 48, 422–436.
Hansen MM, Nielsen EE, Bekkevold D, Mensberg KLD (2001)
Admixture analysis and stocking impact assessment in
brown trout (Salmo trutta), estimated with incomplete
baseline data. Canadian Journal of Fisheries and Aquatic
Sciences, 58, 1853–1860.
Hansen MM, Ruzzante DE, Nielsen EE, Bekkevold D,
Mensberg KLD (2002) Long-term effective population sizes,
temporal stability of genetic composition and potential for
local adaptation in anadromous brown trout (Salmo trutta)
populations. Molecular Ecology, 11, 2523–2535.
� 2012 Blackwell Publishing Ltd

MI CROGEO GRAPHIC POPULATI ON DIFFERE NTIATION IN BROWN TROUT 17
Hansen MM, Skaala O, Jensen LF, Bekkevold D, Mensberg
KLD (2007) Gene flow, effective population size and
selection at major histocompatibility complex genes: brown
trout in the Hardanger Fjord, Norway. Molecular Ecology, 16,
1413–1425.
Hansen MM, Fraser DJ, Meier K, Mensberg KLD (2009) Sixty
years of anthropogenic pressure: a spatio-temporal genetic
analysis of brown trout populations subject to stocking and
population declines. Molecular Ecology, 18, 2549–2562.
Hansen MM, Meier K, Mensberg KLD (2010) Identifying
footprints of selection in stocked brown trout populations:
a spatio-temporal approach. Molecular Ecology, 19, 1787–
1800.
Hard JJ, Winans GA, Richardson JC (1999) Phenotypic and
genetic architecture of juvenile morphometry in Chinook
salmon. Journal of Heredity, 90, 597–606.
Haugen TO, Vøllestad LA (2000) Population differences in
early life-history traits in grayling. Journal of Evolutionary
Biology, 13, 897–905.
Hedrick PW (2005) A standardized genetic differentiation
measure. Evolution, 59, 1633–1638.
Hedrick PW, Kalinowski ST (2000) Inbreeding depression in
conservation biology. Annual Review of Ecology and
Systematics, 31, 139–162.
Hedrick PW, Miller PS (1992) Conservation genetics - techniques
and fundamentals. Ecological Applications, 2, 30–46.
Heggenes J, Roed KH (2006) Do dams increase genetic
diversity in brown trout (Salmo trutta)? Microgeographic
differentiation in a fragmented river. Ecology of Freshwater
Fish, 15, 366–375.
Hendry AP (2001) Adaptive divergence and the evolution of
reproductive isolation in the wild: an empirical
demonstration using introduced sockeye salmon. Genetica,
112, 515–534.
Hendry AP (2004) Selection against migrants contributes to the
rapid evolution of reproductive isolation. Evolutionary
Ecology Research, 6, 1219–1236.
Hendry AP, Wenburg JK, Bentzen P, Volk EC, Quinn TP
(2000) Rapid evolution of reproductive isolation in the wild:
evidence from introduced salmon. Science, 290, 516–518.
Hendry AP, Nosil P, Rieseberg LH (2007) The speed of
ecological speciation. Functional Ecology, 21, 455–464.
Hendry AP, Farrugia TJ, Kinnison MT (2008) Human
influences on rates of phenotypic change in wild animal
populations. Molecular Ecology, 17, 20–29.
Hermida M, Miguel ES, Bouza C, Castro J, Martinez P (2009)
Morphological variation in a secondary contact between
divergent lineages of brown trout (Salmo trutta) from the
Iberian Peninsula. Genetics and Molecular Biology, 32, 42–50.
Hoffman JI, Amos W (2005) Microsatellite genotyping errors:
detection approaches, common sources and consequences for
paternal exclusion. Molecular Ecology, 14, 599–612.
Holderegger R, Wagner HH (2006) A brief guide to landscape
genetics. Landscape Ecology, 21, 793–796.
Hutchings JA (2011) Old wine in new bottles: reaction norms
in salmonid fishes. Heredity, 106, 421–437.
ICES (2006) Report of the working group on North Atlantic
salmon (WGNAS), 13 April 2006, ICES Headquarters. ICES
CM 2006 ⁄ ACFM: 23.
Irwin DE, Bensch S, Irwin JH, Price TD (2005) Speciation by
distance in a ring species. Science, 307, 414–416.
� 2012 Blackwell Publishing Ltd
Jacob A, Nussle S, Britschgi A et al. (2007) Male dominance
linked to size and age, but not to ‘good genes’ in brown
trout (Salmo trutta). BMC Evolutionary Biology, 11,
doi:10.1186/1471-2148-7-207.
Jaquiery J, Broquet T, Hirzel AH, Yearsley J, Perrin N (2011)
Inferring landscape effects on dispersal from
genetic distances: how far can we go? Molecular Ecology, 20,
692–705.
Jensen LF, Hansen MM, Carlsson J, Loeschcke V, Mensberg
KLD (2005) Spatial and temporal genetic differentiation and
effective population size of brown trout (Salmo trutta, L.) in
small Danish rivers. Conservation Genetics, 6, 615–621.
Jensen LF, Hansen MM, Pertoldi C et al. (2008) Local
adaptation in brown trout early life-history traits:
implications for climate change adaptability. Proceedings of
the Royal Society B-Biological Sciences, 275, 2859–2868.
Jombart T (2008) adegenet: a R package for the multivariate
analysis of genetic markers. Bioinformatics, 24, 1403–1405.
Jombart T, Devillard S, Balloux F (2010) Discriminant analysis
of principal components: a new method for the analysis of
genetically structured populations. BMC Genetics, 11, 7,
doi:10.1186/1471-2148-7-207.
Jost L (2008) G(ST) and its relatives do not measure
differentiation. Molecular Ecology, 17, 4015–4026.
Junge C, Vøllestad LA, Barson NJ et al. (2011) Strong gene
flow and lack of stable population structure in the face of
rapid adaptation to local temperature in a spring-spawning
salmonid, the European grayling (Thymallus thymallus).
Heredity, 106, 460–471.
Kanno Y, Vokoun JC, Letcher BH (2011) Fine-scale population
structure and riverscape genetics of brook trout (Salvelinus
fontinalis) distributed continuously along headwater channel
networks. Molecular Ecology, 20, 3711–3729.
Kavanagh KD, Haugen TO, Gregersen F, Jernvall J, Vøllestad
AL (2010) Contemporary temperature-driven divergence in
a Nordic freshwater fish under conditions commonly
thought to hinder adaptation. BMC Evolutionary Biology, 10,
doi: 10.1186/1471-2148-10-350.
Kawecki TJ, Ebert D (2004) Conceptual issues in local
adaptation. Ecology Letters, 7, 1225–1241.
Keller I, Taverna A, Seehausen O (2011) Evidence of neutral
and adaptive genetic divergence between European trout
populations sampled along altitudinal gradients. Molecular
Ecology, 20, 1888–1904.
Kinnison MT, Unwin MJ, Quinn TP (2008) Eco-evolutionary vs.
habitat contributions to invasion in salmon: experimental
evaluation in the wild. Molecular Ecology, 17, 405–414.
Koskinen MT, Haugen TO, Primmer CR (2002) Contemporary
fisherian life-history evolution in small salmonid
populations. Nature, 419, 826–830.
Krkosek M, Ford JS, Morton A et al. (2007) Declining wild
salmon populations in relation to parasites from farm
salmon. Science, 318, 1772–1775.
Laikre L, Schwartz MK, Waples RS, Ryman N, Ge MWG (2010)
Compromising genetic diversity in the wild: unmonitored
large-scale release of plants and animals. Trends in Ecology &
Evolution, 25, 520–529.
Lande R (1992) Neutral theory of quantitative genetic variance
in an island model with local extinction and colonization.
Evolution, 46, 381–389.

18 R. B . ST EL KEN S ET AL.
Langerhans RB (2008) Predictability of phenotypic
differentiation across flow regimes in fishes. Integrative and
Comparative Biology, 48, 750–768.
Largiader CR, Scholl A (1995) Effects of stocking on the genetic
diversity of brown trout populations of the Adriatic and
Danubian drainages in Switzerland, Journal of Fish Biology,
47, (SupplA) 209–225.
Legendre P, Fortin MJ (1989) Spatial pattern and ecological
analysis. Vegetatio, 80, 107–138.
Lehtonen PK, Tonteri A, Sendek D, Titov S, Primmer CR (2009)
Spatio-temporal genetic structuring of brown trout (Salmo
trutta L.) populations within the River Luga, northwest
Russia. Conservation Genetics, 10, 281–289.
Letcher BH, Nislow KH, Coombs JA, O’Donnell MJ, Dubreuil
TL (2007) Population response to habitat fragmentation in a
stream-dwelling brook trout population. PLoS ONE, 2, e1139.
Lowry DB (2010) Landscape evolutionary genomics. Biology
Letters, 6, 502–504.
Luquet E, Lena JP, David P et al. (2011) Consequences of
genetic erosion on fitness and phenotypic plasticity in
European tree frog populations (Hyla arborea). Journal of
Evolutionary Biology, 24, 99–110.
Manel S, Schwartz MK, Luikart G, Taberlet P (2003) Landscape
genetics: combining landscape ecology and population
genetics. Trends in Ecology & Evolution, 18, 189–197.
Manel S, Joost S, Epperson BK et al. (2010) Perspectives on the
use of landscape genetics to detect genetic adaptive variation
in the field. Molecular Ecology, 19, 3760–3772.
Mantel N (1967) Detection of disease clustering and a generalized
regression approach. Cancer Research, 27, 209–220.
McClelland EK, Naish KA (2007) Comparisons of FST and
Q(ST) of growth-related traits in two populations of Coho
salmon. Transactions of the American Fisheries Society, 136,
1276–1284.
McGinnity P, Prodohl P, Ferguson K et al. (2003) Fitness
reduction and potential extinction of wild populations of
Atlantic salmon, Salmo salar, as a result of interactions with
escaped farm salmon. Proceedings of the Royal Society of
London Series B-Biological Sciences, 270, 2443–2450.
Meeuwig MH, Guy CS, Fredenberg WA (2008) Influence of
landscape characteristics on fish species richness among
lakes of Glacier National Park, Montana. Intermountain
Journal of Sciences, 14, 1–16.
Meeuwig MH, Guy CS, Kalinowski ST, Fredenberg WA (2010)
Landscape influences on genetic differentiation among bull
trout populations in a stream-lake network. Molecular
Ecology, 19, 3620–3633.
Meldgaard T, Nielsen EE, Loeschcke V (2003) Fragmentation
by weirs in a riverine system: a study of genetic variation in
time and space among populations of European grayling
(Thymallus thymallus) in a Danish river system. Conservation
Genetics, 4, 735–747.
Moran P, Pendas AM, Garciavazquez E, Izquierdo JI,
Loboncervia J (1995) Estimates of gene flow among
neighbouring populations of brown trout. Journal of Fish
Biology, 46, 593–602.
Muhlfeld CC, Kalinowski ST, McMahon TE et al. (2009)
Hybridization rapidly reduces fitness of a native trout in the
wild. Biology Letters, 5, 328–331.
Neville HM, Dunham JB, Peacock MM (2006a) Landscape
attributes and life history variability shape genetic structure
of trout populations in a stream network. Landscape Ecology,
21, 901–916.
Neville HM, Isaak DJ, Dunham JB, Thurow RF, Rieman BE
(2006b) Fine-scale natal homing and localized movement as
shaped by sex and spawning habitat in Chinook salmon:
insights from spatial autocorrelation analysis of individual
genotypes. Molecular Ecology, 15, 4589–4602.
Nicieza AG (1995) Morphological variation between
geographically disjunct populations of Atlantic salmon: the
effects of ontogeny and habitat shift. Functional Ecology, 9,
448–456.
Nielsen C, Aarestrup K, Norum U, Madsen SS (2003) Pre-
migratory differentiation of wild brown trout into migrant
and resident individuals. Journal of Fish Biology, 63, 1184–
1196.
Northcote TG (1992) Migration and residency in stream
salmonids - some ecological considerations and evolutionary
consequences. Nordic Journal of Freshwater Research, 67, 5–17.
Nosil P (2004) Reproductive isolation caused by visual
predation on migrants between divergent environments.
Proceedings of the Royal Society of London Series B-Biological
Sciences, 271, 1521–1528.
O’Reilly PT, Hamilton LC, McConnell SK, Wright JM (1996)
Rapid analysis of genetic variation in Atlantic salmon (Salmo
salar) by PCR multiplexing of dinucleotide and
tetranucleotide microsatellites. Canadian Journal of Fisheries
and Aquatic Sciences, 53, 2292–2298.
Paez DJ, Hedger R, Bernatchez L, Dodson JJ (2008) The
morphological plastic response to water current velocity
varies with age and sexual state in juvenile Atlantic salmon,
Salmo salar. Freshwater Biology, 53, 1544–1554.
Pakkasmaa S, Piironen J (2000) Water velocity shapes juvenile
salmonids. Evolutionary Ecology, 14, 721–730.
Piertney SB, Summers R, Marquiss M (2001) Microsatellite and
mitochondrial DNA homogeneity among phenotypically
diverse crossbill taxa in the UK. Proceedings of the Royal
Society of London Series B-Biological Sciences, 268, 1511–1517.
Poteaux C, Beaudou D, Berrebi P (1998) Temporal variations of
genetic introgression in stocked brown trout populations.
Journal of Fish Biology, 53, 701–713.
Poteaux C, Berrebi P, Bonhomme F (2000) Allozymes, mtDNA
and microsatellites study introgression in a stocked trout
population in France. Reviews in Fish Biology and Fisheries, 10,
281–292.
Presa P, Guyomard R (1996) Conservation of microsatellites in
three species of salmonids. Journal of Fish Biology, 49, 1326–
1329.
Price TD, Qvarnstrom A, Irwin DE (2003) The role of
phenotypic plasticity in driving genetic evolution. Proceedings
of the Royal Society of London Series B-Biological Sciences, 270,
1433–1440.
Pritchard JK, Stephens M, Donnelly P (2000) Inference of
population structure using multilocus genotype data.
Genetics, 155, 945–959.
Quinn TP, Kinnison MT, Unwin MJ (2001) Evolution of
chinook salmon (Oncorhynchus tshawytscha) populations in
New Zealand: pattern, rate, and process. Genetica, 112, 493–
513.
R DCT (2006) R: A language and environment for statistical
computing. R Foundation for Statistical Computing, Vienna,
Austria.
� 2012 Blackwell Publishing Ltd

MI CROGEO GRAPHIC POPULATI ON DIFFERE NTIATION IN BROWN TROUT 19
Reale D, McAdam AG, Boutin S, Berteaux D (2003) Genetic
and plastic responses of a northern mammal to climate
change. Proceedings of the Royal Society of London Series
B-Biological Sciences, 270, 591–596.
Rice WR (1989) Analyzing tables of statistical tests. Evolution,
43, 223–225.
Riddell BE, Leggett WC (1981) Evidence of an adaptive basis
for geographic variation in body morphology and time of
downstream migration of juvenile Atlantic salmon (Salmo
salar). Canadian Journal of Fisheries and Aquatic Sciences, 38,
308–320.
Rogers SM, Gagnon V, Bernatchez L (2002) Genetically based
phenotype-environment association for swimming behavior
in lake whitefish ecotypes (Coregonus clupeaformis Mitchill).
Evolution, 56, 2322–2329.
Rohlf FJ, Slice DE (1990) Extensions of the Procrustes method
for the optimal superimposition of landmarks. Systematic
Zoology, 39, 40–59.
Rundle HD, Nosil P (2005) Ecological speciation. Ecology
Letters, 8, 336–352.
Ruzzante DE, Hansen MM, Meldrup D (2001) Distribution of
individual inbreeding coefficients, relatedness and influence
of stocking on native anadromous brown trout (Salmo trutta)
population structure. Molecular Ecology, 10, 2107–2128.
Ryman N (1983) Patterns of distribution of biochemical genetic
variation in salmonids: differences between species.
Aquaculture, 33, 1–21.
Schluter D (2000) The Ecology of Adaptive Radiation. Oxford
University Press, Oxford.
Slettan A, Olsaker I, Lie O (1995) Atlantic salmon, Salmo salar,
microsatellites at the SSOSL25, SSOSL85, SSOSL311,
SSOSL417 loci. Animal Genetics, 26, 281–282.
Smith TB, Bernatchez L (2008) Evolutionary change in human-
altered environments. Molecular Ecology, 17, 1–8.
Smouse PE, Long JC, Sokal RR (1986) Multiple regression and
correlation extensions of the Mantel test of matrix
correspondence. Systematic Zoology, 35, 627–632.
Spitze K (1993) Population structure in Daphnia obtusa:
quantitative genetic and allozymic variation. Genetics, 135,
367–374.
Stelkens RB, Schmid C, Selz O, Seehausen O (2009) Phenotypic
novelty in experimental hybrids is predicted by the genetic
distance between species of cichlid fish. BMC Evolutionary
Biology, 9, doi:10.1186/1471-2148-9-283.
Stockwell CA, Hendry AP, Kinnison MT (2003) Contemporary
evolution meets conservation biology. Trends in Ecology &
Evolution, 18, 94–101.
Storfer A, Murphy MA, Spear SF, Holderegger R, Waits LP
(2010) Landscape genetics: where are we now? Molecular
Ecology, 19, 3496–3514.
Taylor EB (1991) A review of local adaptation in Salmonidae,
with particular reference to Pacific and Atlantic salmon.
Aquaculture, 98, 185–207.
Taylor EB, Foote CJ (1991) Critical swimming velocities of
juvenile sockeye salmon and kokanee, the anadromous and
non-anadromous forms of Oncorhynchus nerka (Walbaum).
Journal of Fish Biology, 38, 407–419.
Taylor EB, Boughman JW, Groenenboom M et al. (2006)
Speciation in reverse: morphological and genetic evidence of
the collapse of a three-spined stickleback (Gasterosteus
aculeatus) species pair. Molecular Ecology, 15, 343–355.
� 2012 Blackwell Publishing Ltd
Taylor EB, Tamkee P, Keeley E, Parkinson E (2011) Conservation
prioritization in widespread species: the use of genetic and
morphological data to assess population distinctiveness in
rainbow trout (Oncorhynchus mykiss) from British Columbia,
Canada. Evolutionary Applications, 4, 100–115.
Trussell GC, Smith LD (2000) Induced defenses in response to
an invading crab predator: an explanation of historical and
geographic phenotypic change. Proceedings of the National
Academy of Sciences of the United States of America, 97, 2123–
2127.
Unwin MJ, Kinnison MT, Boustead NC, Quinn TP (2003)
Genetic control over survival in Pacific salmon
(Oncorhynchus spp.): experimental evidence between and
within populations of New Zealand chinook salmon (O.
tshawytscha). Canadian Journal of Fisheries and Aquatic Sciences,
60, 1–11.
Varian A, Nichols KM (2010) Heritability of morphology in brook
trout with variable life histories. PLoS ONE, 5, doi: 10.1371/
journal.pone.0012950.
Wainwright PC, Richard BA (1995) Predicting patterns of prey
use from morphology of fishes. Environmental Biology of
Fishes, 44, 97–113.
Weir BS, Cockerham CC (1984) Estimating F-statistics for the
analysis of population structure. Evolution, 38, 1358–1370.
Zeh-Weissmann H, Konitzer C, Bertiller A (2009) Strukturen
der Fliessgewasser in der Schweiz. Zustand von Sohle,
Ufer und Umland (Okomorphologie); Ergebnisse der
okomorpho-logischen Kartierung. Stand: April 2009.
Umwelt-Zustand Nr. 0926. Bundesamt fur Umwelt, Bern.
100 S.
Zeisset I, Beebee TJC (2001) Determination of biogeographical
range: an application of molecular phylogeography to the
European pool frog Rana lessonae. Proceedings of the
Royal Society of London Series B-Biological Sciences, 268, 933–
938.
Zimmerli S, Bernet D, Burkhardt-Holm P et al. (2007)
Assessment of fish health status in four Swiss rivers
showing a decline of brown trout catches. Aquatic Sciences,
69, 11–25.
R.B.S. is interested in the evolutionary mechanisms generating
biodiversity, with a focus on the role of genetic exchange driv-
ing functional diversification in adaptive radiations. G.J. is
interested in the quantification of phenotypic divergence and
currently studies chemical interactions between social insects
and plant secondary metabolites. M.E. studies the decline of
brown trout in Switzerland, investigating the effects of various
biotic and abiotic factors. C.W. studies the selective forces cur-
rently acting on fish in the wild, including sexual selection,
host-pathogen interactions, and direct and indirect effects of
human activities (e.g. non-random harvesting, supplementary
breeding, pollution, climate change).
Data accessibility
Microsatellite and morphometric data: DRYAD entry
doi:10.5061/dryad.gm29rj2f

20 R. B . ST EL KEN S ET AL.
Supporting information
Additional supporting information may be found in the online
version of this article.
Table S1 Summary of the hatchery program for brown trout
within the study area since 1981. While in some years small
proportions were stocked as alevins or 1 + fish, the large
majority were raised for some weeks in the hatchery or in
small streamlets before released into the stream of origin, with
the exception that the river Aare was regularly stocked also
with fish originating from other streams of the catchment area
(mainly Musche).
Fig. S1 Correspondence between FST and Dest estimates.
Fig. S2 Graphical analyses to infer the most likely K value. a)
Mean L(K) (± SD) as a function of the number of clusters (K)
across 6 runs obtained with STRUCTURE. The ‘break in slope’ at
K = 6 represents the most likely n of K. b) After applying the
method described in Evanno et al. (2005), the highest peak rep-
resents the most likely K value (= 3). DK was calculated as
DK = m|L¢¢(K)| ⁄ s[L(K)].
Fig. S3 Same as Fig. 3 with photos of example specimens plot-
ted along principal component 1 (x-axis). Deformation grids
represent shape at the negative and positive extremes of PC1.
Fig. S4 Same as Fig. 3 with photos of example specimens plot-
ted along principal component 2 (y-axis). Photos on the left
show females, photos on the right show males. Deformation
grids represent shape at the negative and positive extremes of
PC2.
Fig. S5 The number of weirs (nweirs) was positively related to
waterway distance (geoD) between pairs of populations (Man-
tel test: R = 0.051, P < 0.001). Every data point represents a
pairwise population comparison.
Please note: Wiley-Blackwell are not responsible for the content
or functionality of any supporting information supplied by the
authors. Any queries (other than missing material) should be
directed to the corresponding author for the article.
� 2012 Blackwell Publishing Ltd