pfoa pfos pfhxs combined hazard assessment · web viewthe human hazard assessment was principally...
TRANSCRIPT

Hazard assessment report – Perfluorooctane Sulfonate (PFOS), Perfluorooctanoic Acid (PFOA), Perfluorohexane Sulfonate (PFHxS)
Executive summary
Background
This report has been prepared by Food Standards Australia New Zealand (FSANZ) in response to a request from the Department of Health to provide advice on appropriate health-based guidance values (HBGV) for perfluorooctane sulfonate (PFOS) and perfluorooctanoic acid (PFOA), and to consider whether either a separate or group HBGV can be established for perfluorohexane sulfonate (PFHxS). These chemicals belong to a group of compounds collectively referred to as per- and poly-fluoroalkylated (PFAS) substances.
The mammalian toxicology of PFOS and PFOA has been considered by a number of international agencies or bodies including the United Kingdom Committee on Toxicity (UKCOT), the European Food Safety Authority (EFSA), the Swedish Environmental Protection Agency (Swedish EPA)1, the Danish Environmental Protection Agency (Danish EPA), the Agency for Toxic Substances and Disease Registry (ATSDR) and most recently, the United States Environmental Protection Agency (US EPA). The HBGVs derived by these agencies range from 20 – 300 ng/kg bw/day for PFOS and 20 – 1,500 ng/kg bw/day for PFOA (noting that the Swedish EPA established a value based on serum concentration).
FSANZ has used information in these comprehensive international assessments for the purpose of determining HBGVs for PFOS and PFOA, and in the consideration of whether there are sufficient data to establish a HBGV for PFHxS. This approach was considered justified on the basis that these evaluations have, to a large extent, considered the same extensive toxicological databases, and pivotal, or supporting studies for PFOS and PFOA relevant to the establishment of HBGVs. A number of these assessments have also summarised, to the extent possible, the limited available toxicological information on PFHxS.
FSANZ has also had regard to the June 2016 enHealth Statement: Interim national guidance on human health reference values for per- and poly-fluoroalkyl substances for use in site investigations in Australia2, and the August 2016 independent Procedural Review of Health Reference Values Established by enHealth for PFAS3. The latter report identified that the main reasons for the differences in HBGVs internationally is related to the use of physiologically based pharmacokinetic (PBPK) modelling by the US EPA and ATSDR, and differences in selection of uncertainty factors by the agencies involved. In addition, the report provided recommendations for FSANZ to consider relating to the interpretation of epidemiological findings related to birth weight
1 Report was not the result of a formal assessment procedure by the Swedish EPA but contractual work performed by the main authors in contact with the Swedish EPA2 Available at: http://www.health.gov.au/internet/main/publishing.nsf/content/health-pubhlth-publicat-environ.htm3 Available at: http://www.health.gov.au/internet/ministers/publishing.nsf/Content/health-mediarel-yr2016-ley045.htm
1

and serum cholesterol, and the recent United States National Toxicology Program (US NTP) report on immunotoxicity.
Human studies
Associations between PFOS exposure and several health effects have been reported in epidemiological studies, although a number of findings are inconsistent between studies and the biological significance of a number of the observed effects is questionable. EFSA (2008) and ATSDR (2015) concluded that it is not possible to identify any causal associations based on limitations in study design and/or inconsistencies in study results.
The US EPA (2016) concluded that associations that appear to be reasonably consistent and repeatable are those with increased serum cholesterol and decreased body weights at birth. FSANZ has reviewed the available human epidemiological information and concluded that while there is evidence of these associations, it is not possible to determine whether PFOS or PFOA cause the changes, or whether other factors are involved. As these are observational studies, FSANZ considers that the meaning and clinical significance of the associations for PFOS and PFOA for decreased birth weight and increased cholesterol in humans are uncertain and should be interpreted with caution.
A recent draft systematic review of immunotoxicity associated with exposure to PFOA or PFOS by the US NTP concluded that both PFOS and PFOA are presumed to be an immune hazards to humans. A literature review commissioned by FSANZ concluded that there are both positive and negative studies showing associations for increasing PFOS and PFOA concentrations to compromise antibody production in humans. However, to date there is no convincing evidence for increased incidence of infective disease associated with PFOS or PFOA effects on human immune function.
Epidemiological studies have not provided convincing evidence of a correlation between PFOS and PFHxS and any cancer type in human beings. Although associations between PFOA and some human cancers have been suggested from some epidemiological studies, results have often been contradictory, and a causal relationship cannot be established with reasonable confidence
Animal toxicity studies
PFOS and PFOA were rapidly absorbed from the gastrointestinal tract of laboratory animals. Both compounds were highly bound to serum albumin and other plasma proteins in the circulation, with the highest concentrations generally reported in liver, serum, lung and kidney. There was no evidence that either PFOS or PFOA are metabolised in vivo. Elimination of PFOS and PFOA occurred primarily in the urine with lower amounts recovered in the faeces. Marked differences in the elimination half-life of PFOS, PFOA and PFHxS were observed between laboratory animals and humans. Half-life values were usually measured in days for laboratory animals and years for humans.
PFOS and PFOA were of moderate acute toxicity following oral ingestion. In repeat dose studies, the primary target organ was the liver. Toxicological findings in the liver included increased liver weight associated with hepatocellular hypertrophy, and occasionally vacuolation and increased enzyme markers of liver toxicity in serum. A notable finding in animal experiments, particularly in monkeys, was steep dose-response curves which had a narrow dose range between the no observed adverse effect level (NOAEL) and treatment-related mortality.
PFOS induced liver tumours in rats at doses above those observed for other non-neoplastic effects in the liver. The increased incidence of liver cell tumours appears to be due to peroxisome proliferator activated receptor (PPAR) agonism, a mechanism that is not relevant to human beings. PFOA induced Leydig cell tumours in rats, possibly also through a PPAR mediated mechanism. The weight of evidence from a range of genotoxicity studies suggests that PFOS and PFOA are
2

not genotoxic.
Fetal and neonatal toxicity were observed in reproductive and developmental studies with PFOS and PFOA at doses which were similar to, or below those producing maternal toxicity. Adverse effects included early embryonic loss, reduced ossification, increased incidence of microcardia, decreased postnatal body weight gain, liver hypertrophy and reduced fecundity of prenatally exposed females. One research team published a number of studies describing microscopic effects of PFOA on mammogenesis, but these did not appear to affect lactation.
A literature search identified only one toxicity study conducted with PFHxS that was considered useful for regulatory purposes. There was no evidence of reproductive or developmental toxicity in rats at doses of up to 10 mg/kg bw/day.
Derivation of a tolerable daily intake
The available human epidemiology data are not suitable to support the derivation of a tolerable daily intake (TDI) for PFOS or PFOA.
Therefore, the recommended TDIs are based on the findings of toxicological studies in laboratory animals. Given the marked variation in the half-life of both PFOS and PFOA in the various species, a pharmacokinetic modelling approach (that recognises and adjusts for half-life and other pharmacokinetic variation in and between species) is preferred to an approach based on the use of the NOAEL, and the application of a default uncertainty factor to account for pharmacokinetic differences.
For PFOS, FSANZ has recommended a TDI of 20 ng/kg bw/day on the basis of decreased parental and offspring body weight gains in a multigeneration reproductive toxicity study in rats. The TDI was derived by applying pharmacokinetic modelling to the serum PFOS concentrations measured in experimental animals at the NOAELs in these and other critical studies, to calculate human equivalent doses (HED). An uncertainty factor of 30 was applied to the HEDs, which comprised a default factor of 3 to account for interspecies differences in toxicodynamics and a default factor of 10 for intraspecies differences in the human population.
For PFOA, FSANZ has recommended a TDI of 160 ng/kg bw/day on the basis of a NOAEL for fetal toxicity in a developmental and reproductive study in mice. Pharmacokinetic modelling was applied to the serum concentrations at the NOAEL and above to calculate the HED. An uncertainty factor of 30 was applied to the HED, which comprised a default factor of 3 to account for interspecies differences in toxicodynamics and a default factor of 10 for intraspecies differences in the human population.
There was insufficient toxicological and epidemiological information to justify establishing a TDI for PFHxS. In the absence of a TDI, it is reasonable to conclude that the enHealth 2016 approach of using the TDI for PFOS is likely to be conservative and protective of public health as an interim measure. Effectively, this means that PFHxS and PFOS should be summed for the purposes of a dietary exposure assessment and risk characterisation.
3

ContentsEXECUTIVE SUMMARY..............................................................................................................................................1ABBREVIATIONS......................................................................................................................................................51 INTRODUCTION..............................................................................................................................................8
1.1 Background.......................................................................................................................................81.2 Scope of the assessment...................................................................................................................9
2 HAZARD ASSESSMENT PFOS..........................................................................................................................112.1 Introduction....................................................................................................................................112.2 Summary of International hazard reviews of PFOS.........................................................................122.3 Summary of the toxicity of PFOS.....................................................................................................192.4 Discussion and conclusions PFOS....................................................................................................552.5 Derivation of the TDI for PFOS........................................................................................................57
3 HAZARD ASSESSMENT PFOA..........................................................................................................................613.1 Introduction....................................................................................................................................613.2 Summary of International hazard reviews of PFOA........................................................................623.3 Summary of the toxicity of PFOA....................................................................................................683.4 Discussion and conclusions PFOA..................................................................................................1043.5 Derivation of the TDI for PFOA......................................................................................................106
4 HAZARD ASSESSMENT PFHXS.......................................................................................................................1074.1 Introduction..................................................................................................................................1074.2 Summary of International hazard reviews of PFHxS.....................................................................1074.3 Summary of the toxicity of PFHxS.................................................................................................1094.4 Discussion and conclusions PFHxS.................................................................................................114
REFERENCES......................................................................................................................................................115APPENDICES......................................................................................................................................................123
Appendix 1: Observational studies of PFAS and birthweight......................................................................123Appendix 2: Observational studies of PFAS and cholesterol concentrations..............................................157Appendix 3: PFHxS Pharmacokinetic Studies.............................................................................................191
4

Abbreviations
List of abbreviations for PFOA, PFOS and PFHxS Assessments
2D-DIGE two-dimensional fluorescence difference in gel electrophoresis8-dG 8-hydroxyguanosineACoA acyl CoAADHD attention deficit/hyperactivity disorderAF assessment factorAFPO ammonium perfluorooctanoateAIC Akaike Information CriterionALP alkaline phosphataseALT alanine aminotransferaseAPTT activated partial thromboplastin timeASG accessory sex glandsAST aspartate aminotransferaseATSDR Agency for Toxic Substances and Disease RegistryAUC area under the curveBMD benchmark doseBMDL benchmark dose – lower ninety-fifth percentile confidence boundBMDS benchmark dose softwareBSA bovine serum albuminBUN blood urea nitrogenbw body weightCAR constitutive androstane receptorChAT choline acetyltransferaseCHO Chinese Hamster OvaryCL clearanceCL/CD control litter/control damCL/TD control litter/treated damCmax maximum serum or plasma concentrationCOPD chronic obstructive pulmonary diseaseCss steady-state concentrationDNEL Derived No Effect LevelDOPAC 3,4-dihydrophenylacetic acidDss external steady-state doseDTH delayed-type hypersensitivityEFSA European Food Safety AuthorityEPA Environmental Protection AgencyF0 parental generationF1 first filial generation, resulting from a cross of the parental generationF2 second filial generation, resulting from a cross of members of F1FABP fatty acid binding proteinFSANZ Food Standards Australia New ZealandFSH follicle-stimulating hormonegAF Gastrointestinal absorption fractionGD gestation dayGFR glomerular filtration rateHBGV health-based guidance valueHDL high density lipoproteinHED human equivalent doseHMG-CoA 3-hydroxy-3-methylglutaryl coenzyme AHVA homovanillic acidGABA gamma-aminobutyric acid
5

GGT γ-glutamyl transpeptidaseIgG immunoglobulin GIgM immunoglobulin Miv intravenouskg kilogramKp partition coefficientKow octanol-water partition coefficientLD50 lethal dose for 50% of test animalsLDL low density lipoproteinLH luteinising hormoneLLOQ lower limit of quantificationLOAEL lowest observed adverse effect levelLPS lipopolysaccharidemg milligrammL millilitreMOA mode of actionMRL minimal risk levelng nanogramNK natural killerNOAEL no observed adverse effect levelOAT organic anion transporterPBPK physiologically based pharmacokineticPCNA proliferating cell nuclear antigenPCoAO palmitoyl CoA oxidasePFAA perfluoroalkyl acidsPFAS per- and poly-fluoroalkyl substances, overall term including PFOS, PFOAPFC plaque forming cellPFHxS perfluorohexanesulfonic acidPFOA perfluorooctanoic acidPFOS perfluorooctane sulfonatePFOSA perfluorooctanesulfonamidePK pharmacokineticpKa acid dissociation constantPND postnatal dayPOD point of departurePOSF perfluorooctanesulfonyl fluoridePPAR peroxisome proliferator activated receptorppb parts per billionppm parts per millionPT prothrombin timePXR pregnane X receptorRfD reference doseSRBC sheep red blood cellst1/2 chemical half-lifeT3 triiodothyronineT4 thyroxineTDI tolerable daily intakeTL/CD treated litter/control damTL/TD treated litter/control damTmax time to reach Cmax
TNP trinitrophenylTSH thyroid stimulating hormoneTTR thyroid hormone transport protein, transthyretinUF uncertainty factorµg microgram
6

UKCOC United Kingdom Committee on Carcinogenicity of Chemicals in Food, Consumer Products and the Environment
UKCOM United Kingdom Committee on Mutagenicity of Chemicals in Food, Consumer Products and the Environment
UKCOT United Kingdom Committee on Toxicity of Chemicals in Food, Consumer Products and the Environment
UN urea nitrogenUS EPA United States Environmental Protection AgencyUS NTP United States National Toxicology ProgrammeVd volume of distributionVdss volume of distribution at steady-stateVLDL very low density lipoprotein
List of Abbreviations for Appendices 1 and 2
C8 refers to a group of studies conducted in water districts in Ohio and West Virginia, US, around the DuPont Washington Works facility
EFSA European Food Safety AuthorityEPA US Environmental Protection AgencyFSANZ Food Standards Australia New ZealandHDL-C high density lipoprotein cholesterol (in the blood)HR hazard ratioIQR interquartile range, the range between the twenty-fifth and seventy-fifth centilesLBW low birthweightLDL-C low density lipoprotein cholesterol (in the blood)ln natural logarithmNHANES US National Health and Nutrition Examination SurveyOR odds ratioPECO population, exposure, comparator, outcome – the predefined essential features of
studies which will be included to answer a question; other paramenters (such as study design) can also be specified
PFAS per- and poly-fluoroalkyl substances, overall term including PFOS, PFOAPFOA perfluorooctanoic acidPFOS perfluorooctane sulfonateTotal-C total cholesterol (in the blood)SD standard deviation3M refers to the 3M company and studies conducted in any or all of its three facilities
in Decatur, AL and Cottage Grove, MN in the US and Antwerp, Belgium95% CI 95% confidence interval
7

1 Introduction
1.1 Background
This report has been prepared by FSANZ in response to a request from the Department of Health to provide advice on appropriate health-based guidance values (HBGV) for perfluorooctane sulfonate (PFOS) and perfluorooctanoic acid (PFOA), and to consider whether either a group or separate HBGV can be established for perfluorohexane sulfonate (PFHxS). These chemicals belong to a group of compounds collectively referred to as per- and poly-fluoroalkylated (PFAS) substances.
In March 2016, the Australian Health Protection Principal Committee endorsed the Standing Committee on Environmental Health (enHealth) Guidance Statements on Perfluorinated Chemicals to support jurisdictional responses to incidents of environmental contamination with PFAS compounds. Guidance Statement 3 concerned the development of human health reference values for PFOS and PFOA for consistent use in the undertaking of human health risk assessments in Australia.
In April 2016, enHealth convened a national workshop to review overseas standards and draft Australian human health toxicity reference values for PFOS and PFOA. The workshop was attended by toxicologists, enHealth members, representatives of the Cooperative Research Centre for Contamination Assessment and Remediation of the Environment (CRC CARE), FSANZ, and the Australian Government Department of Health and Australian Government Department of the Environment.
The workshop considered various international approaches and concluded that the 2008 European Food Safety Authority (EFSA) derivation of tolerable daily intake (TDI) values for PFOS and PFOA were appropriate as interim national guidance for use in site investigations in Australia. For PFHxS, enHealth agreed that the EFSA TDI for PFOS should also be applied to PFHxS exposures. In practice this means PFOS and PFHxS exposures should be summed and the total compared with the TDI for PFOS. The enHealth June 2016 statement further recommended that FSANZ should undertake an assessment of the available toxicity data for PFOS, PFOA and PFHxS, and noted that the values published by FSANZ will immediately replace the interim toxicity values published by enHealth.
In August 2016 an independent review of the enHealth decision considered the adoption of the EFSA health TDI values to be appropriate as an interim measure. The review noted that international assessments have considered the same pivotal toxicological studies and that the key sources of variation in the EFSA and United States Environment Protection Agency (US EPA) and the Agency for Toxic Substances and Disease Registry (ATSDR) reports related to the use of physiologically based pharmacokinetic (PBPK) modelling by the US EPA and ATSDR, and differences in selection of uncertainty factors. The review also contained a number of recommendations for FSANZ to consider as a part of its assessment, including that the FSANZ review should consider the strengths, weaknesses and validity of the PBPK approach to establishing the human equivalent dose (HED).
8

1.2 Scope of the assessment
The mammalian toxicology of PFOS and PFOA has been considered by the UK Committee on Toxicity of Chemicals in Food, Consumer Products and the Envrionment (UKCOT), EFSA, the Swedish Environmental Protection Agency (Swedish EPA)4, the Danish Environmental Protection Agency (Danish EPA), ATSDR and most recently, the US EPA.
FSANZ has used information from these comprehensive international assessments for the purpose of determining HBGVs for PFOS and PFOA, and in the consideration of whether there are sufficient data to establish a HBGV for PFHxS. This approach was considered justified on the basis that these evaluations have, to a large extent, considered the same extensive toxicological databases, and pivotal, or supporting studies for PFOS and PFOA relevant to the establishment of HBGVs. A number of these assessments have also summarised, to the extent possible, the limited available toxicological information on PFHxS.
HBGVs for PFOS, typically expressed on a daily basis, range from 20 ng/kg bw/day established by the US EPA in 2016 to 300 ng/kg bw/day set by the UKCOT in 2006. The difference between the EFSA value established in 2008 and the US EPA HBGV is 7.5-fold (20 ng/kg bw/day compared with 150 ng/kg bw/day). Notably the Swedish EPA assessment established serum PFOS levels defined as a Derived No Effect Level (DNEL), rather than a TDI. For PFOA, established HBGVs range from 20 ng/kg bw/day established by US EPA and ATSDR, to 1,500 ng/kg bw/day set by EFSA in 2008, a 75-fold difference.
Sources of variation in the HBGVs between different agencies arise as a result of the use (or not) of modelling techniques such as Benchmark Dose (BMD) modelling and pharmacokinetic modelling to establish the HED. Each HBGV also involves a range of uncertainties and a number of assumptions to account for extrapolation between laboratory animals and humans, intraspecies differences, uncertainty factors to extrapolate between short term and long term studies, and may also include a consideration of the adequacy of the database.
No agency has established an oral HBGV for PFHxS.
Internationally established HBGVs for PFOS and PFOA are shown in Table 1 and summarised in Sections 2.2 and 3.2. Considerations of hazard assessments by other agencies for PFHxS are summarised in Section 4.2.
4 Report was not the result of a formal assessment procedure by the Swedish EPA but contractual work performed by the main authors in contact with the Swedish EPA. Reference is Borg and Hakansson, 2012.
9
Table 1: HBGVs for PFOS and PFOA
Agency, year HBGV PoD UF Value of HBGVPFOS
UKCOT, 2006 Tolerable daily intake1 (provisional) 0.03 mg/kg bw/day 100 300 ng/kg bw/day
EFSA, 2008 Tolerable daily intake1 0.03 mg/kg bw/day 200 150 ng/kg bw/day
Swedish EPA 2012 Derived no effect level2
(immunotoxicty)a 17.8 ng/mL serum 150 0.12 ng/mL serum
Danish EPA 2015 Tolerable daily intake1 0.033 mg/kg bw/day 1230 30 ng/kg bw/dayATSDR, 2015 Minimal risk level3 2.52 x 10⁻³ mg/kg bw/dayb 90 30 ng/kg bw/dayUS EPA, 2016 Reference dose4 0.00051 mg/kg bw/dayb 30 20 ng/kg bw/dayPFOA
UKCOT, 2006 Tolerable Daily Intake1 (provisional) 0.3 mg/kg bw/day 200 1.5 μg/kg bw/day
EFSA, 2008 Tolerable Daily Intake1 0.3 mg/kg bw/day 200 1.5 µg/kg bw/day
Swedish EPA, 2012 Derived No Effect Level2 150 ng per mL serum 75 2.0 ng/mL serum
Danish EPA, 2015 Tolerable Daily Intake1 0.003 mg/kg bw/day 30 100 ng/kg/day
ATSDR, 2015 Minimal Risk Level3 1.54 x 10⁻³ mg/kg bw/dayb 90 20 ng/kg/day
US EPA, 2016 Reference Dose4 0.0053 mg/kg bw/dayb 300 20 ng/kg/day
HBGV = health-based guidance value; PoD = Point of Departure; UF = Uncertainty Factora Higher Derived-No-Effect-Levels were also calculated by the Swedish EPA for hepatotoxicity and reproductive toxicitybHuman Equivalent Dose (HED) using PBPK modelling1A Tolerable Daily Intake is an estimate of the amount of a chemical in food or drinking water, expressed on a body weight basis, that can be ingested daily over a lifetime without appreciable health risk to the consumer (FAO/WHO, 2009).2A Derived No Effect Level is the level of exposure to the substance above which humans should not be exposed (ECHA, 2009)3A Minimal Risk Level is an estimate of the daily human exposure to a hazardous substance that is likely to be without appreciable risk of adverse noncancer health effects over a specified duration of exposure (ATSDR 2015).4A Reference Dose is an estimate, with uncertainty spanning perhaps an order of magnitude, of a daily oral exposure to the human population (including sensitive subgroups) that is likely to be without an appreciable risk of deleterious effects during a lifetime (US EPA, 2002).
10

SO3F
FF F F
F F
F F
F F
F F
F F
F F
2 Hazard assessment PFOS
2.1 Introduction
2.1.1 Overview Perfluorooctane sulfonate
PFOS, CAS number 1763-23-1, is a completely fluorinated compound containing eight carbon atoms and a sulfonate group. PFOS and its salts are part of the PFAS group of substances that are or have been used in surface coating and protectant formulations due to their surfactant properties. Major applications of PFAS have included surface treatment of paper and cardboard packaging products, carpets, leather products and textiles to repel water, grease and soil. PFAS have also been used as processing aids in the manufacture of non-stick coatings on cookware as well as in firefighting foams (ATSDR 2015; US EPA 2016). PFOS may occur in food as a result of contamination of plants and animals, and/or via transfer from food-packaging materials.
PFOS is produced commercially from perfluorooctanesulfonyl fluoride (POSF), which is mainly used as an intermediate to produce other fluorochemicals. PFOS can be manufactured through a process known as Simons Electro-Chemical Fluorination, which yields a mixture of linear and branched chain isomers, with an isomer ratio of about 70% linear and 30% branched chain. PFOS can also be produced by telomerisation, which produces linear chains. PFOS is a major impurity in other POSF-derived fluorochemicals, and can also be formed in the environment by the degradation of POSF-based products (EFSA 2008; US EPA 2016).
Because of its strong carbon-fluorine bonds, PFOS is stable to metabolic and environmental degradation. PFOS is considered to have a low acid dissociation constant (pKa) and exists as a highly dissociated anion.
The IUPAC name for PFOS is 1,1,2,2,3,3,4,4,5,5,6,6,7,7,8,8,8-Heptadecafluoro-1-octanesulfonic acid. Synonyms for PFOS include perfluorooctanesulfonic acid. A number of toxicological studies of PFOS that have been conducted in experimental animals used the potassium salt of PFOS, which has the CAS number 2795-39-3.
2.1.1.1 Chemical structure
PFOS has the empirical formula C8HF17O3S, and a molecular mass of 500.13 g/mol. The structure of the PFOS anion is illustrated below:
2.1.1.2 Physicochemical properties
Appearance: White powder (potassium salt)Melting point: > 400 °C (potassium salt)Boiling point: 258 – 260 °CDensity: ~ 0.6 (potassium salt)Water solubility: 519 mg/L at 20 °C; 680 mg/L at 24 – 25 °COrganic solvent solubility: 56 mg/L
11

Log Kow: Not measurablepKa: -3.3 (estimated)
2.2 Summary of International hazard reviews of PFOS
UKCOT, 2006
In 2006, the UKCOT recommended a provisional TDI for PFOS of 300 ng/kg bw/day (UKCOT 2006). This was derived from the lowest NOAEL from the subchronic, chronic, developmental and reproductive toxicity studies with PFOS. This NOAEL was 0.03 mg/kg bw/day for decreased serum triiodothyronine (T3) levels in a 26-week study in cynomolgus monkeys (Seacat et al. 2002). An uncertainty factor of 100 was applied to the NOAEL to allow for inter- and intraspecies variability.
The Committee considered whether there was a need to apply an additional uncertainty factor to allow for incomplete attainment of steady-state PFOS levels in the pivotal study. However, this was considered unnecessary, taking into account that the study was conducted in primates and the effects were mild.
The UKCOT’s sister committees, the Committee on Mutagenicity (UKCOM) and Committee on Carcinogenicity (UKCOC), also evaluated PFOS and provided advice to the UKCOT. The UKCOM concluded that PFOS should be regarded as not mutagenic, while the UKCOC concluded that there was equivocal evidence for carcinogenicity, limited to hepatocellular adenoma in the animal studies.
In 2009, as part of a reconsideration of the provisional TDI for PFOA following publication of the EFSA opinion on PFOS, PFOA and their salts, the UKCOT confirmed its TDI of 300 ng/kg bw/day for PFOS (UKCOT 2009).
EFSA, 2008
The current EFSA TDI for PFOS was established in 2008. The TDI was based on the lowest NOAEL identified from the available toxicity studies with PFOS, 0.03 mg/kg bw/day in the 26-week study with cynomolgus monkeys based on changes in serum lipids and thyroid hormones at the next highest dose (Seacat et al. 2002).
An overall uncertainty factor of 200 was applied to the NOAEL. A factor of 100 was used for inter- and intraspecies differences, with an additional uncertainty factor of 2 applied to compensate for uncertainties in relation to the relatively short duration of the key study and the internal dose kinetics. The TDI was 150 ng/kg bw/day.
EFSA concluded that epidemiology studies in workers exposed to PFOS have not shown convincing evidence of increased cancer risk. Liver tumours observed in rats were considered to be due to a non-genotoxic mode of action.
Swedish EPA, 2012
The Swedish EPA assessed the human and environmental risks of a number of PFASs.
The human hazard assessment was principally based on existing assessments, although additional relevant data were also considered. Two toxicological endpoints, hepatotoxicity and reproductive toxicity, were selected, because these are common to a number of PFASs. Other endpoints showing lower effect levels were also considered.
The existing assessments of PFOS considered in the Swedish EPA report included:
12

2004 Swedish Chemicals Agency risk assessment 2008 EFSA risk assessment 2008 Minnesota Department of Health risk assessment 2009 ATSDR draft toxicological profile 2009 US EPA risk assessment 2010 National Institute for Public Health and the Environment (RIVM) in the
Netherlands report on environmental risk limits for PFOS a draft screening assessment published by Health Canada in 2010 in addition, the Swedish EPA considered an immunotoxicity study conducted in mice by
Peden-Adams et al. (2008)
The Swedish EPA noted that epidemiological studies of PFASs showed inconsistent results.
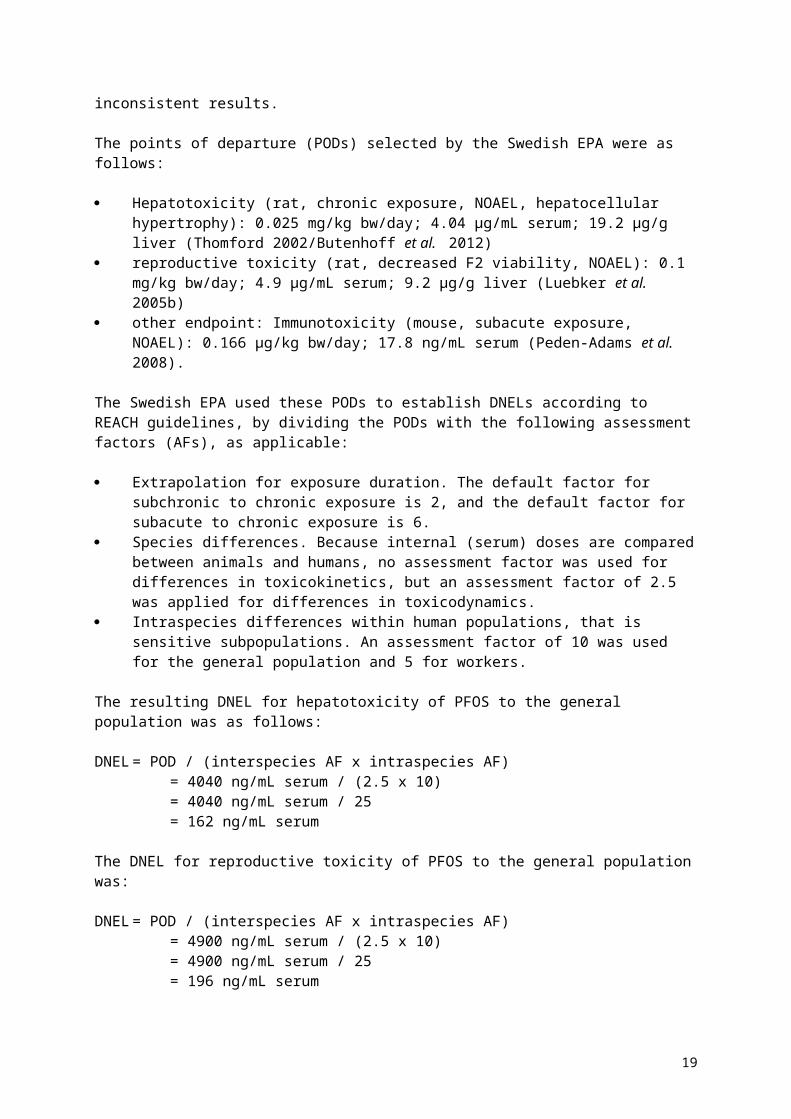
The points of departure (PODs) selected by the Swedish EPA were as follows:
Hepatotoxicity (rat, chronic exposure, NOAEL, hepatocellular hypertrophy): 0.025 mg/kg bw/day; 4.04 µg/mL serum; 19.2 µg/g liver (Thomford 2002/Butenhoff et al. 2012)
reproductive toxicity (rat, decreased F2 viability, NOAEL): 0.1 mg/kg bw/day; 4.9 µg/mL serum; 9.2 µg/g liver (Luebker et al. 2005b)
other endpoint: Immunotoxicity (mouse, subacute exposure, NOAEL): 0.166 µg/kg bw/day; 17.8 ng/mL serum (Peden-Adams et al. 2008).
The Swedish EPA used these PODs to establish DNELs according to REACH guidelines, by dividing the PODs with the following assessment factors (AFs), as applicable:
Extrapolation for exposure duration. The default factor for subchronic to chronic exposure is 2, and the default factor for subacute to chronic exposure is 6.
Species differences. Because internal (serum) doses are compared between animals and humans, no assessment factor was used for differences in toxicokinetics, but an assessment factor of 2.5 was applied for differences in toxicodynamics.
Intraspecies differences within human populations, that is sensitive subpopulations. An assessment factor of 10 was used for the general population and 5 for workers.
The resulting DNEL for hepatotoxicity of PFOS to the general population was as follows:
DNEL = POD / (interspecies AF x intraspecies AF)= 4040 ng/mL serum / (2.5 x 10)= 4040 ng/mL serum / 25= 162 ng/mL serum
The DNEL for reproductive toxicity of PFOS to the general population was:
DNEL = POD / (interspecies AF x intraspecies AF)= 4900 ng/mL serum / (2.5 x 10)= 4900 ng/mL serum / 25= 196 ng/mL serum
13

The DNEL for other effects, specifically immunotoxicity, of PFOS to the general population was:
DNEL = POD / (exposure duration AF x interspecies AF x intraspecies AF)= 17.8 ng/mL serum / (6 x 2.5 x 10)= 17.8 ng/mL serum / 150= 0.12 ng/mL serum
Danish EPA, 2015
The Danish EPA evaluated the human health hazards of PFOS and two related perfluoroalkylated substances, PFOA and perfluorooctanesulfonamide (PFOSA), TDIs were established for PFOS and PFOA, and health-based quality criteria in drinking water, ground water and soil were also proposed.
To establish a TDI for PFOS, the Danish EPA used a BMDL105 value of 0.033 mg/kg bw/day
calculated by the US EPA (2014) for hepatotoxicity in a chronic toxicity/carcinogenicity study in rats (Thomford 2002/Butenhoff et al. 2012).
An uncertainty factor (UF) of 10 was applied to the BMDL10 to account for intraspecies differences. For interspecies differences, the UF consisted of a factor of 3 for possible differences in pharmacodynamics, plus a factor of 41 for pharmacokinetic differences. The pharmacokinetic uncertainty factor was calculated based on the ratio between the clearance rate (CL) of PFOS in the rat and the human, using the following equation:
CL = Vd x (ln 2 / t1/2)
Where:
Vd (volume of distribution) = 0.23 L/kgLn 2 = 0.693t1/2 (half-life) = 48 days for rats and 1971 days for humans
CLrat = 0.23 L/kg x (0.693 / 48 days)= 0.23 L/kg x (0.0144)= 0.0033 L/kg/day
CLhuman = 0.23 L/kg x (0.693 / 1971 days)= 0.23 L/kg x (0.00035)= 0.000081 L/kg/day
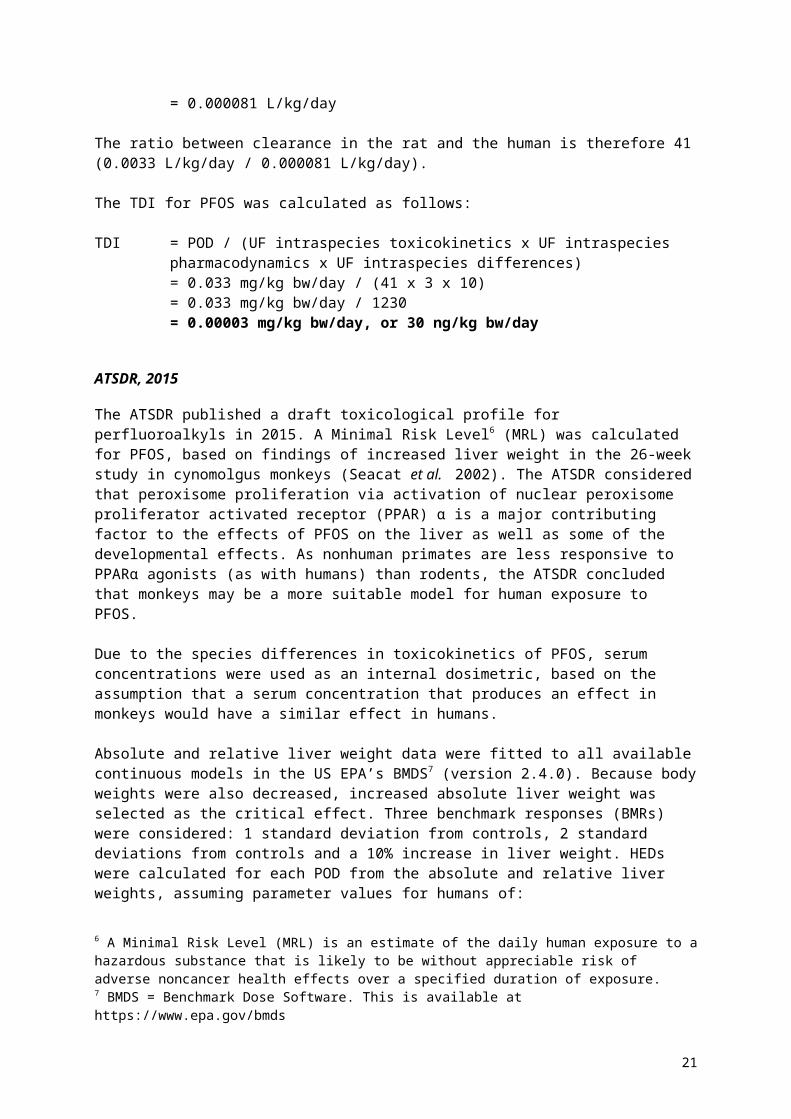
The ratio between clearance in the rat and the human is therefore 41 (0.0033 L/kg/day / 0.000081 L/kg/day).
The TDI for PFOS was calculated as follows:
TDI = POD / (UF intraspecies toxicokinetics x UF intraspecies pharmacodynamics x UF intraspecies differences)= 0.033 mg/kg bw/day / (41 x 3 x 10)= 0.033 mg/kg bw/day / 1230= 0.00003 mg/kg bw/day, or 30 ng/kg bw/day
5 Benchmark dose - lower 95th percentile confidence bound for a 10% additional risk
14

ATSDR, 2015
The ATSDR published a draft toxicological profile for perfluoroalkyls in 2015. A Minimal Risk Level6 (MRL) was calculated for PFOS, based on findings of increased liver weight in the 26-week study in cynomolgus monkeys (Seacat et al. 2002). The ATSDR considered that peroxisome proliferation via activation of nuclear peroxisome proliferator activated receptor (PPAR) α is a major contributing factor to the effects of PFOS on the liver as well as some of the developmental effects. As nonhuman primates are less responsive to PPARα agonists (as with humans) than rodents, the ATSDR concluded that monkeys may be a more suitable model for human exposure to PFOS.
Due to the species differences in toxicokinetics of PFOS, serum concentrations were used as an internal dosimetric, based on the assumption that a serum concentration that produces an effect in monkeys would have a similar effect in humans.
Absolute and relative liver weight data were fitted to all available continuous models in the US EPA’s BMDS7 (version 2.4.0). Because body weights were also decreased, increased absolute liver weight was selected as the critical effect. Three benchmark responses (BMRs) were considered: 1 standard deviation from controls, 2 standard deviations from controls and a 10% increase in liver weight. HEDs were calculated for each POD from the absolute and relative liver weights, assuming parameter values for humans of:
t½= 2,000 daysSerum elimination rate constant (ke) = 3.47 x 10⁻⁴ day-1
Gastrointestinal absorption fraction (gAF) = 1Apparent volume of distribution (Vd) = 0.2 L/kg
according to the equation
DSS = (CSS.ke.Vd)/AF
in which Dss is the external steady-state dosage and Css is the steady-state serum concentration.
The lowest HED was estimated from the BMDL (benchmark dose – lower ninety-fifth percentile confidence bound), for a 10% change in absolute liver weight in male monkeys compared with controls. The HED was 1.61 x 10⁻³ mg/kg bw/day. However, this value was lower than the HEDs calculated from the empirical NOAELs for increases in absolute liver weight in male and female monkeys (HEDs of 9.07 x 10⁻³ mg/kg bw/day and 2.52 x 10⁻³ mg/kg bw/day for males and females, respectively). Therefore, the HED calculated from the NOAEL in female monkeys for increased absolute liver weight (2.52 x 10⁻³ mg/kg bw/day) was used as the POD to derive the MRL for PFOS.
An overall uncertainty factor of 90 was applied to the HED, comprising of 3 for extrapolation from animals to humans, 10 for human variability, and 3 for deficiencies in the database. The database deficiencies related to a lack of developmental and immune toxicity studies in monkeys.
The resulting MRL was 30 ng/kg bw/day.
6 A Minimal Risk Level (MRL) is an estimate of the daily human exposure to a hazardous substance that is likely to be without appreciable risk of adverse noncancer health effects over a specified duration of exposure.7 BMDS = Benchmark Dose Software. This is available at https://www.epa.gov/bmds
15

US EPA, 2016
The US EPA calculated a reference dose (RfD) for noncancer effects of PFOS.
RfD for noncancer effects
Because of the complex pharmacokinetic differences between animals and humans and across animal species, average serum PFOS concentrations based on pharmacokinetic modelling were considered more appropriate for RfD derivation than external doses.
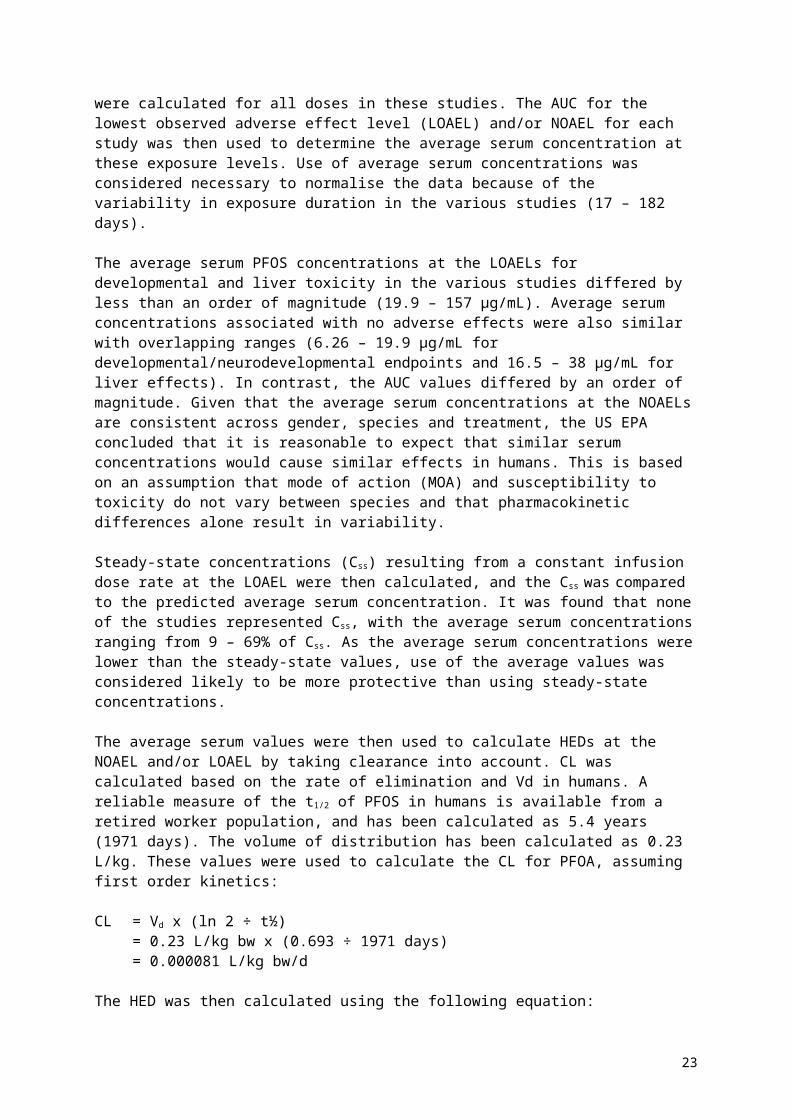
Modelling was performed on a range of subchronic, developmental/neurodevelopmental and reproductive toxicity studies for which measured serum PFOS concentrations were available. The predicted area under the curve (AUC) and final serum concentration were calculated for all doses in these studies. The AUC for the lowest observed adverse effect level (LOAEL) and/or NOAEL for each study was then used to determine the average serum concentration at these exposure levels. Use of average serum concentrations was considered necessary to normalise the data because of the variability in exposure duration in the various studies (17 – 182 days).
The average serum PFOS concentrations at the LOAELs for developmental and liver toxicity in the various studies differed by less than an order of magnitude (19.9 – 157 µg/mL). Average serum concentrations associated with no adverse effects were also similar with overlapping ranges (6.26 – 19.9 µg/mL for developmental/neurodevelopmental endpoints and 16.5 – 38 µg/mL for liver effects). In contrast, the AUC values differed by an order of magnitude. Given that the average serum concentrations at the NOAELs are consistent across gender, species and treatment, the US EPA concluded that it is reasonable to expect that similar serum concentrations would cause similar effects in humans. This is based on an assumption that mode of action (MOA) and susceptibility to toxicity do not vary between species and that pharmacokinetic differences alone result in variability.
Steady-state concentrations (Css) resulting from a constant infusion dose rate at the LOAEL were then calculated, and the Css was compared to the predicted average serum concentration. It was found that none of the studies represented Css, with the average serum concentrations ranging from 9 – 69% of Css. As the average serum concentrations were lower than the steady-state values, use of the average values was considered likely to be more protective than using steady-state concentrations.
The average serum values were then used to calculate HEDs at the NOAEL and/or LOAEL by taking clearance into account. CL was calculated based on the rate of elimination and Vd in humans. A reliable measure of the t1/2 of PFOS in humans is available from a retired worker population, and has been calculated as 5.4 years (1971 days). The volume of distribution has been calculated as 0.23 L/kg. These values were used to calculate the CL for PFOA, assuming first order kinetics:
CL = Vd x (ln 2 ÷ t½) = 0.23 L/kg bw x (0.693 ÷ 1971 days)
= 0.000081 L/kg bw/d
The HED was then calculated using the following equation:
HED = average serum concentration (µg/mL) x CL
The scaling assumed linear first order human kinetics. Linear first order kinetics are observed in animals at the doses at which NOAELs and LOAELs occur, although nonlinear kinetics are observed at higher doses.
16

UF were then applied to the HEDs to derive several candidate RfD values. One study for which pharmacokinetic modelling had been performed was excluded from RfD derivation. This was the 26-week study in monkeys (Seacat et al. 2002), which was not used because two of the six male monkeys died at the LOAEL identified by the US EPA.
An uncertainty factor of 10 was applied in all cases to account for intraspecies variability in the human population (UFH), as was an uncertainty factor of 3 for interspecies differences (UFA) in toxicodynamics. An uncertainty factor for LOAEL to NOAEL extrapolation (UFL) of 1 was applied to all but one of the PODs as NOAELs were identified in these studies. A UFL of 3 was applied to the HED at the LOAEL (0.4 mg/kg bw/day) for effects on pup body weight in a one-generation reproductive toxicity study in rats (Luebker et al. 2005a); this value was considered appropriate given that the NOAEL for pup body weight effects was identified as 0.1 mg/kg bw/day in a two-generation study (Luebker et al. 2005b).
An uncertainty factor of 1 was applied for extrapolation from a subchronic to a chronic exposure duration (UFS) because the PODs are based on average serum concentrations. The US EPA noted that although some of the animals in the 14 week toxicity study in rats (Seacat et al. 2003) continued to be dosed for a total of 105 weeks, the effects observed at the LOAEL did not increase in magnitude, plus serum and liver PFOS concentrations were higher at 14 weeks than they were at 105 weeks. Therefore it was not considered necessary to apply an additional UFS to the POD for this study.
An uncertainty factor for database deficiencies (UFD) of 1 was applied in all cases, based on the availability of comprehensive oral short term, subchronic and chronic studies in three species as well as several neurotoxicity, developmental, reproductive and immune toxicity studies.
The Candidate RfDs are shown in .
17

Table 2: Candidate RfDs for PFOS based on HEDs
Study; endpointPK-HED
mg/kg/dayUFH UFA UFL UFS UFD UFtotal
RfD (mg/kg bw/day)
Seacat et al. 2003; NOAEL for ↑ ALT, ↑ BUN in rats (14 week study) 0.0013 10 3 1 1 1 30 0.00004
Lau et al. 2003; NOAEL for ↓ pup survival in rats (developmental study)
0.0014 10 3 1 1 1 30 0.00005
Butenhoff et al. 2009; NOAEL for ↑ motor activity, ↓ habituation in rats (developmental neurotoxicity study)
0.00084 10 3 1 1 1 30 0.00003
Luebker et al. 2005b; NOAEL for ↓ pup body weight in rats (two-generation study)
0.00051 10 3 1 1 1 30 0.00002
Luebker et al. 2005a; LOAEL for ↓ pup body weight in rats (one-generation study)
0.0016 10 3 3 1 1 100* 0.00002
Luebker et al. 2005a; NOAEL for ↓ pup survival in rats (one-generation study)
0.0016 10 3 1 1 1 30 0.00005
* Although multiplication of the uncertainty factors for this study provides a value of 90, the US EPA rounded this to 100 in their evaluation.
NOAEL – No observed adverse effect level; LOAEL – Lowest observed adverse effect level; RfD – Reference DoseALT – Alanine aminotransferase; BUN – Blood urea nitrogen; PK – Pharmacokinetic; HED – Human equivalent dose
Developmental toxicity was considered by the US EPA to be the critical effect. The lowest RfD of 0.00002 mg/kg bw/day, derived from the NOAEL for reduced pup body weight in the two-generation reproductive toxicity study in rats (Luebker et al. 2005b), was selected as the RfD for PFOS. This value was supported by the same value being derived from the LOAEL for the same effect in the one-generation study (Luebker et al. 2005a).
The final RfD for noncancer effects may be more conveniently expressed as20 ng/kg bw/day.
RfD for Cancer effects
The US EPA concluded that the small number of epidemiology studies that are available do not suggest that there is an association between PFOS exposure and cancer, although the breadth and scope of the studies are not sufficient to make definitive conclusions.
The US EPA noted that in the single chronic cancer bioassay available for PFOS, liver adenomas were significantly increased at the highest doses in male and female rats. However, although a positive trend was found a dose-response pattern was not observed. The incidence of thyroid follicular tumours was elevated in males only in the high dose recovery group exposed for 52 weeks, where the incidence was three times higher than that in rats given the same dose for 104 weeks. Again, a clear dose-response relationship was not observed. The available data were considered inadequate to support a PPARα-linked MOA for the liver and thyroid adenomas observed in this study.
Under the US EPA’s 2005 guidelines for cancer risk assessment, there is ‘suggestive’ evidence for carcinogenicity based on findings in rats of a statistically significant increase at one dose only, but no significant response at other doses and no overall trend. However, the existing evidence was not considered to support a strong correlation between tumour incidence and dose that would justify a quantitative assessment. Therefore a RfD for cancer
18
effects was not established.
2.3 Summary of the toxicity of PFOS
2.3.1 Mechanisms of toxicity
The mode of action of PFAS substances is not fully defined, but can be partly attributed to their structure.
PFOS has been found to activate both mouse and human PPARα in a number of in vitro studies (reviewed by EFSA 2008 and US EPA 2016). Activation of mouse and human PPARα and PPARβ by PFOS has been shown to be less than the level of activation by PFOA, while neither substance significantly activated mouse or human PPARγ (EFSA 2008).
Activation of PPARα leads to proliferation of peroxisomes, and catabolism of fatty acids and cholesterol. Peroxisome proliferation leads to hepatocellular hypertrophy and increased liver weight, which is observed in rodents treated with PFOS. Peroxisome proliferation is associated with hepatocellular carcinogenesis in rodents, but this effect is not relevant to human health risk assessment (Borg and Håkansson 2012).
Peroxisome proliferation is likely to contribute to the liver toxicity observed in laboratory animal studies. However, results of a 28-day dietary rat investigative study in rats with PFOS (50 ppm) provided evidence that PFOS exposure also results in activation of the nuclear receptors CAR and PXR (constitutive androstane receptor and pregnane X receptor, respectively) (Dong et al. 2016). Hepatic expression of 28 genes downstream of CAR/PXR were significantly altered by PFOS treatment. The classic CAR target genes Aldh1a7 and Cyp2b exhibited approximate 10-fold increases in expression, while the PXR target gene Cyp3a was roughly 3-fold increased by PFOS treatment. Expression of PPARα target genes was also affected by PFOS, including Acox1 and other genes involved in lipid metabolism.
Effects not considered to be mediated by PPARα may be relevant to human health risk assessment (Borg and Håkansson 2012). However, it should also be noted that recent advances over the last decade have also revealed that a number of the effects related to the activation of the nuclear hormone receptors CAR and PXR are rodent-specific (Hall et al. 2012).
PFOS is associated with neonatal mortality in mice and rats. The pups appear normal at birth, the lungs were shown to be mature and normal, but die within a few days. It has been suggested that PFOS may interact with the components of the pulmonary surfactant needed to inflate the lungs, based on findings in in vitro studies (Xie et al. 2010).
2.3.2 Toxicokinetics
A detailed review of the toxicokinetics of PFOS is included in the review of pharmacokinetic modelling for PFOS and PFOA commissioned by FSANZ (Roberts et al. 2016). Key information is summarised below.
Absorption
PFOS is readily absorbed by the oral route. Bioavailability of > 95% within 24 hours has been demonstrated following oral administration to rodents (reviewed by Borg and Håkansson 2012). The maximum concentration in the serum (Cmax) after oral gavage is reached within 12 hours in rats, with no clear differences between the sexes (Kim 2016).
19

Distribution
PFOS is highly bound to albumin in circulation. It has been shown to be 99.7% bound to human albumin and 97.3% bound to albumin of rats and monkeys. The dissociation constant for albumin-bound PFOS in human serum is approximately 0.08 mM (Beesoon and Martin 2015). The high binding affinity of human serum albumin for PFOS may at least partly explain its long biological half-life in humans (approximately 5.4 years, ATSDR 2015). Ng and Hungerbϋhler (2014) reported that the number of albumin sites bound with perfluoroalkyl acids (PFAAs) appears to vary with concentration; at low concentrations of PFAA binding occurs to a small numer of primary high affinity sites, while at higher concentrations, as the primary sites become saturated, PFAAs start to bind to a larger number of low affinity sites. Early studies investigating PFOS binding found approximately 10 albumin binding sites.
As with other PFAS, PFOS binds to fatty acid binding protein (FABP) in the liver, and has a higher binding affinity than PFOA. FABP can carry longer chain fatty acids into cell nuclei (Roberts et al. 2016).
PFOS also has a high binding affinity for human serum thyroid hormone transport protein, transthyretin (TTR) and a moderate affinity for low density lipoproteins and α-globulins (Weiss 2009).
After subchronic oral dosing, PFOS is found mainly in blood, liver, lung and kidney of rats. Nearly 95% of a 4.2 mg/kg radiolabelled oral dose administered to rats was recovered from the carcass, urine, faeces, plasma and red blood cells (Chang et al. 2012). The concentration of PFOS in the liver was approximately 10 times that in the plasma; concentrations in other tissues were lower than the plasma, in the order kidneys, lung and spleen. Very little PFOS was located in the brain or fatty tissue. In human postmortem studies, the highest levels of PFOS were found in lungs, kidneys, liver and blood.
Binding of PFOS to FABP in the liver could explain the much higher levels found in the liver compared with other organs (Roberts et al. 2016).
Limited data are available on the uptake of PFOS by transporters, but based on information for PFOA, transporters likely to be involved in absorption, distribution and excretion include organic anion transporters (OATs), organic anion transporting peptides, multidrug resistance –associated proteins, and urate transporters (Roberts et al. 2016). Cui et al. (2009) found that a 4-fold increase in PFOS dose in male rats resulted in only a 2-fold increase in liver and kidney PFOS concentrations and a 10-fold increase in the brain. These data suggest that there are saturable uptake processes occurring in the liver and kidney, and also saturation of the OAT efflux transporter from the brain (Roberts et al. 2016).
In both humans and laboratory animals, PFASs cross the placenta and are also found in milk (reviews by EFSA 2008; Borg and Håkansson 2012; US EPA 2016). A human study found that mean breast milk PFOS was approximately 1% that of maternal serum (Borg and Håkansson, 2012). Research into PFAA concentrations between breast milk, fetus and amniotic fluid in humans concluded in general that transfer efficiency from maternal to cord blood was high, while from maternal blood to amniotic fluid and milk are low. The efficiency values for PFOS were lower than those for PFOA (US EPA 2016).
Metabolism
No evidence has been found that PFOS undergoes any metabolism in studies conducted in rodents or nonhuman primates (reviews by ATSDR 2015, EFSA 2008; Borg and Håkansson 2012; US EPA 2016).
20
Excretion
PFOS is principally excreted by the renal route. Glomerular filtration is limited by extensive binding to serum albumin and other high molecular weight proteins. Based on studies with PFOA, renal OATs have been shown to be involved with active reabsorption of PFASs (reviewed by Borg and Håkansson 2012). No published studies were located which investigated whether a similar process applies to excretion of PFOS.
While one single dose study in rats found a longer half-life of PFOS in females than males, other single and repeated dose studies have found no significant gender differences in half-life (reviewed by US EPA 2016 and Roberts et al. 2016).
The elimination half-life of PFOS in humans is 5.4 years (range 4.1-8.67 years), whereas the half-lives in monkeys, rats and mice are much shorter, 121, 48 and 37 days respectively (US EPA 2016).
2.3.3 Animal toxicity studies
Various international regulatory agencies or bodies have reviewed the toxicity of PFOS. The database includes acute and short term toxicity studies in mice, rats and monkeys, subchronic studies in rats and monkeys, chronic studies in rats, and developmental and reproduction studies in mice, rats and rabbits. As a part of this assessment, FSANZ has evaluated the pivotal toxicological studies relevant to establishing an Australian TDI as well as other information on mechanism of action, toxicokinetics, genotoxicity and immunotoxicity.
A summary of the NOAELs and LOAELs derived from the pivotal toxicological studies assessed as a part of this evaluation is set out in Table 3.
21

Table 3: Key oral toxicity studies used for the derivation of the HBGV for PFOS
Study duration/type Species, Strain NOAEL and LOAEL(mg/kg bw/day) Critical effect(s) Reference Citing Agencies
Subchronic toxicity14 weeks Rat, Sprague Dawley NOAEL: 0.34
LOAEL: 1.33Increased liver weights; decreased serum cholesterol; increased ALT; hepatic hypertrophy and vacuolation
Seacat et al. 2003 EFSA, UK COT, US EPA
182 days(6 months)
Monkey, cynomolgus NOAEL: 0.15LOAEL: 0.75
Mortality; reduced body weight gain; increased liver weights and liver histopathological changes; reduced serum cholesterol
Seacat et al. 2002 EFSA, UK COT, US EPA
Chronic toxicity and carcinogenicity104 weeks Rat, Sprague Dawley NOAEL: 0.098
LOAEL: 0.242 Hepatocellular hypertrophy and vacuolationButenhoff et al. 2012/Thomford 2002)
EFSA, UK COT, US EPA
Reproductive and developmental toxicityTeratology (Developmental Study)
Rabbit, New Zealand White
NOAEL: 0.1 maternal/ 1.0 embryo/fetalLOAEL: 1.0 maternal/2.5 embryo/fetal
Maternal: lower body weight gain during treatment with no corresponding food effect.Fetus: lower fetal weight (probably attributable to maternal toxicity), abortions
Case et al. 2001 None
Teratology (Developmental Study)
Rat, Sprague Dawley NOAEL: 1.0 maternal and embryo/fetalLOAEL: 2.0 maternal and embryo/fetal
Maternal: decreased body weight
Fetal: mortality; decreased body weight; delayed eye-opening
Thibodeaux et al. 2003/Lau et al. 2003
EFSA, UK COT, US EPA
Teratology (Developmental Study)
Mouse, CD-1 NOAEL: 1.0 maternal and embryo/fetalLOAEL: 5.0 maternal and embryo/fetal
Maternal: Increased relative liver weight; reduced serum triglycerides
Fetal: increased liver weight; delayed eye-opening
Thibodeaux et al. 2003/Lau et al. 2003
EFSA, UK COT, US EPA
Reproductive toxicity (Two-generation study)
Rat, Crl:CD(SD)IGS BR VAF
Parental toxicity:NOAEL: 0.1LOAEL: 0.4
Reproductive toxicity:NOAEL: 0.4LOAEL: 1.6Offspring toxicity:NOAEL: 0.1LOAEL: 0.4
Parental toxicity:Decreased body weight gain and food consumption (F0)Reproductive toxicity:increased numbers of dams with all pups dying on postpartum days 1 – 4
Offspring toxicity:Reduced pup viability; reduced pup weight; developmental delays (F1)Reduced body weight and weight gain (F2)
Luebker et al. 2005b
EFSA, UK COT, US EPA
22
Study duration/type Species, Strain NOAEL and LOAEL(mg/kg bw/day) Critical effect(s) Reference Citing Agencies
Reproductive toxicity (One-generation study)
Rat, Crl:CD(SD)IGS VAF/Plus
Maternal toxicity:NOAEL: 0.4LOAEL: 0.8Reproductive toxicity:NOAEL: 0.4LOAEL: 0.8
Offspring toxicity:NOAEL: < 0.4LOAEL: 0.4
Maternal toxicity: Reduced body weight gain
Reproductive toxicity:Reduced gestation length
Offspring toxicity:Reduced body weight and body weight gain
Luebker et al. 2005a
UK COT, US EPA
Other studies28 day (Immunotoxicity study) Mouse, B6C3F1 NOAEL: 0.000166
LOAEL: 0.00166Reduced SRBC plaque forming cell response Peden-Adams et al.
2008US EPA, Swedish EPA
60 day (Immunotoxicity Study) Mouse, C57BL6 NOAEL: 0.008LOAEL: 0.083
Reduced SRBC plaque forming cell response Dong et al. 2009 US EPA
90 day(Neurotoxicity study)
Mouse, C57BL6 NOAEL: 0.43LOAEL: 2.15
Impaired learning and memory; increased apoptosis in hippocampal cells
Long et al. 2013 US EPA
Developmental neurotoxicity Rat, Sprague Dawley NOAEL: 1.0 maternal and developmental neurotoxicityLOAEL: > 1.0
None identified Butenhoff et al. 2009/Chang et al. 2009
US EPA
23

Acute and short term toxicity studies
The oral LD50 of PFOS in CD rats was 233 mg/kg bw in males and 271 mg/kg bw in females, with a combined value of 251 mg/kg bw (Dean et al. 1978, reviewed by UKCOT 2006, EFSA 2008 and US EPA 2016). Clinical signs included hypoactivity, decreased limb tone and ataxia. Findings at necropsy included stomach distension, lung congestion and irritation of the glandular mucosa.
Mice
Male ICR mice were administered PFOS as a single oral dose of 0, 125, 250 and 500 mg/kg bw/day (Sato et al. 2009, reviewed by US EPA 2016). One mouse in each of the treatment groups died. No clinical signs indicative of neurotoxicity were observed. Decreased body weight or delayed body weight gain were seen in mice given 250 or 500 mg/kg bw/day in the 14 days following treatment.
Male BALB/c mice were administered PFOS at 0, 5 or 20 mg/kg bw/day for 14 days while on either a regular fat or high fat diet. A significant increase in liver fat content was observed in treated mice on the regular fat diet (Wang et al. 2014, reviewed by US EPA 2016). A slight, non-significant increase in liver fat content was seen in mice on the high fat diet. Serum levels of glucose, cholesterol, high density lipoprotein (HDL) and low density lipoprotein (LDL) declined in a dose-related manner. PPARα expression was increased in mice on the regular fat diet, but decreased in those on the high fat diet at the end of the 14 day exposure period.
Male CD-1 mice were administered PFOS by oral gavage at doses of 0, 1, 5 or 10 mg/kg bw/day for up to 21 days. Microvesicular hepatic steatosis was observed in the high dose group on day 14 and macrovesicular steatosis was seen on day 21 (Wan et al. 2012, reviewed by US EPA 2016). Increased liver weights, yellowish colouration of the tissues and increased liver triglycerides were observed at 5 and 10 mg/kg bw/day. The authors concluded that the hepatic changes were similar to those associated with non-alcoholic fatty liver disease in humans and not totally related to PPARα activation.
Significant decreases in triglycerides, total cholesterol, HDL, non-HDL and very low density lipoprotein (VLDL) were found in APOE*3-Leiden.CETP mice given PFOS at 3 mg/kg bw/day in the diet for 4 weeks (Bijland et al. 2011, reviewed by US EPA 2016). This strain of mice exhibits human-like lipoprotein metabolism. PFOS decreased hepatic VLDL production leading to increased retention of triglycerides (steatosis) and hepatomegaly. Microarray analysis of liver samples found increased mRNA expression of genes involved with fatty acid uptake and transport and catabolism, triglyceride synthesis, cholesterol storage and VLDL synthesis. Genes involved with HDL synthesis, maturation, clearance and bile acid formation and secretion were downregulated. PFOS increased PXR expression, accompanied by an increase in Cyp3a11 expression and decrease in Cyp7a1expression, both typical for PXR activation. The authors considered that the effects of PFOS on lipid metabolism are suggestive of the activation of nuclear receptors that include PPARα and PXR.
Rats
Male Wistar rats were given PFOS as a single oral dose of 0, 125, 250 or 500 mg/kg bw (Sato et al. 2009, reviewed by US EPA 2016). One of three rats in the 250 mg/kg bw group and both rats administered 500 mg/kg bw died. Rats did not show any clinical signs that suggested a neurological effect of PFOS. Decreased body weight or delayed body weight gain was seen in rats given 250 mg/kg bw in the 14 days following treatment. No histopathological changes were observed in the neuronal or glial cells of the cerebrum and
24

cerebellum of rats killed 24 hours after exposure. No differences in levels of catecholamines or amino acids were seen in rats administered 250 mg/kg bw compared with controls 24 and 48 hours following treatment.
Sprague Dawley rats (15/sex/dose) were administered 0, 2, 20, 50 or 100 mg/kg PFOS/kg diet for 28 days (Curran et al. 2008, reviewed by US EPA 2016). This was equivalent to 0, 0.14, 1.33, 3.21 or 6.34 mg/kg bw/day respectively in males and 0, 0.15, 1.43, 3.73 or 7.58 mg/kg bw/day respectively in females. Increased absolute liver weights were observed in females at doses ≥ 1.43 mg/kg bw/day and in males at doses ≥ 3.21 mg/kg bw/day. Relative liver weights were increased in females at all doses and in males at doses ≥ 1.33 mg/kg bw/day. Increases in hepatocyte hypertrophy in the centrilobular region were observed in male rats at 3.21 and 6.34 mg/kg bw/day, while an increase in cytoplasmic homogeneity in centrilobular hepatocytes was seen at doses ≥ 3.21 or 3.73 mg/kg bw/day in males and females, respectively. There was a significant trend for increased serum alanine aminotransferase (ALT) in males, but not in females, with a significant increase at the high dose compared with controls. Serum cholesterol was significantly decreased in both sexes at these doses. Serum levels of total and conjugated bilirubin were significantly increased at the highest dose in males and females (6.34 and 7.58 mg/kg bw/day respectively), with conjugated bilirubin also increased in females at 3.21 mg/kg bw/day. Serum thyroxine (T4) and T3 levels were decreased in both sexes, with a significant reduction in T4 occurring at doses ≥ 1.33/1.43 mg/kg bw/day.
Male Sprague Dawley rats were administered PFOS at 0, 5 or 20 mg/kg bw/day by oral gavage for 28 days. All rats in the high dose group died by study day 26 (Cui et al. 2009, reviewed by US EPA 2016). Rats had bleeding around the eye socket and nose and yellow staining in the urogenital region at necropsy. Before death, the rats displayed significant weight loss and decreased food consumption compared with controls. Rats administered 5 mg/kg bw/day PFOS also had decreased body weights. Swelling and discolouration of the liver were seen in rats administered 20 mg/kg bw/day, and histopathological examination found hepatocyte hypertrophy and cytoplasmic vacuolation. Congestion and thickened walls were seen in the lungs of rats given 20 mg/kg bw/day, with pulmonary congestion also seen at 5 mg/kg bw/day.
Nonhuman primates
All Rhesus monkeys (2/sex/dose) administered 0, 10, 30, 100 or 300 mg/kg bw/day PFOS by oral gavage died within 20 days (Goldenthal et al. 1979, reviewed by EFSA 2008, UKCOT 2006 and US EPA 2016). Clinical signs observed in all dose groups included decreased activity, emesis with some diarrhoea, body stiffening, general body trembling, twitching, weakness and convulsions. Yellowish-brown discolouration of the liver was seen at necropsy in the 100 and 300 mg/kg bw/day groups, although no microscopic lesions were found on histological examination. Congestion, haemorrhage and lipid depletion of the adrenal cortex were observed in all treatment groups.
Subchronic toxicity studies
Subchronic toxicity studies with PFOS are available in rats and monkeys, but not in mice. Increased liver weights and ALT levels, as well as reduced serum cholesterol levels, were observed in rats administered PFOS at doses of approximately 1.5 mg/kg bw/day. Increased liver weights, decreased total serum cholesterol and HDL cholesterol levels and alterations in thyroid hormone levels were observed in monkeys from doses of 0.15 mg/kg bw/day. Two of six monkeys died or were sacrificed in a moribund condition at the highest dose of 0.75 mg/kg bw/day.
A summary of relevant subchronic toxicity studies considered by overseas regulatory
25

agencies and advisory bodies for establishing a HBGV for PFOS are summarised below.
Rats
Seacat et al. 2003
A subacute and subchronic toxicity study in rats was performed as part of a chronic toxicity/carcinogenicity study with PFOS (Seacat et al. 2003).
Sprague Dawley (Crl:CD (SD)IGS BR) rats were administered PFOS potassium salt at concentrations of 0, 0.5, 2, 5 and 20 ppm in the feed for 4 or 14 weeks (5/sex/dose/interim sacrifice). Rats were housed individually and in-life observations included mortality, clinical observations, body weights and food consumption, with clinical pathology samples (haematology, clinical chemistry and urinalysis) taken during weeks 4 and 14. During the 4- and 14-week necropsies liver samples were collected for analysis of palmitoyl CoA oxidase (PCoAO) activity, cell proliferation index (PI) and PFOS concentrations. A range of tissues from the control and high dose groups were examined microscopically.
In rats dosed for 4 weeks, the mean daily exposure to PFOS in the 0, 0.5, 2, 5 and 20 ppm groups was calculated to be 0, 0.05, 0.18, 0.37 and 1.51 mg/kg bw/day respectively in males and 0, 0.05, 0.22, 0.47 and 1.77 mg/kg bw/day, respectively, in females.
After 4 weeks, relative liver weights were significantly increased in males administered 20 ppm PFOS. No toxicologically significant changes were found in haematology or urinalysis data. The only significant changes in clinical chemistry were a decrease in serum glucose in 20 ppm males and increased aspartate aminotransferase (AST) in 20 ppm females. Analysis of PCoAO activity in the liver, measured as an indicator of peroxisome proliferation, did not show a significant increase. This finding was confirmed when PCoAO activity was retested in a second laboratory: a statistically significant increase was seen in high dose males compared with controls, but the magnitude was less than twofold and not considered relevant for liver tumour formation. No significant effects on hepatocellular PI were observed, and there were no remarkable histopathological findings in the livers of treated animals.
In rats treated for 14 weeks, the mean daily intake of PFOS in the 0, 0.5, 2, 5 and 20 ppm groups was calculated to be 0, 0.03, 0.13, 0.34 and 1.33 mg/kg bw/day respectively in males and 0, 0.04, 0.15, 0.40 and 1.56 mg/kg bw/day, respectively, in females.
After 14 weeks of PFOS administration, no significant effects on body weight were observed. Absolute and relative liver weights were significantly increased in males administered 20 ppm, and relative liver weights were significantly increased in females fed 20 ppm. An increase in the non-segmented neutrophil absolute count was observed in 20 ppm males.
A significant decrease in serum cholesterol was seen in 20 ppm males compared with controls (37 ± 13 versus 63 ± 13 mg/dl). Serum ALT was increased in 20 ppm males (65 ± 53 versus 36 ± 7 IU/l) and urea nitrogen (UN) was significantly increased in 20 ppm males and females (16 ± 2 and 17.2 ± 2 mg/dl respectively) compared with controls (13 ± 2 and 12 ± 2 mg/dl respectively). Females in the 5 ppm group had significantly reduced serum glucose levels, but there was no dose-response for this effect and therefore was not considered clearly related to treatment.
No significant induction of peroxisomal proliferation, as assessed by hepatic PCoAO activity, was observed, and there were no effects on hepatocellular PI. Histopathological changes were restricted to the liver, where hepatic hypertrophy and midzonal to centrilobular vacuolation were observed in males fed 5 or 20 ppm and females fed 20 ppm. The
26
hepatocellular hypertrophy and vacuolation in the 5 ppm group males was graded as marginal and was not accompanied by an increase in liver weight or clinical chemistry changes, and therefore was not considered toxicologically significant.The NOAEL in this study was 5 ppm, equivalent to 0.34 mg/kg bw in males and 0.40 mg/kg bw/day in females based on increased liver weight, histopathology and clinical chemistry findings at the high dose. The mean PFOS concentrations in the serum at this dose after 14 weeks were 43.9 µg/mL in males and 64.4 µg/mL in females. Mean PFOS concentrations in the liver at this dose were 358 µg/g and 370 µg/g in males and females, respectively. At the LOAEL of 20 ppm (equivalent to 1.33 and 1.56 mg/kg bw/day in males and females), mean serum PFOS concentrations were 148 µg/mL and 223 µg/mL in males and females, respectively. Mean liver concentrations at the LOAEL were 568 and 635 µg/g, respectively.
PFOS concentrations obtained in this study are tabulated in the summary of the chronic toxicity/carcinogenicity study later in this document (Thomford 2002/Butenhoff et al. 2012).
Nonhuman primates
Seacat et al. 2002
Cynomolgus monkeys (6/sex/group; 4/sex at the low dose) received the potassium salt of PFOS orally in a capsule by intragastric intubation at doses of 0, 0.03, 0.15, or 0.75 mg/kg bw/day for 26 weeks (Seacat et al. 2002). Two monkeys/sex/group in the control, mid and high dose groups were monitored for one year after the end of the dosing period for delayed or reversible effects. Monkeys were housed individually and were observed twice daily for mortality, morbidity, clinical signs and qualitative food consumption. Ophthalmic observations were performed on each animal before the start of treatment and prior to terminal sacrifice. Body weights were recorded predosing and weekly thereafter. Blood samples were collected for haematology and serum chemistry on days -50, -40 and -27 before treatment and on days 37, 62, 91, 153 and 182 of treatment. PFOS levels were assessed in serum at regular intervals and in liver tissues samples collected at necropsy. Liver samples were also obtained for determination of hepatic peroxisomal proliferation and cell proliferation.
There were no clinical signs of toxicity at the low and mid dose. At the high dose, one male died (on day 155; possible cause of death was severe pulmonary inflammation) and another male was sacrificed on day 179 due to its moribund condition, possibly due to hyperkalaemia. Reduced body weight gain was observed in males and females at the high dose only. No specific observations were reported with respect to food consumption.
Serum PFOS concentrations showed a linear increase over time in the low and mid dose groups while a nonlinear increase was seen in the high dose group, which seemed to plateau over time. The average liver-to-serum PFOS concentration ratios ranged from 0.9:1 to 2.7:1, without a dose-response relationship. The average per cent of the cumulative PFOS dose found in the liver ranged from 4.4 ± 1.6% to 8.7 ± 1.0% without any apparent correlation to dose group or gender.
At the high dose, liver-to-body weight ratios were increased in males and females, and absolute liver weights and liver-to-brain weight ratios were increased in females. Left adrenal-to-body weight ratios were increased in high dose males. At the low and mid dose, there were no treatment-related effects on absolute or relative organ weights (organ to body or organ to brain weight ratios). There were no treatment-related effects on weights of the other organs examined at any dose level (brain, epididymis, kidneys, ovaries, pancreas, testes, and thyroid/parathyroid glands).
A statistically significant reduction in haemoglobin was observed in high dose males at termination of the study. However, haemoglobin values for all high dose males were within
27

the normal range and no stools were found to be discoloured/black. The reduction in haemoglobin is therefore not considered to be toxicologically significant. There were no other treatment-related changes in haematological parameters for males, and no changes in haematological parameters were observed for females at any dose.
In high dose males and females there were marked reductions in total cholesterol and HDL cholesterol (Table 4). In the males, lower cholesterol occurred by day 91 at serum PFOS concentrations of approximately 150 µg/mL. In the females, decreased cholesterol occurred by day 62 at serum PFOS concentrations of approximately 110 µg/mL. A decrease in HDL (measured only on days 153 and 182) was observed in high dose males and mid and high dose females. In females, the apparent effect on HDL cholesterol at the mid dose was not accompanied by a significant decrease in total cholesterol concentration, and the group mean HDL value was within the reference range of 30 to 150 mg/dl for cynomolgus monkeys. In low dose males, a statistically significant decrease in HDL and total cholesterol was observed, however, the HDL values at this dose were within the reference range, and HDL and cholesterol levels in mid dose males were greater than those in low dose males, and not significantly different from controls. During the recovery period, serum cholesterol and HDL levels returned to pretreatment levels (within 36 and 61 days of cessation of treatment, respectively).
Total bilirubin in high dose males was lower than controls on days 91, 153, and 182. Elevated serum bile acid concentrations were observed in high dose males on day 182 only. This was partially the result of a value of 58 mM for the male sacrificed in a moribund condition on day 179. No treatment-related effects on bilirubin or bile acids were observed in females at any dose. Excluding the two high dose males that were either killed moribund or died before the end of the dosing period, no treatment-related findings were observed for any of the other clinical chemistry parameters investigated (albumin, alkaline phosphatase, ALT, AST, blood urea nitrogen (BUN), calcium, chloride, creatinine, creatine kinase, globulin, glucose, inorganic phosphate, potassium, sorbitol dehydrogenase, sodium, triglycerides, total protein and VLDL). The high dose male that died on day 155 had elevated creatine kinase from a sample taken on day 153. The high dose male that was killed in a moribund condition had elevated creatine kinase, creatinine, BUN, sorbitol dehydrogenase, serum bile acids and potassium.
Serum levels of the following were measured prior to and during treatment: cortisol, testosterone, estradiol, oestrone, oestriol, total T3, total T4 and thyroid stimulating hormone (TSH). Free T3 and free T4 were measured from samples taken at terminal sacrifice. In high dose males and females, TSH was increased and total and free T3 were decreased. At the mid dose, increased levels of TSH were seen in males and reduced total T3 levels were seen in males and females at the end of the study. However, thyroid hormone levels of some of the terminal samples were subsequently reanalysed in an independent laboratory, and the changes seen in the mid dose animals were not found to be statistically significantly different from controls. No treatment-related changes in total or free T4 were observed. Mean estradiol in treated females was not significantly different from controls, although 2 of the 6 females in the high dose group had lowered estradiol levels at the end of treatment. Male estradiol levels in the high dose group were significantly lower than controls at the end of treatment, and were significantly lower than pretreatment levels from day 62. There were no treatment-related effects on the other hormones investigated (cortisol, testosterone, oestrone and oestriol). All hormones showing treatment-related changes returned to normal during the recovery period (between 33 and 61 days after cessation of treatment).
There were no significant changes in urinalyses considered to be treatment-related.
28

Table 4: Serum cholesterol and HDL levels in cynomolgus monkeys receiving PFOS by oral gavage
Dose group (mg/kg bw/day) Day 27 Day 37 Day 62 Day 91 Day 153 Day 182
MalesCholesterol (mg/dL)0 138 ± 34 140 ± 22 153 ± 23 154 ± 25 154 ± 30 152 ± 280.03 110 ± 20 118 ± 28 114 ± 25** 126 ± 15 120 ± 16 110 ± 17**
0.15 151 ± 26 146 ± 22 144 ± 20 150 ± 19 149 ± 23 147 ± 240.75 138 ± 29 130 ± 18 125 ± 21 112 ± 27*, ** 65 ± 20*, ** 48 ± 19*, **
HDL (mg/dL)0 ND ND ND ND 69 ± 11 63 ± 110.03 ND ND ND ND 46 ± 5** 42 ± 4**
0.15 ND ND ND ND 55 ± 13 48 ± 140.75 ND ND ND ND 19 ± 7** 13 ± 5**
FemalesCholesterol (mg/dL)0 149 ± 37 147 ± 27 155 ± 46 166 ± 42* 163 ± 49 160 ± 470.03 130 ± 12 124 ± 11* 127 ± 11 134 ± 16 110 ± 22** 122 ± 220.15 144 ± 14 133 ± 22 137 ± 20 140 ± 13 130 ± 23 129 ± 220.75 154 ± 10 130 ± 26 127 ± 19* 111 ± 27*, ** 91 ± 23*, ** 82 ± 15*, **
HDL (mg/dL)0 ND ND ND ND 59 ± 17 56 ± 160.03 ND ND ND ND 47 ± 10 42 ± 90.15 ND ND ND ND 41 ± 9** 36 ± 12**
0.75 ND ND ND ND 23 ± 4** 21 ± 7**
Values are given as the mean ± standard deviation.*Significantly different (p < 0.05) from pretreatment (day –27) value.**Significantly different (p < 0.05) from control value.ND: not determined. Data complied from Seacat et al. 2002.
There were no treatment-related gross pathology findings at the low and mid dose. At the high dose, adverse findings were limited to the lungs of the male that died on day 155 (pulmonary necrosis and severe acute pulmonary inflammation).
Hepatic peroxisome proliferation, as measured by palmitoyl CoA oxidase activity, was increased in high dose females however, the size of the increase (< 2-fold) was not considered to be biologically significant. There were no treatment-related effects on cell proliferation in the liver, pancreas, or testes as determined by immunohistochemistry.
Treatment-related effects were only observed in the liver in high dose males and females (histopathology findings in the lung were not reported for the high dose male that died prematurely, with severe pulmonary inflammation as a possible cause of death). By light microscopy, centrilobular vacuolation, hypertrophy, and mild bile stasis were noted in some high dose livers. By electron microscopy, lipid-droplet accumulation was evident in high dose livers but was not observed in recovery animals. During the recovery period, complete reversal of histopathological changes was observed in high dose livers.
There were no treatment-related effects on the other tissues examined in high dose monkeys (aorta, cecum, cervix, duodenum, oesophagus, eyes, femur, gall bladder, heart, ileum, jejunum, mammary gland, mesenteric lymph node, pituitary, prostate, rectum, mandibular salivary gland, sciatic nerve, seminal vesicles, skeletal muscle (thigh), skin, spinal cord, spleen, sternum with bone marrow, stomach, thymus, trachea, urinary bladder, uterus, and vagina). At the low and mid-dose, no treatment-related effects were observed in the tissues examined (liver, thymus, and spinal cord).
29

The NOAEL is the mid-dose, of 0.15 mg/kg bw/day, on the basis of mortality, reduced body weight gain, increased absolute and relative liver weight and histopathological findings in the liver, and decreased serum cholesterol evident at the high dose of 0.75 mg/kg bw/day.
The mean serum PFOS concentrations achieved following 6 months of dosing at the NOAEL of 0.15 mg/kg bw/day were 82.6 µg/mL and 66.8 µg/mL for males and females, respectively. Mean liver PFOS concentrations were 58.8 µg/g and 69.5 µg/g in males and females, respectively. At the LOAEL of 0.75 mg/kg bw/day, the mean serum PFOS concentrations were 173 µg/mL and 171 µg/mL for males and females, respectively, and mean respective liver PFOS concentrations were 395 and 273 µg/g.
Serum PFOS concentrations from the study are presented in Table 5.
Table 5: Serum levels of PFOS (µg/mL) in cynomolgus monkeys after oral gavage administration for 183 days measured by Seacat et al. (2002)
Oral K+ PFOS concentration (mg/kg bw/day)Dose 0 0.03 0.15 0.75
Male 0.05 ± 0.01 (6) 15.8 ± 1.4 (4) 82.6 ± 25.2 (6) 173 ± 37 (4)Female 0.05 ± 0.02 (6) 13.2 ± 1.4 (4) 66.8 ± 10.8 (6) 171 ± 22 (6)
Data compiled from Seacat 2002Data presented as mean ± standard deviation (sample size)
Chronic studies of toxicity and carcinogenicity
One chronic toxicity/carcinogenicity study is available for PFOS, conducted in rats.
Thomford 2002/Butenhoff et al. 2012
The full report of this study (Thomford 2002) was reviewed by the UK COT and EFSA in their reviews of PFOS. Following these reviews a further paper was prepared to make the key findings more accessible (Butenhoff et al. 2012). Both references are cited in the 2016 US EPA review.
Sprague Dawley (Crl:CD (SD)IGS BR) rats (60 – 70 per sex per dose group) were administered PFOS potassium salt at dietary concentrations of 0, 0.5, 2, 5 and 20 ppm in the feed for up to 104 weeks. An additional recovery group (40/sex/group) was fed 20 ppm for the first 52 weeks after which the animals were fed control diet until study termination. Five rats/sex/group were sacrificed at weeks 4 and 14, and 10 rats/sex/group in the control and high dose groups were killed after 52 weeks of dietary exposure. Remaining animals were scheduled to be terminated after 104 weeks of treatment, however, due to reduced numbers (as a result of mortality) in the females fed 2 ppm, this group was necropsied after 103 weeks.
Rats were housed individually and in-life observations included mortality, clinical observations, body weights and food consumption, with clinical pathology samples (haematology, clinical chemistry and urinalysis) taken from 10 rats/sex/group (except for the 20 ppm recovery group) during weeks 27 and 53. Blood was also taken from surviving rats at the terminal sacrifice for cholesterol, triglyceride and PFOS analysis.
The findings in animals killed at 4 and 14 weeks are detailed in a report by Seacat et al. (2003) and summarised in the section on subchronic toxicity above.
Mean daily intakes of PFOS in the 0.5, 2, 5, 20 ppm and 20 ppm recovery groups were reported by Butenhoff et al. as 0.024, 0.098, 0.242, 0.984 and 1.144 mg/kg bw/day
30

respectively in males, and 0.029, 0.120, 0.299, 1.252 and 1.385 mg/kg bw/day respectively in females. These values were based on gravimetric data for individual food consumption. However, the EFSA and UKCOT reviews of this study, which were based on the report by Thomford (2002), reported slightly different achieved doses. EFSA reported that the achieved doses for the 0.5, 2, 5 and 20 ppm groups were respectively 0.04, 0.14, 0.36 and 1.42 mg/kg bw/day in males and 0.035, 0.14, 0.37 and 1.49 mg/kg bw/day in females. The reason for this difference appears to be that EFSA calculated the mean daily exposure values as the average of the range of calculated exposures cited in the report by Thomford, while Butenhoff et al. calculated the overall mean of weekly determined mean PFOS consumption values for each group.
Serum and liver PFOS concentrations increased in approximate proportion to dose at all time points assessed in both sexes. Concentrations also increased with dosing duration between weeks 4 and 14. Week 53 concentrations in the high dose group were similar to those measured on week 14, which suggests steady-state may have been approached after 14 weeks dietary exposure at 20 ppm. In males, serum levels of PFOS at study termination (week 105) were 33-51% of those measured on week 14, and liver concentrations were 19-36% of week 14 values. In females, serum levels of PFOS remained relatively constant between 14 and 105 weeks, while liver concentrations were 35-80% lower at week 105 compared with week 14. The decline in PFOS concentrations was considered likely to be due to chronic progressive nephritis (a spontaneous age-related disease) leading to increased urinary elimination of PFOS. Individual serum PFOS concentrations correlated significantly with the incidence and severity of chronic progressive nephritis in almost all male groups and in the 2 ppm females.
Mortality was decreased in males fed 5 and 20 ppm, resulting in a statistically significant trend for increased survival in males. No significant trend was identified for survival in females, although there was a statistically significant decrease in survival in females fed 2 ppm, compared with the controls. There were no clinical observations attributed to PFOS exposure, and there was no effect on the incidence of palpable masses.
Males in the 20 ppm and 20 ppm recovery groups had significantly lower mean body weights compared to controls during weeks 9 to 37. Females in the 20 ppm group had significantly lower body weights than controls during weeks 3 to 101. In the female 20 ppm recovery group, body weights were significantly lower than controls during weeks 3 to 61. At the end of the study, there were no significant differences in mean body weights between PFOS treated rats and controls in all groups (main study and recovery animals), although females in the 20 ppm group had lower body weights than controls (447 ± 101 g versus 516 ± 106 g).
At the week 53 interim sacrifice, absolute and relative (to body weight and brain weight) liver weights were increased in the 20 ppm males compared with controls. Absolute and relative spleen weights were also decreased in 20 ppm males. Significantly decreased left thyroid/parathyroid weights in males were not considered related to treatment by the study authors based on the absence of a contralateral effect and a lack of difference in organ to body weight ratios between controls and treated male rats. In female rats administered 20 ppm PFOS, significant increases in organ to body weight ratios for brain, kidney, liver and spleen were considered unlikely to be of toxicological importance given the significantly decreased body weight in these females at this timepoint (week 53). Decreases in adrenal weights were also considered likely to be secondary to the body weight loss.
Statistically significant increases in serum ALT were observed in 20 ppm males on weeks 14 and 53 compared with controls. ALT was also increased in 20 ppm males at week 27 but this did not reach statistical significance. The same effect was not seen in females. The increased ALT levels in males were accompanied by a large increase in relative standard deviations, driven by one and two individual increases in ALT at weeks 14 and 53
31

respectively. Exclusion of these high individual values yielded mean values similar to those of the controls. The study authors noted that this finding, together with a lack of effect on AST, raises some questions regarding the toxicological significance of the increased ALT levels.
Mean serum total cholesterol was significantly reduced in 20 ppm males on weeks 14, 27 and 53 compared with controls. Cholesterol was also reduced in males fed 20 ppm at study termination, although this did not reach statistical significance. In females, statistically significant reductions in serum cholesterol were seen in the 2, 5 and 20 ppm groups at week 27. Cholesterol was also lower than controls in 20 ppm females at week 53 and study termination, although this was not statistically significant.
Serum UN was significantly increased in 20 ppm males and females on weeks 14, 27 and 53. Males and females fed 5 ppm and males given 2 ppm also had significantly elevated UN on week 53. There were no correlative microscopic renal findings and serum creatinine was generally unchanged relative to controls. The study authors therefore concluded that the increased UN levels were likely to be associated with mild dehydration as a result of non-renal-related morbidity.
No significant urinalysis or haematological changes were observed.
Non-neoplastic lesions attributed to treatment were only seen in the liver (significant findings summarised in Table 6). In rats sacrificed at the end of the study, hepatotoxicity was characterised by centrilobular hypertrophy, centrilobular eosinophilic hepatocytic granules, centrilobular pigment or centrilobular hepatocytic vacuolation in males and female given 5 or 20 ppm PFOS. A significant increase in individual hepatocyte necrosis was seen in both sexes given 20 ppm. Electron microscopy examination of a subset of livers from the control and 20 ppm groups identified smooth endoplasmic reticulum hyperplasia and hepatocellular hypertrophy as the prominent changes. A clear increase in peroxisomal bodies was not seen. A statistically significant increase in hepatocellular centrilobular hypertrophy was also observed in males fed 2 ppm. However, this was not accompanied by any other histopathological signs of toxicity or relevant clinical chemistry changes, and the incidence of hypertrophy at this dose was relatively low. Therefore this effect was not considered to be adverse.
Hepatocellular lesions were not evident in the 20 ppm recovery animals at the end of the study.
With respect to neoplastic lesions, a significantly increased incidence of hepatocellular adenomas was seen in 20 ppm males compared with controls (7/60 at 20 ppm, 0/60 in controls). No hepatocellular ademonas were seen in the 20 ppm recovery males. A statistically significant increase in the incidence of thyroid follicular cell ademonas was seen in the 20 ppm recovery males (9/39) compared to the controls (3/60) or the 20 ppm group (4/59). The significance of this finding is unclear since there was no significant trend in thyroid tumours across treatment groups, and there was no other microscopic evidence of thyroid abnormality.
32

Table 6: Incidence of non-neoplastic liver lesions in male and female rats
Lesion
Dietary PFOS concentration (ppm)
0 0.5 2.0 5.0 20
Males
Centrilobular hypertrophy 0/65 2/55 4/55* 22/55** 42/65**Eosinophilic cytoplasm granules (centrilobular) 0/65 0/55 0/55 0/55 14/65**
Centrilobular hepatocellular pigment 0/65 0/55 0/55 0/55 6/65*
Midzonal/centrilobular vacuolation 3/65 3/55 6/55 13/55** 19/65**
Individual hepatocyte necrosis 5/65 4/55 6/55 5/55 14/65*Females
Centrilobular hypertrophy 2/65 1/55 4/55 16/55** 52/65**Eosinophilic cytoplasm granules (centrilobular) 0/65 0/55 0/55 7/55 36/65**
Centrilobular hepatocellular pigment 0/65 0/55 0/55 1/55 36/65**
Individual hepatocyte necrosis 7/65 6/55 6/55 6/55 15/65**
* significantly increased over control: p < 0.05** significantly increased over control: p < 0.01
In females, statistically significant increased incidences of hepatocellular adenoma (5/60) and combined hepatocellular adenoma/carcinoma (6/60) were seen at the high dose compared with controls (0/60). A significant increase in combined thyroid follicular cell adenoma and carcinoma was observed in the 5 ppm group (3/50) compared to controls and the 20 ppm group (0/60 and 1/60 respectively). Thyroid C cell adenoma and thyroid C cell adenoma/carcinoma showed statistically significant decreased incidences in 20 ppm females compared with controls. The 0.5 ppm females had significantly increased incidences of mammary fibroadenoma and mammary fibroadenoma/adenoma compared with controls. However, there was a lack of dose-response and females in the high dose group had a significantly lower incidence than the controls, resulting in statistically significant decreased trends for the incidences of mammary fibroadenoma and mammary fibroadenoma/adenoma overall.
The NOAEL in this study was 2 ppm (equivalent to 0.098 mg/kg bw/day in male rats and 0.120 mg/kg bw/day in female rats), based on the findings of hepatotoxicity at 5 ppm (equivalent to 0.242 mg/kg bw/day and 0.299 mg/kg bw/day in males and females, respectively). The mean serum PFOS concentrations after 14 weeks of dosing at the NOAEL were 17.10 µg/mL in males and 27.3 µg/mL in females. Mean serum PFOS concentrations after 14 weeks of dosing at the LOAEL were 43.9 µg/mL in males and 64.4 µg/mL in females.
Serum PFOS concentrations for this study, as well as values relevant to the 14 week study summarised earlier in this document, are presented in Table 7.
33
Table 7: Serum PFOS concentrations measured by Seacat et al. (2003) and Butenhoff et al. (2012)
Serum levels of PFOS (µg/mL) in Crl:CD (SD) IGS BR by dietary administration for up to 106 weeks
Week
Dietary K+ PFOS Concentration (Ppm)
0 0.5 2 5 20 20 Recovery
Malesmg/kg bw/day 0 0.05 0.18 0.37 1.514 <LOQ 0.91 ± 0.06 4.33 ± 1.16 7.57 ± 2.17 41.80 ± 7.92 -mg/kg bw/day 0 0.03 0.13 0.34 1.3314 <LOQ 4.04 ± 0.80 17.10 ± 1.22 43.90 ± 4.90 148.0 ± 13.80 -mg/kg bw/day1 0 0.024 0.098 0.242 0.984
53 0.025 ± 0.018 - - - 146.0 ± 33.5 (4) -
105 0.012 ± 0.010 (11)
1.31 ± 1.30 (10) 7.60 ± 8.60 22.50 ± 23.50
(25)69.3 ± 57.9
(22) -
106 - - - - - 2.41 ± 5.09 (10)Femalesmg/kg bw/day 0 0.05 0.22 0.47 1.774 0.026 ± 0.007 1.61 ± 0.21 6.62 ± 0.50 12.60 ± 1.73 54.00 ± 7.34 -mg/kg bw/day 0 0.04 0.15 0.40 1.56
14 2.67 ± 4.58 6.96 ± 0.99 (4) 27.30 ± 2.34 64.40 ± 5.48 223.0 ± 22.40 -
mg/kg bw/day1 0 0.029 0.120 0.299 1.25153 0.395 ± 0.777 - - - - -
102 - - 20.20 ± 13.30 (9) - - -
105 0.084 ± 0.134 (24)
4.35 ± 2.78 (15) - 75.00 ± 45.70
(15)233.0 ± 124.0
(25) -
106 - - - - - 9.51 ± 8.70 (17)1 Grand mean taken from Butenhoff et al. 2012 (Table 2)Data compiled from Butenhoff et al. 2012 and Seacat et al. 2003Sample size 5, unless noted in ()Data presented as mean ± standard deviation
Genotoxicity
EFSA (2008) and the US EPA (2016) concluded that PFOS is not genotoxic based on negative findings in in vitro and in vivo tests.
PFOS was negative in the Salmonella typhimurium reversion gene mutation assay and the mitotic recombination test in Saccharomyces cerevisiae (D4 strain) with and without metabolic action. It was also negative in a Salmonella-Escherichia coli reverse mutation assay with and without metabolic activation. In mammalian cells, PFOS did not induce chromosomal aberrations in cultured human lymphocytes with and without metabolic activation, and was negative in an unscheduled DNA synthesis assay in rat liver primary cell cultures.
PFOS was also shown not to induce micronuclei in an in vivo mouse micronucleus assay.
The US EPA (2016) notes that a 50% w/w solution of the diethanolammonium salt of PFOS in water (T-2247 CoC) was negative with and without metabolic activation in a bacterial reverse mutation assay. EFSA (2008) reported that several PFOS precursors (N-ethyl perfluorooctane sulfonamidoethanol [N-EtFOSE], N-ethyl perfluorooctane sulfonamide [N-EtFOSA], N-methylperfluorooctane sulfonamidoethanol [N-MeFOSE], N-methyl
34

perfluorooctane sulfonamide [N-MeFOSA] and potassium-N-ethyl-N ((hepatodecafluorooctyl)-sulfonyl)-glycinate [PFOSAA]) were negative in in vitro and in vivo tests.
Reproductive and developmental toxicity
Reproductive effects
Rats
Luebker et al. 2005b
A two-generation reproductive toxicity study was conducted in Crl:CD(SD)IGS BR VAF rats. Groups of 35 rats/sex/group were administered PFOS potassium salt by oral gavage at 0.0, 0.1, 0.4, 1.6 and 3.2 mg/kg bw/day for 42 days prior to mating and during the mating period. Parental male animals were sacrificed at the end of the cohabitation period, while females continued to be treated through the gestation, parturition and lactation periods.
Serum and liver PFOS concentrations measured in parental generation rats and first filial generation pups (F0 and F1 respectively), increased with increasing dose.
F0 Generation
All F0 rats were observed twice daily for viability and clinical signs, and body weights and feed consumption were recorded at regular intervals which varied depending on the phase of the study. Ten females in each group were assigned to caesarean sectioning on gestation day (GD) 10 and numbers of corpora lutea, implantations and viable and non-viable embryos were recorded. The remaining females were allowed to deliver naturally and were killed on postnatal day (PND) 21. A range of reproductive outcomes were assessed. Liver and blood samples from F0 females in the 0.0, 0.4 and 1.6 mg/kg bw/day dose groups were collected for PFOS analysis.
No deaths or clinical signs were observed in F0 males. Statistically significant reductions in body weight were seen in males administered 1.6 and 3.2 mg/kg bw/day, and a significant reduction in overall body weight gain was seen in males treated with 0.4 mg/kg bw/day and higher. Significant reductions in absolute feed consumption were seen in males given ≥ 1.6 mg/kg bw/day over the premating period, while significant reductions in absolute feed consumption were seen in males at ≥ 0.4 mg/kg bw/day during the cohabitation period. The US EPA and UKCOT reviews of this study noted that a significant reduction in absolute weights of the seminal vesicles and prostate was observed in males administered 3.2 mg/kg bw/day.
In the F0 females, no deaths were observed. Increased incidences of localised alopecia were observed at 0.4 mg/kg bw/day and higher. Statistically significant reductions in body weight were seen in F0 females administered 3.2 mg/kg bw/day throughout the precohabitation, gestation and lactation phases of the study and in females given 1.6 mg/kg bw/day during the gestation and lactation periods. Overall body weight gains were significantly reduced at 1.6 and 3.2 mg/kg bw/day during the premating period and at 3.2 mg/kg bw/day during gestation. Mean absolute feed consumption was significantly reduced in F0 females given 3.2 mg/kg bw/day during premating and gestation, and in the 1.6 mg/kg bw/day group during lactation (feed consumption was not calculated during lactation for the 3.2 mg/kg bw/day group as all pups died at this dose).
Mating and fertility parameters such as estrous cycle, number of pregnancies per number of
35
matings, number of days to inseminate and number of matings in the first week of cohabitation were unaffected by PFOS treatment at all doses. High dose females had significant reductions in the numbers of implantation sites per delivered litter, decreased gestational length, increased numbers of stillborn pups and increased numbers of dams with all pups dying on PNDs 1 – 4. Two dams in the 1.6 mg/kg bw/day group (10%) also had litters in which all pups died on PNDs 1 – 4. The control value was 0% and the contract laboratory reported a historical control incidence of 0%, suggesting that this effect is related to treatment.
F1 generation
A statistically significant reduction in the mean number of live-born pups was seen at 3.2 mg/kg bw/day (7.8 ± 4.0) compared with controls (13.6 ± 2.3), as well as a significant increase in the mean number of stillborn pups per litter compared with controls (2.2 ± 2.3 versus 0.3 ± 0.7 respectively). At 3.2 mg/kg bw/day, there was 45.5% mortality of neonates on PND 1 and 100% of pups had died within the first two postnatal days. In the 1.6 mg/kg bw/day group neonatal mortality was 10.6% on the first day and 33.9% by PND 4. The viability index was 0% and 66% at 3.2 and 1.6 mg/kg bw/day, respectively. Necropsy of the pups found dead or moribund did not reveal a cause of death. Observations of pups after birth did not find signs of respiratory distress.
The high dose group was precluded from further evaluation because there were no surviving pups by PND 2. Statistically significant reductions in pup weight per litter and pup weight gain per litter were seen at 1.6 mg/kg bw/day compared with controls. Significant delays compared with controls were seen in the mean number of days for 50% of pups achieving the developmental landmarks of pinna unfolding (1.6 days), eye-opening (1.4 days), surface righting (2.2 days) and air righting (2.0 days). A slight delay in eye-opening compared with controls (0.6 days) was also observed in the 0.4 mg/kg bw/day pups however, this effect was not considered to be clearly treatment-related.
The 1.6 mg/kg bw/day F1 pups were not continued in the study past weaning because of their poor condition, so only pups from the 0.0, 0.1 and 0.4 mg/kg bw/day groups were involved in the remainder of the study. No treatment-related deaths or clinical signs were observed in the 0.1 and 0.4 mg/kg bw/day rats after direct dosing was initiated at weaning. Body weights, body weight gains and absolute and relative feed consumption were similar to controls at these doses. Sexual maturation was not affected in males or females at 0.1 and 0.4 mg/kg bw/day. Passive avoidance and water maze tests did not find any effects on learning or memory.
There was no significant effect of PFOS treatment on the reproductive performance or delivery parameters of F1 parents at 0.1 and 0.4 mg/kg bw/day.
F2 generation
No effects on pup mortality were observed in F2 litters at any time during the lactation period. All F2 generation pups were sacrificed on PND 21. A transient reduction in body weight and body weight gain was seen at 0.4 mg/kg bw/day, but mean pup weight per litter on PND 21 and body weight gain between PNDs 14 – 21 were not significantly different from controls. At PND 21 mean pup weights remained approximately 9% lower than controls but the results were not statistically significant. It is noted that in a follow-up study by the same laboratory a significant reduction in birth weight and weight on PND 5 was observed in F1 pups born to mothers treated with PFOS at 0.4 mg/kg bw/day (Luebker et al. 2005a). Pup weight findings for the F2 generation are summarised in Table 8.
36
Table 8: Pup weight and weight change per litter for F2 pups during lactation
Day of study
Dose group (mg/kg bw/day PFOS)
0.0 0.1 0.4
Pup weight/litter (g)
1 6.3 ± 0.8 6.1 ± 0.5 6.2 ± 0.54 (preculling) 8.7 ± 1.6 8.2 ± 1.0 8.0 ± 1.34 (postculling) 8.8 ± 1.6 8.3 ± 1.0 8.0 ± 1.37 14.7 ± 2.4 13.9 ± 2.2 12.8 ± 2.6*14 32.0 ± 3.5 31.8 ± 3.1 28.9 ± 4.7**21 50.1 ± 5.1 49.2 ± 5.0 46.5 ± 6.3
Pup weight change/litter (g)
1 – 4 (preculling) 2.4 ± 1.0 2.0 ± 0.9 1.8 ± 1.04 (postculling) – 7 5.9 ± 1.0 5.7 ± 1.3 4.8 ± 1.4**7 – 14 17.4 ± 1.4 17.8 ± 1.5 16.2 ± 2.5*14 – 21 18.1 ± 2.5 17.4 ± 2.4 17.6 ± 2.2
* significantly different from control: p < 0.05** significantly different from control: p < 0.01
The NOAEL for parental toxicity was 0.1 mg/kg bw/day based on decreased body weight gain and food consumption in the F0 generation. The NOAEL for reproductive toxicity was 0.4 mg/kg bw/day based on increased numbers of dams with all pups dying on PNDs 1 – 4. The NOAEL for offspring toxicity was 0.1 mg/kg bw/day based on significant decreases in pup weight and weight gain during lactation.
Serum levels of PFOS measured in this study are presented in Table 9.
Table 9: Maternal serum PFOS concentrations measured by Luebker et al. (2005b)
Serum levels of PFOS (µg/mL) in pregnant female Crl:CD®(SD)IGS VAF/Plus® rats dosed by oral gavage from 42-days prior to mating up to day of sampling
Day
Oral K+PFOS concentration (mg/kg bw/day)
0 0.1 0.4 1.6 3.2
Dams
GD 1 ND 8.90 ± 1.10 (16) 40.7 ± 4.46(16) 160 ± 12.5(16) 318 ± 21.1 (16)GD 7 ND 7.83 ± 1.11 (15) 40.9 ± 5.89 (14) 154 ± 14.0 (12) 306 ± 32.1 (14)GD 15 ND 8.81 ± 1.47 (15) 41.4 ± 4.80 (14) 156 ± 25.9 (12) 275 ± 26.7 (14)GD 21 ND 4.52 ± 1.15 (7) 26.2 ± 16.1 (6) 136 ± 86.5 (4) 155 ± 39.3 (6)
Data presented as mean ± standard deviation (sample size)GD Gestational dayLimit of quantification = 0.004 µg/mLValues compiled from Luebker et al. 2005b
Given the significant mortality seen at the two highest doses, a cross-fostering study was conducted to investigate the potential roles of in utero versus lactational exposure to PFOS, as well as altered maternal care. Female rats were administered 0.0 or 1.6 mg/kg bw/day PFOS, starting 42 days prior to mating with untreated males and continuing through gestation until PND 21.Twenty-five dams and litters per dose group were assigned to cross-fostering. Upon delivery, F1 litters were not allowed to be nursed by their natural dams but were immediately cross-fostered to other dams. On PND 4, cross-fostered litters were culled to 5/sex/litter where possible. The remaining pups were killed on PND 21 and the dams were killed on PND 22. Additional females not assigned to cross-fostering were used for biological
37
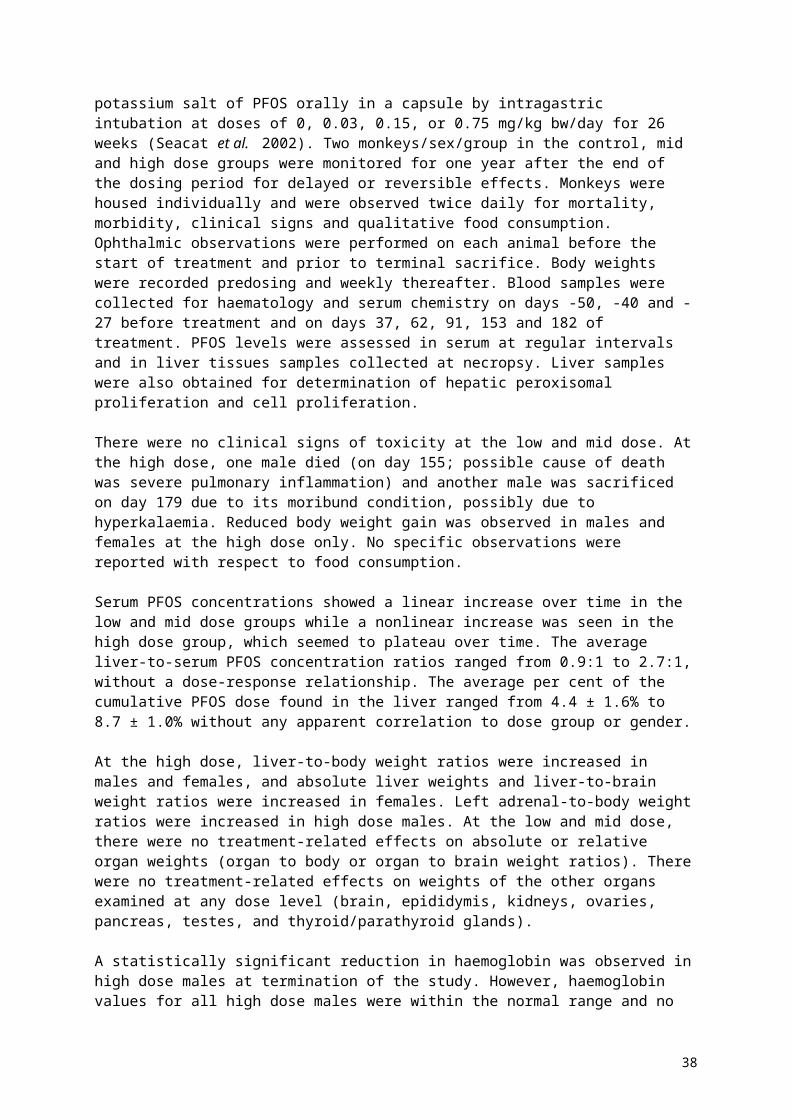
sample collection (milk, serum and liver) and were sacrificed on PND 14. Liver and lung samples were collected from the first 10 control pups and first 10 treated pups not used for cross-fostering. Livers were examined for numbers of peroxisomes in hepatocytes and lungs were assessed for potential effects on lamellar bodies within type II cells and lung surfactant lining the alveoli.
The following cross-fostered subgroups were created:
control litters fostered by control dams (CL/CD; negative control) control litters fostered by treated dams (CL/TD; postnatal exposure only) treated litters fostered by control dams (TL/CD; in utero exposure only) treated litters fostered by treated dams (TL/TD; in utero and postnatal exposure)
No mortality or adverse clinical signs were seen in dams treated with 1.6 mg/kg bw/day. Maternal body weights were significantly reduced in treated dams during the end of the precohabitation period and during gestation. Reduced body weights were also observed for treated dams during lactation but not at the end of the lactation period (PND 22). Significant reductions in gestation length, implantation sites per litter, total litter size and live litter size were observed for treated dams. Statistically significant reductions in these parameters were not observed at the 1.6 mg/kg bw/day dose group in the two-generation study, although they were seen at 3.2 mg/kg bw/day.
Pup mortality was highest in the treated litters fostered by treated dams (group TL/TD) and 19.2% of pups died during the first four days of lactation. An apparent increase in pup mortality was also seen in treated pups fostered by control dams (TL/CD; 9.0%) compared with the CL/CD group (1.6%), although this did not reach statistical significance. No increase in pup mortality was seen in untreated pups fostered by treated dams (CL/TD; 1.1%).
Significant reductions in mean pup body weight relative to the control group (CL/CD) were seen from PND 1 in all pups born to treated dams regardless of lactational exposure to PFOS and these reductions persisted throughout the study. Reduced body weight compared with controls was also seen in the lactation-only exposure group (CL/TD) from PND 7 onwards. Mean litter weight gains were significantly reduced compared to controls in the CL/TD, TL/CD and TL/TD groups at all time periods during lactation, with the exception of PNDs 7 – 14. The greatest reduction in body weight and body weight gain was seen in the group exposed during both gestation and lactation (TL/TD).
Electron microscopy of liver samples showed an approximately 2-fold, statistically significant increase in the mean number of peroxisomes in the hepatocytes of treated pups compared with controls. Subjective evaluation indicated that glycogen stores might have been increased in livers of treated pups compared with controls. No significant differences in pup lung histopathology were observed between control and treated pups.
The cross-fostering study results indicate that neonatal toxicity is primarily caused by in utero exposure to PFOS, while postnatal exposure via maternal milk together with in utero exposure also appears to contribute. Postnatal exposure alone had no impact on pup survival, but did result in reductions in body weight and body weight gain.
Luebker et al. 2005a
As a follow-up to the two-generation study discussed above, the dose-response curve for neonatal mortality in rat pups born to PFOS exposed dams was investigated in a companion study (Luebker et al. 2005a). Biochemical and pharmacokinetic parameters potentially related to the aetiology of the effects seen in neonatal pups were also assessed.
38

Female Crl:CD (SD)IGS VAF Plus rats were treated with 0.0, 0.4, 0.8, 1.0, 1.2, 1.6 and 2.0 mg/kg bw/day PFOS potassium salt by oral gavage. Females were dosed for 42 days prior to mating with untreated males of the same strain. Dosing continued through the mating interval (maximum 14 days) until GD 20 for dams assigned to caesarean section (eight in each of the control, 1.6 and 2.0 mg/kg bw/day groups). Dams assigned to natural delivery (nominally 20 per dose group) were exposed until PND 4. Dams in the caesarean section groups were sacrificed on GD 21, while dams and pups in the natural delivery groups were sacrificed on PND 5.
Dams in the caesarean section group were examined for pregnancy, implantation sites, live/dead fetuses and early/late resorptions. Pooled fetal body weights were also assessed. Reproductive and fetal parameters were assessed in the groups assigned to natural delivery. Biochemical parameters investigated in dams and litters included serum lipids, glucose, melavonic acid lactone and thyroid hormones, milk cholesterol and liver lipids and glycogen. Mevalonic acid lactone was assessed as it is a marker of 3-hydroxy-3-methylglutaryl coenzyme A (HMG-CoA) reductase activity. HMG-CoA reductase converts HMG-CoA to mevalonic acid, which is the rate limiting step in cholesterol synthesis. Some inhibitors of this enzyme are known to cause developmental effect in rats. Effects on blood glucose and liver glycogen levels were assessed based on a previous observation of a possible increase in liver glycogen stores in rat pups born to rats treated with PFOS at 1.6 mg/kg bw/day (Luebker et al. 2005b). Liver malic enzyme activity, a marker for thyroid hormone response, was also assessed.
No mortality occurred in PFOS treated dams and no effects on mating or fertility were observed. In the dams that underwent caesarean sections, no effects on reproductive parameters (corpora lutea, implantations, live/dead fetuses, resorptions, pooled fetal body weights and sex ratio) were observed. Overall, maternal body weights were slightly but statistically significantly reduced compared with controls in the 1.6 and 2.0 mg/kg bw/day dose groups during gestation (5% and 7% of controls respectively) and in the 2.0 mg/kg bw/day group during lactation (approximately 89% of control on PND 5). Mean body weight gains were significantly reduced at 2.0 mg/kg bw/day during the premating phase and at doses of 0.8 mg/kg bw/day and higher during lactation. The effect on body weight gain during lactation was dose-dependent with an overall negative body weight gain (i.e. loss of weight) at the highest dose. No apparent weight gain effects were observed during gestation. There was a general trend for decreased feed consumption with increasing dose during premating, gestation and lactation. In natural delivery dose group dams, relative liver weights (to body weight) at terminal sacrifice were significantly increased (10%, 17% and 12% in the 0.8, 1.2 and 2.0 mg/kg bw/day dose groups, respectively). These changes were considered to be reflective of the slight decreases in terminal body weights and/or slight increases in liver weight, and are not considered to be toxicologically significant.
Among the dams allowed to deliver, the average number of implantation sites, gestation index and number of live births were similar in control and treatment groups. Gestation length was significantly decreased in a dose-dependent manner at doses of 0.8 mg/kg bw/day and higher (data shown graphically). The viability index compared with controls began to decrease at 0.8 mg/kg bw/day (93.1% compared with 97.3% in controls) and was statistically significant at 1.6 and 2.0 mg/kg bw/day (49.3% and 17.1% respectively). The number of dams with all pups dying was increased at 1.6 and 2.0 mg/kg bw/day (4 and 14 respectively) with statistical significance reached at 2.0 mg/kg bw/day. The control incidence of this parameter, as well as the historical control incidence provided by the performing laboratory, was 0.
Mean pup birth weights per litter were significantly decreased in all PFOS treated groups compared with controls, as were mean pup weights per litter on PND 5 and mean pup weight gains per litter to PND 5.
39

The mean per cent of pups per litter surviving to PND 5 was reduced in a dose-dependent manner with statistical significance attained in the 1.6 and 2.0 mg/kg bw/day maternal dose groups.
Data from the pharmacokinetic analysis indicated a linear proportionality of mean serum PFOS concentrations to maternal dose prior to mating and through the first part of gestation. However, at GD 21, mean serum PFOS concentration were notably reduced from values measured earlier in gestation. Transfer of PFOS from dams to fetuses in utero was confirmed.
In the animals sacrificed on GD 20, decreased cholesterol was seen in the liver of dams exposed to 1.6 or 2.0 mg/kg bw/day compared with controls, while increased serum cholesterol and low density lipoproteins were seen in fetuses. There was no clear dose-response however. Among the animals maintained until PND 5, maternal serum cholesterol levels were significantly reduced in all treatment groups, but again without a clear dose-response. No other effects on serum, liver or milk cholesterol or serum lipoproteins were observed in dams or pups on PND 5. Plasma mevalonic acid lactone, measured as a marker of HMG-CoA reductase activity, was not significantly affected by treatment at GD 21 or PND 5.
No effects on serum glucose and triglyceride levels, or liver triglyceride levels, were seen in dams or fetuses sacrificed on GD 21. On PND 5, maternal serum triglycerides were decreased and serum glucose increased in a dose-dependent manner, with statistical significance at 1.6 and 2.0 mg/kg bw/day for triglycerides and at 2.0 mg/kg bw/day for glucose. Dam liver triglycerides were dose dependently increased, with statistical significance at the two highest doses. In pups, serum glucose and triglycerides were unchanged while liver triglycerides were significantly decreased at doses ≥ 1.0 mg/kg bw/day. No significant differences in glycogen levels were seen in pup livers collected from the 0.0, 0.4, 1.6 and 2.0 mg/kg bw/day groups on PND 5. Overall, these findings do not suggest that glycogen utilisation was impaired in PFOS treated pups.
Statistically significant reductions in total T3 (at ≥ 1.2 mg/kg bw/day) and total T4 (at ≥ 0.4 mg/kg bw/day) were seen in PFOS treated dams. In pups from treated dams, significant reductions in total T4 down to levels below the limit of detection were observed in all treated groups, with no change in total T3. However, a negative bias was suspected in the measurement of free T3 and free T4 by the radioimmunoassay methods used due to disturbances in equilibration of free and bound hormone. Therefore follow-up analyses of free T3 and free T4 were made using reference methods in selected groups, as well as use of an alternative chemiluminometric method for total T3 and total T4. TSH levels were also assessed.
Follow-up analysis of maternal serum found no effect of PFOS on free T4 levels and TSH levels were also unchanged. In pups, analysis using the chemiluminometric method found a statistically significant reduction in total T3 in the 1.0 mg/kg bw/day group, the highest dose group that was retested. No effect on free T3 was observed at this dose using the reference method, and no effect on free T4 was observed based on analysis of a limited number of samples from the control and 0.4 mg/kg bw/day groups. TSH levels were generally unchanged: TSH was slightly elevated serum from pups in the 1.6 mg/kg maternal dose group with statistical significance in the reanalysis, but the magnitude of the increase (1.45 ± 0.34 ng/mL versus 1.02 ± 0.17 ng/mL in controls) did not suggest a hypothyroid state.
Liver malic enzyme activity, a marker for thyroid hormone response, did not show significant differences between control and PFOS treated samples obtained from dams and pups in the 0.0, 0.4, 1.6 and 2.0 mg/kg bw/day dose groups on PND 5. No microscopic changes were observed in hearts and thyroids collected from one male and one female pup in the 2.0
40
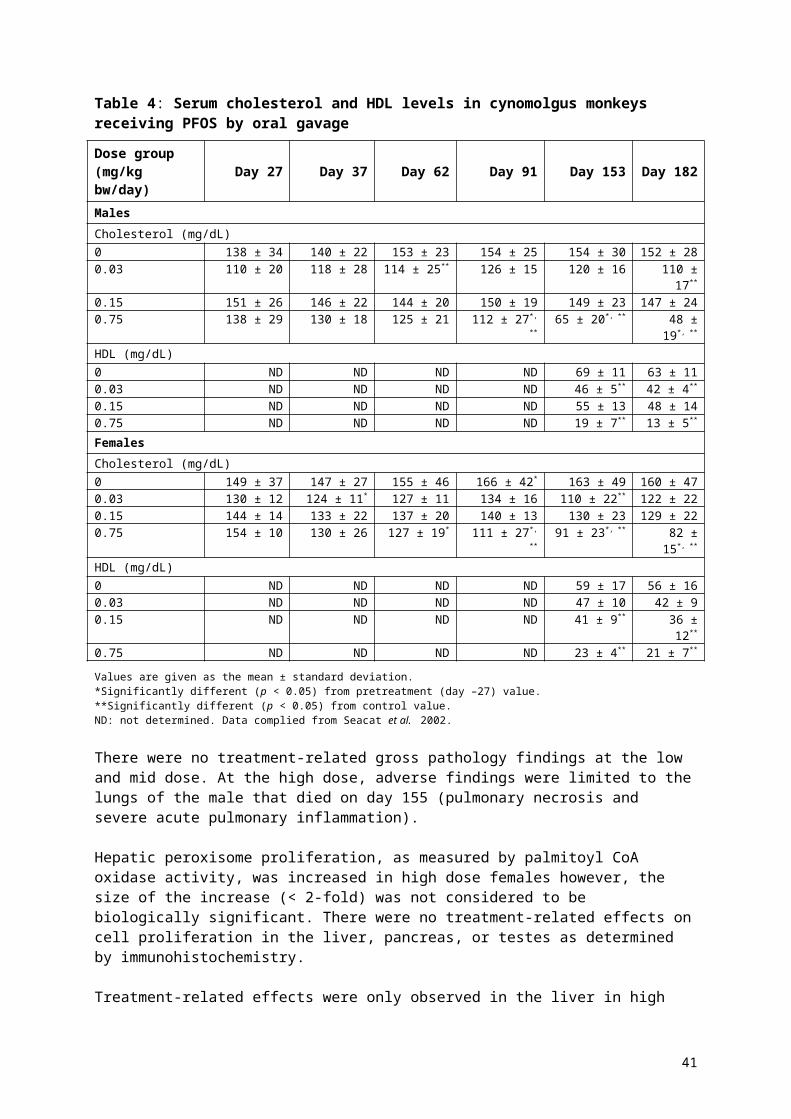
mg/kg bw/day maternal dose group as compared to controls. Overall, the results of this study do not suggest that PFOS exposure in utero and via lactation induces a hypothyroid state in pups.
The NOAEL for maternal toxicity was 0.4 mg/kg bw/day based on decreased body weight gain at 0.8 mg/kg bw/day. The NOAEL for reproductive toxicity was 0.4 mg/kg bw/day based on reduced gestation length at higher doses. The LOAEL for offspring toxicity was 0.4 mg/kg bw/day (based on decreased body weight and body weight gain). A NOAEL for offspring toxicity was not identified.
Developmental effects
Mice
Thibodeaux et al. 2003 and Lau et al. 2003
Pregnant CD-1 mice (20 – 29 per group) were administered PFOS potassium salt by oral gavage from GD 1 to GD 17, at doses of 0, 1, 5, 10, 15 and 20 mg/kg bw/day (Thibodeaux et al. 2003). Maternal weight gain and food and water consumption were monitored throughout gestation. Some mice (number not specified) were sacrificed on GDs 6 and 12 with the remaining dams sacrificed on GD 18. Blood samples were collected at sacrifice for serum PFOS, serum chemistry and thyroid hormone analysis. At sacrifice, the gravid uterus was removed and individual live fetuses were weighed and prepared for teratological evaluation.
Maternal serum and liver PFOS concentrations increased with dose with saturation appearing to occur at the two highest doses (data were presented graphically).
Maternal body weight gain was significantly decreased at 20 mg/kg bw/day compared with controls. Food and water consumption were not significantly affected by treatment. Maternal liver weights (absolute and relative to body weight) were significantly increased compared with controls at doses ≥ 5 mg/kg bw/day. Maternal serum triglycerides were significantly reduced at doses ≥ 5 mg/kg bw/day. Serum cholesterol was significantly decreased at the highest dose only. Serum T4 levels were decreased in a dose-dependent manner on GD 6 with statistical significance achieved at the highest dose, but T4 levels were no longer significantly different from controls during the last week of pregnancy. Levels of T3 and TSH were not affected by treatment.
A significant increase in postimplantation loss was seen at 20 mg/kg bw/day compared with controls (89.1 ± 5.5 % live fetuses versus 97.9 ± 1.0 % respectively). Significantly reduced pup body weights were seen in 10 mg/kg bw and 15 mg/kg bw pups, but pup body weights were not affected at 20 mg/kg bw/day. The incidence of sternal defects was significantly increased compared with controls at doses ≥ 5 mg/kg bw/day, an increased incidence of enlarged right atrium and ventricular septal defects was seen at ≥ 10 mg/kg bw/day, and an increased incidence of cleft palate was seen at ≥ 15 mg/kg bw/day. The sternal defects were considered to be indications of delayed development.
The maternal NOAEL in this study was 1 mg/kg bw/day, based on the increased liver weight and reduced serum triglyceride levels seen at 5 mg/kg bw/day. The maternal serum PFOS concentration at the NOAEL, measured on GD 18, was 9 µg/mL. The NOAEL for embryo and fetal toxicity was 1 mg/kg bw/day based on an increase in fetal sternal effects at 5 mg/kg bw/day.
Lau et al. (2003) conducted a companion study to the Thibodeaux et al. (2003) study, to assess the postnatal effects of in utero PFOS exposure. PFOS potassium salt was administered by oral gavage to pregnant CD-1 mice at doses of 0, 1, 5, 10, 15 and 20 mg/kg
41
bw/day from GDs 1 to 17. Time of parturition for each animal, number of live pups and the condition of the newborn pups was assessed. The following day was designated PND 1. Age at eye-opening was tracked from PND 12 and all pups were weaned on PND 21. In a separate study pregnant mice were given PFOS as described above. Pups of both genders were sacrificed within 2-4 hours of birth and on PNDs 3, 7, 14, 21, 28 and 35, and liver and blood samples were taken for weight and thyroid hormone analysis, respectively.
Prenatal PFOS exposure reduced the postnatal survival of mice in a dose-dependent manner. Most offspring from dams administered 15 or 20 mg/kg bw/day did not survive for 24 hours after birth, while 50% mortality was seen at 10 mg/kg bw/day. Survival of pups from the 1 and 5 mg/kg bw/day dams was similar to controls. Relative liver weights were significantly increased compared to controls in a dose-dependent manner at doses ≥ 5 mg/kg bw/day. No significant effects of PFOS treatment on serum T4 levels were found. A significant delay in eye-opening was detected in PFOS exposed offspring (PND 14.8 ± 0.1 in controls versus 15.1 ± 0.1, 15.5 ± 0.1 and 15.6 ± 0.1 at 1, 5 and 10 mg/kg bw/day respectively). Lau et al. do not specify at which doses the delay was statistically significant, but the US EPA (2016) reported that the delay was significant at ≥ 5 mg/kg bw/day.
The NOAEL for offspring toxicity is 1 mg/kg bw/day, based on increased liver weights and delays in eye-opening at 5 mg/kg bw/day. The maternal serum PFOS concentration at this dose, measured on GD 18, was 9 µg/mL.
Serum PFOS concentrations in the mouse dams were only presented in graphical form in the published study paper. However, numerical values were reported in Lau et al. (2007) and are presented in Table 10.
Table 10: Maternal serum PFOS concentrations measured by Lau et al. 2003 and Thibodeaux et al. (2003)
Serum levels of PFOS (µg/mL) in pregnant CD-1 mouse Dams after oral gavage administration from GD 1 to GD 17
Day
Oral K+PFOS concentration (mg/kg bw/day)
1 5 10 15 20
GD 18 – TerminationDams1 9 50 179 241 261
GD Gestation Day; Sample size and standard deviation data not available; No control values provided1 Taken from Lau et al. 2007
Rats
Thibodeaux et al. 2003 and Lau et al. 2003
PFOS potassium salt was administered by oral gavage to groups of 9-16 pregnant Sprague Dawley rats on GD 2 to 20 (Thibodeaux et al. 2003). The doses were 0, 1, 2, 3, 5 and 10 mg/kg bw/day. Maternal body weights and food consumption were monitored, and blood samples were obtained on GDs 7 and 14 as well as at termination for PFOS and serum chemistry analysis. Rats were euthanised on GD 21, the gravid uterus was removed and individual live fetuses weighed and prepared for teratological evaluation. PFOS levels were determined in the maternal and fetal livers. An additional group of adult female non-pregnant rats (6-8 per group) were given PFOS at 0, 3 or 5 mg/kg bw/day for 20 days. Blood samples were taken at 3, 7 and 14 days after the start of PFOS exposure, and at termination.
PFOS significantly reduced maternal body weight gain at doses of 2 mg/kg bw/day and higher. Both the size and the time of onset of this effect was dose-dependent, with a
42
significant weight deficit first seen on GDs 12, 7, 5 and 3 with doses of 2, 3, 5 and 10 mg/kg bw/day, respectively. Significant reductions in daily food and water consumption were observed in rats administered 5 and 10 mg/kg bw/day.
Serum PFOS concentrations increased in proportion to dose, but the level in all groups fell towards the end of pregnancy. Maternal liver concentrations were approximately 4 times higher than serum levels at each dose, and fetal livers contained approximately half as much PFOS as their maternal counterparts. PFOS concentration data were only presented graphically, however, measured serum concentrations (timepoint not specified) were provided by the study authors to the US EPA.
Maternal liver weights were not affected in the treated rats: a significant increase in relative liver weight was seen in the high dose group, but this was most likely due to the marked body weight reduction in these animals. Significant reductions in serum cholesterol (77.5 ± 4.0 mg/dl versus 90.6 ± 5.2 mg/dl) and triglycerides (337 ± 44 versus 510 ± 44) were seen in the high dose group compared with controls. Significant reductions in serum total and free T4, and to a lesser extent T3, were seen in all treated rats compared with controls. However, no feedback effect on TSH was observed. In non-pregnant female rats, serum T4 and T3 levels were reduced by treatment with 3 and 5 mg/kg bw/day. TSH responses in non-pregnant rats were variable. At 3 mg/kg bw/day, TSH levels were increased after 7 days of PFOS treatment. This increase was maintained for a further week although it was no longer statistically different from controls, and no effect was seen after 20 days of treatment. In contrast, serum TSH levels were slightly reduced in the 5 mg/kg bw/day group after 3 and 7 days of treatment, but these changes were also absent after 20 days of treatment. Thyroid weights or histopathology were not assessed in this study.
The number of live fetuses and postimplantation loss were not adversely affected by PFOS treatment. A significant reduction in fetal weight was observed at 10 mg/kg bw/day. Significant increases in cleft palate, defective sternebrae, anasarca, enlargement of the right atrium, ventricular septal defects were observed. These effects were primarily seen at 10 mg/kg bw/day, although increased incidences of enlarged right atrium and ventricular septal defects were seen at 5 and 10 mg/kg bw/day, while an increased incidence of anasarca was seen at ≥ 3 mg/kg bw/day.
The maternal NOAEL for this study is 1 mg/kg bw/day based on findings of reduced maternal body weight gain at 2 mg/kg bw/day. Measured maternal serum concentrations provided to the US EPA by the study authors for these doses (timepoint not specified) are 19.69 µg/mL at the NOAEL and 44.33 µg/mL at the LOAEL. The NOAEL for embryo and fetal toxicity was 1 mg/kg bw/day based on an increased incidence of body weight effects, anasarca and cleft palate at higher doses.
A companion study to the Thibodeaux et al. (2003) study was conducted in order to assess the postnatal effects of in utero exposure to PFOS (Lau et al. 2003). Sprague Dawley rats were administered PFOS potassium salt by oral gavage at doses of 0, 1, 2, 3, 5 or 10 mg/kg bw/day on GDs 2 to 21. On GD 22, rats were monitored and time of parturition, number of live offspring and condition of the newborns were recorded. The following day was designated as PND 1. All pups were weaned on PND 21 and separated by gender, and developmental landmarks were monitored.
Additional groups of pregnant rats were treated with PFOS at 0, 1, 2, 3 or 5 mg/kg bw/day as described above. Four pups from each litter were sacrificed within 2 – 4 hours after birth and blood and liver samples were taken for PFOS and thyroid hormone analysis. The remaining pups were maintained in the study and one from each litter was sacrificed on PNDs 2, 5, 9, 15, 21, 28 and 35 and serum were collected for PFOS and thyroid hormone analysis, while brain tissue samples were prepared for assessment of choline acetyltransferase (ChAT)
43

activity. At weaning, one pup of each sex was taken from eight control litters and eight litters in the 3 mg/kg bw groups for a T-maze delayed alternation test.
At parturition all animals were born alive and pink in colour, and appeared to be active. However, neonates in the 10 mg/kg bw/day dose group became pale, inactive and moribund within 30 – 60 minutes and all died soon after. In the 5 mg/kg bw/day group, neonates also became moribund and over 95% of these animals did not survive the first day of neonatal life. Fetal mortality was around 50% at 3 mg/kg bw/day, and a significant increase in mortality was also observed at 2 mg/kg bw/day. A significant difference in mortality was not seen in pups from dams administered 1 mg/kg bw/day compared with controls.
Serum PFOS concentrations at birth increased with dose, but the relationship was not linear, especially at the highest dose (data were presented graphically). At PND 5, the serum PFOS level of all surviving treatment groups was lower than the level at birth. PFOS was also found in the liver of newborn rats, however, in contrast to the findings with the dams (Thibodeaux et al. 2003), liver PFOS levels were similar to those found in serum.
Pup body weights at birth were significantly lower than control at 2 mg/kg bw/day and above, and the effect persisted in surviving animals over several days (past weaning at 5 mg/kg bw/day). No difference in neonate liver weights were seen. A significant delay in eye-opening was seen at 2 mg/kg bw/day and higher, but no significant delays in onset of puberty were observed. Total T4 and free T4 serum concentrations were significantly decreased compared with controls at doses of 2 mg/kg bw/day and above. Total T4 levels appeared to have recovered by weaning but free T4 levels remained lower than controls. No significant changes in serum T3 or TSH were observed. ChAT activity, an enzyme sensitive to thyroid status, was reduced in the prefrontal cortex of neonatal rats in the 3 mg/kg bw/day dose group (the only group tested) compared with controls. ChAT activity in the hippocampus was not affected by treatment. T-maze testing of controls and the 3 mg/kg bw/day group pups did not find any difference in learning and memory.
Because of the high number of fetal deaths, a follow-up cross-fostering study was conducted using newborns from the 5 mg/kg bw/day PFOS dose group. Ten control and 10 PFOS exposed litters were subdivided evenly into four groups: (1) control pups remaining with their dams; (2) PFOS exposed pups remaining with their dams; (3) PFOS exposed pups transferred to control dams; and (4) control pups transferred to PFOS treated dams. Survival was monitored for three days. Cross-fostering of PFOS exposed pups to control nursing dams did not improve survival of the neonates. All control pups fostered by PFOS treated dams survived for the duration of the study.
Taking together the findings in the two studies, the NOAEL based on embryo and fetal toxicity is 1 mg/kg bw/day, with reduced pup survival, decreased body weight and a significant delay in eye-opening seen at 2 mg/kg bw/day.
Serum PFOS concentrations in the rat dams were only presented in graphical form in the published study paper. However, values were provided to the US EPA by the study authors and are presented in Table 11.
44

Table 11: Maternal serum PFOS concentrations measured by Lau et al. 2003 and Thibodeaux et al. (2003)
Serum levels of PFOS (µg/mL) in pregnant Sprague Dawley rat dams after oral gavage administration from GD 2 to GD 21
DayOra K+ PFOS concentration (mg/kg bw/day)
1 2 3 5 10GD 22 – TerminationDams1 19.69 44.33 70.62 79.39 189.4
GD Gestation Day; Sample size and standard deviation data not available; No control values providedGraphical data for GD 7 and 14 presented in Thibodeaux but no numerical values; therefore no values presented here – values for all treated groups increased from GD7 to 21, indicating the earliest point of steady-state would be GD 21 (can’t be confirmed as GD 21 was a terminal sample)1 Taken from US EPA PFOS Human Health Effects Support Document (US EPA 2016)
Rabbits
Case et al. 2001
Mated New Zealand White female rabbits (22/dose group) were administered PFOS by oral gavage at doses of 0, 0.1, 1.0, 2.5 and 3.75 mg/kg bw/day on GDs 7 – 20. These levels were selected based on the results of a preliminary dose range finding study. Clinical signs, body weight and feed consumption were monitored daily. On GD 29 the maternal animals were killed and gross necropsy was performed. The uteri of apparently non-pregnant females were examined for evidence of implantation sites. The number of corpora lutea in each ovary was recorded, as well as the number of live and dead fetuses and early and late resorptions. Fetuses were weighed and examined.
There were no treatment-related maternal deaths. Maternal body weight gains on GDs 7 – 21 were significantly lower than controls at doses ≥ 1.0 mg/kg bw/day. Reduced feed consumption was seen in the maternal animals administered 2.5 and 3.75 mg/kg bw/day.
Abortions occured in one doe administered PFOS at 2.5 mg/kg bw/day (GD 25) and 10 does administered 3.75 mg/kg bw/day between GDs 22 and 28. Significantly reduced fetal weights were seen at 2.5 and 3.75 mg/kg bw/day, as well as some reversible delays in ossification of the sternebrae, hyoid, metacarpal and pubic bones. These delays are considered to be a consequence of the reduced fetal body weights at these doses and are not considered to be teratogenic changes. No other compound related fetal alterations were found.
The maternal NOAEL in this study was 0.1 mg/kg bw/day based on reduced body weight gain at the LOAEL of 1.0 mg/kg bw/day. The NOAEL for embryo and fetal toxicity was 1 mg/kg bw/day based on reduced fetal body weights and abortions seen at the LOAEL of 2.5 mg/kg bw/day.
Special reproductive and developmental toxicity studies
Developmental neurotoxicity
Butenhoff et al. 2009/Chang et al. 2009
Mated female Sprague Dawley (Crl:CD (SD)) rats (25 per group) were administered PFOS potassium salt at 0, 0.1, 0.3 and 1.0 mg/kg bw/day by oral gavage. An additional 10 mated females per group were assigned as satellites used to collect blood and tissue samples for evaluation of pharmacokinetic, thyroid hormone and morphology and hepatic gene expression endpoints on GD 20. Animals in the main study phase were dosed from GD 0 to PND 20, while rats used in the satellite study were dosed from GD 0 to GD 19. All satellite
45

dams and their fetuses, and main study phase dams, were euthanised on GD 20 and PND 21, respectively.
All maternal rats were monitored twice daily for moribundity and mortality and main study rats were monitored daily for signs of toxicity approximately 1 hour after dosing. Each litter was observed daily for survival and changes in appearance or behaviour, including nursing habit, until termination on PND 72. Pups were randomly selected and assigned to one of two subsets. Subset A consisted of 20 pups/sex/group (1 rat/sex/litter from 20 litters/group) and these animals underwent a functional observation battery (FOB), acoustic startle response, locomotor activity and learning and memory. Subset B consisted of 15 pups/sex/group (1 rat/sex/litter from 15 litters/group); these animals were used for brain weight evaluations on PND 21. Rats not included in either subset were necropsied on PND 21.
Maternal rats administered 1.0 mg/kg bw/day had statistically significant lower body weights than controls on PND 21 (365 ± 23 g in controls versus 351 ± 17 g at 100 mg/kg bw/day). However, the effect was slight and there were no significant effects on maternal body weight gain from GD 0 – 20 or from PND 1 to PND 21. Dams in the high dose group also had transiently lower food consumption during GD 6 – 12 resulting in a significantly lower absolute food consumption value at this dose for the entire gestation period compared with controls (25 ± 2 g/rat/day in controls versus 23 ± 1 g/rat/day at 1.0 mg/kg bw/day). Again the effect was marginal and both these findings are not considered to be adverse.
No treatment-related effects were observed on pregnancy rates, implantation sites, number of pups born, birth weight, sex ratio and postnatal survival. Mean ages at vaginal patency and balanopreputial separation were also unaffected by treatment with PFOS.
No PFOS-related effects were observed for male or female rats during FOB assessments on PND 4, 11, 21, 35, 45 and 60. Although a significant decrease in hindlimb grip strength was noted in the 1.0 mg/kg bw/day maternal dose group males (66.7 g) when compared to the control group (79.8 g) on PND 21, the mean value in the 1.0 mg/kg bw/day group was within the mean value for the laboratory’s historical control data, which was 70 ± 26 g. Therefore this finding was not attributed to maternal PFOS exposure.
Assessments of locomotor activity generally found no effect of PFOS exposure, however, males in the 1.0 mg/kg bw/day dose group had a statistically significant increased locomotor activity accompanied by slightly increased ambulatory activity on PND 17, but not on PNDs 13, 21 and 61. The increased locomotor activity in males in this dose group was accompanied by a lack of habituation to the test environment and was therefore considered by the study authors to be treatment-related. A statistically significant increase in total and accumulative activity was also noted in males in the 0.3 mg/kg bw/day dose group on PND 17 and in females in the 1.0 mg/kg bw/day group on PND 21. The increased activity in these groups was not accompanied by an effect on habituation and these findings were not considered to be treatment-related.
No effects on auditory startle responsiveness or performance in Biel maze swimming learning and memory trials were observed. Mean absolute and relative brain weights, brain length and width were similar in control and treated animals. No gross findings related to treatment were observed in the brain or spinal cord.
The NOAEL for maternal toxicity and developmental neurotoxicity was 1.0 mg/kg bw/day, the highest dose tested. Although increased motor activity and failure to habituate was seen in male rats at 1.0 mg/kg bw/day on PND 17, this finding was not observed in this group at three other time points before and after PND 17 and therefore is not considered to be clearly treatment-related. Mean serum PFOS concentrations on GD 20 at the NOAEL were 26.6 and 31.5 µg/mL in dams and fetuses, respectively.
46

In a companion study, concentrations of PFOS in samples of serum, liver and brain taken during the developmental neurotoxicity study were assessed (Chang et al. 2009). Assessments of thyroid hormone status and hepatic expression of genes associated with liver hypertrophic modes of action, thyroid hormone and cholesterol metabolism and liver cell proliferation were also conducted.
PFOS concentrations in maternal rat serum, liver and brain from GD 20 through to PND 21 correlated well with the administered doses. Maternal liver-to-serum PFOS concentration ratios ranged from 1.8 to 4.9, while the corresponding maternal brain-to-serum ratios ranged from 0.04 to 0.09. PFOS concentrations in fetal and pup serum, liver and brain from GD 20 to PND 72 also correlated well with the daily litter matched maternal doses. Mean fetal serum PFOS concentrations were higher than those of dams on GD 20. As with maternal rats, liver PFOS concentrations were higher than the respective serum PFOS concentrations, and brain PFOS concentrations were lower than time-matched serum concentrations. No sex difference in serum, liver or brain PFOS concentrations was apparent in offspring up to PND 21. On PND 72, however, female offspring had higher serum PFOS concentrations than males in the same treatment groups. Liver PFOS concentrations remained comparable between male and female offspring on PND 72. Serum PFOS concentrations are shown in Table 12.
Mean serum TSH levels of PFOS treated maternal rats and offspring were not significantly different from controls. Histopathological evaluation of thyroids taken from the high dose group on GD 20 and PNDs 4 and 21 found no treatment-related changes, including no effect on the number of follicles present and the distribution of follicle sizes. Morphometric assessment of mean thyroid follicular colloid area found no treatment-related alterations in the high dose group on PND 4 and PND 21. Follicular epithelial cell height was similar in all groups on PND 4. Mean thyroid follicular epithelial cell height from high dose males on PND 21 was significantly higher than controls, but this was suspected to be unrelated to treatment due to an unusually low value in the male control group compared to female controls and the laboratory’s historical control values (historical data not provided in the study report). No significant differences in thyroid follicular epithelial cell proliferation were seen between controls and high dose males in thyroids taken on GD 20. The mean number of proliferating thyroid follicular cells from female fetal thyroids from the high dose group was 2.1-fold higher than the control group and was statistically significant. However, the toxicological significance of this finding is unclear as the range of values in female control thyroids was quite wide compared to the high dose females, and the highest individual counts were similar in both groups (4 – 113 in controls, 64 – 116 in high dose females).
Table 12: Serum PFOS concentrations measured in dams, fetuses and pups from the study by Butenhoff et al. (2009)
Serum levels of PFOS (µg/mL) for pregnant Sprague Dawley rat dams/fetuses/pups after oral gavage administration during the period GD 0 to PND 20
Oral K+PFOS concentrations (mg/kg bw/day)
0 0.1 0.3 1.0DamsGD 201 <LOQ 1.722± 0.068 6.245 ± 0.901 26.630 ± 3.943PND 4 0.008± 0.000 3.307 ± 0.080 10.449 ± 0.234 34.320 ± 31.154PND 21 0.007± 0.000 3.159 ± 0.081 8.981 ± 0.275 30.480 ± 1.294FetusesGD 202 0.009± 0.001 3.906 ± 0.096 10.446 ± 0.291 31.463 ± 1.032PupsPND 42 <LOQ 2.236 ± 0.070 6.960 ± 0.163 22.440 ± 0.723
47

Serum levels of PFOS (µg/mL) for pregnant Sprague Dawley rat dams/fetuses/pups after oral gavage administration during the period GD 0 to PND 20
Oral K+PFOS concentrations (mg/kg bw/day)
0 0.1 0.3 1.0M pup F pup M pup F pup M pup F pup M pup F pup
PND 21 <LOQ <LOQ 1.729 ± 0.079
1.771 ± 0.076
5.048 ± 0.108
5.246 ± 0.138
18.611 ± 1.011
18.010 ± 0.744
PND 72 <LOQ <LOQ 0.042 ± 0.004
0.207± 0.042
0.120 ± 0.009
0.556± 0.062
0.560 ± 0.105
1.993 ± 0.293
Blood sampling method not providedGD Gestation DayPND Postnatal DayM maleF Female1 Dosed from GD 0 to PND 19 and sampled (terminal) at GD 202 Samples pooled by litterData presented as mean ± standard deviationSample size not provided in original paper table.Values taken from Chang et al. 2009 (companion paper to Butenhoff et al. 2009)
Compared with controls, hepatic Cyp2b2 mRNA levels were increased (2.8-fold) in the dams administered 1 mg/kg bw/day on GD 20 and in their male pups on PND 21 (1.8-fold). Increased expression of Cyp4a1 and acyl CoA (ACoA) (2.1-fold and 1.5-fold respectively) and decreased Cyp7a1 (3.5-fold) was also seen in male pups in the high dose group on PND 21.These findings were taken to suggest induction of hepatic CAR as well as PPARα. Transcripts with a potential relationship to thyroid status were unaffected in dams and offspring following maternal treatment with PFOS.
Special toxicity studies
Immunotoxicity
The US EPA considered a number of immunotoxicity studies with PFOS when considering the appropriate endpoints to be used in establishing a RfD. It was noted that three of four studies in experimental animals found immune effects at the same dose that caused increased liver weights. Effects at a very low dose were found in a 28 day study in mice (Peden-Adams et al. 2008) but these findings are not supported by a higher LOAEL and NOAEL in another study in which mice were exposed to PFOS for 60 days (Dong et al. 2009). The US EPA concluded that the lack of low dose confirmation of effects in animals for the short duration study precludes the use of these immunotoxicity data in setting the RfD. The Swedish EPA established a DNEL for immunotoxicity based on the NOAEL from the study by Peden-Adams et al. 2008. The studies by Peden-Adams et al. and Dong et al. are summarised below, and a more extensive review of the literature regarding potential immunomodulating effects of PFOS can be found in Drew and Hagan (2016). This review also concluded that there are marked differences between studies with respect to the exposures necessary to cause such effects, and the quantitative aspects of pivotal studies have not been confirmed in independent investigations. As such, it was considered inappropriate for potential modulation of the immune system by PFOS to be quantitatively incorporated into human health risk assessments for PFOS exposure at this time.
48

Peden-Adams et al. 2008
Adult B6C3F1 mice (5/sex/group) were administered PFOS by oral gavage doses of 0.0, 0.000166, 0.00166, 0.0033, 0.0166, 0.033 and 0.166 mg/kg bw/day daily for 28 days (Peden-Adams et al. 2008). Five days prior to euthanasia, mice were immunised with a 25% Sheep Red Blood Cell (SRBC) suspension via intraperitoneal injection. Serum samples were collected at the end of the study for analysis of lysozyme activity and PFOS concentrations. Spleen, thymus, liver, kidney, uterus and testis were collected and weighed following euthanasia, and spleen and thymus samples were processed into single cell suspensions for T cell immunophenotype determinations and assessment of functional immune endpoints.
No mortality or clinical signs of toxicity were observed in any of the test animals. Body weight, as well as spleen, thymus, liver, kidney, uterus and testis weights were not affected by treatment. Cellularity and cell viability of the spleen and thymus were also not altered by PFOS treatment compared with controls.
No differences in lymphocyte proliferation responses to T- and B-lymphocyte mitogens were seen in treated animals compared with controls. Natural Killer (NK) cell activity was not affected in females, but was increased 2- to 2.5-fold in males at 0.0166, 0.033 and 0.166 mg/kg bw/day compared with controls. Plasma lysozyme activity was not affected by PFOS exposure in male mice. In females, activity was increased over controls at 0.0033 and 0.166 mg/kg bw/day with statistical significance, but a dose-response was not observed. Thymic T cell immunophenotypes were not affected by PFOS exposure in males, while in females minimal but statistically significant increases in numbers of thymic CD4+/CD8- cells were observed at 0.033 and 0.166 mg/kg bw/day. Splenic T cell immunophenotypes were significantly modulated in males at doses of ≥ 0.033 mg/kg bw/day, while in females slight alterations were observed at some doses, but without a clear dose-response.
SRBC-specific immunoglobulin M (IgM) production, measured by antibody plaque forming cell (PFC) assay rather than direct IgM measurement, was suppressed in a dose-dependent manner in both sexes following PFOS exposure, with males being more sensitive than females. A significant suppression of the SRBC PFC response was seen at doses ≥ 0.00166 mg/kg bw/day in males and at doses ≥ 0.0166 mg/kg bw/day in females. In males the response was decreased by 52 – 78% compared with controls, and in females by 50 – 74%. Because suppression of IgM production by a T cell antigen such as SRBC can be mediated by effects on T- or B-cells, a further study involving challenge with a T-independent antigen, trinitrophenyl (TNP) lipopolysaccharide (LPS) conjugate was conducted in female mice exposed to 0.0 or 0.334 mg/kg bw/day for 21 days. TNP-LPS was administered via intravenous injection seven days prior to euthanasia. Serum levels of TNP-specific IgM were significantly lower (62% decrease) in PFOS exposed mice than controls. These findings suggest that the humoral immune effects of PFOS may be attributed to B-cells rather than T-cells.
The NOAEL in this study was 0.000166 mg/kg bw/day in males, based on suppression of SRBC-specific PFC response at the LOAEL of 0.00166 mg/kg bw/day. In females, the NOAEL was 0.0033 mg/kg bw/day based on reduced PFC response at the LOAEL of 0.0166 mg/kg bw/day. Serum PFOS concentrations at the NOAEL and LOAEL in males were 17.8 ± 4.24 and 91.5 ± 22.2 ng/g, respectively. In females, serum PFOS concentrations at the NOAEL and LOAEL were 123 ± 18.7 and 666 ± 108 ng/g, respectively.
Serum PFOS concentrations measured in this study are shown in
49

Table 13: Serum PFOS concentrations measured by Peden-Adams et al. (2008)
Serum levels of PFOS (ng/mL) in B6C3F1 mice after oral gavage for 28 daysOral PFOS ion concentration (mg/kg bw/day)1
0 0.000166 0.00166 0.00331 0.0166 0.0331 0.166Oral PFOS ion concentration (mg/kg TAD2)
0 0.00464 0.0464 0.0927 0.464 0.927 4.64Day 29 – TerminationMale 12.1±4.64 (5) 17.8±4.24 (5) 91.5±22.1 (4) 131±15.2 (5) ND ND NRFemale 16.8±4.31 (5) ND 88.1±10.5 (5) 123±18.7 (5) 666±108 (5) ND NR
Data compiled from Peden-Adams et al. 2008Data presented as mean ± standard deviation (sample size)1 (Actual total administered dose (TAD) using mass of PFOS ion only/28 days) x10002Targeted TAD over 28 days. Dose concentrations were made by weighing the potassium salt of PFOS and therefore include the salt mass. Target dose is based on the PFOS ion after taking into account the mass of the potassium salt (molecular weight of PFOS ion = 499.12 g/mL); when rounded to a single significant digit the potassium salt or PFOS ion are identical e.g. 0.00464 PFOS ion (mg/kg TAD) = 0.005 PFOS salt (mg/kg TAD).If the potassium salt molecular weight is not removed the PFOS concentration is overestimated by 7% (according to the paper).ND not determinedNR not reported (over calibration curve)
Dong et al. 2009
Adult male C57BL mice (10 per group) were administered PFOS potassium salt with 2% Tween 80 in deionised water by oral gavage for 60 days. The doses were 0, 0.008, 0.083, 0.417, 0.833 and 2.083 mg/kg bw/day. Food intake and body weight were measured daily. Four days prior to the end of the study, mice were immunised with a 25% suspension of SRBC administered by intraperitoneal injection. Blood was taken from mice on the sixty-first day (24 hours after the last treatment) and analysed for PFOS and corticosterone levels. The mice were subsequently sacrificed and spleen, thymus, liver and kidneys were collected and weighed. The spleen and thymus were processed into cell suspensions for use in assessments of functional immune endpoints and T cell immunophenotype determinations.
At the end of the study, mice treated with ≥ 0.417 mg/kg bw/day had significantly lower body weights compared with controls, as well as significantly decreased spleen, thymus and kidney weights relative to body weight. Reduced cellularity in the spleen and thymus was also observed at these doses. Relative liver weights were significantly increased at doses ≥ 0.083 mg/kg bw/day. Serum cortisone levels were significantly increased compared with controls at 0.833 and 2.083 mg/kg bw/day. Flow cytometry analysis of splenic and thymic lymphocytes indicated that the numbers of T cell CD4/CD8 subpopulations were significantly decreased at doses of 0.417 mg/kg bw/day and higher, and the number of splenic B-cells were decreased at ≥ 0.833 mg/kg bw/day. NK cell function was significantly increased compared with controls at 0.083 mg/kg bw/day but unchanged at 0.417 mg/kg bw/day and significantly decreased at 0.833 and 2.083 mg/kg bw/day. Splenic lymphocyte production in response to the T cell mitogen concavalin A was significantly reduced at the high dose, while lymphocyte production in response to the B cell mitogen lipopolysaccharide was significantly reduced at the two highest doses. The SRBC-specific IgM PFC response was significantly decreased in a dose-dependent manner at 0.083 mg/kg bw/day and higher.
The NOAEL in this study was 0.008 mg/kg bw/day based on the reduced SRBC-specific PFC response at 0.083 mg/kg bw/day. Serum PFOS concentrations at the NOAEL and the LOAEL were 0.674 mg/l and 7.132 mg/l, respectively. It is notable that the NOAEL and LOAEL for SRBC PFC response in this study are substantially higher than the NOAEL and LOAEL reported for the same effects in male mice in the 28-day study by Peden-Adams et al. (2008) discussed above.
50

Serum PFOS concentrations in this study are presented in Table 14.
Table 14: Serum PFOS concentrations measured by Dong et al. (2009)Serum Levels of PFOS (µg/mL) in male C57BL/6 mice after oral gavage administration for 60 daysOral K+ PFOS concentration (mg/kg bw/day)
0 0.008 0.083 0.417 0.833 2.083Oral K+PFOS concentration (mg/kg TAD)
0 0.5 5 25 50 125Day 60 – Termination
Male 48±14 (10) 674±166 (10) 7132±1039 (10)
21,638±4410 (10)
65 426±11,726 (10)
120,670±21759 (10)
Blood samples were taken via the orbital sinus route.Data presented as mean ± standard deviation (sample size)Data compiled from Dong et al. 2009TAD Targeted total administered dose
Neurotoxicity
Long et al. 2013
In a study to assess the neurotoxicity of PFOS, adult C57BL6 mice (8 weeks old; 15 per group; number of each sex not stated) were administered doses of 0, 0.43, 2.15 and 10.75 mg/kg bw/day by gavage for three months (Long et al. 2013). Spatial learning and memory were assessed in the Morris water maze. Apoptosis was assessed in hippocampal cells as well as levels of glutamate, gamma-aminobutyric acid (GABA), dopamine, 3,4-dihydrophenylacetic acid (DOPAC), and homovanillic acid (HVA). Differential expression of proteins in the hippocampus was also assessed using two-dimensional fluorescence difference in gel electrophoresis (2D-DIGE) and western blotting analysis. Serum levels of PFOS were not measured in this study.
In the water maze trial, animals administered 2.15 and 10.75 mg/kg bw/day had a significantly decreased escape latency compared with controls, and spent a significantly reduced period of time in the target quadrant. A significant increase in the percentage of apoptotic cells in the hippocampus was found in the mid and high dose animals compared with controls (7.45 ± 2.0 % in controls, 9.2 ± 2.51% at 0.43 mg/kg bw, 20.70 ± 3.56% at 2.15 mg/kg bw and 33.49 ± 5.77 at 10.75 mg/kg bw). A significant increase in the expression of caspase 3 protein was seen at 2.15 and 10.75 mg/kg bw/day compared with controls, along with reduced expressions of Bcl-2 and survivin. Levels of the neurotransmitters dopamine and DOPAC were significantly reduced in the caudate putamen of animals administered 10.75 mg/kg bw/day, and glutamate levels were significantly increased in the hippocampus at this dose. GABA and HVA levels were not affected by treatment with PFOS. A number of hippocampal proteins were found to be differentially expressed in the high dose group compared with controls, but the significance of these findings in relation to the effects on learning and memory are not clear. The NOAEL in this study was 0.43 mg/kg bw/day.
2.3.4 Human data
Epidemiological studies on PFAS have included occupational cohorts mainly exposed at the source of the contamination, communities exposed to high levels of PFAS through environmental media (air, soil or water) and general populations exposed to background levels of PFAS. Study populations have included occupationally exposed workers at 3M manufacturing facilities in Decatur, Alabama and Antwerp, Belgium; communities with high exposure due to contamination of drinking water by leakages from a production plant in the US; and general populations in a range of geographical locations including North America,
51

the UK and Scandinavian countries.
Blood levels of PFASs of occupationally exposed workers are 2 to 3 orders of magnitude (100 – 1000 fold) higher than those of the general population, with levels in highly exposed subpopulations intermediate between the two. Mean serum PFOS concentrations in the general population of the US are 0.015 – 0.056 µg/mL (ATSDR 2015).
The available studies have been considered in assessments conducted by a number of regulatory agencies or bodies including EFSA, US EPA and ATSDR, however, no agency has considered the available data in humans suitable as a basis to establish a HBGV for PFOS. The major conclusions from the EFSA (2008), US EPA (2016) and ATSDR (2015) assessments are briefly summarised below. A detailed consideration of individual epidemiological studies is beyond the scope of this review.
Serum lipids
Associations between PFOS exposure and altered serum lipid levels have been identified in some studies with workers, highly exposed residents and the general population.
The most consistently found change in exposed human populations was increased total cholesterol levels (reviewed by ATSDR 2015 and US EPA 2016). Two studies found an association between high cholesterol levels (defined as cholesterol > 240 mg/dL) and PFOS exposure (US EPA 2016), while a study of highly exposed residents in which measurements were made twice with an interval of around 4 years found decreases in serum LDL cholesterol and total cholesterol over time, that were associated with decreases in serum PFOS levels.
EFSA (2008) and ATSDR (2015) observed that the changes in cholesterol seen in epidemiological studies are in the opposite direction to those observed in animal studies, and that mechanisms by which PFOS may increase serum cholesterol have not been identified. It should also be noted that the exposures in animal studies are likely to have been much higher than those in epidemiological studies.
The US EPA and ATSDR noted that the evidence for associations between PFOS and serum lipids other than total cholesterol is not as strong.
FSANZ reviewed the available epidemiological data relating to PFOS and PFOA exposure and serum cholesterol (Appendix 2). A number of studies that were not referred to in the EFSA and US EPA reviews were identified and included in the analysis. The FSANZ review noted that overall the cross-sectional studies show a fairly consistent finding of a positive association between total and LDL cholesterol and low serum concentrations of PFOS, with the association plateauing at higher PFOS levels. At around 40 ng/mL serum PFOS concentration, total cholesterol was around 0.3 mmol/L higher than the lowest PFOS exposure groups. The lack of association in some occupational groups might be explained because there were not enough low concentrations in the study group to detect the effect at low PFOS concentrations.
The FSANZ review observed that a number of studies note a correlation between concentrations of PFOS and PFOA but do not adjust the results for each other. Similarly, populations with high exposure to PFAS may also be exposed to other contaminants but these have not been considered in most studies. Another limitation is that most studies do not adjust for diet. In addition, kidney function does not seem to have been examined together with cholesterol concentrations. This may be important as PFAS concentrations increase as glomerular filtration rate (GFR) decreases, and it is also known that there is an inverse correlation between serum LDL cholesterol and GFR (Morita et al. 2010).
52

Liver
The liver is a target organ in studies in rodents and monkeys with changes including increased liver weight, hypertrophy, changes in enzyme activity and on occasion changes in serum levels of liver enzymes.
Associations between PFOS exposure and serum liver enzymes (mainly ALT, AST and γ-glutamyl transpeptidase [GGT]) were not consistently found in occupational exposure studies (reviewed by ATSDR 2015).
In a study of workers at the Decatur and Antwerp manufacturing plants, mean values of total bilirubin and ALT were significantly higher in male employees with PFOS levels in the highest quartile (reviewed by EFSA 2008). A study of highly exposed residents, and another of the US general population, found slight positive associations between serum PFOS levels and increased serum ALT values (reviewed by US EPA 2016). Overall levels of GGT and bilirubin did not appear to be affected in epidemiological studies (reviewed by US EPA 2016).
The ATSDR concluded that although some associations were found, the magnitude of the increases in serum enzymes were not great and probably not biologically significant.
Kidney
Kidney function, assessed by levels of BUN and serum creatinine, was not associated with exposure to PFOS and/or PFOA in occupational exposure studies (reviewed by ATSDR 2015). A study in the general population of the USA found a positive association between increasing PFOS (and PFOA) levels and chronic kidney disease, defined as a GFR of <60 mL/minute/1.73 m2. A study of highly exposed residents also found a significant negative association between serum PFOS (and other PFAS) and GFR (reviewed by ATSDR 2015 and US EPA 2016). Associations between serum PFOS and increased uric acid levels have also been observed in highly exposed individuals and the general population.
The US EPA concluded that these studies suggest an association between PFOS and chronic kidney disease, as defined by estimated GFR. However, it was also noted that reverse causality could not be excluded: a low GFR would reduce the removal of PFOS from the serum for excretion by the kidney, leading to increased serum PFOS levels.
The ATSDR noted that increased uric acid levels can also be a risk factor for hypertension, and that a study of highly exposed residents found associations between serum PFOS and PFOA levels and the odds of pregnancy induced hypertension.
Fertility, pregnancy and birth outcomes
EFSA (2008) noted contradictory findings regarding associations between PFOS exposure and birth weight and gestational age, and concluded that the limited data available did not indicate a risk of reduced birth weight or gestational age.
Although three studies were null, birth weight deficits ranging from 29 – 149 grams were detected in five studies (reviewed by US EPA 2016). The significant associations were found in studies of the general population as well as highly exposed residents. Although significant associations have been found, the decreases in birth weight were small and may not be biologically relevant (reviewed by ATSDR 2015).
FSANZ has reviewed the available epidemiological information regarding PFOS and PFOA and birthweight (Appendix 1). FSANZ notes that the blood concentrations in the human studies is about 1000-fold lower than that found in animal studies showing an effect on
53
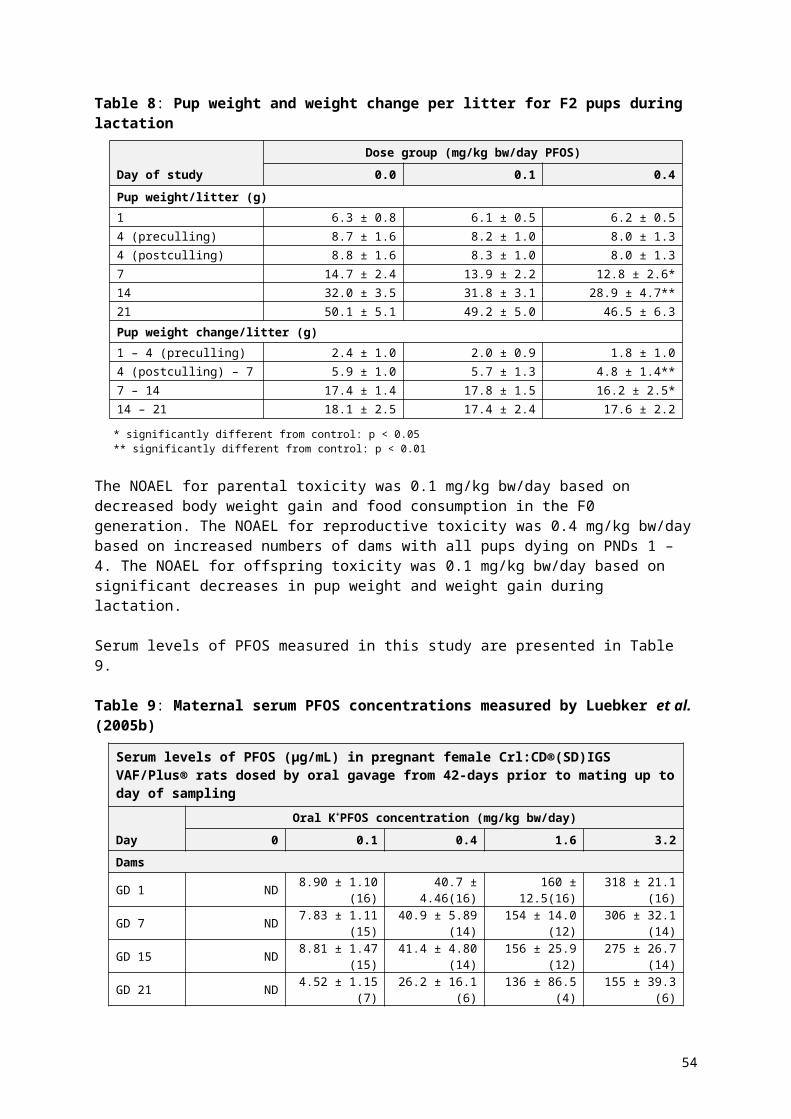
birthweight. Overall the studies with numerical data report an association, but missing quantitative data from studies reporting no effect raises the possibility of selective reporting or publication bias affecting the body of evidence. It is not possible to determine whether the association reflects a causal relationship or is the result of a third factor that alters both PFAS concentration and birthweight. For example, changes in GFR that occur during pregnancy would be expected to affect both birthweight and the rate of excretion of PFAS. This may require further investigation. It is also not possible to determine whether the association between PFAS and birthweight may have been overstated due to selective reporting or publication.
A small set of studies reported associations with gestational diabetes, pre-eclampsia and pregnancy induced hypertension. These outcomes were also associated with increased serum PFOA levels (reviewed by US EPA 2016).
A small number of studies found associations between PFOS exposure and semen quality parameters, however, most studies were null (reviewed by US EPA 2016).
Some studies have observed increased odds for infertility or reduced fecundity in women with higher levels of PFOS, while another study found no association between time to pregnancy and serum PFOS levels (reviewed by US EPA 2016 and ATSDR 2015).
Thyroid
Increased levels of T3 have been observed in PFOS exposed workers, which is the opposite direction to findings in rodents and monkeys (reviewed by EFSA 2008).
The US EPA noted that the epidemiological studies provide limited support for an association between PFOS exposure and thyroid disease, but not thyroid hormone status. However, associations between PFOS exposure and TSH (increased) and T4 (reduced) levels have been found in people at risk for thyroid insufficiency (i.e. people with low iodide status and positive antithyroperoxidase antibodies; reviewed by US EPA 2016).
The ATSDR (2015) concluded that based on the results of studies of adolescents, adults, and pregnant women, exposure to serum PFASs does not appear to result in thyroid toxicity.
Immune function
Limited information is available on the immunotoxicity of perfluoroalkyl compounds in humans (reviewed by ATSDR 2015).
Two studies have reported decreased responses to vaccines in children associated with increasing prenatal serum PFOS levels or levels at 5 years of age. Decreased rubella and mumps antibody concentrations in relation to serum PFOS levels have been found in a study of 12 – 19 year olds in the US general population. In contrast, a study in adults found no association between PFOS levels and antibody response to the influenza vaccine. In the three studies with children, the findings were also correlated with other PFAS, limiting the ability to make conclusions specific to PFOS (reviewed by US EPA 2016).
Higher odds ratios for asthma with increasing serum PFOS concentrations were seen in a study of children in Taiwan, while a study in the USA found no association between serum PFOS and risk of ever having had asthma (reviewed by US EPA 2016).
The US NTP recently published a draft systematic review of immunotoxicity associated with exposure to PFOS or PFOA (NTP 2016). This review concluded that exposure to PFOS should be presumed to be an immune hazard to humans based on a high level of evidence
54

that PFOS suppressed the antibody response from animal studies, and a moderate level of evidence from studies in humans.
FSANZ commissioned a review of the potential of PFASs to modulate the immune system (Drew and Hagen 2016). The review noted that that there are both positive and negative epidemiology studies on associations between serum PFOS concentrations and compromised antibody production. The report concluded that while PFOS may present an immune hazard to humans, the epidemiology data available do not provide compelling evidence for increased incidence of disease associated with PFOS effects on immune function. A number of limitations with the available data were noted. These included comparisons of ‘low’ and ‘high’ exposure groups where the differences are over a very low and narrow serum concentration range (0.002 – 0.05 mg/L), and potential co-exposures to other environmental chemicals that are known to have immunomodulating effects. It was noted that many of the associations are weak and the effects are small and of questionable clinical significance.
Carcinogencity
None of the agencies considered that epidemiological studies provided convincing evidence of a correlation between PFOS and any cancer type.
The US EPA (2016) noted that human epidemiology studies did not find a correlation between PFOS exposure and cancer incidence in occupational populations, and general population studies found no statistically significant trends for any cancer type.
2.4 Discussion and conclusions PFOS
Epidemiology studies on PFAS have included occupational cohorts mainly exposed at the source of the contamination, communities exposed to high levels of PFAS through environmental media (air, soil or water) and general populations exposed to background levels of PFAS. Associations between PFOS exposure and several health effects have been reported in a number of epidemiological studies, although a number of findings are inconsistent between studies and the biological significance of some of the observed effects is questionable. EFSA and ATSDR concluded that it is not possible to identify any causal associations based on limitations in study design and/or inconsistencies in study results. However, the US EPA concluded that associations that appear to be reasonably consistent and repeatable are those with increased serum cholesterol and decreased body weights in offspring.
FSANZ has reviewed the available epidemiological information regarding PFOS and PFOA and birthweight. It is noted that the blood concentrations in the human studies is orders of magnitude lower than that found in animal studies showing an effect on birthweight. Overall the studies with numerical data report an association, but missing quantitative data from studies reporting no effect raises the possibility of selective reporting or publication bias affecting the body of evidence. FSANZ has concluded that it is currently not possible to determine whether the association reflects a causal relationship or is the result of a third factor that alters both PFAS concentration and birthweight. For example, changes in GFR that occur during pregnancy would be expected to affect both birthweight and the rate of excretion of PFAS. This may require further investigation.
FSANZ reviewed the available epidemiological data relating to PFOS and PFOA exposure and serum cholesterol. A number of studies that were not referred to in the EFSA and US EPA reviews were identified and included in the analysis. The FSANZ review noted that overall the cross-sectional studies show a fairly consistent finding of a positive association between total and LDL cholesterol at low serum concentrations of PFOS, with the
55

association plateauing at higher PFOS levels. However, a number limitions were observed including that some studies note a correlation between concentrations of PFOS and PFOA but do not adjust the results for each other. Similarly, populations with high exposure to PFAS may also be exposed to other contaminants but these have not been considered in the studies, and most studies do not adjust for diet or consider the impact of GFR.
A recent draft systematic review of immunotoxicity associated with exposure to PFOA or PFOS by the US NTP 2016) concluded that PFOS is presumed to be an immune hazard to humans. This conclusion was based on a ‘high level of evidence’ that PFOS suppressed antibody responses in animal studies and a ‘moderate level of evidence’ from epidemiology studies that higher serum PFOS levels are associated with suppression of antibody response. The NTP report is focused on hazard identification and does not identify a level of exposure at which immune function in humans is likely to be compromised. A literature review commissioned by FSANZ concluded that the weight of evidence from the available animal studies indicates that PFOS can adversely modulate immune system responsiveness (Drew and Hagan 2016). However, there are significant uncertainties regarding species sensitivity, strain sensitivity and the influence of route of administration on immune system modulation by PFOS that have yet to be resolved. As a result, it is not possible to determine a reliable NOAEL or LOAEL for adverse effects on immune function for use in a quantitative risk assessment of PFOS at this time. Drew and Hagan (2016) concluded that the epidemiology data available do not provide compelling evidence for increased incidence of disease associated with PFOS effects on immune function.
Epidemiological studies have not provided convincing evidence of a correlation between PFOS and any cancer type.
In animal studies, PFOS is rapidly and virtually completely absorbed in laboratory animals. PFOS is highly bound to albumin in the circulation and the highest concentrations were generally found in liver, serum, lung and kidney of laboratory animals. There are no reports that PFOS is metabolised in vivo. PFOS was excreted primarily in the urine with lower amounts recovered in the faeces. Elimination half-life in rats is approximately 38 days in males and 62 days females. Elimination half-life is in the range of 110-132 days in cynomolgus monkeys and is estimated to be approximately 5.4 years in human beings.
Mechanisms of toxicity have not been fully elucidated but are likely to at least partly involve activation of PPARα. Activation of other nuclear receptors such as CAR and PXR has also been observed and PFOS administration has been found to induce the expression of a range of genes involved in lipid metabolism, fatty acid uptake and xenobiotic metabolism. The strong protein binding affinity of PFOS, for example to FABP in the liver, may also contribute to its toxicological profile.
PFOS was of moderate acute toxicity following oral ingestion. In repeat dose studies the primary target organ was the liver. Toxicological findings in the liver included increased liver weight associated with hepatocytic hypertrophy, and occasionally vacuolation and increased enzyme markers of liver toxicity in serum. In the absence of histopathological correlates, increased liver weight and hepatocytic hypertrophy are not considered adverse (Hall et al. 2012; WHO, 2015). Notably, a steep dose-response curve was observed in monkeys with no adverse effects observed in a 6-month study at 0.15 mg/kg bw/day and then mortality occurring at the next highest dose of 0.75 mg/kg bw/day. In contrast, no treatment-related effect on survival of adult rats was seen in subchronic and chronic toxicity studies. PFOS induced liver tumours in rats at high doses above which non-neoplastic effects were observed in liver. The weight of evidence from a range of genotoxicity studies suggests that this occurs through a non-genotoxic mechanism.
Fetal and neonatal toxicity was observed in reproductive and developmental studies at doses
56

which were similar to or below those producing maternal toxicity. Developmental effects ranged from reduced pup body weights and body weight gains at low doses to mortality at higher doses. Developmental delays such as delayed eye-opening were also observed in rats, and increased incidences of sternal defects were seen at high doses in mice. There was a steep dose-response in multigeneration studies in rats, with pup body weights being reduced at 0.4 mg/kg bw/day, reduced gestation length and indications of decreased pup viability at 0.8 mg/kg bw/day and significantly decreased viability at 1.6 mg/kg bw/day.
Regulatory agencies have calculated HBGVs using different approaches. Consequently, although the same animal studies were generally assessed by different agencies, the HBGVs vary substantially. The main reasons related to the use of PBPK modelling by the US EPA and ATSDR and the selection of uncertainty factors. FSANZ has commissioned a review of the validity and limitations of PBPK modelling for PFOS and PFOA, and has concluded that given the considerable interspecies differences in pharmacokinetics it is appropriate to correct for those using PBPK modelling (Roberts et al. 2016). The HBGV is therefore based on serum concentration as an index of internal dose.
2.5 Derivation of the TDI for PFOS
At present, the available epidemiology data are not suitable to support the derivation of a HBGV for PFOS. Therefore the TDI is based on the findings in toxicological studies in laboratory animals. Derivation of a HBGV for PFOS from the available toxicological studies is complicated by significant differences in toxicokinetics of PFOS between species. The half-life of PFOS in the mouse, rat and monkey is 37, 48 and 121 days respectively, whereas in humans the half-life is estimated to be between 4.1 and 8.67 years.
Given the significant differences in toxicokinetics an approach based on serum PFOS concentrations is considered to be the most appropriate means of establishing a HBGV.
PBPK modelling was applied to the pivotal toxicity studies for PFOS for which serum PFOS concentrations are available according to the supporting document A Critical Review of Pharmacokinetic Modelling of PFOS and PFOA to Assist in Establishing HGBVs for these Chemicals by Roberts et al. 2016. The studies included in the PBPK modelling are listed below:
subchronic toxicity study in nonhuman primates (Seacat et al. 2002) chronic toxicity and carcinogenicity study in rats (Butenhoff et al. 2012/Thomford 2002) developmental toxicity in the rat (Thibodeaux et al. 2003/Lau et al. 2003) two-generation reproductive toxicity in the rat (Luebker et al. 2005b).
Human equivalent doses (HED) were based on average serum concentration prediction, derived from predicted AUC over the duration of dosing using the US EPA PK model and parameters (Wambaugh et al. 2013). The average serum PFOS concentrations were converted to HEDs using the following equation, which was also used by the US EPA:HED = average serum concentration (µg/mL) x CL
Where
CL = Vd x (ln 2 ÷ t½) = 0.23 L/kg bw x (0.693 ÷ 1971 days)
= 0.000081 L/kg bw/day
The model diagram is shown in Figure 1. The model assumes that PFOA or PFOS is absorbed from a gut compartment through a first order process with rate constant ka into central compartment. After that, the free fraction of PFOA or PFOS in the central
57

compartment (given by free*C1) distribute to second compartment based on inter-compartmental rate constants (i.e. k12 and k21) and is cleared to a filtrate compartment where it is either excreted or resorbed via a saturable process with a Michaelis-Menten form.
Figure 1: US EPA PBPK Model
The primary and secondary parameters of the model are summarised in Tables 15 and 16 below:
Table 15: Primary parametersParameters
Definition Unit
BW Body weight KgVcc Volume of distribution (central compartment) L/kgQCc Cardiac output per kg L/h/kgQfilc Renal plasma filtration rate, fraction of cardiac output -Tmc Transport maximum constant mg/h/kgKt Transporter affinity constant mg/LFree Fraction of free compound in blood -Vfilc Volume of renal filtration L/kgk12 Transfer rate constant from central to tissue compartment h-1
Rv2:V1 Transfer rate constant from tissue to central compartmentinput Daily dose mg/kg/dayka Absorption rate constant h-1
Table 16: Secondary parameters:Parameters
Definition Unit
Qfil Qfil= Qfilc× QCc×BW0.74 filtration rate for individual animal L/h
Vc Vc = Vcc × BW volume of distribution (central compartment) L
Vfil Vfil = Vfilc× BW volume of renal filtration L
Tm Tm = Tmc × BW transport maximum mg/h
58

The differential equations for mass balance are described below:
d Agutdt
=Input−k a Agut (Gut compartment)
V cd C1dt
=ka Agut+k21 A tissue−k12V cC1 Free−QfilC1Free (Central compartment)
dA tissuedt
=k12V cC1 Freek 21A tissue (Second compartment)
V fild C fildt
=QfilC1Free−Q filC fil−TmC filK t+C fil
(Filtrate compartment)
The calculated HEDs are shown in Table 17.
Table 17: HEDs derived from modelled animal average PFOS serum concentrations
StudyDosing duratio
n (days)
NOAEL (mg/kg
bw/day)
NOAEL (Average
serum concentration
[µg/mL])
HED (mg/kg bw/day
)Seacat et al. 2002; monkey 182 0.15 38.1 0.0031
Butenhoff et al. 2012/Thomford 2002; male rat
728 0.098 8.65 0.0007
Butenhoff et al. 2012/Thomford 2002; Female rat
728 0.120 46 0.0037
Thibodeaux et al. 2003/Lau et al. 2003; female rat
19 1.0 15.6 0.0013
Luebker et al. 2005b; female rat 84 0.1 7.14 0.0006
To further consider the uncertainties in the modelling based on the US EPA PK model and parameters, HEDs were also calculated using species specific PK parameters to predict average serum concentration using Berkeley Madonna™ software (described in detail in Roberts et al. 2016). Using those parameter estimates and the commercial simulation software package, the EPA estimates for the HED of a range of studies could be replicated with an error of less than 80%. In the context of the uncertainty factors of 30 fold applied to derive the TDI to take into account pharmacodynamic and intra-species differences this uncertainty of 1.5 to 1.8 fold is a very small component of the total uncertainty. On that basis, candidate TDIs were calculated by applying uncertainty factors to the HEDs estimated using the US EPA model.
For all studies a default uncertainty factor of 10 has been applied to account for human variability. For interspecies variability, a default uncertainty factor of 3 has been applied to account for potential differences in toxicodynamics between animals and humans. An uncertainty factor to account for interspecies differences in toxicokinetics is not required due to the use of PBPK modelling to derive HEDs. No additional uncertainty factors were considered to be required, and therefore a total uncertainty factor of 30 was applied to all modelled HEDs. The candidate TDIs are shown in Table 18.
59

Table 18: Candidate HBGVs for PFOS
Point of departureHED
(mg/kg bw/day)
UFH UFA UFtotal
Candidate TDI (mg/kg
bw/day)HEDNOAEL Seacat monkey 0.0031 10 3 30 0.0001HEDNOAEL ButenhoffThomford male rat 0.0007 10 3 30 0.00002HEDNOAEL Butenhoff/Thomford female rat 0.0037 10 3 30 0.0001
HEDNOAEL Thibodeaux/Lau female rat 0.0013 10 3 30 0.00004
HEDNOAEL Luebker female rat 0.0006 10 3 30 0.00002
UFH: Intraindividual uncertainty factorUFA: Interspecies uncertainty factor
The overall TDI is 20 ng/kg bw/day, based on the HED for the NOAEL from the Luebker et al. (2005b) study in rats. All of the modelled TDI values were within an order of magnitude ranging from 20 to 100 ng/kg bw/day.
60

3 Hazard assessment PFOA
3.1 Introduction
3.1.1 Overview Perfluorooctanoic acid
Perfluorooctanoic acid, CAS number 335-67-1, is a completely fluorinated organic acid with a seven-carbon backbone and a carboxyl functional group. PFOA and its salts have been used for a range of purposes including as a component in aqueous firefighting foam, non-stick coatings on cookware, membranes for clothing that are both waterproof and breathable, electrical-wire casing, fire- and chemical-resistant tubing, and plumber’s thread-seal tape (IARC, 2016). PFOA may occur in food as a result of contamination of plants and animals, and/or via transfer from food-packaging materials.
The IUPAC name for PFOA is 2,2,3,3,4,4,5,5,6,6,7,7,8,8,8-pentadecafluorooctanoic acid. Synonyms for PFOA include perfluoroheptanecarboxylic acid, perfluoro n octanoic acid, perfluorocaprylic acid and 2,2,3,3,4,4,5,5,6,6,7,7,8,8,8-pentadecafluorooctanoic acid. It should also be noted that a number of toxicological studies of PFOA that have been conducted in experimental animals used the ammonium salt, ammonium perfluorooctanoate or AFPO. The CAS number of AFPO is 95328-99-7.
3.1.1.1 Chemical structure
PFOA has the empirical formula C8HF15O2, and molecular mass of 414.07 g/mol. Its structure is illustrated as:
3.1.1.2 Physicochemical properties
Appearance: White to off-white powderMelting point: 54.3ºCBoiling point: 192.4ºCDensity1.792 g/mL at 20ºCWater solubility: Soluble, 9.5 g/L at 25ºCOrganic solvent solubility: Soluble in polar organic solventsLog Kow: 6.30 (estimated) in octanol-water mixturepKa: Debated; values of 2.80 and 3.80 have been reported,
and 0.5 has been estimated.
61

3.2 Summary of International hazard reviews of PFOA
UKCOT, 2006
In 2006, UKCOT recommended a TDI for PFOA of 3 μg/kg bw/day, based on hepatic effects in a number of studies in rats and mice. The TDI was derived using a dose of 0.3 mg/kg bw/day as the point of departure, and an overall uncertainty factor of 100 for inter- and intraspecies differences (UKCOT 2006).
The TDI was reviewed in 2009 after the EFSA derived a TDI for PFOA of 1.5 μg/kg bw/day in 2008. UKCOT noted that the difference in the assessments was a result of the uncertainty factors applied. EFSA applied an additional uncertainty factor of 2 to compensate for uncertainties relating to the internal dose kinetics and therefore an overall uncertainty factor of 200.
UKCOT concluded that the additional uncertainty factor to account for interspecies differences in toxicokinetics was appropriate and amended the TDI to 1.5 μg/kg bw/day. However, it noted that the TDI remained provisional, recognising that it will be reviewed as new information becomes available (UKCOT 2009).
EFSA, 2008
The current EFSA TDI for PFOA was established in 2008 based on the 95% lower confidence limit of the benchmark dose for a 10% increase in effects on the liver (BMDL10) from studies of mice and male rats. The BMDL10 values were in the range 0.3 to 0.7 mg/kg bw/day.
The lowest BMDL10, 0.3 mg/kg bw/day from the studies of Palazzolo 1993 and Perkins et al. 2004, was selected as the point of departure for deriving the TDI. An overall uncertainty factor of 200 was applied, comprising an uncertainty factor of 100 for inter- and intraspecies differences and an uncertainty factor of 2 to reflect uncertainties related to kinetics. The TDI was 1.5 µg/kg bw/day.
EFSA concluded that epidemiological studies of PFOA-exposed workers do not indicate an increased risk of cancer, and that carcinogenic effects in rats, which mainly affect the liver, appear to be due to non-genotoxic modes of action.
Swedish EPA, 2012
The Swedish EPA assessed the human and environmental risks of a number of PFASs.
The human hazard assessment was principally based on existing assessments, although additional relevant data were also considered. Two toxicological endpoints, hepatotoxicity and reproductive toxicity, were selected, because these are common to a number of PFASs. Other endpoints showing lower effect levels were also considered.
The existing assessments considered in the Swedish EPA report included:
2005 draft US EPA assessment 2007 OECD hazard assessment report 2008 EFSA risk assessment 2008 Minnesota Department of Health risk assessment 2009 Chemical Safety Report by German authorities and industry 2009 ATSDR draft toxicological profile
62

2009 US EPA risk assessment 2010 risk assessment initiated by the European Commission a draft screening assessment published by Health Canada in 2010 in addition, the Swedish EPA considered developmental studies conducted in mice by
Hines et al. (2009) and Macon et al. (2011)
The Swedish EPA noted that epidemiological studies of PFASs showed inconsistent results.
PODs selected by the Swedish EPA were as follows:
Hepatotoxicity (subchronic rat study, NOAEL, hepatocellular hypertrophy): 0.06 mg/kg bw/day, 7.1 µg/mL serum. (Perkins et al. 2004). A liver:serum ratio of 2:1 was assumed.
Reproductive toxicity (mouse, reduced F1 body weight, BMDL): 0.86 mg/kg bw/day, 15.7 µg/mL serum. (Lau et al. 2006). A liver:serum ratio of 2:1 was assumed.
Other endpoints (mouse, mammary gland development, increased body weight, LOAEL): 0.01 mg/kg bw/day, 15 µg/mL serum. (White et al. 2007, 2009, 2011).
The Swedish EPA used the PODs to establish DNELs according to REACH guidelines, by dividing the PODs with the following AF, as applicable:
Extrapolation for exposure duration. The default factor for subchronic to chronic exposure is 2, and the default factor for subacute to chronic exposure is 6.
Extrapolation from LOAEL to NOAEL in studies in which a NOAEL was not identified. A factor of 3 was used.
Species differences. Because internal (serum) doses are compared between animals and humans, no assessment factor was used for differences in toxicokinetics, but an assessment factor of 2.5 was applied for differences in toxicodynamics.
Intraspecies differences within human populations, that is sensitive subpopulations. An assessment factor of 10 was used for the general population and 5 for workers.
Quality of the database. For those PFASs for which read-across was necessary, a factor of 3 was used if the read-across was from a shorter and more rapidly excreted congener to a longer congener, but this assessment factor was not required for PFOA.
The resulting DNEL for hepatoxicity of PFOA to the general population was as follows:
DNEL = POD / (exposure duration AF x interspecies AF x intraspecies AF)= 7100 ng per mL serum / (2 x 2.5 x 10)= 7100 ng per mL serum / 50= 142 ng/mL serum
The DNEL for reproductive toxicity of PFOA to the general population was:
DNEL = POD / (interspecies AF x intraspecies AF)= 15,700 ng per mL serum / (2.5 x 10)= 15,700 ng per mL serum / 25= 628 ng/mL serum
The DNEL for other effects, specifically on mammary gland development and growth, of PFOA to the general population was:
DNEL = POD / LOAEL to NOAEL AF x Interspecies AF x intraspecies AF)= 150 ng per mL serum / (3 x 2.5 x 10)= 150 ng per mL serum / 75
63

= 2.0 ng/mL serum
Danish EPA, 2015
The Danish EPA evaluated the health hazards of PFOA and two related perfluoroalkylated substances, PFOS and PFOSA. TDIs were established for PFOA and PFOS, and health-based quality criteria in drinking water, ground water and soil were also proposed.
To establish a TDI for PFOA, they used the BMDL10 value (0.456 mg/kg bw/day) based on liver effects derived by the US EPA from 90 days exposure of the dietary study in rats by Palazzolo (1993).
The BMDL10 level was transformed to a HED level by dividing the BMDL10 by the LOAEL/HED-LOAEL ratio, as follows:
HED-BMDL10 = BMDL10Palazzolo, rat, 90d/ (LOAEL Palazzolo, rat, 90d/HED-LOAEL Palazzolo, rat, 90d) = 0.467 mg/kg bw/day / (0.64 mg/kg bw/day / 0.0045 mg/kg bw/day) = 0.003 mg/kg bw/day
From this HED-BMDL10, the TDI was derived by applying UFs, that is:
TDI= HED-BMDL10/UFI x UFII…UFn
The UFs applied by the Danish EPA were the default intraspecies UF of 10 to allow for variability in the human population, and an interspecies UF of 3 to allow for possible differences in toxicodynamics between species. Thus:
TDI = 0.003 mg/kg bw/day / 10 x 3 = 0.1 µg/kg bw/day, or 100 ng/kg bw/day
ATSDR 2015
The ATSDR published a draft toxicological profile for perfluoroalkyls in 2015.
A MRL was calculated for PFOA, based on the cynomolgus monkey study of Butenhoff et al. (2002). Due to the species differences in the toxicokinetics of PFOA, serum concentration was used as an internal dosimetric. This was based on the assumption that a serum concentration that had a given effect in monkeys would have the same effect in human beings.
Absolute and relative liver weight data were fit to all available continuous models in the US EPA’s BMDS8 (version 2.4.0). Data from the high dose group were excluded from the modelling due to observations of toxicity in that group. For absolute liver weight, linear, polynomial and power models yielded identical BMDs (lower than those obtained using exponential models) and virtually the same Akaike Information Criterion9 (AIC) values. The linear model was selected as the simplest. For the relative liver weight, the polynomial model was selected as the model yielding the lowest AIC.
HEDs were calculated for each POD from the absolute and relative liver weights, assuming parameter values for humans oft½= 1,400 days
8 BMDS = Benchmark Dose Software. This is available at https://www.epa.gov/bmds9 The AIC is a measure of the relative quality of statistical models for a given set of data. Given a collection of models for the data, AIC estimates the quality of each model, relative to each of the other models. Hence, AIC provides a means for model selection.
64

Serum elimination rate constant (ke) = 4.95 x 10⁻⁴ day-1
Gastrointestinal absorption fraction (gAF) = 1Apparent volume of distribution (Vd) = 0.2 L/kg
according to the equationDSS = (CSS.ke.Vd)/AF
in which Dss is external steady-state dosage and Css is steady-state serum concentration.
HEDs were calculated for BMDL1SD, BMDL2SD and BMDLRD10% for the absolute liver weight using the linear model and for the relative liver weight using the polynomial model. The BMDLRD10% for absolute liver weight was selected as the POD giving the lowest HED, which was 1.54 x 10⁻³ mg/kg bw/day.
Uncertainty Factors applied to the HED to derive the MRL were 3 for extrapolation from animals to man (UFA), 10 for variability in the human population (UFH), and 3 for database deficiencies (UFD). The factor for database deficiencies was based on a lack of studies on developmental and immunological effects in monkeys. Such studies are not usually required for chemical risk assessment.
The final MRL was 20 ng/kg/day.
US EPA 2016
The US EPA calculated RfDs for both noncancer and cancer effects.
RfD for noncancer effects
A PBPK model was applied because of the complexity of the toxicokinetics of PFOA, the lack of a NOAEL in a number of the animal studies, the lack of reactivity of PFOA, and differences in pharmacokinetics between experimental subjects related to species, strain, sex and life stage.
Human data were not considered directly useful for the derivation of a RfD because exposures were often to multiple PFAS, and because the actual exposure level was uncertain.
PFOA is known to cause peroxisome proliferation, leading to hepatocellular hypertrophy and increased liver weight, particularly in rodents. Increases in liver weights in animal studies following administration of peroxisome proliferators are not considered to be predictive of adverse effects in human beings unless accompanied by histopathological lesions such as necrosis, inflammation, fibrosis and/or macrovesicular steatosis. Although some liver pathology was seen in some animal studies of PFOA, and there is some evidence of effects of PFOA on the liver that are not mediated by PPARα receptors, the US EPA noted that it is difficult to separate the effects of PPARα activation from direct effects of PFOA on the liver.
Criteria for selecting animal studies for derivation of an RfD were the determination of a NOAEL and/or LOAEL, inclusion of a control group, use of two or more doses, and available serum data for the species, strain and sex for the purpose of PBPK modelling. The selected studies were a 90-day study in monkeys by Goldenthal (1978), a 26-week study in monkeys by Butenhoff et al. (2002), a 13-week study in rats by Perkins et al. (2004), a two-generation rat study by Butenhoff et al. (2004a), and a 2-year study in rats by Butenhoff et al. (2012). In addition, a number of short term studies were also considered including developmental studies in mice reported by Lau et al. (2006), Wolf et al. (2007), White et al. (2009), Macon et al. 2011, and an immunotoxicity study reported by De Witt et al. (2008).
65

It was noted that the Butenhoff et al. (2002) monkey study was only included in for the purpose of comparison of serum levels, due to the small number of test subjects and the lack of histological correlates to the increased liver weight found.
The very long half-life of PFOA was considered problematic, but a saturable renal resorption model was used to predict average serum values at termination and the duration required to reach steady-state. PK data were obtained from a cynomolgus monkey study by Butenhoff et al. (2004b), a Sprague Dawley rat study of Kemper (2003) and two strains of mouse; CD1 mice (Lau et al. 2009) and C57BL6/N mice (De Witt et al. 2008). Male and female data were fitted separately for rats, because of marked sex differences, while only female mouse data were used. Data from both sexes were combined for monkeys.
For each study with a toxicological endpoint and a LOAEL, the AUC and final serum concentrations were determined for the exposure duration of that study. A final serum concentration was estimated for each treatment and compared to the actual measured serum concentration. It was found that the predicted serum concentration could differ from the actual serum concentration by a factor of two when data from the same strain were used for the prediction, and by a factor of four if a different strain was used. Thus, there is some uncertainty about the exposure estimates.
The average serum concentration was determined through numeric simulation. The serum concentrations associated with LOAELs differed by less than an order of magnitude (13.1 to 96.2 mg/L) between studies, while the AUC values differed by over two orders of magnitude (5360-380,000 mg/L*h). Serum concentrations associated with the LOAEL were 38 mg/L for developmental effects in the Lau et al. (2006) mouse developmental study, 45.9 mg/L for effects in organ weights of males in the Butenhoff et al. (2004a) two-generation rat study, and 61.9 mg/L for the De Witt et al. (2008) mouse immunotoxicity study. It was noted that the LOAELs are roughly consistent (within the same order of magnitude) across sex, species and treatment with respect to average serum concentrations. The US EPA then concluded that it may be expected that similar concentrations would cause similar effects in humans, based on the assumption that PK alone explains variation, and that MOA and susceptibility to toxicity do not vary between species.
The Css in µmol/h resulting from a constant infusion was then calculated and the fraction of Css compared to the average serum concentration predicted. It was found that none of the studies represented Css, although four studies (Perkins et al. 2004; Butenhoff et al. 2004a; Wolf et al. 2007 GDs 7-17 and Wolf et al. 2007, GDs 1-17) resulted in serum values greater than 80% of Css. Thus, there is also uncertainty inherent in calculating a RfD for chronic lifetime exposure from a projection that does not represent Css.
Measurements of the t½ in humans vary, but the US EPA chose to use a value of 2.3 years, obtained from a study of members of the general population exposed to PFOA in contaminated drinking water. The Vd for PFOA in human beings has also been determined from people exposed via drinking water. These values were used to calculate the CL for PFOA, assuming first order kinetics:
CL = Vd x (ln 2 ÷ t½) = 0.17L/kg bw x (0.693 ÷ 839.5 days)
= 0.00014 L/kg bw/d
The derived average serum concentrations for the NOAELs and LOAELs of the studies of De Witt et al. 2008, Lau et al. 2006, Perkins et al. 2004, Wolf et al. 2007, Butenhoff et al. 2004a and Macon et al. 2011 were scaled to derive the predicted oral HED in mg/kg bw/day for each corresponding serum measurement, according to the formula
66

HED = average serum concentration x CL
The scaling assumed linear first order human kinetics. Linear first order kinetics are observed in animals at the doses at which NOAELs and LOAELs occur.
The final HEDs ranged from 0.0044 to 0.0123 mg/kg bw/day. A UFH of 10 for intraspecies variability within the human population was applied in all cases, as was a UFA of 3 for interspecies variability between animals and humans. A UFL
10 was applied for HEDs from all
studies that did not identify a NOAEL, the exceptions being the studies of Perkins et al. (2004) and De Witt et al. (2008). A UFS was applied to the DeWitt et al. (2008) HED because the serum value was less than 80% of Css. For most of the six HEDs used, the UFTOTAL was 300. The exception was the HED derived from the Perkins et al. (2004) study. For that HED, the UFTOTAL was 30. The final candidate RfDs ranged from 0.00002 to 0.00015:
Table 19: Candidate RfDs for PFOA based on HEDs
Study; endpointPK-HED
mg/kg bw/dayUFH UFA UFL UFS UFtotal
RfD (mg/kg bw/day)
Perkins et al. 2004; NOAEL for ↑liver weight in rats 0.0044 10 3 - - 30 0.00015
Wolf et al. 2007; GD 1-17 LOAEL↓pup bw in mice 0.0109 10 3 10 - 300 0.00004
Wolf et al. 2007; GD 7-17 LOAEL↓pup bw in mice 0.0123 10 3 10 - 300 0.00004
DeWitt et al. 2008; NOAEL ↓IgM response to SRBC in mice 0.0053 10 3 - 10 300 0.00002
Lau et al. 2006; LOAEL ↓ossification and ↓ time to puberty in mouse pups.♂
0.0053 10 3 10 - 300 0.00002
Butenhoff et al. 2004a; LOAEL↓F0 bw and ↑ absolute and relative kidney weight
0.0064 10 3 10 - 300 0.00002
Of the candidate RfDs, the final RfD for noncancer effects selected, 0.00002 mg/kg bw/day, was that derived from the mouse developmental study of Lau et al. (2006). That study found reduced ossification of the proximal phalanges and accelerated puberty in male pups. Candidate RfDs of 0.00002 mg/kg bw/day were also derived from the mouse immunotoxicity study of DeWitt et al. (2008), and the two-generation rat study of Butenhoff et al. (2004a).The final RfD for noncancer effects of 0.00002 mg/kg bw/day may be more conveniently expressed as 20 ng/kg bw/day.
Cancer effects
The US EPA considered that there is equivocal evidence that PFOA is associated with increased risk of cancer in either human beings or experimental animals.
Two chronic studies in rats suggest that PFOA may be a weak carcinogen in rats. Increased incidence of liver tumours, Leydig cell tumours and pancreatic acinar cell tumours were reported. The increased incidence of liver cell tumours appears to be due to PPARα agonism, a mechanism that is not relevant to human beings. PPARα agonism may also be indirectly responsible for the increase in Leydig cell tumours. It is possible that PFOA decreases testosterone as a result of increased activity of aromatase. Decreased testosterone synthesis leads to increased gonadotropin-releasing hormone and luteinising hormone (LH), leading to chronic stimulation of Leydig cells. There is a lack of information on whether PFOA could influence the theorised mode of action for pancreatic acinar cell tumours.
10 A UFL is used to extrapolate from a LOAEL when a NOAEL has not been identified.
67

Under the US EPA’s 2005 cancer guidelines, the evidence for carcinogenicity of PFOA is considered to be suggestive because only one species has been evaluated for lifetime exposure and the responses occurred primarily in one sex (males). However, the data on liver tumours from the study, that of Butenhoff et al. (2012), was modelled using the US EPA’s Benchmark Dose Software (Version 2.3.1). It was concluded that the RfD for cancer effects is higher than the RfD for noncancer effects and therefore the RfD for noncancer effects is also protective against any carcinogenicity.
3.3 Summary of the toxicity of PFOA
3.3.1 Mechanisms of toxicity
The mode of action of PFAS substances is not fully defined, but can be partly attributed to their structure.
PFAS compounds exhibit structural similarities to endogenous fatty acids. They are transported bound to albumin in the circulation, and bind intracellularly to fatty acid binding proteins. Like endogenous fatty acids, PFASs are ligands to the peroxisome proliferator activated receptor PPARα. PFOA has been shown to activate PPARα using COS1 cells transfected with a luciferase reporter gene (EFSA 2008).
Activation of this receptor leads to proliferation of peroxisomes, and catabolism of fatty acids and cholesterol. Peroxisome proliferation leads to hepatocellular hypertrophy and increased liver weight, which is observed in rodents and monkeys treated with PFOA. Peroxisome proliferation is associated with hepatocellular carcinogenesis in rodents, but this effect is not relevant to human health risk assessment (Borg and Håkansson, 2012).
The hepatic changes observed in rodents treated with PFOA cannot be entirely attributed to binding with PPARα, because hepatotoxicity has been observed in PPARα-knockout mice treated with PFOA.
PFOA also induces CYP2B2, CYP3A4 and CYP4A1 in liver, which suggests that PFOA may also interact with other members of the nuclear hormone receptor superfamily including CAR and PXR (EFSA 2008). It is difficult to separate the effects of PPARα activation from these other effects of PFOA on the liver (US EPA 2016).
Effects not considered to be mediated by PPARα may be relevant to human health risk assessment (Borg and Håkansson 2012). However, it should also be noted that recent advances over the last decade have also revealed that a number of the effects related to the activation of the nuclear hormone receptors CAR and PXR are rodent-specific (Hall et al. 2012).
3.3.2 Toxicokinetics
A detailed review of the toxicokinetics of PFOA is included in the review of pharmacokinetic modelling for PFOS and PFOA commissioned by FSANZ (Roberts et al. 2016). Key information is summarised below.
Absorption
PFOA is readily absorbed by the oral route. Bioavailability of > 93% within 24 hours has been demonstrated following oral administration to rodents (reviewed by Borg and Håkansson 2012). Cmax is reached within four hours in male mice and eight hours in female mice
68

(reported by Bull et al. 2014 from their review of Lou et al. 2009), and in one to two hours in rats (reviewed by EFSA 2008).
Distribution
PFOA is highly bound to plasma proteins in circulation. It has been shown to be 99.7% bound to human plasma proteins and 97.3% bound to plasma protein of rats and monkeys (ATSDR 2015). Over 90% of the protein binding is to albumin (Roberts et al. 2016). The dissociation constant for albumin-bound PFOA in human serum is approximately 0.4 mM and involves 6–9 binding sites (ATSDR 2015). It also has binding affinity to FABP in the liver, although not as high a binding affinity as PFOS (Roberts et al. 2016). There is no sex related difference in serum protein binding of PFOA between male and female rats. PFOA also has a high binding affinity for human serum thyroid hormone transport protein, TTR and a moderate affinity for low density lipoproteins and α-globulins (ATSDR 2015).
After subchronic oral dosing, PFOA is found mainly in blood, liver, testis, spleen, lung, kidney and brain of rats. The highest levels of PFOA in mice are found in the blood and the highest extravascular concentrations are found in the liver. In human postmortem studies, the highest levels of PFOA were found in lungs, kidneys, liver blood, and bone. In both humans and laboratory animals, PFASs cross the placenta and are also found in milk (reviews by EFSA 2008; Borg and Håkansson 2012; US EPA 2016). A human study found that mean cord blood PFOA was approximately 47% that of maternal blood (reviewed by US EPA 2016). Cerebrospinal fluid does not appear to be a relevant partitioning site for PFOA (Roberts et al. 2016).
Transporters involved in absorption, distribution and excretion of PFOA include organic anion transporters, organic anion transporting peptides, multidrug resistance –associated proteins, and urate transporters (Roberts et al. 2016).
The volume of distribution of PFOA is similar across species at approximately 0.17 L/kg bw, and suggests extracellular distribution (Roberts et al. 2016).
Metabolism
No evidence has been found that PFOA undergoes any metabolism in studies conducted in rodents or nonhuman primates (reviews by ATSDR 2015, EFSA 2008; Borg and Håkansson, 2012; US EPA 2016).
Excretion
PFOA is principally excreted by the renal route in rats. Glomerular filtration is limited by extensive binding to serum albumin and other high molecular weight proteins. Renal organic anion transporters actively reabsorb PFASs (reviewed by Borg and Håkansson 2012). The capacity of these transporters is saturated at high doses of PFOA, resulting in proportionally increased PFOA excretion in urine (reviewed by US EPA 2016). At low doses, PFOA has first order kinetics (Roberts et al. 2016).
A marked sex difference is observed in rats with males showing slower elimination which may be attributed to sex related differences in expression of organic anion transporters, in particular Oatp1a1 in the kidney (ATSDR 2015). Significant sex related differences in systemic clearance have not been found in nonhuman primates or in human monitoring studies, though the latter may reflect limitations in study design (ATSDR 2015).
PFOA is also excreted in the bile and may be subject to extensive enterohepatic recirculation. Biliary excretion may be more important than urinary excretion of PFASs in
69

humans. Biliary excretion with enterohepatic cycling may be the basis for the prolonged elimination half-life of PFASs in humans. Fluctuations in log-linear serum concentration vs time profiles, consistent with enterohepatic cycling, have been reported for monkeys. (Roberts et al. 2016).
Lactation is a route of excretion in women and in mice. Menstruation is considered to be an excretory pathway for PFOS, and this pathway should also apply to PFOA (Roberts et al. 2016).
Half-life of PFOA in humans is estimated to be in the range 2.3 to 3.8 years, much longer than the half-lives of PFOA in monkey, rats and mice which are 20.8 days, 11.5 days, and 15.6 days, respectively (Roberts et al. 2016).
3.3.3 Animal toxicity studies
Various international regulatory agencies or bodies have reviewed the toxicity of PFOA, including acute and short term toxicity studies in mice, rats and monkeys, subchronic studies in monkeys, chronic studies in mice, rats and monkeys, and developmental and reproduction studies in mice and rats. As a part of this assessment, FSANZ has evaluated the pivotal toxicological studies relevant to establishing an Australian TDI as well as other information on mechanism of action, toxicokinetics, genotoxicity and immunotoxicity.
The predominant effect of PFOA in laboratory rodents is peroxisome proliferation-mediated hepatomegaly. Rodents are susceptible to this response whereas humans and other primates are considered to be refractory to it (Parkinson 2001). Other findings in rodent toxicity studies of PFOA include reduced body weight gain, decreased spleen and thymus weights, reduced response to a foreign antigen (SRBC), vacuolation of the zona glomerulosa of the adrenals, increased full-litter resorptions, developmental skeletal defects, reduced birthweight, decreased postnatal growth rate, delayed postnatal eye-opening and hair growth, delayed puberty, decreased postweaning survival, and adverse effects on mammogenesis.
Effects of PFOA in nonhuman primates include weight loss, increased clotting times, decreased heart and brain weights, hypoglycaemia, hypoproteinaemia, bone marrow hypocellularity, lymphoid follicle depletion and lipid depletion in the adrenal glands. Clinical signs in monkeys that were terminated moribund during a subchronic oral gavage study included anorexia, emesis, decreased activity, facial swelling, black stools, prostration and tremor (Goldenthal 1978).
A summary of the NOAELs and LOAELs derived from the pivotal toxicological studies assessed as a part of this evaluation is set out in Table 20.
70

Table 20: Key oral toxicity studies used for the derivation of HBGV for PFOA
71

Study type Species, strain
NOAEL and LOAEL(mg/kg bw/day)
Study details Reference Citing agency/ies
Subchronic toxicity90-day dietary Rat, Crl:CDBR NOAEL: 1.94
LOAEL: 6.50, 1, 10, 30, 100 ppm (0, 0.06, 0.64, 1.94, 6.50 mg/kg bw/day)
Reduced body weight gain at 6.5 mg/kg bw/day
Palazzolo, 1993 Perkins et al. 2004
UKCOTEFSADanish EPASwedish EPAUS EPA
90 day Monkey, Rhesus
NOAEL/LOAEL: not assigned(2 animals only per dose group)
0, 3, 10, 30, 100 mg/kg bw/dayDecreased weights of heart (absolute and relative) and brain (absolute) in females at 10 mg/kg bw/day.
Goldenthal 1978b US EPA
180 day oral capsule
Monkey, cynomolgus (males only)
NOAEL: 10LOAEL: 30/20
0, 3, 10, 30/20 mg/kg bw/day.Mortality, clinical signs, hepatic toxicity, body weight effects at 30/20 mg/kg bw/day.
Butenhoff et al. 2002 ATSDR
Chronic toxicity and carcinogenicity24 month dietary
Rat, male only, CD
No NOAEL/LOAEL assigned.Single dose study
0 and 300 ppm, equivalent to 0 and 14 mg/kg bw/day.Increased liver weights and β-oxidation activity in treated groups.Significant increases in Leydig cell adenomas, hepatocellular adenomas and pancreatic acinar cell tumours.
Biegel et al. 2001. UKCOT
104-week dietary
Rat, Sprague Dawley
LOAEL: 1.3 0, 1.3 and 14.2 mg/kg bw/day for males; 0, 1.6 and 16.1 mg/kg bw/day for females.LOAEL based on increased liver weight, clinical chemistry and hepatocellular pathology males at both doses.
Sibinski,1987, (with histopathology re-evaluation by Mann and Frame, 2004.)
EFSA
Also reported byButenhoff et al. 2012
US EPA
Reproductive and developmental toxicityTwo-generation oral gavage
Rat, Sprague Dawley
Paternal toxicity:LOAEL: 1Reproductive toxicity: NOAEL: 30Offspring toxicity:NOAEL: 10
0, 1, 3, 10 or 30 mg/kg bw/day.Decreased body weight in F1 males at ≥ 1 mg/kg bw/day.No effects on mating or fertility parameters.Decreased body weight and sexual maturation in offspring at 30 mg/kg bw/day.
Butenhoff et al. 2004 UKCOTEFSAUS EPA
72
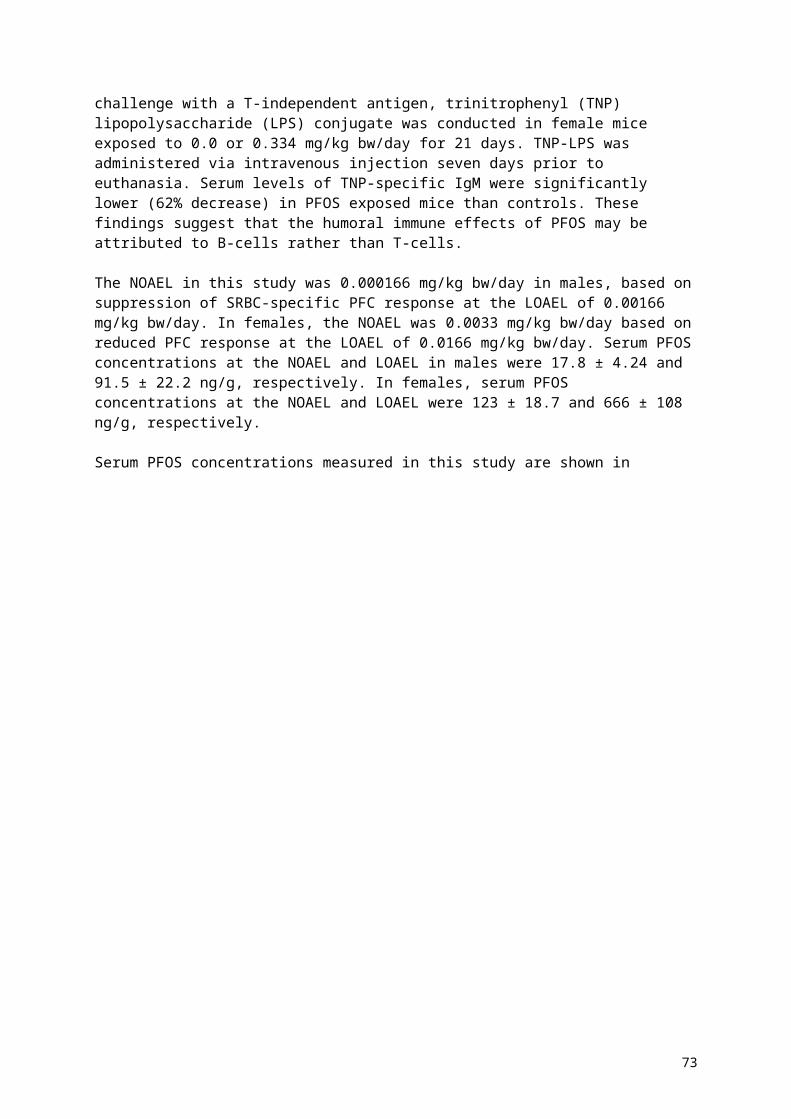
Study type Species, strain
NOAEL and LOAEL(mg/kg bw/day)
Study details Reference Citing agency/ies
LOAEL: 30
Oral gavage Mouse, CD1 Maternal toxicity:NOAEL: 10LOAEL: 20Fetotoxicity:NOAEL: 1LOAEL:3
1, 3, 5, 10, 20,40 mg/kg bw/day GD 1-birth.Dose-related ↓ maternal weight gain at ≥ 20 mg/kg bw/dayDose-related ↑resorptions at ≥ 5 mg/kg bw/dayDose-related ↑late fetal mortality at ≥ 20 mg/kg bw/dayDose-related ↓pup weight at ≥ 20 mg/kg bw/dayDose-related increase in developmental defects including reduced ossification of phalanges and microcardia at ≥10 mg/kg bw/day↑neonatal mortality at ≥10 mg/kg bw/day↓preweaning growth rate at ≥3 mg/kg bw/day
Lau et al. 2006 UKCOTEFSASwedish EPAUS EPA
Oral gavage Mouse, CD1Cross-fostering study
NOAEL/LOAEL not assigned
0, 3, 5 mg/kg bw/day, GD 1-17Reduced birth weight, delayed eye-opening, and increase in whole litter loss at 5 mg/kg bw/day.
No adverse effects on maternal bw or bw gain. ↑absolute and relative liver weights in dams at ≥ 3 mg/kg bw/day but no necrosis.
Wolf et al. 2007 US EPA
Also reported byWhite et al. 2009
Swedish EPAUS EPA
Oral gavage Mouse, CD1 NOAEL/LOAEL not assigned
0 or 5 mg bw/kg on GD 1-17, 8-17 or 12-17, by oral gavage.Pup BW depressed on PND 1 in all treated groups. Dam mammary differentiation decreased for GD 1-17 or 8-17 treated groups. All treated female pups had stunted mammary development.
White et al. 2007 Swedish EPA
Oral gavage ± drinking water exposure
Mouse, CD1 NOAEL/LOAEL not assigned
0, 1 or 5 mg PFOA/kg bw/day GD 1-17
0 or 1 mg bw /kg in drinking water, GD7-17
White et al. 2011 Swedish EPA
Oral gavage Mouse, CD1 NOAEL/LOAEL not assigned
0, 0.01, 0.1 or 1.0 mg/kg bw/day GD 10-17Delayed mammary gland development reported at all doses
Macon et al. 2011 US EPA
Other studiesImmuno-toxicityOral gavage or drinking water
Mouse, C57BL/6J (gavage) and 657BL/6N (water)
Immunological NOAEL: 1.88Immunological LOAEL 3.75
0 or 30 mg/kg bw/day for 10 or 15 days by gavage. Targets 0, 0.94, 1.88, 3.75, 7.5, 15 or 30 mg/kg bw/day for 15 d in drinking water.IgM synthesis suppressed and spleen weight reduced at ≥ 3.75 mg/kg bw/day in drinking water.Liver weight increased at ≥ 0.94 mg/kg bw/day. Thymus weight lower than controls at ≥ 15 mg/kg bw/day.
DeWitt et al. 2008 US EPA
73

74

Acute and subacute toxicity studies
Acute and subacute studies have been conducted with PFOA or AFPO in mice, rats and monkeys. Toxicological findings included lethality, clinical signs (e.g. anorexia, emesis, black stools, pallor of the face and gums, swollen faces and eyes, hypoactivity and prostration) and increased liver weight. A brief summary of acute and short term toxicity studies reviewed in previous international evaluations of PFOA is provided below, by species.
Mice
In a 28-day dietary study of AFPO, all mice of both sexes consuming ≥180 mg/kg bw/day died within 14 days, and almost all mice of both sexes consuming 54-58 mg/kg bw/day died before scheduled termination (Griffith and Long 1980; reviewed by ATSDR 2015).
A significant increase in liver weight, correlating microscopically to hepatocellular hypertrophy, was evident after 7 to 10 days in mice, at a LOAEL of 1 mg/kg bw/day PFOA (ATSDR 2015).
Rats
Acute oral LD50 values for AFPO of 680 mg/kg bw for male rats and 430 mg/kg bw for female rats have been reported, and in a 28-day dietary study, all rats of both sexes consuming ≥ 1,000 mg/kg bw/day died within 7 days (Griffith and Long 1980; reviewed by ATSDR 2015).
Nonhuman primates
Daily gavage with 100 mg AFPO /kg bw was fatal within 14 days to an unspecified number of Rhesus monkeys assigned to a 90-day study. Clinical signs prior to death included anorexia, emesis, black stools, pallor of the face and gums, swollen faces and eyes, hypoactivity and prostration. Postmortem findings included marked diffuse lipid depletion of the adrenals, slight to moderate hypocellularity of the bone marrow, and moderate atrophy of lymphoid follicles of the spleen and lymph nodes (Griffith and Long 1980; reviewed by ATSDR 2015).
Subchronic toxicity studies
Subchronic toxicity studies are available for PFOA for rats and monkeys, but not mice. Toxicological findings in rats were primarily related to decreased body weight gain (6.5 mg/kg bw/day AFPO) and increased liver weight (≥ 0.64 mg/kg bw/day AFPO) correlated to centrilobular hepatocellular hypertrophy. However, there was no associated cellular degeneration or necrosis, and the hepatocellular hypertrophy was reversible during the recovery phase.
Two studies in monkeys were available, a 90-day oral gavage study in Rhesus monkeys and a 26-week oral capsule study in cynomolgus monkeys. Dose levels ≥ 30 mg/kg bw/day caused significant toxicity and some unscheduled deaths in both species. In the Rhesus females dosed with PFOA at 10 mg/kg bw/day, the heart and brain weights were decreased, without histopathological correlates. In cynomolgus monkeys, dose-dependent increases in liver weight associated with mitochondrial proliferation were observed in all treatment groups.
75

Rats
Palazzolo 1993 and Perkins et al. 2004 13-week dietary study in male rats
Only male rats were used in this study because of the slower elimination of PFOA in male rats compared to females, and pre-existing evidence of a lower toxic threshold for PFOA in male rats than in females. Crl:CD®BR rats, approximately 41 days old at the start of treatment, were fed dietary levels of 0, 1, 10, 30, and 100 ppm AFPO, equivalent to 0, 0.06, 0.64, 1.94, and 6.5 mg/kg bw/day AFPO respectively. Cohorts were terminated after 4, 7, and 13 weeks of feeding, and after 8 weeks of recovery. Rats were individually housed under standard laboratory conditions. Food and water were provided ad libitum. In-life parameters were food consumption, clinical observations and body weights. Body weights were measured at study start and at the end of weeks 1, 4, 7, 10 and 13, and in weeks 17 and 21 during the recovery phase. Blood was collected at termination for determination of measurement of serum PFOA, estradiol, testosterone and LH. At scheduled termination, gross necropsy was followed by determination of weights of brain, liver, lungs, testes, and accessory sex organs (seminal vesicle, prostate, coagulating gland, urethra), fixation of the same organ list for histopathology, and collection of liver samples for assay of palmitoyl CoA oxidase activity.
Dose analysis confirmed appropriate concentrations, homogeneity and stability of the test article in the diet. With the exception of one rat in the 100 ppm group that was euthanised due to dermal lesions, all rats survived to scheduled termination, and there were no treatment-related clinical signs. The mean body weight of the 100 ppm group was significantly lower than that of the control group from week 1 to 13. Group mean terminal body weight of the 100 ppm group was 494 ± 64 g, 91% the group mean of 541 ± 41g of controls, and group mean body weight gain from weeks 1 to 13 was 290 ± 57 g for 100 ppm rats, 86% the 338 ± 34 g group mean of controls. The difference in body weight was not statistically significant in weeks 17 or 21 in the recovery phase. Group mean food consumption of the 100 ppm group was slightly lower than that of the control group throughout the study, although this difference only reached statistical significance in week 1. Consumption of ≥ 10 ppm dietary AFPO caused a dose-related statistically significant increase in liver palmitoyl CoA oxidase activity. There were no statistically significant differences in levels of estradiol, testosterone or LH. No treatment-related gross lesions were found on necropsy.
Consumption of ≥ 10 ppm AFPO caused dose-related statistically significant increases in group mean liver weights, absolute and relative to body weight and to brain weight, after 4, 7 and 13 weeks of treatment. These increases correlated to centrilobular hepatocellular hypertrophy. There was no associated cellular degeneration or necrosis, the hepatocellular hypertrophy was reversible during the recovery phase, and absolute and relative liver weights of treated rats in the recovery phase were not significantly different to those of controls. Because the hypertrophy was not associated with necrosis, reversible, and an expected effect of a peroxisome proliferator in a rodent, the hepatic changes were not considered adverse. The NOAEL is 1.94 mg/kg bw/day AFPO based on decreased mean body weight compared to controls at 6.5 mg/kg bw/day.
Measured PFOA concentrations in serum of male rats are shown below in Table 21.
76

Table 21: Serum levels of PFOA (µg/mL) in male Crl:CD® BR1 rats after dietary administration for up to 13 weeks (90 days) with recovery
Dose level (ppm) Dose (mg/kg bw/day)2 MalesWeek of treatment: 4
0 - -0 Pf - -1 0.07 6.5± 1.0 (8)10 0.71 55± 8.1 (9)30 2.14 104± 14 (8)100 7.39 159± 30 (10)
Week of treatment: 70 - -0 Pf - -1 0.06 7.5± 1.3 (9)10 0.60 46± 16 (10)30 1.85 87± 28 (10)100 6.21 149± 35 (10)
Week of treatment: 130 - -0 Pf - -1 0.05 7.1± 1.2 (10)10 0.47 41± 13 (10)30 1.44 70± 16 (10)100 4.97 138± 34 (10)
Week of treatment: 21 (recovery)0 - -0 Pf - -1 - 1.2± - (1)10 - 1.1± 1.3 (3)30 - 1.6± 0.9 (3)100 - 2.5± 0.9(2)
Blood was collected from the vena cava at the time of sacrifice. Data are expressed as group mean ± standard deviation, with number of animals (n) in parentheses.Pf Pair-fed controlsLimit of detection 0.7 µg/mLR Recovery- not applicable1 Sprague Dawley derived2 values taken from Table 2, Perkins et al. 2004 (Animals fed APFO; dose levels in terms of APFO but serum levels in terms of PFOA)
77

Goldenthal (1978) 90-day oral gavage study in Rhesus monkeys
In this 90-day study, Rhesus monkeys, 2/sex/group, administered 0, 3, 10, 30 or 100 mg/kg bw/day PFOA by oral gavage. Monkeys were individually housed under standard laboratory husbandry conditions. Clinical observations were recorded twice daily, and monkeys were weighed weekly. Blood and urine samples were collected prestudy and at 30 and 90 days for standard haematology, serum biochemistry and urinalysis. All surviving monkeys were terminated for necropsy at the end of the treatment period, and monkeys dying prior to the end of the study were also necropsied. Fresh weights of heart, liver, adrenals, spleen, pituitary, kidneys, gonads and brain, and fixed weights of thyroids with parathyroids, were recorded. A comprehensive list of tissues was collected for histopathology.
All monkeys dosed with 100 mg/kg bw/day died between weeks 2 and 5, and 3 of the monkeys (both females and one male) dosed with 30 mg/kg bw/day also died during the study. Clinical signs prior to death included anorexia, emesis, decreased activity, swollen face and eyes, black stools, prostration and trembling. All monkeys dosed with ≤ 10 mg/kg bw/day survived to scheduled termination, but one monkey had pallor and swollen face in week 7 and black stools in week 12. No clinical signs attributable to toxicity were observed in the 3 mg/kg bw/day group.
There were no treatment-related effects on body weight or clinical pathology parameters at ≤ 10 mg/kg bw/day. In contrast, monkeys dosed with ≥ 30 mg/kg bw/day showed decreased body weight after week 1, and the body weight of the one surviving male in the 30 mg/kg bw/day group was significantly lower than those of control males. In the first month of the study, the 30 mg/kg bw/day monkeys had significantly increased activated partial thromboplastin time (APTT) and prothrombin time (PT), and in the third month, the one surviving monkey in that group had even longer APTT and PT, and also had anaemia. The 30 mg/kg bw/day monkeys also had a significant decrease in serum alkaline phosphatase (ALP) in the first month of study, and this change was also evident in the third month in the one surviving monkey in the group, as well as significant decreases in blood sugar, total protein, and albumin, and a slight elevation in cholesterol. No treatment-related changes in urinalysis were discovered.
No treatment-related gross lesions were found on scheduled or unscheduled necropsies. At necropsy, females in the 10 mg/kg bw/day group had significantly lower absolute and relative heart weights, and lower brain weights, than control females. Mean absolute heart weight of 10 mg/kg bw/day females was 11.77 g while that of control females was 15.05 g (i.e. group mean heart weight was 78.2% that of controls). Corresponding values for heart weight relative to body weight were 0.32% and 0.44% respectively. Group mean absolute brain weight of the 10 mg/kg bw/day females was 76.54 g, compared to 82.10 g for control females (i.e. 93.2 % of control group mean). Relative brain weights were also lower than those of control or 3 mg/kg bw/day females, but the difference did not reach statistical significance.
No treatment-related microscopic changes were observed in organs of monkeys treated with ≤ 10 mg/kg bw/day. Consistent microscopic findings in the ≥ 30 mg/kg bw/day monkeys that died prior to scheduled termination included marked diffuse lipid depletion in the adrenal glands, slight to moderate hypocellularity of bone marrow, moderate atrophy of the lymphoid follicles of the spleen and lymph nodes. The one male in the 30 mg/kg bw/day group that survived to scheduled termination also had slight to moderate hypocellularity of the bone marrow and moderate lymphoid follicle atrophy in the spleen.
78

Butenhoff et al. 2002 26-week oral capsule study in cynomolgus monkeys
Male cynomolgus monkeys were assigned to four groups. The control, mid- and high dose groups comprised six monkeys/group while the low dose group comprised four monkeys. Gelatine capsules, empty for the control group and containing AFPO for treated groups, were administered daily by the oral route. The low and mid-dose groups were treated with 3 and 10 mg/kg bw/day respectively, for 26 weeks. The high dose group was initially treated with 30 mg/kg bw/day but this was discontinued on day 12 due to toxicity issues and treatment of the high dose group was resumed on day 22 at 20 mg/kg bw/day. Treatment of three of the six high dose monkeys was discontinued on day 43 due to further toxicity issues. Two monkeys from the control group and the mid-dose (10 mg/kg bw/day) group were assigned to a 13 week recovery period.
Monkeys were housed under standard laboratory husbandry conditions. In-life parameters were daily clinical observations, weekly body weight determination, and ophthalmic examinations prestudy, in week 27 and, for recovery cohorts, at the end of the recovery period.
Blood and urine for clinical pathology were collected prestudy, on days 31, 63, 91, and 182 of treatment, and during the recovery phase on days 217, 245, and 275. Blood was collected for hormone analysis on days –18, –8, and –4, during treatment on days 35, 66, 94, and 183, and during the recovery phase on days 220, 248, and 276. Blood was collected every two weeks from week 2 and analysed for PFOA concentration
Necropsies were performed on all monkeys including those euthanised before scheduled termination. Weights of adrenals, brain, epididymis, kidneys, liver, pancreas, testes, and thyroids with parathyroids were recorded. Samples of the right lateral lobe of the livers, and a sample of bile were collected from all monkeys and flash-frozen in liquid nitrogen. Flash-frozen liver was analysed for PFOA content and palmitoyl CoA oxidase activity, and bile was analysed for specific bile acids. A comprehensive list of tissues was preserved, processed and stained with haematoxylin and eosin for light microscopy. In addition, samples of the left lateral lobe of the liver, left and right testes and the pancreas were collected from each, fixed, processed, and stained for proliferating cell nuclear antigen (PCNA).
One monkey in the 3 mg/kg bw/day group was euthanised for bacterial septicaemia, unrelated to treatment, on day 15 and replaced on day 17. All monkeys in the 10 mg/kg bw/day group survived to scheduled termination. Signs of toxicity in the 30 mg/kg bw/day group that led to suspension of dosing and introduction of a lower dose (20 mg/kg bw/day) were anorexia and weight loss. Dosing of three monkeys in this group was discontinued on days 43, 66, or 81 because of recurrence of the same clinical signs. A sixth monkey in this group was euthanised in moribund condition on day 29 with marked weight loss, and was found on necropsy to have suffered dosing injury. This monkey also had hepatocellular degeneration, necrosis and regeneration.
Clinical signs, food consumption, and body weights were unaffected by treatment in all monkeys receiving 3 and 10 mg/kg bw/day. One monkey in the 3 mg/kg bw/day group was euthanised in moribund condition on day 137 but this was considered to be unrelated to treatment. Administration of PFOA had no effect on ophthalmologic findings.
The two 10 mg/kg bw/day monkeys that were assigned to the recovery phase gained less weight during recovery than the control monkeys assigned to the recovery period. However, this finding is considered to be unlikely to be treatment-related, because there were no significant differences between the body weights or body weight changes of the 10 mg/kg bw/day monkeys and the control monkeys during the dosing phase.
79

There were no treatment-related effects on haematology, clinical chemistry or urinalysis at dose levels ≤ 10 mg/kg bw/day. Small but significant increases in serum triglycerides were found on days 31, 63 and 91 in the 30/20 mg/kg bw/day group. The two monkeys in the 30/20 mg/kg bw/day group that were still alive on days 91 and 182 also had mild to marked decreases in absolute neutrophil count, total protein concentration and albumin concentration. On day 63, the monkey for which treatment was stopped on day 66 had marked increases in AST, ALT, creatine kinase and sorbitol dehydrogenase, as well as an increase in bile acids. The same enzymes were significantly increased in the monkey that was terminated in moribund condition on day 29, and that monkey also had a marked decrease in serum cholesterol.
There were no treatment-related effects on circulating levels of estradiol, testosterone, cholecystokinin, TSH, free thyroxine or total thyroxine.
In monkeys treated with 30/20 mg/kg bw/day, liver tissue collected and flash-frozen at necropsy had a group mean significantly decreased DNA concentration and succinate dehydrogenase activity, and significantly increased cyanide—insensitive palmitoyl CoA oxidation, which is a peroxisomal marker. Group mean hepatic DNA concentration of monkeys treated with ≤ 10 mg/kg bw/day was also lower than that of controls, but not to a statistically significant extent. There was no evidence of increased cell proliferation in liver, pancreas or testes, as measured by PCNA, in any group.
Steady-state values for serum PFOA appeared to be reached after 4 to 6 weeks of daily dosing. Liver PFOA levels were not elevated in the 10 mg/kg bw/day monkeys that were killed at the end of the recovery period.
Absolute liver weight was significantly elevated in all treated groups as compared to controls at the end of the treatment period, although liver weight relative to body weight was only significantly elevated in the 30/20 mg/kg bw/day monkeys that survived to scheduled necropsy. The increase in liver weight was reversible, in that it was not evident in the 10 mg/kg bw/day monkeys necropsied at the end of the recovery period. No gross or histological lesions were found in any monkeys that survived to scheduled necropsy.
The increase in absolute liver weight in the monkeys treated with ≤10 mg/kg bw/day was not associated with any detectable microscopic changes and was reversible, and therefore not considered to be an adverse effect. The NOAEL was 10 mg/kg bw/day based on clinical signs, decreased body weight and hepatic toxicity at the high dose.
Table 22: Mean serum levels (µg/mL) of PFOA in Male cynomolgus monkeys dosed by oral capsule for 180 days
Dose (mg/kg bw/day) Week of treatment Serum level3 Mean 6-26 77± 39 ( 10-154)10 Mean 6-26 86± 33 (10-180)30/20 Mean 6-26 158± 100 (20-467)
Blood was collected from the femoral vein every two weeks from week 2 of treatment. Mean values presented above were calculated from samples taken over the 180 days dosing period, Butenhoff et al. 2002.Data are expressed as group mean ± SD, with range in parentheses.Limit of detection not provided.
The means and ranges of the serum levels may be illustrated graphically as follows, with dose level (mg/kg bw/day) on the x axis, and serum level (µg/mL) on the y axis:
80

3 10 200
50
100
150
200
250
300
350
400
450
500
Figure 2: Dose level vs PFOA serum levels
The 10 mg/kg bw/day dose level is the NOAEL. The 30/20 mg/kg bw/day dose level was associated with significant and life-threatening morbidity. These results indicate a steep dose-response curve in cynomolgus monkeys.
Chronic studies of toxicity and carcinogenicity
Biegel et al. 2001 24-month toxicity/carcinogenicity study in male rats
This study was conducted in male rats only, because it was carried out specifically to investigate the role of peroxisome proliferators in induction of Leydig cell tumours.
Male CD rats, 156/group, were approximately 49 days old at study start. They were individually housed under standard laboratory husbandry conditions and provided with ad libitum access to diet containing either 0 or 300 ppm AFPO. Food consumption was measured daily for the first 3 weeks, then weekly to 3 months, and every two weeks thereafter. Rats were subject to daily cageside examinations and to detailed in-hand examinations when weighed. They were weighed weekly for the first 3 months of study and every second week for the rest of the study. Blood was collected for analysis of testosterone, estradiol, LH, follicle-stimulating hormone (FSH), and prolactin from 10 randomly selected rats at 1, 3, 6, 9, 12, 15, 18 and 21 months. At the same timepoints, 6 rats/group were terminated for evaluation of cell proliferation and 6 rats/group were terminated for evaluation of peroxisome proliferation. At these terminations, organ weights were recorded for testes, epididymides, accessory sex glands (ASG), coagulating gland/seminal vesicle, prostate and liver. All rats surviving to 24 months were subject to termination, necropsy, and recording of weights of brain, heart, liver, spleen, kidneys, ASG, coagulating gland/seminal vesicle, prostate, epididymides, and testes. Sections of liver, testes, epididymides, pancreas and any gross lesions were processed to slides and stained with haematoxylin and eosin for histopathology.
Group mean body weight of the treated group was significantly lower than that of the control group from day 8 of study to the end of the study, although mean daily food consumption was very similar. Survival of the treated rats was greater than that of the control rats. Liver
81
weight was significantly increased in treated rats, relative to controls, at all time points at which liver weight data were collected. Treatment was associated with a statistically significant increase in the incidence of hepatocellular adenomas, but not carcinomas. Absolute testis weight was increased in the treated group, relative to controls, at 24 months, and treatment was associated with increased incidence of Leydig cell hyperplasia and of Leydig cell adenomas. There was a treatment-related increase in pancreatic acinar cell proliferation at the 15-, 18- and 21-month timepoints, and significant increases in the incidence of acinar cell adenoma. Dietary exposure to AFPO was associated with significant elevation in serum estradiol concentrations at 1, 3, 6, 9 and 12 months, but there were no consistent effects on serum testosterone. Effects on serum LH, FSH, and prolactin were also inconsistent.
The increases in neoplasias of the liver, Leydig cells and pancreatic acinar cells are consistent with the effects of other peroxisome proliferators in rats.
Butenhoff et al. 2012– 24-month chronic toxicity/carcinogenicity study in rats
This publication was written to make more accessible the results of the study of Sibinski (1987), and to include the findings of re-appraisals of the histopathology that had been published from 2003 onwards.
The study was performed in Sprague Dawley rats, 65/sex/group, using AFPO as the test article. AFPO was administered in the diet. Fresh diet mixtures were prepared weekly. Concentration, homogeneity and stability of the test article in the diet were confirmed prestudy, and concentration and homogeneity were also measured during the first month of study and at three-month intervals thereafter. Groups comprised a control group, a 30 ppm AFPO group and a 300 ppm AFPO group. The study was conducted for 24 months, but there was an interim termination and necropsy of 15 rats/sex from the control and 300 ppm groups at 12 months. Rats were housed under standard laboratory husbandry conditions. Males were housed individually and females were pair-housed. In-life endpoints were survival, clinical observations, body weight, feed consumption, ophthalmology (prestudy, at 12 months and at 24 months), and clinical pathology (haematology, clinical chemistry and urinalysis, from 15 rats/sex/group/timepoint) at 3, 6, 12, 18 and 24 months. All surviving rats were terminated after 24 months on study. Necropsy procedures included weighing of adrenals, brain, testes, heart, kidneys, liver, spleen and uterus; and collection and preservation of a comprehensive list of tissues for histopathology.
Mean test article consumptions in the 30 and 300 ppm groups were 1.3 and 14.2 mg/kg bw/day respectively for males, and 1.6 and 16.1 mg/kg bw/day respectively for females.
AFPO had no adverse effects on survival; on the contrary, there were fewer unscheduled deaths and moribund terminations of rats of either sex in the 300 ppm group than in the control group. The greater survival rate of the males in the 300 ppm group, compared to males in the control group, was statistically significant and likely to reflect lower body weight over the course of the study, described below. Clinical signs were limited to a dose-related increase in the incidence of ataxia in females, near the termination of the study. However, this finding was considered to be unlikely to be related to treatment because there was no corresponding dose-relationship in ataxia in the males, and ataxia was less common in males, which is not consistent with other studies that show that clearance of AFPO is slower, and plasma levels higher, in males than in females. Other subchronic and chronic studies in rats have not identified ataxia as a clinical sign of AFPO or PFOA exposure. There was no treatment-related effect on the incidence of palpable masses in females. In males, palpable masses were more common in control rats than in treated rats. There were no treatment-related ophthalmological findings in either sex.
82

Group mean body weight gain was decreased in excess of 10% in male rats in the 300 ppm group, when compared to controls, from study week 2 to 98 inclusive. Body weight gains of male rats in the 30 ppm group, on the other hand, were not significantly different to those of controls. Food consumption was slightly depressed in 300 ppm males, but not 30 ppm males, in the first year of study. When expressed relative to body weight, food consumption of 300 ppm males was generally ≥13% higher than that of controls. Treatment had no effect on group mean body weights of female rats until the study had been in progress for 18 months. From 18 months, there was a gradual decrease in group mean body weight in the 300 ppm females, and there was a gradual decrease in food consumption from 18 months to study termination at both dose levels in females. Information on body weights is presented in graphical rather than tabular form, so the magnitudes of these changes are uncertain. However, the mean body weight of the 300 ppm females appears to be around 450 g in the last six months, compared to 500 g for control and 30 ppm females. Data on food consumption are not presented.
No treatment-related changes in urinalysis were found in either sex. No treatment- related haematological or clinical chemistry changes were found in female rats. In male rats in the 300 ppm group, there were consistent minimal decreases, which sometimes reached statistical significance, in red blood cells, haemoglobin and haematocrit between 3 and 18 months. Elevations in group mean white blood cells, relative to those of controls, were sometimes present in treated males during the first year of study, but this finding was not consistent. Alterations in serum chemistry results were consistently found only in males. From 6 to 18 months of study, group mean ALT, AST and ALP were consistently elevated, relative to those of male controls, at both dose levels in males, and these elevations were frequently statistically significant. Elevations in these parameters were present at 24 months in the 300 ppm males but not the 30 ppm males. Group mean serum albumin was significantly elevated in 300 ppm males, relative to controls, throughout the study. Group mean albumin level tended to be higher than that of controls, in 30 ppm males during the first 12 months of study, although this only reached statistical significance at the 3 and 6 month time points.
Only cohorts of rats from the control and 300 ppm groups were subject to interim termination at 12 months. There were no treatment-related gross findings. Group mean male liver and kidney weights, relative to body weights, were elevated in treated males but not treated females. Group mean pituitary weights of 300 ppm males were significantly lower, in absolute terms and relative to body weight and to brain weight, than those of male controls. Group mean adrenal weights of males were significantly lower than those of controls, in absolute terms and relative to brain weights, but not relative to body weights. There were no significant differences in organ weights between treated and control females. Treatment-related microscopic lesions found at the interim terminations were confined to the liver and were more pronounced in males than in females. Females showed a treatment-related increase in minimal to mild hepatocellular vacuolation, whereas males showed a treatment-related increase in diffuse hepatocellular hypertrophy with ‘ground glass’ cytoplasm. Focal hepatocellular necrosis and portal mononuclear cell infiltration were more frequent findings in treated males than control males.
In 300 ppm males subject to unscheduled necropsy or 24-month necropsy, there was a slight increase in incidence of gross hepatic lesions including masses, nodules, raised lesions, mottling or pale foci. There was also an increased incidence in testicular masses. There were no other gross findings in either sex that showed a relationship to treatment, at unscheduled necropsy or study termination, and there were no changes in organ weights that were clearly associated with treatment in either sex. At the interim terminations at 12 months, males in the 300 ppm group had increased incidence, relative to controls, of hepatocellular hypertrophy, focal hepatocellular necrosis, and portal mononuclear cell infiltration. Dose-related changes in the liver found in both sexes at unscheduled or 24-month necropsies included
83

hepatocellular hypertrophy, cystoid degeneration and portal mononuclear cell infiltration; however, there was no dose-related increase in incidence of hepatocellular necrosis. The dose-related effects on the liver were more common in males than in females. The only neoplastic lesion that showed a relationship to dose of AFPO was a statistically significant increase in incidence of Leydig cell adenomas in the testes. There was no AFPO-related increase in hepatocellular neoplasia.
The increased incidence of Leydig cell adenoma in this study is consistent with the study of Biegel et al. (2001). It has been suggested that the increased incidence of these tumours by AFPO and other peroxisome proliferators reflects hormonal changes secondary to induction of aromatase. In contrast to the findings of Biegel et al. (2001), no increase in pancreatic acinar cell tumours was found in this study. There was, however, some evidence of dose-related pancreatic acinar cell hyperplasia.
The LOAEL in male rats in this study is 30 ppm or 1.3 mg/kg bw/day, on the basis of increased relative liver weight, elevations in liver enzymes (ALT, AST, ALP) and cystoid degeneration in the liver. A NOAEL for male rats was not identified. The LOAEL in female rats is 300 ppm or 16.1 mg/kg bw/day, on the basis of weight loss in female rats from approximately 18 months of age. The NOAEL in female rats is 1.6 mg/kg bw/day.
Genotoxicity
EFSA (2008) concluded that the ammonium salt of PFOA (AFPO) does not have significant genotoxic activity, following review of a number of studies. AFPO did not induce mutations in the reverse mutation assay, with or without metabolic activation. Nor did it induce forward mutations in the Chinese Hamster Ovary (CHO) HGPRT assay or in cultured human lymphocytes, with or without metabolic activation. AFPO induced chromosomal aberrations and polyploidy in CHO cells only at toxic concentrations. PFOA is able to induce DNA strand breaks in the single cell gel electrophoresis assay, and micronuclei in human hepatoma HepG2 cells. These effects were accompanied by significant increases in levels of reactive oxygen species and 8-hydroxyguanosine (8-dG), consistent with the genotoxicity being an indirect effect of oxidative DNA damage. AFPO yielded a negative outcome in the mouse micronucleus assay and did not induce cell transformation in C3H10T½ mouse embryo fibroblasts.
IARC (2016) also reviewed a number of studies investigating the genotoxic potential of PFOA, including studies in human cell lines in vitro, in mammalian systems in vitro and in vivo, in non-mammalian eukaryotic system in vitro, and in bacterial and other systems. IARC concluded that there is strong evidence that direct genotoxicity is not a mechanism of PFOA carcinogenesis. However, a few assays indicated that indirect DNA damage may result from induction of oxidative stress, and therefore IARC concluded that there is moderate evidence that genotoxicity overall is not a mechanism of PFOA carcinogenesis.
Reproductive and developmental toxicity
Mice
Lau et al. 2006 developmental and female reproductive study in mice
In this study, timed-pregnant CD-1 mice were administered AFPO equivalent to 0, 1, 3, 5, 10, 20 or 40 mg PFOA /kg bw by oral gavage, at a dose volume of 10 mL/kg, from GD 1 through 17 inclusive. The vehicle and control substance was water. Mice were individually housed under standard laboratory husbandry conditions. Some of each group were terminated on
84

GD 18, 24 hours after their most recent treatment, for teratological evaluation, while others were dosed on GD 18 and allowed to proceed to spontaneous parturition. In the control group, 45 mice were terminated pregnant and 23 proceeded to spontaneous parturition, whereas for the treated groups the corresponding numbers were 17/8, 17/8, 27/19, 26/21, 42/7 and 40/0 respectively.
Endpoints measured included maternal survival; maternal weight gain; maternal liver weight on GD 18; number of fetuses live, dead or resorbed on GD 18; weight, sex and external appearance of fetuses on GD 18; anatomy and skeletal morphology of fetuses on GD 18; time of spontaneous parturition; number, viability and condition of pups at spontaneous parturition; body weights and body weight gains of surviving pups (with pups in litters with fewer than 4 pups redistributed to other dams in the same dose group); day of eye-opening; day of puberty (vaginal opening or preputial separation) of pups; body weights of pups at puberty; and age at first oestrus of female pups. In addition, dams were terminated after weaning and implantation sites in their uteri were counted.The effect of PFOA on maternal survival was not stated and cannot be calculated from the data because the original group numbers were not stated. PFOA treatment had a dose-related negative effect on maternal weight gain during pregnancy at dose levels of ≥ 20 mg/kg bw/day, and the maternal liver weights showed a dose-related increase at dose levels ≥ 1 mg/kg bw/day. Analysis of maternal serum confirmed a dose-related increase in PFOA concentration at term. The authors reported serum PFOA data only for the 20 mg/kg bw/d dose level.
Treatment with PFOA had no effect on the number of implantations, but there was a significant dose-related increase in the incidence of full-litter resorptions in the groups receiving ≥ 5 mg/kg bw/day PFOA. All pregnancies were lost in the 40 mg/kg bw/day group. Among litters with viable fetuses at term, significant prenatal loss was observed only in the 20 mg/kg bw/day group. Weights of live pups at term were decreased only in the 20 mg/kg bw/day group, in which there was a mean decrease of 20%. In fetuses assessed for morphology at GD 18, skeletal abnormalities were found with increased incidence in the 10 and 20 mg/kg bw/day groups, and included enlarged fontanels, and reduced ossification of sternebrae, caudal vertebrae, metacarpals, metatarsals, phalanges, calvaria, supraoccipital bones and hyoid bones. However, not all these defects showed a consistent dose-response relationship. Soft tissue defects found in the same dose groups were minor tail and limb defects, and microcardia.
PFOA slightly increased average time to spontaneous parturition, which was statistically significant at ≥10 mg/kg bw/day, and the incidences of stillbirth and neonatal mortality were significantly increased at ≥ 5 mg/kg bw/day PFOA. Most neonates in the 10 and 20 mg/kg bw/day groups died within 24 hours of birth. However, postnatal viability was not affected at ≤ 3 mg/kg bw/day PFOA. Growth retardation from birth to weaning at PND 23 was found in the pups in the ≥ 3 mg/kg bw/day groups. Body weights of pups recovered after weaning. Female pups had body weights comparable to those of controls by 6.5 weeks of age while males had body weights comparable to those of controls by 13 weeks of age. Time to eye-opening was significantly delayed in pups in the ≥ 5 mg/kg bw/day dose groups. Time to puberty, as determined by vaginal opening and by time to first oestrus, was not significantly altered in female pups. The authors considered that time to preputial separation was decreased in male pups of treated dams, but the presented data do not support this conclusion, because group mean time to preputial separation increased, rather than decreased, with increasing dose.
The maternal NOAEL was 10 mg/kg bw/day, based on decreased body weight gain at ≥20 mg/kg bw/day.The NOAEL for fetotoxicity was 1 mg/kg bw/day, based on decreased body weight gain at doses of ≥ 3 mg/kg bw/day.
85

The US EPA obtained the following serum PFOA data from the authors of the study:
Table 23: Serum levels of PFOA in female CD-1 mice after receiving daily oral gavage from GD1-17 inclusive
Dose level (mg/kg bw/day) Group mean serum PFOA (µg/mL)1 21.93 40.55 71.9
10 11620 18140 271
Blood was collected from the trunk 24 hours after the last treatment.
White et al. 2007 developmental and female reproductive study in mice
Timed-pregnant CD-1 mice were randomly assigned to one of four groups. The control and GD 1-17 group comprised 14 mice/group while the cohorts dosed on GD 8-17 and GD 12-17 contained 16 mice/group. Mice were individually housed under standard laboratory husbandry conditions and dosed by oral gavage with water vehicle or 5 mg PFOA/kg bw/day. The dose was selected on the grounds that it had previously been shown by Lau et al. (2006) to reduce neonatal body weight gain.
Dams were weighed daily through gestation. Weights and sexes of pups were recorded at birth. Pups were randomly redistributed among the dams within treatment groups, with standardised litter sizes. Dams that delivered fewer than 4 pups were excluded from the rest of the study. Litters were weighed, and average pup body weights calculated, on PNDs 5, 10, and 20. Half of the dams and their litters in each group were randomly selected for termination and necropsy on PND 10. The remaining dams and their litters were terminated and necropsied on PND 20. At necropsy, the fourth and fifth inguinal mammary glands were collected from both dams and female pups. Total RNA was extracted from lactating mammary glands for assessment of gene expression for selected milk proteins. Uteri were collected from dams for counting of implantation sites.
In a separate study, timed-pregnant CD-1 mice, 5/group, were dosed with 0 or 5 mg PFOA/kg body weight/day through GD 1-17 and sacrificed on GD 18 to microscopically evaluate the maternal mammary gland.
PFOA had no effect on maternal body weight, mean number of implantation sites, number of live pups born, or embryonic/fetal loss. All PFOA treatment regimens resulted in decreased mean neonatal body weights, relative to controls. The decreases were 3% for the GD 12-17 group, 7% for the GD 8-17 group, and 12% for the GD 1-17 group, compared to controls. Mean body weights of pups were depressed, relative to those of controls, throughout the lactational period, in a manner directly related to the duration of PFOA treatment. The lack of effect of PFOA on mean number of implantation sites, numbers of live pups born, per cent preimplantation loss or maternal weight gain supports the conclusion that the decreased pup body weights were not due to general maternal toxicity or to an effect on the number of pups born.
86

On PND 10, typically the peak of lactation in mice, dams treated during GD 8-7 and GD 1-17 exhibited significant delays in mammary epithelial differentiation and development scores, compared to controls. Altered differentiation was also apparent in mammary glands of GD 12-17 exposed dams, but the differences were not statistically significant when translated into a score. At PND 20 the mammary glands of control dams exhibited changes associated with involution, which is normal for this stage of lactation in mice, but in all PFOA-treated groups there was a lack of evidence of involution. Histologically, PFOA-exposed glands from dams treated through GD 1-17 and terminated on GD 18 exhibited stunted alveolar development. This is consistent with the differences noted during lactation in the other study being a direct effect of PFOA rather than being secondary to differences in stimulation by pups.
PFOA exposure had no clear or consistent effect on the expression of genes for β-casein, epidermal growth factor, or α-lactalbumin. Lactoferrin was elevated in mammary glands of GD 1-17 dams at PND 10, suggesting that the peak for this protein was delayed, because it is usually highest early and late in lactation. At PND 20, when lactoferrin levels are normally high, all the PFOA-exposed dams had significantly lower lactoferrin expression than the control dams. The lactoferrin expression of the treated dams at PND 20 was similar to that of the control dams at PND 10, consistent with a ten-day delay in mammary gland development.
Mammary gland epithelial branching and longitudinal growth were effectively arrested in all PFOA-exposed female pups on both PND 10 and 20, when compared to controls. Body weight was not a significant covariate for these mammary effects.
In comparison to the usual toxicokinetics of PFOA in mice, the blood PFOA level of treated dams remained unchanged between PND 10 and 20. The authors suggested that the maternal behaviour of grooming the pups, stimulating their micturition and consuming the urine caused continuing maternal exposure to PFOA excreted by the pups. Analysis of pup livers supports this, in that levels of PFOA in pups remained elevated between PND 1 and 10, the time during which pups require maternal stimulation for elimination.
The authors suggested that PPARα agonism may underlie the maternal lactational abnormalities, because overexpression of PPARα due to a keratin 5 promoter has been shown to cause lactation failure and consequent neonatal mortality in mice.
Serum PFOA concentration analysis results were semiquantitative and not useful for modelling purposes, so they are not reported here.
Wolf et al. 2007 and White et al. 2009 developmental, female reproductive and lactational study in mice
Wolf et al. (2007) reported a cross-fostering study and restricted exposure study.
In the cross-fostering study, timed-pregnant CD-1 mice were dosed by oral gavage on GD 1 through 7 with 0, 3 or 5 mg/kg bw/day PFOA. Mice were individually housed under standard laboratory husbandry conditions. There were 48 mice in the vehicle control group, 28 mice in the 3 mg/kg bw/day group and 36 mice in the 5 mg/kg bw/day group. The mice were monitored closely at the time of parturition. The date and time of birth, number of live and dead pups, and number of pups of each sex were recorded, and litters were weighed by sex. As close to birth as possible, litters were cross-fostered to create the following groups:
control pups to control dams control pups to 3 mg/kg bw/day dams control pups to 5 mg/kg bw/day dams
87

pups of 3 mg/kg bw/day dams to control dams pups of 5 mg/kg bw/day dams to control dams pups of 3 mg/kg bw/day dams to other 3 mg/kg bw/day dams pups of 5 mg/kg bw/day dams to other 5 mg/kg bw/day dams
All pups were either cross-fostered or killed for collection of blood and liver; no pups remained with their birth mother. Foster litters comprised 10 pups, with 5 males and 5 females whenever possible.
In the restricted exposure study, 70 timed-pregnant CD-1 mice, housed as for the cross-fostering study, were assigned to treatment groups. The control group, n=12, was dosed by oral gavage with deionised water on GD 7-17. The treated groups were dosed by oral gavage with 5 mg PFOA/kg bw/day on GD 7-17 (n=14), GD 10-17 (n=14), GD 13-17 (n=12), GD 15-17 (n=12) or with 20 mg PFOA/kg bw/day on GD 15-17 (n=6). Mice were closely monitored at parturition, and the date and time of birth, number of live and dead pups, and number of pups of each sex were recorded, and litters were weighed by sex. Litters were culled to 10 pups with equal representation, where possible, of male and female pups.
In both studies, litters were observed daily and weighed on PNDs 1, 2, 3, 4, 7, 10, 14, 17, and 22. Eye-opening and hair growth were monitored. On PND 22, pups were weighed, weaned and separated by sex. After weaning, one male and one female pup from each litter was randomly selected, weighed, and killed for collection of blood serum and liver. Dams were also killed at weaning, with collection of blood serum and livers, and examination of uteri for implantation sites. For recording of postweaning body weights, one pup per sex per litter was randomly selected, and body weights were recorded weekly from PND 29 through to 35 weeks of age for the cross-fostering study and 27 weeks of age for the restricted exposure study.
Treatment with PFOA had no effect on maternal weight, the number of implantation sites or the number of live pups per litter in either study.
In the cross-fostering study, there was an increase in the incidence of prenatal whole litter loss in the maternal mice dosed with 5 mg PFOA/kg bw/d. The birthweights of both male and female pups of dams treated with 5 mg PFOA/kg bw were lower than those of controls. Survival of pups to weaning was decreased only in pups both gestated by and cross-fostered to dams treated with 5 mg PFOA/kg bw. Eye-opening and hair growth were significantly delayed in pups gestated by and cross-fostered to dams treated with 3 mg PFOA/kg bw, pups gestated by dams treated with 5 mg/kg bw but cross-fostered to control dams, and pups gestated by 5 mg/kg bw dams and also cross-fostered to 5 mg/kg bw dams. In general, the delay was progressively more severe with dose and with exposure type, with exposure in utero and through lactation more harmful that in utero exposure alone. PFOA exposure had adverse effects on body weights in the same groups of pups. Weight gain through PND 1-22 was significantly reduced in pups exposed to PFOA in utero and cross-fostered to control dams, and also pups of 5 mg/kg bw dams that were cross-fostered to 5 mg/kg bw dams. Male pups, with the exception of those of 5 mg/kg bw dams that were cross-fostered to 5 mg/kg bw dams, recovered from the body weight deficits within a week of weaning. However, female pups gestated by 5 mg/kg bw/day dams, whether or not they were cross-fostered to other 5 mg/kg bw dams, continued to show body weight deficits as late as PND 85. After PND 85, male pups of females treated with 5 mg PFOA/kg bw showed increased body weights relative to controls, while females had similar body weights to controls.
Control dams that raised pups exposed to PFOA in utero had measurable PFOA in their serum at weaning of the pups, consistent with dams ingesting PFOA while assisting the excretion of wastes by their pups. Pups exposed to PFOA both in utero and through milk had the higher serum PFOA levels than those exposed only in utero or in milk. At weaning, levels
88

in pups exposed only in utero to a given maternal dose were very similar to those in pups exposed only in milk to the same maternal dose.
In the restricted exposure study, pup weight at birth was significantly decreased for male pups, but not for females, in litters exposed from GD 7-17 and 10-17, and those pups exposed to 20 mg PFOA/kg bw on GD 15-17. Survival from birth to PND 22 was significantly decreased only for pups exposed to 20 mg PFOA/kg bw on GD 15-17. Relative liver weights were significantly increased in dams at weaning, with the exception of dams dosed to 5 mg/kg bw on GD 15-17. The increase in relative liver weight was positively associated with total administered dose. PFOA exposure also increased liver weights of pups of both sexes in all exposure groups.
As in the cross-fostering study, delays in eye-opening and hair growth were observed, affecting pups exposed to 5 mg PFOA/kg bw on GD 7-17 and 10-17, and was more severe in the GD 7-17 pups. PFOA exposure significantly reduced body weights of male and female pups on PNDs 1 through to 22. After weaning, male body weights of pups exposed GD 7-17 did not recover to control weights until the pups were 10 weeks old, and male pups exposed GD 10-17 did not recover until the pups were 11 weeks old.
Mean serum PFOA in pups increased with longer durations of prenatal exposure.
The cross-fostering study showed that lactational exposure to PFOA alone did not have detrimental effects on pup growth, development or survival, consistent with interference by PFOA on growth and development of the fetus. Furthermore, the lack of adverse effects in pups only exposed through lactation suggests that PFOA did not have any adverse effects on the maternal behaviour or milk production of the dams.
The study showed that PFOA exposure early in gestation is not required for the development of adverse effects. Serum PFOA data obtained from the study are presented in Tables 24 and 25.
89

Table 24: Serum levels of PFOA in cross-foster dams and male pups at weaning (3 weeks) and in female pups at 3, 6 and 9 weeks of age
Group
Dams at weaning
Male pups3 weeks
Female pups3 weeksa
Female pups 6 weeks
Female pups 9 weeks
n PFOA ng/mL n PFOA ng/mL n PFOA
ng/mL n PFOA ng/mL n PFOA
ng/mLControl dam, control pups 13 24±3b 12 19±5b 13 7±2b 15 2±2b 15 0.6 ± 0.2b
Control dam,3 mg pups (3U) 11 10 047
±1169c 11 9562 ±1067 11 8143±1347 18 996±108 13 292±34
Control dam,5 mg pups (5U) 13 13 797
±1439d 12 11 548 ±1398e 13 8767±909 15 1136±151 15 339±56
3 mg/kg dam,control pups (3L) 11 23 645
±1979 11 8371 ±530 11 9098±1243 14 1195±130 15 317±41
3 mg/kg dam,3 mg pups (3U+L) 12 29 470
±2554 12 18 074 ±2614 12 14 788±1647 16 2063±244f 8 362±75
5 mg/kg dam, control pups(5L) 13 35 231
±3756 13 10 388 ±1306 13 12 430±1494 15 1494±141g 15 324±58
5 mg/kg dam,5 mg pups(5U+L) 12 36 900
±4749 12 24 948 ±4291h 11 22114±3677i 9 4031±377j 4 971±123k
PFOA concentrations are mean ± standard error of the mean.U – in utero exposure; L – lactational exposureaFor female pups, means of all treatments 3>6>9 weeks, p<0.001bFor all groups, control<all PFOA-exposed groups, p<0.001cDams: 3U<3L,5L,3U+L,5U+L, p<0.001dDams: 5U<5L, 3U+L, 5U+L, p<0.001; 5U<3L, p<0.05eMale pups: 3U+L>3L, 5L, p<0.01; 3U+L>3U, p<0.05fFemale pups 6 weeks: 3U+L > 3L, p<0.01; 3U+L > 3U, 5U; p< 0.001gFemale pups 6 weeks: 5L>3U, p< 0.01; 5L> 5U, p <0.05hMale pups: 5U+L > 3L, 5L, 3U, 5U, p<0.001; 5U+L > 3U+L, p<0.05iFemale pups 3 weeks: 5U+L > 3L, 3U, 5U, p < 0.01; 5U+L. 5L, p<0.05jFemale pups, 6 weeks: 5 U+L > 3L, 5L, 3U, 5U, p<0.001; 5U+L > 3U+L, p<0.01kFemale pups, 9 weeks: 5U+L > 3L, 5L, 5U, 3U+L, p<0.05; 5U+L > 3U, p<0.01
Table 25: Serum levels of PFOA in restricted exposure study dams and male pups at weaning (PND22) and female pups at PND22, 29, and 32.
PFOA dose and gestational period
Dams PND22 Male pups PND22
Female pupsa
PND22Female pupsa
PND29Female pupsa
PND32
n PFOA ng/mL n PFOA
ng/mL n PFOA ng/mL n PFOA
ng/mL n PFOA ng/mL
Control GD 7-17 1269b
±12 6 23b
±9 6 21b
±5 10 18b
±6 10 10b
±1
5 mg/kg GD 7-17 1424 843±1840 10 8680c
±1091 12 21894d
±2553 16 6048±500 18 6703
±698
5 mg/kg GD 10-17 1425 643±1686 12 6495
±297 13 8782±840 22 6188
±833 20 6719±687
5 mg/kg GD 13-17 1120 259±2627 10 5364
±673 10 5132±280 9 6287
±761 14 4781±321
5 mg/kg GD 15-17 1216104e
±2312 10 4771±762 9 2764f
±152 11 4448±345 12 2484g
249±
20 mg/kg GD 15-17 553460h
±11024 - - - - - - - -
PFOA concentrations are mean ± standard error of the mean.aFor female pups, means of all treatments within PND: 22>29 and 32, p<0.001bControl < all PFOA-exposed groups p<0.001cMale pups: 5 mg/kg GD7-17 > GD15-17, p<0.01dPND22: GD7-17 > GD10-17, 13-17, 15-17, p<0.001e Dams: 5 mg/kg GD15-17 <GD7-17, 10-17, p<0.05fPND22: GD15-17 < GD 10-17, 13-17, p< 0.001 and p<0.05 respectivelyg GD15-17 < GD7-17, 10-17, 13-17, p <0.001h Dams: 20 mg/kg GD15-17 > all 5 mg/kg exposure groups, p<0.05
90

White et al. 2011 three-generation developmental and female reproductive study in mice
The objective of this study was to investigate the effects of gestational and chronic exposure to PFOA on lactational function of the F1 generation of mice, and the subsequent development of F2 offspring. Timed-pregnant CD-1 mice were housed individually under standard laboratory husbandry conditions, and randomly assigned into five treatment groups.
Three groups were administered 0, 1 or 5 mg/kg bw/day PFOA by oral gavage through GD 1-17. There were 10 mice in the control group, 12 mice in the 1 mg/kg bw/day group and 11 mice in the 5 mg/kg bw/day group. An additional two groups were similarly gavaged daily with 0 (n = 7) or 1 (n = 10) mg/kg bw/day PFOA, but also received 5 ppb PFOA in their drinking water from GD 7 and throughout the study. Their F1 and F2 offspring also received 5 ppb PFOA in their drinking water throughout the study, except during breeding and early gestation of the F1 females in order to avoid administering PFOA to the males. Water was changed weekly, with bottles weighed to determine water consumption. F0 dams were weighed daily throughout gestation. On PND1, pups were weighed and sexed, and redistributed between dams within the same dose group in order to ensure similar numbers and sex ratios between litters in the same dose group. There were between 5 and 7 litters per dose group. Pups were weighed again on PND 10. On PND 22, the F1 pups were weaned, and dams and 1 or 2 female offspring per litter were weighed and then terminated for necropsy. Cohorts of F1 females, 6-8 per dose group, were maintained into adulthood for weighing and necropsy on PND 42 or PND 63. The remaining adult F1 females were bred to control F1 males at 7 to 8 weeks of age, for one night only, on the night of proestrus. Plug-positive females were housed individually and monitored during gestation. On PND 1, F2 pups were weighed, sexed and equalised to 10 pups/litter. F1 dams and 3 female pups from each F2 litter were terminated on either PND 10 or PND 22, while the remaining F2 females, 4 to 8 per dose group, were necropsied on either PND 42 or PND 63.
The lactational challenge experiment was performed with F1 dams and their F2 litters on PND 10. Dams were separated from their litters for 3 hours and then returned to them and allowed to nurse for 30 minutes. The time between returning the dam to the litter and initiating of nursing was recorded to the nearest second. In addition, the weight of the 10-pup litter was determined before nursing and after exactly 30 minutes of nursing, in order to estimate the total volume of milk consumed by the litter. Dams were terminated and necropsied immediately after nursing.
Blood was collected from all mice immediately prior to necropsy, for measurement of serum PFOA. Uteri of F0 and F1 dams were examined for implantation sites, in order to determine postimplantation loss. Mammary glands were collected at necropsies on PND 10 and PND 22, coinciding with peak lactation and weaning respectively. Mammary glands of pups were prepared as whole mounts for assessment of development, while lactating mammary glands of dams were processed to slides and stained with haematoxylin and eosin.
PFOA had no significant effect on gestational weight gain or implantation site numbers in F0 dams. PFOA at 5 mg/kg, but not at 1 mg/kg bw, during gestation had significant adverse effects on number of live pups, prenatal survival, and postnatal survival and growth. Mammary involution at PND 22 was compromised in all F0 dams. Histologically their mammary glands resembled those of control dams at peak lactation. PFOA did not have a consistent effect on body weights, or body weights adjusted for liver weight, in F1 mice between PND 22 and PND 63. Liver:body weight ratios at PND 22 were elevated in F1 females born to dams dosed with 1 or 5 mg/kg PFOA. At PND 42, F1 females born to dams dosed with 5 mg/kg bw/day PFOA during gestation had significantly increased liver:body weight ratios and significantly lower body weights, with and without adjustment for liver weight, but these effects were not evident in F1 females from the same group that were
91

terminated on PND 63. Chronic exposure to 5 ppb PFOA in drinking water did not affect the liver:body weight ratio in F1 mice. Scores for mammary development were significantly reduced in F1 females from all treated groups until at least PND 63.
The number of uterine implants was significantly reduced in F1 dams that had been prenatally exposed to 5 mg/kg bw/day. However, postnatal survival of F2 pups was not affected by prenatal or chronic exposure to PFOA. In the lactational challenge on PND 10, no effect on milk volume or timed nursing behaviour of prenatal or chronic PFOA exposure of F1 dams was observed. Mammary glands of F1 dams from all treatment groups were significantly different, histologically, to those of controls on PND 10, showing reduced secretory alveoli and greater adiposity. On PND 22, involution appeared to be delayed in the 5 mg/kg bw/day group relative to controls. The authors noted that at the time the F1 dams became pregnant, their siblings in all PFOA-exposed groups still exhibited stunted mammary gland development relative to controls. However, the alterations in mammary gland histology were not sufficient to alter F2 body weights.
Developmental mammary gland scores in F2 females did not show any effects of PFOA exposure of their dams. However, by PND 42, in both of the groups chronically exposed to PFOA in drinking water, F2 females had significantly reduced mammary gland development relative to controls.
PFOA altered lactational morphology in dams and altered mammary gland development in their F1 offspring, although these histological changes did not affect growth or survival of F2 pups.
Serum PFOA data obtained from the study are presented in Table 26.
Table 26: Serum PFOA concentrations (ng/mL) over three generations (mean ± SE)
Generation/age Control Control + 5 ppb PFOA in water 1 mg/kg bw
1 mg/kg bw + 5 ppb PFOA in
water5 mg/kg bw
F0 dams at weaning, PND 22 4.0 ± 0.3 74.8 ± 11.3 6658.0 ± 650.5 4772.0 ± 282.4 26 980.0 ± 1288.2
F1 pupsPND 22 0.6 ± 0.3 21.3 ± 2.1 2443.8 ± 256.4 2743.8 ± 129.4 10 045 ± 1125.6PND 42 1.4 ± 0.4 48.98 ± 4.7 609.5 ± 72.2 558.0 ± 55.8 1581.0 ± 245.1PND 63 3.1 ± 0.2 66.2 ± 4.1 210.7 ± 21.9 187.0 ± 24.1 760.3 ± 188.3F1 dams at weaning, PND 22 2.0 ± 0.6 86.9 ± 14.5 9.30 ± 2.6 173.3 ± 36.4 18.7 ± 5.2
F2 pupsPND 22 0.4 ± 0.0 26.6 ± 2.4 4.6 ± 1.2 28.5 ± 3.7 7.8 ± 1.9PND 42 0.7 ± 0.3 57.4 ± 2.9 0.4 ± 0.0 72.8 ± 5.8 0.4 ± 0.0PND 63 1.1 ± 0.4 68.5 ± 9.4 1.1 ± 0.5 69.2 ± 4.3 1.2 ± 0.5
Macon et al. 2011 developmental and female reproductive study in mice
This publication describes two studies: a full gestation exposure study and late gestation and early development study.
In the full gestation exposure study, 52 timed-pregnant CD-1 mice were divided into four treatment groups, 13 mice per group. They were individually housed under standard laboratory husbandry conditions. Each group was dosed by oral gavage from GD 1 through 17 with 0, 0.3, 1.0 or 3.0 mg PFOA/kg bw/day. At parturition, litters were equalised, as far as possible, to 10 pups/litter with equal representation of each sex. One or two pups per dam were weighed and then terminated for necropsy on each of PNDs 7, 14, 21, 28, 42, 63 and 84, with the exception that female pups of control dams were not included on PND 63, in
92

order to ensure sufficient female pups from control dams for necropsy of female pups from control dams on PND 84. The pups were terminated by decapitation with collection of blood for serum PFOA analysis. The contralateral fourth and fifth inguinal mammary glands were removed from female pups and prepared as whole mounts. Dams were terminated on PND 24, and pups separated by sex.
PFOA did not affect the body weights, either absolute or corrected for liver weight, of pups of either sex. Prenatal exposure to PFOA resulted in a dose-related increase in absolute and relative liver weights of pups of both sexes. Notably, on PND 7, relative liver weights of pups of both sexes were significantly higher than those of controls at all doses of PFOA. This effect at 0.3 mg/kg establishes a lower threshold for this effect than previously reported. The effect on liver weights was reversible, and not evident by PND 14 for 0.3 mg/kg bw/day pups, PND 21 for 1.0 mg/kg pups and PND 28 for 3.0 mg/kg pups. Absolute, but not relative, brain weights were significantly lower than those of controls in males prenatally exposed to ≥ 1.0 mg/kg bw/day maternal bw, but not females, at PND 63 but not at other scheduled terminations. Mammary glands of pups prenatally exposed to all dose levels of PFOA showed developmental delays, relative to those of controls, at all doses, and this effect was still evident at PND 84.
Serum concentrations of PFOA were highest at PND 14 for pups in the 1.0 and 3.0 mg/kg groups, but highest on PND 7 in the 0.3 mg/kg bw/day group. The serum concentrations of PFOA were significantly elevated until PND 42 for all treated pups, and to PND 84, the last timepoint at which they were measured, in females in the 1.0 and 3.0 mg/kg groups. Liver was also a significant location of PFOA in prenatally exposed pups, but PFOA levels in brain were substantially lower than those in serum or liver, and data showed that PFOA is more readily eliminated from the brain.
The results of this study show that doses 10- to 30-fold lower than previously investigated are sufficient to impair mammary gland development in CD-1 mice.
The late gestation study was performed in two blocks, with 20 dams in the first block and 32 in the second block. Mice were received on GD 9, divided into four groups of equal size, and dosed by oral gavage, once daily from GD 10 to 17, with 0, 0.01, 0.1 or 1.0 mg /kg bw/day. At birth, litters were equalised within each group, as far as possible, to 7 to 9 pups/dam with 4 to 7 females in each litter. Female pups from at least three litters per treatment group were weighed and then terminated for necropsy on PNDs 1, 4, 7, 14 and 21. Serum was collected at decapitation. Liver was collected and weighed. The contralateral fourth and fifth inguinal mammary glands were prepared as whole mounts.
Prenatal exposure to PFOA had no effect on body weights of pups of either sex. Group mean absolute liver weights in the 1.0 mg/kg bw/day treatment group were significantly increased, relative to those of controls, on PND 4 and PND 7, and relative liver weights in this group were increased for this group from PND 4 through to PND 14 inclusive. Mammary glands of all PFOA-treated female pups exhibited developmental delays which were most evident on PND 21. The effects were dose-related. The highest serum concentrations of PFOA occurred on PND 1, and levels declined thereafter, but were still not reduced to the levels of controls at PND 21, even in the 0.01 mg/kg bw/day group. Serum and calculated blood PFOA burdens were comparable at PND 7 between the pups exposed throughout gestation and the pups exposed only from GD 10. On the other hand, the females exposed to 1.0 mg/kg bw/day PFOA throughout gestation had almost double the serum and calculated blood PFOA burdens at PND 14 and PND 21, when compared to the female pups exposed to the same dose only from GD 10.
Dosimetry data obtained in this study are presented in Tables 27, 28 and 29.
93

Table 27: PFOA dosimetry of female offspring from the full gestation exposure study
PND 7d,e (n) PND 14a,b,c (n) PND 21 (n) PND 28 (n) PND 42 (n) PND 63 (n) PND 84 (n)Serum (ng/mL)
Control < 20, LOQ (5) 12 ± 2 (4) < 20, LOQ (6) < 20, LOQ (3) <10, LOQ (4) - <10, LOQ (2)
0.3 mg/kg 4980 ± 218*** (4) 4535 ± 920*** (6) 1194 ± 394*** (5) 630 ± 162*** (6) 377 ± 81*** (6) 55 ± 17 (3) 16 ± 5 (5)
1.0 mg/kg 11 026 ± 915*** (5) 16 950 ± 3606*** (6) 3770 ± 607*** (5) 1247 ± 208*** (4) 663 ± 185*** (6) 176 ± 85 (2) 71 ± 8* (2)
3.0 mg/kg 20 700 ± 3900*** (2) 26 525± 2446*** (4) 8343 ± 1078*** (3) 4883 ± 1378*** (6) 2058 ± 348*** (4) - 125* (1)
Calculated Blood Burden (ng)
Control 0.3 ± 0.2 (5) 0.5 ± 0.5 (4) 1.0 ± 0.7 (6) 1.7 ± 1.7 (3) 1.5 ± 1.5 (4) - 0.0 ± 0.0 (2)
0.3 mg/kg 762 ± 32*** (4) 1167 ± 206*** (6) 412.3 ± 72.4*** (5) 409.7 ± 103.1*** (6) 306.7 ± 95.8* (6) 46.8 ± 14.1 (3) 15.5 ± 3.9 (5)
1.0 mg/kg 1561 ± 242*** (5) 3729 ± 989*** (6) 1409 ± 173*** (5) 727.2 ± 60.5*** (4) 547.1 ± 127.8** (6) 165.6 ± 77.9 (2) 82.1 ± 3.1 (2)
3.0 mg/kg 2515 ± 731*** (2) 6422 ± 458*** (4) 4038 ± 628*** (3) 3246 ±1080*** (6) 1640.0 ± 211.8** (4) - 131.5 (1)
Liver (ng/g)
Control <35, LOQ (5) <LOQ (4) <LOQ (6) <LOQ (4) <LOQ (4) - <LOQ (2)
0.3 mg/kg 2078 ± 90*** (4) 972 ± 124*** (6) 1188 ± 182*** (5) 678 ± 130*** (6) 342 ± 87** (6) 118 ± 22 (3) 43 ±12 (5)
1.0 mg/kg 8134 ± 740*** (5) 4152 ± 483*** (6) 1939 ± 637*** (5) 2007 ± 560*** (4) 617 ± 145*** (6) 320 ± 113 (5) 55 ± 12 (4)
3.0 mg/kg 16 700 ± 749*** (4) 10 290 ± 1028*** (4) 2339 ± 1241*** (3) 7124 ± 1081*** (6) 1145 ± 274*** (4) 417 ± 160 (2) 235 ± 79** (2)
Brain (ng/g)
Control <35, LOQ (5) <LOQ (4) <LOQ (6) <LOQ (4) <LOQ (4) - <LOQ (2)
0.3 mg/kg 150 ± 26*** (4) 65 ± 12** (6) <LOQ (5) <LOQ (6) <LOQ (6) <LOQ (3) <LOQ (5)
1.0 mg/kg 479 ± 41*** (5) 241 ± 20*** (6) 31± 5 (5) <LOQ (4) <LOQ (6) <LOQ (5) <LOQ (4)
3.0 mg/kg 1594 ± 162*** (4) 650 ± 44*** (4) 133 ± 23*** (3) 62 ± 93*** (6) <LOQ (4) <LOQ (2) <LOQ (2)
Note. PFOA dosimetry data for female pups from the full gestation study. Data presented are mean ± standard error. Dashes (-) signify time points where no measure was taken for a treatment group. Calculated blood burdens were determined by the equation (BW x (58.5/1000) x serum x 0.55). Since calculated blood burdens were log transformed to determine significance and the control value was 0.0, at PND 84 statistical significance could not be determined. LOQ=Limit of Quantitation.Significant treatment effect compared to controls; * p < 0.05, ** p < 0.01, *** p <0.001.a Mean serum concentration of each PFOA-treated group within PND: 14> 21, 21, 42, 63, and 84, p<0.001b Mean calculated blood burden of 0.3 and 1.0 mg/kg group within PND: 14> 21, 28, 42, 63, and 84, p<0.05c Mean calculated blood burden of 3.0 mg/kg group within PND: 14> 42 and 84, p≤0.05d Mean liver concentration of each PFOA-treated group within PND: 7> 14, 21, 28, 42, 63, 84, p<0.01e Mean brain concentration of each PFOA-treated group within PND: 7 > 14, 21, 28, 42, 63, 84, p<0.001
94

Table 28: PFOA dosimetry of male offspring from the full gestation exposure study
PND 7 (n) PND 14 (n) PND 21 (n) PND 28 (n) PND 42 (n) PND 63 (n) PND 84 (n)Serum (ng/mL)
Control < 20, LOQ (1) 2292 ± 2278 (2) - < 20, LOQ (2) < 10, LOQ (2) < 10, LOQ (4) < 10, LOQ (3)
0.3 mg/kg 5940* (1) - 597 (1) - - 74 ± 24 ***(3) 39*** (1)
1.0 mg/kg 11 600* (1) - 2840 (1) 1833± 1217* (2) - 130*** (1) 29*** (1)
3.0 mg/kg 27 050 ± 1550* (2) 23 650 ± 2850 (2) 11 440 ± 1060 (3) - 3245 ± 255*** (2) 118** (1) -
Calculated Blood Burden (ng)
Control 1.1 (1) 600.4 ± 598.0 (2) - 3.0 ± 3.0 (2) 0.0 ± 0.0 (2) < LOQ (4) 2.5 ± 2.5 (3)
0.3 mg/kg 716.7* (1) - 263.2 (1) - - 93.7 ± 29.9 (3) 58.4 (1)
1.0 mg/kg 1642.2* (1) - 1261.0 (1) 1625 ± 1103 (2) - 169.0 (1) 39.2 (1)
3.0 mg/kg 3900.4± 700.6* (2) 5128.5 ± 243.1 (2) 4243.2 ± 505.1 (3) - 3384.8 ± 489.1 (2) 138.2 (1) -
Liver (ng/g)
Control <35, LOQ (1) < LOQ (2) - < LOQ (2) < LOQ (2) < LOQ (4) < LOQ (3)
0.3 mg/kg 2600 ± 490** (2) - 1015 (1) - - 220 ± 67*** (3) 83 (1)
1.0 mg/kg 6490** (1) - 654 (1) 3132 ± 2412* (2) - 406*** (1) 172 ± 97** (2)
3.0 mg/kg 17 450 ± 450** (2) 11 030± 1170*** (2) 3383 ± 562 (3) - 5758 ± 2713** (2) 2384 ± 921*** (2) 421 ± 28*** (3)
Brain (ng/g)
Control <35, LOQ (1) < LOQ (2) - < LOQ (2) < LOQ (2) < LOQ (4) < LOQ (3)
0.3 mg/kg 188 ± 48 (2) - < LOQ (1) - - < LOQ (3) < LOQ (1)
1.0 mg/kg 412 (1) - < LOQ (1) < LOQ (2) - < LOQ (1) < LOQ (2)
3.0 mg/kg 1256 ± 305* (2) 751 ± 61*** (2) 181 ± 20 (3) - 32 ± 7 (2) < LOQ (2) < LOQ (3)
Note. PFOA dosimetry data for male offspring from the full gestation study. Data presented are mean ± standard error. Dashes (-) signify time points where no measure was taken for a treatment group. Calculated blood burdens were determined by the equation (BW x (58.5/1000) x serum x 0.55). Not able to determine statistical significance at PND 21 due to absence of controls. LOQ=Limit of Quantitation.Significant treatment effect compared to controls; * p < 0.05, ** p < 0.01, *** p <0.001.
95

Table 29: PFOA dosimetry of female offspring from the late gestation exposure studyPND 1a (n) PND 4 (n) PND 7 (n) PND 14 (n) PND 21b (n)
Serum (ng/mL)Control 22.6 ± 5.5 (4) 8.6 ± 0.5 (2) 7.8 ± 2.1 (5) 7.8 ± 1.5 (8) 4.1 ± 0.6 (7)
0.01 mg/kg 284.5 ± 21.0* (3) 184.1 ± 12.1* (2) 150.7 ± 20.9* (7) 80.2 ± 13.9* (8) 16.5 ± 2.1* (10)
0.1 mg/kg 2303.5 ± 114.1* (2) - 1277.8 ± 122.6* (8) 645.4 ± 114.2* (7) 131.7 ± 24.5* (7)
1.0 mg/kg 16 305.5 ± 873.5* (7) - 11880.3 ± 1447.6* (11) 6083.7 ± 662.6* (11) 2025.1 ± 281.9* (11)
Calculated Blood Burden (ng)Control 1.3 ± 0.38 (4) 0.9 ± 0.1 (2) 1.5 ± 0.4 (5) 2.7 ± 0.7 (8) 1.2 ± 0.6 (7)
0.01 mg/kg 15.2 ± 1.7* (3) 20.6 ± 0.1* (2) 27.3 ± 3.8* (7) 27.0 ± 4.6* (8) 7.9 ± 1.0* (10)
0.1 mg/kg 114.3 ± 5.4* (2) - 221.7 ± 24.9* (8) 218.5 ± 39.8* (7) 66.4 ± 12.8* (7)
1.0 mg/kg 926.0 ± 47.6* (7) - 1965.9 ± 256.7* (11) 2033.6 ± 293.5* (11) 984.9 ± 142.8* (11)
Note. PFOA dosimetry data for female offspring from late gestation study. Data presented are mean ± standard error. Dashes (-) signify time points where no measure was taken for a treatment group. Calculated blood burdens were determined by the equation (BW x (58.5/1000) x serum x 0.55).
Significant treatment effect compared to controls; * p<0.001.a Mean serum concentration of each PFOA-treated group within PND: 1> 4, 7, 14, and 21, p<0.05b Mean calculated blood burdens of each PFOA-treated group within PND: 21< 7 and 14, p<0.02
Rats
Butenhoff et al. 2004 two-generation developmental and reproductive study in rats
This two-generation study was conducted in Sprague Dawley rats, using AFPO as the test article. Adult rats were housed individually except during mating, and husbandry was according to standard laboratory conditions. The F0 generation consisted of five dosage groups with 30 rats/sex/group. Two F1-generation pups/sex/litter/dosage group were selected at weaning for continued evaluation, making a total 300 F1 rats/sex/group. F0-generation rats were gavaged daily from 6 weeks of age, and for at least 70 days before mating, with 0, 1, 3, 10 or 30 mg/kg bw/day AFPO at a constant volume of 5 mL/kg. The doses were selected on the basis of earlier studies that showed that male rats did not tolerate > 30 mg/kg bw/day AFPO on a subchronic basis. F1 rats were administered the same daily dose as their parents from weaning at 22 days.
Measured endpoints in the F0 and F1 generations were survival, clinical observations, abortions or premature deliveries, and body weights. Feed consumption was also measured, except during cohabitation for mating and from PND 15 to weaning (PND 22) because pups began to eat food provided to the dams from PND 15. Day of vaginal opening or preputial separation was recorded for F1 rats. Following sexual maturation, 30 mating pairs of F1 rats were selected, on a generally random basis although avoiding sibling pairs, and the rest of the F1 rats were terminated and necropsied. For the F1 rats selected for mating, oestrus activity was evaluated by vaginal cytology for 21 days before cohabitation for mating. Reproductive parameters measured or calculated in the F0 and F1 females were duration of gestation, fertility and gestation indices, number and sex of pups, number of implantation sites, condition of dam and litter, viability index, lactation index, per cent survival and sex ratio. F2 pup weights were recorded on PNDs 1, 5, 8, 15 and 22. F2 males were examined on PND 12 for retention of nipples, which would not usually be present on males of that age, and anogenital distance was measured in all pups on PNDs 1 and 22. F0 generation male rats were terminated at 106 – 110 days of age and F1 males at 109-120 days of age. Concentration, mobility and morphology of sperm from the cauda epididymis was assessed at termination, and testicular spermatid concentration was also assessed. Female breeding rats were terminated on PND 22 and implantation sites were counted in uteri. Three randomly selected F1 pups from those culled on PND 22 were examined for gross lesions including assessment for hydrocephaly. Brain, spleen and thymus from these pups were weighed and retained for histological evaluation.
96

F0 and F1 generation dams were terminated when pups were weaned. All F0 and F1 breeding rats were subject to blood collection for PFOA analysis, and full necropsy, and stage of oestrus was assessed by vaginal cytology on day of termination of breeding females. Organ weights recorded included brain, kidneys, spleen, gonads, thymus, liver, adrenal glands, pituitary, uterus, epididymides (separately), prostate and seminal vesicles. Organs fixed and processed for histopathology included pituitary, adrenal glands, vagina, uterus with oviducts, cervix, gonads, seminal vesicles, right epididymis and prostate.
F0 generation
Males in the 30 mg/kg bw/day group in the F0 generation exhibited slight increases in clinical signs of dehydration and lack of grooming. There were no treatment-related clinical observations in the F0 generation females.
Dosing with ≥ 3 mg/kg bw/day AFPO had a dose-related negative effect on body weight gain in F0 generation male rats. This effect reached statistical significance at the day 8 timepoint in 30 mg/kg bw/day males, the day 15 timepoint for 10 mg/kg bw/day males, and the day 50 timepoint for 3 mg/kg bw/day males. Although group mean absolute feed consumption was significantly decreased in 30 mg/kg bw/day males in the F0 generation, group mean feed consumption relative to body weight was increased in males in all treated groups in the F0 generation, and this effect was statistically significant at ≥ 3 mg/kg bw/day. No treatment-related effects on body weight gain or feed consumption were observed in the F0 generation females.
There were no treatment-related gross findings in treated rats of either sex in the F0 generation. Two of ten males in the 10 mg/kg bw/day group, and seven of 10 males in the 30 mg/kg bw/day group, had hypertrophy and/or vacuolation of the adrenal zona glomerulosa. There were no treatment-related microscopic findings in the F0 generation females.
All groups of F0 generation males exhibited a dose-related increase in absolute and relative liver weight, but there was no corresponding effect in females. Other significant differences in group mean organ weights either exhibited no dose-response relationship, or were considered most likely to be a result of the decreased body weights.
There were no treatment-related effects on reproductive performance in the F0 generation rats. Male fertility and sperm parameters were normal. There were no effects on oestrus cycles, conception rate, pregnancy, parturition, number of F1 pups born or whether they were alive or stillborn. Pups of the F1 generation in the 30 mg/kg bw/day group had moderately lower body weights throughout lactation (6-9% lower than those of controls, not statistically significant), and a slightly higher mortality rate in the first few days following weaning. This was seen almost exclusively in pups that were small at weaning and was attributed to a failure to thrive and adapt to being weaned. There were no treatment-related effects on sex ratio of pups, and no evidence of structural malformations or variations.
F1 generation
There was a statistically significant delay in sexual maturation in both male and female pups in the F1 generation in the 30 mg/kg bw/day group. Preputial separation was delayed 3.7 days on average, and vaginal patency was delayed an average of 1.7 days. These delays were considered to be treatment-related. However, when these effects were co-varied with
97

body weight weaning, there was no statistically significant difference in days to milestone, which suggests that the delays were secondary to reduced body weight and body weight gain. Decreased body weight is a well-documented cause of delayed puberty in Sprague Dawley rats. The delays were a transient effect because fertility and reproduction of the affected pups were not affected when they were mature.
F1 male rats treated with ≥ 10 mg/kg bw/day AFPO had increased incidence of emaciation, urine-stained abdominal fur, and decreased motor activity, and F1 male rats in the 30 mg/kg bw/day group had increased incidence of abdominal distension. However, there were no treatment-related clinical observations in the F1 females at any APFO dose level.
Statistically significant decreases in body weight and body weight gain occurred in F1 males in the 30 mg/kg bw/day group during both the juvenile (weaning to 35 days) and peripubertal (55-60 days of age), and a corresponding decrease in body weight gain in the 10 mg/kg bw/day males developed at the end of the peripubertal period. In the adult F1 males, all treated groups exhibited significantly decreased mean body weight by termination, although the decreases were < 10% in the ≤ 3 mg/kg bw/day groups. In female F1 rats, a dose-related lower group mean body weight, relative to that of controls, was evident only in the 30 mg/kg bw/day group, in which it was first noted at the peripubertal timepoint (15 days postweaning; approximate age 35 days), and group mean body weight of this group remained significantly lower than that of controls throughout most of gestation and lactation, through to terminal body weight at weaning.
There were no treatment-related gross findings in the F1 females at necropsy, but the males in the ≥ 3 mg/kg bw/day APFO groups had hepatic discolouration that correlated with hepatocellular hypertrophy and focal to multifocal hepatocellular necrosis. The incidence of these findings increased between 3 and 10 mg/kg bw/day (6/60 vs 10/60), but not between 10 and 30 mg/kg bw/day (10/60 vs 9/60). Grade of severity was not reported. There was a dose-related increased in absolute and relative liver weight at all dose levels in F1 males in all treated groups, similar in magnitude to the same finding in F0 generation males, but no corresponding effect was found in F1 females. Other apparent changes in organ weights in the males were attributable to lower body weight. Hypertrophy and vacuolation of the adrenal zona glomerulosa was present in most (7/10) F1 males in the 30 mg/kg bw/day group, but no similar lesions were observed in the 10 mg/kg bw/day group, which was in contrast to the F0 generation. F1 females treated with ≥ 3 mg/kg bw/day AFPO had group mean pituitary weights that were statistically lower than those of controls, but this was not considered to be a treatment-related effect because differences were slight, individual values remained within normal range, there were no histological correlates, and there was no evidence of similar effects in males of any generation or in F0 generation females.
As in the F0 generation, there were no treatment-related effects on reproductive performance of either sex in the F1 generation rats. Female rats in the 30 mg/kg bw/day group had a slight but statistically significant increase in the mean number of complete oestrus cycles per 21 days, but there was a lack of correlating evidence to suggest that this was other than incidental. As for the previous generation, pups in the 30 mg/kg bw/day group tended to have slightly to lower (6 to 9%) body weights than controls, but the differences were not statistically significant, and there was no increase in mortality during or after the lactation period in F2 pups.
In discussing the results, the authors noted that the sexually mature male rats were more sensitive to negative effects of AFPO on body weight than the sexually immature males in the same dose group, and that this is consistent with a testosterone-mediated reduction in renal clearance rate of AFPO that has been demonstrated in other studies. Other studies were cited that show that castration of male rats greatly increases the rate of urinary excretion of PFOA, and that PFOA clearance is decreased in castrated male rats, and in
98

female rats, by treatment with testosterone. The current study supports the conclusion that sexually immature male rats have AFPO elimination kinetics closer to those of females than those of intact males. The authors further cited studies that have demonstrated that intact, sexually mature male rats have a much lower level of expression of the organic anion transporter protein OAT 2 than female rats.
The cellular hypertrophy and vacuolation noted in the zona glomerulosa of adrenal glands in male rats in the 30 mg/kg bw/day group and, in the F0 generation, the 10 mg/kg bw/day group, was a novel finding not previously reported in rats treated with AFPO. The pathogenesis of this lesion is unknown. The authors noted that the same lesions have been observed in rats treated with the hypolipidaemic drug nafenopin, which is also a peroxisome proliferator.
A NOAEL for parental toxicity was not observed because all dose levels were associated with significantly decreased body weight in F1 males. The reproductive NOAEL was >30 mg/kg bw/day. The offspring NOAEL was 10 mg/kg bw/day based on pup mortality and decreased body weight and delayed sexual maturation at higher doses.
Group mean serum PFOA concentrations are presented in Table 30.
Table 30: Group mean PFOA concentrations of F0 and F1 generation rats at termination, 24 h after last dose
Dose level (mg/kg bw/day) Males Females0 0.034 ± 0.015 mg/mL < 0.005 ppm
10 51.5 ± 9.3 mg/mL 0.37 ± 0.08 ppm30 45.3 ± 12.6 mg/mL 1.02 ± 0.43 ppm
Special toxicity studies
Immunotoxicity
DeWitt et al. 2008 immunotoxicity study in female mice
The studies reported in this paper were conducted on young adult female mice that were group-housed, 8/cage, under standard laboratory husbandry conditions. The authors state that there were 40 mice ‘per endpoint’ although it is not clear from the paper what is meant by endpoints.
The ‘recovery study’ was conducted using C57BL/6J mice and included three groups of mice. The control group was dosed daily by oral gavage for 15 days with the vehicle control, which was water. One treatment group was dosed with 30 mg/kg bw/day PFOA by oral gavage for 15 days, while the other treatment group was dosed with 30 mg/kg bw/day PFOA by oral gavage for 10 days and then dosed with water for five days. On day 11 of dosing, 16 mice/ group were immunised by intravenous (iv) injection of 4.0 x 10⁷ SRBC. Five days later, eight of the immunised mice were exsanguinated with collection of blood for measurement of SRBC-specific IgM and serum PFOA concentration. Two weeks after immunisation the remaining 8 mice/dose were given a booster immunisation of SRBC, and terminated 5 days later with blood collection for measurement of SRBC-specific immunoglobulin G (IgG) and serum PFOA concentration. Relative serum titres of SRBC-specific IgM and IgG antibodies were measured by ELISA. After termination of mice for collection of blood for measurement of IgM or IgG, spleen and thymus were removed from each mouse and weighed. A further 8 mice/ group were sensitised on day 11 of dosing by subcutaneous injection of bovine serum albumin (BSA) in Freund’s complete adjuvant, in order to measure delayed-type
99

hypersensitivity (DTH) response. After a further 7 days mice were anaesthetised and challenged by injection of heat-aggregated BSA into the right rear footpad, while the left rear footpad was injected with the same volume of saline to serve as control. Footpad thickness was measured 24 hours later.
The dose-response studies were conducted using C57BL/6N mice, and both dose-response studies were performed in duplicate. For the first dose-response study, mice were provided drinking water for 15 days containing 0, 25, 50, 100 or 200 mg PFOA/L, to provide doses of 0, 3.75, 7.5, 15 or 30 mg/kg bw/day, based on anticipated water consumption. Stability of the PFOA in drinking water was confirmed. Water consumption/week, based on changes in the weights of bottles, was determined on a per cage basis. The same interventions for determination of IgM response, IgG response, DTH response and changes in lymphoid tissue weights were conducted in this study as in the recovery study. The second dose-response study was the same as the first in all respects except the concentrations of the dosing solutions, which were 0, 6.25, 12.5, 25 and 50 mg/L drinking water, to provide an intended intake of 0, 0.94, 1.88, 3.75 or 7.5 mg/kg bw/day.
From day 8 to day 11 of gavage dosing, mice gavaged with 30 mg /kg bw/day had body weights that were on average 8% lower than those of controls, but mice in the recovery cohort (dosed with PFOA for 10 days followed by water for 5 days) had body weights comparable to those of control mice two days after PFOA dosing ended. In contrast, mice dosed with 30 mg/kg PFOA for 15 days (the ‘constant group’) had a mean body weight 10.5% lower than that of controls on the last day of dosing. This difference disappeared 15 days after the end of dosing. Relative liver weights of mice gavaged with PFOA showed a mean increase of 64% over those of controls one day after exposure ended, and a 54% increase 15 days after dosing ended. Group mean spleen and thymus weights of the mice in the constant group were 48% and 79% lower, respectively, than those of controls, while those of mice in the recovery group were 24% and 36% lower, respectively. SRBC-specific IgM titres were significantly reduced by nearly 20% in both the constant and recovery groups, compared to controls, but in contrast, SRBC-specific IgG titres were not significantly different to those of controls.
The addition of PFOA to drinking water did not affect water consumption on a per cage basis in either of the dose-response studies. Group mean body weight was decreased in groups drinking ≥ 15 mg /kg bw/day although recovery of this effect was rapid (<8 days) even at 30 mg/kg bw/day PFOA. Relative liver weights were elevated in all treated groups (≥ 3.75 mg/kg bw/day) in the first dose-response study and this difference was still present 15 days after the end of dosing. Absolute and relative spleen weights were significantly decreased in mice consuming ≥ 15 mg /kg bw/day, but these effects were reversible within 15 days. Absolute thymus weight 15 days after dosing ended was higher in the 15 mg/kg bw/day group than in controls. All doses in the first dose-response study (≥ 3.75 mg/kg bw/day) reduced SRBC-specific IgM titres, but none of the doses was associated with a decrease in SRBC-specific IgG titre. On the contrary, mice in the 3.75 and 7.5 mg/kg bw/day groups had moderately (13%) higher IgG titres than controls. No effect on DTH response was observed in the first dose-response study.
In the second dose-response study, in which lower doses (0.94 to 7.5 mg/kg bw/day) were used, there were no treatment-related effects on water consumption, body weight, SRBC-specific IgG response or DTH response. Group mean absolute and relative spleen weights were decreased at a PFOA dose ≥ 3.75 mg/kg bw/day, although this effect was reversed within 15 days of the end of dosing. Exposure to ≥ 3.75 mg/kg bw/day was also associated with reduced SRBC-specific IgM titres. Thus, the NOAEL for decreased spleen weight and decreased IgM response was 1.88 mg/kg bw/day.
Drew and Hagen (2016), in a review of PFAS-induced immunotoxicity commissioned by
100

FSANZ, concluded that it is inappropriate to use the NOAEL of 1.88 mg/kg/day identified in the DeWitt (2008) study for quantitative risk assessment as insufficient information is available to determine the serum concentrations in animals associated with this dose, and if they are at steady-state. Another limitation of the study is that the decrease in IgM response recorded at the LOAEL, 3.75 mg/kg bw/day, was only 7% lower than that of controls, and the same as that observed at double that dose, 7.5 mg/kg bw/day. Thus there was no dose-response relationship evident at ≤ 7.5 mg/kg bw/day and it is possible that the apparent 7% decrease in IgM response at 3.75 and 7.5 mg/kg bw/day was not treatment-related but reflected normal biological variation.
3.3.4 Human data
Although there are a number of epidemiological studies of human populations exposed to PFOA, evidence of significant risk is scant and frequently contradictory. Study populations have included occupationally exposed workers at 3M or DuPont, the major manufacturers of PFASs, communities with high exposure due to proximity to PFAS production plants, populations exposed to PFASs through contamination of drinking water by leakages from production plants, and general populations, for example through the US National Health and Nutrition Examination Survey (NHANES) database. Human epidemiological studies are frequently complicated by exposure to more than one PFAS.
Blood levels of PFAS of occupationally exposed workers are 2 to 3 orders of magnitude (100 – 1000 fold) higher than those of the general population, with levels in highly exposed subpopulations intermediate between the two. Serum levels of PFOA in occupationally exposed workers are generally in the range of 1 to 2 µg/mL. Serum levels of PFOA in people consuming contaminated drinking water near a production plant in the USA in 2004-2005 averaged 0.423 µg/mL. In contrast, in the same years the mean serum level in the US population was 0.00392 µg/mL.
Because of uncertainties around levels and durations of exposure, no international regulatory agency or body has found human toxicity data useful for the determination of a HBGV. A summary of the major findings and interpretation of human studies previously reviewed by ATSDR, EFSA and the US EPA is provided below. A detailed consideration of individual epidemiological studies is beyond the scope of this review.
Endocrine effects
Some studies have suggested a positive association between serum PFOA and elevated thyroxine levels, but others have found no association (based on Knox et al. 2011a, presented in Bull et al. 2014). Results of three large studies support an association between PFOA exposure and risk of thyroid disease in women or children, but not in men. Associations between PFOA and TSH have been reported in pregnant women with anti-TPO antibodies. However, no association has been found between PFOA and TSH in people without diagnosed thyroid disease (reviewed by US EPA 2016).
Evidence for increased risk of diabetes mellitus as a result of exposure to PFOA is equivocal (based on data from Lin et al. 2009 and MacNeil et al. 2009, presented in Bull et al. 2014).
There is some evidence of a dose-related increase in estradiol, but this is confounded by body mass index. Analysis of NHANES data suggested that PFOA exposure may be associated with an increased risk of hysterectomy, and advance the onset of menopause (based on data from Taylor et al. 2013 and Knox et al. 2011b presented in Bull et al. 2014).
101
Serum lipids
A positive association between PFOA and serum levels of cholesterol and triglycerides has been found in some studies but not in others (reviewed by EFSA 2008). The ATSDR (2015) concluded that the association between serum PFOA and increased serum lipid levels is a consistent finding. The US EPA (2016) concluded that evidence for a positive association between serum PFOA and serum total cholesterol and LDL, but not HDL, are relatively consistent and robust, and they note that similar results have been found for PFOS.
FSANZ considered that studies in both adults and children suggest a positive association between total and LDL cholesterol and PFOA concentration at very low concentrations of PFOA but not at higher concentrations (Appendix 2). At around 25 ng/mL, total cholesterol is about 0.2-0.3 mmol/ higher than the lowest groups in the studies and then the association plateaus. The quantitative results from pregnant women are more inconsistent, but this may be related to haemostatic changes during pregnancy. There appears to be little or no association with HDL cholesterol, and not all studies have adverse findings. The few longitudinal data that are available do not contradict the findings in the cross-sectional studies. However, the results in humans do contradict the findings in animals because increased PFAS concentrations in animals decrease total cholesterol.
Fertility, pregnancy and lactation
There is no consistent evidence of negative effects of PFOA on sperm quality, sperm DNA integrity or other factors of male fertility. Some studies have reported an association between maternal PFOA exposure and increased time to pregnancy, but other studies have not found this association, and one study found that primipara were not affected whereas multipara were affected (based on human data on reproductive outcomes presented in Bull et al. 2014).
A positive association with gestational diabetes was found in one study (reviewed by US EPA 2016).
A positive association with gestational hypertension/pre-eclampsia has been found in some studies (data from Darrow et al. 2013 presented in Bull et al. 2014, reviewed by US EPA 2016) and a number of studies have found an association between PFOA exposure and low birth weight, while others did not find a statistically significant effect. The apparent effect may be confounded by low GFR which is known to adversely affect birth weight and which would also lead to increased serum PFOA levels (reviewed by US EPA 2016). This could also be the basis for the apparent association with gestational hypertension/pre-eclampsia, in which GFR is reduced. The US EPA (2016) concluded that a direct effect of PFOA on birth weight for the general population could not be ruled out.
No association between PFOA exposure and risk of congenital abnormalities or with complications of labour has been found (data from by Nolan et al. 2010 reported Bull et al. 2014).
An association between PFOA exposure and significant reduction in the duration of breastfeeding was reported in one study (Fei et al. 2010b study reported in Bull et al. 2014).
FSANZ has reviewed the evidence for an association between PFOA or PFOS and birthweight. There were two systematic reviews of PFOA and FSANZ has updated these reviews by replicating one of the search strategies in PubMed to find more recently published studies (Appendix 1). A number of inconsistencies in the analysis and presentation of data were identified, for example, data were typically log transformed, using either base 10 or natural logarithms, suggesting that the association was not linear, but most authors did not
102

describe examining regression diagnostics to determine if the transformation was appropriate. Some authors also presented results for linear or categorical analyses, but generally did not comment on which was the best fit for the data. It was noted that some papers stated that there was no association but did not provide usable data describing this. One systematic review conducted a quantitative meta-analysis that assumed that the relationship between PFOA and birthweight was linear, although this assumption was not justified or explained by the authors. FSANZ has identified and added additional studies to the above-mentioned meta-analysis. As a result of including these studies, the effect of PFOA on birthweight was reduced. Most of the studies included in the meta-analysis examined populations with PFOA concentrations <20 ng/mL. The other systematic review did not conduct a meta-analysis.
Neither of the systematic reviews considered how the results of studies that they excluded owing to data format problems, would have affected their conclusion. However, in the case of PFOA, FSANZ is of the opinion that these excluded studies reflect the range of results shown in the meta-analysis. Most studies examined associations for PFOA and PFOS separately and did not conduct a mutually-adjusted analysis despite often noting a substantial correlation between PFOA and PFOS. Overall the results show a steep decline in birthweight at low blood concentrations of PFAS, which levelled off to a plateau or near-plateau at higher concentrations. The mechanism by which PFASs could lead to such a dose-response curve is not clear.
FSANZ notes that the concentration in blood in the human studies described above is approximately 1,000-fold lower than that found in animal studies showing an effect on birthweight. It is not certain whether the association observed reflects a causal relationship between PFAS and birthweight or is the result of a third factor. For example, Verner et al. (2015) suggest that both would be affected by the changes in GFR that occur during pregnancy.
In summary, FSANZ has found that overall the studies with numerical data report an association between blood PFAS concentration and decreased birth weight. Missing quantitative data from studies reporting no effect raises the possibility of selective reporting or publication bias affecting the body of evidence. The shape of the association is not clear. It is not possible to determine whether the association reflects a causal relationship or is the result of a third factor that alters both PFAS concentration and birthweight, or may have been verstated owing to selective reporting or publication.
Effects on offspring of PFOA-exposed parents
Two studies reported that attention deficit hyperactivity disorder (ADHD) as reported by parents, was positively associated with prenatal exposure to PFOA (reviewed by US EPA 2016), but two other studies did not identify such an association (reviewed by EFSA 2008).
Assessment of anthropometry of offspring at 20 years revealed a positive association between in utero PFOA exposure and higher body mass index (BMI) and waist circumference in women but not in men. The women also had significant elevations in insulin, leptin and adiponectin (data from Halldorsson et al. 2012 reported in Bull et al. 2014).
Evidence that prenatal PFOA exposure affects age at menarche is equivocal (data from Christensen et al. (2011) and Lopez-Espinosa et al. 2011, reported in Bull et al. 2014, reviewed by US EPA 2016).
One study reported that prenatal PFOA exposure was associated with decreased semen
103

quality, sperm count, and sperm morphology, as well as increases in LH and FSH, in male offspring (Data from Vested et al. 2013, reported in Bull et al. 2014).
104

Immune function
There is some evidence of an association between serum PFOA levels and failure of adequate antibody response in children to vaccinations against diphtheria and against tetanus (Grandjean et al. 2012 as reported in Bull et al. 2014, reviewed by US EPA 2016). However, the data are not sufficient to establish a causal relationship between PFOA exposure and clinical relevant impairment of vaccine response (Drew and Hagen 2016).
Cardiovascular disease
There is a lack of consistent evidence that PFOA is associated with increased risk of cardiovascular disease (reviewed by EFSA 2008)
Cancer
EFSA (2008) concluded that epidemiological studies in PFOA exposed workers do not indicate an increased cancer risk.
A weak association between PFOA exposure and prostate cancer was reported in one retrospective cohort mortality study of occupationally exposed workers, but was not found in an update to the study. However, the exposure categories were changed between the original study and the update, making it difficult to compare the two. A study in Denmark found no association between PFOA exposure and prostate cancer (reviewed by EFSA 2008).
A study of residents living near a Teflon manufacturing plant reported a positive association between PFOA exposure and increased risk of kidney cancer and non-Hodgkin lymphoma (data from Vierira et al. 2013 presented in Bull et al. 2014).
A Danish study found no association between PFOA exposure and pancreatic cancer (reviewed by EFSA 2008).
An apparent association with risk of mesothelioma in one study of occupationally exposed workers probably reflected exposure to asbestos (data from Steenland and Woskie 2012 presented in Bull et al. 2014).
ATSDR (2015) considered that results of a number of studies reporting increases in cancer risk should be interpreted cautiously, because most studies did not control for confounding variables such as smoking. The ATSDR also noted the lack of consistency of results between epidemiological studies and considered that the actual number of cancer cases was low, and a causative relationship cannot be established.
The US EPA (2016) concluded that there is ‘suggestive evidence of carcinogenic potential’ of PFOA. This was based on an association of serum PFOA with kidney and testicular tumours among highly exposed members of the general population. However, two occupational cohorts in Minnesota and West Virginia did not support an increased risk of kidney or testicular cancer. A number of studies of the general population have found no association between PFOA exposure and risk of colorectal, breast, prostate, bladder or liver cancer (reviewed by US EPA 2016).
IARC (2016) concluded that there is limited evidence in humans for the carcinogenicity of PFOA, based on positive associations observed for kidney and testicular cancers in a high-exposure community setting. It was noted that for testicular cancers the evidence was based on small numbers, and for cancer of the kidney, chance, bias and confounding could not be
105

ruled out with reasonable confidence.
Other effects
No consistent associations have been reported between serum PFOA levels and abnormal haematology findings, indicators of metabolic syndrome, memory loss or senility. Various epidemiological studies have found an association between PFOA and increased risk of hyperuricaemia, incidence of ulcerative colitis, risk of osteoarthritis, risk of childhood asthma, and risk of moderate/severe endometriosis. Findings on kidney disease are conflicting (based on data presented on human epidemiology data detailed in Bull et al. 2014) and might reflect reverse causation (i.e. declining kidney function may result in increased PFOA levels).
Bull et al. (2014) concluded that there was no consistent association between serum PFOA levels and impairment of liver function, but the US EPA (2016) concluded that PFOA has the potential to affect human liver function. The ATSDR (2015) concluded that there were consistent findings of an association between serum PFOA and alterations in biomarkers of liver damage. The ATSDR reached the same conclusion concerning increases in uric acid levels.
The US EPA (2016) noted that the C8 Science Panel concluded in 2012 that links between PFOA exposure and ulcerative colitis, high cholesterol, gestational hypertension and thyroid disease were ‘probable’ but that there was no probable link between PFOA exposure and birth defects, autoimmune diseases, type II diabetes, hypertension, coronary artery disease, infectious disease, liver disease, Parkinson’s disease, osteoarthritis, ADHD or other neurodevelopmental disorders in children, miscarriage, stillbirth, kidney disease, stroke, asthma, chronic obstructive pulmonary disease (COPD), preterm birth or low birth weight.
3.4 Discussion and conclusions PFOA
PFOA is highly persistent in human beings, with an elimination half-life measured in years. This persistence gives rise to some concern, although PFOA appears to have few adverse effects. Toxic mechanism(s) in humans are unclear, but epidemiological evidence suggests that PFOA may be positively associated with serum levels of cholesterol, LDL, and serum triglycerides. PFOA may also be positively associated with risk of gestational hypertension, and with a risk of decreased birth weight. Evidence of other effects, including associations with cancers, is inconsistent and equivocal. FSANZ has identified a number of deficiencies in the available epidemiological studies and meta-analysis. It is noted that gestational hypertension is a known risk factor for decreased birth weight, and also decreases GFR, which would lead to decreased renal excretion of PFOA.
The positive association of PFOA with elevated levels of cholesterol and triglycerides in the circulation in human beings are inconsistent with findings in experimental animals, and are also the reverse of those that would generally be expected of a PPARα agonist. Fibrates including gemfibrozil, bezafibrate and fenofibrate are PPARα agonists that are prescribed to lower cholesterol and decrease plasma triglycerides, and experimental evidence links these therapeutic effects with their PPARα agonism (Yu et al. 2015). It is noteworthy that there is an inverse correlation between serum LDL cholesterol and GFR, and that it has been suggested that LDL cholesterol reduces GFR by impairing the function of renal arterioles and capillaries (Morita et al. 2010).
Modelling of the toxicity of PFOA in animal species is complicated by two major factors. The first of these is the interspecies variation in toxicokinetics. The elimination half-life of PFOA is estimated to be a matter of hours in female rats, and days in male rats and in monkeys, but years in human beings. The interspecies differences may be a result of differences in
106

expression of renal organic anion transporters. There is also evidence that biliary excretion, with extensive enterohepatic cycling which would prolong the persistence of PFOA in the body, may be an important route in primates but not in rodents.
The second complicating factor is that PFOA is a PPARα agonist; that is, it induces peroxisome proliferation. PPARα agonists typically cause hepatocellular hypertrophy and markedly increased liver weight in rodents, although primates are refractory to this response. Increased liver weight in rodents in response to a PPARα agonist, in the absence of hepatocellular degeneration or necrosis, is usually regarded as an adaptive response and not predictive of human toxicity (Hall et al. 2012). FSANZ has not interpreted increase in absolute and/or relative liver weight in rodents, in the absence of hepatocellular degeneration or necrosis, as an adverse effect for the purpose of identifying a NOAEL or LOAEL.
Similarly, FSANZ has not interpreted increased absolute liver weight in a small number of monkeys (Butenhoff et al. 2002) as an adverse effect because there was no significant effect on relative liver weight, and no histological evidence of hepatocellular hypertrophy or liver lesions. Consequently the NOAELs and LOAELs identified by FSANZ for some studies differ from those of regulatory agencies that identify increased liver weight as an adverse effect.
Developmental and reproductive toxicology studies of PFOA in rats and mice are available. Overall, the studies support the conclusion that PFOA may exert adverse effects on prenatally exposed pups at dose levels that do not cause maternal toxicity. The two-generation study in rats of Butenhoff et al. (2004) did not identify reproductive or developmental effects distinct from the effects observed in general toxicity studies, that is effects on body weight and the liver, but prenatally exposed pups exhibited these effects at dose levels that did not affect their dams. The mouse studies of White et al. (2007, 2011) and Macon et al. (2011) shared a number of co-authors, and identified treatment-related effects on whole litter loss, pup body weights and fecundity of prenatally exposed females, at dose levels that did not cause maternal toxicity. The most sensitive endpoints identified in these studies were changes in mammary gland maturation. However, the relevance of these findings, in the absence of any postlactational PFOA exposure or any apparent impairment of lactation, is uncertain, especially as it relates to humans. Mammary gland maturation is not a conventional endpoint in toxicology studies, and historical control data are therefore not available. For these reasons FSANZ has not considered this endpoint for the purpose of establishing a HBGV.
Most adverse effects on mouse pups in the Lau et al. (2006) study occurred at dose levels greater than the maternal NOAEL; that is, in the presence of maternal toxicity. However, an adverse effect on growth rate of pups prior to weaning occurred at doses lower than the maternal NOAEL, and some developmental effects on ossification and cardiac development occurred at the maternal NOAEL. FSANZ reached a different conclusion regarding the developmental NOAEL in mice than the authors of the Lau et al. (2006) study, due to the lack of a dose-response relationship in the purported accelerated preputial separation. FSANZ notes that preputial separation is not an endpoint usually determined in mice.
The NTP (2016) has concluded that PFOA and PFOS are presumed to be immune hazards in humans. Mouse studies indicate that PFOA may cause atrophy and changed cellularity in immune system organs of mice, and at lower doses may suppress humoral responses to antigens. Data from animal studies are not sufficiently robust for use in quantitative human risk assessment. Furthermore, currently available epidemiology data are insufficient to establish a cause and effect relationship between PFOA exposure and clinically relevant immunomodulatory effects in humans (Drew and Hagen 2016).
Various regulatory agencies have calculated HBGVs for PFOA using different approaches.
107

Consequently, although the same animal studies were used by different agencies, the HBGVs vary by orders of magnitude. Because of the considerable interspecies differences in pharmacokinetics, FSANZ considers it appropriate to correct for these using PBPK modelling and basing a HBGV on serum concentration as an index of internal dose. The PBPK modelling approach for PFOA is the same as that employed for PFOS; see Section 2.5.
3.5 Derivation of the TDI for PFOA
Studies identified as suitable for derivation of a HBGV were the cynomolgus monkey study of Butenhoff et al. (2002), the rat study of Perkins et al. (2004), and the mouse developmental study of Lau et al. (2006). All of these studies included serum PFOA data, so that pharmacokinetic modelling could be conducted to derive HEDs. The NOAEL for each study was identified by examination of the available data, disregarding effects considered to be adaptive (liver hypertrophy in the absence of hepatocellular degeneration or necrosis), and those for which there was no dose-response effect evident (preputial opening in pups in the Lau et al. 2006 study).
HEDs were derived from the serum values (Table 31), according to the approach previously described for PFOS (see Section 2.5). The lowest candidate TDI, derived from the NOAEL for fetal toxicity of the Lau et al. (2006) mouse developmental and reproductive study, is 160 ng/kg bw/day.
Table 31: HEDs derived from the modelled animal average PFOA serum concentrations
Study Dosing duration (days)
NOAEL (mg/kg bw/day)
NOAEL (Average serum
concentration [μg/mL])
HED (mg/kg bw/day)
Butenhoff et al. 2002;Monkey 182 10 101 0.014
Perkins et al. 2004;Rat 91 1.94 93.9 0.013
Lau et al. 2006(fetal toxicity);Mouse
17 1 35.1 0.0049
Lau et al. 2006 (maternal toxicity);Mouse
17 10 197 0.0276
The derived candidate TDI values are shown in Table 32.
Table 32: Candidate HBGVs for PFOA
Point of departure Value (mg/kg/day) UFH UFA UFtotal
Candidate TDI (mg/kg/day)
HEDNOAEL Butenhoff
monkey 0.014 10 3 30 0.00047
HEDNOAEL Perkins
rat 0.013 10 3 30 0.00043
HEDNOAEL Lau
mouse, fetoxicity 0.0049 10 3 30 0.00016
HEDNOAEL Lau
mouse, maternal 0.0276 10 3 30 0.00092
UFH=uncertainty factor for intraspecies variability
UFA= uncertainty factor for interspecies variability
108

4 Hazard assessment PFHxS
4.1 Introduction
4.1.1 Overview Perfluorohexane sulfonate
Perfluorohexane sulfonate, CAS number 355-46-4, is a completely fluorinated organic acid. PFHxS and its salts have the ability to repel both oil and water which has led to its use for a variety of purposes including as a component in aqueous firefighting foam and surface coatings for paper, cardboard and cookware (ATDSR, 2015). PFHxS may occur in food as a result of contamination of plants and animals and/or transfer from food-packaging materials or cookware.
The IUPAC name for PFHxS is 1,1,2,2,3,3,4,4,5,5,6,6,-tridecadecafluorosulphonic acid. Synonyms for PFOS include C6 sulfonate, Perfluorohexane-1-sulphonic acid, 1,1,2,2,3,3,4,4,5,5,6,6,-tridecadecafluorohexane-1-sulphonic acid. A number of toxicological studies on PFHxS have been conducted in experimental animals using the potassium salt, potassium perfluorohexane sulfonate or K+PFHxS. The CAS number of K+PFHxS is 3871-99-6.
4.1.1.1 Chemical structure
PFHxS has the empirical formula C6HF13O3S, and a molecular mass of 400.12 g/mol. Its structure is illustrated as:
4.1.1.2 Chemistry and physicochemical properties
Appearance: White crystalline powderMelting point: No dataBoiling point: 114.70CDensity: 1.84 g/mLWater solubility: “slightly soluble”Organic solvent solubility: No dataLog Kow: Not measurablepKa: 0.14
4.2 Summary of International hazard reviews of PFHxS
In contrast to PFOA and PFOS, HBGVs for PFHxS have not generally been established by international regulatory agencies. This is likely to be due to a lack of sufficient toxicological information to conduct an assessment. Nevertheless, PFHxS has, on occasion, been considered as a part of consideration of other PFASs. A summary of those considerations is provided below.
109

Swedish EPA, 2012
The Swedish EPA assessed the human and environmental risks of a number of PFASs. For PFHxS, this assessment principally relied on information contained within the 2009 ATSDR draft toxicological profile, although some additional information was also considered.
The PODs selected by the Swedish EPA for PFHxS were selected from a single reproductive/developmental toxicity study in male and female rats (Hoberman and York 2003 and Butenhoff et al. 2009):
hepatotoxicity (rat, subacute exposure, NOAEL, hepatocellular hypertrophy/increased liver weight): 1 mg/kg bw/day, 89 µg/mL serum, 150 µg/g liver
reproductive toxicity (rat, no effects): >10 mg/kg/bw/day, > 60 µg/mL serum, 17µg/g liver
other endpoints (rat, subacute exposure, LOAEL, haematological effects): 0.3 mg/kg bw/day, 44 µg/mL serum, 44 µg/g liver
The Swedish EPA used the PODs to establish DNELs according to REACH guidelines, by dividing the PODs with the following AFs, as applicable:
Extrapolation for exposure duration. The default factor for subchronic to chronic exposure is 2, and the default factor for subacute to chronic exposure is 6.
Extrapolation from LOAEL to NOAEL in studies in which a NOAEL was not identified. A factor of 3 was used.
Species differences. Because internal (serum) doses are compared between animals and humans, no AF was used for differences in toxicokinetics, but an assessment factor of 2.5 was applied for differences in toxicodynamics.
Intraspecies differences within human populations, that is sensitive subpopulations. An assessment factor of 10 was used for the general population.
The resulting DNEL for hepatotoxicity of PFHxS to the general population was as follows:
DNEL = POD / (exposure duration AF x interspecies AF x intraspecies AF)= 89,000 ng per mL serum / (2 x 2.5 x 10)= 89,000 ng per mL / 50= 1780 ng/mL serum
The DNEL for reproductive toxicity of PFHxS to the general population was:
DNEL = POD / (interspecies AF x intraspecies AF)= >60,000 ng per mL serum / 2.5 x 10)= >60,000 ng per mL serum / 25= >2400 ng/mL serum
The DNEL for other effects, specifically on haematological effects of PFHxS to the general population was:
DNEL = POD / (exposure duration AF x LOAEL to NOAEL AF x Interspecies AF x intraspecies AF)
= 44 000 ng per mL serum / (6 x 3 x 2.5 x 10)= 44 000 ng per mL serum / 450= 98 ng/mL serum
Sweden, National Food Agency (Livsmedelsverket), 2014
110

Based on a precautionary approach, the limit value derived by Livsmedelsverket for PFOS in drinking water (0.09 µg/L) applies to the sum of seven PFAS substances including PFOS, one of which was PFHxS. In addition, Livsmedelsverket advised that if the PFAS content exceeds the limit value, action should be taken to reduce levels below it, but water could still be consumed if the levels did not exceed 0.9 µg/L (i.e. 10 fold higher than the established limit). If levels exceed 0.9 µg/L they advise that pregnant women, women trying to get pregnant and infants should not consume the water.
Danish EPA, 2015
As part of the Danish EPA evaluation of the health hazards of PFOA, PFOS and PFOSA, a preliminary screening of toxicity data for five other PFASs including PFHxS was undertaken. The objective of this screen was to assess the possibilities for further derivation of specific quality criteria for the particular substance.
The Danish report concluded that based on the Swedish EPA findings (2012) and Livsmedelsverket (2013)11 there is sufficient information to warrant consideration of deriving a specific quality criteria for PFHxS.
ATSDR, 2015
The ATSDR published a draft toxicological profile for perfluoroalkylated compounds in 2015.
Assessment of available data on PFHxS was included in this profile but due to insufficient toxicological information and/or uncertainty, no MRL was established.
US EPA 2016
The US EPA published a Health Effects Support Document for PFOA which included some information on PFHxS (human serum levels and protein binding affinities) however, no data relevant to deriving HBGVs for PFHxS were described.
4.3 Summary of the toxicity of PFHxS
4.3.1 Mechanisms of toxicity
Available information on the mechanism of action of PFAS has been described previously in Sections 2.3.1 and 3.3.1, relating to PFOS and PFOA, respectively. Additional information relevant to PFHxS is summarised briefly below.
PFHxS was shown to be a moderately potent activator of PPARα receptor in COS-1 cells transfected with mouse or human PPARα receptor-luciferase reporter plasmids (Wolf et al. 2008). The potency12 of the mouse PPARα activation response to PFHxS was similar to that
11 The Danish report indicates that Livsmedelsverket (National Food Agency Sweden) has set a provisional TDI of 5 µg/kg/day for PFHxS derived from a NOAEL of 1 mg/kg/day for liver effects (presumably in the rat) but no further details could be found in English on the Livsmedelsverket site (last accessed 16 November 2016).12 Potency was assessed by the ranking the C20max (predicted concentration at which a compound elicits 20% of the overall maximal response) for each of the PFAS investigated.
111
of the human PPARα response. The relative response of PFHxS was similar to PFOS in the mouse PPARα transfected cells (76 versus 94 µM) and lower than human PPARα transfected cells (81 versus 262 µM).
PFHxS reduced plasma triglyceride and HDL levels, and increased liver weights and hepatic triglyceride content in APOE*3-Leiden CETP mice (transgenic mice which have human-like plasma lipoprotein profile and plasma lipid levels) (Bijland et al. 2011). Using hepatic gene expression profiling data, the authors concluded that the liver effects were a combined result of PPARα and PXR activation.
4.3.2 Toxicokinetics
Limited toxicokinetic studies have been conducted in laboratory animals with PFHxS administered either via the oral gavage or iv routes (Sundström et al. 2012, Kim et al. 2016; summarised in Appendix 3). These studies suggest that PFHxS is readily absorbed by the oral route. For the purposes of risk assessment it should be considered that bioavailability is close to 100% within 24 hours following oral administration to rats by gavage. Cmax in rats occurred within approximately 3 days for males and 1.5 hours for females.
Kerstner-Wood (2003) observed that over the range of 1-500 mg/L in plasma from monkeys and humans PFHxS was bound between 99.4-100%, while in rats the binding was 98.2-100%. There was also binding to ß-lipoproteins, α- and ɣ-globulins. Ren et al. (2016) reported evidence of binding to thyroxine-binding globulin. PFHxS displayed a weak binding affinity for human liver fatty acid binding protein at a 1:1 molar ratio (Sheng et al. 2016). The affinity was lower than for PFOA, while PFOS was not assessed.
Tissue distribution has not been well investigated, however, the highest concentrations of PFHxS have generally been reported in the liver and kidney. Serum elimination half-life in female rats is less than 24 hours, and in the male rat and mice of both sexes is around 30 days. Elimination half-life is in the range 87-141 days in cynomolgus monkeys. Excretion of PFHxS in laboratory animals occurred primarily in the urine with relatively small amounts eliminated in the faeces.
The half-life of PFHxS in humans was estimated from serial blood samples collected over five years from 26 retired fluorochemical production workers. Elimination appears to be linear on a semilogarithmic plot of concentration versus time, so a first order model of kinetics was used. The arithmetic and geometric half-life of serum elimination, respectively, were 8.5 years (95% confidence interval, 6.4 – 10.6) and 7.3 years (95% confidence interval, 5.8 – 9.2) (Olsen et al. 2007). The fluorochemical production workers also had body burdens of PFOS and PFOA. PFHxS has been shown to be present in breast milk at a concentration of less than 10% of that in maternal serum (Kim et al. 2011). There is evidence that PFHxS can cross the placenta and enter the fetal circulation (ATSDR 2015).
4.3.3 Animal toxicity studies
A literature search identified only one toxicity study conducted with PFHxS that was considered useful for regulatory purposes. The study evaluated reproductive and developmental toxicity in rats.
Butenhoff et al. 2009, Evaluation of potential reproductive and development toxicity of potassium perfluorohexanesulfonate in Sprague Dawley rats
In a modified OECD 422 guideline-based design, male and female rats (15/sex/group) were administered PFHxS (K(+)) at doses of 0 (control), 0.3, 1, 3, and 10 mg/kg bw/day by oral gavage. All animals were dosed for 14 days prior to cohabitation, during cohabitation and
112

until the day before sacrifice. The treatment period for males was a minimum of 42 days. Females that littered were terminated on day 21 of lactation (approximately 62 days of treatment), while non littering females (2 animals from groups receiving 1.0 or 3.0 mg/kg/day) were killed on presumed day 25 of gestation (approximately 40 days of treatment).
The following parameters were assessed in both F0 and F1 animals unless noted otherwise: survival; reproductive success (F0 only); clinical signs; body weight gain; food consumption (F0 only); oestrus cycling (female F0 only); neurobehavioural effects (F0 only); haematology and clinical chemistry (F0 only); gross and microscopic examination of selected organs; and sperm quality and quantity (male F0 only). Blood samples were taken on day 14, day 42 and GD 21. On GD 21, fetal blood and liver samples (pooled for each litter), were taken. At termination on PND 22 blood and liver samples were taken from 5 pups/sex/litter/treatment groups for analysis of PFHxS. Serum samples were pooled for each litter.
No deaths or treatment-related clinical signs occurred in F0 animals. Body weight gain was statistically significantly lower in males at 10 mg/kg bw/day compared with controls (Table 33). No treatment-related differences in body weight or body weight gain were observed in F0 females during the cohabitation and gestation phases of the study. Significantly lower mean body weights were observed in females administered 0.3, 3 and 10 mg/kg bw/day compared with controls on PND 8, but this finding was not seen at the 1.0 mg/kg bw/day level at this timepoint or other time points. No effects on feed consumption were observed.
A significant increase in absolute and relative liver weights was observed in males administered PFHxS at 3 and 10 mg/kg bw/day, but not in females. No absolute liver weight group numerical data were presented in the report, and liver weights relative to body weight were only presented in graphical form.
No treatment-related macroscopic changes were observed at necropsy at any dose level. Treatment-related histopathological changes were restricted to findings in the liver and thyroid gland of males at 3 and 10 mg/kg bw/day. In the liver centrilobular hypertrophy was seen with accompanying increased amounts of dense eosinophilic granular cytoplasm. The thyroid findings were confined to hypertrophy and hyperplasia of the follicular cells.
Significant differences from controls were seen in some haematological and clinical chemistry parameters in male rats (Table 33). Lower haematocrit and red blood cell counts were reported at 3 or 10 mg/kg bw/day and lower haemoglobin levels at 1, 3 or 10 mg/kg bw/day. These differences were slight and not considered to be of toxicological significance. Higher prothrombin time was found at 0.3, 3 or 10 mg/kg bw/day (but not at 1 mg/kg bw/day) but the differences were slight and did not show a dose-response trend. Significantly increased albumin, albumin/globulin ratios, BUN, alkaline phosphatase and calcium mean values were observed at 10 mg/kg bw/day, with lower cholesterol in all treated male groups and lower mean triglycerides at 10 mg/kg bw/day only.
113

Table 33: Mean body weight, blood chemistry and haematology values for males treated for at least 42 DaysDosage (mg/kg bw/day)
Parameter Control 0.3 1 3 10
Mean Body weight gain (g) Day 1-44 129.8±25.5 114.8±27.5 121.2±37.7 122.7±30.0 98.2±13.9*
Blood chemistry
Albumin (g/dL) 4.3±0.2 4.1±0.2 4.3±0.2 4.2±0.2 4.5±0.2**
Albumin/globulin 2.1±0.2 2.1±0.2 2.2±0.3 2.2±0.2 2.5±0.2**
BUN (mg/dL) 16.0±1.5 16.0±0.8 16.0±1.8 17.0±1.6 21.0±2.4**
Cholesterol (mg/dL) 57±8 41±11** 46±12** 43±13** 33±7**
Triglyceride (mg/dL) 52±21 47±17 36±14 36±28 17±8**
Alkaline phosphatase (U/L) 105±14 111±37 100±12 115±25 144±38**
Haematology
Prothrombin time (s) 13.4±0.2 14.2 ±0.3** 13.6±0.2 13.8±0.4* 14.0 ±0.5**
Haemoglobin (g/dL) 16.5±1.2 15.9±0.4 15.7±0.6* 15.4±0.7** 15.6±0.8*
Red Blood Cells (106/mm3 ) 7.51±0.40 7.33±0.4 7.32±0.4 6.93±3.05* 6.99 ±0.44*
Haematocrit (%) 43.5±3.5 42.2±1.6 42.0±2.2 40.2±2.3** 40.7±1.8*
Values presented are mean ± standard deviation and taken from Butenhoff et al. 2009BUN* Significantly different from the control group value (p≤0.05)** Significantly different from the control group value (p≤0.01)
There were no effects of PFHxS treatment on mating or fertility parameters (estrus cycling, cohabitation length, mating and fertility indices). Similarly there were no effects on pregnancy status, gestation length or pregnancy outcomes. Histopathological examination of the reproductive organs revealed no effect of treatment on sperm motility, count, density and morphology values for F0 male rats, or on primordial follicle counts for F0 females. There were no effects of treatment on any FOB parameters (autonomic functions, sensorimotor functions, excitability, gait and sensorimotor coordination, forelimb and hindlimb grip strength) and motor activity. No treatment-related effects on litter outcomes were observed.
The NOAEL for reproductive toxicity was 10 mg/kg bw/day, the highest dose tested. The NOAEL for paternal toxicity was 3 mg/kg bw/day (males only) and the NOAEL for offspring toxicity was 10 mg/kg bw/day.
Serum and liver PFHxS concentrations measured in the study are summarised in Table 34.
114
Table 34: Mean serum/plasma and liver PFHxS concentrationK+PFHxS dose (Mg/kg Bw/day)Day Cohort 0 0.3 1.0 3.0 10.0Serum PFHxS (µg/mL)14 F0 male 0.14±0.05 18.18±2.42 80.97±30.83 143.05±82.09 182.67±8.2514 F0 female 0.39a 2.78±0.81 9.85±3.91 20.67±3.91 42.04±6.4742 F0 male 0.32±0.09 44.22±12.66 89.12±0.80 128.67±10.30 201.50±20.02GD21 F0 female <LLOQb 3.32±0.71 10.65±6.41 32.75±7.83 59.80±11.54GD21 F1, pooled <LLOQ 5.32±1.32 13.47±2.06 37.10±2.89 44.33±6.50PND22 F1, pooled <LLOQ 8.57±2.41 34.34±10.86 32.35±8.20 93.55±55.79Liver PFHxS (µg/g)42 F0 male 0.35±0.23 43.80±8.07 149.50±26.06 338.67±128.42 593.50±81.41GD21 F0 female <LLOQc 0.79±0.19 2.61±0.54 7.80±1.58 16.53±2.57GD21 F1 fetus <LLOQ 1.37±0.53 3.29±1.17 7.19±1.39 18.87±4.28PND22 F1 male <LLOQ 1.13±0.31 3.86±0.94 8.73±1.65 16.22±4.41PND22 F0 female <LLOQ 1.04±0.24 3.91±1.05 9.96±2.69 18.39±2.32
Values presented are mean ± standard deviation and taken from Butenhoff et al. 2009GD – Gestation Day; PND – Postnatal day; LLOQ - lower limit of quantificationa excludes data from 2 females which were below LLOQ of 0.1 µg/mLb serum LLOQ = 0.1 µg/mLc liver LLOQ = 0.1 µg/g
4.3.4 Human data
There are a number of epidemiological studies of human populations that have explored the association between PFHxS exposure and various health endpoints but evidence of significant risk is poor and at times contradictory. Study populations have included occupationally exposed workers at 3M, a major manufacturer of PFASs, communities with high exposure due to proximity to PFAS production plants, and general populations, for example through the NHANES database. These studies are frequently complicated by exposure to more than one PFAS, and are not considered useful for determining a HBGV for PFHxS.
Mean PFHxS serum concentrations reported in various studies of the general population in the United States are in the range 1.5–3.9 ng/mL (ppb). Levels of 0.29 to 1.85 µg/mL have been reported in occupationally exposed individuals (ATSDR 2015). There is some evidence levels in children may be higher than in adults and it has been suggested that this may be due to greater exposure through other routes of exposure, such as inhalation and hand to mouth transfer from carpets.
ATSDR (2015) considered a number of epidemiological studies that have reported an association between PFHxS exposure and health effects in human populations. These and some other more recent data, are briefly summarised below.
One epidemiology study reported a significant association between serum PFHxS levels and physician-diagnosed asthma in children aged 10-15 years but another epidemiology study, based on NHANES data, did not find this association. Results of epidemiology studies are likewise contradictory with regard to effects of PFHxS on total cholesterol, LDL cholesterol and non-HDL cholesterol, sperm quality and effects on birth weight. Overall, ATSDR considered that the number of studies examining the relationship between serum PFHxS and cholesterol is insufficient for any conclusions to be drawn.
A reported negative association between serum PFHxS and estimated GFR may be a consequence of ‘reverse causation,’ that is individuals with low GFR are slower to excrete PFHxS. A small number of studies have examined possible associations
115

between serum PFHxS level on the one hand and TSH, T3 and T4 on the other, but no associations have been found.
Most studies have found no association between serum PFHxS and evidence of diabetes, although one study found a negative association between PFHxS levels and insulin resistance in adolescent females.
Negative associations have been found between serum levels of PFASs, including PFHxS, and antibody responses to vaccinations against tetanus, diphtheria, and rubella in children. One study has found an association between serum PFHxS and ADHD and/or learning difficulties in children, as reported by parents or the children themselves.
Jørgensen et al. (2014) did not find consistent evidence that PFHxS had any effect on time to conception in women, whereas Vélez et al. (2015) concluded that PFHxS increased time to conception.
Maison et al. (2015) found some evidence that prenatal exposure to PFHxS was associated with a slight increase in serum testosterone concentration in adolescent girls, but acknowledged that their study was small (n=72).
Overall, ATSDR did not consider the available human data useful for establishing a MRL.
4.4 Discussion and conclusions PFHxS
There are currently substantial deficiencies in the toxicological and epidemiological database that preclude establishing a TDI for PFHxS, or a group TDI for perfluoroalkyl compounds. Establishing a HBGV is usually a strong indicator of the confidence in the database around the toxicity of the chemical being assessed. When a HBGV is established, it is taken that the database is robust and comprehensive, such that all relevant endpoints can be covered.
In the case of PFHxS, the only toxicology study considered useful for regulatory purposes was a reproductive and developmental study in rats (Butenhoff et al. 2009). There was no evidence of reproductive or developmental toxicity. The NOAEL for reproductive toxicity was 10 mg/kg bw/day, the highest dose tested. The NOAEL for paternal toxicity was 3 mg/kg bw/day (males only), and the NOAEL for offspring toxicity was 10 mg/kg bw/day.
In the absence of a HBGV, it may be it may still be possible to derive a margin of exposure (MOE) to provide risk managers with information on the level of public health and safety risk. The MOE is defined as the ratio of the NOAEL or BMDL for the critical effect to the predicted or estimated exposure. In general, the interpretation of an MOE is based on considerations similar to those used in establishing a HBGV. When based on data from experimental animals, as a default, a MOE of at least 100 would be considered as an indication for low health concern for compounds such as perfluoralkylated compounds with an apparent threshold.
However, this is likely to be complicated by the toxicokinetics for PFHxS, which similar to PFOS and PFOA, exhibits significant differences between laboratory animals and humans, such that the default 100-fold uncertainty factor may not be sufficiently protective of human health. On that basis, it is reasonable to conclude that the enHealth approach of using the TDI for PFOS is likely to be conservative and protective of public health as an interim measure. The approach recognises that the structure of PFHxS and PFOS are similar, and that there is some evidence of similar potency of PFHxS and PFOS in activating PPARα, which at least partially, mediates the toxicity of perfluroalkylated compounds.
Effectively, this means that as a conservative approach, PFHxS and PFOS should be summed for the purposes of a dietary exposure assessment and risk characterisation.
References
116

PFOS
Agency for Toxic Substances and Disease Registry (2015) Draft Toxicological Profile for Perfluoroalkyls.
Andersen ME, Clewell HJ 3rd, Tan YM, Butenhoff JL and Olsen GW (2006) Pharmacokinetic modeling of saturable, renal resorption of perfluoroalkylacids in monkeys--probing the determinants of long plasma half-lives. Toxicology 227: 156–164.
Beesoon S and Martin JW (2015) Isomer-specific binding affinity of perfluorooctanesulfonate (PFOS) and perfluorooctanoate (PFOA) to serum proteins. Environ Sci Technol 49: 5722–5731.
Biegel LB, Hurtt ME, Frame SR, O’Connor JC and Cook JC (2001) Mechanisms of Extrahepatic Tumor Induction by Peroxisome Proliferators in Male CD Rats. Toxicol Sci 60: 44–55.
Biesemeier JA, and Harris DL (1974) Eye and Skin Irritation Report on Sample T-1117. Project No. 4102871. WARF Institute, Inc.
Bijland S, Rensen PCN, Pieterman EJ, Maas ACE, van der Hoorn JW, van Erk MJ, Havekes LM, van Dijk KW, Chang S-C, Ehresman EJ, Butenhoff JL and Princen HJMG (2011) Perfluoroalkyl sulfonates cause alkyl chain length-dependent hepatic steatosis and hypolipidemia mainly by impairing lipoprotein production in APOE*3-Leiden CETP mice. Toxicol Sci 123: 290–303.
Borg and Håkansson (2012) Environmental and Health Risk Assessment of Perfluoroalkylated and Polyfluoroalkylated Substances (PFASs) in Sweden. The Swedish Environmental Protection Agency
Bull S, Burnett K, Vassaux K, Ashdown L, Brown T and Rushton L (2014) Extensive literature search and provision of summaries of studies related to the oral toxicity of perfluoroalkylated substances (PFASs), their precursors and potential replacements in experimental animals and humans. Area 1: Data on toxicokinetics (absorption, distribution, metabolism, excretion) in in vitro studies, experimental animals and humans. Area 2: Data on toxicity in experimental animals. Area 3: Data on observations in humans. EFSA supporting publication 2014:EN-572
Butenhoff JL, Chang S-C, Olsen GW and Thomford PJ (2012) Chronic dietary toxicity and carcinogenicity study with potassium perflurooctanesulfonate in Sprague Dawley rats. Toxicology 293: 1-15.
Butenhoff JL, Ehresman DJ, Chang S-C, Parker GA and Stump DG (2009) Gestational and lactational exposure to potassium perfluorooctanesulfonate (K+PFOS) in rats: Developmental neurotoxicity. Reprod Toxicol 27:319–330.
Case M, York R, Christian M (2001). Rat and Rabbit Oral Development Toxicology Studies with Two Perfluorinated Compounds. Int J Toxicol 20:101-109.
Chang SC, Ehresman DJ, Bjork JA, Wallace KB, Parker GA, Stump DG, and Butenhoff J (2009) Gestational and lactational exposure to potassium perfluorooctanesulfonate (K+PFOS) in rats: Toxicokinetics, thyroid hormone status and related gene expression. Reprod Toxicol 27: 387-399.
Cui L, Zhou Q-F, Liao C-Y, Fu J-J and Jiang G-B (2009) Studies on the toxicological effects of PFOA and PFOS on rats using histological observation and chemical analysis. Arch
117

Environ Contam Toxicol 56: 338–349.
Curran I, Hierlihy SL, Liston V, Pantazopoulos P, Nunnikhoven A, Tittlemier S, Barker M, Trick K and Bondy G (2008) Altered fatty acid homeostasis and related toxicologic sequelae in rats exposed to dietary potassium perfluorooctanesulfonate (PFOS). J Toxicol Environ Health A 71: 1526–1541.
Dean WP, Jessup DC, Thompson G, Romig G and Powell D (1978) Fluorad Fluorochemical Surfactant FC-95 Acute Oral Toxicity (LD50) Study in Rats. Study No. 137-083. International Research and Development Corporation.
Danish Environmental Protection Agency (2015) Perfluoroalkylated substances: PFOA, PFOS and PFOSA. Edited by PB Larsen and E Giovalle.
Dong H, Curran I, Williams A, Bondy G, Yauk CL and Wade MG (2016) Hepatic miRNA profiles and thyroid hormone homeostasis in rats exposed to dietary potassium perfluorooctanesulfonate (PFOS). Environ Toxicol Pharmacol 41: 201–210.
Dong G-H, Zhang Y-H, Zheng L, Liu W, Jin Y-H, and He Q-C (2009) Chronic effects of perfluorooctanesulfonate in adult male C57BL/6 mice. Arch Toxicol 83: 805-815.
Drew R and Hagen T (2016) Immunomodulation by PFASs: A brief literature review. ToxConsult document ToxCR300816
ECHA (2009) Guidance in a nutshell: Chemical safety assessment.
EFSA (2008) Perfluorooctane sulfonate (PFOS), perfluorooctanoic acid (PFOA) and their salts. Scientific Opinion of the Panel on Contaminants in the Food chain. EFSA J 653: 1-131.
FAO/WHO (2009) Principles and methods for the risk assessment of chemicals in food.Environmental Health Criteria 240.
Goldenthal EI, Jessup DC, Geil RG and Mehring JS (1979) Ninety-Day Subacute Rhesus Monkey Toxicity Study. Study No. 137-087. International Research and Development Corporation, Mattawan, MI.
Hall AP, Elcombe CR, Foster JR, Harada T, Kaufmann W, Knippel A, Küttler K, Malarkey DE, Maronpot RR, Nishikawa A, Nolte T, Schulte A, Strauss V and York MJ (2012) Liver hypertrophy: a review of adaptive (adverse and non-adverse) changes – conclusions from the 3rd International ESTP Expert Workshop. Toxicol Pathol 40: 971–994.
Holsapple MP1, Pitot HC, Cohen SM, Boobis AR, Klaunig JE, Pastoor T, Dellarco VL and Dragan YP (2006) Mode of action in relevance of rodent liver tumors to human cancer risk. Toxicol Sci 89: 51–56.
Lau C, Anitole K, Hodes C, Lai D, Pfahles-Hutchens A and Seed J (2007) Perfluoroalkyl acids: a review of monitoring and toxicological findings. Toxicol Sci 99: 366-94.
Lau C, Thibodeaux JR, Hanson RG, Rogers JM, Grey BE, Stanton ME, Butenhoff JL and Stevenson LA (2003) Exposure to perfluorooctane sulfonate during pregnancy in rat and mouse. II: Postnatal evaluation. Toxicol Sci 74: 382–392.
Long Y, Wang Y, Ji G, Yan L, Hu F and Gu A (2013) Neurotoxicity of perfluorooctane sulfonate to hippocampal cells in adult mice. PLOS One 8: e54176.
118

Luebker DJ, York RG, Hansen KJ, Moore JA and Butenhoff JL (2005a) Neonatal mortality from in utero exposure to perfluorooctanesulfonate (PFOS) in Sprague Dawley rats: Dose-response and biochemical and pharmacokinetic parameters. Toxicology 215: 149–169.
Luebker DJ, Case MT, York RG, Moore JA, Hansen KJ and Butenhoff JL (2005b) Two-generation reproduction and cross-foster studies of perfluorooctanesulfonate (PFOS) in rats. Toxicology 215: 126–148.
NTP (2016) Draft Systematic Review of Immunotoxicity Associated with Exposure to PFOA or PFOS. National Toxicology Program. National Institute of Environmental Health Sciences, National Institutes of Health. http://ntp.niehs.nih.gov/ntp/about_ntp/monopeerrvw/2016/july/draftsystematicreviewimmunotoxicityassociatedpfoa_pfos_508.pdf
Parkinson A (2001) Biotransformation of Xenobiotics. In Casarett and Doull’s Toxicology, 6th edition, edited by CD Klaassen. McGraw Hill
Peden-Adams MM, Keller JM, EuDaly JG, Berger J, Gilkeson GS and Keil DE (2008) Suppression of humoral immunity in mice following exposure to perfluorooctane sulfonate. Toxicol Sci 104: 144–154.
Ren XM, Qin WP, Cao LY, Zhang J, Yang Y, Wan B and Guo LH (2016) Binding interactions of perfluoroalkyl substances with thyroid hormone transport proteins and potential toxicological implications. Toxicology 366–367: 32–42.
Rusch GM, Rinehart WE and Bozak CA (1979) An Acute Inhalation Toxicity Study of T-2306 CoC in the Rat. Project No. 78-7185. Bio/dynamics, Inc.
Seacat AM, Thomford PJ, Hansen KJ, Olsen GW, Case MT and Butenhoff JL (2002) Subchronic toxicity studies on perfluorooctanesulfonate potassium salt in cynomolgus monkeys. Toxicol Sci 68: 249-264.
Seacat AM, Thomford PJ, Hansen KJ, Clemen LA, Eldridge SR, Elcombe CR and Butenhoff JL (2003) Sub-chronic dietary toxicity of potassium perfoluoroocanesulfonate in rats. Toxicology 183: 117-131.
Thibodeaux JR, Hanson RG, Rogers JM, Grey BE, Barbee BD, Richards JH, Butenhoff JL, Stevenson LA and Lau C (2003) Exposure to perfluorooctane sulfonate during pregnancy in rat and mouse. I: Maternal and prenatal evaluations. Toxicol Sci 74: 369-381.
Thomford PJ (2002) 104-week dietary chronic toxicity and carcinogenicity study with perfluorooctane sulfonic acid potassium salt (PFOS; T-6295) in rats. Final Report. Volumes I-IX. Covance study no. 6329-183. 3M Company, St Paul, MN.
United Kingdom Committee on Toxicity of Chemicals in Food, Consumer Products and the Environment (2006) COT statement on the tolerable daily intake for perfluorooctane sulfonate. https://cot.food.gov.uk/cotstatements/cotstatementsyrs/cotstatements2006/cotstatementpfos200609
United Kingdom Committee on Toxicity of Chemicals in Food, Consumer Products and the Environment (2009) COT statement on the tolerable daily intake for perfluorooctanoic acid.https://cot.food.gov.uk/cotstatements/cotstatementsyrs/cotstatements2009/cot200902
US EPA (2002) A review of the reference dose and reference concentration processes. EPA/630/P-02/002F
119

US EPA (2014) Health effects document for perfluorooctane sulfonate (PFOS). EPA 822-R-14-002.
US EPA (2016) Health effects support document for perfluorooctane sulfonate (PFOS). EPA 822-R-16-002. Available at https://www.epa.gov/ground-water-and-drinking-water/supporting-documents-drinking-water-health-advisories-pfoa-and-pfos
Wambaugh JF, Setzer RW, Pitruzzello AM, Liu J, Reif DM, Kleinstreuer NC, Wang NC, Sipes N, Martin M, Das K, DeWitt JC, Strynar M, Judson R, Houck KA and Lau C (2013) Dosimetric anchoring of in vivo and in vitro studies for perfluorooctanoate and perfluorooctanesulfonate. Toxicol Sci 136: 308–327.
Wan HT, Zhao YG, Wei X, Hui KY, Giesy JP and Wong CKC (2012) PFOS-induced hepatic steatosis, the mechanistic actions on β-oxidation and lipid transport. Biochim Biophys Acta 1820: 1092–1101.
Wang L, Wang Y, Liang Y, Li J, Liu Y, Zhang J, Zhang A, Fu J and Jiang G (2014) PFOS induced lipid metabolism disturbances in BALB/c mice through inhibition of low density lipoproteins excretion. Scientific Reports 4: 4582.
WHO (2015) Pesticide residues in food. WHO Core Assessment Group on Pesticide Residues. Guidance document for WHO monographers and reviewers. Geneva: World Health Organization.
Xie W, Ludewig G, Wang K and Lehmler HJ (2010) Model and cell membrane partitioning of perfluorooctanesulfonate is independent of the lipid chain length. Colloids Surf B Biointerfaces 76: 128–136.
Yu X-H, Zheng X-L and Tang, C-K (2015) Peroxisome Proliferator-Activated Receptor α in Lipid Metabolism and Atherosclerosis. Adv Clin Chem 71: 171-203.
PFOA
Agency for Toxic Substances and Disease Registry (2015) Draft Toxicological Profile for Perfluoroalkyls.
Biegel LB, Hurtt ME, Frame SR, O’Connor JC and Cook JC (2001) Mechanisms of Extrahepatic Tumor Induction by Peroxisome Proliferators in Male CD Rats. Toxicol Sci 60: 44–55
Borg and Håkansson (2012) Environmental and Health Risk Assessment of Perfluoroalkylated and Polyfluoroalkylated Substances (PFASs) in Sweden. The Swedish Environmental Protection Agency
Bull S, Burnett K, Vassaux K, Ashdown L, Brown T and Rushton L (2014) Extensive literature search and provision of summaries of studies related to the oral toxicity of perfluoroalkylated substances (PFASs), their precursors and potential replacements in experimental animals and humans. Area 1: Data on toxicokinetics (absorption, distribution, metabolism, excretion) in in vitro studies, experimental animals and humans. Area 2: Data on toxicity in experimental animals. Area 3: Data on observations in humans. EFSA supporting publication 2014:EN-572
Butenhoff J, Costa, G, Elcombe C, Farrar D, Hansen K, Iwai H, Jung R, Kennedy Jr. G, Lieder P, Olsen G and Thomford P (2002) Toxicity of Ammonium Perfluorooctanoate in Male
120

cynomolgus Monkeys after Oral Dosing for 6 Months. Toxicol Sci 69: 244–257
Butenhoff JL, Kennedy Jr. GL, Frame SR,. O’Connor JC and York RG (2004) The reproductive toxicology of ammonium perfluorooctanoate (APFO) in the rat. Toxicology 196: 95–116
Butenhoff JL,. Kennedy Jr. GL, Chang S-C, and Olsen GW(2012) Chronic dietary toxicity and carcinogenicity study with ammonium perfluorooctanoate in Sprague Dawley rats. Toxicology 298: 1– 13
Danish Environmental Protection Agency (2015) Perfluoroalkylated substances: PFOA, PFOS and PFOSA. Edited by PB Larsen and E Giovalle.
DeWitt JC, Copeland CB, Strynar MJ and Luebke RW (2008) Perfluorooctanoic Acid–Induced Immunomodulation in Adult C57BL/6J or C57BL/6N Female Mice. Environ Health Perspect 116: 644–650
Drew R and Hagen T (2016) Immunomodulation by PFASs: A brief literature review. ToxConsult document ToxCR300816
EFSA (2008) Perfluorooctane sulfonate (PFOS), perfluorooctanoic acid (PFOA) and their salts. Scientific Opinion of the Panel on Contaminants in the Food chain. EFSA J 653: 1-131
Goldenthal EI (1978) Ninety Day Subacute Rhesus Monkey Toxicity Study. Final Report. Prepared for 3M, St. Paul, by International Research and Development Corporation, St. Paul. US EPA Public Docket AR226-0447
Hall AP, Elcombe CR, Foster JR, Harada T, Kaufmann W, Knippel A, Küttler K, Malarkey DE, Maronpot RR, Nishikawa A, Nolte T, Schulte A, Strauss V and York MJ (2012) Liver Hypertrophy: A Review of Adaptive (Adverse and Non-adverse) Changes – Conclusions from the 3rd International ESTP Expert Workshop. Toxicol Pathol 40: 971-994
International Agency for Research on Cancer (2016). IARC Monographs on the Evaluation of Carcinogenic Risks to Humans. Volume 110 (2016) Perfluorooctanoic Acid, Tetrafluoroethylene, Dichloromethane, 1,2-Dichloropropane, and 1,3-Propane Sultone
Lau C, Thibodeaux JR, Hanson RG, Narotsky MG, Rogers JM, Lindstrom AB and Strynar MJ (2006) Effects of Perfluorooctanoic Acid Exposure during Pregnancy in the Mouse. Toxicol Sci 90 510–518
Macon MB, Villanueva LR, Tatum-Gibbs K, Zehr RD, Strynar MJ, Stanko JP, White SS, Helfant L and Fenton SE (2011) Prenatal Perfluorooctanoic Acid Exposure in CD-1 Mice: Low Dose Developmental Effects and Internal Dosimetry. Toxicol Sci 122:, 134–145
Morita Y, Homma Y, Igarashi M, Miyano R, Yamaguchi H, Matsuda M, Tanigaki T, Shiina Y and Homma K (2010) Decrease in glomerular filtration rate by plasma low density lipoprotein cholesterol in subjects with normal kidney function assessed by urinalysis and plasma creatinine Atherosclerosis 210(2): 602-606
NTP (2016) Draft Systematic Review of Immunotoxicity Associated with Exposure to PFOA or PFOS. National Toxicology Program. National Institute of Environmental Health Sciences, National Institutes of Health. http://ntp.niehs.nih.gov/ntp/about_ntp/monopeerrvw/2016/july/draftsystematicreviewimmunotoxicityassociatedpfoa_pfos_508.pdf
121

Palazzolo MJ (1993) Thirteen-week dietary toxicity study with T-5180, ammonium perfluorooctanoate (CAS No. 3825-26-1) in male rats. Final Report. Laboratory Project Identification HWI 6329-100. Hazleton Wisconsin, Inc. U.S. Environmental Protection Agency Administrative Record 226-0449
Parkinson A (2001) Biotransformation of Xenobiotics. In Casarett and Doull’s Toxicology, 6th edition, edited by CD Klaassen. McGraw Hill
Perkins RG, Butenhoff JL, Kennedy Jr. GL, and Palazzolo MJ (2004) 13-Week Dietary Toxicity Study of Ammonium Perfluorooctanoate (APFO) in Male Rats. Drug Chem Toxicol 27 361–378
Roberts M, Grice J, Hungerford N, Liang X, and Liu X (2016) A critical review of pharmacokinetic modelling of PFOS and PFOA to assist in establishing HBGVs for these chemicals.
United Kingdom Committee on Toxicity (2006) COT Statement on the Tolerable Daily Intake for Perfluorooctanoic Acid. https://cot.food.gov.uk/sites/default/files/cot/cotstatementpfoa200902.pdf
US EPA (2016) Health Effects Support Document for Perfluorooctanoic Acid (PFOA). EPA 822-R-16-003. https://www.epa.gov/sites/production/files/2016-05/documents/pfoa_hesd_final_508.pdf
White SS, Calafat AM, Kuklenyik Z, Villanueva L, Zehr RD, Helfant L, Strynar MJ, Lindstrom AB, Thibodeaux JR, Wood C and Fenton SE (2007) Gestational PFOA Exposure of Mice is Associated with Altered Mammary Gland Development in Dams and Female Offspring. Toxicol Sci 96: 133–144
White SS, Kato K, Jiac LT, Basden BJ, Calafat AM, Hinesa EP, Stanko JP, Wolf CJ, Abbott BD and Fenton SE (2009) Effects of perfluorooctanoic acid on mouse mammary gland development and differentiation resulting from cross-foster and restricted gestational exposures. Reprod Toxicol 27: 289–298
White SS, Stanko JP, Kato K, Calafat AM, Hines EP and Fenton SE (2011) Gestational and Chronic Low Dose PFOA Exposures and Mammary Gland Growth and Differentiation in Three Generations of CD-1 Mice. Environ Health Perspect 119: 1070–1076
Wolf CJ, Fenton SE, Schmid JE, Calafat AM, Kuklenyik Z, Bryant XA, Thibodeaux J, Das KP, White SS, Lau CS and Abbott BD (2007) Developmental Toxicity of Perfluorooctanoic Acid in the CD-1 Mouse after Cross-Foster and Restricted Gestational Exposures. ToxicolSci 95: 462–473
Yu X-H, Zheng X-L and Tang, C-K (2015) Peroxisome Proliferator-Activated Receptor α in Lipid Metabolism and Atherosclerosis. Adv Clin Chem 71: 171-203
PFHxS
Agency for Toxic Substances and Disease Registry (ATSDR) (2015) Draft Toxicological Profile for Perfluoroalkyls.
Bijland S, Rensen PCN, Pieterman EJ, Maas ACE, van der Hoorm JW, van Erk MJ, Havekes LM, van Dijk KW, Chang SC, Ehresman DJ, Butenhoff JL, Princen HMG (2011). Perfluoroalkyl Sulfonates Cause Alkyl Chain Length-Dependent Hepatic Steatosis and Hypolipidemia Mainly by Impairing Lipoprotein Production in APOE*3-Leiden CETP Mice.
122

Toxicol Sci 123: 290-303
Butenhoff JL, Chang SC, Ehresman DJ, Chang SC, York RG (2009) Evaluation of Potential reproductive and developmental toxicity of potassium perfluorohexanesulphonate in Sprague Dawley rats: Reprod Toxicol 27: 331-341
Danish EPA (2015) Perfluoroalkylated substances: PFOA, PFOS and PFOSA: Evaluation of health hazards and proposal of a health-based quality criterion for drinking water, soil and ground water. Environment project No. 1665, 2015. Danish Ministry of the Environment, Environmental Protection Agency. http://www2.mst.dk/Udgiv/publications/2015/04/978-87-93283-01-5.pdf
Hoberman AM, York RG (2003) Oral (gavage) combined repeated dose toxicitystudy of T-7706 with the reproduction/developmental toxicity screening test.Argus Research. (Unpublished report).
Jørgensen KT, Specht IO, Lenters V, Bach CC, Rylander L, Jönsson BAG, Lindh CH, Giwercman A, Heederik D, Toft G and Bonde JP (2014) Perfluoroalkyl substances and time to pregnancy in couples from Greenland, Poland and Ukraine. Environ Health 13:116
Kim SJ, Heo SH, Lee DS, Hwang IG, Lee YB and Cho HY (2016) Gender differences in pharmacokinetics and tissue distribution of 3 perfluoroalkyl and polyfluoroalkyl substances in rats. Food Chemi Toxicol 97: 243-255
OECD (2002) Hazard assessment of perfluorooctane sulfonate (PFOS) and its salts. Joint meeting of the Chemicals Committee and The Working Party on Chemicals, Pesticides and Biotechnology. Organisation for Economic Co-operation and Development.
Olsen GW, Burris JM, Ehresman DJ, Froehlich JW, Seacat AM, Butenhoff JL, Zobel LR (2007) Half-life of serum elimination of perfluorooctanesulfonate,perfluorohexanesulfonate, and perfluorooctanoate in retired fluorochemical production workers. Environ Health Perspect 115: 1298-305
Olsen GW, Butenhoff JL, Zobel LR (2009) Perfluoroalkyl chemicals and human fetal development: an epidemiologic review with clinical and toxicological perspectives. Reprod Toxicol 27: 212-30
Ren XM, Qin WP, Cao LY, Zhang J, Yang Y, Wan B (2016) Binding interactions of perfluoroalkyl substances with thyroid hormone transport proteins and potential toxicological implications. Toxicology 366-367: 32-42
Sheng N, Li J, Lui H, Zhang A, Dai J (2016) Interactions of Perfluoroalkyl acids with human liver fatty acid-binding protein. Arch Toxicol 90: 217-27
Sundström M, Chang SC, Noker PE, Gorman GS, Hart JA, Ehresman DJ, Bergman Ȃ, Butenhoff JL (2012). Comparative pharmacokinetics of perfluorohexanesulfonate (PFHxS) in rats, mice and monkeys. Reprod Toxicol 33: 441-451
Swedish Environmental Health Protection Agency Report 6513 (2012). Environmental and Health Risk Assessment of Perfluoroalkylated and Polyfluoroalkylated Substances (PFASs) in Sweden. http://www.naturvardsverket.se/Documents/publikationer6400/978-91-620-6513-3.pdf?pid=3822
Vélez MP, Arbuckle TE, and Fraser WD (2015) Maternal exposure to perfluorinated chemicals and reduced fecundity: the MIREC study. Hum Reprod 30: 701–709
123
Weiss JM, Andersson, PL, Lamoree MH, Leonards PEG, van Leeuwen SPJ, Hamers, T (2009) Competitive Binding of Poly- and Perfluorinated Compounds to the Thyroid Hormone Transport Protein Transthyretin. Toxicol Sci 109: 206-216
124
Appendices
Appendix 1: Observational studies of PFAS and birthweight
Executive Summary
Two systematic reviews were identified which described the association between PFOA or PFOS and birthweight. A number of studies published since these reviews were completed were also identified.
The individual studies reported their results, usually multivariate, using a variety of analytical approaches and reported results in a range of formats. Typically, data were log transformed, using either base 10 or the natural logarithm. This suggested that the associations in these studies were not linear although most authors did not describe examining regression diagnostics to determine if the transformation was appropriate. Specifically, there was a steep decline in birthweight seen at low blood concentrations of PFAS, which levelled off to a plateau or near-plateau at higher concentrations. Some authors also presented results for linear or categorical analyses, but generally did not comment on which was the best fit for the data. It was noted that some papers stated that there was no association but did not provide any quantitative results.
One systematic review conducted a quantitative meta-analysis that assumed that the relationship between PFOA and birthweight was linear, although this assumption was not justified or explained by the authors. They included results of studies which had been reanalysed using the linear assumption. Their primary meta-analysis excluded retrospective analyses, including the data from the large C8 study from West Virginia, but included studies that they judged to have a high risk of bias (specifically, these studies were a univariate analysis in one instance and had possible conflict of interest in the second instance). They found an overall decline in birthweight of 18.9 g (95% CI: -29.8 to -7.9) per increment of 1 ng/mL PFOA (they combined maternal or infant concentrations, as were available, owing to their review that this was reasonable). FSANZ identified several additional studies (including a prospective analysis of the C8 data) that met the inclusion and exclusion criteria and which were not additional analyses of previously reported studies. Two of these described their results using a linear model, and notably, found no inverse association. Adding these to the existing meta-analysis model, reduced the association to -11.9 g (95% CI: -21.6 to -2.2) birthweight per increment of 1ng/mL PFOA concentration. Most studies in the meta-analysis had examined PFOA concentrations <20ng/mL and so the results relate to this range of PFOA concentrations.
The second systematic review did not do a quantitative meta-analysis but graphed the results of each study as reported by their respective authors. This presented the nonlinearity of the associations of birthweight with PFOA and PFOS from each study (i.e. a greater effect at low concentrations than higher concentrations). FSANZ added additional studies to these graphs and also tabulated results described in papers in formats which could not be graphed.
Neither of the systematic reviews considered how the results of studies they had needed to exclude, owing to data format problems, might have affected their conclusion. In the case of PFOA, FSANZ considers the excluded studies reflect the range of results shown in the meta-analysis and graph. However, in the case of PFOS, the excluded studies tended to be more likely to show no association, or a positive association compared to the graphed studies. This raises the possibility of selective reporting or publication bias in the body of literature leading to an over-representation of studies reporting significant adverse effects. Furthermore most studies examined associations for PFOA and PFOS separately and did not conduct a
125

mutually-adjusted analysis despite often noting a substantial correlation between PFOA and PFOS.
FSANZ notes that the concentration in blood in the human studies described above is about 1,000-fold lower than that found in animal studies showing an effect on birthweight. It is not certain whether the association observed reflects a causal relationship between PFOS, PFOA and birthweight or is the result of a third factor. For example, Verner et al. (2015) suggest that both would be affected by the changes in glomerular filtration rates that occur during pregnancy. This requires further investigation.
In summary, overall the studies with numerical data report an association between PFOA or PFOS and birthweight at low concentrations. However, missing quantitative data from studies reporting no effect raises the possibility of selective reporting or publication bias affecting the body of evidence. The shape of the association is not clear; that is whether it is linear or nonlinear. Consequently it is not clear that the result from the meta-analysis should be used to estimate possible impacts on birthweight, especially above 20 ng/mL. It is not possible to determine whether the association reflects a causal relationship or is the result of a third factor that alters both PFAS concentration and birthweight, or may have been overstated owing to selective reporting or publication.
Background
The purpose of this report is to describe the epidemiological studies that have examined whether there is an association between PFOA or PFOS and birthweight.
Previous reviews have had divergent conclusions. EFSA (2008) concluded that it was unlikely that either PFOA or PFOS had adverse effects in the population but noted uncertainties with respect to infant development for PFOA. The US EPA (2014b) and Johnson et al. (2014) concluded that there was an inverse association between birthweight and PFOA. Bach et al. (2015) concluded that the studies were too inconsistent to allow a conclusion to be drawn. By contrast, Verner et al. (2015) propose that almost all of the observed association can be attributed to a third factor, namely changes in glomerular filtration rate during pregnancy.
FSANZ has attempted to answer the following question:Is blood PFOA or PFOS concentration related to infant birthweight?
Table A1.1 PECO(s) criteria for the review of PFOA, PFOS and birthweight
Population Pregnant women and their newborn infants
Exposure PFOA and/or PFOS measured in maternal blood during pregnancy or at delivery or in cord blood at delivery
Comparison Different levels of PFOA and/or PFOS concentration
OutcomeInfant birthweight – preferably expressed as kg; other expressions such as low/not low birthweight or weight as a z-score allowed; length-adjusted measures such as ponderal index excluded
Study types Longitudinal (cohort); cross-sectional
Table A1.1 shows the scoping for this review. Preliminary examination of other reports indicates that there are no trials, randomised or otherwise, in the literature.
126

Literature examined
Existing reviews identified
PFOS and PFOA often occur together and so reviews of either substance were considered as the starting point to collate original literature. The initial assessment examined the reports from EFSA concerning both PFOS and PFOA and the reports from the US EPA concerning PFOS (US EPA, 2014a) and PFOA (US EPA, 2014b). Two recent systematic reviews were also identified from these reports and by searching PubMed (https://www.ncbi.nlm.nih.gov/pubmed). One examined the effect of PFOA on birthweight (Johnson et al. 2014) whereas the other examined the effect of PFOA and PFOS on birthweight (Bach et al. 2015). A third systematic review (Verner et al. 2015) was also examined but did not have additional studies compared to Johnson et al. (2014).
Table A1.2 shows the original papers referred to in the above reviews, together with some details, listed in order of year of publication. Most papers were published after the EFSA report was released. This table also shows FSANZ’s decision about whether to include the studies in its consideration. FSANZ was able to include some studies in a quantitative or graphical form, whereas other studies could only be included in a qualitative form (as showing a positive, inverse or no association between the PFAS and birthweight) owing to the manner in which their results were reported. The rationale for FSANZ’s decisions is given below.
Some of the authors of the systematic review by Johnson et al. (2014) list their affiliation as the US EPA. The US EPA reports (US EPA, 2014a; US EPA, 2014b) describe the results as reported by the authors of the various papers whereas Johnson et al. (2014) state that they asked the author of papers to reanalyse their data using multivariate linear regression. However, these revised analyses and the meta-analysis result reported by Johnson et al. (2014) do not seem to have been used in the US EPA reports.
127

Table A1.2 Papers referred to in selected reviews and systematic reviews of the association between PFOA, PFOS and birthweight and FSANZ’s decision about their inclusion or exclusion from this review
Author Year of publication
Location of study
Study name
Year
of
data
co
llect
ion
n subjects
Reporting format used by authors to describe the association of BW with blood PFAS EF
SA 2
008
US
EPA
20
16
John
son
et
al.
2014
Bac
h et
al.
2015
FSA
NZ
Inoue 2004 Hokkaido, Japan Sapporo Toho 2003 15
PFOA – not applicable (only 3 subjects with detectable concentrations)PFOS – “no apparent correlation” in the scatterplot
- - - e
Apelberg 2007 Maryland, USA - 2004-5 293 Per log unit (base 10?) PFAS
Fei 2007 Denmark DNBC 1996-20021207 term
1399 full sample
Per ng/mL increase in PFAS (untransformed)
Grice 2007Decatur, AL US
3M 1997421 births
to 263 women
Mean birthweight (maternal recall) by categories of calculated exposure from job history between 1961-1997 (PFOS only)
- - - e q
Monroy 2008 Ontario, Canada - 2002-5 101 Inverted analysis* - e q
Washino 2009 Hokkaido, Japan Sapporo Toho 2002-5 428 Per log 10 unit of PFAS -
Nolan 2009 US C8 2003-5 1600Mean birthweight in areas classified by concentration in the water supply
- c e e e
Stein 2009 US C8 2000-5
1845 (PFOA);
5262 (PFOS)
OR for low birthweight for the interquatile range difference - c e
e
Kim S & Choi 2011 Korea - 2008-9 35Partial correlation coefficient for log transformed (base not stated) PFAS and birthweight
- - ?
Kim SK & Lee 2011 Seoul, Korea - 2007 20 Raw data presented - - e - q
Hamm 2010 Alberta, Canada - 2005-6 252 Per natural log unit of PFASalso in tertiles of PFAS -
128
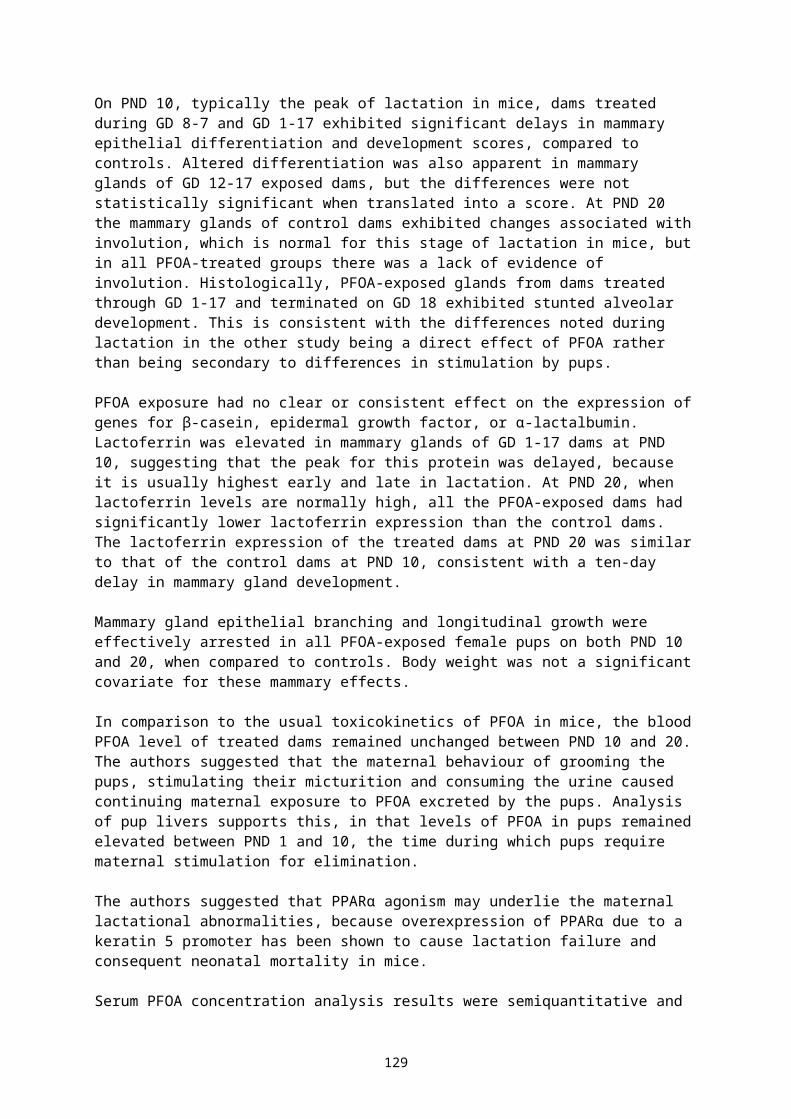
Author Year of publication
Location of study
Study name
Year
of
data
co
llect
ion
n subjects
Reporting format used by authors to describe the association of BW with blood PFAS EFSA
200
8
US
EPA
20
16
John
son
et
al.
2014
Bac
h et
al.
2015
FSA
NZ
Author Year of publication
Location of study Study
Year of data collection
N subjects
Reporting format used by authors to describe the association of BW with blood PFAS
EFSA
20
08
US
EPA
20
16
John
son
et a
l. 2
014
Bac
h et
al.
2015
FSA
NZ
Arbuckle 2012 Ottawa, Canada - 2005-8 126 Inverted analysis* - - e q
Whitworth 2012 Norway MoBa 2003-4 847 BW z-score per unit increase in PFAS; also in quartiles of PFAS -
Maisonet 2012 UK ALSPAC 1991-2 395 Per log unitalso in tertiles of PFAS -
Chen 2012 TaiwanTaiwan Birth Panel Study
2004-5 429 Per natural log unit of PFAS -
Savitz 2012a US C8 1990-2006 11,737 OR for low birthweight - c e e e
Savitz 2012b US C8 1990-2004 4534Per 100 ng/mL increase in PFOA and OR for low birthweight
- c e e e
Fromme 2010 Germany - 2007-9 44 Not reported - - -
Haldorsson 2012 Denmark - 1988-89 Unadjusted mean birthweight in quartiles of maternal PFOA - - e - e
Wu 2012 China - 2007 167 Per log 10 unit of PFOA - - -
Lee 2013 Gyeongbuk,South Korea - 2011 59
Inverted analysis: mean PFAS in 2 categories of birthweight (above and below median)
- - - q
Darrow 2013 US C8 2005-10 1629Per natural log unit of PFAS(PFOS analysis also has OR for low birthweight)
- -
*Inverted refers to an analysis is which authors used PFAS as the dependent variable and birthweight as the independent variable and so calculated the difference in PFAS per unit difference in birthweight
Abbreviations: BW birthweight; LBW low birthweight; OR odds ratio included in this review; -: not referred to in this review; e- excluded from consideration in the review;? referred to but reason for exclusion from consideration not given; q- included for qualitative assessment but not quantitative assessment
129

130

Additional studies identified by FSANZ
FSANZ examined several other sources and identified some additional, including recent, studies (Table A1.3). A recent book referred to one paper (So et al. 2006) which was subsequently excluded because it did not measure PFAS in blood. A search of reference lists in the papers in Table A1.2 did not yield any additional papers . One of the searches given by Johnson et al. (2014) was updated in PubMed (see Annex for search criteria and paper screening). Serveral studies were published between the initial search in November 2016 and the final search a month later.
Table A1.3 Additional studies identified by FSANZ and FSANZ’s decision about their inclusion or exclusion from this review
included in this review; e- excluded from this review; q- included for qualitative assessment but not quantitative assessment
Non-independence of some of the original studies
Large studies often have a specific name and authors publish multiple papers. In particular, in cohort studies, the same outcome might be examined several times, each time with a longer follow-up. Cross-sectional studies might examine the same hypothesis in greater detail in selected subsamples in addition to an overall analysis. If the same outcome is described in more than one paper, then the results are not independent and should not be treated as separate studies in a review, especially if a quantitative meta-analysis is
131
First author
Year
of
publ
icat
ion
Location of study Study
Year
of
data
co
llect
ion
n subjects
Reporting format
FSA
NZ
So2006
China - 2004 19
No signification correlation between breast milk PFAS concentration and infant weight
e
Kishi 2015 Hokkaido, Japan
Sapporo Toho 2002-5 306 Per log 10 unit of PFAS e
Robeldo 2015Michigan and Texas, US
LIFE 2005-9 230Per 1 standard deviation of the natural log of PFAS
q
Bach 2016 DenmarkAarhus Birth Cohort
2008-13 1507 Per 0.1 ng/mL of PFAS quartiles
de Cock 2016 Netherlands OBELIX 2011-3 91 Tertiles of PFAS (ng/L) /q
Lauritzen 2016 Norway and Sweden
Scandanavian SGA Study
1986-8 424 Per natural log unit of PFAS
q
Wang 2016 Taiwan Taiwan Maternal and Infant Cohort Study
2000-1 223 Per natural log unit of PFOA
Shi 2016 Bejing, China
- 2012 170 Per log 10 unit of PFAS q
Alkhalawi 2016 Germany Duisberg Birth Cohort
2000-2 148 Correlation not significant
q

undertaken. Neither Johnson et al. (2014) or Bach et al. (2015) discuss how to manage multiple papers from the same dataset.
As indicated in Tables A1.2 and A1.3, there are several examples of multiple papers reporting results from the same study in the compiled list. Some essential features of these papers are described in Table A1.4. From this, FSANZ selected papers that would not lead to multiple inclusions of the same results in its consideration. Darrow et al. (2013) was selected to include the results of the C8 study. The other C8 studies contain estimates of PFAS exposure calculated from job and residential histories and/or analyse births which occurred prior to collection of blood samples, often many years prior. Darrow et al. (2013) examine blood PFAS concentrations and birthweight for two sets of infants: those who were born before or after the blood sample was drawn and those who were estimated to have been conceived after the blood sample was drawn. FSANZ has used the latter results because the prospective analysis allows for greater certainty about the direction of the association.
Washino et al. (2009) was selected from the Sapporo Toho Study as the remaining studies (Inoue et al. 2004; Kishi et al. 2015) appear to describe subsamples of this population. All three Danish studies were included as they seem to be studying different sets of infants.
Table A1.4 Studies with multiple papers describing results
Study Brief description of the study
Papers from this study Specific features of this paper
C8 Health Project
And the
C8 Community Follow-up Study
The DuPont Company’s Washington Works factory has used PFOA in the manufacture of fluoropolymers since 1951, with use peaking in the 1990s. Community residents were exposed to high levels of PFOA through ground-water contamination (2005–2006 serum median = 28 ng/mL) with residents in cer-tain water distribution districts more highly exposed than others. PFOS levels were not elevated compared to background US levels.
The C8 Health Project is a survey of 69,030 people exposed to PFOA-contaminated drinking water in specific water districts in Ohio and West Virginia for at least 12 months between 1950 and 2004.
A subset of participants who were at least 20 years old at the time of enrolment in the C8 Health Project (n = 32,254) participated in one or two follow-up interviews between 2008 and 2011.
Stein 2009
Pregnancies between 2000-5, i.e. which occurred in the 5 years preceding the collection of blood Reports analyses for PFOS and PFOA.
Nolan 2010
Singleton live births in Washington County, Ohio, between 2003-5. PFOA exposure estimated from concentrations in drinking water and postcode of residence listed on the birth records. Analysed data for PFOA only.
Savitz 2012a
Pregnancies occurring between 1900-2006 with self-reported birth outcomes and estimated exposure based on residential and work history (including 133 term low birthweight babies). Would include pregnancies analysed by Stein et al. 2009. PFOA exposure only.
Savitz 2012b.
Study 1: 4534 term births (including 918 term low birthweight babies) occurring 1990-2004, i.e. preceding collection of blood. Study 2: is based on birth records linked to the C8 project, includes additional geographic areas compared to Study 1 and has reconstructed residential history. PFOA exposure only.
Darrow, 2013
Singleton live births in white women between 2005-10 to Community Follow-up Study participants who enrolled in the Study between 2005-6, including births that occurred before enrolment. Analyses PFOS and PFOA.
Sapporo Toho Hospitals Study
One cohort was recruited at the Toho Hospital in Sapporo late in pregnancy.
Inoue, 2004 15 subjects recruited between February and July 2003;only 3 women had detectable levels of PFOA; appears to be a subset of Washino
132

Study Brief description of the study
Papers from this study Specific features of this paper
The same research group is also conducting a large scale Hokkaido-wide study which recruited pregnant women early in pregnancy (Kishi et al. 2011) but not reports of the association between PFAS and birthweight were found relating to the larger cohort study.
et al. 2009.
Washino, 2009
Data from 428 subjects recruited between 2002-5.
Kishi, 2015
Describes the combined effects of PFAS and serum fatty acids on birthweight in subjects recruited between 2002-5; appears to be a subset of Washino et al. 2009
Danish Studies
Fei et al. 2007
Danish National Birth Cohort which recruited women between March 1996 and November 2002 from 60% of GPs and had a response rate of Fei et al. 2002 took a small random sample of those responding to all questionnaires and having both maternal and cord blood.
Halldorsson, 2012
Refers to women recruited in 1988-9 at the Aarhus Hospital with blood analysed for PFOA. Not possible to determine whether there is any overlap with the women in Fei et al. although it seems unlikely that women would agree to be in two separate cohort studies involving questionnaires and blood sampling during the same pregnancy.
Bach, 2016
Random selection of women recruited 2008-13. Although this study states that it analyses data from the Danish National Birth Cohort Study, the timing of pregnancies that the subjects do not overlap with those of Fei et al. (2007) or Haldorssen et al. (2012). Results were presented for all births and for term births; the data for all subjects was used as Johnson et al. (2014) do not refer to restricting their analysis to term births.
Analytical variability across the studies
A notable feature of Tables A1.2 and A1.3 is the variety of ways that authors have described the association between PFAS and birthweight. Consequently, the results reported in the various papers cannot be combined to derive an overall average estimate. As described below, Johnson et al. (2014) contacted authors and asked them to reanalysis their PFOA data in a common analytical format. These results have been used in FSANZ’s update.
Table A1.5 shows the consolidated list of studies that FSANZ will include in its assessment. Most studies report analyses for both PFOS and PFOA. Most studies had average PFOA concentrations less than 4 ng/mL and average PFOS concentrations less than 20 ng/mL (Figure A1.1). Although Figure A1.1 shows that there was no association across the studies between PFOA and PFOS, there was an association within the populations examined in the studies (see below). Some have data which can be compared to other studies in a quantitative or graphical form. Others only allow a qualitative assessment of whether they found a positive, inverse or no association between the PFAS and birthweight.
133

Table A1.5 List of studies FSANZ has chosen for inclusion (first author, year of publication)
Inclusion in meta-analysis and/or graphical presentation
Qualitative inclusion only
Apelberg, 2007 Fromme, 2010 (PFOA data given in Johnson at al, 2014) Alkhalawi, 2106 Lauritzen, 2016
Bach, 2016 Hamm, 2010 Arbuckle, 2012 Lee, 2013Kim S, 2011 Haldorrsson, 2012 Monroy, 2008Chen, 2012 Maisonet, 2012 De Cock, 2016 (PFOS) Robeldo, 2015Darrow, 2013 Washino, 2009 Grice, 2007 (PFOS data only) Shi, 2016de Cock, 2016 (PFOA) Wang, 2016 (PFOA data only) Kim SK, 2011Fei,2007 Whitworth, 2012
Wu, 2012 (PFOA data only)
Figure A1.1 Plot of the average concentrations of PFOA and PFOS in studies measuring both compounds
The association between PFOA and birthweight
The reviews from EFSA (2008) and the US EPA (2014a, 2014b) did not describe their strategies for identifying the body of literature and provided narrative descriptions of the studies. Multiple papers from the same study were apparently regarded as independent studies. Their methods will not be considered further.
Overview of existing systematic reviews
Two systematic reviews are discussed here (Table A1.6) as the basis for considering the question around the effect of PFAS chemicals on birthweight.
The design of many studies cannot be unambiguously described as longitudinal or cross-sectional. Some studies collected maternal blood in late pregnancy or cord blood samples at delivery and so these are essentially estimates of exposure after fetal growth has largely occurred. A number of studies show that maternal blood collected at various times during pregnancy and cord blood are correlated and so it is reasonable to assume that blood
134
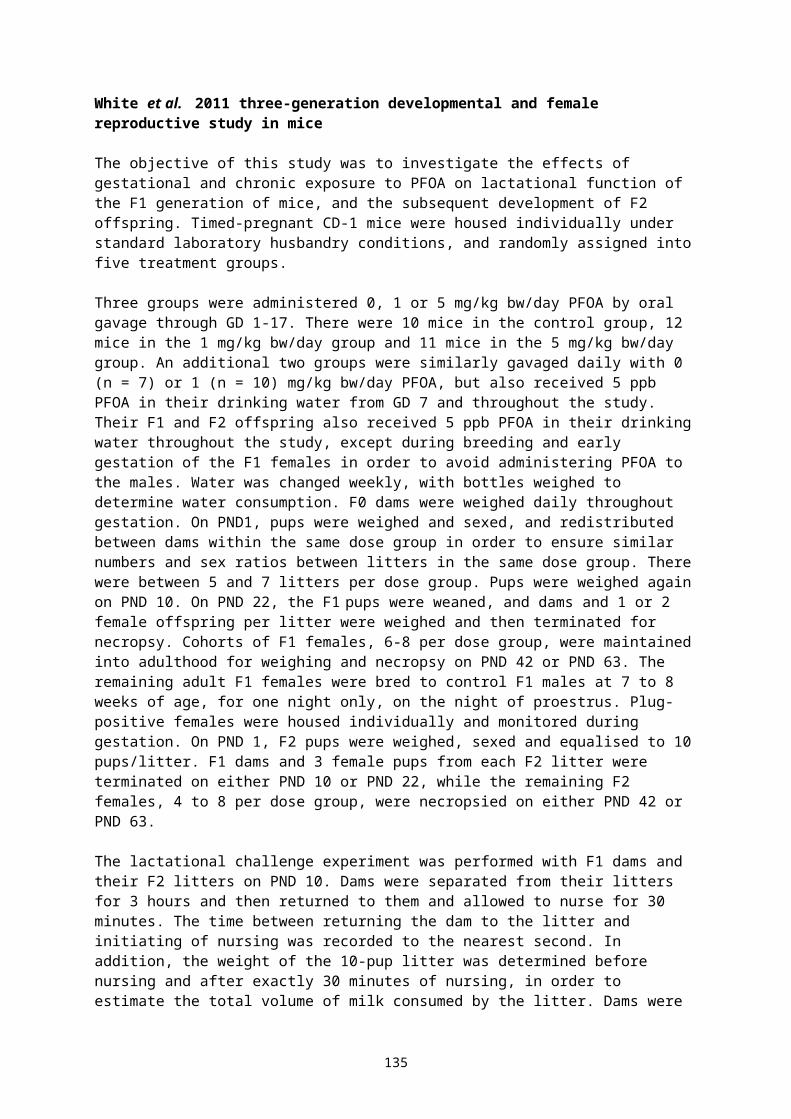
collected at any time provides a guide to exposure in people who have not moved their residence. However, the actual concentration of PFAS in the blood changes during pregnancy (possibly partly related to haemodilution) and is different in maternal and cord blood.
Table A1.6 PECO and other information about two systematic reviews of PFOA and birthweight
Johnson et al. 2014 Bach et al. 2015
PECO(s) criteria
Population
Humans during reproduction/development (i.e. before & during pregnancy for women, during pregnancy for the fetus)
Pregnant women
Exposure
PFOA (CAS#335-67-1) or its salts before/during pregnancy – “measured or estimated during the reproductive/developmental time period” (any time before or during pregnancy for women, or directly in fetuses, including cord blood)
PFOS or PFOA in biological material (blood, cord blood); excluded indirect estimates of exposure
Comparator Comparison across a range of exposures Range of exposureOutcomes Birthweight; other measures of fetal or
infant growth optional; BW did not have to be the focus of the study
Developmental growth - birthweight on a continuous scale; other measures also included
Study design No design specifications but study had to contain original data or observations
Original human cohort, cross-sectional and case-control studies;
Other items
Databases searched
PubMed, EMBASE, Web of Science and other databases MEDLINE, EMBASE, citation search in Scopus
Final date of search 23 April, 2012 - 11 May, 2012 12 June, 2014
Language, publication date No restrictions No restrictions
Quality assessment of individual studied
Johnson et al. developed criteria to assess the risk of bias for this set of longitudinal and cross-sectional studies (further described in the online supplement to their paper). They used this to assess the risk of bias of studies included in the systematic review, including those subsequently excluded from the meta-analysis
“The study design, sampling procedure, inclusion and exclusion criteria, distribution of participant characteristics, numbers of participants and response rates, assessment of exposure, ascertainment of outcomes, statistical analysis and quantitative risk estimates with 95% confidence intervals were evaluated. Each of the 9 criteria were assigned a value of 1 if fulfilled and given equal weight. A sum of > 7 was considered sufficient for completeness of reporting (Bonzini et al. 2007). The risks of selection and information biases as well as confounding were assessed. Potential confounders, primarily covariates from multiple regression analyses of PFOA and PFOS exposure and birth weight variables, were extracted and evaluated”
N included studies
19 data sets from 18 papers reported results for one or more measures of infant size (one of these (Fei et al. 2008) did not describe birthweight). They wrote to authors to request reanalysis of data in a common format (linear regression of untransformed continuous birthweight) but only 9 sets of data were used in the primary meta-analysis for birthweight
14 studies of PFOS, (13 studies of PFOA) published between August 2004 and December 2013 of which 10 reported on birthweight as a continuous variable
Review by Johnson et al. (2014)
135

The Johnson et al. (2014) review was part of a larger project testing a methodological approach to assessing evidence from animal and human data in the environmental science area. The possible association between developmental exposure to PFOA and various outcomes, including birthweight was used a case study to examine the approach. They assessed which studies were combinable in a meta-analysis based on whether the study had birthweight data as a continuous variable or a categorical variable (e.g. low birthweight or not low birthweight), exposure assessment and data analysis. They examined data to determine whether it was reasonable to combine PFOA concentrations which had been measured at different times in pregnancy or in cord blood and concluded that it was. They contacted study authors to request a reanalysis of data that had been log transformed or original data so that all studies could be reanalysed without logarithmic transformation. They also assessed the risk of bias of all studies, including those not included in the quantitative meta-analysis, using a set of criteria they had adapted from other work. They used well-known routines (metan in STATA version 12.1) to conduct a random effects model with DerSimonian-Laird confidence intervals using the adjusted results (for the most part) from the studies included.
The nine studies with data in the untransformed continuous form yielded an overall estimate that birthweight decreased by 18.9 g (95% CI: –29.8 to –7.9 g) for every increase of 1 ng/mL serum or plasma PFOA concentration. Heterogeneity was low (I2 = 38%) (see Figure A1.2). They also conducted some sensitivity analyses. First, a tenth study (Savitz et al. 2012, from the C8 study) which had been excluded because it was a retrospective analysis, was added. This study had a small effect of less than 0.2 g birthweight per ng/mL and so adding it to the meta-anlaysis reduced the overall estimate slightly –15.4 g (95% CI: –26.5 to –4.3 g) but the heterogeneity increased. Second, they remove two studies from which were assessed as having a high risk of bias, either singly or together, but this did not substantially alter the effect.
Johnson et al. (2014) concluded that there was little possible residual confounding that could explain the finding. They calculated that a new study would have to have a strong opposing effect (i.e., an increase in birthweight with increasing PFOA concentrations) to overturn the effect. They concluded that there is sufficient evidence of an association between PFOA exposure and reduced fetal growth and that this reflected a causal effect.
Commentary on Johnson et al. (2014)
It is notable that the Johnson et al. (2014) meta-analysis assumed that the association between PFOA and birthweight was linear even though many of the studies had log transformed their data. It is certainly true that the authors of papers do not describe having conducted regression diagnostics to determine if the transformed data yielded a better fit to the data than non-transformed data. However, Johnson et al. (2014) do not
136

Figure A1.2 Risk of bias assessment for all studies and meta-analysis of 9 studies from Johnson et al. (2014) (Reproduced from Environmental Health Perspectives)
137

provide any justification or comment on the decision that they made to analyse the body of data using a linear assumption. The meta-analysis only contains studies that FSANZ would include (see above). As noted above, the authors did not consider whether papers contained multiple analyses from the same underlying study, although all the C8 studies (Nolan et al. , 2009, Savitz et al. , 2012a, Savitz, 2102b, Stein et al. 2009) were excluded from the meta-analysis by Johnson et al. (2014) for other reasons.
Review by Bach et al. (2015)
The inclusion criterion for exposure measurement was different in the review of Bach et al. (2015) from that of Johnson et al. (2014) in requiring an assessment in biological material such as maternal blood. Consequently some of the C8 studies found by Johnson et al. (2014) which had estimated exposure from, for example occupational history, were not included in the review of Bach et al. (2015). Papers from the C8 study which analysed blood concentation (Stein et al. , 2009; Darrow et al. 2013) were included by Bach et al. (2015).
Bach et al. (2015) tabulated 14 studies, of which one (Inoue at al. 2004) reported results measured PFOS only, leaving 13 studies of PFOA. Two of the remaining studies (Stein et al. , 2009; Arbuckle et al. , 2013) only describe results related to low birthweight; Lee et al. (2013) dichotomised birthweight at the median, and Whitworth et al. (2012) provided results with birthweight expressed as a z-score rather than in kg. This left eight 8 studies of PFOA reporting results for birthweight as a continuous variable which were graphed by Bach et al. (2015) (Figure A1.3).
138

Figure A1.3 Graph of studies from Bach et al. (2015)
Bach et al. (2015) commented on the lack of internal consistency in some studies which assessed birthweight in several ways (such as continuous birthweight or proportion with low birthweight) and that some important confounding variables had not been considered in a number of the existing studies. They also note that other PFAS had not been properly examined and that both lower birthweight and increased PFAS concentrations could be the result of a third process, such as changes in glomerular filtration rate during pregnancy. They concluded that at present, the data are insufficient to confirm or reject the association between PFAS and birthweight.
Commentary on Bach et al. (2015)
The timing of the literature search allowed Bach et al. (2015) to identify Wu et al. (2012), Darrow et al. (2013) and Lee et al. (2013) which were not captured by Johnson et al. (2014). They refer to Johnson et al. (2014) but do not comment on certain studies included by Johnson et al. that they did not include. Specficially, Johnson et al. (2014) give linear regression coefficientis for Whitworth et al. (2012), Fromme et al. (2010) and Kim S et al. (2011) but none of these were graphed by Bach et al. (2015). Haldorssen et al. (2012) was also retrieved by Johnson et al. (2014) but not used because the data were given in quartiles not a linear regression coefficient; however this could have been graphed. Bach et al. (2015) do not comment on why these studies were not graphed even though it is common practice to include studies identified from reference lists of included studies or reviews.
139

Bach et al. (2015) conclude that“higher PFOA levels were associated with lower average birth weight in eight studies of a total of 5046 pregnancies, even though the magnitude and significance of associations differed. Data are insufficient to determine a safe lower PFOA exposure level, but statistically significant associations were only demonstrated when median serum or plasma levels during pregnancy were above approximately 3 ng/mL (Fei et al. 2007, Maisonet et al. 2012, Wu et al. 2012). However, one study with median levels above this level found no significant association (Darrow et al. 2013). The value of 3 ng/mL is similar to the present day average PFOA exposure in US women of fertile age (Jain 2013).”
However, whether or not any concentration is statistically significant depends on the range in the study, the variability and the numbers in the study. The authors were hampered by the inability to combine data with disparate reporting formats.
Update
FSANZ has approached updating the literature review in two ways because it is not clear whether the linear assumption made by Johnson et al. (2014) can be justified. First, the meta-analysis of Johnson et al. (2014) has been updated (see Annex) with two studies that meet the inclusion and reporting format criteria (a linear regression coefficient) described by Johnson et al. (2015). Secondly, additional studies have been added to the graph of Bach et al. (2015). New studies identified by FSANZ have been added when they reported birthweight results as quantiles or regression coefficients, except those published in late 2016 that were identified in the final search (results of these studies are tabulated together with results of studies which can only be included qualitatively). The studies shown by Johnson et al. (2014) but not previously graphed by Bach et al. (2015) have also been added. FSANZ notes that Bach et al. (2015) plotted the combined retrospective and prospective results of Darrow et al. (2013) whereas FSANZ would choose the analysis that was restricted to the prospective births (see Annex). For the visual presentation, there is not much difference and FSANZ has not re-plotted the entire graph. However, for the update of the meta-analysis, the prospective results from Darrow et al. (2013) have been used.
Figure A1.4 shows the updated meta-analysis which contains two additional studies (Darrow et al. 2013; Bach et al. 2016). The Annex shows a low overall risk of bias for each of these studies using the criteria of Johnson et al. (2014). It is notable that neither of the new studies found an inverse association between PFOA and birthweight. Both of these had larger sample sizes than the studies already included in the meta-analysis except for Fei et al. (2007) and Whitworth et al. (2012). Adding these studies has altered the overall estimate of effect to -11.9 g (95% CI: -21.6 to -2.2 g) birthweight per ng/mL but has increased the heterogeneity among the studies I2 = 70%).
Figure A1.5 shows the update of the graph from Bach et al. (2015). It should be noted that Fromme et al. (2010) and Haldorsson et al. (2012) show crude results that have not been adjusted for any confounders. The narrow range over which some of the results have been analysed in the various studies is immediately apparent. For example the interquartile range in Kim S et al. (2010) was less than 1 ng/mL and so the large apparent effect on birthweight in the meta-analysis is based on a small variation in PFOA concentration. Figure A1.5 also shows the variation in results across studies. At about 15 ng/mL, the results range from an increase in birthweight of about 100g to a decrease of about 200g.
140

NOTE: Weights are from random effects analysis
Overall (I-squared = 69.9%, p = 0.000)
Hamm, 2010
Maisonet, 2012
Kim S, 2011
Fei, 2007
Whitworth, 2012
Darrow, 2013
Apelberg, 2007
Fromme, 2010
Washino, 2009
Study
Chen, 2012
ID
Bach, 2016
-11.93 (-21.61, -2.24)
-12.40 (-32.80, 8.00)
-34.20 (-54.80, -13.50)
154.00 (-83.50, 391.70)
-10.60 (-20.80, -0.50)
-28.40 (-60.30, 3.50)
0.05 (-0.45, 0.50)
-64.00 (-125.20, -2.70)
-213.00 (-423.70, -2.20)
-22.60 (-60.80, 15.60)
-11.20 (-26.00, 3.70)
ES (95% CI)
6.36 (-9.09, 20.90)
100.00
10.74
10.61
0.16
16.73
6.36
20.49
2.23
0.21
4.89
%
13.83
Weight
13.75
0-424 0 424
ES: effect size, i.e. increment in birthweight (g) per ng/mL PFOA increment, the grey squares show the relative weighting of the studies, the effect size and its 95% confidence interval are also shown
Figure A1.4 FSANZ’s update of the meta-analysis of Johnson et al. (2014) including two additional studies reporting results in the format required by Johnson et al. (2014)
141

Figure A1.5 FSANZ’s update of the graph of Bach et al. (2015)
Table A1.7 Results of studies included in the review which did not report their results in a way that allowed inclusion in either Figure A1.4 and/or Figure A1.5 (or were published in late 2016)
Study PFOA concentration (ng/mL) Results Direction of
association
ArbuckleMinimum 0.3Median 1.6Maximum 5.2
Inverted multivariate analysis: non-low birthweight was a significant inverse predictor of serum PFOA
Unknown
Kim SKMean 1.6Min: 0.9Max 3.2
Not correlated p>0.2 Unclear
Lee25th centile 2.1250th centile 2.6275th centile 3.25
Adjusted analysis: Odds of having higher birthweight (above the median of 3.19 kg) decreased if PFOA concentration was greater than the median concentration (OR=0.54)
Inverse
Monroy Mean 2.54 (range 1.46 – 3.14)
Inverted regression (i.e. prediction of maternal PFOA from birthweight) Unknown
Robeldo Geometric mean: 3.16Girls: -61.64 g, boys: 4.78 g per 1 standard deviation increase in the natural log of maternal PFOA concentration
Inverse for girls, positive for boys
Lauritzen(Norway)
Median 1.62 (range 0.31 – 7.97)
37 g per natural log unit Positive
Lauritzen (Sweden)
Median 2.33 (range 9.60 – 6.70)
-359 g per natural log unit Inverse
Alkhalawi 25th centile 1.9950th centile 2.7575th centile 3.52
“the correlation coefficient for birthweight was negative”
Inverse
Shi 25th centile 0.8250th centile 1.175th centile 1.4
163g per log 10 unit PFOA Positive
The linear analysis that underlies the meta-analysis in Figure A1.4 assumes that the incremental association is not related to PFOA concentration whereas the graphical presentation (Figure A1.5) challenges this assumption. Comparison of the studies in the updated meta-analysis (Figure A1.4) and the graph (Figure A1.5) shows that most studies in the meta-analysis examined blood PFOA concentrations of <20 ng/mL. Only three studies examined blood PFOA of 40 ng/mL and the meta-analysis results do not align well with the results of these three studies at around 40 ng/L or higher. Extrapolation of the meta-analysis result of -11.9 g birthweight/ng/mL leads to a difference in birthweight -476 g at 40 ng/mL PFOA. By contrast, the three studies with data at 40 ng/mL have results ranging from zero (which is the largest study in the dataset) to -400 g birthweight (Figure A1.5). This discrepancy indicates that the results of the meta-analysis should not be used to extrapolate the association with birthweight above about 20 ng/mL PFOA.
A number of studies could not be included in either Figure A1.4 or A1.5 owing to their reporting format. Their results are summarised in Table A1.7. Like the other studies, most report an inverse association, but some report a positive association. Some of the studies have very narrow ranges of PFOA concentration.
The association between PFOS and birthweight
The PFOS analysis follows the same approach as that described above for PFOA, and the set of literature examined is almost identical with the exception that Wu et al. (2012) and Wang et al. (2016) only measured PFOA and Grice et al. (2007) only measured PFOS. There is no quantitative analysis of PFOS that parallels that provided by Johnson et al. (2014) for PFOA.
142

Existing systematic review
Bach et al. (2015) was the only systematic review of the assocation between PFOS and birthweight. The characteristics of this review have already been described above. As was the case with PFOA, the results of studies were graphed where the effect on birthweight was presented as continuous data (see Figure A1.6).
Update
FSANZ updated the graph from Bach et al. (2015) (Figure A1.7). However, fewer studies could be included in this update compared to PFOA because there was no review that had obtained additional information from authors as Johnson et al. (2014) had done. The study by de Cock et al. (2016) was not graphed but listed in the table because the underlying graph by Bach et al. (2016) centred the results of all studies on 7 ng/mL and the population studied by de Cock et al. (2016) had no concentrations of this magnitude. (By contrast, for PFOA the graph was centred on 2 ng/mL which lay in the range of the population of de Cock et al. ).
Most studies show that birthweight is lower when PFOS concentrations are higher, however, the extent of the decline varies greatly among the studies ranging from almost 0 to about100 g lower. There is one study which found that birthweight increases as PFOS concentration increases.
The direction of association in studies which did not report results in a form that could be included on the graph was different (Table A1.8). These studies mostly reported no association, or in one case, a positive association (Robeldo et al. 2015). However, it is not possible to determine the real direction of association from studies in which the authors did not report the actual result but only stated that it was not statistically significant.
143

Figure A1.6 Graph of studies from Bach et al. (2015)
144
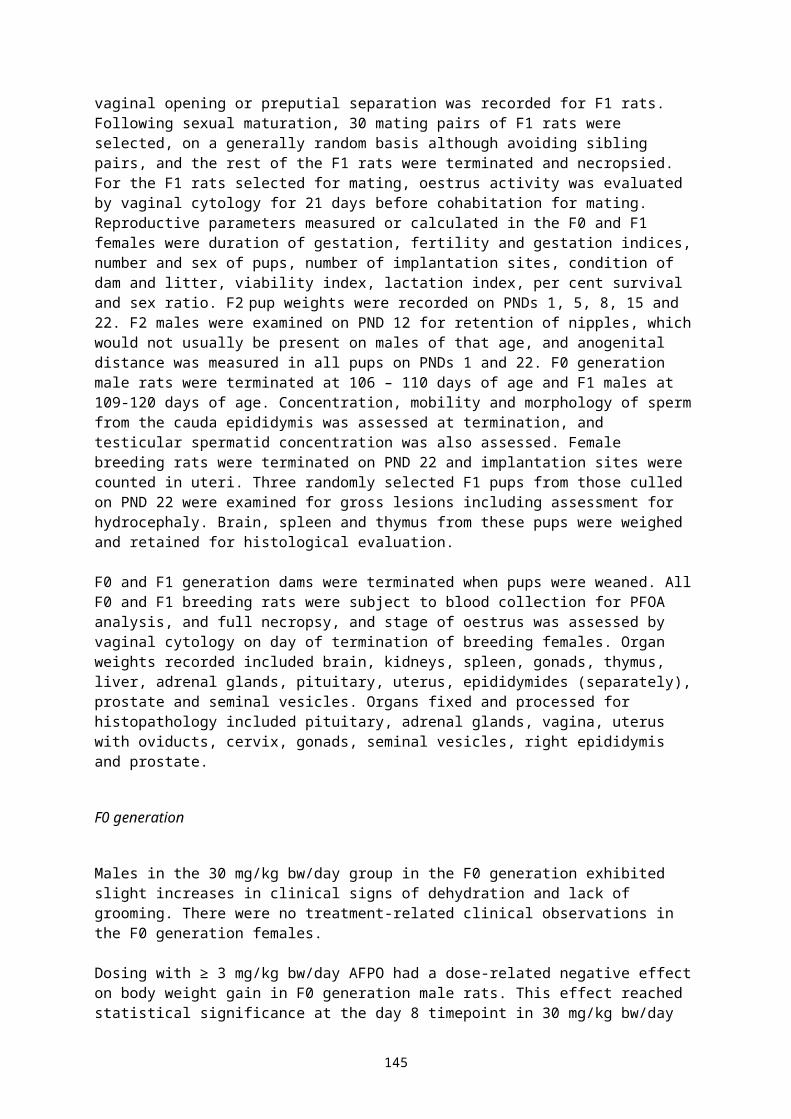
Figure A1.7 FSANZ’s update of the graph of Bach et al. (2015)
145

Table A1.8 Results of studies included in the review which did not report their results in a way that allowed inclusion in Figure A1.7 (or were published in late 2016)First author
PFOS concentration Results Direction of association
ArbuckleMinimum < detectionMedian 5.0Maximum21
Inverted multivariate analysis birthweight not a significant predictor of PFOS Unknown
Grice Unquantified description based on work history
Compared to never exposed pregnancies, ever low exposure was associated with-60 g; ever high exposure with + 70 g etc.
Inconsistent
Kim SKMean 5.6Min: 3.3Max 9.4
Not correlated p>0.2 Unknown
Monroy Mean 18.31 (range 10.8 – 22.9)
Inverted regression (i.e. prediction of maternal PFOS from birthweight) Unknown
Lee25th centile 7.3150th centile 9.3775th centile 12.36
Adjusted analysis: odds of having higher birthweight (above the median of 3.19 kg) not associated with PFOS concentration was greater than the median concentration (OR=0.98)
Little or no association
Robeldo Geometric mean: 12.53.16Girls: 14.16 g, boys 37.5 g per 1 standard deviation increase in the natural logarithm of maternal PFOA concentration
Positive
De Cock Lowest tertile of cord blood: 0.57 – 1.2 ng/mLHighest tertile: 1.9 – 3.2 ng/mL
438 g higher birthweight in the highest tertile of cord blood than the lowest tertile
Positive
Lauritzen(Norway)
Median 9.74 (range 0.95 – 59.6)
74 g per natural log unit Positive
Lauritzen (Sweden)
Median 16.4 (range 2.28 – 55.2)
-292 g per natural log unit Inverse
Alkhalawi 25th centile 7.0250th centile 9.3375th centile 11.86
“the correlation coefficient for birthweight was negative” Inverse
Shi 25th centile 0.6350th centile 1.075th centile 1.58
160 g per log 10 unit PFOS Positive
Commentary
Residual confounding
In addition to the usual considerations about residual confounding, such as whether smoking has been adequately measured and adjusted for, there are several specific gaps in the analyses examined.
One notable feature in the papers is that many authors describe the effect of PFOA and PFOS on birthweight after adjusting for various factors which might confound the relationships, such as gestational age, parity, maternal smoking of body habitus. These analyses are performed separately for PFOS and PFOA. Authors sometimes describe the correlation between PFOS and PFOA in their data sets (Table A1.9). However, there does not seem to have been any consideration of whether the analysis examining PFOA should be adjusted for PFOS concentrations, and vice versa. For example, in the study of Chen et al. (2012) PFOS has a much larger coefficient than PFOA and so it is possible that the PFOA result might be confounded by PFOS.
An exception is the analysis of the C8 cohort by Darrow et al. (2013) who found that simultaneously including both PFOS and PFOA in the same model halved the small effect on
146
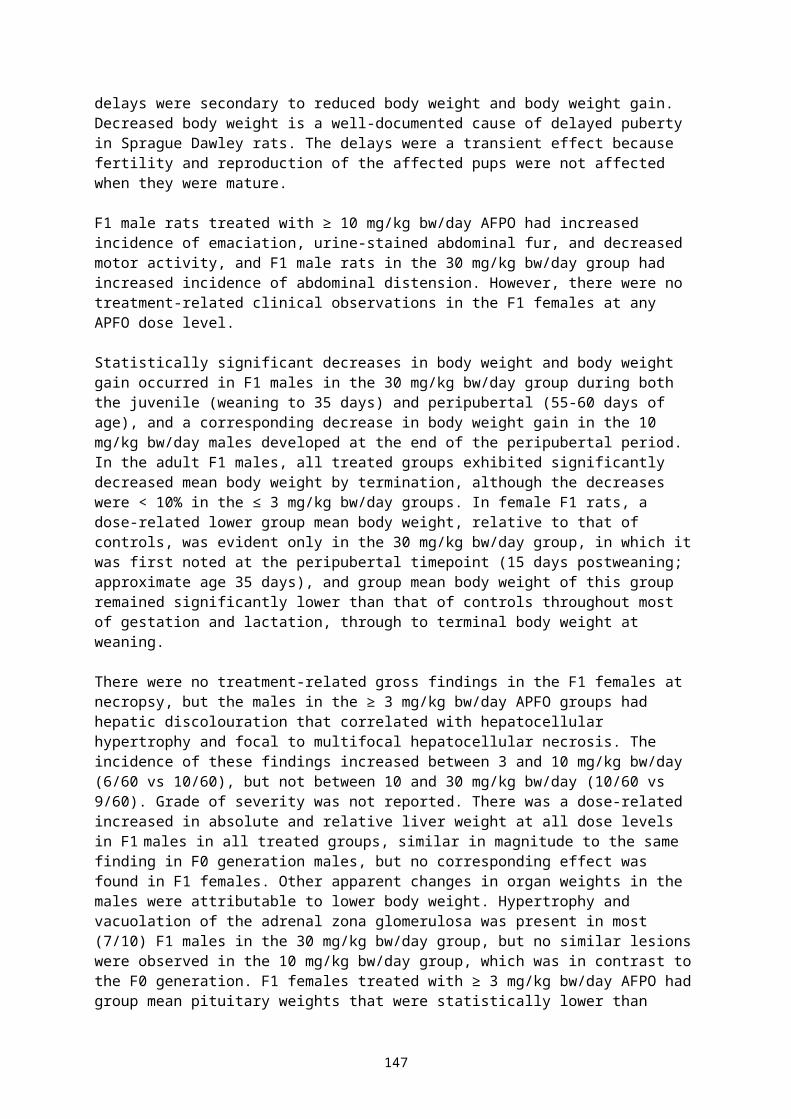
birthweight observed for PFOA did not change the effect for PFOS importantly (Table A1.10). In other words, the effect seen for PFOA was partly due to PFOA acting as a surrogate for PFOS. The correlation between the two PFAS in this study was lower than any other shown in Table A1.9 and raises questions about whether there may be confounding of the PFOA result shown in the Johnson meta-analysis. This study is unusual among the available studies in that the median concentration of PFOS and PFOA was almost the same in their subjects and it has a larger sample size than any study included in the meta-analysis of Johnson et al. (2014).
Furthermore, some authors have measured other PFAS and sometimes other chemicals such as PCBs in the same blood sample and these may or may not have associations with birthweight. Only rarely do authors comment on whether any of these other contaminants confound the relationships of PFOS and PFOA with birthweight. For example, Lauritzen et al. (2016) state that only the odds ratio for the association between PFOA and being born small-for-gestational age remained statistically significant when PFOA, PFOS and five organo-cholorine chemicals were included in the same model.
Table A1.9 Correlations between PFOS and PFOA concentrations in the same blood sample reported by various authorsFirst author, year Type of correlation reported rApelberg, 2007 Spearman’s rank correlation 0.58Bach, 2016 Pearson’s correlation 0.4Chen, 2012 Not stated <0.45Darrow, 2013 Not stated 0.30Kim SK, 2011 Spearman’s rank 0.33Hamm, 2010 Pearson’s correlation for the natural logarithm of the PFAS 0.51Maisonet, 2012 Spearman’s rank correlation 0.72Lauritzen, 2016 Not stated 0.56-0.73
Table A1.10 Adjusted association for PFOS or PFOA, separately, and birthweight and a model which included PFOS and PFOA simultaneously (from Darrow et al. 2013, supplementary material)_____________________________________________________________________Model variant N
birthsChange in birthweight (grams) (95% CI)per 1 unit natural log increase in PFAS
PFOA PFOS
1. Primary model – PFOA 1470 -8 (-28, 12) -2. Primary model – PFOS 1470 - -29 (-66, 7)3. PFOA and PFOS in same model 1470 -4 (-25, 17) -27 (-65, 10)
adjusted for maternal age (cubic terms), educational level (<12 years,12,13-15,16+), smoking status (current, former, non), parity (0,1+), BMI (underweight, normal, overweight, obese), self-reported diabetes, time between conception and serum measurement (year strata)
Birthweight in Australia
A brief summary of the birthweight of Australian infants is provided to give a context for interpreting the results relating to the association with birthweight from the reviews.
There is a national agreement for a minimum set of information to be recorded for all births in Australia. The various States and Territories might collect additional information within their
147

jurisdictional systems. These data are compiled and reported on periodically by the Australian Institute of Health and Welfare, by the State and Territory health departments and are also analysed and published by researchers. The reports focus on different information in different years and so Table A1.11 was compiled from several sources.
Table A1.11 shows that boys are about 200 g heavier than girls at any gestational age. Moreover, birthweight increases by nearly one kilogram across the range of gestational ages that are regarded as full term (greater than 36 weeks and less than 42 weeks) and between the mean birthweight of singleton and twin babies. Consequently, small variations in proportion of boys and girls or gestational ages or the presence of twins in the groups being compared could potentially have lead to the small difference in birthweight found in some of the studies. The meta-analysis result of -11.9 g per ng/mL PFOA predicts -238 g birthweight for a concentration of 20 ng/mL PFOA compared to zero concentration. It is equivalent to a shift of more than half a standard deviation in the birthweight distribution. This is a similar order of magnitude as the difference in birthweight between boys and girls or between the babies born to Indigenous and non-Indigenous in the Northern Territory. As noted elsewhere, the data on which the calculation is based do not necessarily allow a causal association to be drawn.
Table A1.11 Mean birthweight of live-born Australian babies
Year(s) that datarefer to
Group Meanbirthweight (g)
Reference
2012 All live births 3367 Hilder et al. 2014
Live births by plurality
Singletons 3397
Twins 2379
Other multiple births 1633
1998-2007 Live-born singletons by sex and gestation Dobbins et al. . 2012
Male
36 completed weeks 2826 (SD: 428)
38 weeks 3344 (SD: 439)
40 weeks 3632 (SD: 434)
42 weeks 3832 (SD: 462)
Female
36 completed weeks 2720 (SD: 420)
38 weeks 3215 (SD: 425)
40 weeks 3493 (SD: 416)
42 weeks 3665 (SD: 445)
2013 Northern Territory: live births by maternal Indigenous identification
Hall et al. 2015
Indigenous 3092
Not indigenous 3358
148
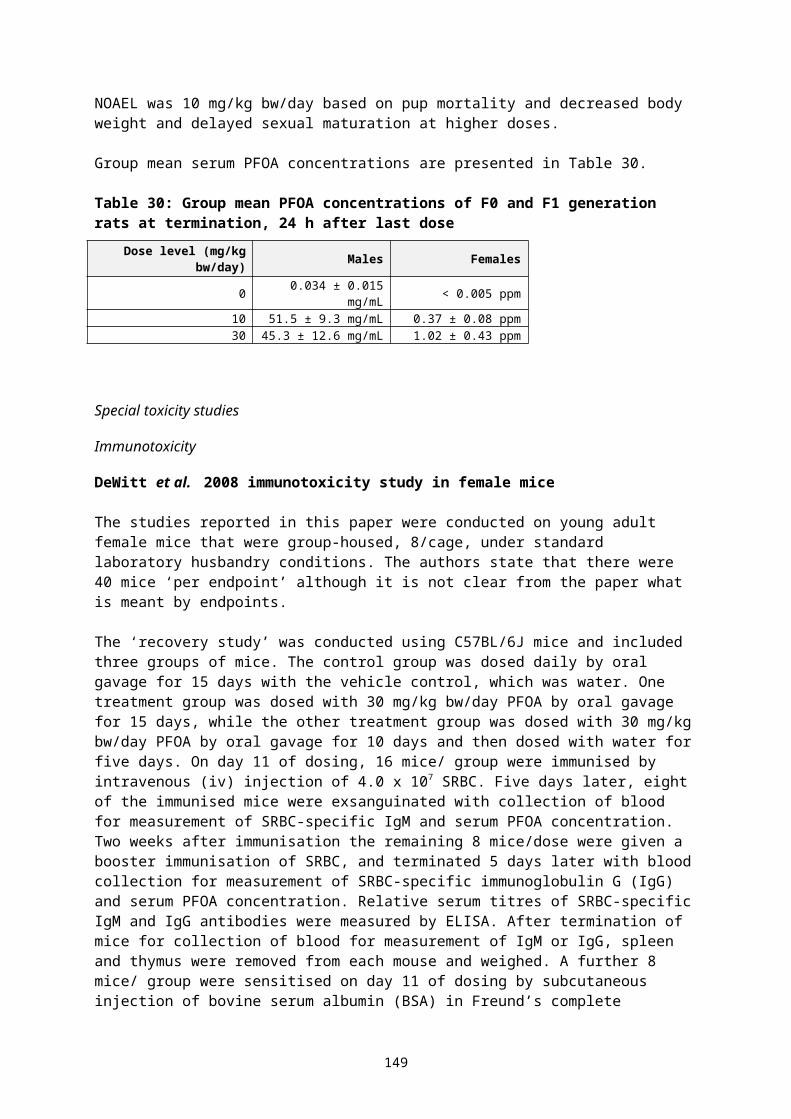
Summary
FSANZ’s update of an existing meta-analysis found that a 1ng/mL increment in PFOA was associated with a decrease of 11.9 g in birthweight. Most studies contributing to the analysis examined populations with PFOA concetrations <20 ng/mL and FSANZ does not believe the result should be extrapolated to higher PFOA concentrations on a per ng/mL basis. The graphical data indicate that the association of birthweight both PFOA and PFOS may attenuate at higher blood concentations. This analysis excludes a number of studies which did not report their results in a suitable format for inclusion. It also assumes that the relationship is linear whereas many of the authors of the underlying paper used a logarithmic transformation when analysing their data. It is possible that the body of evidence contains selective reporting or publication bias in the body of literature leading to an over-representation of studies reporting significant adverse effects on birthweight. Furthermore most studies examined associations for PFOA and PFOS separately and did not conduct a mutually-adjusted analysis despite often noting a substantial correlation between PFOA and PFOS. Other explanations of the association are also possible, such as the presence of a physiological change leading to increases in blood PFAS and decreases in birthweight.
149

Annex
Literature search
Several additional studies were noted from an informal search in PubMed. Then, one of the search strategies given by Johnson et al. (2014) was selected in run in PubMed. Annex Table 1 shows the search terms and retrieved results as at December 15, 2016. Although Johnson et al. (2014) had run this on 30th April 2012, FSANZ selected a start date of ‘5 years ago’ which started the search at the end of 2011 to allow for possible delays in cataloguing papers in PubMed. Given the wide-ranging search strategy used by Johnson et al. (2014), most of the papers were ruled out based on their titles. The search strategy identified four papers which were listed in Johnson et al. (2014) and four papers subsequently identified by Bach et al. (2015) in their later systematic review. Therefore it was decided not to replicate the search strategy of Bach et al. (2015). Since the search conducted by Bach et al. (2015), eight additional papers have been published (Annex Figure 1). The decision about whether these and other papers described in the two existing reviews should be included in the FSANZ review is given in the body of this report.
Annex Table 1 Search strategy in PubMed, with results retrieved for the final search on 15 December, 2016
Search Query Items found
#5 Search #4 Filters: published in the last 5 years 493
#4 Search (#1 AND #2 AND #3) 1437
#3 Search (epidemio* OR cohort OR participant* OR questionnaire) 2899423
#2 Search (developmental biology OR embryonic fetal development OR embryonic* OR fetal development OR growth and development OR development* OR embryology OR ecotoxicology OR ecolog* OR toxic* OR toxicol* OR toxicogenetic* OR growth OR environment and public health OR body weight OR body weights OR birth weight OR birth weights OR birthweight* OR infant, low birth weight OR embryo loss OR embryo losses OR gestational age OR gestational ages OR endocrine disruption OR endocrine disrupting OR reproduction)
11250338
#1 Search (perfluorooctanoic acid OR perfluoro n octanoic acid OR pentadecafluorooctanoic acid OR apfo OR perfluorinated octanoic acid OR perfluorooctanoate OR perfluorooctanoyl chloride OR pfoa OR fluorinated telomer alcohol OR fluorinated telomer alcohols OR fluorotelomer alcohol OR fluorotelomer alcohols OR fluorocarbon emulsion OR perfluorocarbon* OR fluorocarbon polymer OR fluorocarbon polymers OR fluorinated polymer OR fluorinated polymers OR polyfluoroalkyl* OR pfaa OR perfluoroalkyl chemical OR perfluoroalkyl chemicals OR c8 OR perfluorochemical* OR pfcs OR perfluoroalkyl carboxylate OR perfluorocarboxylates OR pfca OR perfluorinated carboxylic acid OR pentadecafluorooctanoate)
33342
150

Annex Figure 1 Screening outcome of the 493 items retrieved from the PubMed search
Updated meta-analysis of PFOA and birthweight
1. Demonstration that identical results are obtained
FSANZ abstracted the effect sizes and 95% CI from Figure 5 of Johnson et al. (2014) (which is reproduced in Figure A1.2 of this report) and analysed these in STATA 13.1 (Intercooled, College Station, TX) using the command
metan meandiff lci uci, random label(namevar=authors)
where meandiff, lci and uci were the names of columns containing the data for the effect size, lower bound and upper bound of the confidence interval respectively. This command generates a random effects model using the DerSimonian-Laird method as was done by Johnson et al. (2014). The forest plot generated is shown below in Annex Figure 2. The overall effect is identical to that reported by Johnson et al. (2014) and the weight for each study is identical to that shown in Figure A1.2 except that Johnson et al. (2014) has rounded to 1 decimal. The overall effect and its confidence interval are also the same except that Johnson et al. (2014) show the lower bound of the confidence interval as 29.8 (Figure A1.2) whereas Annex Figure 2 shows the lower bound as -29.85.
151

NOTE: Weights are from random effects analysis
Overall (I-squared = 38.2%, p = 0.113)
ID
Whitworth, 2012
Fei, 2007
Chen, 2012
Study
Kim S, 2011
Apelberg, 2007
Hamm, 2010
Fromme, 2010
Washino, 2009
Maisonet, 2012
-18.89 (-29.85, -7.94)
ES (95% CI)
-28.40 (-60.30, 3.50)
-10.60 (-20.80, -0.50)
-11.20 (-26.00, 3.70)
154.00 (-83.50, 391.70)
-64.00 (-125.20, -2.70)
-12.40 (-32.80, 8.00)
-213.00 (-423.70, -2.20)
-22.60 (-60.80, 15.60)
-34.20 (-54.80, -13.50)
100.00
Weight
8.88
27.52
21.68
%
0.21
2.94
16.01
0.27
6.69
15.80
0-424 0 424
Annex Figure 2 FSANZ’s replication of the forest plot from Figure 5 of Johnson et al. (2014) prior to adding new studies
2. Updating the meta-analysis
As described, FSANZ added information for two studies (Darrow et al. 2013; Bach et al. 2016) which reported results from a linear regression model. Annex Tables 2 and 3 and Annex Figure 2 show the risk of bias for these two studies using the criteria described by Johnson et al. (2014) in the online supplementary material.
Darrow et al. (2013) presented results from a multivariate regression in which PFOA was entered as its natural logarithm and also from a multivariate linear regression in which PFOA was not transformed. The latter is consistent with the calculations used by Johnson et al. (2014) in the meta-analysis being updated. Darrow et al. (2013) expressed the linear result for the interquartile range in their population which was 22 ng/mL (This is an analysis from the C8 study and so the range of exposures are wider than might be seen in other studies). The effect per ng/mL, and its confidence interval was calculated by dividing by 22. Darrow et al. (2013) analysed their population in two ways. One analysis included all births occurring from 2005 onwards, even though many of these occurred before the woman had her blood sampled, and included multiple pregnancies per woman if these had occurred. The second analysis was included only the first birth that was conceived after the blood sample was drawn. FSANZ has used the second result because it aligns with Johnson et al. (2014) who had excluded prior results from the C8 study from their main analysis on the grounds that the C8 results were based on retrospective assessment. As shown in Annex Table 2, this analysis achieves a ‘low risk of bias’ rating whereas the analysis of all births achieves a ‘probably low risk of bias’ rating.
Bach et al. (2016) analysed their data to consider the effect on all births and on the subset of term births. For both groups, they presented the results in two ways; both per 0.1 ng/mL PFOA and per interquartile range (IQR) in their population, which was 1.1 ng/mL PFOA from a multivariate linear regression. The change per 1 ng/mL, and its confidence interval was calculated for both modes of presentation. FSANZ based its primary analysis on all births
152

because most studies included in Johnson et al. (2014) were based on all births, not term births and the calculated result based on the IQR as this was regarded as less influenced by rounding for reporting purposes.
The forest plot generated after adding these two studies is showin in Figure A1.4. It reduces the association between PFOA and birthweight to -11.9 g birthweight (95% CI: -21.6 to -2.2; p=0.001). The I2 increased from 38.2% to 70% indicating that there is substantial heterogeneity (Higgins et al. 2003) among the studies in the updated analysis.
Annex Figure 2 Summary of the risk of bias assessment of studies added to the meta-analysis
153

Annex Table 2 Risk of bias assessment of Darrow et al. (2013) using the criteria of Johnson et al. (2014)Bias Rating Support for judgementRecruitment Low risk The strategy for recruiting participants was consistent across study groups.Blinding Probably low risk The authors did not discuss blinding but the study design prevents knowledge of
exposure groups.
Confounding Low risk Adjusted for maternal age; restricted the analysis of birth weight to term births but used indicator variables to adjust for week of gestation up to 41+ in the analysis.
Exposure assessment
Low risk for ‘first prospective birth analysis’
(Probably low risk for ‘all births’ analysis)
Exposure was measured in blood, 26% before blood drawn, but quite close in time.The exposure assessment methods were robust and included a detailed description of quality assurance/control.
Incomplete outcome data Probably Low risk
17% could not be matched to birth records, tended to be better educated, other factors including median PFOA and PFOS same in matched and not matched groups
Selective reporting Low risk The study is free of suggestion of selective outcome reporting. All of the study’s specified outcomes were adequately reported.
Other bias Low risk No other potential biases are suspected.Conflict of interest Low risk The authors report no conflict of interest, and associated funds and persons
appear to be from government and/or academia only.
Design: Mostly prospective cohort study. Participants: Singleton term pregnancies of white women between 2005-2010 in the Mid-Ohio Valley. Participants are part of the much
larger C8 Health Project. In women having blood draw 2005-6 and pregnancy questionnaire 2008-11. Exposure: Serum PFOA measured 2005-6. Outcomes: Preterm, PIH, low birthweight; Birth weight (continuous) in term infants. All reported per ln unit increase, per IQR increase and
quantiles. Notes: Although excluded from analysis of PFOA and term low birth weight, the relationship between PFOA and preterm birth was
examined separately (findings: non-significant adjusted OR for both all births and when restricted to first prospective birth).
154

Annex Table 3 Risk of bias assessment of Bach et al. (2016) using the criteria of Johnson et al. (2014)Bias Rating Support for judgementRecruitment Low risk Random sampling of participants in a cohort study in each year of recruitment therefore
strategy for recruiting participants was consistent across study groups.Blinding Low risk Knowledge of the exposure groups was adequately prevented during the study.Confounding Low risk The authors adjusted for both maternal age and gestational age in their analysis.Exposure assessment Probably low risk Not much detail but cross-references another study.Incomplete outcome data Low risk The study did not have incomplete outcome data.Selective reporting Low risk The study is free of suggestion of selective outcome reporting. All of the study’s specified
outcomes were adequately reported.Other bias Low risk No other potential biases are suspected.
Conflict of interest Low risk The authors report no conflict of interest, and associated funds and persons appear to be from government and/or academia only.
Design: Cross-sectional study Participants: Live-born singleton deliveries to nulliparous women, Denmark Exposure: PFOA concentrations in maternal serum if collected between 9-20 weeks (continuous), apparently blood was frozen after
collection n=1507 Outcomes: Birth weight (continuous; z-score standardised by gestational age), head circumference, length, gestational age (preterm
delivery)
155

References
Alkhalawi E, Kasper-Sonnenberg M, Wilhelm M, Volkel W, Wittsiepe J. (2016) Perfluoroalkyl acids (PFAAs) and anthropometric measures in the first year of life: Results from the Duisburg Birth Cohort. J Toxicol Environ Health A 79(22-23):1041-1049. Published online Dec 7.
Apelberg BJ, Witter FR, Herbstman JB, Calafat AM, Halden RU, Needham LL, Goldman LR. (2007). Cord serum concentrations of perfluorooctane sulfonate (PFOS) and perfluorooctanoate (PFOA) in relation to weight and size at birth. Environ Health Perspect 115,1670 – 6.
Arbuckle TE, Kubwabo C, Walker M, Davis K, Lalonde K, Kosarac I et al. (2013) Umbilical cord blood levels of perfluoroalkyl acidsand polybrominated fl ame retardants. Int J Hyg Environ Health, 216, 184 – 94.
Bach CC, Bech BH, Brix N, Nohr EA, Bonde JPE, Henriksen TB (2015) Perfluoroalkyl and polyfluoroalkyl substances and human fetal growth: A systematic review Crit Rev Toxicol, 45(1): 53–67
Bach CC, Bech BH, Nohr EA, Olsen J, Matthiesen NB, Bonefeld-Jørgensen EC, Bossi R, Henriksen TB. (2016). Perfluoroalkyl acids in maternal serum and indices of fetal growth: the Aarhus Birth Cohort. Environ Health Perspect 124:848–854.
Bonzini M, Coggon D, Palmer KT (2007). Risk of prematurity, low birthweight and pre-eclampsia in relation to working hours and physical activities: a systematic review. Occup Environ Med, 64, 228– 43.
Chen MH, Ha EH, Wen TW, Su YN, Lien GW, Chen CY, et al. (2012).Perfl uorinated compounds in umbilical cord blood and adverse birth outcomes. PLoS One 7, e42474.
Darrow LA, Stein CR, Steenland K. (2013). Serum perfluorooctanoic acid and perfluorooctane sulfonate concentrations in relation to birth outcomes in the Mid-Ohio Valley, 2005 – 2010. Environ Health Perspect 121, 1207 – 13.
de Cock M, De Boer MR, Lamoree M, Legler J, Van De Bor M (2016). Prenatal exposure to endocrine disrupting chemicals and birth weight-A prospective cohort study.J Environ Sci Health A Tox Hazard Subst Environ Eng. 2016 Jan 28;51(2):178-185 Epub 2015 Nov 25.
Dobbins TA, Sullivan EA, Roberts CL, Simpson JM. Australian national birthweight percentiles by sex and gestational age, 1998–2007 MJA 2012; 197: 291–294 doi: 10.5694/mja11.11331
EFSA Perfluorooctane sulfonate (PFOS), perfluorooctanoic acid (PFOA) and their salts. Scientific Opinion of the Panel on Contaminants in the Food chain. The EFSA Journal (2008) 653: 1-131.
Fei C, McLaughlin JK, Tarone RE, Olsen J. (2007). Perfluorinated chemicals and fetal growth: a study within the Danish National Birth Cohort. Environ Health Perspect 115, 1677 – 82.
156

Fei C, McLaughlin JK, Tarone RE, Olsen J. 2008. Fetal growth indicators and perfluorinated chemicals: a study in the Danish National Birth Cohort. Am J Epidemiol 168:66–72.
Fromme H, Mosch C, Morovitz M, Alba-Alejandre I, Boehmer S, Kiranoglu M, et al. (2010). Pre- and postnatal exposure to perfl uorinated compounds (PFCs). Environ Sci Technol, 44, 7123– 9.
Grice MM, Alexander BH, Hoffbeck R, Kampa DM (2007). Self-reported medical conditions in perfluorooctanesulfonyl fluoride manufacturing workers. J Occup Environ Med 49: 722-9.
Hamm MP, Cherry NM, Chan E, Martin JW, Burstyn I. (2010). Maternal exposure to perfluorinated acids and fetal growth. J Expo Sci Environ Epidemiol 20, 589 – 97.
Hall J, Case A, O’Neil L. Northern Territory Midwives’ Collection. Mothers and Babies 2013. Department of Health, Darwin, 2015 Available at http://digitallibrary.health.nt.gov.au/prodjspui/handle/10137/640.
Halldorsson TI, Rytter D, Haug LS, Bech BH, Danielsen I, Becher G, Henriksen TB,Olsen SF 2012. Prenatal exposure to perfluorooctanoate and risk of overweight at 20 years of age: a prospective cohort study. Environ Health Perspect 120: 668-673.
Higgins JPT, Thompson SG, Deeks JJ, Altman, DG. Measuring inconsistency in meta-analyses. Brit Med J 2003;327:557-60.
Hilder L, Zhichao Z, Parker M, Jahan S, Chambers GM 2014. Australia’s mothers and babies 2012. Perinatal statistics series no. 30. Cat. no. PER 69. Canberra: AIHW.
Inoue K, Okada F, Ito R, Kato S, Saski S, Nakajima S, et al. (2004). Perfluorooctane sulfonate (PFOS) and related perfluorinated compounds in human maternal and cord blood samples: assessment of PFOS exposure in a susceptible population during pregnancy. Environ Health Perspect, 112,1204 – 7.
Johnson PI, Sutton P, Atchley DS, Koustas E, Lam J, Sen S, Robinson KA, Axelrad DA, Woodruff TJ. 2014. The Navigation Guide—evidence-based medicine meets environmental health: systematic review of human evidence for PFOA effects on fetal growth. Environ Health Perspect 122:1028–1039; http://dx.doi.org/10.1289/ehp.1307893
Kim S, Choi K, Ji K, Seo J, Kho Y, Park J, Kim S, Park S, Hwang I, Jeon J, Yang H,Giesy JP. 2011. Trans-placental transfer of thirteen perfluorinated compounds andrelations with fetal thyroid hormones. Environ Sci Technol 45: 7465-7472.
Kim SK, Lee KT, Kang CS, Tao L, Kannan K, Kim KR, et al. 2011. Distribution of perfluorochemicals between sera and milk from the same mothers and implications for prenatal and postnatal exposures. Environ Pollut 159:169–174.
Kishi R, Nakajima T, Goudarzi H, Kobayashi S, Sasaki S, Okada E, et al. 2015. The association of prenatal exposure to perfluorinated chemicals with maternal essential and long-chain polyunsaturated fatty acids during pregnancy and the birth weight of their offspring: the Hokkaido Study. Environ Health Perspect 123:1038–1045.
Kishi R, Sasaki S, Yoshioka E, Yuasa M, Sata F, Saijo Y, et al. Cohort profile: the Hokkaido study on environment and children’s health in Japan. Int J Epidemiol. 2011;40:611–618.
Lauritzen HB, Larose TL, Olen T, Sandanger TM, Odland JA, van de Bor M, Jacobsen GW. (2016) Maternal serum levels of perfluoroalkyl substances and organochlorines and indices
157

of fetal growth: a Scandinavian case-cohort study. Pediatr Res Oct 26. doi: 10.1038/pr.2016.187. [Epub ahead of print]
Lee YJ, Kim MK, Bae J, Yang JH. (2013). Concentrations of perfl uoroalkyl compounds in maternal and umbilical cord sera and birth outcomes in Korea. Chemosphere 90, 1603 – 9.
Maisonet M, Terrell ML, McGeehin MA, Christensen KY, Holmes A, Calafat AM, Marcus M (2012). Maternal concentrations of polyfl uoroalkyl compounds during pregnancy and fetal and postnatal growth in British girls. Environ Health Perspect 120, 1432 – 7.
Monroy R, Morrison K, Teo K, Atkinson S, Kubwabo C, Stewart B, et al. (2008). Serum levels of perfluoroalkyl compounds in human maternal and umbilical cord blood samples. Environ Res 108:56–62.
Nolan LA, Nolan JM, Shofer FS, Rodway NV, Emmet EA. (2009). The relationship between birth weight, gestational age and perfluorooctanoic acid (PFOA)-contaminated public drinking water. Reprod Toxicol 27, 231 – 8.
Robledo CA, Yeung E, Mendola P, Sundaram R, Maisog J, Sweeney AM, et al. 2015. Preconception maternal and paternal exposure to persistent organic pollutants and birth size: the LIFE Study. Environ Health Perspect 123:88–94, doi:10.1289/ ehp.1308016.
Savitz DA. (2007). Biomarkers of perfluorinated chemicals and birth weight (editorial). Environ Health Perspect 115, 528 – 9.
Savitz DA, Stein CR, Bartell SM, Elston B, Gong J, Shin HM, Wellenius GA. (2012a) Perfluorooctanoic acid exposure and pregnancy outcome in a highly exposed community. Epidemiology 23, 386 – 92.
Savitz DA, Stein CR, Elston B, Wellenius GA, Bartell SM, Shin HM, et al. (2012b) Relationship of perfluorooctanoic acid exposure to pregnancy outcome based on birth records in the mid-Ohio Valley. Environ Health Perspect 120,1201 – 7.
Shi Y, Yang L, Li J, Lai J, Wang Y, Zhao Y, Wu Y (2016). Occurrence of perfluoroalkyl substances in cord serum and association with growth indicators in newborns from Beijing. Chemosphere. Nov 22;169:396-402. doi: 10.1016/j.chemosphere.2016.11.050. [Epub ahead of print]
So MK, Yamashita N, Taniyasu S, Jiang Q, Giesy JP, Chen K, Lam PK (2006) Health risks in infants associated with exposure to perfluorinated compounds in human breast milk from Zhoushan, China. Environ Sci Technol 40: 2924-9.
Stein CR, Savitz DA, Dougan M. 2009. Serum levels of perfluorooctanoic acid andperfluorooctane sulfonate and pregnancy outcome. Am J Epidemiol 170: 837-846.
US EPA (2014a) Health effects document for perfluorooctane sulfonate (PFOS). EPA 822-R-14-002.
US EPA (2014b) Health effects document for perfluorooctanoic acid (PFOA). EPA 822-R-14-001.
Verner MA, Loccisano AE, Morken NH, Yoon M, Wu H, McDougall R et al. (2015) Associations of perfluoroalkyl substances (PFAS) with lower birth weight: an evaluation of potential confounding by glomerular filtration rate using a physiologically based pharmacokinetic model (PBPK). Environ Health Perspect 123:1317–1324.
158

Wang Y, Adgent M, Su PH, Chen HY, Chen PC, Hsiung CA, Wang SL. (2016) Prenatal Exposure to Perfluorocarboxylic Acids (PFCAs) and Fetal and Postnatal Growth in the Taiwan Maternal and Infant Cohort Study. Environ Health Perspect.124(11):1794-1800.
Washino N, Saijo Y, Sasaki S, Kato S, Ban S, Konishi K, et al. (2009) Correlations between prenatal exposure to perfluorinated chemicals and reduced fetal growth. Environ Health Perspect 117, 660 – 7.
Whitworth KW, Haug LS, Baird DD, Becher G, Hoppin JA, Skjaerven R, et al. (2012) Perfluorinated compounds in relation to birth weight in the Norwegian Mother and Child Cohort Study. Am J Epidemiol 175, 1209 – 16.
Wu K, Xu X, Peng L, Liu J, Guo Y, Huo X. (2012) Association between maternal exposure to perfluorooctanoic acid (PFOA) from electronic waste recycling and neonatal health outcomes. Environ Int 48:1 – 8.
159

Appendix 2: Observational studies of PFAS and cholesterol concentrations
Executive Summary
In summary, the cross-sectional studies overall present a fairly consistent picture. Studies in both adults and children suggest a positive association between total cholesterol (total-C) and low density lipoprotein cholesterol (LDL-C) and PFOA concentration at very low concentrations of PFOA but not at higher concentrations. At around 25 ng/mL blood concentration, total-C is about 0.2 - 0.3 mmol/ higher than total-C in the lowest PFOA blood concentration groups in the studies, above this the association plateaus. The quantitative results from pregnant women are more inconsistent, but this may be related to changes in blood volume during pregnancy. There appears to be little or no association with high density lipoprotein cholesterol (HDL-C), and not all studies have adverse findings. Similar results were seen for PFOS with a plateau of 0.3 mmol/L total-C which is reached at around 40 ng/mL blood concentration. The lack of association reported in some occupational groups might be due to the lack of sufficient subjects with low concentrations of PFAS to detect the effect. The few longitudinal data that are available do not contradict the findings in the cross-sectional studies. However, the results in humans do contradict the findings in animals because increased PFAS concentrations in animals decrease total-C.
This report has focused on describing the results from the available studies but has not considered either p-values or standard errors for several reasons. Firstly, p-values are not a measure of effect but describe probability in relation to the null hypothesis. . If there is truly no effect or association, then this will not be statistically significant, by definition. It is not possible to determine whether the inconsistent information presented across the studies occurs because the samples were not tested for certain cholesterol fractions or whether the authors have failed to report non-significant results. Therefore the question of whether there is publication bias affecting this body of literature must be raised.
Studies have been included regardless of whether or not they have reported their results in a common format because failure to do this may have introduced a bias into the body of evidence. As far as it is possible to tell, the results of studies which could not be graphed do not contradict the results of studies which could be graphed in a qualitative sense although it is not possible to make a quantitative comparison.
160

Background
Animal studies suggest that there is an inverse association between PFOA and serum cholesterol concentrations, namely that as PFOA increases, serum cholesterol concentration decreases. The purpose of this report is to consider the epidemiological studies that have examined the association between PFOA or PFOS and serum cholesterol concentrations in humans. Total-C primarily consists of LDL-C and HDL-C subfractions. Increases in LDL-C are associated with increases in risk of coronary heart disease whereas increases in HDL-C are associated with decreases in risk of coronary heart disease. The concentration of LDL-C is about three times higher than the concentration of HDL-C and so changes in total-C generally reflect changes in LDL-C, although there can be exceptions. Total-C and HDL-C are measured and material for laboratory standardisation has been available for several decades. LDL-C can be measured directly although it is often calculated from HDL-C and triglyceride concentration using the Friedewald equation.
In early 2008, the EFSA concluded “Epidemiological studies in PFOA-exposed workers do not indicate increased cancer risk. Some have shown associations with elevated cholesterol and triglycerides, or with changes in thyroid hormones, but overall there is no consistent pattern of changes.” At that time, a limited number of papers were available and many of them contained analyses of the same or overlapping study populations.
In 2014, the C8 Science Panel “concluded there is a “probable link” between “exposure to PFOA and high cholesterol” among the population around DuPont’s Washington Works facility. The term “probable” is related to the context of the settlement agreement for the Class Action lawsuit “to mean that, given the available scientific evidence, it is more likely than not that among class members a connection exists between PFOA exposure and a particular human disease. The finding of a probable link does not mean causality has been established.” (http://ehp.niehs.nih.gov/122-a338/). In other words, the term “probable” might be used by other authors with a different meaning. Others have commented that the prevalence of elevated cholesterol concentrations in the C8 population is unexpectedly low compared to the general US population and propose that this affected the results in the C8 study analysis.
In 2016, the US EPA report stated “These epidemiology studies have generally found positive associations between serum PFOA concentration and total cholesterol (TC) in the PFOA-exposed workers and the high exposure community (i.e., increasing lipid level with increasing PFOA); similar patterns are seen with LDLs but not with HDLs. These associations were seen in most of the general population studies, but similar results also were seen with PFOS, and the studies did not always adjust for these correlations.” (US EPA, 2016b)
Because a number of studies had been published between the EFSA and US EPA reports, the US EPA was able to draw on a greater body of literature than EFSA. FSANZ has examined the literature cited by these two bodies and identified some additional studies.
FSANZ has attempted to answer the following question:Is blood PFOA or PFOS concentration related to total-C, LDL-C or HDL-C concentration?
Table A2.1 shows the scoping for this review. Preliminary examination of other reports indicates that there are no randomised controlled trials in the literature.
161

Table A2.1: PECO criteria for the review of PFOA, PFOS and cholesterol concentration
Population Children or adults who do not have serious diseases - such as cancer, renal failure
Exposure
Direct measure of PFOA and/or PFOS in serumOrEstimates of longterm exposure based on environmental data such as occupation, concentrations in drinking water
Comparator Different levels of PFOA and/or PFOS concentration or exposure
OutcomeTotal-C, LDL-C, HDL-C (continuous)Incidence of elevated cholesterol concentrations or a marker of these, e.g. commencement of cholesterol lowering medication
Study designClinical trials (including non-randomised); observational studies of individuals (Longitudinal (cohort); case-control, cross-sectional); (ecological studies excluded)
Literature examined
PFOS and PFOA often occur together and so reviews of either substance were considered to compile an initial list of existing original literature. The initial assessment examined the reports from EFSA concerning both PFOS and PFOA (EFSA, 2008) and the reports from the US EPA concerning PFOS (US EPA, 2014a) and PFOA (US EPA, 2014b). No information about how the literature reviewed was collated is given in these reports. No systematic literature reviews of this topic were identified in PubMed (https://www.ncbi.nlm.nih.gov/pubmed).
Existing reviews – overview
Table A2.2 shows the papers referred to in the reports. EFSA referred to five papers of PFOA which were published between 1980 and 2007 (EFSA 2008) whereas the US EPA report on PFOA refers to papers published between 2003 and 2015 (US EPA, 2016b). Three papers published prior to 2000 cited by EFSA were not discussed in the US EPA report.
Table A2.2 also shows the range of styles in which each paper reported the association between PFAS and serum cholesterol concentration. Many used linear regression, with or without logarithmic transformation of the PFAS concentrations, some used the PFAS data as a continuous variable while others categorised it into between three and 10 quantiles. Some papers reported results from both continuous and categorical analyses. Most, but not all, papers treated PFAS as the dependent variable and cholesterol as the independent variable.
It is evident that most papers have been published after the EFSA report was released. The table also shows a number of study reports which FSANZ has not been able to access. However, descriptions of these reports indicate that their results were also published in the papers from the 3M study of the same period. Table A2.2 also shows FSANZ’s conclusion about whether to include each paper in its assessment. The rationale for FSANZ’s decision is given in the following sections.
162

Table A2.2 Papers cited by EFSA (2008) and US EPA (2016a, 2016b) reports and FSANZ’s decision about whether to include or exclude these papers from the graphical presentation
First authorYe
ar o
f pub
licat
ion Location
of study
Study
Year
of d
ata
colle
ctio
n
N
subjects
Reporting format used by authors to
describe the association of cholesterol with
PFAS
EFSA
200
8
US
EPA
201
6 a,
2016
b
PFO
A
FSA
NZ
Ubel 1980 3M - - Not yet accessed - e
Gilliland 1996 Cottage
Grove, US
3M 1985-9 115 Correlation with total serum fluoride (said to
reflect PFOA); linear regression for HDL-C in 5
uneven groups
- e
Olsen 1998 3M 1993, 1995 191 Not yet accessed e
Olsen 2000 3M 1993, 1995,
1997
265 Not yet accessed e
Olsen 2001a Antwerp,
Decatur
3M 2000 - Document not accessed - e
Olsen 2001b - 3M 1993, 1995,
1997
- Document not accessed - e
Olsen 2003a Antwerp,
Decatur
3M 2000 421 M, 97
F
Unadjusted means by quartile of PFOS -
(PFOS
)
Olsen 2003b Cottage
Grove
3M 2000 - Document not accessed e
Emmet 2006 US (lies within
C8 area)
2004 371 t-test comparing PFOA in those with abnormal
and normal cholesterol concentrations;
correlation coefficients from univariate
regression
- e
Olsen 2007 Cottage
Grove.
Antwerp,
Decatur
3M 2000 506 Adjusted mean cholesterol by PFOA decile, and
OR for abnormal cholesterol
(PFOA
)
Sakr 2007a US C8 2004 1019 Adjusted increase in cholesterol per 1ppm
increase in serum PFOA
e
Sakr 2007b C3 1979-2004 454 Mixed methods regression using multiple
measures per person
e
Steenland 2009 US C8 2005-6 46,294 Adjusted mean difference in natural log of
cholesterol in PFAS deciles, graphed after
exponentiation
-
Costa 2009 Italy - 2007 37
exposed,
107
control
Adjusted mean difference from regression -
Frisbee 2010 US C8 2005-6 12,476
children,
Results from continuous multivariate regression
presented in quintiles-
Nelson 2010 US NHANES 2003-4 860 Adjusted means for quartiles of PFAS -
Chatearu-
Degat
2010 Canada
(artic)
- 2004 723 Adjusted means for quartiles of PFOS -
Eriksen 2013 Denmark - 1993-7 753 Results from continuous multivariate regression
presented in octiles-
Fisher 2013 Canada Health
Measures
Survey
2007-9 2345
(1168 for
LDL-C)
Results from log continuous multivariate
regression; OR for elevated cholesterol- q
163

First author
Year
of p
ublic
atio
n Location
of study
Study
Year
of d
ata
colle
ctio
n
N
subjects
Reporting format used by authors to
describe the association of cholesterol with
PFAS
EFSA
200
8
US
EPA
201
6 a,
2016
b
PFO
A
FSA
NZ
Fitz-Simon 2013 US C8 2005-6 & 2010 521 Change in LDL-C in tertiles of change in PFAS
(longitudinal analysis)- e
Winquist 2013 US C8 2005-11 32,254 Hazard ratio for developing
hypercholesterolemia (self-reported) based on
cumulative estimated PFOA exposure over 20
years or blood data from 2005-6
- e
Starling 2014 Norway MoBA 2003-4 891
pregnant
women
Adjusted regression using quartiles of
natural log -PFAS, reported after back-
transformation
-
Geiger 2014 US NHANES 1999-2008 815
<19 years
Adjusted regression by tertiles of PFAS -
Steenland 2015 US C8 longterm
cumulative
estimate
2845 Incidence of hypercholesterolaemia not
assessed as self-report was not validated- e
OR: odds ratio, included in this review,-: not referred to in the review; c: comment e- excluded q- included for qualitative assessment but not quantitative assessment
Additional studies identified by FSANZ
The following search strategy was conducted in PubMed on 15 Nov, 2016
(PFOA[All Fields] AND PFOA[All Fields] OR PFOS[All Fields] AND ("cholesterol"[MeSH Terms] OR "cholesterol"[All Fields])) AND "humans"[MeSH Terms]
This retrieved 51 articles from which FSANZ identified 10 papers (Table A2.3) which had not been identified from earlier reviews and reports (Table A2.2). In particular, these additional studies extend the number of papers describing the association in children and pregnant women. There were also 17 papers which had been identified from the earlier reviews. Repeating the search in mid-December 2016 did not yield additional papers.
164

Table A2.3 Additional studies identified by FSANZ not referred to in EFSA (2008), US EPA (2016a), US EPA (2016b) and FSANZ’s decision about whether to include or exclude these papers from the graphical presentation
Inverted relationship refers to an analysis is which authors used PFAS as the dependent variable and cholesterol as the independent variable and so calculated the change in
PFAS per unit change in cholesterol; OR: odds ratio;
165
First authorYe
ar o
f pu
blic
atio
nLocation of study
Study
Year
of d
ata
colle
ctio
n
N subjects Reporting format
FSA
NZ
Lin 2009 US NHANES 1999 & 2003-4
474 adol-escents; 969 adults
OR for abnormal HDL-C per unit increase in log PFAS
e
Lin 2013 Taipei,Taiwan
Young Taiwanese Cohort Study
2006-8 664 aged 12-30 years
Adjusted means of LDL-C for 4 quantiles of PFAS; different quantile definitions for each PFAS. Data for total-C and HDL-C not presented, but apparently not significant (using alpha <0.0125 to account for multiple testing)
Jain 2013 US NHANES 2003-8 1078 women
Inverted analysis: identifying significant predictors of log transformed PFAS
e
Skuladottir 2015 Denmark - 1988-9 854 pregnant women
Adjusted means for quartiles of PFAS
Fu 2014 Henan China - 2011 133 people 0-80 yrs old
Adjusted mean natural log total-C, LDL-C or non-transformed HDL-C by quartile
Maisonet 2015 UK ALSPAC 1991-2 88 girls, aged 15
Piecewise regression; fasting blood samples at 15 years used for cholesterol; prenatal PFAS exposure measurement from maternal blood
Zeng 2015 Taipei,Taiwan
Genetic and Biomarker Study for Childhood Asthma
2009-10
225 children aged 12-15
Adjusted mean natural log total-C, LDL-C or non-transformed HDL-C by quartile
Christensen 2016 Wisconsin, US
- 2012-3 154 men 50+ yrs
Inverted continuous analysis (predictors of PFAS); OR for self-reported high total-C
q
Wang 2012 China - 2010-11
132 residents, 55 workers
Adjusted linear regression of natural log cholesterol per unit natural log-PFOA
Olsen 2012 Decatur AL, Cottage Grove MN, US
M3 2008-10
Up to 179 depending on analysis
Mean before-after results for subgroups
e

Non-independence of some of papers
Large studies often have results reported in multiple papers and often have a specific name which allows them to be identified easily. In particular, in cohort studies, the same outcome might be examined several times, each time with a longer follow-up or in relation to different predictors. Cross-sectional studies might examine the same hypothesis in greater detail in selected subsamples of the population in addition to an overall analysis. Furthermore, data from national surveys is often available publicly and more than one researcher might independently analyse it to examine similar or identical questions. The results in papers describing the same study population are not independent because the association is being examined and tested statistically in the same people. They should not be treated as separate ‘studies’ in a review, especially if a quantitative meta-analysis is undertaken (unless statistical techniques to account for non-independence are used). Table A2.4 shows the linkage between papers identified in Tables A2.2 and A2.3 above. It is evident that although there are many papers describing epidemiological analyses, the number of independent populations examined is much smaller.
Table A2.4: Summary of papers referring to unique study populationsStudy Brief description of the
studyPapers from this study
Specific features of this paper
C8 Health Project
And the
C8 Community Follow-up Study
The DuPont Company’s Washington Works factory in West Virginia has used PFOA in the manufacture of fluoropolymers since 1951, with use peaking in the 1990s. Community residents were exposed to high levels of PFOA through ground-water contamination (2005–2006 serum median = 28 ng/mL) with residents in cer-tain water distribution districts more highly exposed than others. PFOS levels were not elevated compared to background US levels.
The C8 Health Project is a survey of 69,030 people exposed to PFOA-contaminated drinking water in specific water districts in Ohio and West Virginia for at least 12 months between 1950 and 2004.
A subset of participants who were at least 20 years old at the time of enrolment in the C8 Health Project (n = 32,254) participated in one or two follow-up interviews between 2008 and 2011
Emmett, 2006
A random sample of residents of the Little Hocking water district plus a volunteer sample tested between July 2004-February 2005. Although this study is not part of the C8 Health Project, Little Hocking is one of 6 water districts included in the C8 study area (Steenland et al. 2009). Hence the overlap between participants in this study and the C8 study is unknown
Fitz-Simon, 2013
Adults from C8 not taking cholesterol lowering medication; PFOS and PFOAOnly LDL-C examined, only 10% were fasting at both blood draws; 47% of subjects were non-fasting at blood draw
Sakr, 2007a
Cross-sectional study of workers at the facility; data collected 2004
Sakr, 2007b
Longitudinal study of the worker cohort
Frisbee, 2010
Children aged 1-<18 years, baseline measurements; total-C, LDL-C and HDL-C examined
Steenland, 2009
Adults 18 and older, baseline measurements; total-C, LDL-C and HDL-C examined
Winquist, 2013
Adults only. PFOA only. Community and worker cohorts; retrospective and prospective analyses of incidence hypercholesterolaemia
Steenland, 2015
Incidence of various health conditions in 2845 workers at the facility; cumulative exposure based on drinking water, emissions, occupational exposure etc.;
166
Study Brief description of the study
Papers from this study
Specific features of this paper
Serum concentrations of both PFOA and PFOS decreased between 2005-6 and 2010.
no validation of self-report of incidence of hypercholesterolaemia
3M Monitoring in the 3M facilities in Cottage Grove, MN, Decatur AL in the US and Antwerp in Belgium.
Surveys were done in 1995, 1997.
In 2000, workers were invited to participate in a voluntary fluorochemical medical surveillance program
Ubel, 1980 Not yet accessedGilliland, 1996
Data collection 1985-9
Olsen, 1998
Not yet accessed
Olsen, 2000
An additional round of data collection (1997) plus data from Olsen et al. 1998
Olsen, 2001a
Document not accessed. US EPA (2016b) indicates that material covered in this report is described in Olsen et al. 2003a
Olsen, 2001b
Document not accessed. US EPA (2016b) indicates that material covered in this report is described in Olsen et al. 2003a
Olsen, 2003a
2 locations, data collected in 2000
Olsen, 2003b
Cannot access document. Olsen (2007) refers to this as reporting on the 2000 data worker survey from the third location, n=74
Olsen, 2007
3 locations: populations of Olsen et al. 2003a and 2003c combined and men taking cholesterol lowering medications excluded. Analyses of PFOA only
Olsen, 2012
Longitudinal analysis using data from 3M workers and additional contractors
NHANES US national nutrition survey collecting biomedical data.
Lin, 2009 Analysed data from the 1999-2000 and 2003-4 rounds for persons 12 years and older who had complete data for metabolic syndrome parameters. No results for total-C or LDL-C, an odds ratio for abnormal HDL-C is given
Nelson, 2010
Analysed data from the 2003-4 NHANES. Although persons aged 12-80 were included in the analyses, the analyses related to those aged 20 years and older. Pregnant and breastfeeding women excluded
Geiger, 2014
Analysed data from the 1999-2000, 2003-4, 2005-6, 2007-8 rounds for children <19 years; mean differences for total-C, LDL-C, HDL-C
Jain, 2013 180 pregnant women 17-39 years old and 898 non-pregnant women analysed together from the 2003-8 NHANES
Five of the seven papers cited by EFSA (2008) describe the 3M study population. Some of these were not cited by the US EPA but their content appears to have been covered in the reports to the 3M company that were cited by the US EPA. Both agencies cite the Olsen et al. (2007) analyses of the 2000 round of data collection in the three facilities of that
167

company. FSANZ has selected this paper as the best description of the association between PFOA and serum cholesterol concentration, because it contains data from all three 3M sites and excludes people who were taking cholesterol lowering medications. For PFOS, FSANZ has used the data from Olsen et al. 2003 because Olsen et al. (2007) do not given analyses related to this chemical.
FSANZ chose Frisbee et al. (2010) and Steenland et al. (2009) as the primary description of the association between PFAS and serum cholesterol concentrations in children and adults respectively from the C8 study. Other papers describing additional analyses will be discussed as relevant, in particular, the papers that combine several rounds of examination, or calculate longterm exposure in this population (Fitz-Simon et al. 2013; Winquist et al. 2013).
Four different authors have examined the unit record files from the NHANES surveys. Of these, Lin et al. (2009) was excluded because they examine a subset of the children included by Geiger et al. (2014). Jain (2013) was also excluded; most of the subjects were non-pregnant women who were contained in the analysis of Nelson et al. (2010) and there were no separate analyses of the pregnant women.
Table A2.5 shows the primary papers that will be used to summarise the association between PFAS and serum cholesterol in the body of literature examined by FSANZ. Other papers from these studies will be referred to where they describe additional analyses that provide other insights into the association.
Table A2.5 Primary papers used by FSANZ to describe the association between PFAS and serum cholesterol concentrationsInclusion in graphs Qualitative inclusionPregnant women Children Adults AdultsSkuladottir et al. 2015
Frisbee et al. 2010 Chateau-Degat et al. 2010
Christiansen et al. 2016
Starling et al. 2014 Geiger et al. 2014 Olsen et al. 2007 (PFOA)Olsen et al. 2003 (PFOS)
Costa et al. 2009
Lin et al. 2013 Steenland et al. 2009
Fisher et al. 2013
Maisonet et al. 2015 Nelson et al. 2010 Fu et al. 2014Zeng et al. 2015 Eriksen et al. 2013 Wang et al. 2012
Graphical presentation
The literature can be grouped in several different ways: cross-sectional versus multiple measurements over time by age and stage: children (including adolescents), pregnant women and non-pregnant
adults degree of exposure: occupational studies, highly exposed populations, general
populations.
Most papers describe cross-sectional associations. As not all occupations involving PFAS confer the same degree of exposure, FSANZ does not think it is useful to consider these as a group without examining the degree of exposure as has been done by some authors. Instead, FSANZ has chosen to group papers using age/stage and examine the association across all ranges of exposure.
168

The variable reporting format used by the authors of papers makes it hard to compare the study results. Even when results are reported for quartiles, these are not comparable because the range of serum PFAS concentrations varies across the study populations and so the quartiles in each study describe a different exposure. Therefore FSANZ has presented the results graphically to illustrate the range of exposure in each study and the effect on serum cholesterol concentrations. The most adjusted result was extracted, except in the case of Maisonet et al. (2015; see below). It is noted that several studies did not adjust their results for confounders or comment on why this was not done. When a study reported both a linear and a categorical analysis, the categorical result was chosen as this analysis contains fewer assumptions (i.e. the continuous analyses usually assumed a log-linear association). Results for each quantile was chosen in preference to the difference for an interquartile range, when both were reported, because the former would provide more detail.Where papers report values for quantiles of PFAS (e.g. tertiles, quintiles), then the data are graphed as difference in mean cholesterol concentration compared to the lowest quantile value. Most papers presented their data in this form. Some papers provide the upper and lower bound of each quantile and the data were graphed as steps. In this casethe lowest and highest ‘step’ is shown as a single point and the reader should understand that the plot extends to each side of what has been graphed, but for an unstated distance because many authors did not describe the maximum and minimum PFAS concenrations in their populations. Where the authors gave the median (or occasionally the mean) value in the quantile, the medians are plotted and joined with a line. If the line had been fitted then the line was extracted and is plotted without markers. In one instance (Maisonet et al. 2015) a piecewise regression was fitted and this was extracted. In these latter cases, the lowest point on the line has been used to start the line at the zero mark. The width of the line was scaled to increase with the sample size of the studies.
Furthermore, some studies did not report sufficient numerical information to allow their results to be plotted, usually because they were not statistically significant. A table of results from papers which could not be graphed is presented as part of each figure. Results have been plotted regardless of statistical significance because p-values are not a measure of effect but describe e of chance. If there is truly no association, then this can never be statistically significant and so ignoring non-significant results as being uninformative would automatically skew the body of evidence. Where necessary, data were extracted from graphs using WebPlot Digitiser Version 3.10 (http://arohatgi.info/WebPlotDigitizer/). Cholesterol concentrations reported in mg/dL were converted to mmol/L by dividing by 38.6. PFAS concentrations reported as ppm were converted to ng/mL by assuming a density of 1 mL = 1 g.
Association of PFOA with cholesterol concentrations
Non-pregnant adults
The results for studies reporting associations between PFOA and total-C are shown in Figure A2.1, for LDL-C in Figure A2.2 and HDL-C in Figure A2.3. All studies are cross-sectional. The graphs show the results for industrially exposed (Olsen et al. 2007; Steenland et al. 2009) and general populations, including the NHANES population (Nelson et al. 2012). By far the largest study is that from the C8 group (Steenland et al. , 2009) with more than 46,000 adults whereas the other three studies shown in the graphs have between 500 and 900 subjects. Several studies could not be graphed owing to the way that their data were expressed. It is difficult to know how to interpret the data in the tables because the size of a log unit depends on the base used for transformation and the scale of the variable.
The graph has been calculated to compare results for different PFAS concentrations to the lowest PFAS concentration group in the same study. However, the range of exposure varies
169

across the studies as does the number of subjects. For example, the lowest point plotted for Steenland et al. (2009) is the midpoint of their lowest decile. Thus, about 2,500 subjects in this study have concentrations less than that plotted (Figure A2.1B) and this is more that the total number of subjects in the other studies combined.
The range of exposure in the combined set of studies is wide. Total-C is positively associated with PFOA at least when PFOA concentrations are greater than about 5-10 ng/mL and plateaus, or almost plateaus at a concentration of around 25 ng/mL, based on visual inspection of the graph. The studies in the tables that could not be graphed do not conflict with the graphed data in a qualitative sense, although a quantitative comparison is not possible.
Several studies examine serum PFOA concentration up to apprximately 10 ng/mL (Figure A2.1B). Those on the graph show a rise in total-C of 0.1-0.3 mmol/L across this range. The smaller studies show larger, but variable increases compared to the large study of Steenland et al. 2009 and suggest that the maximal point is reached at lower concentrations (around 5 ng/mL) compared to the much larger study of Steenland et al. (2009). The occurrence of an increase is also present in studies which could not be added to the graph (Fisher et al. 2013; Fu et al. 2014). The final study, Christensen et al. (2016) is also consistent in finding an increased odds ratio for self-reported elevated cholesterol in this exposure range.
Steenland et al. (2009) describe exposures up to approximately 400 ng/mL. They reported a small increase of about 0.1 mmol/L in total-C across the range from about 25 ng/mL to 400 ng/mL; that is almost a plateau. The lowest group in Olsen et al. (2007) had a median concentration of 60 ng/mL and higher groups exhibited a small decline of 0.1 mmol/L over the same range. The remaining study to cover this range was the nearby resident group (n=132) of Wang et al. (2012). This group had a median PFOA concentration of 284 ng/mL but there was no relationship with total-C (Figure A2.1C). Overall, the three studies indicate that there is a plateau, or no relationship with total-C in the mid-range of PFOA concentration.
Three papers described study groups with much higher average exposures than the C8 group reported by Steenland et al. (2009). Olsen et al. (2007) reports a variation around a zero change between 60 ng/mL and 4940 ng/mL. In the worker group (n=55) of Wang et al. (2012) the median concentration was 1636 ng/mL and there was a positive association between the natural log of PFOA and the natural log of total-C (Figure A2.1C). Costa et al. (2009) compared 34 highly exposed workers (median concentration 5270 ng/mL) to 34 unexposed workers whose concentrations were not described. The authors refer to seven unexposed workers who had concentrations ranging from 50 to 181 ng/mL PFOA. Therefore it is difficult to interpret the difference of 0.8 mmol/L total-C in this group because it is not certain what range of PFOA exposure it relates to.
Overall, studies examining the lower ranges of exposure are consistent in reporting an increase in total-C with increasing blood PFOA concentrations which then plateaus at higher PFOA concentrations. The largest study reports that the association attenuates, which might reflect a plateau or an ongoing but much slower increase, from about 25 ng/mL. Other studies either do not cover this range or do not have enough sample size to examine where the change in slope might occur.
Two of the studies reporting results for total-C did not report whether they had analysed their samples for LDL-C (Costa et al. 2009; Christiansen et al. 2016) although one of these did analyse for HDL-C (Costa et al. 2009). Most report a similar pattern but a smaller effect on LDL-C than total-C (Figure A2.2). For example, Steenland et al. (2009) report an increase of 0.1 mmol/L at a PFOA concentration of about 25 ng/dL. An exception is the worker group of Wang et al. (2012) in whom the effect on LDL-C was larger than the effect on total-C.
170

171

A
B
172
CAuthor Range of PFOA concentration in
populationDescription of association
Costa et al. 2009
In 2007 production workers had a median of 5.71 µg/mL (i.e. 5270 ng/mL) vs seven clerical workers whose PFOA concentrations ranged from 0.05 to 0.181µg/mL in 2006
Mean difference of 0.8 mmol/L higher in 34 exposed workers and 34 matched staff from other departments
Fisher et al. 2013
25th centile: 1.85 ng/mLMedian: 2.58 ng/mL75th centile: 3.55 ng/mL
Adjusted difference: 0.03 log mmol/L total-C (mmol/L) per log ng/mL PFOA
Base used for log transformation not describedFu et al. 2014 Lowest quartile: median 0.7ng/mL
Highest quartile: median 4.9 ng/mLIrregular increase from lowest to highest quartile, of approximately 0.3 natural log mmol/L total-C
Christiansen et al. 2016
Median 2.50 ng/mL25th centile 1.80 ng/mL75th centile 3.30 ng/mL95th centile 5.1 ng/mL
Adjusted OR for self-reported elevated total-C = 1.12. However, the units of PFOA that this relates to are not given; i.e. whether the OR describes increase in odds per ng/mL, per unit natural logarithm etc.
Wang et al. 2012
Nearby residents: median 284 ng/mL; minimum 10 ng/mL; maximum 2437 ng/mLWorkers: median 1636 ng/mL; minimum 85 ng/mL; maximum 7737 ng/mL
Residents: -0.00 natural log mmol/L total-C (mmol/L) per natural log ng/mL PFOAWorkers: 0.02 natural log mmol/L total-C (mmol/L) per natural log ng/mL PFOA
Figure A2.1 Association between PFOA and serum total cholesterol concentrations in adults A: papers which provided enough information to graph their results B: magnified view of the low PFOA concentration range C: tabulation of results reported in paper which provided insufficient data for graphical presentationA
173

B
CAuthor Range of PFOA concentration in
populationDescription of association
Fisher et al. 2013
25th centile: 1.85 ng/mLMedian: 2.58 ng/mL75th centile: 3.55 ng/mL
Adjusted difference: 0.03 log mmol/L total-C per log ng/mL PFOA
Base used for log transformation not describedFu et al. 2014 Lowest quartile: median 0.7ng/mL
Highest quartile: median 4.9 ng/mL
Irregular increase, from lowest to highest quartile, of approximately 0.3 natural log mmol/L LDL-C
Wang et al. 2012
Nearby residents: median 284 ng/mL; minimum 10 ng/mL; maximum 2437 ng/mLWorkers: median 1636 ng/mL; minimum 85 ng/mL; maximum 7737 ng/mL
Residents: -0.00 natural log mmol/L LDL-C per natural log ng/mL PFOAWorkers: 0.03 natural log mmol/L LDL-C per natural log ng/mL PFOA
Figure A2.2 Association between PFOA and serum LDL cholesterol concentrations in adults A: papers which provided enough information to graph their results B: magnified view of the low PFOA concentration range; C: tabulation of results reported in paper which provided insufficient data for graphical presentation
174

A
CAuthor Range of PFOA concentration in
populationDescription of association
Costa et al. 2009
In 2007 production workers had a median of 5.71 µg/mL (i.e. 5270 ng/mL) vs seven clerical workers whose PFOA concentrations ranged from 0.05 to 0.181 µg/mL in 2006
Mean difference of 0.3 mmol/L higher in 34 exposed workers and 34 matched staff from other departments
Fisher et al. 2013
25th centile: 1.85 ng/mLMedian: 2.58 ng/mL75th centile: 3.55 ng/mL
Adjusted difference: 0.0009 log mmol/L HDL-C per log ng/mL PFOA
Base used for log transformation not described
Fu et al. 2014 Lowest quartile: median 0.7ng/mL
Highest quartile: median 4.9 ng/mL
Little change across quartiles; highest quartile <0.05 natural log mmol/L HDL-C higher than lowest quartile
Wang et al. 2012
Nearby residents: median 284 ng/mL; minimum 10 ng/mL; maximum 2437 ng/mLWorkers: median 1636 ng/mL; minimum 85 ng/mL; maximum 7737 ng/mL
Residents: 0.02 natural log mmol/L HDL-C per natural log ng/mL PFOAWorkers: -0.07 natural log mmol/L HDL-C (mmol/L) per natural log ng/mL PFOA
Figure A2.3 Association between PFOA and serum HDL cholesterol concentrations in adults A: papers which provided enough information to graph their results B: magnified view of the low PFOA concentration range C: tabulation of results reported in paper which provided insufficient data for graphical presentation
175

The results across studies are much more variable for HDL-C (Figure A2.3). At low PFOA concentrations, both the graphical and tabulated results show little or no effect on HDL-C. At concentrations greater than 1000 ng/dL, Wang et al. (2012) reports an inverse effect whereas Costa et al. (2009) reports a positive effect. FSANZ concludes that there is no association between PFOA and HDL-C concentration.
Pregnant women
Figure A2.4 shows the results for two studies of PFOA and total-C, LDL-C and HDL-C concentrations in pregnant women. Both studies have more than 800 subjects. Blood was drawn at 30 weeks in the Danish group (Skuladottir et al. 2015). In the Norwegian study, 99% of women provided blood between 14-26 weeks of pregnancy (Starling et al. 2014) and so might have had an overall lower degree of haemodilution due to blood volume expansion than the Danish gorup. The studies had partially overlapping ranges of PFOA exposure but the total range of exposure was much smaller than that shown in non-pregnant adults (Figure A2.1).
One study described its results in quartiles of PFAS concentration (Starling et al. 2014) and the other in quintiles (Skuladottir et al. 2015). Hence 25% of the population lie below the bottom point and above the top point plotted for the first study and 20% for the second. Consequently, more than half of the population studied by Starling et al. (2014) had PFOA concentrations less than 80% of the population studied by Skuladottir et al. (2015).
Both studies found that total-C increased as PFOA increased, and this was larger than was seen in the non-pregnant group and occurred across a smaller increment in PFOA (Figure A2.1). Only one of these studies reported on cholesterol subfractions. The one study reporting the association for subfractions shows that LDL-C and HDL-C both increased by a small amount. The study reporting larger increases in total-C did not analyse their samples for LDL-C and HDL-C.
Children and young people
Figure A2.5 shows the results of studies which have examined children or young people. All except Maisonet et al. (2015) are cross-sectional studies. Unlike the studies in adults and pregnant women, two studies only described their results as regression coefficients and thus have been shown on the graph as lines without points. It is difficult to know how to represent this fairly compared to the studies which report results in PFOA quantiles. Frisbee et al. (2010) analysed 12,000 children which was a much larger sample than the other studies. It should be noted that this is the only age group in which papers did not report results as quantiles, and so it is difficult to know how to zero the presentation of the regression lines of Frisbee et al. (2010) and Maisonet et al. (2015) relative to the other studies.
Frisbee et al. (2010) describe the relationship between PFOA and cholesterol in 12,000 children from the C8 study and show the same effect that was seen in the adults of the same study in Figure A2.1 (Steenland et al. 2009). Geiger et al. analysed data from the NHANES as did Nelson et al. (Figure A2.1), albeit from a slightly different range of years. They found essentially the same pattern in children that was shown for adults (Figure A2.1). The smaller studies of Zeng et al. (2015) and Lin et al. (2013) from Taiwan examined low concentrations of PFOA in this age group and had opposite results for LDL-C.
Maisonet et al. (2015) examined 88 girls and used different methods from the other studies. Firstly, their study is longitudinal and compared PFOA concentrations from prenatal maternal blood to the girls’ cholesterol concentrations at age 7 and age 15 years. The plot shows the unadjusted data at age 15, but this was similar to the adjusted data at the same age and at 7 years old.
176

A
B
C
Figure A2.4 Association between PFOA and serum cholesterol concentrations in pregnant women A: total cholesterol B: LDL cholesterol C: HDL cholesterol
177

A
B
C
Figure A2.5 Association between PFOA and serum cholesterol concentrations in children and young people A: total cholesterol B: LDL cholesterol C: HDL cholesterol
New version for Figure A2.5 below
178

A
B
C
The pattern shown in the study of Maisonet et al. (2015) was very different from that of the other studies. The apparent size of effect may be related to the zeroing problem mentioned
179

above when graphing the results from the various studies. It is difficult to explain how maternal PFOA concentrations during pregnancy would have an effect at only one concentration in children aged 15 years. As noted, this shows the unadjusted results which were not very different from the adjusted results. However, the only adjustment factors considered were maternal age at delivery, maternal education and previous live births. 25% of maternal blood samples were drawn after 28 weeks and so there could be differences in PFAS concentration due to haemodilution which occurs in the later weeks of pregnancy. No other factors related to cholesterol seem to have been considered, such as weight or diet, and there could be correlations between these and maternal PFAS owing to similarity in the familial environment. However, with only 88 subjects, it is not appropriate to include a large number of covariates in a regression model. The authors comment that they are conducting a similar analysis on blood from boys who are members of the same cohort study but these data were not available.
Association of PFOS with cholesterol concentrations
Many papers reported results for both PFOA and PFOS. Some only reported results for PFOA (Costa et al. , 2009). Wang et al. (2012) reported that the median concentration of PFOS was about 33 ng/mL in both their worker and resident populations. However, they did not present any results examining the association of PFOS with cholesterol concentrations despite doing this for PFOA. They state that they chose PFOA because it had a wider range of exposure but do not indicate whether associations with other PFAS were not significant (and therefore not reported) or were not analysed. Olsen et al. (2007) only presented results for PFOA from the 3M population, and so their earlier paper has been used in the assessment for PFOS (Olsen et al. 2003). Chateau-Degat et al. (2010) measured PFOS but not PFOA.
Non-pregnant adults
The results for studies reporting associations between PFOS and total-C are shown in Figure A2.6, for LDL-C in Figure A2.7 and HDL-C in Figure A2.8. All studies are cross-sectional. As was the case for PFOA, by far the largest is the study of Steenland et al. (2009) from the C8 group. The only study which examined the association at PFOS concentrations greater than 60 ng/mL was Olsen et al. (2003) which had a total sample size of less than 100 women and less than 500 men.
Four studies with low concentrations (Figure A2.6B) reported that total-C concentration was positively associated with PFOS concentration with a possible maximal increase of 0.3 mmol/L at a concentration of about 40 ng/mL. Olsen et al. (2003) examined a population with much higher blood concentrations and reported that, in women, total-C declined and then returned to the starting point as PFOS concentration increased above 70 ng/mL. In men, however, there was no association in the range of 270 ng/mL to 1190 ng/mL followed by an increase. These variations may reflect random variation around a null effect or plateau at higher concentrations.
Three of the four studies measuring total-C also reported LDL-C data. Two of these found that LDL-C increased in parallel and to much the same extent as total-C whereas Chateau-Degat et al. (2010) found a much lower increase in LDL-C (Figure A2.7B). Chateau-Degat et al. (2010) examined an Inuit population who had high consumption of fish; however, long-chain omega-3 fatty acids are generally thought to affect triglyceride concentration rather than cholesterol concentration (Nestel et al. 2015) and so this would not seem to explain the relatively small difference in LDL-C. Olsen et al. (2003) did not report measuring LDL-C. Studies examining HDL-C reported results varying around a null effect (Figure A2.8). The studies which could not be graphed are generally consistent with the graphed results in
180

showing that total-C and LDL-C are positively associated with PFOS in the low concentration range and that HDL-C has little or no association.
181

A
B
CAuthor Range of PFOS concentration in
populationDescription of association
Fisher et al.2013
25th centile: 5.42 ng/mLMedian: 8.54 ng/mL75th centile: 12.91 ng/mL
Adjusted difference: 0.014 log units of total-C (mmol/L) per log unit of PFOS (ng/mL)
Base used for log transformation not describedFu et al. 2014 Lowest quartile: median 0.6 ng/mL
Highest quartile: median 2.6 ng/mLTotal-C ~0.2 natural log mmol/L total-C in highest vs lowest quartile
Christiansen et al. 2016
Median 19.00 ng/dL25th centile 9.80 ng/dL75th centile 28.00 ng/dL95th centile 54.00 ng/dL
OR for self-reported elevated total-C= 1.02 (95% CI: 1.00-1.04) adjusted for age, BMI, work status, and alcohol consumption However, the units of PFOSA that this relates to are not given; i.e. whether the OR describes increase in odds per ng/mL, per unit natural logarithm etc.
Figure A2.6 Association between PFOS and serum total cholesterol concentrations in adults A: papers which provided enough information to graph their results B: magnified view of the low PFOA concentration range; C: tabulation of results reported in paper which provided insufficient data for graphical presentation
182
A
B
Author Range of PFOS concentration in population
Description of association
Fisher et al. 2013
25th centile: 5.42 ng/mLMedian: 8.54 ng/mL75th centile: 12.91 ng/mL
Adjusted difference: 0.02 log units of LDL-C (mmol/L) per log unit of PFOS (ng/mL)
Base used for log transformation not described
Fu et al. 2014 Lowest quartile: median 0.6 ng/mLHighest quartile: median 2.6 ng/mL
LDL-C ~0.4 natural log mmol/L higher than lowest quartile
Figure A2.7 Association between PFOS and serum LDL cholesterol concentrations in adults A: papers which provided enough information to graph their results (truncated at 60 ng/mL B: tabulation of results reported in paper which provided insufficient data for graphical presentation)
183
A
B
C
Author Range of PFOS concentration in population
Description of association
Fisher et al. 2013 25th centile: 5.42 ng/mL
Median: 8.54 ng/mL75th centile: 12.91 ng/mL
Adjusted difference: -0.02 log units of HDL-C (mmol/L) per log unit of PFOS (ng/mL)
Base used for log transformation not described
Fu et al. 2014 Lowest quartile: median 0.6 ng/mL
Highest quartile: median 2.6 ng/mL
Inconsistent increase of <0.1 natural log units across quartiles
Figure A2.8 Association between PFOS and serum HDL cholesterol concentrations in adults A: papers which provided enough information to graph their results B: magnified view of the low PFOA concentration range; C: tabulation of results reported in paper which provided insufficient data for graphical presentation
184

Pregnant women
Two studies examined the association between total-C and PFOS concentration in the range of 10-30 ng/mL PFOS in pregnant women and found a positive association. The range of PFOS concentrations covered by the studies was more similar to the general population (See Figure A2.6B) than was the case for PFOA. The greatest increase was 0.44 mmol/L for the quintile with PFOS concentration of 27.7 ng/mL or greater. This was paralleled by LDL-C and there was as an increase in HDL-C (good cholesterol) of the same magnitude (Figure A2.9).
Children and young people
The results in children are similar to the results in adults (Figure A2.10). As noted above, Maisonet et al. (2015) reported on a longitudinal study which compared the concentration of PFAS in maternal blood during pregnancy to the cholesterol concentration of daughters at age 15 and the apparent size of the effect relative to other studies may be related to a zeroing problem. The association between LDL-C and PFOS parallels that for total-C and is consistent in direction across the studies. By contrast, the studies have variable findings relating to HDL-C which suggests that there is no association overall.
Commentary
This report has focused on describing the results from the studies of PFAS chemicals and cholesterol concentrations but has not considered either p-values or standard errors for several reasons. Firstly, p-values are not a measure of effect; they describe the probability of obtaining the observed result, or a more extreme result, if the null hypothesis is true. It is customary to set some value, such as <0.05 to reject the null hypothsis and this is called ‘statistically significant’. If there is truly no effect or association (the null hypothesis seems to be correct), then this will not be statistically significant, by definition. It is not possible to determine whether the inconsistent presentation of information across the studies occurs because the samples were not tested for certain cholesterol fractions or whether the authors have failed to report non-significant associations. It is also notable that some papers do not report all results, possibly because they were not statistically significant. For example, Lin et al. (2013) provide numerical data for their non-significant LDL-C analyses, but not for their total-C or HDL-C analyses. Gilliland et al. (1996) found non-significant associations between all three cholesterol fractions and total serum fluorine (as a surrogate for PFAS), but then presented a significant reduction in HDL-C from a regression analysis in which a categorised HDL-C variable appears to have been analysed as a continuous variable. Therefore the question of whether there is publication bias affecting this body of literature must be raised.
Studies have been included in this review regardless of whether or not they have reported their results in a common format because failure to do this may have introduced a bias into the body of evidence. As far as it is possible to tell, the results of studies which could not be graphed do not contradict the results of studies which could be graphed in a qualitative sense although it is not possible to make a quantitative comparison.
In addition, some of the methods used to analyse data in some papers seem questionable and so their p-values and standard errors are also questionable. For example, in one paper it seems that the PFAS data have been grouped into quantiles and then the quantiles have been entered into the regression equation as a continuous variable instead of being treated as a set of dummy variables. No quantitative results can be derived from some studies because one or both of the PFAS and cholesterol variables have been logarithmically transformed but the authors do not state the base used in the transformation or provide any
185

back-transformed results. In this case, it is only possible to state the direction of the association found in the study.A
B
C
Figure A2.9 Association between PFOS and serum cholesterol concentrations in pregnant women A: total cholesterol B: LDL cholesterol C: HDL cholesterolA
186

B
C
Figure A2.10 Association between PFOS and serum cholesterol concentrations in children
187

and young people A: total cholesterol B: LDL cholesterol C: HDL cholesterol
The extent of control for confounding across the studies is variable depends on the other characteristics that were included. A number of studies note the correlation between the concentrations of PFOA and PFOS but they do not adjust the results of each PFAS for the other. For example, Nelson et al. (2010) report a correlation of 0.65 between PFOS and PFOA in the NHANES dataset. Lin et al. (2013) is an exception as they measured four PFAS (PFOS, PFOA, perfluorononanoic acid and perfluorodecanoic acid) in adolescents and young adults and conducted a composite analysis of effects on carotid intima medial thickness, which was their focus, but not of other outcomes such as cholesterol concentrations. Similarly, populations with high exposure to PFAS due to occupation or environmental contamination might have exposure to other contaminants and these have not been considered in the studies.
Most studies do not adjust for diet. Skuladottir et al. (2015) is an exception; they used semiquantitative food frequency questionnaires and examined various associations. In their population of pregnant women, the highest quartile of saturated fat intake had total-C concentration that was 0.61 mmol/L higher than women in the lowest quartile. Intake of PFOS was positively associated with saturated fat intake but intake of PFOA was not. However, adding dietary factors to an adjusted model already containing age, parity, education, smoking and prepregnancy BMI did not alter the effect associated with either PFOS or PFOA. Hence, the non-inclusion of dietary measurement might be more or less important depending on what other factors have also been measured and controlled for.
The results shown in the graphs are cross-sectional studies with one exception (Maisonet et al. 2105). Fitz-Simon et al. (2013) examined the change in total-C, LDL-C and HDL-C that occurred between the two cross-sectional analyses in the C8 population that were conducted 4.4 years apart. People who were taking lipid lowering medication were excluded, as were people with elevated triglycerides (because LDL-C was calculated using the Friedewald equation) leaving 521 for the analyses involving LDL-C and 560 for the other analyses. The geometric mean for PFOA declined from 74.8 ng/mL to 30.8 ng/mL and for PFOS, from 18.5 ng/mL to 8.2 ng/mL. However, there was little difference in either total-C (+0.01 mmol/L) LDL-C (0.05 mmol/L) or HDL-C (-0.03 mmol/L). Moreover, the cross-sectional data for PFOA from this study would not suggest that a large change would be anticipated. Figures A2.1, A2.2 and A2.3 show that both the baseline and follow-up mean concentrations described by Fitz-Simon et al. (2013) lie in the plateau section of the curve for PFOA from the C8 study (Steenland et al. 2009). However, the same is not true for PFOS: both points lie on the increasing portion of the curve (Figures A2.6, A2.7 and A2.8) and so a difference would have been expected if the cross-sectional results reflect longitudinal effects. Further analysis compared the degree of change within individuals in both PFAS. For PFOA, the people with baseline PFOA concentrations <44.4 ng/mL had much larger reductions (0.8 mmol/L LDL-C) than those with baseline PFOA concentrations higher than this. Although not statistically significant, this is consistent with the shape of the cross-sectional association. There was no consistent effect by initial concentration of PFOS
A much smaller longitudinal study was conducted in 179 3M workers involved in demolishing the factory and who were not taking lipid lowering medication (Olsen et al. 2012). In long term workers, the PFOA concentrations decreased by 7.4 ng/mL whereas in contractors it increased by 6.8 ng/mL over duration of the project. Total-C, HDL-C and non-HDL-C all rose in both groups. An analysis was conducted in those with baseline PFOA concentration <15 ng/mL and PFOS < 50 ng/mL. Median PFOA increased by 5.3 ng/mL, PFOA by 0.7 ng/mL and total-C increased by 0.08 mmol/L. Although not significant, this is consistent with the pattern shown in Figure A2.1.
188

Although some studies have examined a range of other biochemical parameters, such as thyroid function, kidney function does not seem to have been examined together with cholesterol concentrations. This may be relevant because PFAS concentrations increase as glomerular filtration rate decreases. This is a possible factor that might also lead to changes in cholesterol metabolism.
No randomised controlled trials were found. One striking feature is that the observational studies in humans have the opposite finding to studies in animals. A conference abstract reporting on a Phase 1 study investigating an ammonium salt of PFOA as a cancer treatment was found but did not meet the inclusion criterion of being conducted in healthy people. This study used a dose-escalation strategy until a dose-limiting toxicity was found. Among 41 middle-aged adults with advanced cancer who received a single dose of between 50 and 1200 mg of the ammonium PFOA salt for a median of 6.5 weeks, the authors reported “reductions in LDL-C consistent with a PD effect” (MacPherson et al. 2011). While there is no randomised control group, this is a longitudinal study with a clearly defined exposure. Patients had a range of cancers and so it is unlikely that they all had disturbed lipid metabolism. It adds to the debate concerning whether the increases in LDL-C observed in the human epidemiological studies are an adverse effect caused by PFAS exposure or reflect some concurrent biological process that is not yet understood.
PFAS concentrations in Australia
There is no data regarding PFOA concentration in Australia from a nationally representative survey. Karrman et al. (2006) reported that pooled samples in stored serum available to a nationwide pathology company between November 2002 and April 2003 had median PFOA concentrations of 7.6 ng/mL (IQR: 6.6-8.6, minimum 5.0; maximum 9.9 ng/mL). Samples from the same pathology company for the south-eastern Queensland area were followed over time. Mean serum PFOA concentration declined from 9.7 ng/mL in 2002-3 to 4.3 in 2010-11 in people aged over 16 years (Toms et al. 2014).
The same studies also examined data for PFOS. Karrman et al. (2006) reported a nationwide median PFOS concentration of 20.8 ng/mL (IQR: 18.5-25.0, minimum 12.7; maximum 29.5). Over time, in south-eastern Queensland, mean PFOS concentrations declined from 27.0 ng/mL to 12.0 between 2002-3 and 20010-11 (Toms et al. 2014). Children had lower concentrations.
From this, it could be concluded that the general Australian population has PFOA concentrations in the range shown for the NHANES surveys, but PFOS concentrations in the lower half of the range for the NHANES surveys (Nelson et al. 2010; Geiger et al. 2014) above. Data regarding concentrations in specific subgroups of the population were not found.
Summary
In summary, the cross-sectional studies overall present a fairly consistent picture. Studies in both adults and children suggest a positive association between total-C and LDL-C and PFOA concentration at very low concentrations of PFOA but not at higher concentrations. At around 25 ng/mL, total cholesterol is about 0.2-0.3 mmol/L higher than at the lowest concentrations measured; after this point the association plateaus. The peak may be reached at lower concetrations or be a little higher. The quantitative results from pregnant women are more inconsistent, but this may be related to haemodiluation changes during pregnancy. There appears to be little or no effect on HDL-C, and not all studies have adverse findings. Similar results were seen for PFOS with a maximum increment in total-C of 0.3 mmol/L which is reached at around 40 ng/mL. The lack of association reported in some occupational groups might be due to the lack of sufficient subjects with low concentrations of
189

PFAS to detect the effect. The few longitudinal data that are available do not contradict the findings in the cross-sectional studies.
References
Chateau-Degat ML, Pereg D, Dallaire R, Ayotte P, Dery S, Dewailly E. (2010) Effects of perfluorooctane sulfonate exposure on plasma lipid levels in the Inuit population of Nunavik (Northern Quebec). Environ Res. 110:710–717.
Christensen KY, Raymond M, Thompson BA, Anderson HA. (2016) Perfluoroalkyl substances in older male anglers in Wisconsin. Environment International 91:312–318.
Costa G, Sartori S, Consonni D. (2009) Thirty years of medical surveillance in perfluooctanoic acid production workers. J Occup Environ Med 51:364–372.
EFSA Perfluorooctane sulfonate (PFOS), perfluorooctanoic acid (PFOA) and their salts. Scientific Opinion of the Panel on Contaminants in the Food chain. The EFSA Journal (2008) 653: 1-131.
Emmett EA, Zhang H, Shofer FS, Freeman D, Rodway NV, Desai C, et al. (2006). Community exposure to perfluorooctanoate: relationships between serum levels and certain health parameters. J Occup Environ Med 48:771–779.
Eriksen KT, Raaschou-Nielsen O, McLaughlin JK, Lipworth L, Tjonneland A, Overvad K, et al. (2013). Association between plasma PFOA and PFOS levels and total cholesterol ina middle-aged Danish population. Plos One 8(2):e56969; doi:10.1371/journal.pone.0056969.
Fisher M, Arbuckle TE, Wade M, Haines DA. (2013). Do perfluoroalkyl substances affect metabolic function and plasma lipids?—Analysis of the 2007–2009, Canadian Health Measures Survey (CHMS) Cycle 1. Environ Res 121:95–103.
Fitz-Simon N, Fletcher T, Luster MI, Steenland K, Calafat AM, Kato K, et al. (2013). Reductions in serum lipids with a 4-year decline in serum perfluorooctanoic acid andperfluorooctanesulfonic acid. Epidemiology 24:569–576.
Frisbee SJ, Shankar A, Knox SS, Steenland K, Savitz DA, Fletcher T, et al. (2010) Perfluorooctanoic acid, perfluorooctanesulfonate, and serum lipids in children andadolescents: results from the C8 Health Project. Arch Pediatr Adolesc Med 164:860–869.
Fu Y, Wang T, Fu Q, Wang P, Lu Y (2014). Associations between serum concentrations of perfluoroalkyl acids and serum lipid levels in a Chinese population. Ecotoxicol Environ Saf. 106:246-52. doi: 10.1016/j.ecoenv.2014.04.039.
Geiger, S.D., J. Xiao, A. Ducatmen, S. Frisbee, K. Innes, and A. Shankar. (2014). The association between PFOA, PFOS and serum lipid levels in adolescents. Chemosphere 98:78–83.
Gilliland FD, Mandel JS. (1996) Serum perfluorooctanoic acid and hepatic enzymes,lipoproteins, and cholesterol: a study of occupationally exposed men. Am.J.Ind.Med. 29,560-568.
Jain RB. (2013) Effect of pregnancy on the levels of selected perfluoroalkyl compounds for females aged 17-39 years: data from National Health and Nutrition Examination Survey 2003-2008. J Toxicol Environ Health A. 76(7):409-21.
190

Kaplan AM (2004) Ammonium perfluorooctanoate. US EPA docket AR-226-1867 and AR 226-1868. US Environmental Protection Agency, Washington, DC
Kärrman A, Mueller JF, van Bavel B, Harden F, Toms LM, Lindström G. (2006) Levels of 12 perfluorinated chemicals in pooled australian serum, collected 2002-2003, in relation to age, gender, and region. Environ Sci Technol 40: 3742-8.
Kerger BD, Copeland TL, DeCaprio AP. (2011) Tenuous dose-response correlations for common disease states: case study of cholesterol and perfluorooctanoate/sulfonate (PFOA/PFOS) in the C8 Health Project. Drug Chem Toxicol. 34(4):396-404.
Lin, C.-Y., Chen, P.-C., Lin, Y.-C., & Lin, L.-Y. (2009). Association among serum perfluoroalkyl chemicals, glucose homeostasis, and metabolic syndrome in adolescents and adults. Diabetes Care, 32(4), 702–707.
Lin CY, Lin LY, Wen TW, Lien GW, Chien KL, Hsu SH, Liao CC, Sung FC, Chen PC, Su TC (2013) Association between levels of serum perfluorooctane sulfate and carotid artery intima-media thickness in adolescents and young adults. Int J Cardiol. 2013 Oct 9;168(4):3309-16.
MacPherson IR, Bissett D, Petty RD, et al. (2011). A first-in-human phase I clinical trial ofCXR1002 in patients with advanced cancer. J Clin Oncol 29:3063 [Suppl.; abstr Available at http://ascopubs.org/doi/abs/10.1200/jco.2011.29.15_suppl.3063 (accessed 16 Nov 2016)
Maisonet M, Näyhä S, Lawlor DA, Marcus M. (2015) Prenatal exposures to perfluoroalkyl acids and serum lipids at ages 7 and 15 in females. Environ Int. 82:49-60.
Nelson JW, Hatch EE, Webster TF. (2010). Exposure to polyfluoroalkyl chemicals and cholesterol, body weight, and insulin resistance in the general U.S. population. Environ Health Perspect 118:197–202.
Nestel P, Clifton P, Colquhoun D, Noakes M, Mori TA, Sullivan D, Thomas B (2015) Indications for omega-3 long-chain polyunsaturated fatty acid in the prevention and treatment of cardiovasculard. Heart Lung Circ. 24(8):769-79.
Olsen GW, Gilliland FD, Burlew MM, Burris JM, Mandel,JS, Mandel JH. (1998.) An epidemiological investigation of reproductive hormones in men with occupationalexposure to perfluorooctanoic acid. J Occ Env Med 40, 614-622.
Olsen GW, Burris JM, Burlew MM, Mandel JH. (2000). Plasma cholecystokinin and hepatic enzymes, cholesterol and lipoproteins in ammonium perfluorooctanoate production workers. Drug Chem Toxicol 23:603–620.
Olsen GW, Burlew MM, Burris JM, Mandel JH. (2001a) A Cross-Sectional Analysis of Serum Perfluorooctane Sulfonate (PFOS) and Perfluorooctanoate (PFOA) in Relation to Clinical Chemistry, Thyroid Hormone, Hematology and Urinalysis Results from Male and Female Employee Participants of the 2000 Antwerp and Decatur Fluorochemical Medical Surveillance Program. Final Report. 3M Company, St. Paul, MN.
Olsen GW, Burlew, M Burris JM, Mandel JH. (2001b.) A Longitudinal Analysis of Serum Perfluorooctane Sulfonate (PFOS) and Perfluorooctanoate (PFOA) Levels in Relation to Lipid and Hepatic Clinical Chemistry Test Results from Male Employee Participants of the 1994/95, 1997 and 2000 Fluorochemical Medical Surveillance Program. Final Report. 3M Company, St. Paul, MN.
191

Olsen GW, Burris JM, Burlew MM, Mandel JH. (2003a). Epidemiologic assessment of worker serum perfluorooctanesulfonate (PFOS) and perfluorooctanoate (PFOA) concentrations and medical surveillance examinations. J Occup Environ Med 45:260–270.
Olsen GW, Butenhoff JL, Mandel JH (2003b) Assessment of lipid, hepatic and thyroid function in relation to an occupational biologic limit value for perfluorooctanoate. 3M Company, St Paul. US EPA docket AR-226-1351. US Environmental ProtectionAgency, Washington, DC
Olsen GW, Zobel LR. (2007). Assessment of lipid, hepatic, and thyroid parameters with serum perfluorooctanoate (PFOA) concentrations in fluorochemical production workers. Int Arch Occup Environ Health 81:231–246.
Olsen GW, Ehresman DJ, Buehrer BD, Gibson BA, Butenhoff JL, Zobel LR. (2012) Longitudinal assessment of lipid and hepatic clinical parameters in workers involved with the demolition of perfluoroalkyl manufacturing facilities. J Occup Environ Med. 54(8):974-83.
Sakr CJ, Kreckmann KH, Green JW, Gillies PJ, Reynolds JL, Leonard RC. (2007a). Cross-sectional study of lipids and liver enzymes related to a serum biomarker of exposure(ammonium perfluorooctanoate or APFO) as part of a general health survey in a cohort of occupationally exposed workers. J Occup Environ Med 49:1086–1096.
Sakr CJ, Leonard RC, Kreckmann KH, Slade MD, Cullen MR. (2007b). Longitudinal study of serum lipids and liver enzymes in workers with occupational exposure to ammonium perfluorooctanoate. J Occup Environ Med 49:872–879.
Skuladottir M, Ramel A, Rytter D, Haug LS, Sabaredzovic A, Bech BH, Henriksen TB, Olsen SF, Halldorsson TI. (2015) Examining confounding by diet in the association between perfluoroalkyl acids and serum cholesterol in pregnancy. Environ Res143(Pt A):33-8.
Starling AP, Engel SM, Whitworth KW, Richardson DB, Stuebe AM, Daniels JL et al. (2014). Perfluoroalkyl substances and lipid concentrations in plasma during pregnancy among women in the Norwegian Mother and Child Cohort Study. Environ Int 62:104–112.
Steenland K, Tinker S, Frisbee S, Ducatman A, Vaccarino V. (2009). Association of perfluorooctanoic acid and perfluorooctane sulfonate with serum lipids among adults living near a chemical plant. Am J Epidemiol 170:1268–1278.
Steenland K, Zhao L, Winquist A. (2015) A cohort incidence study of workers exposed to perfluorooctanoic acid (PFOA). Occup Environ Med.72(5):373-80.
Toms LM, Thompson J, Rotander A, Hobson P, Calafat AM, Kato K et al. (2014) Decline in perfluorooctane sulfonate and perfluorooctanoate serum concentrations in an Australian population from 2002 to 2011. Environ Int. 2014 Oct;71:74-80.
Ubel FA, Sorenson SD, Roach DE (1980) Health status of plant workers exposed to fluorochemicals—a preliminary report. Am Ind Hyg Assoc J 41:584–589
US EPA (2014a) Health effects document for perfluorooctane sulfonate (PFOS). EPA 822-R-14-002.
US EPA (2014b) Health effects document for perfluorooctanoic acid (PFOA). EPA 822-R-14-001.
192

Winquist A, Steenland K. (2014). Modeled PFOA exposure and coronary artery disease, hypertension, and high cholesterol in community and worker cohorts. Environ Health Perspect 122:1299–1305.
Wang JS, Zhang YT, Zhang W, Jin YH, Dai JY. (2012). Association of perfluorooctanoic acid with HDL cholesterol and circulating miR-26b and miR-199-3p in workers of a fluorochemical plant and nearby residents. Environ Sci Technol 46:9274–9281.
Zeng XW, Qian Z, Emo B, Vaughn M, Bao J, Qin XD et al. (2015) Association of polyfluoroalkyl chemical exposure with serum lipids in children. Sci Total Environ 15;512-513:364-70.
193
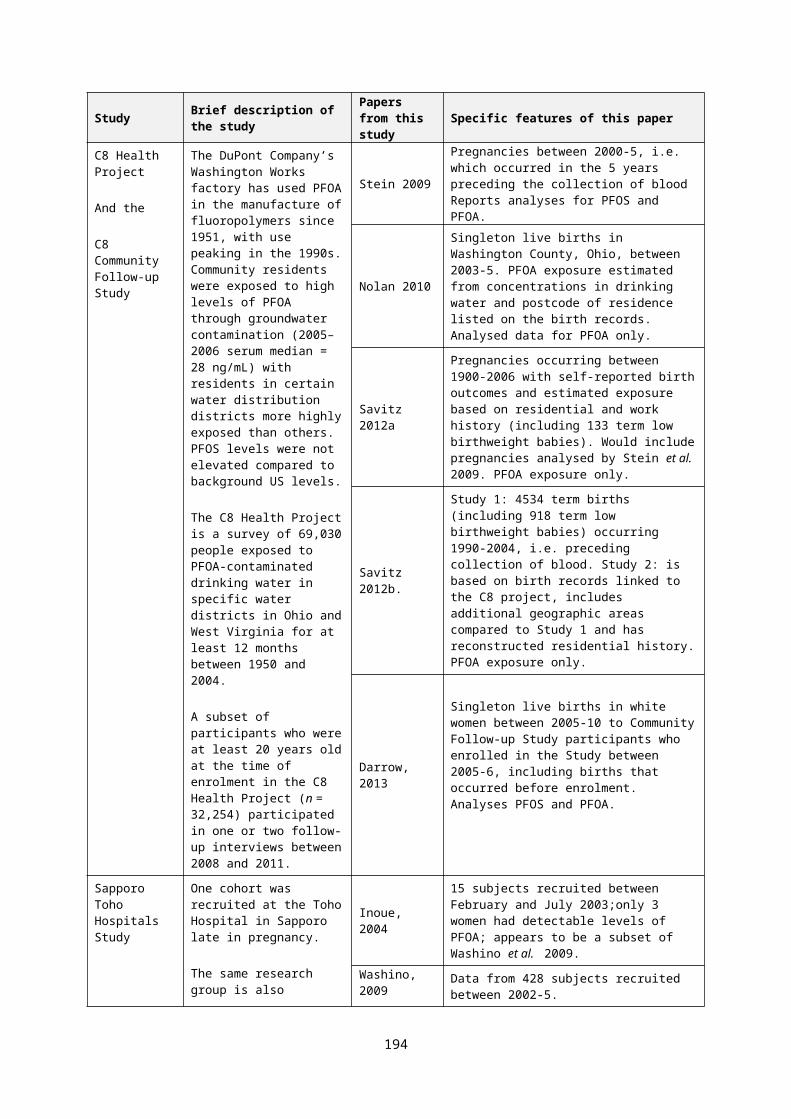
Appendix 3: PFHxS Pharmacokinetic Studies
Sundström et al. 2012 - Comparative iv and oral gavage Pharmacokinetics of PFHxS in mice, rats and monkeys
A series of studies were conducted to establish PFHxS concentrations in serum, urine and faeces of mice, rats and monkeys.
Mice
Male and female CD-1 mice, at least 8-10 weeks old, were given a single oral gavage dose of either 1 or 20 mg K+PFHxS/kg bw. At 2, 4, and 8 hours and days 1, 8, 15, 22, 36, 50, 64 and 162, four mice/sex/treatment level were euthanised and blood was collected via the abdominal aorta and serum prepared. In the 24 hours prior to termination urine and faeces samples were collected. Liver and kidneys were collected at study termination. All samples were frozen with liquid nitrogen and stored at -800C until analysis.
The highest PFHxS concentrations were seen in the serum, followed by the liver and then kidneys. By day 162 PFHxS levels in these tissues were comparable to predose levels. Serum values for females at 20 mg/kg bw were slightly higher than males at all sampling points up to and including day 64; for all other tissues male and female values were generally similar, within dose level.
Serum t1/2 values for both sexes and doses were similar (30.50 and 24.82 days at 1 mg/kg, and 27.97 and 26.81 days at 20 mg/kg bw, males and females respectively).
PFHxS was excreted mainly in the urine with lesser amounts (no more than 20% of the urine value) recovered in the faeces.
The Vd values indicate predominantly extracellular distribution.
Table A3.1:PFHxS Vd in male and female mice after administration of single oral doses of 1 or 20 mg/kg bw.
Parameter Sex 1 mg/kg bw 20 mg/kg bwVd (mL/kg) Male 129 195Vd (mL/kg) Female 96 147
Data taken from Sundström et al. (2012)
Rats
Male and female Sprague Dawley rats, at least 8-10 weeks old, were given a single oral gavage dose of either 1, 10 or 100 mg K+PFHxS/kg bw (N=4/sex/group). Urine and faeces samples were collected for up to 96 hours. Approximately 96 hours postdose the rats were euthanised, blood was collected and serum prepared, and liver samples (region not specified) were harvested. All samples were frozen with liquid nitrogen and stored at -800C until analysis.
After approximately 96 hours, only 50% of the administered dose was recovered in the treated male groups. Recovery varied in females from approximately 34-40% without clear relation to dose. Serum concentrations ranged from 4.7 to 194.6 µg/mL for males and 1.9 to 26.2 µg/mL in females. Concentrations of PFHxS in the liver ranged from 5.6 to 118.1 µg/g for males and 0.45 to 5.70 µg/g for males. PFHxS was primarily excreted in the urine. Recovery in the carcass was not further assessed.
194

Table A3.2: PFHxS concentrations in serum, liver, urine and faeces 96 h after administration of single oral doses of 1, 10 and 100 mg/kg bw.
Association between dose level and per cent dose in serum, liver, urine and faeces After a single administration
Dose level (mg/kg bw)
1 10 100
MalesSerum per cent of dose 17.96 30.83 7.48
Serum (µg/mL) 4.68 81.79 194.63Liver per cent of dose 30.96 13.38 8.17
Liver (µg/g) 5.58 25.71 118.13
Urine per cent dose 6.58 6.24 29.66
Faeces per cent dose 0.00 0.23 0.92Total recovered per cent 55.51 50.58 46.23
Females
Serum % of dose 7.04 4.37 0.95
Serum (µg/mL) 1.92 12.34 26.16
Liver % of dose 2.07 1.01 0.28
Liver (µg/g) 0.45 2.18 5.70
Urine % dose 34.86 27.91 40.58
Faeces % dose 0.00 0.35 0.13
Total recovered % 43.97 33.64 41.95
In a separate study, male and female Sprague Dawley rats (4/sex/group; at least 8-10 weeks old) were given a single iv dose of K+PFHxS at 10 mg/kg bw. Blood samples (from the tail vein), urine and faecal samples were then collected over a 10 week observation period. It appears (from graphical data) that samples were taken on three occasions in the first observation week and then approximately weekly thereafter. At study termination blood samples via the abdominal aorta were taken at sacrifice and liver samples collected (region not specified). Serum was prepared and all samples were frozen with liquid nitrogen and stored at -80°C until analysis.
Pharmacokinetic parameters are tabulated below. The data suggest marked sex differences in AUC and more rapid clearance via excretion in the urine in females.
195

Table A3.3: Pharmacokinetic values for Sprague Dawley rats After a single iv dose followed by a 10 week observation period
Parameter Male FemaleCmax (µg/mL) 61.87±1.90 79.10±8.58Serum [PFHxS]last (µg/mL) 6.25±1.06 <LLOQa
Liver [PFHxS]last (µg/mL) 6.62±0.68 <LLOQb
% PFHxS dose in urine, 0-24h 0.70±0.07 13.28±2.88Serum elimination initial phase (1/day) 0.7428±0.1362 0.4226±0.00190Serum elimination terminal phase (1/day) 0.0238±0.0005 NAt1/2 (day) 29.1±0.6c 1.64±0.08d
CL (mL/day/kg) 6.71±0.06 53.35±4.38AUC (µg day/mL) 1490±12 187±15VDss mL/kg) 275±5 126±14
Values presented are mean ± standard error and taken from Sundström et al. 2012a LLOQ Lower limit of quantification for serum = 10ng/mLb LLOQ Lower Limit of quantification for liver = 50ng/gc based on terminal phase datad based on initial phase data
Monkeys
Male and female cynomolgus monkeys (3/sex/group) were given a single iv dose of K+PFHxS at 10 mg/kg bw. Blood was collected over a 171 day observation period. Urine was collected over 24 hour periods on days -3 (baseline), 1 and 2 and weekly thereafter up to and including day 70. Serum was prepared from the blood and all samples were frozen at -200C until analysis. Serum concentration versus time data were analysed using a non-compartmental model, which was considered to be the best fit by the authors. No further explanation is given in the paper.
Table A3.4: Pharmacokinetic parameters for cynomolgus monkeys after a single iv dose followed by a 171 day observation period
Parameter Male FemaleCmax (µg/mL) 180±17 180±20Serum [PFHxS]o.5h (µg/mL) 108±20 148±17Serum [PFHxS]24h (µg/mL) 35.20±5.15 39.50±9.73Serum [PFHxS]day 171 (µg/mL) 17.27±2.41 11.73±4.91% PFHxS dose in urine, 0-24h 0.102±0.010 0.055±0.033t1/2 (day) 141±30 87±27CL (mL/day/kg) 1.33±0.12 1.93±0.41AUC (µg day/mL) 7462±675 5794±1396Vdss mL/kg) 287±52 213±28
Values presented are mean ± standard error and taken from Sundström et al. 2012
There was no difference in mean Cmax values between males and females. The lower day 171 serum values for females, along with the shorter t1/2, higher mean clearance value and lower AUC indicated that female cynomolgus monkeys are likely to excrete PFHxS more rapidly than males.
The percentage of administered dose detected in the urine on each sampling occasion was low, reported to be in the order of 0.03% (no individual day of sampling numerical data presented in the paper). The overall mean % for males was approximately twice that for females (0.102 vs 0.055% respectively). Faeces were not sampled.
196

The Vdss values were considered by the authors to indicate predominantly extracellular distribution.
Kim et al. 2016 – Gender differences in pharmacokinetic and tissue distribution of PFHxS in rats
The objective of this study with respect to PFHxS13 was to confirm and investigate further the gender differences in PK characteristics after a single iv or oral gavage administration in rats.
Male and female Sprague Dawley rats (5/sex/group; at least 8-12 weeks old) were given a single iv or oral gavage dose of K+PFHxS at 4 mg/kg bw. Males were observed for a period of 72 days, while females were observed for only 14 days. During the observation periods, blood (processed to plasma), urine and faeces samples (24-hour sampling period) were collected. The timing of these observations are given in the table below. At study termination samples from the liver, kidneys, heart, lung and spleen from each animal were taken for analysis of PFHxS levels (region of tissue sampled was not detailed). All samples were frozen with liquid nitrogen and stored at -800C until analysis.
The authors used a two-compartment model to analyse the data.
Table A3.5: Summary of sampling times
Route Dose (mg/kg) Blood sampling time Urine and faeces
sampling days
Males iv/oral 4 1, 3, 9, 18, 24, 30, 36, 43, 51, 58, 65 and 72# days
1, 2, 3, 5, 7, 14 and weekly thereafter to day 70
Females iv/oral 4 0.5, 1, 2, 4, 6,12, 24 hours and 2, 3, 5, 7, 10 and 14* 1, 2, 3, 5 and 14*
# males terminated Day 72; * females terminated Day 14
There were clear gender differences, irrespective of the dose route, for Tmax, AUC, t1/2, clearance and amount of PFHxS detected in the urine. PFHxS was mainly excreted in the urine with only small amounts recovered in the faeces. The reported high mean value for faecal excretion in iv females is considered to be unreliable because of the high SE value associated with it (SE is greater than the mean value). Individual animal data were not available.
Cmax and Vd were similar between routes and genders. The authors suggest that similarities in Cmax between the iv and oral route support approximately 100% oral bioavailability.
Investigations of the organs taken at termination for PFHxS levels showed some distribution to the liver, kidneys, lungs, heart and spleen. The highest levels were seen in the liver and then the kidney. Partition coefficient (Kp) values for PFHxS in the organs investigated were all < 0.2 indicating that the tissue distribution of PFHxS was low and there was negligible accumulation. Liver and kidney Kp values for females were slightly lower than those for males. Kp values for other organs were considered to be similar between the sexes.
13 PFOA and PFOS were also included in this study but those results are not included in this report. In addition this paper reported on validation of a revised method for quantification of PFAS in rat serum and tissues, the results of the validation have not been included in this report.
197

Table A3.6: Pharmacokinetic parameters in rats given either a single oral or iv dose at 10 mg/kg bw/day PFHxS
Summary of PK parametersMales Females
Oral iv Oral ivCmax (µg/mL) 13.30±0.16 14.87±2.88 14.93±0.73 13.83±1.14Tmax (day) 3.11±0.14* NA 0.06±0.01 NAAUC (µg.day/mL) 559.35±4.39 444.16±2.23* 32.04±0.87 17.55±0.52t1/2(day) 26.90±0.37 20.70±3.96* 1.72±0.11 0.88±0.07Vd (mL/kg) 277.58±3.92 268.91±52.13 255.88±18.17 289.30±23.18
CL (mL/day/kg) 7.15±0.06 9.01±0.05* 124.83±3.40 227.93±6.73
CLR (mL/day/kg) NA 0.76±0.01* NA 63.87±1.96Xu(t) (µg) 93.94±21.66 82.63±9.86* 485.70±74.08 280.22±34.41Xf(t) (µg) 2.70±2.86 3.24±1.92 1.78±0.58 10.82±11.46
Data taken from Kim et al. 2016.* P<0.05 between males and females; ** P<0.01 between males and femalesCLR – renal clearance; Xu(t) – amount PFHxS excreted in urine; Xf(t) – amount of PFHxS excreted in faeces
Table A3.7 -Summary of partition coefficients (Kp) in organs taken at termination
Compartment Male FemaleLiver 0.17±0.04 0.11±0.03Kidney 0.13±0.03 0.08±0.02Heart 0.05±0.01 0.04±0.02Lung 0.04±0.01 0.03±0.02Spleen 0.02±0.01 0.02±0.01
198