perfluorooctanoic acid (pfoa) & perfluorooctane sulfonate (pfos)
TRANSCRIPT

Perfluorinated Chemicals (PFCs):
Perfluorooctanoic Acid (PFOA) &
Perfluorooctane Sulfonate (PFOS)
Information Paper
August 2015
Remediation and Reuse Focus Group
Federal Facilities Research Center
ASTSWMO
1101 17th Street, NW, Suite 707
Washington, DC 20036 www.astswmo.org

PERFLUORINATED CHEMICALS (PFCs): PFOA & PFOS INFORMATION PAPER AUGUST 2015
i
ACKNOWLEDGEMENTS
The Association of State and Territorial Solid Waste Management Officials (ASTSWMO) Federal Facilities Research Center’s Remediation and Reuse Focus Group prepared this document with assistance from the U.S. Environmental Protection Agency (EPA) Office of Federal Facilities Restoration and Reuse (FFRRO) under Cooperative Agreement RT-83489201. This document does not necessarily reflect the policy or legal position of U.S. EPA or FFRRO. The views expressed in this document are those of the ASTSWMO Remediation and Reuse Focus Group and its members, and have not been formally endorsed by the ASTSWMO Board of Directors.
ASTSWMO is an organization supporting the environmental agencies of the States and Territories (States). ASTSWMO's mission is to enhance and promote effective State and Territorial programs and to affect relevant national policies for waste and materials management, environmentally sustainable practices, and environmental restoration. The mission of the Remediation and Reuse Focus Group is to identify and investigate issues arising from the remediation, reuse, and long-term management of federal facilities. This includes researching and developing resource documents, issue papers, and other tools on the implementation of alternative or innovative remediation policies and strategies; site closeout and transfer; reuse and redevelopment of federal facilities; and long-term stewardship. ASTSWMO thanks the following members for their participation in developing this report: Monica Sheets, CO – Past Focus Group Chair Ruben Zamarripa, MO – Focus Group Chair Isabella Alasti, CA Stephanie Andrews, IN Elisabeth Green, MD Rita Kottke, OK Mark Lewis, CT Dean Nygard, ID Amy Potter, GA Wilmarie Rivera, PR Gwen Zervas, NJ

PERFLUORINATED CHEMICALS (PFCs): PFOA & PFOS INFORMATION PAPER AUGUST 2015
ii
TABLE OF CONTENTS
ACKNOWLEDGEMENTS .................................................................................................................... i
TABLE OF CONTENTS........................................................................................................................ii
OVERVIEW ....................................................................................................................................... 1
MANUFACTURING AND USES OF PFCs ........................................................................................... 2
PFOS ............................................................................................................................................. 2
PFOA ............................................................................................................................................ 3
ENVIRONMENTAL FATE AND TRANSPORT ...................................................................................... 4
HEALTH AND ENVIRONMENTAL EFFECTS ....................................................................................... 5
Summary ...................................................................................................................................... 5
Research Details .......................................................................................................................... 6
ANALYTICAL AND TREATMENT METHODS...................................................................................... 7
Analytical Methods ...................................................................................................................... 7
Treatment Methods or Remediation Alternatives ...................................................................... 8
STATE AND FEDERAL GUIDELINES................................................................................................... 8
U.S. Environmental Protection Agency ....................................................................................... 9
States ......................................................................................................................................... 10
Department of Defense ............................................................................................................. 12
U.S. Navy .................................................................................................................................... 13
FURTHER DEVELOPMENTS AND STUDIES ..................................................................................... 13
REFERENCES .................................................................................................................................. 14
APPENDIX A: CASE STUDY - Former Wurtsmith Air Force Base………………………………………………A-1

PERFLUORINATED CHEMICALS (PFCs): PFOA & PFOS INFORMATION PAPER AUGUST 2015
1
Perfluorinated Chemicals (PFCs): Perfluorooctanoic Acid (PFOA) & Perfluorooctane Sulfonate (PFOS) Information Paper
OVERVIEW
The purpose of this document is to provide the Association of State and Territorial Solid Waste Management Officials (ASTSWMO) membership with information on perfluorinated chemicals (PFCs), which are emerging contaminants of concern. The identification and cleanup of these contaminants may pose unique challenges in State and Territorial (hereinafter collectively referred to as States) cleanup programs.
There are many chemicals that fall into the generic family of PFCs. This paper will focus on the two most commonly researched PFCs and most prevalent in the environment:1
perfluorooctanioc acid (PFOA)
perfluorooctane sulfonate (PFOS) The science surrounding PFCs is still evolving, especially in the fields of health and environmental effects and human toxicology. Much research has been and is being performed in the U.S. and internationally. PFCs are persistent, bio-accumulative, and toxic substances that have been detected all over the world, even in remote locations. They have been shown to be toxic to laboratory animals, and there is inconclusive evidence that they might cause cancer in animals. The toxicity to humans is still being debated; although some studies suggest that these chemicals function as endocrine disruptors and mimic fatty acids in the body. The chemicals are not easily excreted and remain in the human body for years (estimated 4-8 years). In addition, PFCs do not degrade in the environment and are not
1 Additional information on the chemical properties of PFCs are available in Appendix A, Attachment 1.
PFCs Quick Facts1
What are PFCs? PFCs are very stable, man-made chemicals. The chemical structure of PFCs is a chain of carbon atoms (4 to 16) surrounded by fluorine atoms and often with a charged functional group at the end (typically acarboxylate or sulfonate salt or acid). PFCs with 8 or greater Carbon atoms, including PFOA and PFOS, are long-chain PFCs. They are unique substances that repel oil, grease and water. How have PFCs been used? PFCs have been used to make fluoropolymer coatings and products that are oil and water repellent such as Teflon®, StainMaster® carpets, Scotchgard®, and GoreTex®. They have also been used to make surfactants that are used in fire-fighting foams and mist suppressants for metal plating operations. Where are PFCs found in the environment? PFCs are extremely stable and persistent in the environment, and migrate easily. They have been found globally (even in remote locations) in water, soil, and air, as well as in food, breast milk, umbilical cord blood, and human blood serum. They also concentrate in the food chain. How does exposure to PFCs affect human health? Scientists are continuing to study PFCs. Studies show that humans do not metabolize PFCs nor does the human body excrete the longer chain compounds very rapidly. In some cases it may take years for the human body to rid itself of PFCs. This is in contrast to animal (mice, rats) which rapidly excrete the chemicals. Some studies suggest that these substances may affect sex hormones and cholesterol in humans. Animal studies indicate damage to the liver and tumor development. The scientific evidence is inconclusive on whether PFCs might cause cancer in humans.
1ATSDR, 2009

PERFLUORINATED CHEMICALS (PFCs): PFOA & PFOS INFORMATION PAPER AUGUST 2015
2
removed by conventional water treatment methods, such as in-situ pump and treat, soil vapor extraction and air sparing. PFCs have been used to make fluoropolymer coatings and products that are widely used by consumers due to their oil and water repellent characteristics. They have also been used to make surfactants that are used in fire-fighting foams and mist suppressants for metal plating operations. Locations that may have been contaminated with PFCs include:
firefighting training areas,
aircraft crash sites,
metal coating and plating facilities,
water treatment systems and receiving water bodies, and
airport hangars and other facilities storing fire-fighting foams The scientific community, industry leaders, regulatory agencies, and others are working to fully understand the health and environmental effects of PFCs as well as developing various analytical methods, treatment technologies, and remediation alternatives. In addition, federal government agencies and States are developing their own regulatory guidelines and protocols for addressing PFC contamination in the United States. This document includes introductory information and resources specific to PFCs and their persistence in the environment, and summarizes policy decisions and programs being implemented at federal facilities and other cleanup sites within the United States. A case study provided by the Michigan Department of Environmental Quality is also presented. MANUFACTURING AND USES OF PFCs PFCs are a large class of synthetic fluorinated chemicals and have been used in many industries including aerospace, automotive, construction, manufacturing, electronics, and textiles. PFCs have been used since the 1940s as manufacturer-applied oil and water repellants on products such as clothing, upholstery, paper, and carpets, and are also used in making fluoropolymers for non-stick cookware. PFCs surfactant qualities were also utilized in mist suppressants that can be added to metal plating baths to prevent air releases and to fire-fighting foams for flammable liquids (ATSDR, 2009). The two most commonly researched PFCs and most prevalent in the environment are PFOS and PFOA (ATSDR, 2009). PFOS
In 1966, aqueous film forming foam (AFFF) was patented as a method for extinguishing liquid hydrocarbon fires (Tuve & Jablonski, 1966). In 1969, the Department of Defense (DoD) issued military specification Mil-F-24385, which includes the requirements for AFFF liquid concentrate

PERFLUORINATED CHEMICALS (PFCs): PFOA & PFOS INFORMATION PAPER AUGUST 2015
3
fire extinguishing agents consisting of PFOS. AFFF meeting MIL-F-24385 specifications were developed by seven manufacturers since the 1960s – 3M, Ansul, National Foam, Angus, Chemguard, Buckeye, and Fire Service Plus, Inc. – for the use in extinguishing fires at military bases, airports, oil refineries, and firefighting training facilities throughout the U.S. Between 2000 and 2002, the 3M Company, the largest manufacturer of AFFF in the world, voluntarily phased out its production. AFFF has not been manufactured in the United States since 2002 (Place & Field, 2013; Houtz, Higgins, Field, & Sedlak, 2014). AFFF products containing PFOS may still be in use. Although AFFF was reformulated in the early 2000s and no longer contains PFOS, civilian and military airports continue to maintain an inventory of PFOS-based AFFF. In recent years, the U.S. Environmental Protection Agency (EPA) issued Significant New Use Rules (SNURs) under its Toxic Substances Control Act (TSCA) authority to restrict the production and use of products that contain PFOS and its precursors; however, the U.S. EPA, Federal Aviation Authority, and other regulatory agencies continue to allow its use.2 (FAA, 2011) In 2004 and 2011, Robert L. Darwin, P.E., prepared estimates on the quantities of AFFF in the U.S. for the Fire Fighting Foam Coalition. Estimates provided in 2011 are provided in Table 1 below. Table 1: Estimates of AFFF Quantities by Sector, 2004 – 2011 (Darwin, 2011)
Sector PFOS-based AFFF (2004), gallons
PFOS-based AFFF (2011), gallons
Military & Other Federal 2,100,000 1,094,700
Civil Aviation (Aircraft Rescue and Fire) 130,000 20,000
Oil Refineries 950,000 152,000
Other Petro-Chem 1,000,000 500,000
Civil Aviation (Hangars) 190,000 70,300
Fire Departments 120,000 60,000
Miscellaneous 150,000 75,000
TOTALS 4,600,000 1,972,000
PFOA
PFOA has been manufactured in industrial quantities since the 1940s, and unlike PFOS, PFOA continues to be manufactured in the United States although several companies are phasing out its use. PFOA has been used primarily as an aqueous dispersion agent (additive) in the manufacturing of fluoropolymers, which are substances with special properties that have thousands of manufacturing and industrial applications. Well-known fluoropolymers are Teflon®, which is used in non-stick cookware, Gore-Tex® textiles, Stainmaster® carpets, and Scotchgard®.3 PFOA can also be created by the degradation of some fluorinated telomers that are not
2 67 FR 11008, 67 FR 72854, citing the TSCA Section 5(f) 3 These registered and trademarked products are still available; however their manufacturers have ceased purchasing materials containing PFOA or revised the chemical formulas to eliminate the use of PFOA.

PERFLUORINATED CHEMICALS (PFCs): PFOA & PFOS INFORMATION PAPER AUGUST 2015
4
manufactured using PFOA. Fluorinated telomers are used in fire-fighting foams and as surface protection to provide soil, stain, grease, and water resistance in products such as tile, stone, textiles, and paper packaging (U.S. EPA, 2014). In 2006, U.S. EPA partnered with eight chemical companies to launch the 2010/2015 PFOA Stewardship Program to reduce emissions and product content of PFOA and long-chain PFCs that break down to PFOA by 95% in 2010, and to eliminate long-chain PFCs by 2015. As of January 2015, the program is on track to meet its goal of phasing out the use of PFOA by 2015 (U.S. EPA, 2015). ENVIRONMENTAL FATE AND TRANSPORT
PFOS and PFOA compounds are highly soluble in water and typically present as an anion (conjugate base) in solution and have very low volatility due to their ionic nature (ATSDR, 2009). Long chain PFCs have low vapor pressure, and aquatic environments are expected to be their primary sink in the environment (Environment Canada, 2010). These compounds do not readily degrade by most natural processes. They are thermally, chemically, and biologically stable and are resistant to biodegradation, atmospheric photooxidation, direct photolysis, and hydrolysis. The structure of PFCs increase their resistance to degradation: the carbon-fluorine bonds require a lot of energy to break, and the fluorine atoms shield the carbon backbone (OECD, 2002).
PFCs have been found worldwide in soil, groundwater, surface water, rain, ice caps, air, plants, animal tissue, and blood serum (Furl & Meredith, 2010). The highest concentrations found in the environment tend to be associated with direct discharge from industries where PFCs are in use. Fresh waters in the vicinity of these industries have been documented to have concentrations of PFCs ranging from 1 – 1000s parts per trillion (ppt). Oceanic concentrations of PFCs are several orders of magnitude lower, ranging closer to 0.01 – 0.1 ppt (Lindstrom, Strynar, & Libelo, 2011). U.S. EPA Region 5 (2009) has detected PFCs in municipal tap water in Chicago and Cleveland with PFOS concentrations ranging from 2.0ppt to 5.0 ppt. Interestingly, while not volatile, PFCs have been detected in air, sediments, and fauna in the Arctic, despite being geographically separated from any possible human sources (Lindstrom et al., 2011).
PFCs are mobile in soil and leach into groundwater (SERDP, 2012). It is not completely understood how the compounds are transported to areas far removed from industrial facilities or consumer products. Three hypotheses have been presented regarding the method of long-range transport of PFCs. One possibility is direct ocean transport of PFCs (ATSDR, 2009). The second is that PFCs are transported directly as marine aerosols, which is supported by evidence that surfactants accumulate at the surface of water bodies (ATSDR, 2009). In addition, a third hypothesis is that volatile fluorotelomer alcohols travel great distances in the atmosphere and degrade into PFOS and PFOA (Wallington et al., 2006)

PERFLUORINATED CHEMICALS (PFCs): PFOA & PFOS INFORMATION PAPER AUGUST 2015
5
HEALTH AND ENVIRONMENTAL EFFECTS
Summary
Due to the wide variety of uses of PFCs, it is not difficult to understand how people are exposed to these chemicals. In the 1990s, regulatory agencies called for additional research on PFCs when it was discovered that PFCs were found throughout the earth’s environment and were also very commonly found in human blood serum. Initial research focused on human exposures, toxicity, health effects, and fate and transport (Lindstrom et al., 2011). Research has indicated that humans can be exposed to PFCs through the following routes:
a) Occupational exposure. Levels of PFCs in the blood of people who work where PFCs are manufactured or used are much higher than people from the same area that do not work where PFCs are manufactured or used. Inhalation and dermal contact are the most common exposure entry routes (ATSDR, 2009).
b) Non-occupational exposure. PFCs contamination of food and air is likely to be responsible
for most non-occupational exposures in industrial nations. Potential exposure routes include (ATSDR, 2009; Lindstrom et al., 2011):
i. Eating fish from contaminated water bodies; ii. Eating crops grown in contaminated soils, particularly in agricultural areas that
receive amendments of biosolids from wastewater treatment plants (WWTPs). Biosolids from WWTPs become contaminated from the treatment of contaminated wastewaters at the WWTP.
iii. Infant consumption of contaminated breast milk. Breast milk can become contaminated from PFCs in the bloodstream of the mother;
iv. Drinking contaminated water. v. Inhalation of contaminated air;
vi. Inhalation and ingestion of house dust containing PFCs; and vii. Direct contact with consumer products that have been treated with PFCs (such as
carpets which are treated with PFCs for stain resistance) or which contain residuals from a manufacturing process (Lindstrom et al., 2011). Children especially may ingest PFCs through hand-to-mouth transfer from treated carpets.
Of significant note is that based on data from the National Health and Nutrition Examination Survey, the concentration of PFOS in national blood serum has decreased since 2002, when 3M eliminated production of the chemical. The median concentration of PFOS in blood serum from 1999 to 2010 decreased by 67%. However, the concentration of PFOA in blood serum levels has not decreased as significantly, indicating sources of PFOA remain. The median concentration of PFOA in blood serum from 1999 to 2010 decreased by 34%. Additionally, the concentrations of other PFCs (other than PFOS and PFOA) in blood serum have increased, which indicates that additional studies on the health effects from exposure to other PFCs are needed (Lindstrom et al., 2011).

PERFLUORINATED CHEMICALS (PFCs): PFOA & PFOS INFORMATION PAPER AUGUST 2015
6
Research Details
The following is a brief description of research into the health effects of PFCs. It is not exhaustive and is only provided as a glimpse at potential health issues. PFCs have been found to bioaccumulate in animals and humans. Although research has indicated that PFCs are toxic to animals, studies are inconclusive regarding health effects on humans. It is difficult to translate health effect studies of PFCs on animals to humans since PFCs have a very short half-life in animals (17-19 days in mice), and a much longer half-life in humans (3-5 years) (Lindstrom et al., 2011). Long-chain PFCs (compounds with ≥ 8 carbon-fluorine bonds), such as PFOS, tend to bioaccumulate in animal species as they move through the food chain, more than PFCs with seven (7) or less carbon-fluorine bonds (such as PFOA). However, PFOA appears to bioaccumulate just as readily in humans as PFCs with 8 carbon-fluorine bonds, such as PFOS (Lindstrom et al., 2011). The human body does not metabolize or rapidly rid itself of these chemicals. The question of toxicity in humans arises from the fact that studies of industrial/chemical workers exposed to these compounds have shown few adverse health effects (ATSDR, 2009), and have generally shown inconsistent results. Studies of people exposed to PFOA, as reviewed in Steenland, Tinker, Frisbee, Ducatman, and Vaccarino (2010), showed links between the chemical and high cholesterol and elevated uric acid. A study of West Virginia and Ohio populations (C8 Science Panel) exposed to PFOA contaminated water from a nearby manufacturing plant showed probable links between PFOA exposure and testicular cancer, kidney cancer, clinically elevated cholesterol in adults and children, changes in thyroid hormone levels, pregnancy induced hypertension, and ulcerative colitis. However, studies conducted under the C8 Science Panel are significantly limited by the lack of cumulative PFOA exposure data for the individual subjects and by the cross-sectional study design (Steenland et al., 2010). Studies of the general public with PFCs in their blood indicated that PFOA may be associated with decreased sperm count, low birth weight, and current thyroid disease (Lindstrom et al., 2011). Studies of pregnant women who had been exposed to PFOA found a possible link between the chemical and low birth weight and developmental effects (ATSDR, 2009). More study is necessary to determine if PFCs are a serious threat to human health. There have been numerous studies of the health effects of PFCs on lab animals. These studies revealed that the health effects depend on the exposure route: (ATSDR, 2009).
Inhalation of high levels of PFOA can cause irritation to the eyes and nose;
Ingestion of PFCs can cause damage to the liver, tumors, birth defects and weight loss; and

PERFLUORINATED CHEMICALS (PFCs): PFOA & PFOS INFORMATION PAPER AUGUST 2015
7
Dermal contact with high levels of PFOA can cause irritation to the skin and changes in the liver. There is a possibility that through dermal contact, PFOA may be absorbed through the skin and cause changes to the liver.
Studies of PFOA exposure in mice performed by Lau revealed possible links between the chemical and increased maternal liver weight, low birth weight, early pregnancy loss, compromised postnatal survival, and delays in growth and development. The most sensitive of the effects appears to be increased maternal liver weight, which has also been reported in studies involving rats and monkeys (U.S. EPA, 2009c). A PFOS exposure study in monkeys also showed links between the chemical and significant health impacts, such as death, decreased body weight, reduced high-density lipoproteins (HDL) in females, low triiodothyronine (T3) concentration in females and males, and increased thyroid-stimulation hormone (TSH) in males (U.S. EPA, 2009c). ANALYTICAL AND TREATMENT METHODS
Analytical Methods
The unique chemical and physical properties of PFOA and PFOS prevent them from being measured using conventional analysis. For example, their extremely low volatility eliminates the possibility of using gas chromatography/mass spectrometry (GC/MS). As a result, the more complex methodology of liquid chromatography and tandem mass spectrometry (LC/MS-MS) has been proven most reliable for analyzing PFOS and PFOA in biological and environmental samples. This type of analysis has allowed for more sensitive determination of many PFCs, including PFOA and PFOS, in air, water, and soil (ATSDR, 2009). U.S. EPA developed the first reference method for PFCs in drinking water in September 2008. EPA’s Method 537, Version 1.1 was published in September 2009, and is intended for analyzing selected perfluorinated alkyl acids in drinking water using solid phase extraction with LC/MS-MS. The method has been validated for 14 different perfluorinated alkyl acids and has lowest concentration minimum reporting limits of 2.9 ppt to 14 ppt (U.S. EPA, 2009b). Before September 2009, there were no validated test methods or standardized data quality criteria. As a result, most PFC data generated and used in earlier publications was not based on validated methods and therefore cannot be used for comparison with today’s data. Many reports have been published on the analysis of PFCs in surface waters, but very few report on the contents of PFCs in air or drinking water. Methods for surface water analysis are similar to those used for drinking water analysis (EFSA, 2008). The European Food Safety Authority (2008) and ATSDR (2009) have compiled and summarized the various analytical technologies available for detecting various PFCs. ASTM has published two methods for analyzing PFCs in environmental media, D7968 – 14 for soil and D7979 – 15 for water, sludge, influent, effluent and wastewater, but neither has been validated yet. Some environmental laboratories have also developed their own LC/MS-MS procedures allowing for the detection of PFCs.

PERFLUORINATED CHEMICALS (PFCs): PFOA & PFOS INFORMATION PAPER AUGUST 2015
8
Treatment Methods or Remediation Alternatives
The unique chemical and physical properties of PFOA and PFOS make the use of conventional treatment technologies difficult. For groundwater, the most common treatment is extraction and filtration through granular activated carbon (GAC). This technology has been shown to consistently remove PFOS at µg/L concentrations with an efficiency of 90%; however, it is not as efficient at removing PFOA and other PFCs. Other adsorbents that have been utilized include: powdered activated carbon, polymers, maize-straw-derived ash, alumina, and montmorillonite. A downside of these groundwater treatments is that the spent absorptive media typically must be incinerated, which increases the overall cost of treatment. Alternative treatment technologies for groundwater include ion exchange, sonochemical treatment and reverse osmosis for groundwater. All of these technologies still require groundwater extraction and ex-situ treatment and are more costly than GAC and relatively experimental (Hawley, Pancrass, & Burdick et al., 2012). For soil treatment, contaminated soils are usually removed and sent to landfills. Not only is this an expensive remediation alternative it is also inefficient because the contaminants are not destroyed, but just transferred to another location. PFC contaminated soils can also be incinerated, but only high temperature incinerators will completely destroy PFOS and PFOA (Hawley et al., 2012). Studies continue to be conducted to find more efficient, less costly, in-situ treatment technologies. A review of one study shows that oxidation-based treatment technologies, such as activated persulfate, have significant potential to treat soil and groundwater impacted by PFOS and PFOA (Hawley et al., 2012). A study by DoD’s Strategic Environmental Research and Development Program (SERDP) assesses the possibility of using a permeable reactive barrier (PRB) system to generate effective enzyme-catalyzed humification reactions for in situ remediation of PFC-contaminated groundwater. Results from this study provide a better understanding of how PFCs may be transformed during natural humification processes. While these interactions can be enhanced through system engineering to help address groundwater PFC contamination, additional research is necessary to develop these techniques (Huang, 2013). Research to determine whether microorganisms can degrade PFCs has also been conducted. The results of this research encourage further exploration of fungi as likely candidates to biodegrade PFCs, especially PFOA and PFOS (Tseng, 2012).
STATE AND FEDERAL GUIDELINES
In 2007 and 2008, the Environmental Council of States (ECOS)-DoD Sustainability Workgroup released two issue papers: Identification and Selection of Toxicity Values/Criteria for CERCLA and Hazardous Waste Site Risk Assessments in the Absence of IRIS Values, and Initiation of Emerging Contaminants Characterization and Response Actions for Protection of Human Health. The Workgroup drafted these papers to inform States, U.S. EPA, and DoD on characterization and response actions for emerging contaminants, and to provide recommendations on the identification and selection of toxicity criteria in the absence of IRIS values (ECOS, 2007, 2008).

PERFLUORINATED CHEMICALS (PFCs): PFOA & PFOS INFORMATION PAPER AUGUST 2015
9
Emerging contaminants are defined as chemicals or materials that are characterized by a “perceived or real threat to human health or the environment” and for which “there is no currently published health standard or there is an existing health standard, but the standard is evolving or being reevaluated”. In addition, these contaminants “may have insufficient or limited human health or environmental information available” and “may also become of interest because a new source, pathway or detection limit has been discovered” (ECOS, 2008) States and federal agencies continue to grapple with PFCs as emerging contaminants at various remediation sites across the country. The U.S. EPA, States, and Department of Defense (DoD) are working to better understand the environmental and health implications of PFCs and to establish protocols and regulations for PFCs. Outlined below are additional details about how these entities are addressing these emerging contaminants.
U.S. Environmental Protection Agency
In January 2009, the U.S. EPA Office of Water issued provisional health advisories (PHA) for PFOA and PFOS to assess risk from exposure in drinking water. PHAs are for short-term exposure and are 0.2 µg/L for PFOS and 0.4 µg/L for PFOA (U.S. EPA, 2009a). Based on these PHAs, in October 2009, U.S. EPA Office of Solid Waste and Emergency Response issued a memorandum, subject: The Toxicity of PFOA and PFOS. In the memorandum, sub-chronic RfDs were developed for use in the Superfund program’s risk-based equations to derive Removal Action Levels and/or Screening Levels for water and other media (U.S. EPA, 2009c).
Additional activities conducted by U.S. EPA include:
In 2009, U.S. EPA Region IV established a residential soil screening level of 6 mg/kg for PFOS and 16 mg/kg for PFOA (U.S. EPA Region 4, 2009).
Since 2002, U.S. EPA has used its authority under TSCA to issue several SNURs that have phased out or extremely limited the manufacturing and use of PFCs, including PFOS and PFOA (U.S. EPA, 2013).
In 2010, PFOS and PFOA were removed from the Integrated Risk Information System (IRIS) agenda (75 FR 63827).
In 2012, U.S. EPA began monitoring for PFOS and PFOA under the third Unregulated Contaminant Monitoring Rule (UCMR 3). The UCMR collects data for contaminants suspected to be present in drinking water but do not currently have health-based standards under the SDWA (U.S. EPA, 2012).
In 2015, U.S. EPA listed PFOS and PFOA on its Draft 4th Contaminant Candidate List (CCL). The CCL includes contaminants that are not subject to proposed or promulgated national primary drinking water regulations, but are known or anticipated to occur in public water

PERFLUORINATED CHEMICALS (PFCs): PFOA & PFOS INFORMATION PAPER AUGUST 2015
10
systems and may require future regulation under the Safe Drinking Water Act (SDWA) (80 FR 6076).
States
In the absence of national regulatory standards some States have developed regulatory and guidance advisory and cleanup levels for PFCs. In 2014-2015, the Remediation and Reuse Focus Group requested information from States in order to document current State regulations and guidance for PFCs, and to gather and compile State resources that may assist other States that may soon develop their own. Information provided by States and additional research conducted by the Focus Group on guidance and/or regulatory cleanup levels for PFOS and/or PFOA are provided in Table 2. Table 2: State Guidelines for PFOS and PFOA
State Guidelines Source
Illinois Provisional Groundwater Remediation Objectives - PFOA
0.4 µg/L (Class I)
2 µg/L (Class II) Provisional Groundwater Remediation Objectives - PFOS
0.2 µg/L (Class I)
0.2 µg/L (Class II) Illinois uses Reference Doses derived by the State of Minnesota with the procedures of 35 IAC Part 742 to develop a suite of provisional soil remediation objectives for the Ingestion and Migration to Groundwater pathways.
Illionis EPA, personal communication, October 8, 2013.
Maine Groundwater Remedial Action Guidelines
PFOA: 0.06 ppb
PFOS: 0.1 ppb
Maine Center for Disease Control has derived non-cancer human health risk-based screening levels for exposures to soil, sediment, groundwater, surface water, and ingestion of fish, for PFOA and PFOS.
http://www.maine.gov/dep/spills/publications/guidance/rags/final_5-8-2013/3%20ME-RAG%20Tables%205-8-2013.xlsx Maine DEP, personal communication, 2015

PERFLUORINATED CHEMICALS (PFCs): PFOA & PFOS INFORMATION PAPER AUGUST 2015
11
State Guidelines Source
Michigan Fish advisories for Clarks Marsh and the Ausable River. Surface water used as drinking water, PFOA: 0.420 µg/L Ambient water quality standard, PFOS: 0.012 µg/L
Michigan DEQ, personal communication, October 8, 2013. http://www.michigan.gov/deq/0,1607,7-135-3313_3686_3728-11383--,00.html http://www.michigan.gov/mdch/0,4612,7-132-54783_54784_56159-285528--,00.html
Minnesota Drinking Water Health Risk Limit: 0.3 µg/L (PFOA, PFOS) Fish Consumption:
1.6 µg/L (PFOA, Lake)
2.7 µg/L (PFOA, River)
12 ng/L (PFOS, Lake)
6 ng/L (PFOS, River) Drinking water plus fish consumption:
0.61 µg/L (PFOA, Lake)
0.72 µg/L (PFOA, River)
12 ng/L (PFOS, Lake)
6 ng/L (PFOS, River) Ecological, Acute:
15,000 µg/L (PFOA)
85 µg/L (PFOS) Ecological, Chronic:
1,700 µg/L (PFOA)
19 µg/L (PFOS) Soil:
Tier 1, Residential soil value (SRV): 2.1 mg/kg (PFOA, PFOS)
Tier 2, Recreational SRV: o 2.5 mg/kg (PFOA) o 2.6 mg/kg (PFOS)
Tier 2, Industrial SRV: o 13 mg/kg (PFOA) o 14 mg/kg (PFOS)
Minnesota Administrative Rule, Section 4717.7860, Health Risk Limits Table (https://www.revisor.mn.gov/rules/?id=4717.7860) http://www.pca.state.mn.us/index.php/waste/waste-and-cleanup/cleanup/superfund/perfluorochemicals-pfc/perfluorochemicals-pfcs.html
New Jersey Preliminary Drinking Water Guidance Level, PFOA: 0.04 µg/L http://www.state.nj.us/dep/dsr/pfoa_doc.pdf
Nebraska Screening levels for some PFCs are provided in Voluntary Cleanup Program guidance.
NE DEQ, personal communication, 2015

PERFLUORINATED CHEMICALS (PFCs): PFOA & PFOS INFORMATION PAPER AUGUST 2015
12
State Guidelines Source
North Carolina
Groundwater Interim Maximum Allowable Concentration, PFOA: 2 µg/L May lower to 1 µg/L based on new data.
http://daq.state.nc.us/toxics/risk/sab/ra/PFOA_Pending.pdf
Pennsylvania Safe Drinking Water Program developed an action plan as a result of two ongoing cases where PFCs were discovered and treatment proposed.
PA DEP, personal communication, 2015
Texas Texas has established protective concentration levels for 16 PFCs and published in update in its Tier 1 PCL Tables in November 2014.
A. Strahl, personal communication, 2013 http://www.tceq.texas.gov/assets/public/remediation/trrp/pcls2014.xlsx
Washington Listed PFOS as a Persistent, Bioaccumulative, and Toxic (PBT) under Washington State’s PBT rule.
WAC 173-333-320
Department of Defense
DoD has identified PFCs as emerging contaminants. DoD Instruction 4715.18, Subject: Emerging Contaminants (ECs), establishes policy for the identification and management of all emerging contaminants. Emerging contaminants are identified and assessed through a three-tiered process called “scan-watch-action” and are defined as (DoD, 2009):
Have a reasonably possible pathway to enter the environment;
Present a potential unacceptable human health or environmental risk;
Do not have regulatory standards based on peer-reviewed science, or the regulatory standards are evolving due to new science, detection capabilities, or pathways.
Additional information on DoD’s policies and activities related to emerging contaminants is available on its Chemical and Material Risk Management Program’s Emerging Chemical and Material Risks webpage: http://www.denix.osd.mil/cmrmd/ECMR/index.cfm. U.S. Air Force The U.S. Air Force issued Interim Air Force Guidance on Sampling and Response Actions for Perfluorinated Compounds at Active and BRAC installations on September 17, 2012, which has since led to a nationwide assessment of installations for potential PFCs contamination. The guidance notes that the U.S. Air Force will, on a case-by-case basis, review and address requests for action on PFCs “when a regulatory driver, direct human exposure, and/or off-site migration is identified.” The guidance also provides details on how Air Force personnel should respond to regulatory requests for investigations and provides details on contracting for assessments, treatment technologies, and other technical resources (USAF, 2012).

PERFLUORINATED CHEMICALS (PFCs): PFOA & PFOS INFORMATION PAPER AUGUST 2015
13
In accordance with the guidance, the U.S. Air Force has begun assessing PFCs using a systematic, risk-based approach, starting with installations that had fire training areas (FTAs) in operation between 1970 and 2000. The approach includes determining if a release of PFCs has occurred at the FTA, delineating the extent of PFCs contaminated media, and taking mitigating action (if necessary) when there are any confirmed human exposures (USAF, 2012). U.S. Navy
On October 21, 2014, The Assistant Secretary of the Navy (Energy, Installations and Environment) issued a memorandum, Subject: Perfluorinated Compounds (PFCs) – An Emerging Environmental Issue. The memorandum directs the Navy’s Defense Environmental Restoration Program to identify all BRAC and active installations where PFOS and/or PFOA have been released or suspected to have been released, and to address releases in accordance with DoD Instruction 4715.18. The memorandum also directs testing and reporting of U.S. Navy drinking water systems that could be impacted from potential release sites by December 2015, and requires that alternative drinking water be supplied if testing exceeds U.S. EPA’s PHA values (USN, 2014). FURTHER DEVELOPMENTS AND STUDIES
As set forth in this paper, the Remediation and Reuse Focus Group discovered that PFCs contamination is wide-spread throughout the United States and throughout the world. They have been discovered on private and public properties, including federal facilities. PFCs are an emerging environmental and health issue due to their widespread use in a variety of products; chemical properties that make them persistent in the environment, bio-accumulative, toxic, difficult and expensive to remediate, and how they were used or disposed. The presence of PFCs may cause challenges if identified during a remedial investigation as the guidance, policies, and science behind the fate and transport, the health and environmental effects, as well as the analytical and treatment technologies for PFCs quickly evolve. While PFCs are an emerging contaminant, the chemicals have become rather ubiquitous from releases to the environment due to their many uses and different formulations that exist for these compounds. This may pose challenges with source identification as we look to define the extent of groundwater contamination from uncontrolled releases at various sites. However, research efforts are being conducted that may help address some of these challenges and environmental impacts. As long as PFCs are considered an emerging contaminant by States, U.S. EPA, DoD, and other agencies, the Focus Group recommends using the processes developed by the ECOS-DoD Sustainability Workgroup to address PFCs at federal facilities.
The information contained herein is intended to serve as an introduction to PFCs to the ASTSWMO member. ASTSWMO will continue to monitor this emerging issue and provide information to our members as it becomes available.

PERFLUORINATED CHEMICALS (PFCs): PFOA & PFOS INFORMATION PAPER AUGUST 2015
14
REFERENCES
Agency for Toxics and Disease Registry (ATSDR), Division of Toxicology and Environmental Medicine. (2009). Toxicological profile for perfluoroalkyls. U.S. Government Printing Office. http://www.atsdr.cdc.gov/toxprofiles/tp.asp?id=1117&tid=237.
Darwin, R. L. (2011). Estimated inventory of PFOS-based Aqueous Film Forming Foam (AFFF),
2011 update to the 2004 report entitled “Estimated Quantities of Aqueous Film Forming Foam (AFFF) In The United States”. Prepared for the Fire Fighting Foam Coalition, Inc., Arlington, VA.
Department of Defense (DoD) Instruction 4715.18, Subject: Emerging Contaminants (ECs).
(2009) http://www.dtic.mil/whs/directives/corres/pdf/471518p.pdf. Environment Canada. (2010). Risk management scope for perfluorooctanoic acid (PFOA), and its
salts, and its precursors and long chain (C9 – C20) perfluorcarboxylic acids (PFCAs) and their salts and their precursors. Government of Canada.
Environmental Council of States (ECOS) – DoD Sustainability Workgroup, Emerging Contaminants
Task Group. (2007). Issue paper on identification and selection of toxicity values/criteria for CERCLA and hazardous waste site risk assessment in the absence of IRIS values. http://www.ecos.org/files/2733_file_FINAL_ECOS_PV_Paper_4_23_07.doc.
ECOS – DoD Sustainability Workgroup. (2008). issue paper on initiation of emerging contaminants
characterization and response actions for protection of human health. http://www.ecos.org/files/3278_file_Resource_Triggers_Paper_9_15_08.doc.
European Food Safety Authority (EFSA). (2008). Opinion of the scientific panel in the food chain
on perfluorooctane sulfonate (PFOS), perfluorooctanoic acid (PFOA) and their salts. Question No EFSA-Q-2004-163. EFSA Journal 653, 1-131. http://www.efsa.europa.eu/en/scdocs/doc/653.pdf
Federal Aviation Administration (FFA). (2011). National Part 139 CertAlert: Identifying Mil-Spec
Aqueous Film Forming Foam (AFFF). https://www.faa.gov/airports/airport_safety/certalerts/media/cert1102.pdf.
Furl, C. & Meredith, C. (2010). Perfluorinated compounds in Washington rivers and lakes.
Washington Department of Ecology. Publication Number 10-03-034. Olympia, Washington. https://fortress.wa.gov/ecy/publications/summarypages/1003034.html
Hawley, E.L., Pancrass, T. & Burdick, J. (2012). Remediation technologies for perfluorinated
compounds (PFCs) including perfluorooctane sulfonate (PFOS) and perfluorooctanoic acid (PFOA). Arcadis White Paper.

PERFLUORINATED CHEMICALS (PFCs): PFOA & PFOS INFORMATION PAPER AUGUST 2015
15
Houtz, E. F., Higgins, C. P., Field, J.A. & Sedlak, D. I. (2014). Persistence of perfluoroalkyl acid precursors in AFFF-impacted groundwater and soil.” Environmental Science & Technology, 47(15), doi: 10.1021/es4018877. http://www.researchgate.net/publication/252323955_Persistence_of_Perfluoroalkyl_Acid_Precursors_in_AFFF-Impacted_Groundwater_and_Soil.
Huang, Q. (2013). Remediation of perfluoroalkyl contaminated aquifers using an in-situ two layer
barrier: laboratory batch and column study. SERDP Project ER-2127. https://www.serdp-estcp.org/Program-Areas/Environmental-Restoration/Contaminated-Groundwater/Emerging-Issues/ER-2127/ER-2127/%28modified%29/30Jun2014
Lindstrom, A.B., Strynar, M.J., & Libelo, E.L. (2011). Polyfluorinated compounds: past, present,
and future. Environmental Science & Technology 45, 7954-7961, doi: 10.1021/es2011622. http://pubs.acs.org/doi/ipdf/10.1021/es2011622
Military Specification (MIL)-F-24385, Fire Extinguishing Agent, Aqueous Film Firefighting Foam
(AFFF) Liquid Concentrate, Six Percent, For Fresh and Seat Water. November 21, 1969. Organization for Economic Cooperation and Development (OECD) Environment Directorate.
(2002). Hazard assessment of perfluorooctane sulfonate (PFOS) and its salts.’’ www.oecd.org/chemicalsafety/risk-assessment/2382880.pdf
Place, B.J. &J.A. Field. (2013). Identification of novel fluorochemicals in aqueous film-forming
foams (AFFF) used by the US military.” Environmental Science & Technology, 46 (13), 7120-7127. Doi: 10.1021/es301465n. http://www.ncbi.nlm.nih.gov/pmc/articles/PMC3390017/
Steenland, K., Tinker, S., Frisbee, S., Ducatman, A., & Vaccarino, V. (2009). Association of
perfluorooctanoic acid and perfluorooctane sulfonate with serum lipids among adults living near a chemical plant. American Journal of Epidemiology, 170(10): 1268-78, doi: 10.1093/aje/kwp279. http://aje.oxfordjournals.org/content/170/10/1268.abstract.
Strategic Environmental Research and Development Program (SERDP). (2012). FY 2014
Statement of need, environmental restoration program area, in situ remediation of perfluoroalkyl contaminated groundwater. SON Number: ERSON-14-02. https://www.serdp-estcp.org/content/download/15973/182513/version/1/file/FY14+ERSON-14-02+PFOS.pdf
Tseng, N. (2012). Feasibility of biodegradation of polyfluoroalkyl and perfluoroalkyl substances.
A thesis submitted in partial satisfaction of the requirements for the degree Master of Science in Civil Engineering. UCLA. http://escholarship.org/uc/item/2x47296b.

PERFLUORINATED CHEMICALS (PFCs): PFOA & PFOS INFORMATION PAPER AUGUST 2015
16
U.S. Air Force (USAF), HQ USAF/A7C. (2012). Interim Air Force guidance on sampling and response actions for perfluorinated compounds at active and BRAC installations. Washington, DC.
U.S. Environmental Protection Agency (EPA). (2009a). Provisional health advisories for
perfluorooctanoic acid (PFOA) and perfluorooctane sulfonate (PFOS). Attachment 1 to: http://www.epa.gov/opptintr/pfoa/pubs/Final%20PFOA%20PFOS%20RfD%20memo%2010-28-09.pdf.
U.S. EPA. (2009b). Determination of selected perfluorinated alkyl acids in drinking water by solid
phase extraction and liquid chromatography/tandem mass spectrometry (LC/MS/MS). Version 1.1. http://www.epa.gov/nerlcwww/documents/Method%20537_FINAL_rev1.1.pdf.
U.S. EPA. (2009c). The toxicity of perfluorooctanic acid (PFOA) and perfluorooctane sulfonate
(PFOS). Memorandum. http://www.epa.gov/opptintr/pfoa/pubs/Final%20PFOA%20PFOS%20RfD%20memo%2010-28-09.pdf
U.S. EPA. (2012). Unregulated Contaminant Monitoring Rule 3.
http://water.epa.gov/lawsregs/rulesregs/sdwa/ucmr/ucmr3. U.S. EPA (2013). Prepublication notice of Final Significant New Rule on perfluoroalkyl sulfonates
and long chain perfluoroalkyl carboxylate chemical substances. 40 CFR Parts 9 and 721. EPA-HQ-OPPT-2012-0268; FRL-9397-1. RIN 2070-AJ95.
http://www.epa.gov/oppt/pfoa/pubs/pfas.html. U.S. EPA. (2014). Perfluorooctanoic acid (PFOA) and fluorinated telomers webpage.
http://www.epa.gov/oppt/pfoa/pubs/pfas.html. U.S. EPA. (2015). 2010/2015 PFOA Stewardship Program webpage.
http://www.epa.gov/oppt/pfoa/pubs/stewardship/index.html. U.S. EPA Region 4 (2009). Soil screening levels for perfluorooctanoic acid (PFOA) and
perfluorooctyl sulfonate (PFOS).” Memorandum. U.S. EPA Region 5. (2009). PFOS chromium electroplater study.
http://www.epa.gov/opptintr/pfoa/pubs/pfoschromeplaterstudypdf_final.pdf. U.S. Navy (USN). Assistant Secretary of the Navy (Energy, Installations and Environment). (2014).
Perfluorinated compounds (PFCs) – An emerging environmental issue. Memorandum. Wallington TJ, Hurley MD, Xia J, Wuebbles DJ, Sillman S, Ito A, Penner JE, Ellis DA, Martin J,
Mabury SA, Nielsen OJ, & Sulbaek Andersen MP. (2006). Formation of C7F15COOH (PFOA) and other perfluorocarboxylic acids during the atmospheric oxidation of 8:2

PERFLUORINATED CHEMICALS (PFCs): PFOA & PFOS INFORMATION PAPER AUGUST 2015
17
fluorotelomer alcohol. Environmental Science & Technology, 40(3): 924-30, doi: 10.1021/es051858x. http://pubs.acs.org/doi/abs/10.1021/es051858x.
Tuve, RL, & E.J. Jablonski. Method of extinguishing liquid hydrocarbon fires. U.S. Patent 3,258,423, filed September 4, 1963, and issued Jun 28. 1966. http://www.google.com/patents/US3258423.

Case Study – Former Wurtsmith Air Force
Base
by: Robert Delaney
Dorin Bogdan, Ph.D., EIT Dale Corsi, PE
December 19, 2014
APPENDIX A
A-1

Robert Delaney, DSMOA Coordinator Department of Environmental Quality 517-284-5085 P.O. Box 30426 Lansing, Michigan 48909-7926 [email protected] Dorin Bogdan, PhD, EIT AECOM 616-940-4381 5555 Glenwood Hills Parkway, SE Suite 300 Grand Rapids, MI 49512 [email protected] Dale Corsi, PE AECOM 517-913-5824 401 South Washington Square Lansing, MI 48933 [email protected]
APPENDIX A
A-2

Table of Contents 1. Introduction…………………………………………………………………………… 1 2. Case Study – WAFB…………..………………………………………………………. 1 3. Conclusions……………………………………………………………………………. 6 4. References…………………………………………………………………………….… 8
List of Figures Figure 1: Former Wurtsmith Air Force Base Figure 2: Examples of Major PFAS Classes* Figure 3: Location Where PFASs Detected Figure 4: Extent of PFAS Contamination from Wurtsmith Figure 5: Food Web From Mai Po Marshes, Hong Kong* Figure 6: Example of Tree Swallow Food Web* Figure 7: 5 Total PFAS Plumes into Clark’s Marsh and Fish Sample Data Figure 8: Total PFAS contamination of the Au Sable by 7 Streams Figures 9: Example of Multiple PFAS Plumes in Groundwater Figure 10: FT-02 Groundwater Plume and Cross Section Location Figure 11: FT-02 Plume Cross Section A-A’ Figure 12: Former Wurtsmith AFB – Clark’s Marsh - Upper Pond - Pumpkin Seed -
PFOS in Different Media 2012 Figure 13: Former Wurtsmith AFB – Clark’s Marsh - Upper Pond - Pumpkin Seed –
PFHxS in Different Media 2012 Figure 14: Former Wurtsmith AFB – Clark’s Marsh - Upper Pond - Pumpkin Seed -
PFOSA in Different Media 2012 Figure 15: Drinking Water Field and PFAS Plume Today *Figures 2, 5, and 6 are presented in the text. List of Tables
Table 1: State of Michigan Fish Consumption Screening Value (FCSV) Ranges for
PFOS Table 2: Geometric Mean Total PFASs concentrations in eggs and plasma at four
locations Table 3: Concentration comparisons from fish and tree swallow studies, Clark’s Marsh
Pond 1 - (2014) Table 4: Remedial Action Standards Table 5: Effluent and Influent concentrations of PFASs for Mission Drive Pump and
Treat System List of Attachments Attachment 1: PFASs Supplemental Data Attachment 2: 47 PFAS Analysis
APPENDIX A
A-3
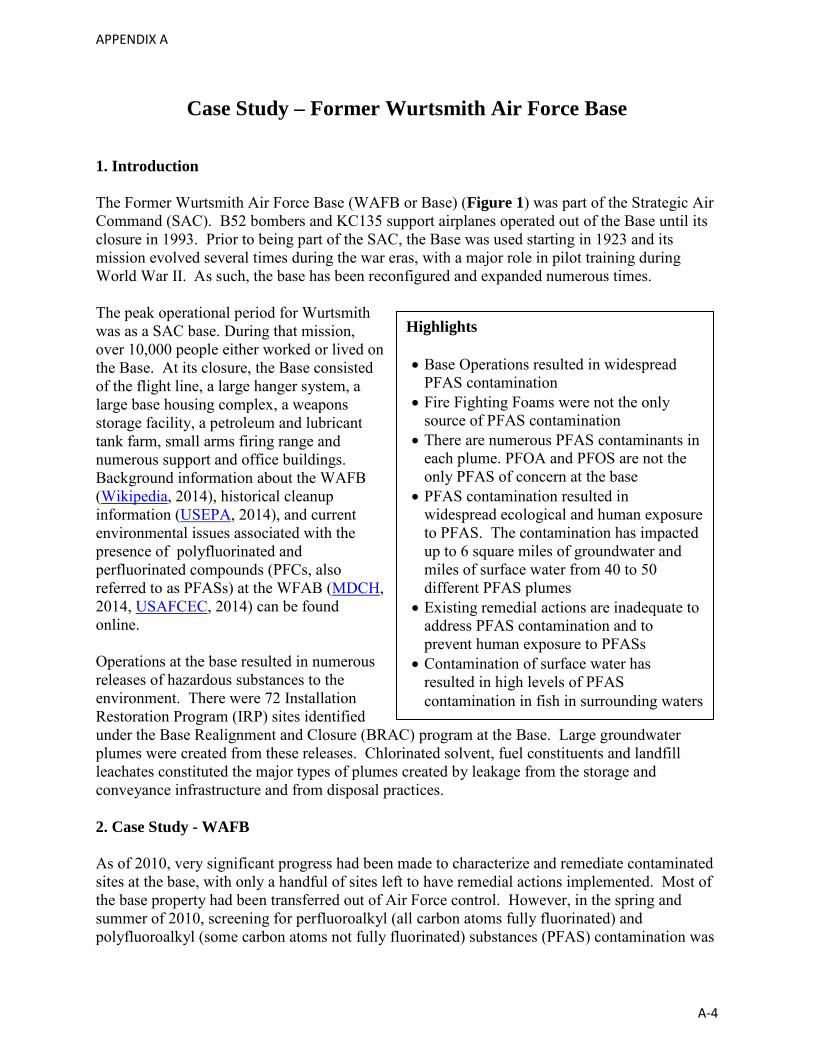
Case Study – Former Wurtsmith Air Force Base 1. Introduction The Former Wurtsmith Air Force Base (WAFB or Base) (Figure 1) was part of the Strategic Air Command (SAC). B52 bombers and KC135 support airplanes operated out of the Base until its closure in 1993. Prior to being part of the SAC, the Base was used starting in 1923 and its mission evolved several times during the war eras, with a major role in pilot training during World War II. As such, the base has been reconfigured and expanded numerous times. The peak operational period for Wurtsmith was as a SAC base. During that mission, over 10,000 people either worked or lived on the Base. At its closure, the Base consisted of the flight line, a large hanger system, a large base housing complex, a weapons storage facility, a petroleum and lubricant tank farm, small arms firing range and numerous support and office buildings. Background information about the WAFB (Wikipedia, 2014), historical cleanup information (USEPA, 2014), and current environmental issues associated with the presence of polyfluorinated and perfluorinated compounds (PFCs, also referred to as PFASs) at the WFAB (MDCH, 2014, USAFCEC, 2014) can be found online. Operations at the base resulted in numerous releases of hazardous substances to the environment. There were 72 Installation Restoration Program (IRP) sites identified under the Base Realignment and Closure (BRAC) program at the Base. Large groundwater plumes were created from these releases. Chlorinated solvent, fuel constituents and landfill leachates constituted the major types of plumes created by leakage from the storage and conveyance infrastructure and from disposal practices. 2. Case Study - WAFB As of 2010, very significant progress had been made to characterize and remediate contaminated sites at the base, with only a handful of sites left to have remedial actions implemented. Most of the base property had been transferred out of Air Force control. However, in the spring and summer of 2010, screening for perfluoroalkyl (all carbon atoms fully fluorinated) and polyfluoroalkyl (some carbon atoms not fully fluorinated) substances (PFAS) contamination was
Highlights • Base Operations resulted in widespread
PFAS contamination • Fire Fighting Foams were not the only
source of PFAS contamination • There are numerous PFAS contaminants in
each plume. PFOA and PFOS are not the only PFAS of concern at the base
• PFAS contamination resulted in widespread ecological and human exposure to PFAS. The contamination has impacted up to 6 square miles of groundwater and miles of surface water from 40 to 50 different PFAS plumes
• Existing remedial actions are inadequate to address PFAS contamination and to prevent human exposure to PFASs
• Contamination of surface water has resulted in high levels of PFAS contamination in fish in surrounding waters
APPENDIX A
A-4

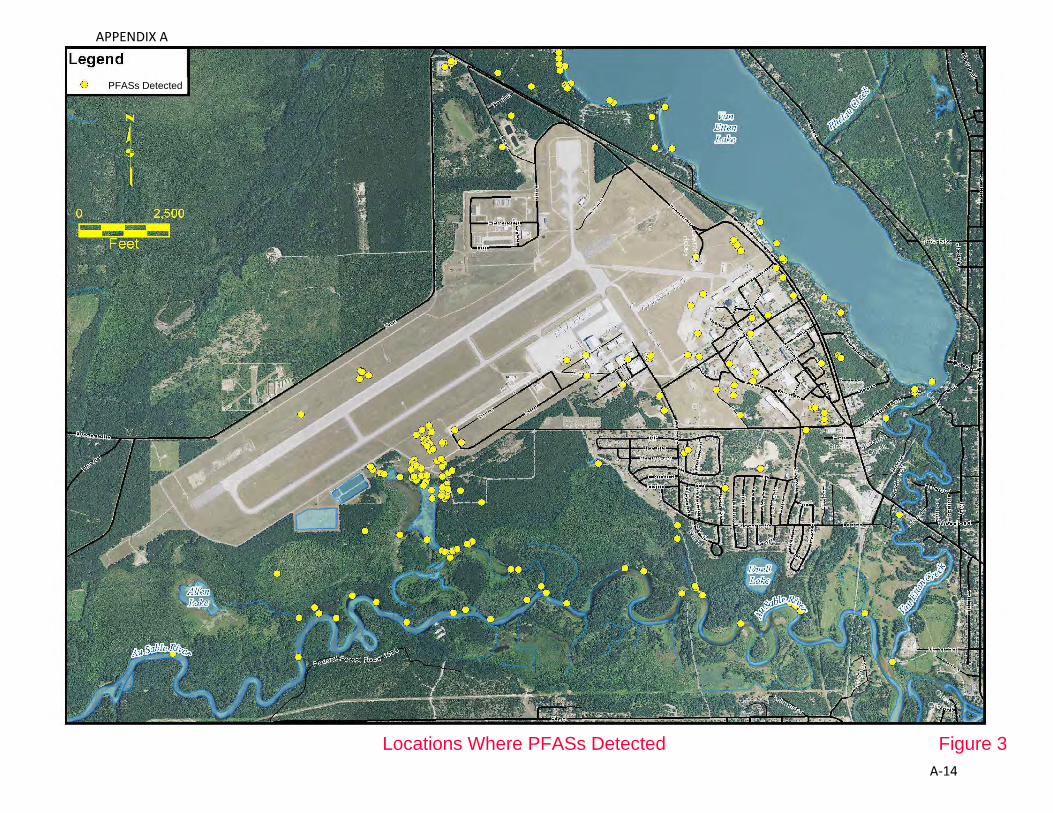
performed at the Fire Training Area (FT02). Figure 2 shows examples of major PFAS chemical classes. Additional information about PFAS and their occurrence at military bases can be found in Attachment 1. “High” levels of PFAS were detected in a stained soil horizon about 2 feet below ground surface at FT02. Ground water samples from monitoring wells also showed high levels of PFAS in the chlorinated contaminant plume originating at the fire training pit. Closer to the pit, groundwater foamed from PFAS contamination when pumped to the surface for sampling. From this initial screening, staff of the Michigan Department of Environmental Quality (MDEQ) began splitting samples with the Air Force contractor across the entire base, randomly picking a few sample locations from each IRP site that had active monitoring. Surprisingly, PFAS contamination was found at every IRP site (Figure 3) and in all but three wells that were analyzed for PFAS. Two of the wells that were not contaminated were from zones where the groundwater originated up gradient of the Base and was deep enough in the aquifer to not be impacted by base operations (water in the shallower parts of the aquifer at these two locations is contaminated with PFAS). The other location that is free of PFAS contamination is located in the middle of a PFAS plume, but the sample location is extremely contaminated with manganese, methane, iron and ammonia. The PFAS contamination is either masked or broken down at this location.
Figure 2. Examples of major PFAS classes In the fall of 2012, Air Force sampling confirmed the sampling results of the MDEQ. Since 2010, MDEQ and the Air Force have performed multiple sampling events in which samples of surface water, groundwater, soils, sediment, fish, and tree swallows have been analyzed for PFASs. The analysis methods for PFAS had improved over the years enabling the analysis of
PFAS
Perfluorinated
Perfluoroalkyl Acids (PFAAs)
Perfluoroalkyl Carboxylates (PFCAs)
Perfluoroalkyl Sulfonic Acids
(PFSAs) Perfluoroalkyl
Sulfonates
Polyfluorinated
Fluorotelomer Alcohols (FTOHs)
N-alkylated Fluorooctane
Ssulfonamides (FOSAs)
N-alkylated fluorooctane
sulfonamidoethanols (FOSEs)
APPENDIX A
A-5

increasing number of different PFASs. To date 20 different PFASs have been detected at the base. Seven samples have been analyzed using the advance techniques developed by Dr. Jennifer Field and her staff from the University of Oregon. The techniques that were used on these seven samples could detect up to 47 PFASs. The results of the seven samples are presented in Attachment 2. The most commonly detected PFAS classes were PFCAs and PFSAs compounds. The compounds that are consistently detected at the highest concentrations are PFOS, PFOA, and perfluorohexane sulfonate (PFHxS). However, sampling across the entire Base for polyfluorinated chemicals has not been performed at this time. This is a significant data gap since these compounds have been shown to be able to degrade to PFSAs and especially to PFCAs, are volatile, and have their own toxicity as well. All 10 background groundwater locations at the Base are free of PFAS contamination indicating that the PFAS contamination originates on the Base.* PFAS contamination has impacted approximately six square miles of groundwater, two square miles of marsh and swamp, nine miles of the Au Sable River, three miles of Van Ettan Creek and three miles of Van Ettan Lake shoreline (Figure 4). The MDEQ and the Michigan Department of Community Health have sampled fish in the major waterways around the base. All fish have shown PFAS contamination at various concentrations. Highest level contamination in fish has been found in the marshes just south of the Base where the plume from the fire training area FT02 discharges. PFOS levels ranged up to 9,580 ppb (9,580,000 ppt) in filets of fish taken from Clark’s Marsh and up 2,956 ppb (2,956,000 ppt) in fish from the Au Sable River. Table 1 provides the Michigan Fish Consumption Screening Value (FCSV) ranges for PFOS. Of the 13 different PFASs sampled for in fish, seven PFASs were detected. A search of the literature revealed that the levels of PFAS contamination in these fish are some of the highest ever recorded. An example of a food web in a marsh that shows different possible pathways of PFAS exposure is shown in Figure 5.
Figure 5. Food web from Mai Po Marshes, Hong Kong (Loi et al., 2011)
*Note: Recent sampling has shown very light contamination at some background locations (one part per trillion
APPENDIX A
A-6

range). These may be from air borne or other sources. However, they are easily distinguished from the plumes generated by the Base. The MDEQ and the United States Geological Survey have sampled tree swallows (Tachycineta bicolor) (plasma, egg, and diet) from nest boxes located on the north part of Clark’s Marsh Pond #1. Tree swallows have been increasingly used to assess contaminant exposure and effects (Custer, 2011) because they can be attracted to a specific area or interest with nest boxes and they feed within a radius smaller than 1kilometer, and are easy to sample (Custer et al., 2014). Tree swallows feed on benthic aquatic insects and are mid-level consumers on the aerial stage. As a result, the contaminants present in the swallow tissue are closely tied to sediment contamination (Custer et al., 2014). We can see in Figure 6 an example of food web for tree swallows.
Figure 6. Example of food web for Tree Swallows
Preliminary results of the tree swallows indicate that the concentrations from WAFB of PFAS in the birds, just like in the case of fish, are also some of the highest concentrations of PFAS ever recorded in tree swallows (See Table 2, personal communication with Custer Thomas - USGS). It can be seen in Table 3 that potential bioaccumulation can be seen in fish based on the surface water data. Based on preliminary results for the tree swallows, there appears to be bioaccumulation as well for certain PFASs in birds. However, further data analysis, especially the diet, has to be evaluated in order to come to a definite conclusion. Nevertheless, the data shows the importance of biota sampling in order to find potential receptor and the environmental fate of PFASs that might lead to human exposure. Although the FT02 (fire training) plume is the most contaminated plume going into Clark’s Marsh and subsequently the Au Sable River, there are at least 4 other plumes discharging into this marsh system (Figure 7) as well.
APPENDIX A
A-7

The marsh system water empties into the Au Sable River which runs parallel to the southern border of the Base. Seven streams on the south side of the base drain swamps, the marsh system, and groundwater plumes. One stream also receives wastewater effluent from the Base. All seven streams are contaminated with PFAS (Figure 8). Very high level PFAS contamination enters the river from at least three streams and likely from groundwater as well (low part per million levels of total PFASs). The contamination of the marshes and river resulted in the high level PFAS contamination of fish and resulted in “Do Not Eat the Fish” advisories for Clark’s Marsh, Allen Lake (south of the base and west of Clark’s Marsh) and the Au Sable River. The fish advisories have resulted in concerns in the local community over health impacts and economic impacts. Both Clark’s Marsh and the Au Sable River are heavily used by both residents of the area and a very large visitor population that supports a locally important recreational industry. To date, there are approximately 30 PFAS plumes that have been discovered with contamination above some criteria. Table 4 provides a partial list of established criteria for both Michigan and around the nation. Between 40 and 50 different PFAS plumes have been detected. It is important to understand that no remedial investigation has been performed base wide for PFAS contamination. The number of plumes above criteria and the number of plumes detected are only estimated. Only screening level work has been performed by the MDEQ and Air Force. It is expected that new plumes and many locations with higher level contamination are yet to be discovered once a full remedial investigation is performed. Figure 9 shows close ups of some of the sites where plumes have been detected. The sources of PFAS contamination are occasionally obvious, while other plumes are yet to be explained. Sources that have been clearly identified include, fire training sites, a KC135 crash site, the hanger areas, a fire equipment wash down area, landfills, the wastewater treatment facility, and possibly the petroleum, oil and lubricant yard. However, for many plumes at the base, the source of the contamination is unknown. The Air Force has moved quickly to address the worst known plume on the base at Fire Training Area FT02. This plume is adding a great deal of contamination to the marsh system and the Au Sable River. The Air Force will soon be capturing and treating this plume in hopes of significantly reducing the contaminant load to these waters with the goal of reducing levels of contamination in fish in the marshes and the Au Sable River. In the fall of 2014, the Air Force started construction on a system to remediate the FT02 PFAS plume. Prior to the start of design, the Air Force contracted to have the plume from FT02 well characterized. Using Air Force data and data generated by MDEQ studies, a conceptual site model has been created for the FT02 plume. Figure 10 is a generalized plume map of the FT02 plume. Figures 11 shows the FT02 plume in cross section with contaminant levels in various matrixes tracked from source to fish fillet. Generalized ideas of contaminant fate and transport, matrix effects, and bio-magnification can be gained by studying the cross sections. For instance PFOA and PFOS show similar patterns of chemical concentration in all matrixes until uptake
APPENDIX A
A-8

into fish is measured and then one can see the uptake and magnification of PFOS in the fish, but virtually no bio-magnification of PFOA. (See Figures 12, 13, and 14). A few residential wells have been impacted on the east side of the base. Levels of PFOS or PFOA, which have been found in these wells, do not exceeded any current drinking water criteria protective of human health. Other PFAS that were detected in these wells do not have “protective of human health” screening level values at this time. However, it is important to note that every residential well that has been tested, has shown PFAS contamination. This emphasizes the need to complete a full remedial investigation of PFAS contamination at the Base. It is also apparent that the drinking water supply for the Base, while it was still active, was contaminated with PFAS and base personnel and residents were exposed to PFAS as the abandoned well fields were in a portion of the aquifer at the Base that is still impacted with PFAS contamination (Figure 15). The drinking water supply, for the current residents of the former Base, has been replaced with a new water supply from off base. The Agency for Toxic Substances and Disease Registry (ASTDR) and the Michigan Department of Community Health are in the process of developing a Health Consultation in response to the PFAS contamination and the human exposure to those PFAS. The use of firefighting foams at the former Wurtsmith Air Force Base resulted in wide spread PFAS contamination with many source areas of contamination. However, not all PFAS contamination came from the use of firefighting foams. Plume characteristics vary across the base with some plumes being dominated by PFOS and PFOA, but other plumes having virtually no PFOS or PFOA in them. In some plumes the predominant PFAS is PFHxS. Plumes originating in landfills for instance have a very different PFAS mix than do plumes originating at firefighting training areas. Finally, the major pump and treat systems that continue to operate at the Base are capturing some of the PFAS plumes. However, the treatment systems are not designed to treat PFAS contamination in the groundwater and are only redirecting the contamination to surface water or another part of the aquifer. Table 3 shows the influent and effluent concentrations of certain PFASs contaminants for the Mission Drive Pump and Treat System. The PFAS effluent concentrations closely match the influent concentrations as presented in Table 5. 3. Conclusions The use of firefighting foams at the Former Wurtsmith Air Force Base resulted in wide spread PFAS contamination. In some areas the contamination is extremely high. Beyond the PFAS contamination created by firefighting foams, other sources of PFAS contamination also have impacted the ground water, surface water, fish, and tree swallows. Although most scientific and regulatory focus has been on PFOA and PFOS contamination, at least18 different PFAS have been released on the Base and PFOS and PFOA are not always the
APPENDIX A
A-9

highest level contaminants in PFAS plumes at the Base. These other PFAS should not be ignored during site characterization and risk evaluation. PFAS release has resulted in historical and continuing human and ecological exposures to these chemicals. None of the current remedial actions is sufficient to prevent ecological exposure, nor reliably prevent human exposure. In order to better understand the environmental fate of the PFAS, a robust sampling plan and characterization of the marsh sediments should be performed along with the analysis of the distribution of PFASs in the food web. A comprehensive analysis of the fate of PFAS would enable better planning and environmental remediation measures to be applied at the Base. Review of historical documents in order to find purchases of chemical compounds that are known to contain PFAS or precursors should be done in order to better understand the environmental fate of PFAS at a military site. Sampling of additional animals that are known to be eaten, such as deer, should be performed as well, in order to find other possible exposure routes through diet to humans. The widespread nature of the PFAS contamination cannot be easily characterized even though the Base was previously characterized for many other contaminants of concern. PFAS is not limited to the current IRP sites. The discovery of these emerging contaminants will result in the delay of the final closure of the Base under the BRAC program. The risks posed by these contaminants are now beginning to be researched, but interim measures are being taken to reduce the exposure to these chemicals.
APPENDIX A
A-10

4. References Custer, C.M., 2011. Swallows as a sentinel species for contaminant exposure and effect
studies. In: Elliott JE, Bishop CA, Morrissey CA (eds) Wildlife ecotoxicology: forensic approaches. Emerging topics in ecotoxicology, vol 3. Springer, New York, NY.
Custer, C.M., Custer, T.Q., Dummer, P.M., Etterson, M.A., Thogmartin, W.E., Wu, Q.,
Kannan, K., Trowbridge, A., and McKann, P.C., 2014. Exposure and Effects of Perfluoroalkyl Substances in Tree Swallows Nesting in Minnesota and Wisconsin, USA. Archives of Environmental Contamination and Toxicology 66: 120-138.
Loi, E.I.H., Yeung, L.W.Y., Taniyasu, S., Lam, P.K.S., Kannan, K., and Yamashita, N.,
2011. Trophic Magnification of Poly- and Perfluorinated Compounds in Subtropical Food Web. Environmental Science and Technology 45: 5506-5513.
Michigan Department of Community Health (MDCH), 2014. Former Wurtsmith Air
Force Base, Iosco County. http://www.michigan.gov/mdch/0,1607,7-132-2945_5105-285528--,00.html. Accessed on October 21, 2014.
United States Air Force Civil Engineering Center (USAFCEC), 2014. Former Wurtsmith
Air Force Base History. http://www.afcec.af.mil/library/factsheets/factsheet.asp?id=20104. Accessed on October 21, 2014.
United States Environmental Protection Agency (USEPA), 2014.
http://www.epa.gov/region5/superfund/npl/michigan/MI5570024278.html. Accessed on October 21, 2014.
Wikipedia, 2014. Wurtsmith Air Force Base.
http://en.wikipedia.org/wiki/Wurtsmith_Air_Force_Base. Accessed on October 21, 2014.
APPENDIX A
A-11

Figures
APPENDIX A
A-12

V
a
n
E
t
t
e
n
L
a
k
e
Lake Huron
Au Sable River
Foote Dam Pond
Figure 1Former Wurtsmith Air Force Base
APPENDIX A
A-13
PFASs Detected
Figure 3Locations Where PFASs Detected
APPENDIX A
A-14

Figure 4Extent Of Contamination From Wurtsmith
APPENDIX A
A-15

V
A
N
E
T
T
E
N
L
A
K
E
POND 1
POND 2
POND 3
CLARK'S MARSH
POND 1
CLARK'S MARSH
POND 1
CLARK'S MARSH
POND 3
CLARK'S MARSH
POND 1
CLARK'S MARSH
POND 2
CLARK'S MARSH
POND 3
ALLEN LAKE
Van Etten LakePerch 111/1/12PFAS = 14
VAN ETTEN LAKE
CLARK'S MARSH
POND 1
ALLEN LAKE
2011301-07Pumpkinseed @Cage 1 3/1/2011PFAS = 9,159
PumpkinseedU-202 Liver10/31/12PFAS = 14,220Lg Mouth BassU-218 Liver10/31/12PFAS = 15,678
2011302-04Pumpkinseed @Cage 2 3/2/2011PFAS = 9,728
2011303-07Pumpkinseed @Cage 3 3/3/2011PFAS = 3,8932011303-11Golden Shiner @Cage 3 3/3/2011PFAS = 4,985
2011304-11Bluegill @ Cage 43/4/2011PFAS = 1,294Upper (Pond 2)
Perch11/2/12PFAS = 1,814PumpkinseedU-252 Liver11/2/12PFAS = 17,193
Lg Mouth BassU-230 Liver10/31/12PFAS = 5,288
Allen LakeBass - Fillet11/1/2012PFAS = 1.78
151 - 420 ng/L (ppb)
1,001 - 5,000 ng/L (ppb)
5,001 - 25,000 ng/L (ppb)
100,001 - 250,000 ng/L (ppb)
NOTE: TISSUE ANALYTICAL DATA ARE
REPORTED IN ng/g (ppb).
SYMBOL KEY
FISH SAMPLE LOCATION (APPROX.)
TOTAL PFAS IN GROUNDWATER
PLUME LEGEND
A
U
S
A
B
L
E
R
I
V
E
R
ESTIMATED EXTENT OF PFAS
IMPACTED GROUNDWATER
Upper (Pond 1)Perch 311/2/12PFAS = 3,127
2011304-10Pumpkinseed @Cage 4 3/4/2011PFAS = 553
Figure 75 Total PFAS Plumes into Clark's Marsh & Fish Sample Data
APPENDIX A
A-16

V
a
n
E
t
t
e
n
L
a
k
e
Pond 1
Pond 2
Pond 3
Duell
Lake
Allen
Lake
W
W
T
P
L
a
g
o
o
n
s
Infiltration
Beds
A
u
S
a
b
l
e
R
i
v
e
r
Figure 8Total PFAS Contamination of the Au Sable River by 7 Streams
LEGEND
Stream Sample Location and Total PFAS Data (ppt)
APPENDIX A
A-17

Figure 9Example Of Multiple PFAS Plumes In Groundwater
(ng/l - ppt)
APPENDIX A
A-18

A
-
A
'
Pond 1
PFOS IN GW PLUME
1
1
Figure 10FT-02 Groundwater Plume and Cross Section Location
APPENDIX A
A-19

5'
FE
ET
0
E
LE
VA
TIO
N
200'
FEET
0
DISTANCE
Figure 11FT-02 Plume Cross Section A-A'
APPENDIX A
A-20

Co
ncen
tratio
n (n
g/g
o
r ppb
)
Figure 12Former Wurtsmith AFB - Clark's Marsh-Upper Pond - Pumpkinseed - PFOS 2012
APPENDIX A
A-21

Co
ncen
tratio
n (n
g/g
o
r ppb
)
Figure 13Former Wurtsmith AFB - Clark's Marsh-Upper Pond - Pumpkinseed - PFHxS 2012
APPENDIX A
A-22

Co
ncen
tratio
n (n
g/g
o
r ppb
)
Figure 14Former Wurtsmith AFB - Clark's Marsh-Upper Pond - Pumpkinseed - PFOSA 2012
APPENDIX A
A-23

Figure 15Drinking Water Field and PFAS Plume Today
(ng/l - ppt)
APPENDIX A
A-24

Tables
APPENDIX A
A-25

Table 1 State of Michigan Fish Consumption Screening Value (FCSV) Ranges for PFOS
Meal Category FCSV Ranges
Meals per month1 µg/g or mg/kg (ppm)2 ng/g (ppb)3
16 ≤ 0.009 ≤ 9 12 >0.009 to 0.013 >9 to 13 8 >0.013 to 0.019 >13 to 19 4 >0.019 to 0.038 >19 to 38 2 >0.038 to 0.075 >38 to 75 1 >0.075 to 0.15 >75 to 150
6 meals per year >0.15 to 0.3 >150 to 300 Do not eat >0.3 >300
1Units are in months unless otherwise stated. 2 Micrograms of chemical per gram of wet weight fish tissue (µg/g) that is the same as parts per million (ppm). 3 Nanograms of chemicals per grams of wet weight fish tissue (ng/g) that is the same as parts per billion (ppb)
APPENDIX A
A-26

TABLE 2
Geometric mean total PFASs concentrations in eggs and plasma at four locations
PFASs Egg concentrations ng/g ww
PFASs Plasma concentrations ng/g ww
Reference 2011
Pig’s Eye 2011
Wild Rice Lake, MN
Wurtsmith Reference 2011
Pig’s Eye 2011
Wild Rice Lake, MN
Wurtsmith
Geometric Mean
6 418 133 915 27 437 582 1645
Maximum
383 1781 1564 2529
APPENDIX A
A-27

Page 1 of 1
PFAS MAX ppb in Surface Water, Pond 1
MAX ppb in Swallows Eggs
MAX ppb in Swallow Plasma
Max ppb in Fish Fillet Max ppb in Fish Liver
PFBA U<0.596 U<0.500 U<0.488 U<1.30PFPeA 1.84 U<0.500 U<0.488 1.89PFHxA 1.70 U<0.596 U<0.500 U<0.488 U<1.30PFHpA 1.41 U<0.500 U<0.488 U<1.30PFOA 2.20 1.67 U<0.500 2.99 8.52PFNA 2.9 5.99 0.83 12PFDA 1.01 1.73 3.19 14.9PFUnA 3.62 1.72 1.21 3.54PFDoA 1.78 0.76 U<0.488 U<1.30PFBS U<1.19 U<1.00 U<0.488 U<1.30PFHxS 6.40 107 641 69.80 195PFOS 1220 1840 9580 73200PFOSA 10.5 13.0 152.0 358
No significant biomagnification is indicated
Potential biomagnification is indicated (particularly in fish)
0.210
7.400.440
0.0280.003
U<0.002U<0.002
Table 3
0.1600.660
0.260
CONCENTRATION COMPARISONS FROM FISH AND SWALLOW STUDIESClark's Marsh Pond 1 - (2014)
APPENDIX A
A-28

Table 4 Remedial Action Standards
Page 1 of 1
Regulatory Agency PFOS PFOA PFBS PFBA PFNA
Michigan - MDEQ1 0.42 µg/L (420 ng/L)Minnesota (River) - MPCA2 0.006 µg/L (6 ng/L) 0.72 µg/L (720 ng/L)Minnesota (Lake) - MPCA2 0.012 µg/L (12 ng/L) 0.61 µg/L (610 ng/L)
Michigan - MDEQ1 0.012 µg/L (12 ng/L) 12 µg/L (12,000 ng/L)Minnesota (River) - MPCA2 0.006 µg/L (6 ng/L) 2.7 µg/L (2,700 ng/L)Minnesota (Lake) - MPCA2 0.012 µg/L (12 ng/L) 1.6 µg/L (1,600 ng/L)
Minnesota (Acute) - MPCA2 85 µg/L 15,000 µg/L Minnesota (Chronic) - MPCA2 19 µg/L 1,700 µg/L
Minnesota - MDH3 0.3 µg/L (300 ng/L) 0.3 µg/L (300 ng/L) 7 µg/L (7,000 ng/L) 7 µg/L (7,000 ng/L)New Jersey - NJ DEP4 0.04 µg/L (40 ng/L) 0.02 µg/L (20 ng/L)North Carolina - NCSAB5 1 µg/L (1,000 ng/L)
Maine - (MECDC)6 0.1 µg/L (100 ng/L)Ohio7 0.5 µg/L (500 ng/L)West Virginia7 0.5 µg/L (500 ng/L)US EPA8 0.2 µg/L (200 ng/L) 0.4 µg/L (400 ng/L)
Regulatory Agency PFOS PFOA PFBS PFBA PFNA
Minnesota - MPCA9 2,100 µg/Kg 2,100 µg/Kg 77,000 µg/KgUS EPA10 6,000 µg/Kg 16,000 µg/Kg
Minnesota - MPCA9 2,600 µg/Kg 2,500 µg/Kg 94,000 µg/Kg
Minnesota - MPCA9 14,000 µg/Kg 13,000 µg/Kg 500,000 µg/Kg* All units are presented in parts per billion (ppb) for ug/L or ug/Kg or parts per trillion (ppt) for ng/L.
2 Minnesota Pollution Control Agency (MPCA) developed ambient surface water criteria using method published in Minnesota Rules, Chapter 7050.0218 Methods for Protection of Surface Waters from Tocix Pollutants for Which Numerical Standards Not Promulgated.
9 Minnesota Pollution Control Agency (MPCA) soil reference values (SRVs).10 United States Environmental Protection Agency (US EPA) Region 4 calculated residential soil screening levels.
Surface Water / Groundwater
Soil
6 Maine Center for Disease Control and Prevention (MECDC) maximum exposure guideline (MEG).
5 North Carolina Science Advisory Board (NCSAB) on Toxic Air Pollutants recommendations to the North Carolina Division of Water Quality (DWQ) and recommended in August 2012 to update the Interim Maximum Allowable Concentration (IMAC) for PFOA in groundwater from 2 µg/L to 1µg/L. The new recommended value of 1 µg/L is still pending review by the NC DWQ. The PFOA IMAC was first established in 2006 to 2 µg/L.
7 West Virginia and Ohio people that lived next to DuPont Washington Works facility were protected under legal agreement from PFOA contamination in their drinking water. The agreement known as "consent order" was made been US EPA and DuPont, which established an "action level" of 0.5 ppb. 8 United States Environmental Protection Agency (US EPA) Office of Water established a provisional health advisory (PHA) for short-term exposure through drinking water.
Soil - Residential
Soil - Recreational
Soil - Industrial
1 Michigan Department of Environmental (MDEQ) Quality Rule 57 Water Quality Values for Human non-cancer value (HNV). PFOS criterion is promulgated but has been not yet published in the Rule 57 Table.
3 Minnesota Department of Health (MDH) chronic Health Risk Level (HRL) for groundwater used as drinking water.4 New Jersey Department of Environmental Protection (NJ DEP) chronic exposure. PFNA value is a draft interim specific groundwater criterion.
Surface Water - Drinking
Surface Water - Non-Drinking
Groundwater - Drinking
Drinking Water
Surface Water - Ecological Exposure
APPENDIX A
A-29

Table 5 Influent and Stream Outfall Data
Samples Mission Drive Pump and
Treat Outfall Stream
(Consumers Property)
Date Collected 2/4/2013 5/22/2012
Unit PFHxA ng/L 310 320 PFOA ng/L 96 80 PFBS ng/L 550 510 PFHxS ng/L 1,800 1,100 PFOS ng/L 1.4 3
APPENDIX A
A-30

Attachments
APPENDIX A
A-31

Attachment 1 PFAS Supplemental Data
Any organic or inorganic substance that contains at least one fluorine atom is referred to as “fluorinated substances” as a general term. However, their chemical, physical, and biological properties could differ significantly (Buck et al., 2011). A subset of fluorinated substances are the highly fluorinated aliphatic substances that contain one or more carbon atoms on which the fluorine atoms have replaced the hydrogen atoms that would normally be found in non-fluorinated substances. These subset substances contain the perfluoroalkyl moiety with the form of 𝐶𝑛𝐹2𝑛+1− and are referred to as perfluoroalkyl or polyfluoroalkyl substances having the acronym PFASs (Buck et al., 2011). PFASs compromise a large group of chemicals that are both chemically and thermally stable and are both lipophobic (have no affinity for oils) and hydrophobic (have no affinity for water), making them very useful in surfactants and as polymers. However, PFASs are composed of two main parts; one that is formed out of a hydrophobic alkyl chain and a hydrophilic (strong affinity to water) functional group. A total of 146 perfluorochemicals and 469 fluorochemicals were identified as potentially able to degrade to PFCAs (OECD, 2007). The most investigated classes of PFASs are the perfluorocarboxylate acids (PFCAs) and perfluoroalkyl sulfonic acids (PFSAs). In addition, the most studied PFCA compound is perfluorooctanoic acid (PFOA) and PFSA is perfluorooctane sulfonate (PFOS). Aqueous Film Forming Foams (AFFF) were developed in the 1966 and became an important tool for extinguishing fires involving flammable liquids/fuels (Scheffey and Hanauska, 2002). The AFFF sold to the US military had to conform to military-specific performance and quality control that were prescribed by Military Specification (Mil-Spec) MIL-F-24385, while the commercial AFFF had to comply with other performance standards. Since the initial development of AFFF in 1966, seven different manufacturers were able to develop AFFF that met military specifications and were purchased in large quantities. The seven manufactures are 3M, Ansul, National Foam, Angus, Chemguard, Buckeye, and Fire Services Plus (FSP). They all produced AFFF that contained fluorochemicals since 1976, 1976, 1976, 1994, 1997, 2004, and 2011, respectively. Depending on the year of production and manufacturer, the composition of AFFF was different and resulted in different classes and individual PFASs released at sites. The major source of PFAS contamination at military bases came from the use of AFFF agents, which are a mixture of fluorocarbon- and hydrocarbon-based surfactants (Schultz et al, 2004). The presence of large quantities of flammable liquids, such as gasoline and kerosene at oil refineries, chemical manufacturers, and military bases required the use of AFFFs. Fire departments that responded to fires at facilities with fuels and other flammable liquids also used AFFF. The military compromised 75 % of the total market (Moody and Field, 2000). Historical fire-training exercises at military bases had been performed weekly to monthly (Backe et al., 2013). Most of the PFASs are extremely resistant to degradation (Rahman et al., 2014), because the carbon and fluorine (C-F) bond is the shortest and strongest bond of organic compounds and microorganisms typically cannot gain energy from breaking the bond. Because of the use of PFASs in many industries and the difficulty of natural processes to degrade the compounds, environmental contamination is a worldwide problem. PFASs have been found to be able to bioaccumulate (become concentrated inside the body) and biomagnify (the concentration
APPENDIX A
A-32

increases at each trophic level though the food web) in the artic, temperate, and subtropical systems (Tomy et al., 2004, Loi et al., 2011). Because of the persistence of these chemicals in the environment and multiple studies that showed adverse health effects at very low concentration in both the environment and humans, many manufacturing companies voluntarily removed their AFFF products from the market in the early 2000s. The US EPA entered into an agreement with other fluorochemical and AFFF manufacturers to comply with a PFOA/PFOS Stewardship program and cease production of all fluorinated compounds with an eight carbon chain (C8) base before 2015. However, this measure would only prevent the problems from spreading but would not address historical discharges, particularly for PFOS that has a reported environmental half-life between 4 and 41 years. Therefore, sites currently contaminated with PFAS will remain contaminated well into the future. Based on this information, staff from the Michigan Department of Environmental Quality (MDEQ) took initial samples in 2010, as mentioned above, from a known fire training area (FT02) at Wurtsmith AFB and found very high concentrations more than 20 years after the closure of the base (1993). On June 1, 2012 USEPA updated the list of unregulated contaminants (UCMR3) that have to be reported to USEPA by Public Water Systems (PWSs) that serve 10,000 or more people, which included six PFASs. During an evaluation performed by Center for Disease Control (CDC) in 2003-2004 on humans, they screened for 12 PFASs and found 4 PFASs -- PFOS, PFOA, perfluorohexanesulfonate (PFHxS), and perfluorononoic acid (PFNA) -- to be present in nearly all people. The National Institute of Environmental Health Sciences (NIHS) performed short term studies as preliminary work for seven PFASs. As a result, the analysis for PFASs should not be concerned only with PFOA and PFOS, currently the most common practice. The cost of analyzing these compounds had decreased over time and the cost difference of analyzing only for PFOA/PFOS as opposed to a wider range of PFASs has decreased significantly. The most common method used for the analysis of PFASs is the USEPA 537 Method or modification of it, depending on the lab. This method is able to analyze for 14 different PFASs. There are laboratories that routinely analyze for 19 PFAS compounds using their own methods to analyze for the additional 5 PFASs (beyond the 14 compounds using USEPA 537 Method). As mentioned in the main text, seven water samples have been analyzed with a more refined method for 47 different PFASs (See Attachment 2). In all, a total of different 20 PFASs have been identified in various contaminated media at the WAFB.
APPENDIX A
A-33

References Backe, W.J., Day, T.C., and Field, J.A., 2013. Zwitterionic, Cationic, and Anionic Fluorinated
Chemicals in Aqueous Film Forming Foam Formulations and Groundwater from U.S. Military Bases by Nonaqueous Large-Volume Injection HPLC-MS/MS. Environmental Science and Technology 47: 5226-5234.
Buck, R. C., Franklin, J., Berger, U., Conder, J.M., Cousins, I.T., de Voogt, P., Jensen, A.A.,
Kannan, K., Mabury, S.A., and van Leeuwen, S. P., 2011. Perfluoroalkyl and Polyfluoroalkyl Substances in the Environment: Terminology, Classification, and Origins. Integrated Environmental Assessment and Management 7:513-541.
Loi, E.I.H., Yeung, L.W.Y., Taniyasu, S., Lam, P.K.S., Kannan, K., and Yamashita, N., 2011. Trophic Magnification of Poly- and Perfluorinated Compounds in Subtropical Food Web. Environmental Science and Technology 45: 5506-5513.
Moody, C.A. and Field, J., 2000. Perfluorinated Surfactants and the Environmental Implications
of Their Use in Fire-Fighting Foams. Environmental Science and Technology 34: 3864-3870. Organization for Economic Co-operation and Development (OECD), 2007. Lists of PFOS,
PFAS, PFOA, PFCA, Related Compounds and Chemicals that may degrade to PFCA. Rahman, M.F., Peldszus, S., and Anderson, W.B., 2014. Behavior and fate of perfluoroalkyl and
polyfluoroalkyl substances (PFASs) in drinking water treatment: A review. Water Research 50: 318-340.
Scheffey, F.L. and Hanauska, C.P., 2002. Status Report on environmental Concerns related to
Aqueous Film Forming Foam (AFFF). Presented for the 2002 Federal Aviation Administration Technology Transfer Conference.
Schultz, M.M., Barofsky, D.F., and Field, J.A., 2004. Quatitative Determination of
Fluorotelomer Sulfonates in Groundwater by LC MS/MS. Environmental Science and Technology 34: 1828-1835.
Tomy, G.T., Budakowski, W., Halldorson, T., Helm, P.A., Stern, G.A., Friesen, K., Pepper, K.,
Tittlemier, S. A., and Fisk, A.T., 2004. Fluorinated Organic Compounds in Eastern Artic Marine Food Web. Environmental Science and Technology 38: 6475-6481.
APPENDIX A
A-34

Attachment 2 47 PFAS Analysis Site Name: Wurtsmith Analyst: Monica Best Date Analyzed: 04/15/14 Method Overview: The method is based on a micro liquid-liquid extraction of groundwater into an
organic phase followed by direct analysis via large-volume injection HPLC-MS/MS.1 Ten classes2 and a
total of 47 individual per and polyfluoroalkyl substances (PFAS) are determined by this method.
Definition of Terms
<LOD Signal-to-noise ratio less than 3
<LOQ Computed concentration fell below the Limit of Quantification (LOQ), which corresponds to the lowest calibration curve point
* Semi-quantitative; analytes have an authentic standard but no matched internal standard1
** Qualitative; analytes have neither an authentic standard nor a matched internal standard1
N/A No authentic standard available1
Solvent Overspike Solvent mixture spiked with standard, run between samples to check instrument performance (replicate of calibration standard)
Extraction Blank DI water taken through the extraction process
Solvent Blank Contains the solvent matrix and mass-labeled standards
% RSD Percent relative standard deviation; n = 3 replicate aliquots of FF02 FT2 (diluted 100 fold) used to determine within-run precision.
Analyte List Perfluoroalkyl Carboxylates -11 Perfluoro-n-butanoic acid (PFBA) Perfluoro-n-pentanoic acid (PFPeA) Perfluoro-n-hexanoic acid (PFHxA) Perfluoro-n-heptanoic acid (PFHpA) Perfluoro-n-octanoic acid (PFOA) Perfluoro-n-nonanoic acid (PFNA) Perfluoro-n-decanoic acid (PFDA)
Perfluoro n- undecanoic (PFUdA) Perfluoro n-dodecanoic (PFDoA) Perfluoro n-tridecanoic (PFTrDA) Perfluoro n-tetradecanoid (PFTeDA)
Perfluoroalkyl Sulfonates-7 Perfluoro-1-butanesulfonate (PFBS) Perfluoro-1-pentanesulfonate (PFPeS)** Perfluoro-1-hexanesulfonate (PFHxS) Perfluoro-1-heptanesulfonate (PFHpS) Perfluoro-1-octanesulfonate (PFOS) Perfluoro-1-nonanesulfonate (PFNS)** Perfluoro-1-decanesulfonate (PFDS)
APPENDIX A
A-35

Fluorotelomer Sulfonates-3 1H,1H,2H,2H-perfluoro-1-hexanesulfonate (4-2 FtS)
1H,1H,2H,2H-perfluoro-1-octanesulfonate (6-2 FtS) 1H,1H,2H,2H-perfluoro-1-decanesulfonate (8-2 FtS) Perfluoroalkyl Sulfonamido Amines-5
N-(3-(dimethylamino)propyl)-perfluorobutane-1-sulfonamide (PFBSaAm)** N-(3-(dimethylamino)propyl)-perfluoropentane-1-sulfonamide (PFPeSaAm)**
N-(3-(dimethylamino)propyl)-perfluorohexane-1-sulfonamide (PFHxSaAm)** N-(3-(dimethylamino)propyl)-perfluoroheptane-1-sulfonamide (PFHpSaAm)** N-(3-(dimethylamino)propyl)-perfluorooctane-1-sulfonamide (PFOSaAm)**
Perfluoroalkyl Sulfonamide Amino Carboxylates-5 3-(N-(3-(dimethylamino)propyl)-perfluorobutylsulfonamido)propanoic acid (PFBSaAmA)** 3-(N-(3-(dimethylamino)propyl)-perfluoropentylsulfonamido)propanoic acid (PFPeSaAmA)** 3-(N-(3-(dimethylamino)propyl)-perfluorohexylsulfonamido)propanoic acid (PFHxSaAmA)** 3-(N-(3-(dimethylamino)propyl)-perfluorohepylsulfonamido)propanoic acid (PFHpSaAmA)** 3-(N-(3-(dimethylamino)propyl)-perfluorooctylsulfonamido)propanoic acid (PFOSaAmA)**
Fluorotelomer Thioether Amido Sulfonates-3 2-methyl-2-(3-((1H,1H,2H,2H-perfluoro-1-hexyl)thio)propanamido)propane-1-sulfonate (4-2
FtAoS)** 2-methyl-2-(3-((1H,1H,2H,2H-perfluoro-1-octyl)thio)propanamido)propane-1-sulfonate (6-2 FtAoS)* 2-methyl-2-(3-((1H,1H,2H,2H-perfluoro-1-decyl)thio)propanamido)propane-1-sulfonate (8-2 FtAoS)**
Fluorotelomer Thio Hydroxy Ammonium-1 2-hydroxy-N,N,N-trimethyl-3-((1H,1H,2H,2H-perfluoro-1-octyl)thio)propan-1-aminium (6-2 FtTHN+)*
Fluorotelomer Sulfonamide Amine-2 N-[3-(dimethylamino) propyl]-1H,1H,2H,2H-perfluoro-1-octanesulfonamide (6-2 FtSaAm)* N-[3-(dimethylamino) propyl]-1H,1H,2H,2H-perfluoro-1-decanesulfonamide (8-2 FtSaAm)**
Fluorotelomer Sulfonamido Betaines-4 N-(carboxymethyl)-N,N-dimethyl-3-(1H,1H,2H,2H-perfluoro-1-octanesulfonamido)propan-1-aminium (6-2 FtSaB)* N-(carboxymethyl)-N,N-dimethyl-3-(1H,1H,2H,2H-perfluoro-1-decanesulfonamido)propan-1-aminium (8-2 FtSaB)** N-(carboxymethyl)-N,N-dimethyl-3-(1H,1H,2H,2H-perfluoro-1-dodecanesulfonamido)propan-1-aminium (10-2 FtSaB)** N-(carboxymethyl)-N,N-dimethyl-3-(1H,1H,2H,2H-perfluoro-1-tetradecanesulfonamido)propan-1-aminium (12-2 FtSaB)**
Fluorotelomer Betaines-6 N-(carboxymethyl)-1H,1H,2H,2H,3H -N,N-dimethylperfluorooctan-1-aminium (5-1-2 FtB)* N-(carboxymethyl)-1H,1H,2H,2H,3H -N,N-dimethylperfluorodecan-1-aminium (7-1-2FtB)* N-(carboxymethyl)-1H,1H,2H,2H,3H -N,N-dimethylperfluorododecan-1-aminium (9-1-2 FtB)*
N-(carboxymethyl)-1H,1H,2H,2H,3H,3H -N,N-dimethylperfluorooctan-1-aminium (5-3 FtB)* N-(carboxymethyl)-1H,1H,2H,2H,3H,3H -N,N-dimethylperfluorodecan-1-aminium (7-3 FtB)* N-(carboxymethyl)-1H,1H,2H,2H,3H,3H -N,N-dimethylperfluorododecan-1-aminium (9-3FtB)*
APPENDIX A
A-36

REFERENCES 1. Backe, W.; Field, J. A., Zwitterionic, Cationic, and Anionic Fluorinated Chemicals in Aqueous Film Forming Foam Formulations and Groundwater at Us Militarty Bases by Non-Aqueous Large Volume Injection HPLC-MS/MS. Environ. Sci. Technol. 2013, 47, 5226-5234. 2. Place, B. J.; Field, J. A., Identification of Novel Fluorochemicals in Aqueous Film-Forming Foams Used by the Us Military. Environmental Science & technology 2012, 46, 7120-7127.
APPENDIX A
A-37

C4 C5 C6 C7 C8 C9 C10 C11 C12 C13 C14
PFBA PFPeA PFHxA PFHpA PFOA PFNA PFDA PFUdA PFDoA PFTrDA PFTeDA
(ng/L) (ng/L) (ng/L) (ng/L) (ng/L) (ng/L) (ng/L) (ng/L) (ng/L) (ng/L) (ng/L)
Samples
LF30 MW-1 <LOD <LOD <LOD <LOD <LOD <LOD <LOD <LOD <LOD <LOD <LOD
LF30/31 R16S <LOD <LOD <LOD <LOD <LOQ <LOD <LOD <LOD <LOD <LOD <LOD
SS-06 H190 <LOD <LOD <LOD <LOD <LOD <LOD <LOD <LOD <LOD <LOD <LOD
SS-08 H172 26 52 200 30 190 <LOD <LOD <LOD <LOD <LOD <LOD
SS71 MW-4 100 340 230 140 350 8.8 <LOD <LOD <LOD <LOD <LOD
OT 24 OUTFALL 45 69 270 47 120 <LOD <LOD <LOD <LOD <LOD <LOD
FF02 FT2 6400 24000 85000 10000 220000 580 29 1.0 <LOD <LOD <LOD
%RSD 3.0 5.0 6.0 6.0 5.0 31 N/A N/A N/A N/A N/A
QC Acceptance
Limit
n = 2 Solvent Overspike 100 ng/L 70 - 130 ng/L 94 97 97 98 97 93 88 88 83 80 84
n = 2 Solvent Overspike 500 ng/L 350 - 650 ng/L 510 490 500 530 490 500 530 480 550 530 470
n = 1 Extraction Blank <LOD <LOD <LOD <LOD <LOD <LOD <LOD <LOD <LOD <LOD <LOD <LOD
n = 2 Solvent Blank <LOD <LOD <LOD <LOD <LOD 58*** <LOD <LOD <LOD <LOD <LOD <LOD
8 points Linearity (R2) R
2 > 0.97 0.99 0.99 0.99 0.99 0.99 0.99 0.98 0.98 0.99 0.99 0.99
Method Limits
Limit of Detection (LOD) (ng/L)
4.1 1.1 1.4 1.8 1.5 1.0 0.94 0.93 1.0 1.2 1.7
Limit of Quantitation (LOQ) (ng/L)
10 10 10 10 10 10 10 10 10 10 10
*** Did Not Pass
Bolded values are from the analysis of the diluted sample.
APPENDIX A
A-38

C4 C5 C6 C7 C8 C9 C10
PFBS PFPeS** PFHxS PFHpS PFOS PFNS** PFDS
(ng/L) (ng/L) (ng/L) (ng/L) (ng/L) (ng/L) (ng/L)
Samples
LF30 MW-1
<LOD <LOD <LOQ <LOD <LOD <LOD <LOD
LF30/31 R16S
<LOD <LOD <LOQ <LOD <LOQ <LOD <LOD
SS-06 H190
<LOQ <LOD <LOQ <LOD <LOD <LOD <LOD
SS-08 H172
36 68 2100 210 >3000 11 <LOD
SS71 MW-4
20 33 1100 130 1300 <LOD <LOD
OT 24 OUTFALL
210 260 1800 99 140 <LOD <LOD
FF02 FT2
4100 8000 260000 5900 69000 99 <LOD
%RSD
13 15 11 8.0 12 N/A N/A
QC Acceptance Limit
n = 2 Solvent Overspike 100 ng/L 70 - 130 ng/L 84 N/A 110 87 83 N/A 68***
n = 2 Solvent Overspike 500 ng/L 350 - 650 ng/L 460 N/A 480 470 490 N/A 370
n = 1 Extraction Blank <LOD <LOD <LOD <LOD <LOD <LOD <LOD <LOD
n = 2 Solvent Blank <LOD <LOD <LOD 67*** <LOD 12*** <LOD <LOD
8 points Linearity (R2) R2 > 0.97 0.99 0.99 0.99 0.99 0.99 0.99 0.97
Method Limits
Limit of Detection (LOD) (ng/L)
1.2 N/A 1.7 0.88 0.81 N/A 0.71
Limit of Quantitation (LOQ) (ng/L)
10 N/A 10 10 10 N/A 10
*** Did Not Pass
Bolded values are from the analysis of the diluted sample.
>3000 indicates that analyte concentration exceeded the calibration curve when run undiluted. The sample was not run
diluted, thus the concentration could not be determined.
For PFHxS and PFOS, the signals reported in solvent blanks are due to trace levels present in purchased internal
standards and are not due to the sampling or analysis process.
APPENDIX A
A-39

4:2 FtS 6:2 FtS 8:2 FtS
(ng/L) (ng/L) (ng/L)
Samples
LF30 MW-1
<LOD <LOD <LOD
LF30/31 R16S
<LOD <LOD <LOD
SS-06 H190
<LOD <LOD <LOD
SS-08 H172
<LOD 79 <LOD
SS71 MW-4
<LOD <LOD <LOD
OT 24 OUTFALL
<LOD <LOD <LOD
FF02 FT2
66 46000 990
%RSD
N/A 8.0 20
QC Acceptance Limit
n = 2 Solvent Overspike 100 ng/L 70 - 130 ng/L 88 78 120
n = 2 Solvent Overspike 500 ng/L 350 - 650 ng/L 540 580 640
n = 1 Extraction Blank <LOD <LOD <LOD <LOD
n = 2 Solvent Blank <LOD <LOD <LOD <LOD
8 points Linearity (R2) R2 > 0.97 0.99 0.97 0.99
Method Limits
Limit of Detection (LOD) (ng/L)
1.6 0.84 1.9
Limit of Quantitation (LOQ) (ng/L)
10 10 10
Bolded values are from the analysis of the diluted sample.
APPENDIX A
A-40

C4 C5 C6 C7 C8
PFBSaAm** PFPeSaAm** PFHxSaAm** PFHpSaAm** PFOSaAm**
(ng/L) (ng/L) (ng/L) (ng/L) (ng/L)
Samples
LF30 MW-1
<LOD <LOD <LOD <LOD <LOD
LF30/31 R16S
<LOD <LOD <LOD <LOD <LOD
SS-06 H190
<LOD <LOD <LOD <LOD <LOD
SS-08 H172
<LOD <LOD <LOD <LOD <LOD
SS71 MW-4
<LOD <LOD <LOD <LOD <LOD
OT 24 OUTFALL
<LOD <LOD <LOD <LOD <LOD
FF02 FT2
<LOD <LOD <LOD <LOD <LOD
%RSD
N/A N/A N/A N/A N/A
QC Acceptance Limit
n = 2 Solvent Overspike 100 ng/L 70 - 130 ng/L N/A N/A N/A N/A N/A
n = 2 Solvent Overspike 500 ng/L 350-650 ng/L N/A N/A N/A N/A N/A
n = 1 Extraction Blank <LOD <LOD <LOD <LOD <LOD <LOD
n = 2 Solvent Blank <LOD <LOD <LOD <LOD <LOD <LOD
Linearity (R2) R2 > 0.97 N/A, calculated using PFOS calibration
Method Limits
Limit of Detection (LOD) (ng/L)
N/A N/A N/A N/A N/A
Limit of Quantitation (LOQ) (ng/L)
N/A N/A N/A N/A N/A
APPENDIX A
A-41

C4 C5 C6 C7 C8
PFBSaAmA** PFPeSaAmA** PFHxSaAmA** PFHpSaAmA** PFOSaAmA**
(ng/L) (ng/L) (ng/L) (ng/L) (ng/L)
Samples
LF30 MW-1
<LOD <LOD <LOD <LOD <LOD
LF30/31 R16S
<LOD <LOD <LOD <LOD <LOD
SS-06 H190
<LOD <LOD <LOD <LOD <LOD
SS-08 H172
<LOD <LOD <LOD <LOD <LOD
SS71 MW-4
<LOD <LOD <LOD <LOD <LOD
OT 24 OUTFALL
<LOD <LOD <LOD <LOD <LOD
FF02 FT2
<LOD <LOD <LOD <LOD <LOD
%RSD
N/A N/A N/A N/A N/A
QC Acceptance Limit
n = 2 Solvent Overspike 100 ng/L
70 - 130 ng/L
N/A N/A N/A N/A N/A
n = 2 Solvent Overspike 500 ng/L 350 - 650
ng/L N/A N/A N/A N/A N/A
n = 1 Extraction Blank <LOD <LOD <LOD <LOD <LOD <LOD
n = 2 Solvent Blank <LOD <LOD <LOD <LOD <LOD <LOD
Linearity (R2) R2 > 0.97 N/A, calculated using PFOS calibration
Method Limits
Limit of Detection (LOD) (ng/L)
N/A N/A N/A N/A N/A
Limit of Quantitation (LOQ) (ng/L)
N/A N/A N/A N/A N/A
APPENDIX A
A-42

4-2 FtTAoS** 6-2 FtTAoS* 8-2 FtTAoS**
(ng/L) (ng/L) (ng/L)
Samples
LF30 MW-1
<LOD <LOD <LOD
LF30/31 R16S
<LOD <LOD <LOD
SS-06 H190
<LOD <LOD <LOD
SS-08 H172
<LOD <LOD <LOD
SS71 MW-4
<LOD <LOD <LOD
OT 24 OUTFALL
<LOD <LOD <LOD
FF02 FT2
<LOD 6200 23000
%RSD
N/A N/A N/A
QC Acceptance Limit
n = 2 Solvent Overspike 100 ng/L 70 - 130 ng/L N/A 13*** N/A
n = 2 Solvent Overspike 500 ng/L 350 - 650 ng/L N/A 550 N/A
n = 1 Extraction Blank <LOD <LOD <LOD <LOD
n = 2 Solvent Blank <LOD <LOD <LOD <LOD
8 points Linearity (R2) R2 > 0.97
N/A, calculated using 6-2 FtTAoS
calibration
0.99
N/A, calculated using 6-2 FtTAoS
calibration
Method Limits
Limit of Detection (LOD) (ng/L)
N/A N/A N/A
Limit of Quantitation (LOQ) (ng/L)
N/A 10 N/A
*** Did Not Pass
APPENDIX A
A-43

6-2 FtTHN+*
(ng/L)
Samples
LF30 MW-1
<LOD
LF30/31 R16S
<LOD
SS-06 H190
<LOD
SS-08 H172
<LOD
SS71 MW-4
<LOD
OT 24 OUTFALL
<LOD
FF02 FT2
<LOD
%RSD
N/A
QC Acceptance Limit
n = 2 Solvent Overspike 150 ng/L 105 - 195 ng/L 17***
n = 2 Solvent Overspike 750 ng/L 525 - 975 ng/L 740
n = 1 Extraction Blank <LOD <LOD
n = 2 Solvent Blank <LOD <LOD
6 points Linearity (R2) R2 > 0.97 0.99
Method Limits
Limit of Detection (LOD) (ng/L)
N/A
Limit of Quantitation (LOQ) (ng/L)
15
*** Did Not Pass
APPENDIX A
A-44

*** Did Not Pass
6-2 FtSaAm* 8-2 FtSaAm**
(ng/L) (ng/L)
Samples
LF30 MW-1
<LOD <LOD
LF30/31 R16S
<LOD <LOD
SS-06 H190
<LOD <LOD
SS-08 H172
<LOD <LOD
SS71 MW-4
<LOD <LOD
OT 24 OUTFALL
<LOD <LOD
FF02 FT2
<LOD <LOD
%RSD
N/A N/A
QC Acceptance Limit n = 2 Solvent Overspike 810 ng/L 570 - 1100 ng/L 290*** N/A
n = 2 Solvent Overspike 4100 ng/L 2900 - 5300 ng/L 3200 N/A
n = 1 Extraction Blank <LOD <LOD <LOD
n = 2 Solvent Blank <LOD <LOD <LOD
6 points Linearity (R2) R2 > 0.97 0.98
N/A, calculated using 6-2 FtSaAm calibration
Method Limits
Limit of Detection (LOD) (ng/L)
N/A N/A
Limit of Quantitation (LOQ) (ng/L)
81 N/A
APPENDIX A
A-45

6-2 FtSaB* 8-2 FtSaB** 10-2 FtSaB** 12-2 FtSaB**
(ng/L) (ng/L) (ng/L) (ng/L)
Samples
LF30 MW-1
<LOD <LOD <LOD <LOD
LF30/31 R16S
<LOD <LOD <LOD <LOD
SS-06 H190
<LOD <LOD <LOD <LOD
SS-08 H172
<LOD <LOD <LOD <LOD
SS71 MW-4
<LOD <LOD <LOD <LOD
OT 24 OUTFALL
<LOD <LOD <LOD <LOD
FF02 FT2
<LOD <LOD <LOD <LOD
%RSD
QC Acceptance Limit n = 2 Solvent Overspike 1000 ng/L 700 - 1300 ng/L 280*** N/A N/A N/A
n = 2 Solvent Overspike 5000 ng/L 3500 - 6500 ng/L 5000 N/A N/A N/A
n = 1 Extraction Blank <LOD <LOD <LOD <LOD <LOD
n = 2 Solvent Blank <LOD <LOD <LOD <LOD <LOD
7 points Linearity (R2) R2 > 0.97 0.98
N/A, calculated using 6-2 FtSaB calibration
Method Limits
Limit of Detection (LOD) (ng/L)
N/A N/A N/A N/A
Limit of Quantitation (LOQ) (ng/L)
100 N/A N/A N/A
*** Did Not Pass
APPENDIX A
A-46

5-1-2 FtB* 7-1-2 FtB* 9-1-2 FtB* 5-3 FtB* 7-3 FtB* 9-3 FtB*
(ng/L) (ng/L) (ng/L) (ng/L) (ng/L) (ng/L)
Samples
LF30 MW-1
<LOD <LOD <LOD <LOD <LOD <LOD
LF30/31 R16S
<LOD <LOD <LOD <LOD <LOD <LOD
SS-06 H190
<LOD <LOD <LOD <LOD <LOD <LOD
SS-08 H172
<LOD <LOD <LOD <LOD <LOD <LOD
SS71 MW-4
<LOD <LOD <LOD <LOD <LOD <LOD
OT 24 OUTFALL
<LOD <LOD <LOD <LOD <LOD <LOD
FF02 FT2
<LOD <LOD <LOD 530 <LOD <LOD
%RSD
N/A N/A N/A N/A N/A N/A
QC Acceptance Limit
n = 2 Solvent Overspike 1 See Accepted Range
<LOQ*** <LOQ*** 30*** <LOQ*** 59*** 32
n = 2 Solvent Overspike 2 335*** 1435 515 187 697*** 209***
n = 1 Extraction Blank <LOD <LOD <LOD <LOD <LOD <LOD <LOD
n = 1 Solvent Blank <LOD <LOD <LOD <LOD <LOD <LOD <LOD
6 points Linearity (R2) R2 > 0.97 0.99 0.99 0.99 0.99 0.99 0.98
Method Limits
Limit of Detection (LOD) (ng/L)
N/A N/A N/A N/A N/A N/A
Limit of Quantitation (LOQ) (ng/L)
19 40 11 4.8 10 2.7
Accepted Range
Solvent Overspike 1 (ng/L) 70-130% 130-250 280-520 75-140 33-63 70-130 19-32
Solvent Overspike 2 (ng/L) 70-130% 670-1300 1400-2600 370-700 170-310 350-650 94-170
*** Did Not Pass
APPENDIX A
A-47

APPENDIX A
A-48