pfge: tips and tricks to success and interpretation … tips and tricks to success and...
TRANSCRIPT
PFGE: Tips and Tricks to Success and Interpretation of Results for
Foodborne Outbreak Investigations
BioNumerics Workshop for PulseNet Participants
April 15th, 2011
PFGE Reference Unit, PulseNet USA
Enteric Diseases Laboratory Branch, CDC
April 15 , 2011
National Center for Emerging and Zoonotic Infectious Diseases
Division of Foodborne, Waterborne, and Environmental Diseases
Molly Freeman, PhD
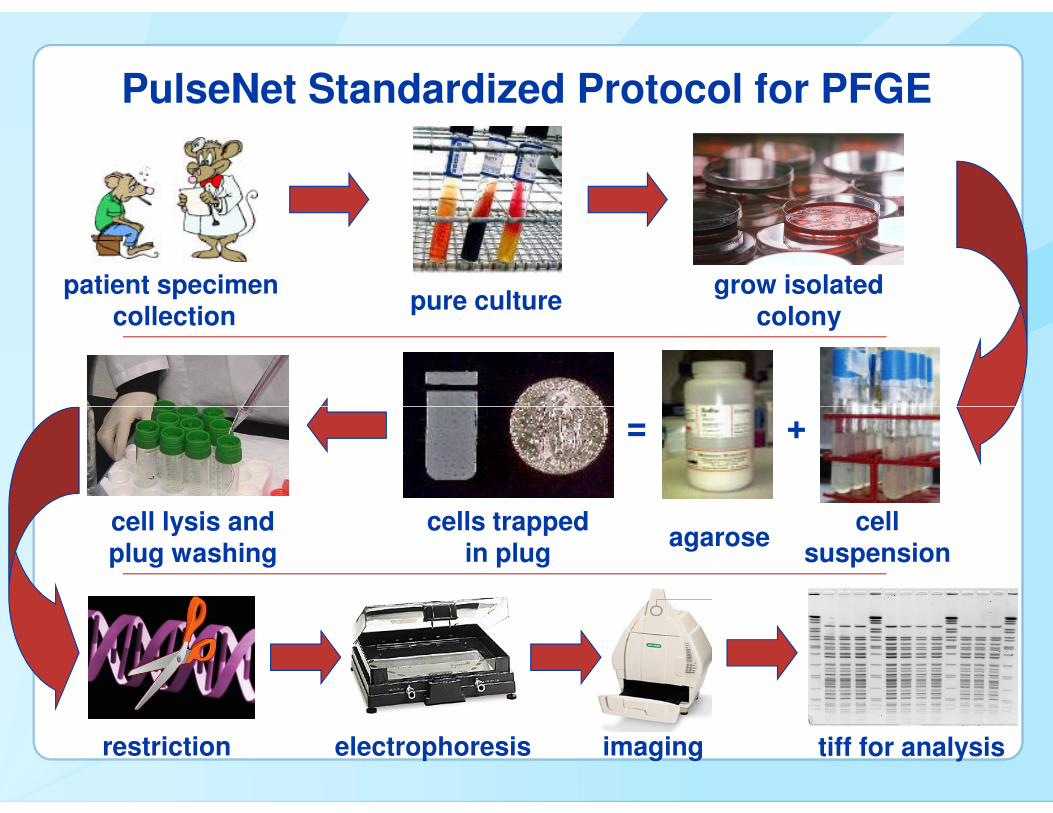
PulseNet Standardized Protocol for PFGE
pure culturepatient specimen
collection
+=
grow isolatedcolony
+
cellsuspension
agarose
=
cells trappedin plug
cell lysis and plug washing
tiff for analysisrestriction electrophoresis imaging
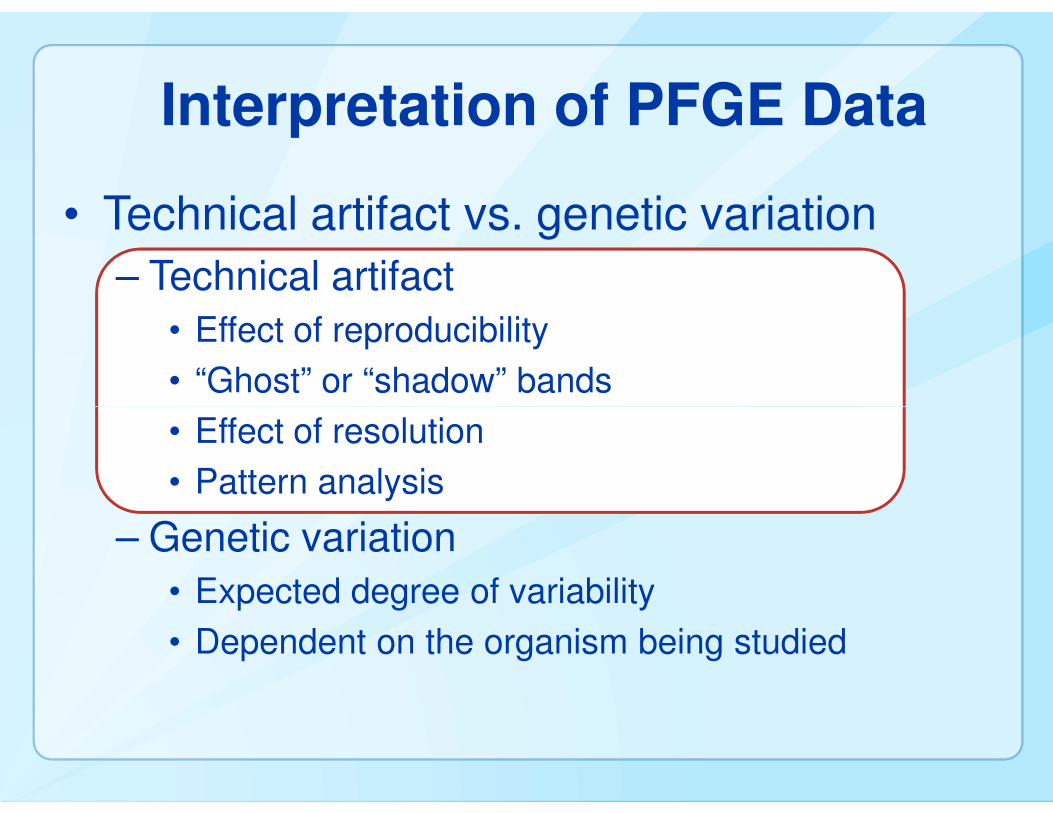
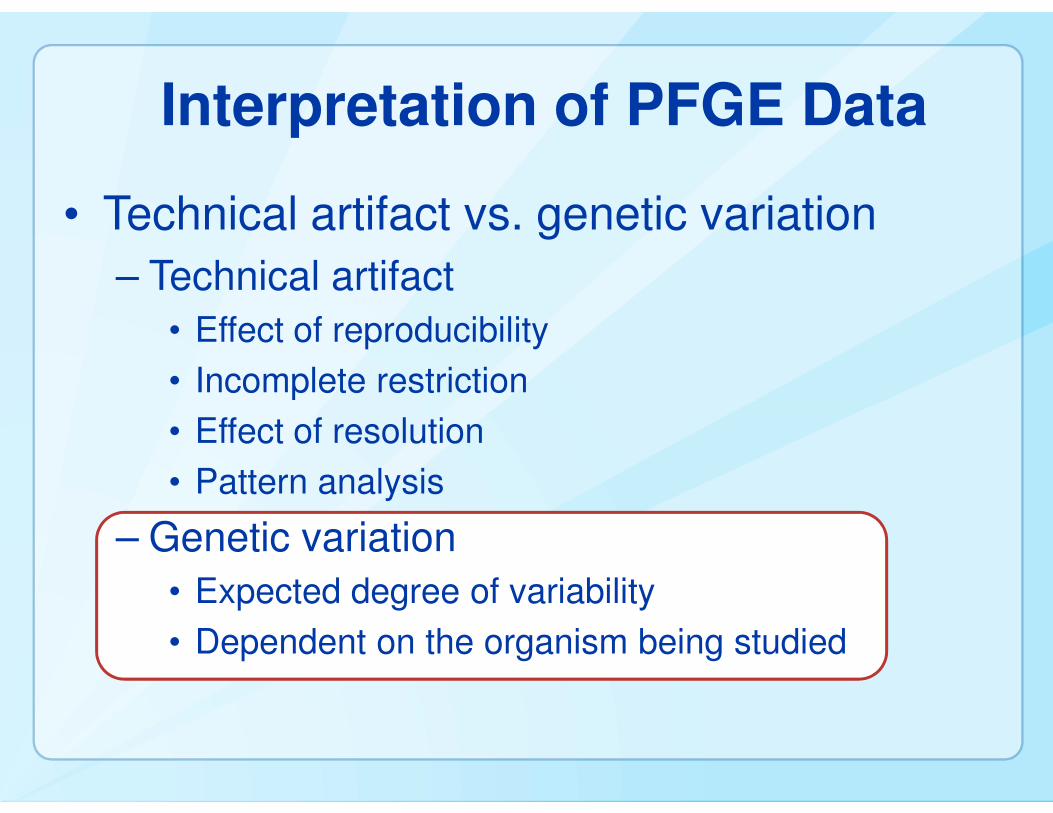
Interpretation of PFGE Data
• Technical artifact vs. genetic variation
– Technical artifact
• Effect of reproducibility
• “Ghost” or “shadow” bands
• Effect of resolution
• Pattern analysis
– Genetic variation
• Expected degree of variability
• Dependent on the organism being studied
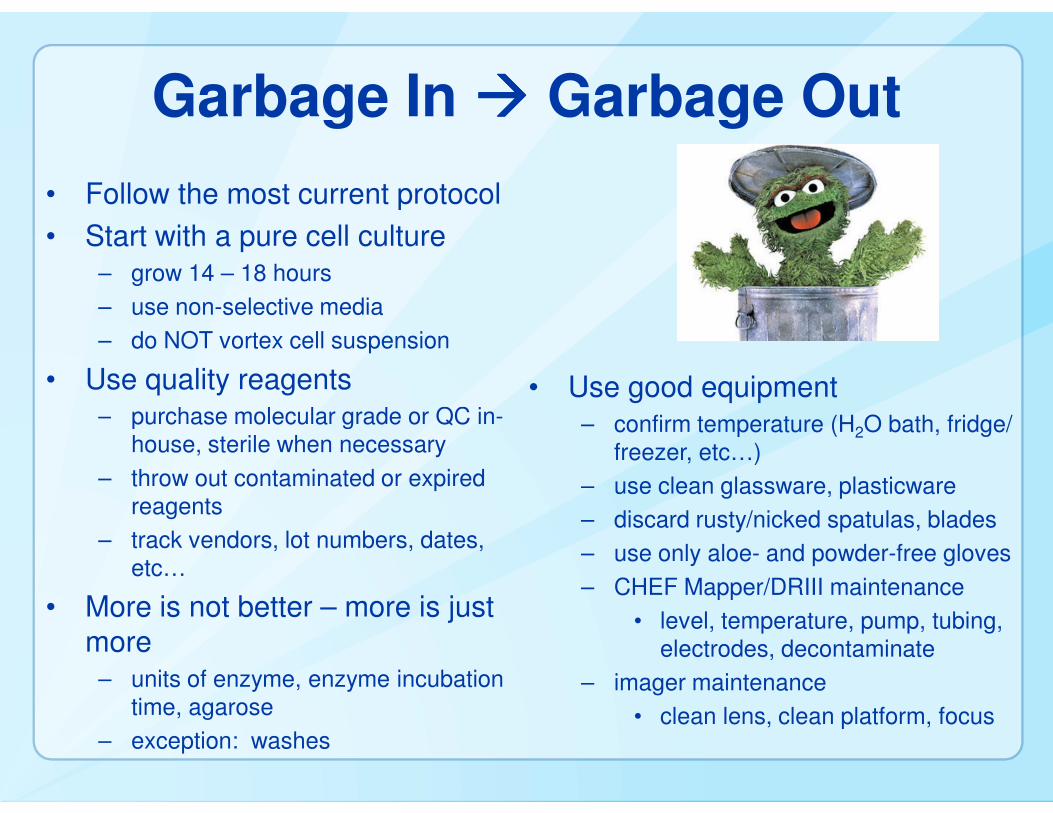
Garbage In ���� Garbage Out
• Follow the most current protocol
• Start with a pure cell culture– grow 14 – 18 hours
– use non-selective media
– do NOT vortex cell suspension
• Use quality reagents– purchase molecular grade or QC in-
• Use good equipment– purchase molecular grade or QC in-
house, sterile when necessary
– throw out contaminated or expired reagents
– track vendors, lot numbers, dates, etc…
• More is not better – more is just more
– units of enzyme, enzyme incubation time, agarose
– exception: washes
– confirm temperature (H2O bath, fridge/ freezer, etc…)
– use clean glassware, plasticware
– discard rusty/nicked spatulas, blades
– use only aloe- and powder-free gloves
– CHEF Mapper/DRIII maintenance
• level, temperature, pump, tubing, electrodes, decontaminate
– imager maintenance
• clean lens, clean platform, focus
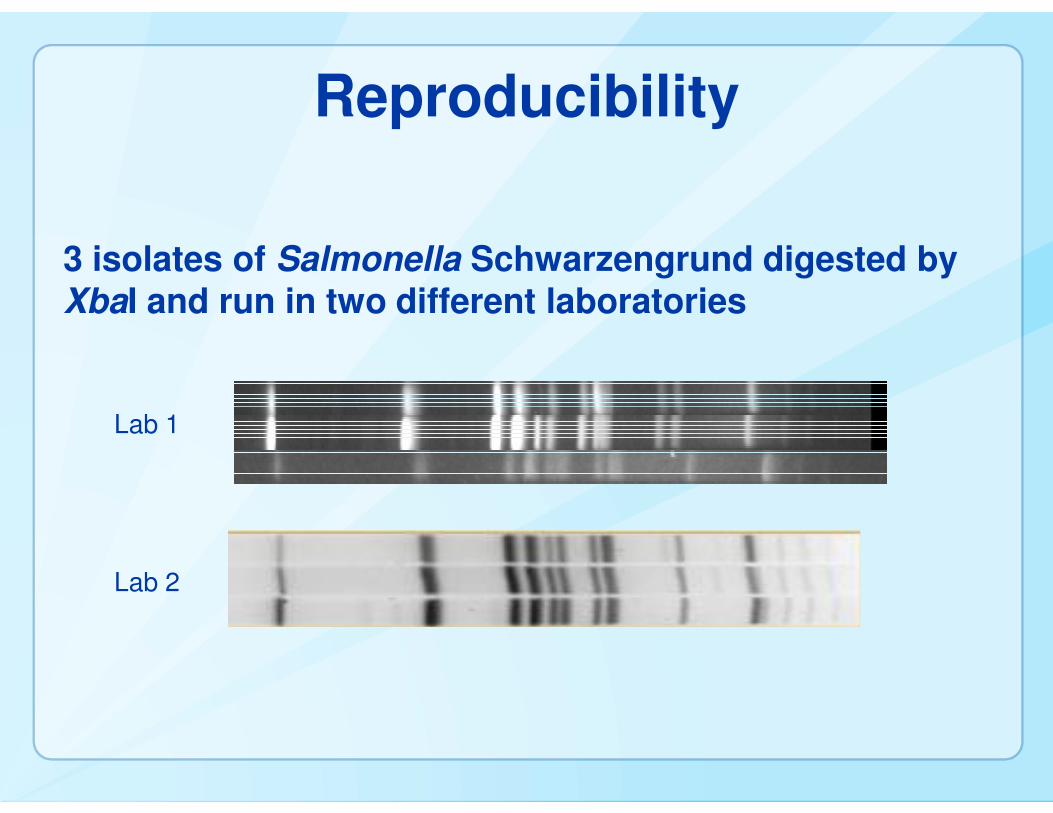
Reproducibility
3 isolates of Salmonella Schwarzengrund digested by XbaI and run in two different laboratories
Lab 1
Lab 2
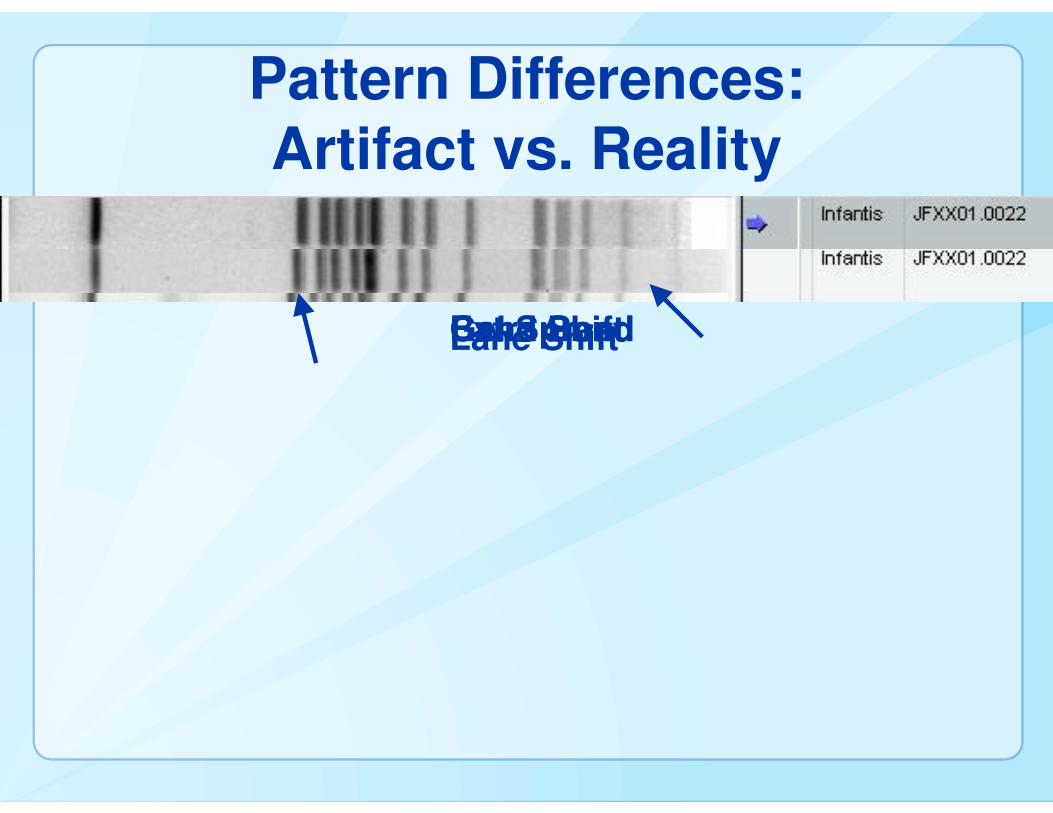
Pattern Differences: Artifact vs. Reality
Gel SpreadBand ShiftExtra BandLane Shift

Artifacts?
• Salmonella Saintpaul alfalfa sprout outbreak, multi-state (OR) 2003
Outbreak?
Artificial band shifts? No!
XbaIOutbreak?Outbreak
BlnINon-outbreakOutbreak
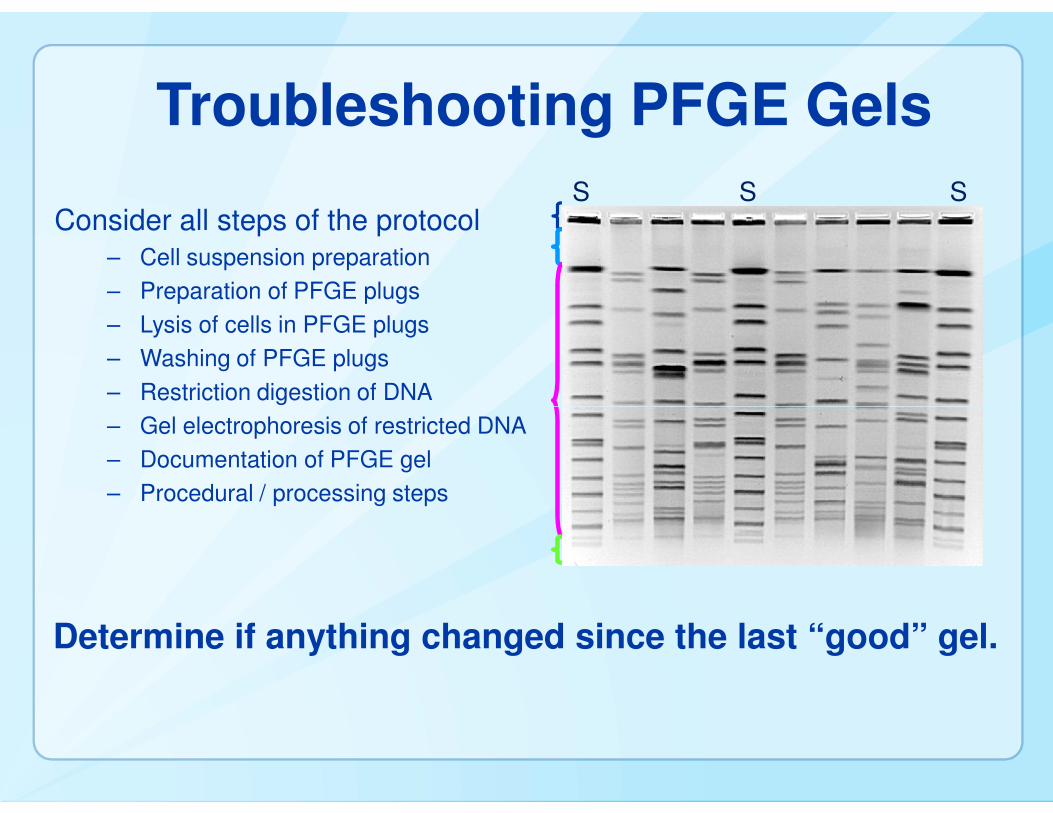
Troubleshooting PFGE Gels
Consider all steps of the protocol– Cell suspension preparation
– Preparation of PFGE plugs
– Lysis of cells in PFGE plugs
– Washing of PFGE plugs
– Restriction digestion of DNA
S S S
– Gel electrophoresis of restricted DNA
– Documentation of PFGE gel
– Procedural / processing steps
Determine if anything changed since the last “good” gel.
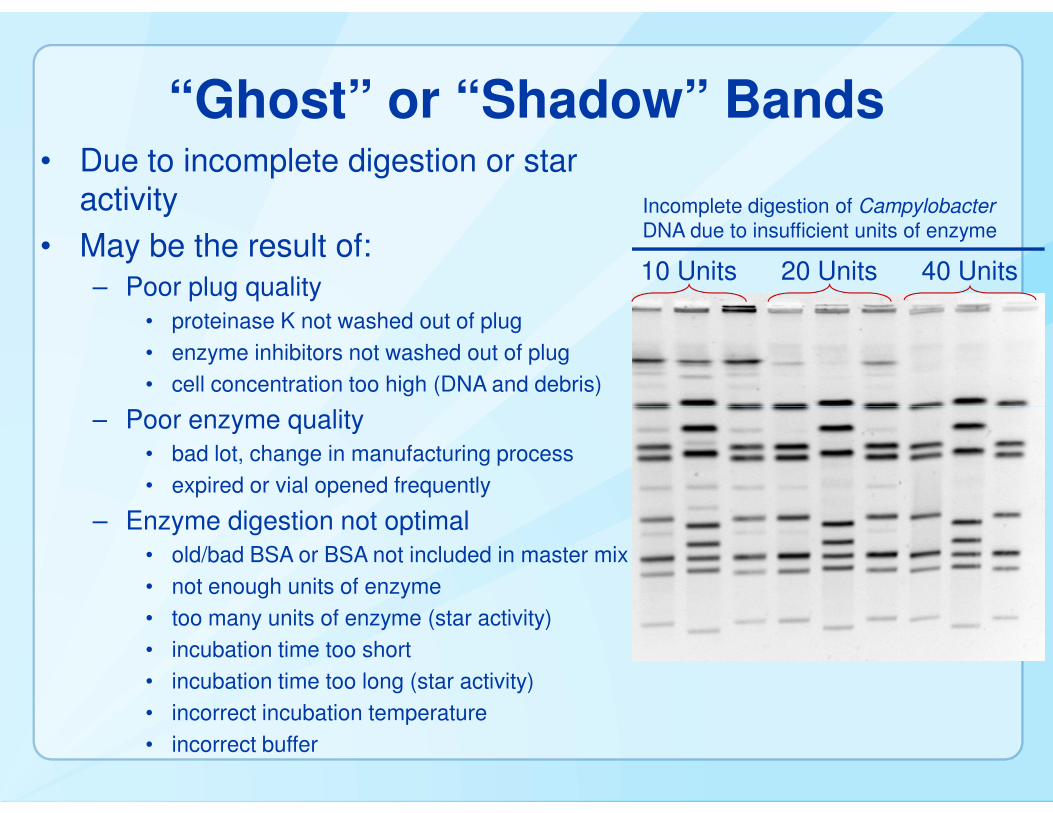
10 Units
“Ghost” or “Shadow” Bands• Due to incomplete digestion or star
activity
• May be the result of:
– Poor plug quality
• proteinase K not washed out of plug
• enzyme inhibitors not washed out of plug
• cell concentration too high (DNA and debris)
– Poor enzyme quality
20 Units 40 Units
Incomplete digestion of Campylobacter
DNA due to insufficient units of enzyme
– Poor enzyme quality
• bad lot, change in manufacturing process
• expired or vial opened frequently
– Enzyme digestion not optimal
• old/bad BSA or BSA not included in master mix
• not enough units of enzyme
• too many units of enzyme (star activity)
• incubation time too short
• incubation time too long (star activity)
• incorrect incubation temperature
• incorrect buffer
Cell suspension
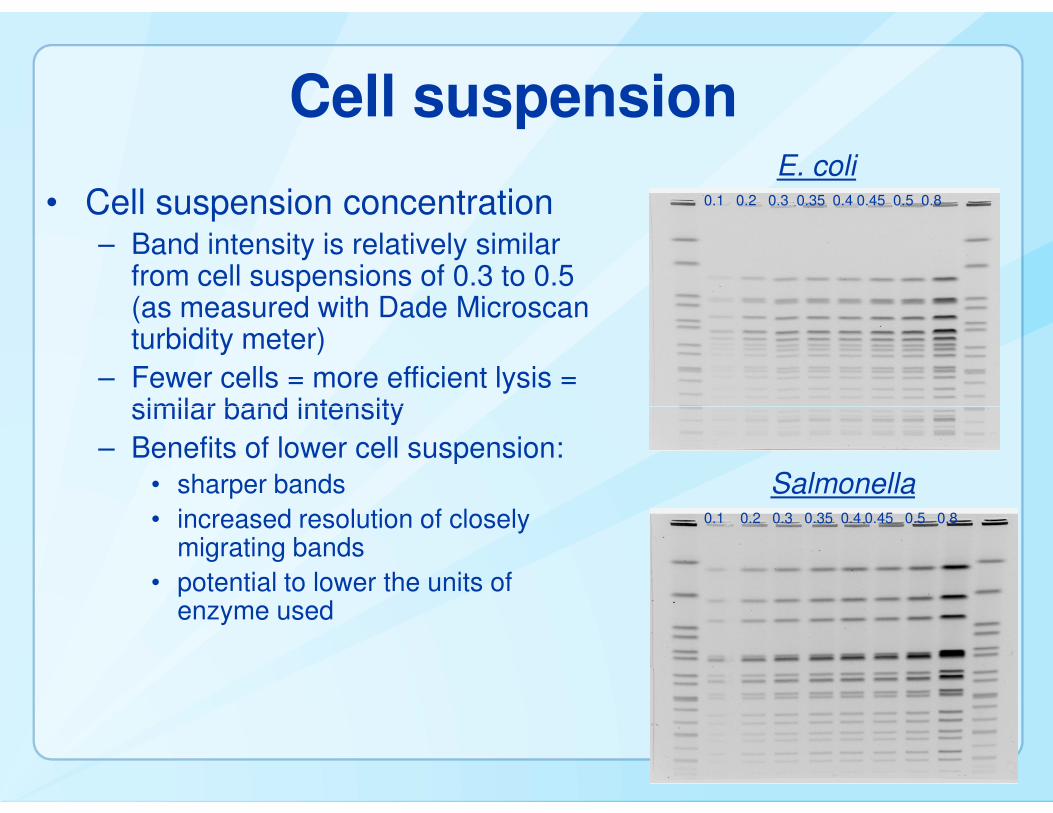
• Cell suspension concentration– Band intensity is relatively similar
from cell suspensions of 0.3 to 0.5 (as measured with Dade Microscanturbidity meter)
– Fewer cells = more efficient lysis = similar band intensity
0.1 0.2 0.3 0.35 0.4 0.45 0.5 0.8
E. coli
similar band intensity
– Benefits of lower cell suspension:
• sharper bands
• increased resolution of closely migrating bands
• potential to lower the units of enzyme used
0.1 0.2 0.3 0.35 0.4 0.45 0.5 0.8
Salmonella
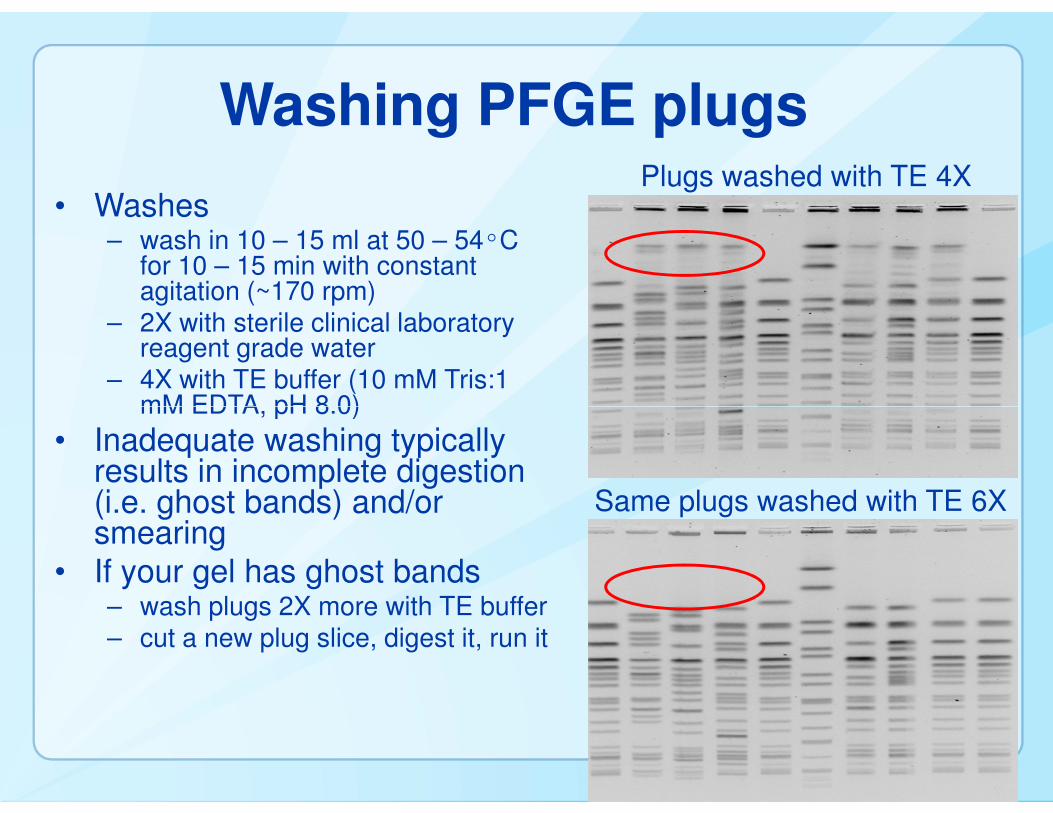
Washing PFGE plugs
• Washes– wash in 10 – 15 ml at 50 – 54ºC
for 10 – 15 min with constant agitation (~170 rpm)
– 2X with sterile clinical laboratory reagent grade water
– 4X with TE buffer (10 mM Tris:1 mM EDTA, pH 8.0)
Plugs washed with TE 4X
mM EDTA, pH 8.0)
• Inadequate washing typically results in incomplete digestion (i.e. ghost bands) and/or smearing
• If your gel has ghost bands– wash plugs 2X more with TE buffer– cut a new plug slice, digest it, run it
Same plugs washed with TE 6X
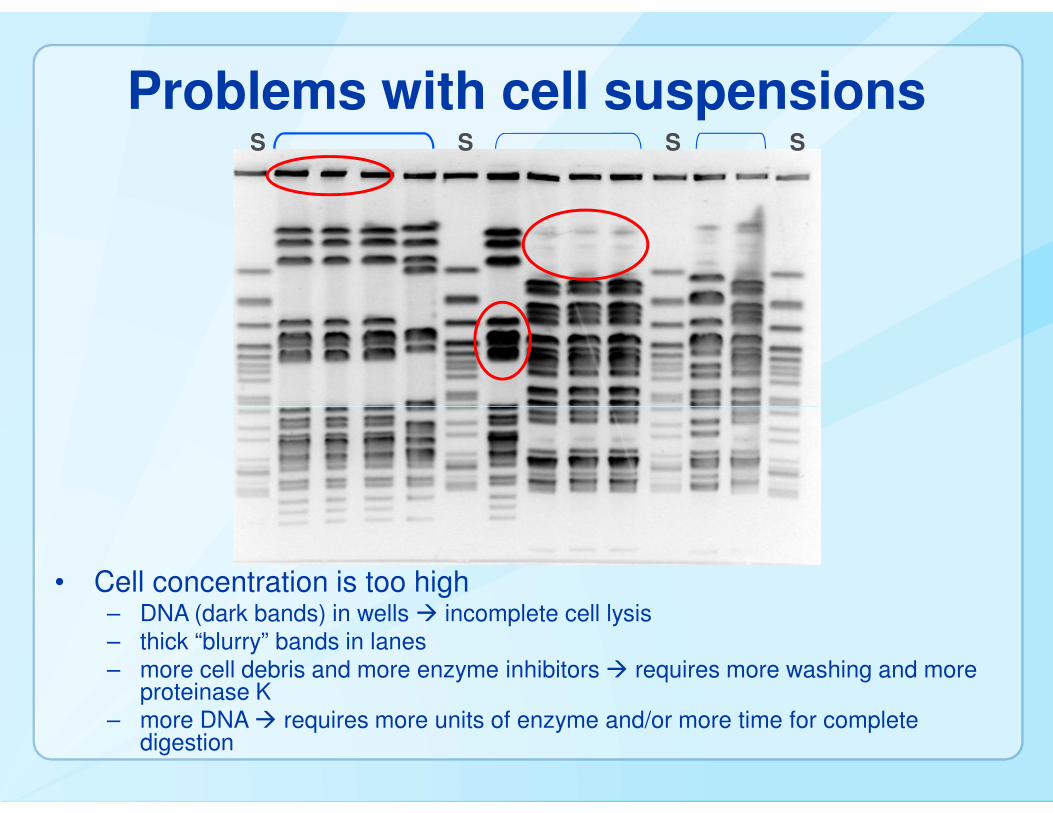
Problems with cell suspensionsS S S S
• Cell concentration is too high– DNA (dark bands) in wells � incomplete cell lysis– thick “blurry” bands in lanes– more cell debris and more enzyme inhibitors � requires more washing and more
proteinase K– more DNA � requires more units of enzyme and/or more time for complete
digestion
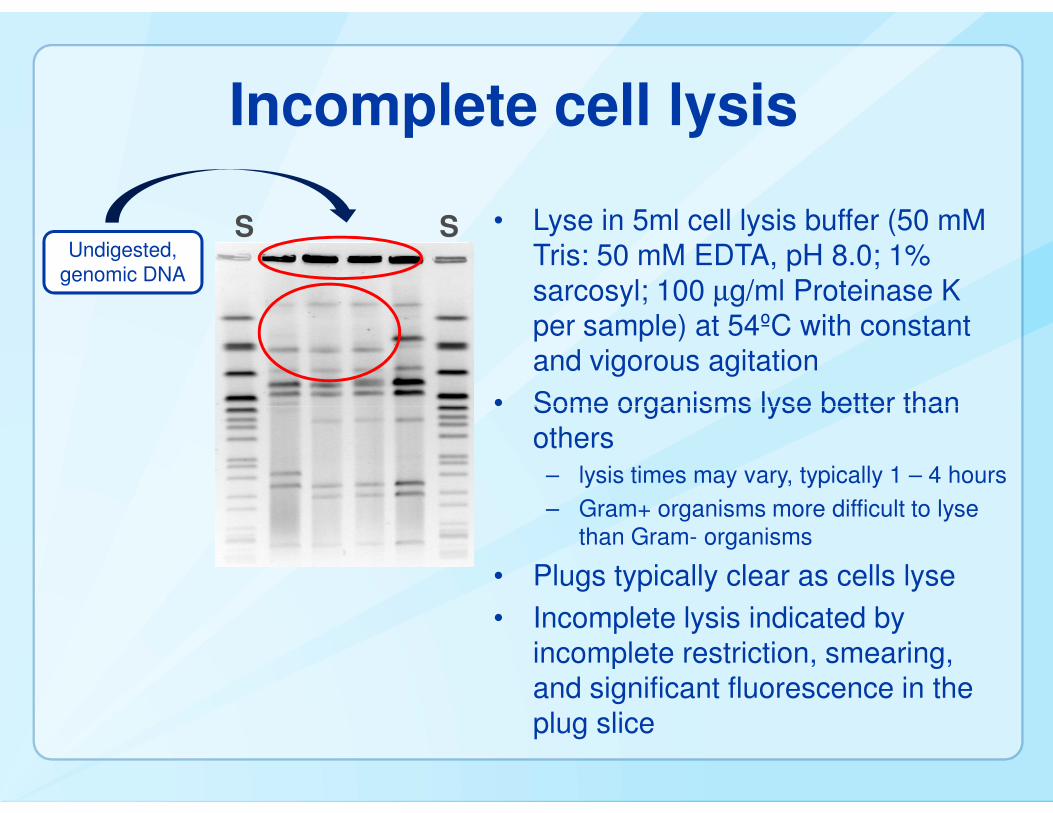
Incomplete cell lysis
S SUndigested,
genomic DNA
• Lyse in 5ml cell lysis buffer (50 mMTris: 50 mM EDTA, pH 8.0; 1%
sarcosyl; 100 µg/ml Proteinase K per sample) at 54ºC with constant and vigorous agitation
• Some organisms lyse better than • Some organisms lyse better than others
– lysis times may vary, typically 1 – 4 hours
– Gram+ organisms more difficult to lysethan Gram- organisms
• Plugs typically clear as cells lyse
• Incomplete lysis indicated by incomplete restriction, smearing, and significant fluorescence in the plug slice
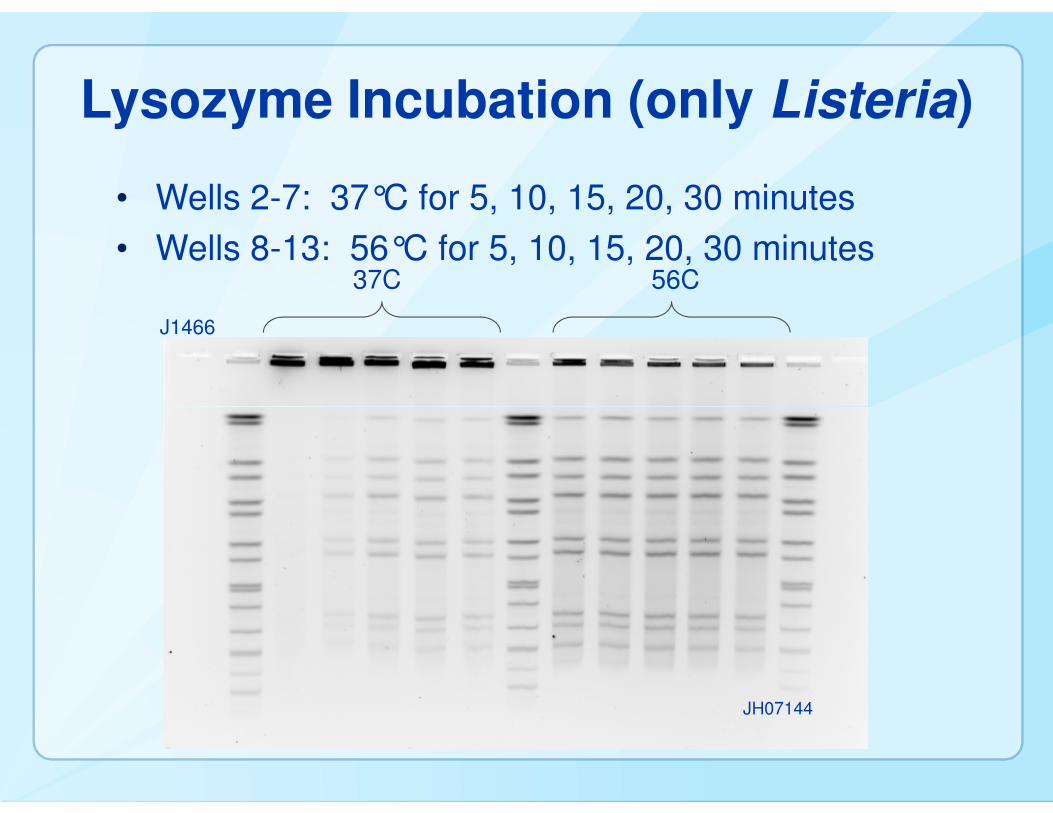
Lysozyme Incubation (only Listeria)
• Wells 2-7: 37°C for 5, 10, 15, 20, 30 minutes
• Wells 8-13: 56°C for 5, 10, 15, 20, 30 minutes37C 56C
J1466
JH07144
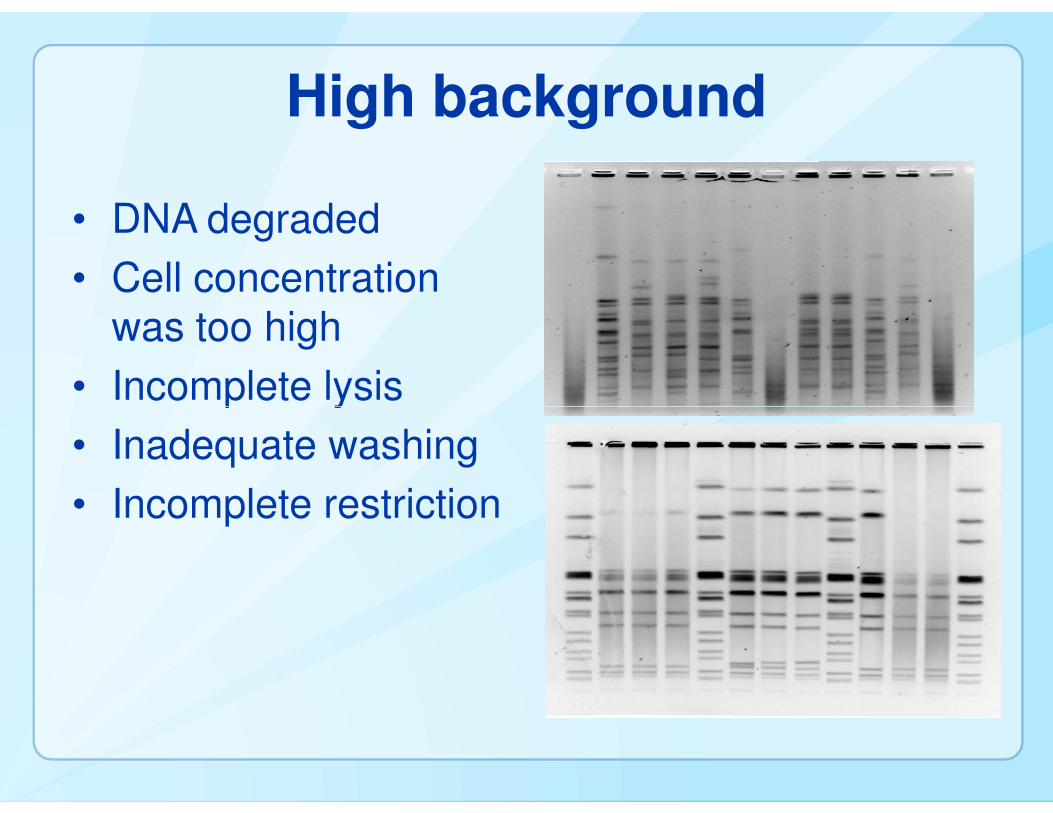
High background
• DNA degraded
• Cell concentration was too high
• Incomplete lysis• Incomplete lysis
• Inadequate washing
• Incomplete restriction
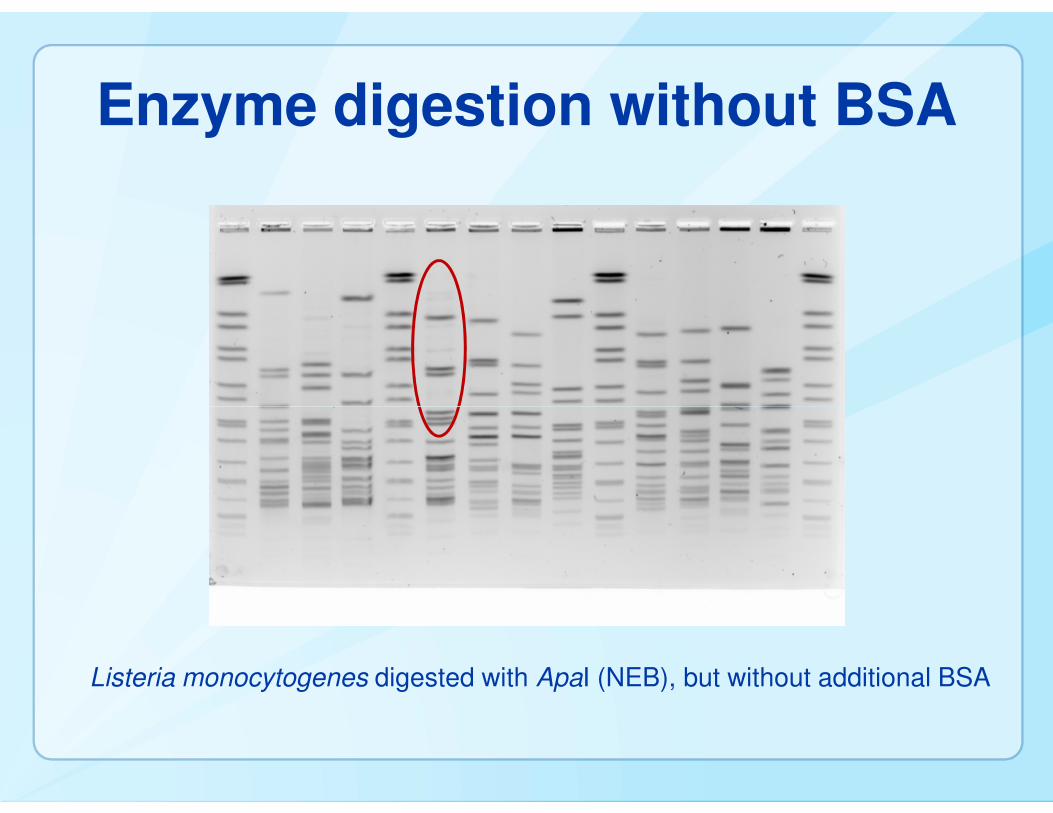
Enzyme digestion without BSA
Listeria monocytogenes digested with ApaI (NEB), but without additional BSA

Enzyme digestion without BSABSA BSA
- +stock +NEB - +stock +NEB
Two different strains of Salmonella Newport digested with BlnI.Image courtesy of Carol Sandt and David Faucette (PA)
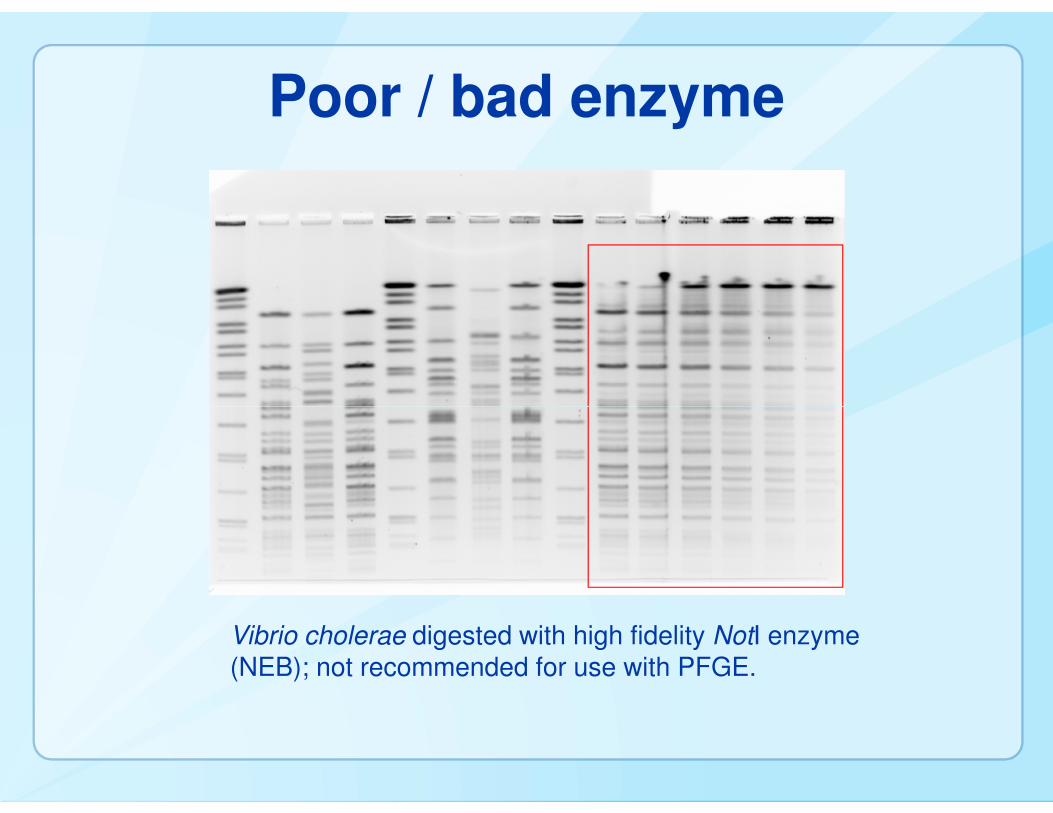
Poor / bad enzyme
Vibrio cholerae digested with high fidelity NotI enzyme (NEB); not recommended for use with PFGE.
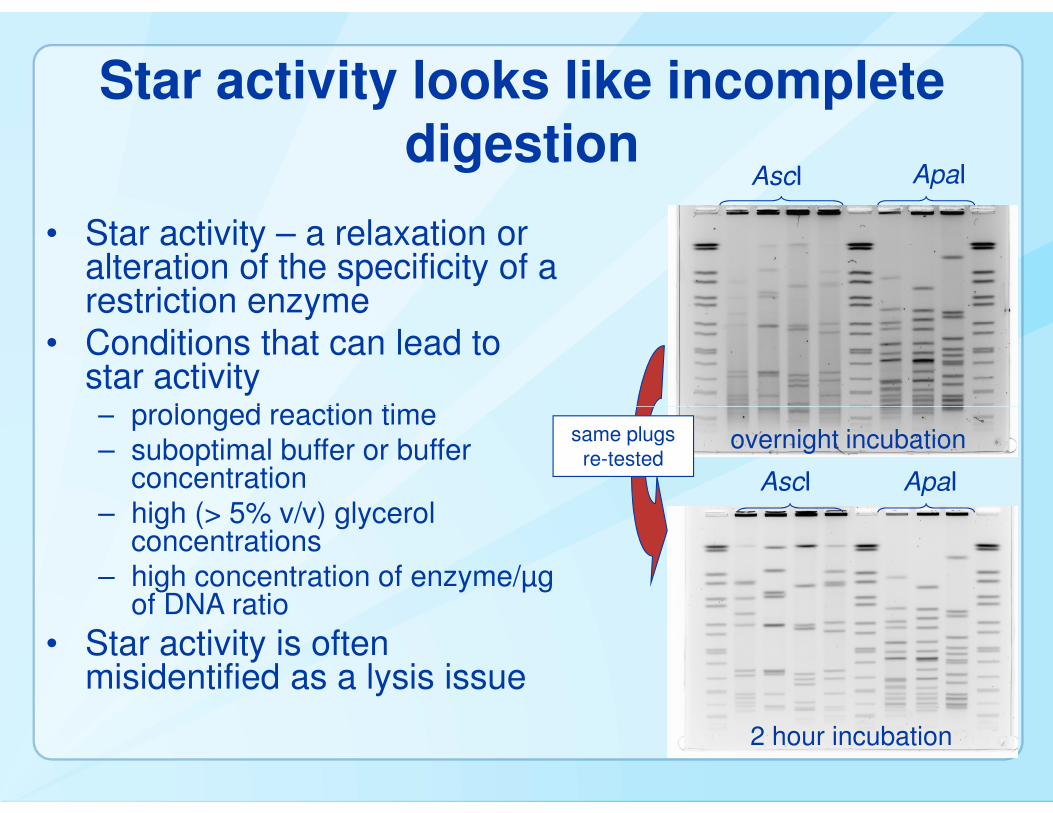
• Star activity – a relaxation or alteration of the specificity of a restriction enzyme
• Conditions that can lead to star activity– prolonged reaction time
AscI ApaI
Star activity looks like incomplete digestion
– prolonged reaction time– suboptimal buffer or buffer
concentration– high (> 5% v/v) glycerol
concentrations– high concentration of enzyme/µg
of DNA ratio
• Star activity is often misidentified as a lysis issue
AscI ApaI
same plugs
re-testedovernight incubation
2 hour incubation
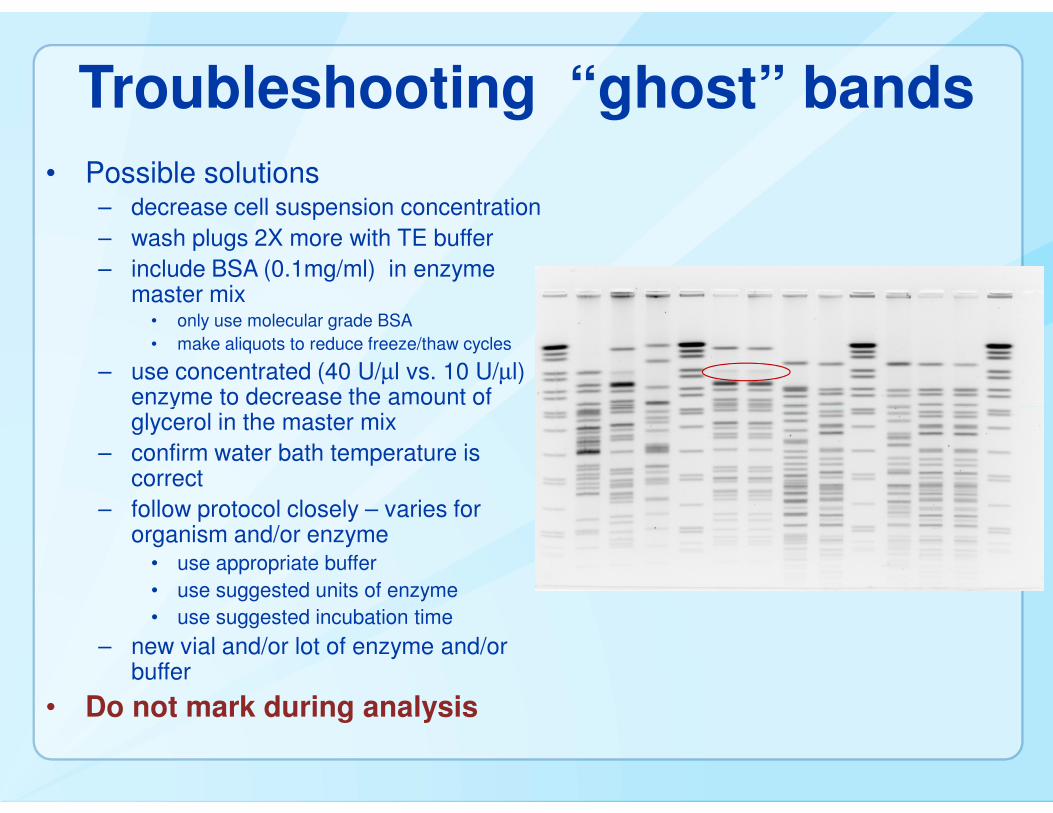
Troubleshooting “ghost” bands
• Possible solutions– decrease cell suspension concentration
– wash plugs 2X more with TE buffer
– include BSA (0.1mg/ml) in enzyme master mix
• only use molecular grade BSA
• make aliquots to reduce freeze/thaw cycles
– use concentrated (40 U/µl vs. 10 U/µl) enzyme to decrease the amount of enzyme to decrease the amount of glycerol in the master mix
– confirm water bath temperature is correct
– follow protocol closely – varies for organism and/or enzyme
• use appropriate buffer
• use suggested units of enzyme
• use suggested incubation time
– new vial and/or lot of enzyme and/or buffer
• Do not mark during analysis
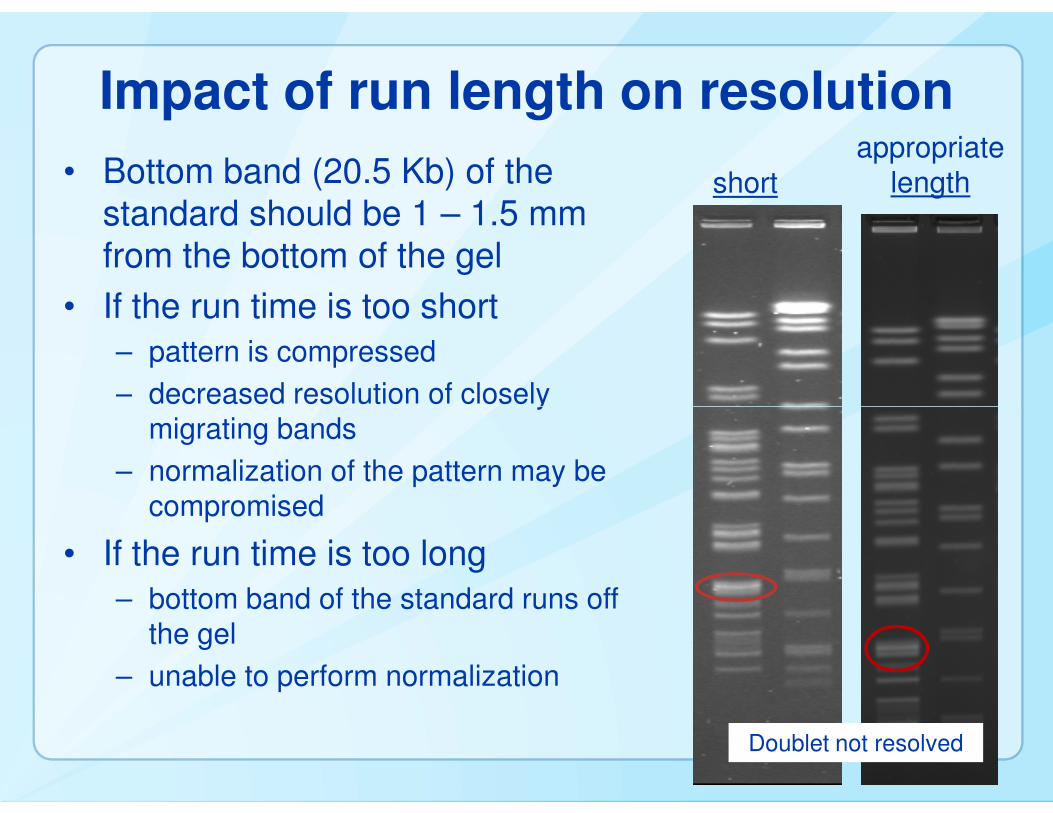
Impact of run length on resolution
short
appropriatelength• Bottom band (20.5 Kb) of the
standard should be 1 – 1.5 mm from the bottom of the gel
• If the run time is too short
– pattern is compressed
– decreased resolution of closely
Doublet not resolved
– decreased resolution of closely migrating bands
– normalization of the pattern may be compromised
• If the run time is too long
– bottom band of the standard runs off the gel
– unable to perform normalization
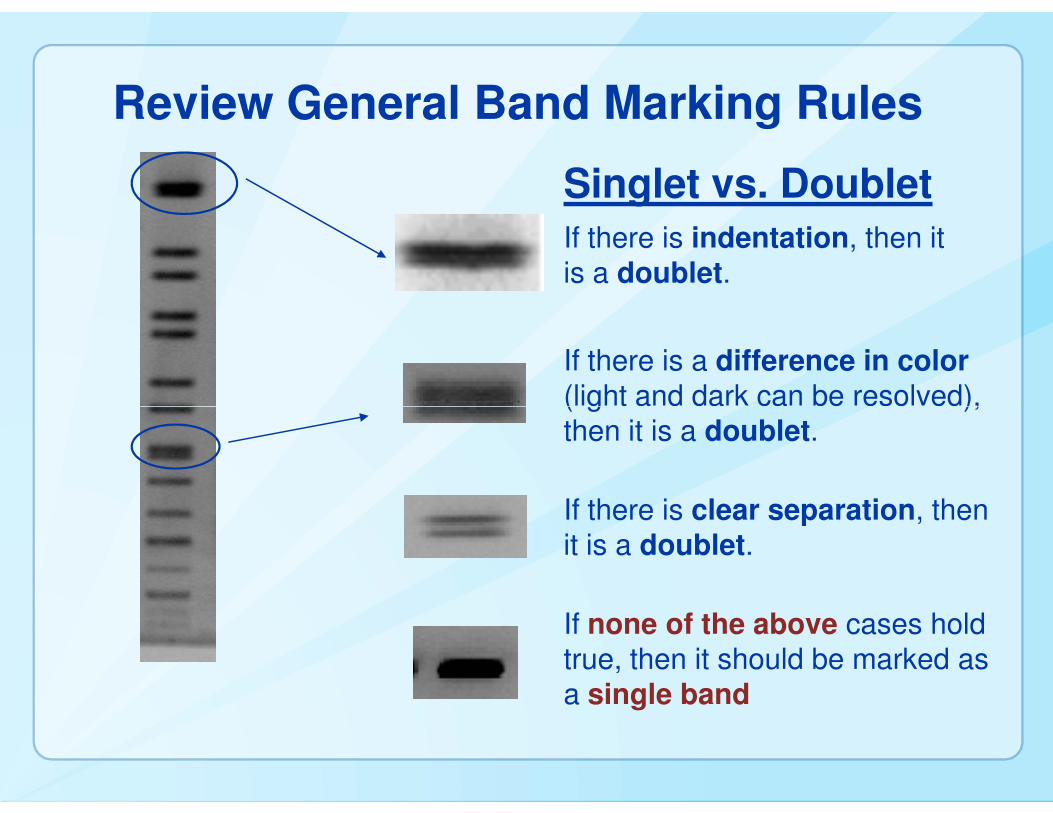
Singlet vs. Doublet
If there is indentation, then it is a doublet.
If there is a difference in color (light and dark can be resolved),
Review General Band Marking Rules
(light and dark can be resolved), then it is a doublet.
If there is clear separation, then it is a doublet.
If none of the above cases hold true, then it should be marked as a single band
Interpretation of PFGE Data
• Technical artifact vs. genetic variation
– Technical artifact
• Effect of reproducibility
• Incomplete restriction
• Effect of resolution
• Pattern analysis
– Genetic variation
• Expected degree of variability
• Dependent on the organism being studied
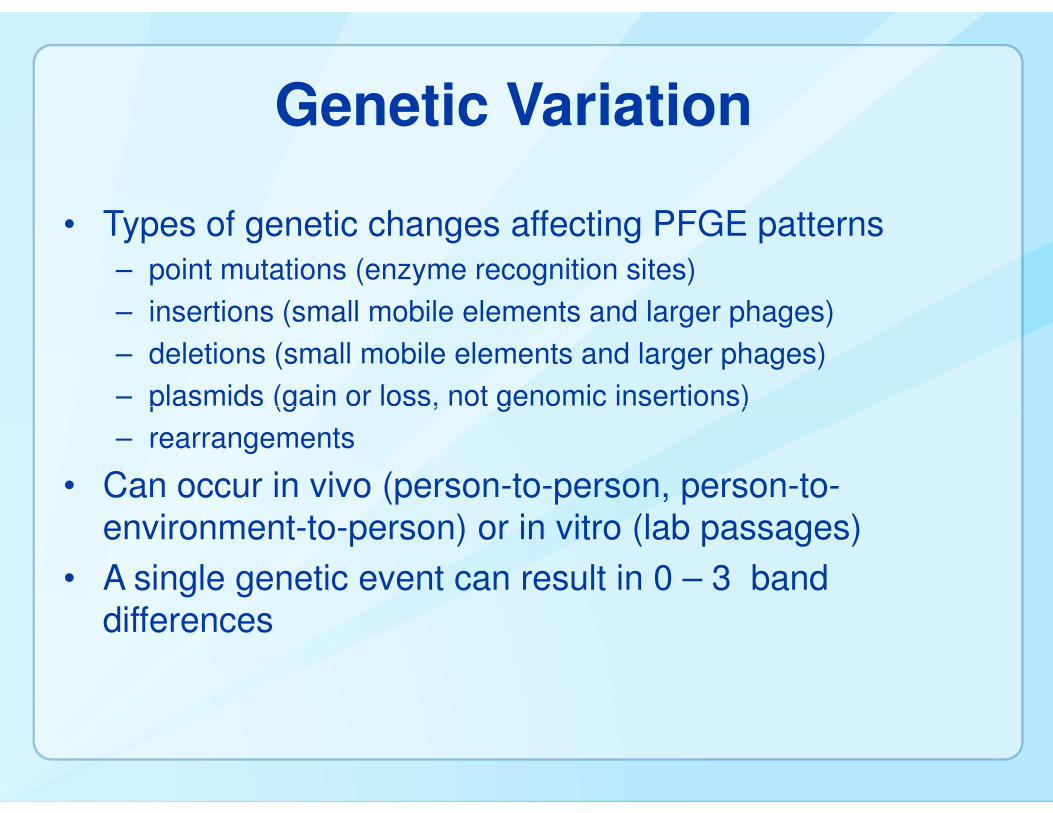
Genetic Variation
• Types of genetic changes affecting PFGE patterns
– point mutations (enzyme recognition sites)
– insertions (small mobile elements and larger phages)
– deletions (small mobile elements and larger phages)
– plasmids (gain or loss, not genomic insertions)– plasmids (gain or loss, not genomic insertions)
– rearrangements
• Can occur in vivo (person-to-person, person-to-environment-to-person) or in vitro (lab passages)
• A single genetic event can result in 0 – 3 band differences
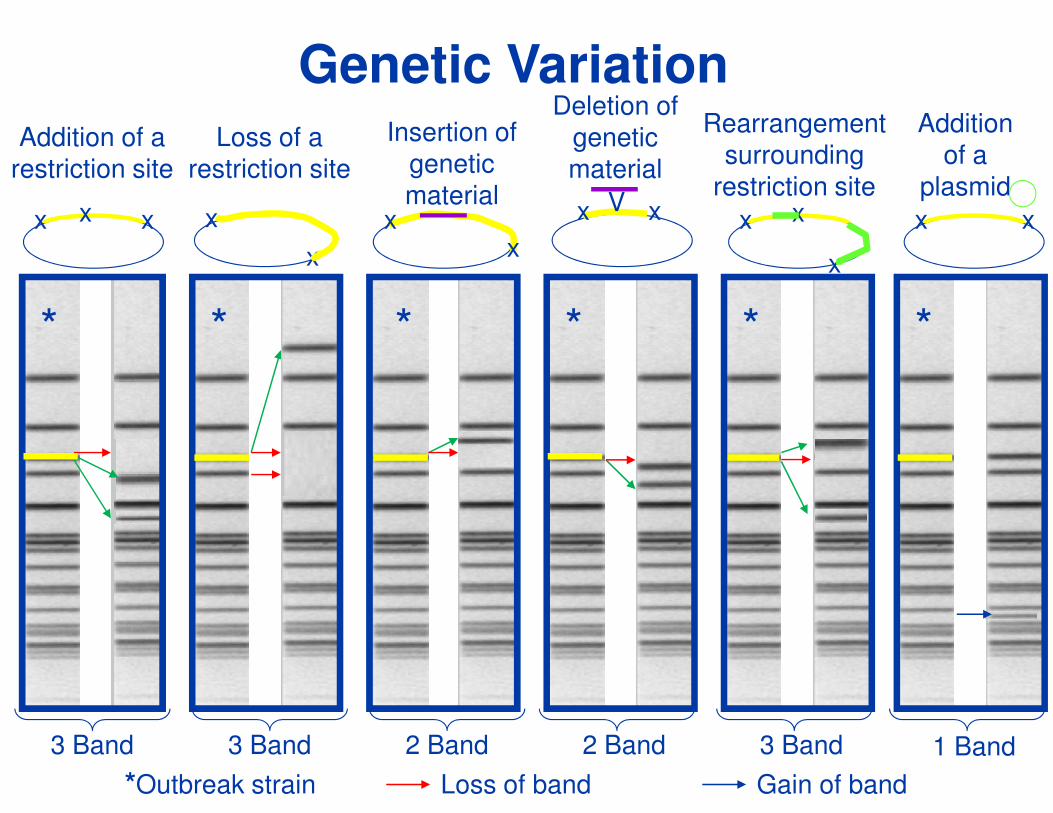
Genetic Variation
Loss of a restriction site
Addition of a restriction site
Insertion of genetic material
Deletion of genetic material
Rearrangement surrounding
restriction site
* * * * *
x
x xxx x
*
Addition of a
plasmid
xxxxVxxx
x
*Outbreak strain Loss of band Gain of band
3 Band 3 Band 2 Band 2 Band 3 Band 1 Band
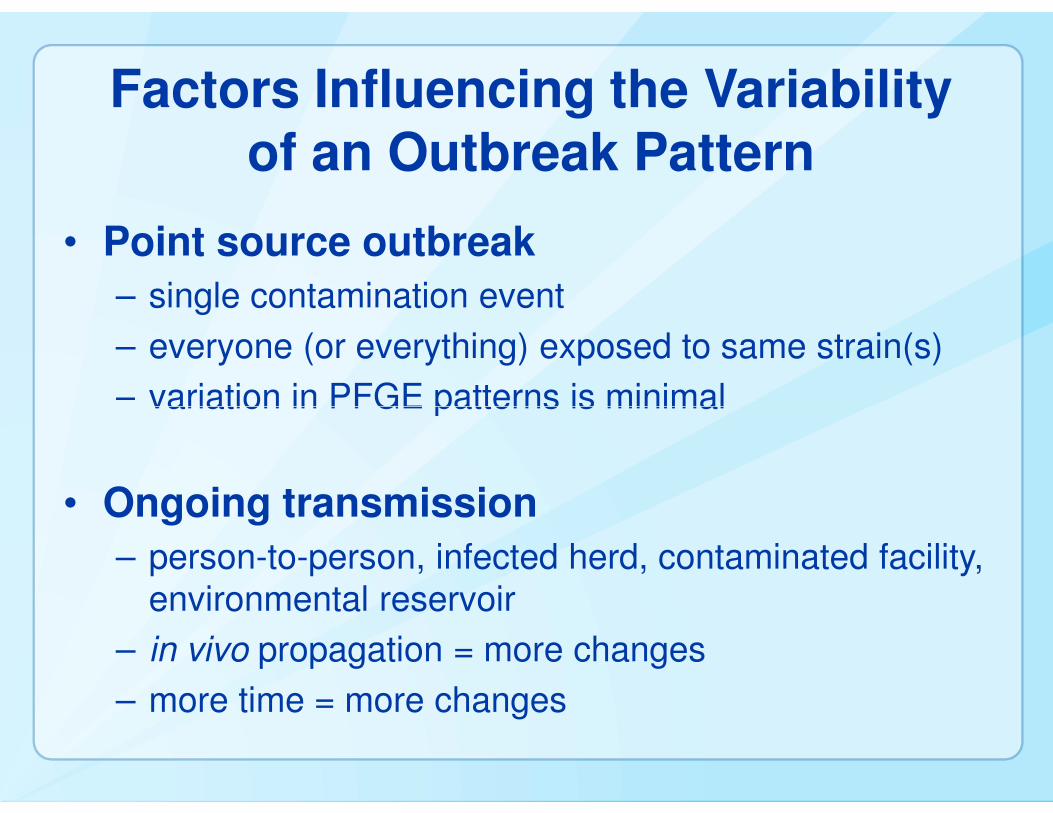
Factors Influencing the Variability of an Outbreak Pattern
• Point source outbreak
– single contamination event
– everyone (or everything) exposed to same strain(s)
– variation in PFGE patterns is minimal– variation in PFGE patterns is minimal
• Ongoing transmission
– person-to-person, infected herd, contaminated facility, environmental reservoir
– in vivo propagation = more changes
– more time = more changes
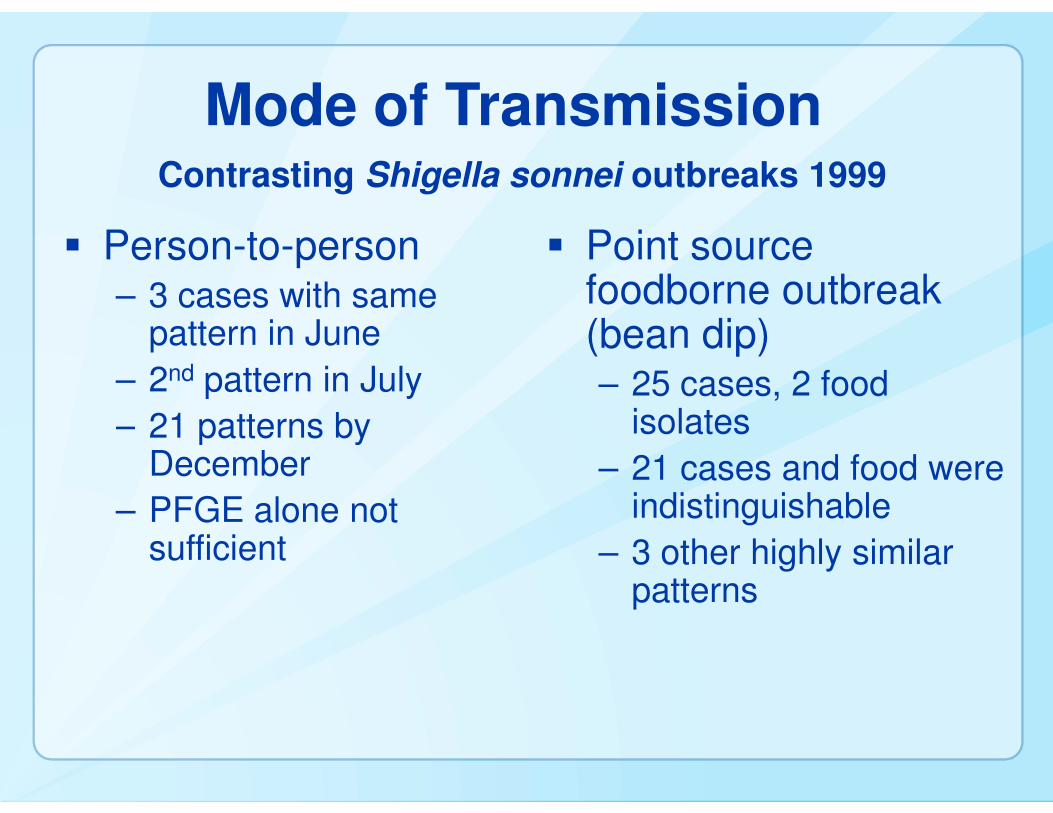
Mode of Transmission
� Person-to-person– 3 cases with same
pattern in June
– 2nd pattern in July
– 21 patterns by
� Point source foodborne outbreak (bean dip)– 25 cases, 2 food
isolates
Contrasting Shigella sonnei outbreaks 1999
– 21 patterns by December
– PFGE alone not sufficient
isolates
– 21 cases and food were indistinguishable
– 3 other highly similar patterns
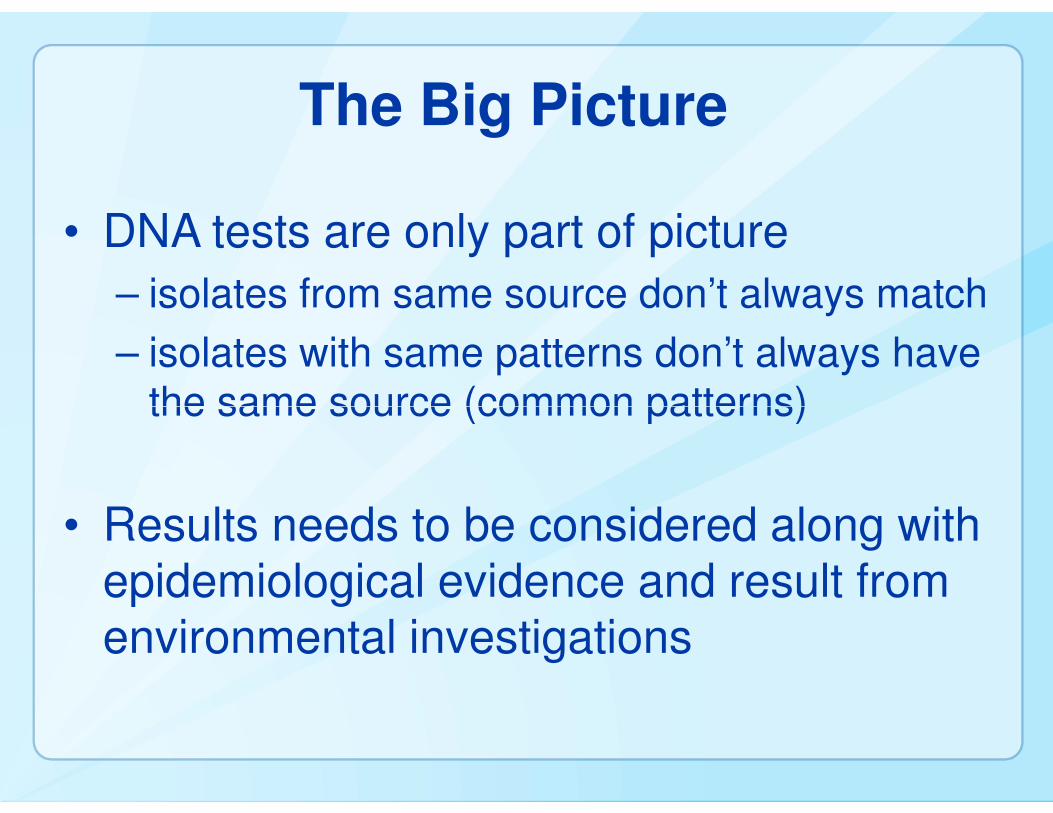
The Big Picture
• DNA tests are only part of picture
– isolates from same source don’t always match
– isolates with same patterns don’t always have the same source (common patterns)the same source (common patterns)
• Results needs to be considered along with epidemiological evidence and result from environmental investigations
AcknowledgementsAll PulseNet participants at CDC, FDA, USDA,
and in the State Public Health Laboratories
The findings and conclusions in this presentation are those of the
For more information please contact Centers for Disease Control and Prevention1600 Clifton Road NE, Atlanta, GA 30333Telephone, 1-800-CDC-INFO (232-4636)/TTY: 1-888-232-6348E-mail: [email protected] Web: www.cdc.gov
The findings and conclusions in this presentation are those of the author and do not necessarily represent the views of the Centers for
Disease Control and Prevention
National Center for Emerging and Zoonotic Infectious Diseases
Division of Foodborne, Waterborne, and Environmental Diseases