performing comparisons in bionumerics - pulsenet … · overview create a comparison and perform a...
TRANSCRIPT

Performing Comparisons in BioNumerics
Erik W. ColemanErik W. ColemanMay 2009May 2009

OverviewOverview
Create a Comparison and Perform a Cluster Analysis
Cluster Analysis Parameters
Position Tolerance and Optimization
Dice Coefficient with UPGMA Dendrogram
% Similarity within dendrograms
Change the look of the dendrogram
Manage Comparisons
Save, Open, Delete
Cut, Copy, Paste in Comparison windows
Print Comparisons
Change Settings/Views, Copy to Clipboard
Compare One Pattern to Others
Compare Two Entries
Compare Raw Images

Create New Comparison
Select isolates for comparison, then go to “Create new comparison” under the “Comparison” menu
Manually SelectCtrl + left clickShift + left click Left click + space bar
Selection by QueryClick binoculars for query optionsQuery shortcut buttons

Create New Comparison
A comparison window will appear, containing only the isolates you have selected
Notice number of entries

Comparisons: View PatternsComparisons: View Patterns
Click on icon in top toolbar, or choose enzyme from Experiments panel to show pattern images
Choose enzyme from pull-down menu

Comparisons: Perform Cluster Comparisons: Perform Cluster AnalysisAnalysis
Click on “Calculate cluster analysis”

Comparisons: Perform Cluster Comparisons: Perform Cluster AnalysisAnalysis
Resulting Dendrogram similarity matrix

OverviewOverview
Create a Comparison and Perform a Cluster Analysis
Cluster Analysis Parameters
Position Tolerance and Optimization
Dice Coefficient with UPGMA Dendrogram
% Similarity within dendrograms
Change the look of the dendrogram
Manage Comparisons
Save, Open, Delete
Cut, Copy, Paste in Comparison windows
Print Comparisons
Change Settings/Views, Copy to Clipboard
Compare One Pattern to Others
Compare Two Entries
Compare Raw Images
Cluster Analysis ParametersCluster Analysis Parameters
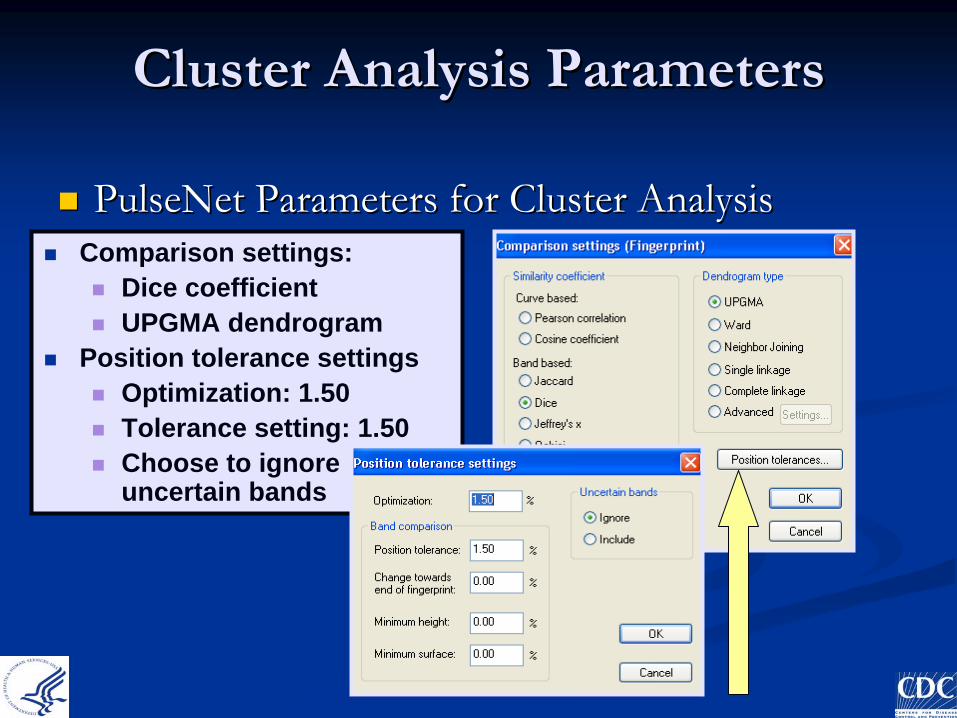
PulseNet Parameters for Cluster AnalysisPulseNet Parameters for Cluster Analysis
Comparison settings:
Dice coefficient
UPGMA dendrogram
Position tolerance settings
Optimization: 1.50
Tolerance setting: 1.50
Choose to ignore uncertain bands

Cluster Analysis Parameters:Cluster Analysis Parameters: Position Tolerance Position Tolerance
Computer Interpretation of Band PositionsComputer Interpretation of Band Positions
To the computer a band is not a band, but a band plus a window surrounding the band
When comparing band positions of two profiles the computer will consider the band position identical if the band position in one of the profiles falls within a window around a band in the other profile
The size of this window is called the Position Tolerance (set at 1.5% of the run length of the band)
≠≠
==
==
≠≠

Cluster Analysis Parameters:Cluster Analysis Parameters: Position Tolerance Set Too HighPosition Tolerance Set Too High
The computer will interpret some unique profiles as being identical!
Dice (Opt:1.50%) (Tol 2.0%-2.0%) (H>0.0% S>0.0%) [10.8%-97.0%]PFGE-XbaI
100
PFGE-XbaI

Cluster Analysis Parameters:Cluster Analysis Parameters: UPGMAUPGMA
Cluster analysis allows you to compare many profiles in the database at one time
Note! In UPGMA clustering the similarity value at each branching in the dendrogram represents the average similarity of the profiles in the branches

Comparisons: DendrogramsComparisons: Dendrograms
A blue dot indicates the selected branch
You can click on any branch to see the % similarity

Comparisons: DendrogramsComparisons: Dendrograms
Here, we have collapsed this branch
You can also right-click on the branches for additional options, such as to collapse or expand a branch

OverviewOverview
Create a Comparison and Perform a Cluster Analysis
Cluster Analysis Parameters
Position Tolerance and Optimization
Dice Coefficient with UPGMA Dendrogram
% Similarity within dendrograms
Change the look of the dendrogram
Manage Comparisons
Save, Open, Delete
Cut, Copy, Paste in Comparison windows
Print Comparisons
Change Settings/Views, Copy to Clipboard
Compare One Pattern to Others
Compare Two Entries
Compare Raw Images
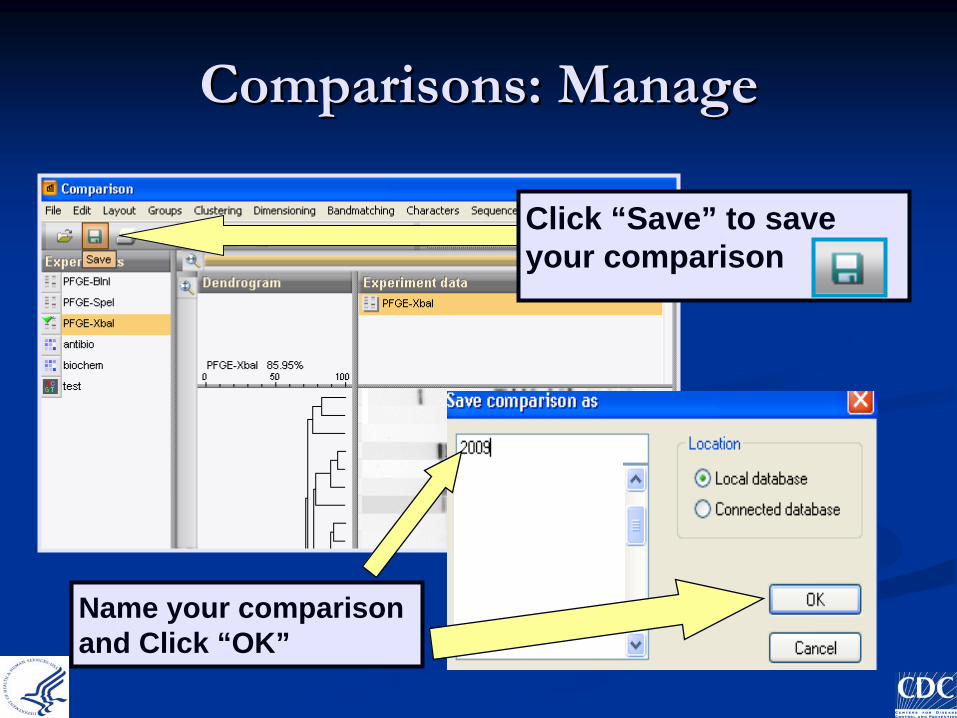
Comparisons: ManageComparisons: Manage
Name your comparison and Click “OK”
Click “Save” to save your comparison

Comparisons: ManageComparisons: Manage
You can manage your comparisons in the “Comparisons” window:Create New:Open:Delete:Search:

Comparisons: ManageComparisons: Manage
If you want to add patterns to a comparison window:
Click “Copy selection” in main window or another comparison window
Click “Paste selection…” in comparison window

Comparisons: ManageComparisons: Manage
If you want to take patterns out of a comparison window:
Select the patterns
Click “Cut selection…” in comparison window
Click “OK”

Comparisons: PrintComparisons: Print
Click “Show print preview”

Comparisons: PrintComparisons: Print
Use nodes to move columns
Use toolbar to change settings/view

Comparisons: Arrange by SerotypeComparisons: Arrange by Serotype
Right-click on “Serotype” and choose “Arrange entries by field”
NOTE: Arrange by serotype to see clusters more easily before creating dendrogram

OverviewOverview
Create a Comparison and Perform a Cluster Analysis
Cluster Analysis Parameters
Position Tolerance and Optimization
Dice Coefficient with UPGMA Dendrogram
% Similarity within dendrograms
Change the look of the dendrogram
Manage Comparisons
Save, Open, Delete
Cut, Copy, Paste in Comparison windows
Print Comparisons
Change Settings/Views, Copy to Clipboard
Compare One Pattern to Others
Compare Two Entries
Compare Raw Images

Comparisons: Compare One Comparisons: Compare One Pattern to OthersPattern to Others
Click on one isolate (key) within your comparison to compare the others in your comparison

Comparisons: Compare One Comparisons: Compare One Pattern to OthersPattern to Others
Click on “Arrange by decreasing similarity”to compare the selected pattern to all others within the comparison window

Comparisons: Compare One Comparisons: Compare One Pattern to OthersPattern to Others
If this screen appears, click “Yes”

Comparisons: Compare One Comparisons: Compare One Pattern to OthersPattern to Others
Now, your patterns are arranged by decreasing similarity to the pattern you selected
% Similarity

Comparisons: Compare Two EntriesComparisons: Compare Two Entries
1. Select two isolates in your database to compare 2. Select
“Comparetwo entries” from comparison menu

Comparisons: Compare Two EntriesComparisons: Compare Two EntriesAlso called a Pairwise comparison or 2x2 comparison
Red for one isolate, blue for the other
Peaks correspond to intensity of bands
Note % Similarity

Comparisons: Compare Two EntriesComparisons: Compare Two Entries
Shows matching bands and non-matches
% Similarity (# of total bands)