perspectivas de mercado maÍz · commodity & ingredient hedging 2 trading futures and options...
TRANSCRIPT

Perspectivas de Mercado
MAÍZ
Abril, 2018

Commodity & Ingredient Hedging 2Trading futures and options carries a risk of loss. Past performance is not indicative of future results. © 2018 Commodity & Ingredient Hedging, LLC. All rights reserved.
Introducción
Contexto Histórico
Análisis Fundamental
Análisis Estacional
Volatilidad Implícita

Contexto Histórico

Commodity & Ingredient Hedging 4Trading futures and options carries a risk of loss. Past performance is not indicative of future results. © 2018 Commodity & Ingredient Hedging, LLC. All rights reserved.

Commodity & Ingredient Hedging 5Trading futures and options carries a risk of loss. Past performance is not indicative of future results. © 2018 Commodity & Ingredient Hedging, LLC. All rights reserved.

Análisis Fundamental

Commodity & Ingredient Hedging 7Trading futures and options carries a risk of loss. Past performance is not indicative of future results. © 2018 Commodity & Ingredient Hedging, LLC. All rights reserved.

Commodity & Ingredient Hedging 8Trading futures and options carries a risk of loss. Past performance is not indicative of future results. © 2018 Commodity & Ingredient Hedging, LLC. All rights reserved.
Análisis Fundamental
2017/18 Ending Stocks Estimates
April
USDA Average Range
March
USDA
2016-17
USDA
Corn 2.182 2.192 2.050-2.265 2.127 2.293
Soybeans 0.550 0.570 0.520-0.609 0.555 0.302
Wheat 1.064 1.040 1.010-1.080 1.034 1.181

Commodity & Ingredient Hedging 9Trading futures and options carries a risk of loss. Past performance is not indicative of future results. © 2018 Commodity & Ingredient Hedging, LLC. All rights reserved.
0
20,000
40,000
60,000
80,000
100,000
120,000
140,000
1960 1963 1966 1969 1972 1975 1978 1981 1984 1987 1990 1993 1996 1999 2002 2005 2008 2011 2014 2017
1,0
00 M
etr
ic T
ons
U.S. Corn Ending Stocks
Source: USDA Foreign Agricultural Service
(Updated April 10, 2018)

Commodity & Ingredient Hedging 10Trading futures and options carries a risk of loss. Past performance is not indicative of future results. © 2018 Commodity & Ingredient Hedging, LLC. All rights reserved.
0%
10%
20%
30%
40%
50%
60%
70%
1960 1963 1966 1969 1972 1975 1978 1981 1984 1987 1990 1993 1996 1999 2002 2005 2008 2011 2014 2017
U.S. Corn Stocks/Use Ratio
Source: USDA Foreign Agricultural Service
(Updated April 10, 2018)

Commodity & Ingredient Hedging 11Trading futures and options carries a risk of loss. Past performance is not indicative of future results. © 2018 Commodity & Ingredient Hedging, LLC. All rights reserved.
60
80
100
120
140
160
180
200
1995 1996 1997 1998 1999 2000 2001 2002 2003 2004 2005 2006 2007 2008 2009 2010 2011 2012 2013 2014 2015 2016 2017
Bushels
Per
Acre
U.S. Corn Trendline Yield
Source: USDA Economic Research Service
Source: USDA World Agricultural Outlook BoardSource: USDA World Agricultural Outlook Board
(Updated April 10, 2018)

Commodity & Ingredient Hedging 12Trading futures and options carries a risk of loss. Past performance is not indicative of future results. © 2018 Commodity & Ingredient Hedging, LLC. All rights reserved.
0
2000
4000
6000
8000
10000
12000
14000
1972 1975 1978 1981 1984 1987 1990 1993 1996 1999 2002 2005 2008 2011 2014 2017
100,0
00 B
ushels
Total U.S. Domestic Corn Use
Ethanol & by-products
Other Food, Seed & Industrial
Feed and Residual
Source: USDA World Agricultural Outlook Board & Economic Research Service
(Updated April 10, 2018)

Commodity & Ingredient Hedging 13Trading futures and options carries a risk of loss. Past performance is not indicative of future results. © 2018 Commodity & Ingredient Hedging, LLC. All rights reserved.
0
1000
2000
3000
4000
5000
6000
7000
1972 1975 1978 1981 1984 1987 1990 1993 1996 1999 2002 2005 2008 2011 2014 2017
100,0
00 B
ushels
U.S. Feed and Residual Corn Use
Feed and Residual
Source: USDA World Agricultural Outlook Board & Economic Research Service
(Updated April 10, 2018)

Commodity & Ingredient Hedging 14Trading futures and options carries a risk of loss. Past performance is not indicative of future results. © 2018 Commodity & Ingredient Hedging, LLC. All rights reserved.
0
1000
2000
3000
4000
5000
6000
1995 1997 1999 2001 2003 2005 2007 2009 2011 2013 2015 2017
100,0
00 B
ushels
U.S. Corn Consumption for Ethanol
Source: USDA Economic Research Service
(Updated April 10, 2018)

Oferta y Demanda Global
Cociente inventarios/usos mundial
Producción fuera de los EE.UU.
Uso interno mundial

La siguiente tabla resalta los cambios realizados a la Hoja de Balance
global para el ciclo 2016/17 & 2017/18

Commodity & Ingredient Hedging 17Trading futures and options carries a risk of loss. Past performance is not indicative of future results. © 2018 Commodity & Ingredient Hedging, LLC. All rights reserved.

Commodity & Ingredient Hedging 18Trading futures and options carries a risk of loss. Past performance is not indicative of future results. © 2018 Commodity & Ingredient Hedging, LLC. All rights reserved.
Crop Year
Region
Beginning
Stocks Production Imports Feed Exports
Ending
Stocks Stocks/Use
World -1.07 0.26 -0.08 0.37 -0.02 -0.96 -0.09%
United States 0 0 0 -0.02 0 0
Major Exporters 0 0.07 -0.13 0 0.09 -0.15
Argentina 0 0 0 0 0.49 -0.48
South Africa 0 0.07 -0.04 0 -0.3 0.33
Major Importers -0.02 -0.02 0.01 0 -0.01 -0.02
Egypt 0 0 0 0 0 0
EU-27 0 0 0 0 0 0
Japan 0 0 0 0 0 0
Mexico 0 0 0 0 0 0
Southeast Asia -0.03 0 0.02 0 -0.01 -0.01
South Korea 0 0 0 0 0 0
Selected Other
Brazil 0 0 -0.1 0 -0.1 0
Canada 0 0 0 0 0 0
China 0 0 0 0 0 0
FSU-12 0 0 0 0 0 0
Ukraine 0 0 0 0 0 0
2016/2017 April, 2018
World Corn Balance Sheet in Million Metric Tons
Supply Use

Commodity & Ingredient Hedging 19Trading futures and options carries a risk of loss. Past performance is not indicative of future results. © 2018 Commodity & Ingredient Hedging, LLC. All rights reserved.
Crop Year
Region
Beginning
Stocks Production Imports Feed Exports
Ending
Stocks Stocks/Use
World -0.96 -5.67 -1.09 -3.82 -3.36 -1.39 -0.04%
United States 0 0 0 -1.27 0 1.4
Major Exporters -0.15 -5.3 -0.1 -1 -3 -1.35
Argentina -0.48 -3 0 -1 -1 -1.29
South Africa 0.33 0.2 -0.1 0 0 0.43
Major Importers -0.02 0.18 -1.3 -1.65 0.04 -0.42
Egypt 0 0 0 0 0 0
EU-27 0 0 0 -0.7 0 0
Japan 0 0 0 0 0 0
Mexico 0 0.3 -0.3 0 0 0
Southeast Asia -0.01 -0.11 -0.5 -0.6 0.04 -0.25
South Korea 0 0 0 0 0 0
Selected Other
Brazil 0 -2.5 0 0 -2 -0.5
Canada 0 0 0 0 0 0
China 0 0 0 0 0 0
FSU-12 0 -0.1 0 -0.1 0 0
Ukraine 0 0 0 0 0 0
Supply Use
2017/2018 April, 2018
World Corn Balance Sheet in Million Metric Tons

Commodity & Ingredient Hedging 20Trading futures and options carries a risk of loss. Past performance is not indicative of future results. © 2018 Commodity & Ingredient Hedging, LLC. All rights reserved.
0
50,000
100,000
150,000
200,000
250,000
1960 1963 1966 1969 1972 1975 1978 1981 1984 1987 1990 1993 1996 1999 2002 2005 2008 2011 2014 2017
1,0
00 M
etr
ic T
ons
World Corn Ending Stocks
Source: USDA Foreign Agricultural Service
(Updated April 10, 2018)

Commodity & Ingredient Hedging 21Trading futures and options carries a risk of loss. Past performance is not indicative of future results. © 2018 Commodity & Ingredient Hedging, LLC. All rights reserved.
0%
5%
10%
15%
20%
25%
30%
35%
40%
45%
50%
1960 1963 1966 1969 1972 1975 1978 1981 1984 1987 1990 1993 1996 1999 2002 2005 2008 2011 2014 2017
World Corn Stocks/Use Ratio
Source: USDA Foreign Agricultural Service
(Updated April 10, 2018)

Commodity & Ingredient Hedging 22Trading futures and options carries a risk of loss. Past performance is not indicative of future results. © 2018 Commodity & Ingredient Hedging, LLC. All rights reserved.
0%
10%
20%
30%
40%
50%
60%
70%
1960 1963 1966 1969 1972 1975 1978 1981 1984 1987 1990 1993 1996 1999 2002 2005 2008 2011 2014 2017
World vs U.S. Corn Stocks/Use Ratio
World U.S.
Source: USDA Foreign Agricultural Service
(Updated April 10, 2018)

Commodity & Ingredient Hedging 23Trading futures and options carries a risk of loss. Past performance is not indicative of future results. © 2018 Commodity & Ingredient Hedging, LLC. All rights reserved.
0
100,000
200,000
300,000
400,000
500,000
600,000
1960 1963 1966 1969 1972 1975 1978 1981 1984 1987 1990 1993 1996 1999 2002 2005 2008 2011 2014 2017
1,0
00 M
etr
ic T
ons
Major Foreign Corn Producers
Southeast Asia Mexico Argentina
Brazil E.U. China
Source: USDA Foreign Agricultural Service
(Updated April 10, 2018)

Commodity & Ingredient Hedging 24Trading futures and options carries a risk of loss. Past performance is not indicative of future results. © 2018 Commodity & Ingredient Hedging, LLC. All rights reserved.
0
10,000
20,000
30,000
40,000
50,000
60,000
70,000
80,000
90,000
1960 1963 1966 1969 1972 1975 1978 1981 1984 1987 1990 1993 1996 1999 2002 2005 2008 2011 2014 2017
1,0
00 M
etr
ic T
ons
Major Foreign Corn ExportersAnnual Exports
Ukraine Argentina Brazil
Source: USDA Foreign Agricultural Service
(Updated April 10, 2018)

Commodity & Ingredient Hedging 25Trading futures and options carries a risk of loss. Past performance is not indicative of future results. © 2018 Commodity & Ingredient Hedging, LLC. All rights reserved.
0
20,000
40,000
60,000
80,000
100,000
120,000
1981 1983 1985 1987 1989 1991 1993 1995 1997 1999 2001 2003 2005 2007 2009 2011 2013 2015 2017
1,0
00 M
etr
ic T
ons
Brazil Corn Production
Source: USDA Foreign Agricultural Service
(Updated April 10, 2018)

Commodity & Ingredient Hedging 26Trading futures and options carries a risk of loss. Past performance is not indicative of future results. © 2018 Commodity & Ingredient Hedging, LLC. All rights reserved.
0
5,000
10,000
15,000
20,000
25,000
30,000
35,000
40,000
45,000
1981 1983 1985 1987 1989 1991 1993 1995 1997 1999 2001 2003 2005 2007 2009 2011 2013 2015 2017
1,0
00 M
etr
ic T
ons
Argentina Corn Production
Source: USDA Foreign Agricultural Service
(Updated April 10, 2018)
Commodity & Ingredient Hedging 27Trading futures and options carries a risk of loss. Past performance is not indicative of future results. © 2018 Commodity & Ingredient Hedging, LLC. All rights reserved.
0
5,000
10,000
15,000
20,000
25,000
30,000
35,000
40,000
1981 1983 1985 1987 1989 1991 1993 1995 1997 1999 2001 2003 2005 2007 2009 2011 2013 2015 2017
1,0
00 M
etr
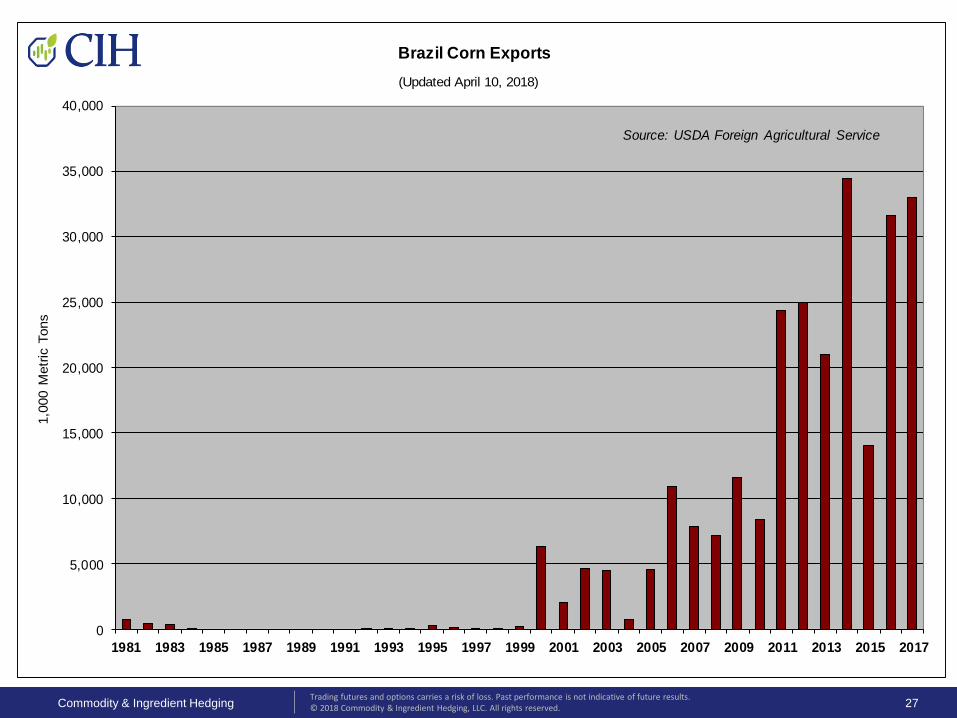
ic T
onsBrazil Corn Exports
Source: USDA Foreign Agricultural Service
(Updated April 10, 2018)

Commodity & Ingredient Hedging 28Trading futures and options carries a risk of loss. Past performance is not indicative of future results. © 2018 Commodity & Ingredient Hedging, LLC. All rights reserved.
0
5,000
10,000
15,000
20,000
25,000
30,000
1981 1983 1985 1987 1989 1991 1993 1995 1997 1999 2001 2003 2005 2007 2009 2011 2013 2015 2017
1,0
00 M
etr
ic T
ons
Argentina Corn Exports
Source: USDA Foreign Agricultural Service
(Updated April 10, 2018)

Commodity & Ingredient Hedging 29Trading futures and options carries a risk of loss. Past performance is not indicative of future results. © 2018 Commodity & Ingredient Hedging, LLC. All rights reserved.
0
10,000
20,000
30,000
40,000
50,000
60,000
70,000
80,000
90,000
1960 1963 1966 1969 1972 1975 1978 1981 1984 1987 1990 1993 1996 1999 2002 2005 2008 2011 2014 2017
1,0
00 M
etr
ic T
onsMajor Corn Importers
E.U. Egypt Southeast Asia
South Korea Mexico Japan
Source: USDA Foreign Agricultural Service
(Updated April 10, 2018)

Análisis Estacional

Commodity & Ingredient Hedging 31Trading futures and options carries a risk of loss. Past performance is not indicative of future results. © 2018 Commodity & Ingredient Hedging, LLC. All rights reserved.

Volatilidad Implícita

Commodity & Ingredient Hedging 33Trading futures and options carries a risk of loss. Past performance is not indicative of future results. © 2018 Commodity & Ingredient Hedging, LLC. All rights reserved.

Commodity & Ingredient Hedging 34Trading futures and options carries a risk of loss. Past performance is not indicative of future results. © 2018 Commodity & Ingredient Hedging, LLC. All rights reserved.
• Diseño y Administración de Coberturas
• Políticas de Coberturas & Procedimientos de Presentación de Informes
• Guías de Modelos Para Tomar Decisiones de Precios
• Evaluación de Riesgo
• Educación y Entrenamiento
There is a risk of loss in futures trading. The information contained in this publication is taken from sources
believed to be reliable, but is not guaranteed by Commodity & Ingredient Hedging, LLC as to accuracy or
completeness, and is intended for purposes of information and education only. Nothing therein should be
considered as a trading recommendation by Commodity & Ingredient Hedging, LLC. The rules and regulations
of the individual exchanges should be consulted as the authoritative source on all contract specifications and
regulations. There is a risk of loss in all futures and options trading. Copyright 2017 Commodity & Ingredient
Hedging, LLC. All rights reserved.
Mike Shawver •VP New Business Development 120 South LaSalle St. Suite 2200Chicago, IL 60603 USA
Tel: 312-596-7300Fax: 312-596-7722
Christian Villamil •Client Service ManagerArturo Zavala •Account ExecutiveCarlos Silva •Account Executive
[email protected] www.cihedging.com