permeability of municipal solid waste in bioreactor
TRANSCRIPT

PERMEABILITY OF MUNICIPAL SOLID WASTE IN BIOREACTOR LANDFILL
WITH DEGRADATION
by
KIRAN KUMAR PENMETHSA
Presented to the Faculty of the Graduate School of
The University of Texas at Arlington in Partial Fulfillment
of the Requirements
for the Degree of
MASTER OF SCIENCE OF CIVIL ENGINEERING
THE UNIVERSITY OF TEXAS AT ARLINGTON
May 2007

ii
ACKNOWLEDGEMENTS
I would like to express my gratitude to Dr Sahadat Hossain, for his valuable guidance,
keen interest, encouragement and care he has taken to bring this thesis into this form. I
would like to thank Dr Laureano Hoyos and Dr Syed R. Qasim for serving in thesis
committee and their valuable suggestion and advice. Special thanks extended to
Mohamed Adil Haque and Dharma Teja Maganti for their co-operation in all stages of
work. I wish to acknowledge the help and encouragement from all my colleagues in
geotechnical laboratory during my masters program, who were directly or indirectly
involved in successful completion of the work.
Finally I would like to express my heartfelt thanks to my parents, brother, sister
and fiancée for their support and encouragement given, to complete my masters
program.
April 18, 2007

iii
ABSTRACT
PERMEABILITY OF MUNICIPAL SOLID WASTE IN BIOREACTOR LANDFILL
WITH DEGREDATION
Publication No. ______
Kiran Kumar Penmethsa, M.S.
The University of Texas at Arlington, 2007
Supervising Professor: Dr. Sahadat Hossain
Bioreactor landfills are operated and controlled to accelerate refuse
decomposition, gas production and biological stabilization of the municipal solid waste.
In favorable environmental conditions biological stabilization of the waste in a
bioreactor landfill is expected to be much faster when compared to the conventional
landfill. The fundamental process used for waste stabilization in bioreactor landfill is
leachate recirculation, which creates a favorable environment for rapid microbial
decomposition of the biodegradable components of solid waste. Therefore, clear
understanding of the mechanism of moisture movement within the solid waste would be
necessary for successful design and operation of the bioreactor landfill.

iv
Permeability is an important parameter during the design of leachate collection
and recirculation system. In the current study an experimental program was designed to
determine the variation of coefficient of permeability of MSW with degradation and to
determine the influence of density and cover soil on permeability of MSW.
MSW samples representing various stages of decomposition were generated in
eight laboratory scale reactors operated under conditions designed to simulate
decomposition in bioreactor landfills. The reactors were destructively sampled at the
end of each phase of degradation based on the reactors methane production rate curve,
PH and volatile organic content. A series of constant head tests were performed on the
representative MSW samples at different stages of decomposition to determine the
variation in permeability with degradation. Tests were repeated at three densities and
two percentages of soil.
Test results indicated a decrease in particle size with degradation which was
mainly due to the breakdown of matrix structure of individual components within
MSW. The coefficient of permeability of MSW decreased from 0.0088 cm/s (Phase I)
to 0.0013 cm/s (Phase IV). There is an overall decrease in the permeability with
increase in density and percentage soil. The trend is the same for the samples at each
phase of degradation. The percentage decrease in permeability is much higher when
there is combined effect of both increase in density and increase in percentage of cover
soil.

v
TABLE OF CONTENTS
ACKNOWLEDGEMENTS....................................................................................... ii ABSTRACT .............................................................................................................. iii LIST OF ILLUSTRATIONS..................................................................................... viii LIST OF TABLES..................................................................................................... xii Chapter Page 1. INTRODUCTION.. ....................................................................................... 1 1.1 Background….......................................................................................... 1 1.2 Problem Statement................................................................................... 3 1.3 Objective ................................................................................................. 3 1.4 Methodology ........................................................................................... 4 1.5 Thesis Organization ................................................................................. 5 2. LITERATURE REVIEW ............................................................................. 6 2.1 Solid Waste Degradation ......................................................................... 6 2.2 Properties of Municipal Solid Waste ...................................................... 7 2.2.1 Engineering Classification of Municipal Solid Waste......................................................... 8 2.2.2 Unit Weight of MSW ............................................................... 9

vi
2.2.3 Particle Size .............................................................................. 11 2.2..4 Specific Gravity ....................................................................... 12 2.2.5 Moisture Content ...................................................................... 13 2.3 Permeability of Municipal Solid Waste in Landfill................................. 15
2.3.1 Factors Influencing Moisture Transport ................................... 16 2.3.2 Permeability with Depth of Landfill......................................... 17
2.4 Previous Studies on Permeability of MSW ............................................. 18
2.4.1 Laboratory Studies on Determination of Permeability................................................. 19 2.4.2 Field Tests ............................................................................... 32
3. EXPERIMENTAL PROGRAM AND PROCEDURE ........................................ 38 3.1 Introduction.............................................................................................. 38 3.2 Sample Preparation ................................................................................. 38 3.3 Experimental Program............................................................................. 42 3.4 Laboratory Tests ...................................................................................... 46 3.4.1 Moisture Content ...................................................................... 46 3.4.2 Specific Gravity ........................................................................ 46 3.4.3 Particle Size Analysis ............................................................... 48 3.4.4 Permeability.............................................................................. 50 4. ANALYSIS OF TEST RESULTS........................................................................ 56 4.1 Introduction.............................................................................................. 56 4.2 Refuse Decomposition Results ................................................................ 56

vii
4.3 Change in Composition with Degradation .............................................. 58 4.4 Geotechnical Testing ............................................................................... 60 4.4.1 Particle Size Analysis ............................................................... 60 4.4.2 Specific Gravity ....................................................................... 65 4.4.3 Moisture Content...................................................................... 67 4.4.4 Permeability ............................................................................. 68 4.4..4.1 Permeability with Degradation ................................... 68 4.4.4.2 Permeability with Voids Ratio ..................................... 70 4.4.4.4 Permeability with Density............................................ 73 4.4.4.5 Effects of Cover Soil.................................................... 77 5. SUMMARY AND CONCLUSIONS ................................................................... 86 REFERENCES .......................................................................................................... 89 BIOGRAPHICAL INFORMATION......................................................................... 94

viii
LIST OF ILLUSTRATIONS
Figure Page
1.1 Schematic diagram of a bioreactor landfill system (Pohland, 1996) ...................................................................... 2
2.1 Observed trend in leachate characteristics (Hossain, 2002) ....................................................................... 7
2.2 Classification system suggested by Landva and Clark (1990)................................................................................. 9
2.3 Grain size distribution using dry and wet testing (Gabr, 1995)..................................................................... 12
2.4 Compaction curve: maximum dry density and optimum moisture content (Gabr, 1995) .................................................. 15 2.5 Permeability with dry density (Blieker, 1993) ................................................ 17 2.6 Variation of permeability with depth (Powrie and Beaven, 1999) ................. 18 2.7 Flexible wall permeameter (Oweis, 1990)....................................................... 24
2.8 Consolidation ring permeameter (Oweis, 1990).............................................. 25 2.9 Consolidometer cell a) Conventional consolidometer b) Large scale consolidometer cell (Durmusoglu et al., 2006) ........................ 27 2.10 Pitsea compression cell (Powrie, 2005) .......................................................... 29 2.11 Vertical permeability against
(a) the density; and (b) drainable porosity, for wastes (reproduced from Powrie et. al., 2005) .......................................... 31
2.12 Permeability and unit weight as measured in insitu test pits (Landva and Clark, 1986) ................................................... 32

ix
2.13 Details of ASTM D 1987 columns
being used for this field investigation (Koerner and Eith, 2005)................................................................................. 36
3.1 Composition of each bag of MSW sample obtained from the transfer station (Haque, 2007) ........................................... 39 3.2 Two sets of bioreactor cells with
and without soil representing the four phases of decomposition (Hossain et al, 2007) ............................................... 41 3.3 Flow diagram representing the samples considered for permeability testing ................................................................. 44 3.4 Grain size distribution of cover soil ................................................................ 45 3.5 Typical sample and test apparatus used; a) Fraction passing US sieve No. 200; b) Volumetric flask; c) Representative sample; d) Pycnometer ................................................................................................ 47 3.6 Hydrometer test (a) Typical fraction passing US sieve 200; (b) Graduated cylinders with hydrometer and test solution ........................................................................... 50 3.7 Step by step procedure for determination of coefficient of permeability. (a) and (b) apparatus and experimental setup;
(c) representative sample; (d), (e) and (f) sample placement and compaction; (g) sample mounted on the stand with porous stone on the top; (h) set up connected to water line (i) maintaining constant head; (j) allowing the flow in sample to stabilize (k) collecting the water drained at a given time; (l) measuring the water collected. .................................................................. 55 4.1 Rate of gas production from reactors at each phase of Decomposition of reactors without soil (Hossain et al, 2007) ........................ 57 4.2 PH of generated leachate from the bioreactor cell (Hossain et al, 2007)................................................................ 58 4.3 Change in weight percentage of degradable
constituents in reactor set 1 (Haque, 2007) .................................................... 59

x
4.4 Change in weight percentage of degradable
constituents in reactor set 2 (Haque, 2007) .................................................... 59
4.5 Disintegration of paper with Degradation (a) Phase I; (b) Phase II;
(c) Phase III; (d) Phase IV ............................................................................. 61 4.6 Particle size distribution of
MSW with degradation from reactor set 1 ..................................................... 62
4.7 Particle size distribution of MSW with degradation from reactor set 2 ..................................................... 63 4.8 Typical sample retained on the corresponding sieve (a) Fraction Retained on 2 – inch US sieve; (b) Sample Passing 1 Inch US sieve and retained on 1/4th –inch US sieve;
(c)Sample Passing US – sieve # 40 and retained on US sieve # 60; (d) Sample Passing (d) Us sieve # 60 and retained on US sieve # 200........................................... 64
4.9 Percentage of particles finer than 75µm (US Sieve No. 200) with degradation ................................................... 65 4.10 Permeability with degradation of the samples from reactor set 1............................................................................................ 69 4.11 Permeability with the percentage of particles passing US Sieve No. 200 ................................................................ 69
4.12 Permeability with voids ratio of MSW at Phase I........................................... 71
4.13 Permeability with voids ratio of MSW at phase II ........................................ 71
4.14 Permeability with voids ratio of MSW at Phase III ........................................ 72
4.15 Permeability with voids ratio of MSW at phase IV ....................................... 72 4.16 Observed trend of permeability with void Ratio............................................. 73 4.17 Permeability with density ............................................................................... 75 4.18 Interpolated values of permeability at a given density ................................... 75

xi
4.19 Comparison of values obtained in the current study and values of vertical hydraulic conductivity with dry density obtained by Powrie and Beaven (2005) ........................................................................ 76 4.20 Change in permeability with percentage soil for phase I................................ 79 4.21 Change in permeability with percentage soil for Phase I at a given density ................................................ 79 4.22 Change in permeability with percentage Soil for phase II .............................. 80 4.23 Change in permeability with percentage soil for phase II at a given density ............................................... 80 4.24 Change in permeability with percentage soil for phase III ............................. 81 4.25 Change in permeability with percentage soil for phase III at a given density.............................................. 81 4.26 Change in permeability with percentage soil for phase IV ............................ 82 4.27 Change in permeability with percentage soil for phase IV at a given density.............................................. 82

xii
LIST OF TABLES
Table Page 2.1 Typical refuse composition (Landva and Clark, 1992)................................... 10 2.2 Refuse fill average unit weights ...................................................................... 11 2.3 Previous studies reporting permeability of MSW...................................................................................... 21 3.1 Typical waste composition in reactor set 1 and their percentage by weight........................................................................ 40 3.2 Typical waste composition in reactor set 1 and their percentage by weight........................................................................ 40
3.3 Experimental program and variables............................................................... 43 3.4 Notations ......................................................................................................... 43
3.5 Properties of cover soil.................................................................................... 43
3.6 Glossary of particle size and mode of compaction for
permeability testing from previous studies ..................................................... 52
4.1 Methane production and sample composition in sampled reactors (Hossain et al, 2007).................................. 57 4.2 Test results of specific gravity of MSW.......................................................... 66 4.3 Typical values of specific gravity from literature ........................................... 66 4.4 Experimental and calculated values of specific gravity of MSW ................................................................................. 67 4.5 Moisture content of MSW............................................................................... 67

xiii
4.6 Percentage decrease in coefficient of permeability with increase in density from 700 kg/m3 to 800 kg/m3 and 700 kg/m3 to 900 kg/m3 at each phase of degradation. .................................. 74 4.7 Percentage decrease in coefficient of permeability for phase I sample with Percentage of soil and density................................................................. 78 4.8 Percentage decrease in coefficient of permeability for phase II sample with Percentage of soil and density................................................................. 78 4.9 Percentage decrease in coefficient of permeability for phase III sample with Percentage of soil and density................................................................. 78 4.10 Percentage decrease in coefficient of permeability for phase IV sample with Percentage of soil and density................................................................. 78

1
CHAPTER 1
INTRODUCTION
1.1 Background
Municipal solid waste (MSW) is either a solid or semisolid waste that includes
household and commercial wastes collected within a given area. According to the US
Environmental Protection Agency (EPA), total generated municipal solid waste (MSW)
production in 2005 was 247.3 million tons in United States. About 55% of the generated
MSW was landfilled.
Landfilling is an engineered method of waste disposal on land with minimal
impact on the surrounding environment. Physical, chemical and biological process
occur within the landfill that convert the waste to leachate and gas (Reinhart, 2002).
Compared to conventional sanitary landfills, bioreactors provide the potential for more
rapid, complete and predictable attenuation of solid waste constituents, enhance gas
recovery and reduce adverse environmental impacts (Pohland, 1997). Figure 1.1 gives
the schematic of a bioreactor landfill system.
The fundamental process used for waste treatment in bioreactor landfill is
leachate recirculation. Recirculation of leachate generated back into the landfills creates

2
a favorable environment for rapid microbial decomposition of the biodegradable solid
waste. The successful implementation of bioreactor landfills depends on the
understanding of the impact of additional moisture on physical and engineering
properties of MSW. Accordingly, the hydraulic properties of wastes and their impact on
the flow of fluids within the waste mass will also be affected.
Figure 1.1 Schematic diagram of a bioreactor landfill system (Pohland, 1996)
In an attempt to understand the hydraulic properties of the municipal solid waste
as a function of degradation, an experimental program was developed to understand the

3
variation in permeability with degradation and the factors that influence the change in
permeability of municipal solid waste.
1.2 Problem Statement
Leachate recirculation plays an important role in successful operation of the
bioreactor landfill. Permeability of MSW in a bioreactor landfill is an important
parameter to determine the recirculation rate and overall performance of landfill It is
also necessary during the design of the containment system. Designing with improper
estimate of permeability might lead to leachate accumulation in some pockets of landfill
resulting in non uniform degradation of the waste thus, causing differential settlement
and structural failure of the landfill components. In order to better estimate the leachate
generated and design of leachate recirculation system, clear understanding of the
permeability of the MSW and the factors influencing the permeability is necessary.
1.3 Objective
Degradation of solid waste effects the physical and engineering properties of
MSW. With degradation, the matrix structure of MSW components break down into
finer particles. The degradation process is expected to increase the percentage of fine
content and density of MSW. Therefore the objective of the current study is to
a. Prepare MSW Samples at different stages of degradation.
b. Determine the permeability of MSW as a function of degree of
degradation.

4
c. Determine the effects of percentage fine content and density on
permeability of MSW, and
d. Determine the effects of Cover Soil on permeability of MSW
1.4 Methodology
Methodology of the current research consisted of a comprehensive literature
review on the permeability of municipal solid waste and factors influencing the
permeability and degradation of the waste, laboratory testing and data analysis.
Municipal solid waste (MSW) at different stages of degradation is generated in a
laboratory scale bioreactors with leachate recirculation under controlled conditions
(Hossain et al, 2007). Initially, moisture content, specific gravity and particle size
distribution were completed.
Constant head permeability tests were performed on the remolded samples from
the reactors to determine the variation of permeability with degradation. The tests were
repeated at three densities to determine the influence of packing density on
permeability. Additionally two percentages of soil, 20% and 30%, were added to the
samples and the tests were carried out at three densities to determine the influence of
percentage cover soil on the permeability.

5
1.5 Thesis Organization
A brief summary of the chapters included in the thesis is presented here:
Chapter 2 presents a brief overview of municipal solid waste, classification, properties,
permeability of MSW, factors influencing permeability and its determination and the
degradation of municipal solid waste.
Chapter 3 describes all the experimental variables and procedures including sample
preparation, particle size analysis, specific gravity and permeability testing.
Chapter 4 presents all the experimental results and comprehensive analysis of test
results from the current research. Comparison of the results with existing literature is
also presented.
Chapter 5 summarizes the main conclusions from the current research and some key
recommendations for future work.

6
CHAPTER 2
LITERATURE REVIEW
2.1 Solid Waste Degradation
The rate of biodegradation of MSW is a function of waste composition, waste
nutrient level, presence of buffering agent, Moisture content and operational practices
(Hossain, 2002). The rate and characteristics of leachate produced and biogas generated
from a landfill vary from one phase of degradation to another and reflect the processes
taking place inside the landfill. Figure 2.1 presents the observed trend of leachate
characteristics with MSW degradation.
Phase I: Aerobic Phase: Transformation from aerobic to anaerobic environment occurs
in this phase. This phenomenon can be observed by the decrease in oxygen trapped
within the pores of the waste. The gas generated constitutes of mainly CO2 and N2
leachate strength is relatively very low in this phase.
Phase II: Anaerobic Acid Phase: In this phase, the PH value decreases which is
accompanied by biomass growth associated with the acidogenic bacteria and rapid
consumption of substrate and nutrients. The gas produced is still mainly CO2 and little
amount of methane. With the transition to phase III, the PH value and methane
production increases. The decomposition is estimated to be in between 15 to 20%

7
Phase III: Accelerated Methane Production Phase: In this phase, intermediate acids are
consumed by methane forming bacteria and converted into methane and carbon dioxide.
There is an increase in methane production and increase in PH value. Most of the
methane production is due to the depletion of accumulated carboxylic acids in earlier
phase.
Phase IV: Decelerated Methane Production Phase: This is the final state of landfill
stabilization, nutrients and available substrate reduces and the biological activity shifts
to relative dormancy. Gas production drops significantly and the leachate strength
remains constant and at much lower concentrations than earlier phases. Decomposition
is about 50 to 70% in this phase depending on the methane production and operating
environment.
Figure 2.1 Observed trend in leachate characteristics (Hossain, 2002)
8
2.2 Properties of Municipal Solid Waste
The major challenge for the geotechnical engineers is to determine the
engineering properties of MSW due to the heterogeneity of the MSW components.
Reliable engineering properties are important to evaluate and predict landfill behavior.
However, determining engineering properties is extremely difficult as mentioned by
Manasslero et al. (1997) due to the following reasons,
1) Difficulties in sampling of MSW which simulate the insitu condition,
2) Lack of generally accepted sampling procedure for geotechnical characterization
of waste material,
3) Change in properties of municipal solid waste with time,
4) Level of training and education of the personnel on site for basic interpretation
and understanding of the measurements, and,
5) Heterogeneity of the MSW within the landfill and its variation with
geographical location.
2.2.1 Engineering Classification of Municipal Solid Waste
Landva and Clark (1990) classified the waste based on biodegradability of the
individual constituents as the rate of decomposition may not be the same for all
materials. The group OP is highly degradable under favorable conditions when
compared to the other group of materials. The other three groups possibly contain void
forming constituents which have a significant influence on hydraulic characteristics of
MSW. Figure 2.2 presents the classification system proposed by Landva and Clark
(1990)

9
Figure 2.2 Classification system suggested by Landva and Clark (1990)
2.2.2 Unit Weight of MSW
MSW is highly heterogeneous material. The factors which influence unit weight
are composition of MSW, placement procedure, type and amount of compaction, depth
of sampling, moisture content and the thickness of daily cover. Table 2.1 illustrates the
range of densities of components of MSW, which play a major role in unit weight of
MSW. The layer thickness and the degree of compaction also influence the unit weight
of the MSW.

10
Table 2.1 Typical refuse composition (Landva and Clark, 1992)
Unit weight kN/m3
Category Percent of total weight
Dry Saturated
Food Waste 5-42 1.0 1.0
Garden refuse 4-20 0.3 0.6
Paper products 20-55 0.4 1.2
Plastic, rubber 2-15 1.1 1.1
Textiles 0-4 0.3 0.6
Wood 0.4-15 0.45 1.0
Metal Products 6-15 6.0 6.0
Glass and ceramics 2-15 2.9 2.9
Ash, rock and dirt 0-15 1.8 2.0
Landva and Clark (1990) proposed a general equation for average unit weight of the
MSW based on unit weight of individual constituent of the waste as
γc =
∑ ×n
ic
i
w
w
1
1
1
γ
( 2.1)
where, c
i
w
w is the weight of constituent i as a fraction of the total weight wc of the
constituent, γi is the unit weight of constituent and n is the number of constituent. The
average unit weight when exposed to moisture is given as
γc’ = γc
∆×+∑
n
i
i
c
i
w
w
1
1γ
γ (2.2)
where, iγ∆ is the increase in unit weight of constituent i.

11
Table 2.2 gives the average unit weights of refuse fill. It can be observed that the
average unit weight of MSW is in the range of 20 to 85 pcf depending on the
compaction effort and composition.
Table 2.2 Refuse fill average unit weights
Unit weight Source Refuse placement conditions
kg/m3 lb/ft3
U.S Department of Navy (1983)
Sanitary landfill Un shredded Poor Compaction Good Compaction Best Compaction Shredded
320 641 961 881
20 40 60 55
Sowers (1968) Sanitary Landfill depending on the compaction effort
481-961 30-60
NSWMA (1985) Municipal Refuse in a landfill after degradation and settlement
705-769 44-49
Landva and Clark (1986)
Refuse Landfill (refuse to soil cover ratio varied from 2:1 to 10:1)
913-1346 57-84
EMCON Associates (1989)
For 6:1 refuse to daily cover soil 737 46
Source: Sharma (2004)
2.2.3 Particle Size
The particle size ranges from soil to large objects such as demolition waste. Life
cycles changes, legislation, seasonal factors, pretreatment and recycling activities result
in a changing waste stream over time (Dixon, 2005). Within the landfill, specimens
from shallower depths indicated coarser particle distribution compared to the samples at
greater depth. The difference in the grain size distribution may be attributed to the

12
higher degree of decomposition of the deeper samples. The above statement can be
supported by experimental results from Gabr (1995). Figure 2.3 shows the particle size
analysis on two specimens at depth 19.2m and 14.4m given by Gabr (1995).
Figure 2.3 Grain size distribution using dry and wet testing (Gabr, 1995)
Dry Mechanical sieving was carried out on one sample from shallow depth, the
sample from 19.2m is washed through series of sieves, and hydrometer analysis was
conducted on fraction passing No. 200 sieve. Test results indicated an increase in
percentage of fines with increase in depth.
2.2.4 Specific Gravity
Landva and Clark (1990) indicated that the determination of the index process of
samples of refuse fill is a long and somewhat complex procedure. Gabr (1995) reported

13
the specific gravity of the MSW from the tests done on the entire particle size
distribution as 2.0 and for the finer fraction (<No. 200 sieve) as 2.4. The lower values of
specific gravity were attributed to the presence of decomposed organic matter. Pelkey
(1997) from the test results on fraction finer than 4.75mm sieve of the sample which
consisted mainly of cover soil with minor amounts of glass and organic material
reported a value of 2.3 to 2.5.
2.2.5 Moisture Content
Beaven and Powrie (1996) defined the moisture content of the waste of the
refuse as the ratio of the mass of water to the mass of dry solids present (WCdry). After
landfilling the moisture content of the waste may increase through absorption of water
by certain components of the waste such as paper, cardboard and textiles.
Zornberg (1999) defined the mechanism of moisture retention within the waste
mass for the purpose of characterizing the distribution of liquids as
1) Moisture within the waste mass (within the intraparticle voids)
2) Moisture between particles (within inter particle voids), held by capillary
stresses
3) Moisture between particles, retained by layers with lower permeability.
The gravimetric moisture content (w) is defined as ratio of the weight of water (ww) to
the weight of solids (ws) ie.,

14
w = s
w
w
w (2.3)
The insitu volumetric moisture content (θ) is the ratio of between volume of water (vw)
to total volume (v) ie.,
θ = v
vv (2.4)
The relationship between gravimetric and volumetric moisture content as given by
Zornberg (1999) is
θ = ww
d ×γ
γ or, θ = ( ) wGn s ⋅⋅−1 (2.5)
where n is the porosity defined as the ratio of volume of voids to total volume.
Kelly (2002) determined the moisture content using the modified standard method
2540-B (APHA 2540-B). The sample was dried at 105oC and moisture content was
determined after cooling the oven dried sample in dessicator as the percentage of weight
loss from the original sample. Gabr (1995) determined the moisture content by oven
drying at 60oC so as to prevent the combustion of volatile matter.
Gabr (1995) estimated the attainable weight density and optimum moisture
content through compaction tests. Figure 2.4 gives the representative average of the
moisture density relationship. The variation is similar to that observed for soils.

15
Figure 2.4 Compaction curve: maximum dry density and optimum moisture content
(Gabr, 1995)
2.3 Permeability of Municipal Solid Waste in Landfill
Permeability is a property of material which permits the passage of any fluid
through its interconnecting pore spaces. The coefficient of permeability in compacted
wastes is
K = Cd2
µ
γ = k µ
γ (2.6)
Where, C is dimensionless constant or shape factor, d is average size of pores, γ
is specific weight of water, and µ dynamic viscosity of water. Intrinsic permeability
(Cd2 = k) is dependent on the property of the solid material, including pore size
distribution, tortuosity, specific surface and porosity (Tchobanoglous, 1993). Typical

16
values of intrinsic permeability in compacted landfill are 10-11 m2 to 10-12 m2 in vertical
direction and 10-10 m2 in horizontal direction. Permeability is normally determined
using field pumping tests or field percolation tests (Pelkey, 1997).
2.3.1 Factors Influencing Moisture Transport
The physical properties that influence the permeability in MSW are density,
particle size, porosity, material type, degree of saturation, stage of decomposition, and
depth within the landfill. Density of the refuse, in turn is dependent on the refuse
composition, the amount and degree of compaction, surface cover, over burden pressure
and moisture content of the refuse during compaction. In addition to the refuse density
the strain in a porous media has a significant influence on the permeability (Blieker,
1995). Figure 2.5 presents the variation of permeability with the dry density of MSW.
During the regular land filling the refuse is compacted in thin lifts leading to
horizontal stratification within the landfill, which might result in greater horizontal
permeability of the waste than the vertical permeability (Powrie and Beaven 1999). In
addition to the particle size, the application of daily and intermediate soil covers leads
to anisotropy and heterogeneity within a landfill (Hyder and Khire 2004). Hence, along
with the physical properties of the solid waste, various other factors like refuse
placement and amount of compaction, properties of cover soil, depth of landfill
contribute to the behavior of MSW in a landfill.
Moisture usually tend to flow through the large pores, leading to flow
channeling. Oweis et al., (1990) found that channeling results in the downward
movement of leachate through interconnected pores at rates faster than the uniform flow

17
under gravity. This variation in flow result in non uniform leachate recirculation
resulting in non uniform biodegradation leading to differential settlements (Hyder and
Khire 2004).
Figure 2.5 Permeability with dry density (Blieker, 1993)
2.3.2 Permeability with Depth of Landfill
In a landfill as depth increases, effective stress on the waste increases. Increase
in the effective stress increases the waste density (Powrie and Beaven, 1999).
Blieker (1993) from his study on Brock west landfill indicated difficulties in drilling
with the increase in depth due to the probable increase in density which supports the

18
assumption of increase in density with depth. Figure 2.6 presents the decrease in
permeability with the increase in depth due to the possible increase in density.
Figure 2.6 Variation of permeability with depth (Powrie and Beaven, 1999)
2.4 Previous Studies on Permeability of MSW
Permeability of the MSW can be determined by laboratory tests and field tests.
A brief overview of previous studies on permeability of MSW on undisturbed samples
and reconstituted samples is presented in this section. Table 2.3 gives a brief summary
of test results of permeability from previous researchers. Values of permeability
obtained so far from the literature did not consider the stage of decomposition.

19
2.4.1 Laboratory Studies on Determination of Permeability
2.4.1.1 Constant and falling head tests
Fungaroli and Steiner (1979) were one of the pioneers to study the internal
behavior of sanitary landfills under laboratory and field conditions (Shank, 1993). As a
part of their study on shredded MSW, the saturated coefficient of permeability (ks) was
measured as a function of average particle size and density. The study concluded that
the ks was inversely proportional to density. For shredded MSW, the ks ranged from 2.0
x 10-4 cm/s at to 1.1 x 10⁻² cm/s at densities 737 lb/ft3 to 504 lb/ft3 respectively. The
variation was attributed to the sample size, affect of permeameter sidewalls, and refuse
characteristics.
Gabr (1995) performed constant and falling head tests on triaxial compression
specimens by measuring the flow rates through the saturated specimens before the
consolidation phase. The observed values of the permeability from his testing were in
the order of 10-7 to 10-5 m/s. No particular trend was observed in the values of
permeability either with the hydraulic gradient or the unit weight which might be due to
the heterogeneity of the sample. Chen et al., (1995) studied the variation in
permeability with density of the samples and hydraulic gradient. Constant head tests
were conducted on test columns at densities 160 kg/m3, 320 kg/m3 and 480 kg/m3 with
hydraulic gradient from 2 m/m - 4 m/m. The permeability varied from 9.6 x 10⁻² cm/s
to 4.7x 10⁻⁵ cm/s when compacted to densities 160 to 480 kg/m3 respectively and no
significant influence was observed due to the variation in hydraulic gradient.

20
Bleiker (1993) used fixed ring apparatus to study the relation between the
permeability and density of the refuse samples from Keele Valley Landfill on Toronto,
Ontario. Canada A small portion of sample was placed in a fixed brass ring having a
diameter 63mm and a thickness of 19mm and the effective stress was increased causing
compression. The permeability at each effective stress level was determined at the end
of 90 minutes by applying the head at one side of the sample and recording the volume
of water that passed through the sample on the other end at a given period of time. Tests
results indicated a decrease in permeability with decrease in porosity, increase in
density and effective stress. The change in permeability were over several orders (10-6
to 10-8 m/s) of magnitude and suggest significant changes in permeability with change
in depth.

21
Table 2.3 Previous studies reporting permeability of MSW
Source Permeability Unit weight t/m3
Comments Test
Fungaroli and Steiner (1979)* 10-4 to 10-2 cm/s Constant Head
Krofiatis et al., (1984) 8 x 10⁻³ to 1.3 x10⁻² cm/s Refuse was six months old collected from local landfill
Constant Head
Noble and Arnold (1991)* 8.4 x 10-5 to 6.6 x10⁻⁴ cm/s Constant Head
Bleiker et al., (1993) 1.0 x 10⁻⁶ cm/s 1.58 x 10⁻⁵ cm/s 6.3 x 10⁻⁶ cm/s 3.98 x 10⁻⁵ cm/s 6.3 x 10⁻⁶ cm/s 6.3 x 10⁻⁶ cm/s
22.9 m 19.8 m 24.4 m 22.9 m 27.4 m 30.5 m
<10 years <10 years <10 years <10 years <10 years <5 years
Falling Head test on core samples
Chen and Chynoweth (1995) 4.7 x 10⁻⁵ to 9.6 x10⁻² cm/s Refuse derived fuel from National Ecology of Baltimore, MD containing mostly paper and plastic.
Constant Head
Landva and Clark (1998) 2 x 10⁻⁶ to 2 x10⁻³ cm/s (vertical) 4 x 10⁻⁵ to 1 x10⁻³ cm/s (Horizontal)
Constant Head
Powrie and Beaven (1999) 1.5 x 10⁻⁴ to 3.4 x10⁻⁵ cm/s 2.7 x 10⁻⁶ to 3.7 x10⁻⁸ cm/s
390 kg/m3
720 kg/m3
Crude house hold waste obtained directly from the tipping face of the landfill.(approximately six months of testing)
Constant Head
Townsend et al., (1995) * 3 x 10-6 to 4 x 10⁻⁶ cm/s 1-3 years Zaslasky Wetting front
*Shank(1993)
21

22
Table 2.3 - continued
Source Permeability Unit weight t/m3
Comments Test
Koerner and Eith (2005)
1.2 × 10⁻² cm/s to 6.9 × 10⁻² cm/s (Initial test results )
12 columns of 100 mm PVC flow columns. (0-3years) experiments under progress.
Flow columns
Gabr (1995) 10-3 to 10-5 cm/s 7.4 to 8.2 kN/m3
15 to 30 years old sample recovered from auger cuttings.
Constant head and Falling head tests in triaxial compression cells
Durmusoglu (2006) 4.7 x 10⁻⁴ to 1.24 x 10⁻² cm/s Samples 2.5 to 3.0 m deep from Rock Prairie Road Landfill in Brazos County, Texas Approximately 10 years old sample
Falling head test, In small and large scale consolidometer
Ettala (1987) 5.9 x 10⁻⁷ to 2.5 x 10⁻⁶ cm/s 2.1 -2.5 x 10⁻⁵cm/s
Strong compaction Slight compaction
13 infiltration measurements Modified double cylinder infiltrometer and pumping tests.
Shank (1993) 6.7 x 10⁻⁵ to 9.8 x 10⁻⁴ cm/s Approximately 20 years Slug test
Jang et al., (2002) 2.91 x 10⁻⁴ cm/s
1.07 x 10⁻³ cm/s
2.95 x 10⁻³ cm/s
1.2 1.0 0.8
Tests were conducted in a Modified Tempe cell at three compacted densities
Constant Head
Jain (2006) 6.11 x 10⁻⁵ to 5.4 x10⁻⁶ cm/s 2.34 x 10⁻⁵ to 5.6 x10⁻⁶ cm/s
1.9 x 10⁻⁵ to 7.4 x10⁻⁶ cm/s
8 locations @ 3-6m 10 locations @ 6-12m 5 location @ 12-18m
Borehole Permeameter test
Moore (1997) 3.9 x 10⁻⁴ cm/s
Permeability in test cell with leachate recirculation
Empirical method
22

23
Table 2.3 - continued
Source Permeability Unit weight t/m3
Comments Test
Korman et. al. (1987) 2 x 10⁻⁵ to 1 x 10⁻⁶ (FW) 5 x 10⁻⁶ to 3 x 10⁻⁷(FW) 2 x 10⁻⁶ to 5 x 10⁻⁷(LW) 1 x 10⁻⁷ to 4 x 10⁻⁷(LW)
Depth 26.5-26.9 ft 41.5 ft
Tests were conducted on both fresh waste (FW) and landfilled waste(LW). Two regid wall permeability tests were performed on fresh waste and two flexible wall permeability tests were conducted on landfilled waste
Flexible wall and regid wall permeability tests
Beaven and Powrie (1995)
1.7 x 10⁻⁴ cm/s 2 x 10⁻² to 3.5 x10⁻⁷ cm/s 1 x10⁻⁷ cm/s 3.5 x 10⁻³ to 1 x10⁻⁵ cm/s
0.75 – 1.36 0.62 – 0.97 0.32 – 0.95 0.5 – 1.18
DM2 PV1 PV2 DM3 Where, DM is crude domestic refuse obtained from tipping face of landfill and PV is Processed (pulverized) refuse passing 150mm filter.
Large scale compression cell
Landva and Clark (1986) 2.6 x 10⁻² cm/s 1.6 x10⁻² cm/s 3.9 x 10⁻² cm/s 3.0 x 10⁻³ cm/s 1.1 x 10⁻² cm/s
1.3 x 10⁻² cm/s
1 x 10⁻³ cm/s 8 x 10⁻² cm/s
5 x 10⁻³ cm/s
1 x 10⁻² cm/s
1.1 x 10⁻² cm/s
1.3 x 10⁻² cm/s
12.5 kN/m3
14.5 kN/m3 13.0 kN/m3 11.1 kN/m3 12.9 kN/m3 10.0 kN/m3 13.6 kN/m3 11.4 kN/m3 10.7 kN/m3 12.3 kN/m3 13.1 kN/m3 10.5 kN/m3
Calgary Edmonton, Alberta Mississauga Waterloo
Insitu test pits
23

24
2.4.1.2 Flexible wall Cell
A flexible wall permeability cell is similar to a triaxial cell as shown in Figure 2.7.
The specimen diameter ranges from 38 mm to 152 mm. The height of the specimen is kept
small, so as to reduce the time of testing. Specimen is enclosed in a flexible latex
membrane with porous discs at both the ends. The membranes are sealed to the bottom
pedestal and top cap. The soil specimen is saturated using back pressure, until the value of
B (Skempton pore pressure parameter) is close to 0.95 and is maintained during the
permeability testing (Oweis, 1990).
Figure 2.7 Flexible wall permeameter (Oweis, 1990)
Korman et al., (1987) determined the saturated coefficient of permeability of fresh
waste using flexible wall permeability test and of land filled waste on rigid wall
permeability test. Fresh wastes are reconstituted to the field density while the land filled

25
samples were tested at the sampled diameter and density. The values of permeability
obtained are in the order of 2 x 10⁻⁵ cm/s to 3 x 10⁻⁷ cm/s for fresh wastes and in the order
of 2 x 10⁻⁶ cm/s to 5 x 10⁻⁷ cm/s for land filled wastes.
2.4.1.3 Oedometer Cell Permeameter
A fixed ring consolidation permeameter cell is shown in Figure 2.8. The soil
specimen is placed in a ring with a diameter of 40 – 100mm and a eight of up to 100mm.
The consolidometer is placed in a loading frame and the desired axial load is applied. The
air is flushed out from the bottom. One of the two outlets at the two outlets at the bottom is
closed and a head is applied through the other outlet. The head is applied using a stand
pipe of a small diameter ‘a’. A constant head is maintained at the exit. The permeability is
determined using the equation 2.4, where t is the total time of flow, h1 is the head at the
beginning of the flow and h2 at the end of flow.
Figure 2.8 Consolidation ring permeameter (Oweis, 1990)

26
2
1lnh
h
At
aLk = (2.6)
for soils with low permeability, additional pressure ‘dp’ may be applied to reduce the test
duration. The permeability is then given by the following equation.
w
w
dph
dph
At
aLk
γ
γ
/
/ln
2
1
+
+= (2.7)
Durmusoglu (2006) conducted a series of laboratory test to evaluate permeability
and compression characters of MSW samples on small and large scale consolidation
apparatus as shown in Figure 2.9. The small scale conslolidometer used in this study was a
conventional apparatus described in ASTM-D2435-90, formed by a stainless steel ring of
6.35cm inner diameter and 2.54 cm deep. The cell was subjected to vertical loads by means
of 8.9 kN capacity load frame. The large scale consolidometer consisted of a 71.12 cm
diameter and 55.88 cm high stain less steel cylinder of 5.10 cm thickness with a circular
load plate on the top. Several 0.3 cm diameter holes were drilled to necessitate for
drainage. The set up was mounted on plate of larger diameter where a seal was attached for
avoiding the liquid leakage. The lift had a capacity of applying loads upto 2,500 kN for
long periods of time and permitted application of load increments as required.

27
a) b)
Figure 2.9 Consolidometer cell a) Conventional consolidometer b) Large scale consolidometer cell (Durmusoglu et al., 2006)
The MSW samples were sieved to exclude particles larger than 0.5cm and
compacted at standard proctor compactive effort before it was placed into the cell. The
large scale consolidometer was filled with the refuse having particles smaller than 2.0 cm.
The height of the specimen within the ring ranges from 19.7 cm to 24.1 cm. Durmusoglu
(2006) maintained the diameter to height ratios in between 2.95 to 3.61 which were greater
than 2.5. Falling head permeability tests were conducted at the field capacity at the end of
each load increment. Results were in agreement with the previous works and observed
permeability’s are in the order of 4.7 x 10⁻⁶ to 1.24 x 10⁻⁴ m/s. The results from the small
scale tests were comparable to large scale setup. Durmusoglu (2006) from the compression
test results postulated that a conventional small scale consolidometer can be used for
testing even though the samples are more disturbed.

28
Pelkey (1997) determined the vertical and horizontal permeability of the sample
approximately five years old obtained from the test pits 6.4m deep at Spruce Lake landfill,
Saint John, NB. Canada. Tests were conducted to determine the variation in permeability
with vertical stress. Pelkey used a 44.7cm diameter and 54 cm deep consolidometer cell to
determine the vertical permeability. Stand pipes were positioned around the
consolidometer to measure the pressure heads within the samples. The sample was placed
in 6-8 lifts compacted using 5.6 kg hammer that was dropped from a height of 20 to 30 cm.
Horizontal coefficient of permeability(kh) test apparatus consists of a 769 mm diameter by
450 mm deep consolidometer, a constant pressure system, a constant head container and
two stand pipes placed on the top to monitor the heads in the system. The permeability was
determined using a flownet developed for radial flow. Test results concluded that the
anisotropy of the waste has strong effect on the permeability and the ratio of horizontal to
vertical coefficients of permeability for the refuse ranged from 0.5 to 1.0 for varying
vertical stress. The obtained vertical coefficient of permeability is in the order of 10-3 at 55
kPa and 10-4 cm/s at 289 kPa.
2.4.1.4 Pitsea Compression Cell
Powrie and Beavan (1999) conducted a constant head flow test in a Pitsea
compression cell to determine the permeability of crude unprocessed household waste.
Pitsea cell is a purpose built steel cell as shown in Figure 2.10, accommodating a sample of
waste 2m in diameter and upto a 3 m height (six times that of conventional oedometer)
which is necessary to get a representative results from highly heterogeneous samples.

29
Figure 2.10 Pitsea compression cell (Powrie, 2005)
The cylinder was suspended vertically within a steel support frame. The feet of the
support frame were mounted on load cells, enabling to monitor the weight of the contents
of the cell continuously. Test setup had a capability of applying overburden pressures up to
600 kpa in five to six steps representing different depths of the landfill of up to 60 m.
Powrie and Beaven (1999) gives a detailed description of the test setup. The refuse was
placed in five layers compressed to the desired density of 0.5 Mg/m3 to a depth of 2.5 m.
The Upper platen was lowered onto the sample and an initial load was applied using the
hydraulic system and the compression of refuse was monitored with time. The applied load
was maintained until the compression ceases (1% in 24hrs) which normally took 2-7 days.
The total vertical stresses indicated by the pressure cells installed at various depths
within the refuse were also recorded. The waste was saturated by allowing water flow into

30
the sample through the lower platen. The drainable porosity of the saturated waste was
measured at constant vertical load from the volume of leachate drained per unit volume.
Powrie and Beaven (1999) from their test results of constant head flow test on
crude unprocessed household in a large scale compression cell concluded that the
coefficient of permeability decreases with the increase in the effective stress from 10-3 m/s
to 10-7 m/s, when the stress increases from 50kPa to 850 kPa respectively. Powrie and
Beaven (1999) gave an expression for variation of k with effective stress as given below.
Figure 2.11 gives the variation in vertical permeability against the drainable porosity and
density for wastes reported by Powrie (2005).
k (m/s) = 2.1(σv’)-2.71 (2.8)
where, σv’ is the effective stress in kPa and k is the coefficient of permeability in m/s.

31
(a)
(b)
Figure. 2.11 Vertical permeability against (a) the density; and (b) drainable porosity, for wastes (reproduced from Powrie et. al., 2005)

32
2.4.2 Field tests
2.4.2.1 Test pits
Landva and Clark (1986) reported in-situ permeability results obtained from the
large scale percolation tests in the pits excavated for unit weight measurements during a
field investigation program on waste fills across Canada.
The permeability estimated on the basis of the rate of water level recession and
flow nets applicable to any particular level. The permeability reported is in the order of 1 ×
10-5 to 39 × 10-5 cm/s. Permeability measured in test pits in Calgary, Edmonton,
Mississauga and Waterloo in Canada with their respective unit weights are given in Figure
2.12
Figure 2.12 Permeability and unit weight as measured in insitu test pits. (Landva and Clark, 1986)

33
2.4.2.2 Borehole tests
The borehole permeameter test is one of the several methods for estimating
saturated coefficient of permeability in situ in the vadose zone. Jain et al., (2006) estimated
the in situ saturated permeability of MSW using the bore hole permeameter test at 23
locations in a 4-hectare full scale landfill site Florida, USA. Test area consisted of
relatively new and un-degraded waste. The site was equipped with large number of vertical
wells and consisted of relatively new and un-degraded wastes. The liquids added consisted
of leachate from the landfill cell where the experiment was conducted and from adjacent
landfill units. Liquid was added to wells until the water level or pressure stabilized; the
flow rate added and the pressure at the bottom of wells are continuously monitored. A
constant head of water is maintained in a bore hole excavated into unsaturated media until
a steady infiltration rate is reached. The model proposed by Zangar (1953) was selected to
determine permeability. Zangar’s formula for determination of saturated permeability
assuming a case with deep water Table is given as.
ks = HrC
Q
wu
Cu =
−
−
−
H
A
r
AHr
AAH
w
w
1
2
sinh
)2(2π (2.9)
Where, rw is radius of the borehole, A is length of casing (screened section), H is
the pressure head acting at the bottom of the bore hole; Q is the flow rate at steady state
and ks is field saturated permeability.

34
From the investigation, Jain (2006) estimated the permeability at 23 locations were
in the range of 5.4 × 10⁻⁶ cm/s to 6.9 × 10⁻⁵ cm/s. The range of permeability was relatively
lower than the previous studies. The average permeability of the waste was observed to
decrease with the depth of the landfill. The ratio of the permeability of the waste estimated
with air as the fluid and water as fluid was found to be in the range of 220 to 3500, the
reason for this might be due to the presence of entrapped gas phase.
2.4.2.3 Pumping tests
Oweis (1990) reported the values of permeability from pumping test at a municipal
landfill in northern New Jersey. The landfill contains a leachate mound with a maximum
saturated thickness of about 35 feet. The test well consisted a 6 inch. diameter stainless
steel casing and screen assembly installed in a 20 inch. diameter bore hole using cable tool
method of well construction. Three additional observation wells were installed of 2-in.
diameter stainless steel casing and 90 ft of 10 - slot well screen. Piezometers were installed
to measure the fluid levels immediately outside well screen. Results showed a non linear
relation between the discharge and the drawdown suggesting turbulent conditions. The
average transmissivity of the refuse was observed to be 600 gpd/ft. The average storage
coefficient value was about 0.05. Considering an average saturated thickness of 30 ft the
calculated hydraulic conductivity was 10-3 cm/s
Ettla (1987) measured the hydraulic infiltration and hydraulic conductivity at two
different landfills which entirely differ in their disposal technology. Neither of the landfills
have leachate discharge. During maximum runoff the leachate was pumped from basin to

35
the receiving waters. The calculation of hydraulic conductivity was based on the volume of
the basin, leachate discharge and levels of the water Table in refuse. The saturated
hydraulic conductivity of landfill was determined by pumping the leachate at the rate of
150 – 200 m3/d from a bore hole and checking the water Table in observation tubes around
the borehole.
The measured hydraulic conductivity in Holla landfill was in the order of 10-5 cm/s
and in Lahti landfill in the order of 10-7 to 10-6 cm/s. The hydraulic conductivity differed
significantly between the two landfills. The variation of hydraulic conductivity was
attributed to the presence of parched water in Lahti Landfill and the variation in degree of
compaction.
2.4.2.4 Flow columns
Koerner and Eith (2005) conducted a field investigation to obtain the residual
permeability of 12 flow columns over time. The experimental set up confirms to ASTM D
1987 consisting of PVC flow column that houses the waste, soil/geotextile, and gravel
supported by stain less steel screen as shown in Figure 2.13. The upper and lower tubes
are joined to the coupler by containment rings. Normal pressure to the degraded waste on
the top of the column with a spring and a reaction bar and the test is conducted in
accordance to ASTM D 2434 “Standard Test Method for Permeability of Granular Soil
(Constant Head)”. The flow columns were connected to the leachate circulation system on
a monthly interval and replaced back in drums of heated leachate for incubation until the
next permeability reading. Figure 2.14 shows the Details of ASTM 1987 Columns being

36
used for the investigation. The investigation is still in progress and the initial test results
after one month gave a permeability in the order of 1.2 × 10⁻² cm/s to 6.9 × 10⁻² cm/s.
Figure 2.13 Details of ASTM D 1987 columns being used for this field investigation (Koerner and Eith, 2005)
2.4.2.5 Horizontal Injection Lines
Townsend (1995) studied the leachate recycle at solid waste landfill using
horizontal injection at the Alachua county southwest landfill in north central Florida. The
27-acre landfill was lined and equipped with leachate collection and removal system.
Tests conducted in the same landfill using infiltration pond estimated the values of
vertical permeability, ky as 3 x 10⁻⁶ to 4 x 10⁻⁶ cm/s. The waste compaction was observed
to be greater than the density in leachate injection area. The values of permeability
estimated were found to be more than one order of magnitude than the previous estimates
of ky indicating a definite anisotropic conditions. The ratio of estimated vertical to
horizontal permeability is in the order of 1 to 0.01.

37
2.4.2.6 Slug tests
The Slug Test Method was used to evaluate the permeability of an aquifer. Shank
(1993) conducted slug tests in the existing gas vents of the municipal landfill of Alachua
County, Florida. The Alachua county southwest landfill is located on a 232 – acre site,
southwest of Gainesville; FL. Landfill operations at the site began in late 1973. The
landfill site comprised of a number of separate landfill units. Two closed unlined units and
one lined unit. 35 gas vents were installed in 24-inch diameter borehole with depths
ranging from 28 to 35 feet, with well casings of 4 inch and 6 inch. sections. A total of 7
PVC slug tests , 3 pump slug tests were conducted. Two types of tests were conducted, the
conventional method with a volumetric slug and a new method with removal of slug by
means of submersible pump. The results from PVC slug test ranged from 8.6 x 10⁻⁴ to 1.5 x
10-2 cm/s with a geometric mean of 1.2 x 10⁻³ cm/s and a standard deviation of 3.0 x 10⁻³
cm/s. The pump slug tests yielded ks values ranged from 6.7 x 10⁻⁵ to 9.8x 10⁻⁴ cm/s.
Bouwer and Rice slug test analysis method was used in determination of permeability.
Literature available so far does not indicate the variation in permeability as a
function of decomposition of the municipal solid waste. In the current study an attempt is
made to determine the variation of permeability of MSW with degradation. Test
methodology adopted and results are discussed in the following sections.
38
CHAPTER 3
EXPERIMENTAL PROGRAM AND PROCEDURE
3.1 Introduction
This chapter briefs the sample preparation, laboratory tests and procedures and
experimental program used in the current work. The MSW samples used in the current
research was collected in October 2005 from a transfer station in Burlington, Texas. The
sample was mixed thoroughly and standard collection procedure was followed for
obtaining a representative sample. The sample was transferred to the lab in 14 bags and
later on physical characterization of the waste, including visual inspection of refuse
composition, weight percentage of each constituent were determined. Figure 3.1 gives the
weight percentage of each bag.
3.2 Sample Preparation
Municipal solid waste (MSW) at different stages of degradation was generated in
eight laboratory scale bioreactors with leachate recirculation and under controlled
conditions for ongoing research by Haque (2007). Two sets of bioreactor cells were built in
the laboratory. Each set of reactor consists of four 16-gallon reactors to generate samples at
different stages of decomposition. Composition of each reactor and their weight percentage

39
is presented in Table 3.1 and Table 3.2. The first set of reactors were set up without soil,
and the second set of reactors with soil to simulate the intermediate covers.
0 20 40 60 80 100
Textile
Paper
Plastic
Food
Plastic Cups
Tin
Others
Percentage
Bag 14
Bag 13
Bag 12
Bag 11
Bag 10
Bag 9
Bag 8
Bag 7
Bag 6
Bag 5
Bag 4
Bag 3
Bag 2
Bag 1
Figure 3.1 Composition of each bag of MSW sample obtained from the transfer station (Haque, 2007)
Prior filling the reactors, glass, tin and hard plastic bottles were removed. Each
sample is thoroughly mixed and the reactors were filled in equally distributed layers and
hand compacting it to get a uniform compaction. At the end of each phase, the reactors
were dismantled and destructively sampled. The stage of decomposition was determined
from the gas composition, and by the volatile solids composition (Haque, 2007). Gas was
collected in five-layer gas bags and the volume was measured by pumping it out through a

40
standard pump which pumps at a rate of 0.5 L/min. Methane gas concentration was
measured using a gas chromatograph equipped with a thermal conductivity detector.
Table 3.1 Typical waste composition in each reactor set 1 and their percentage by weight
Reactor Material
1-1 1-2 1-3 1-4
Textile 12 0 6.4 4.2
Plastic 17.0 15.2 12.2 13.9
Paper 51 63.7 66.8 57.4
Food 19.6 21.1 14.6 24.5
Source: Haque (2007)
Table 3.2 Typical waste composition in each reactor set 2 and their percentage by weight
Reactor Material
2-1 2-2 2-3 2-4
Textile 1.9 14.6 3.7 0.0
Plastic 7.0 7.0 4.0 9.7
Paper 50.3 50.0 50.1 61.7
Food 31.7 18.7 4.0 19.1
Soil 9.1 9.8 9.2 9.5
Source: Haque (2007)
Quantity of moisture required to bring the sample to the optimum moisture is
calculated based on the initial moisture content and wet weight of the sample filled in the
reactor. Based on the initial moisture content, water was added to adjust the moisture
content to 55% (wet weight basis), and to generate a leachate of 1.5L. Reactors were
operated under conditions designed to simulate a bioreactor including: (a) the addition of
sufficient moisture to induce leachate production; (b) leachate recirculation; and (c) the
addition of an inoculum of anerobically digested sewage sludge. The leachate was

41
neutralized with potassium hydroxide and sulfuric acid for acidic and alkaline conditions
as necessary and recycled 4 days a week to accelerate the decomposition in laboratory. All
reactors were maintained at a room temperature of 22 – 29 ˚C.
The volatile solids were determined in accordance with Standard Methods APHA
Method 2440-E (Hossain et al, 2007). Samples were dried at 105˚C to a constant weight
and held in a desiccator. Approximately 100 grams of the dried sample were then placed in
ceramic dish and inserted into a muffle furnace at 550°C for 20 minutes. Samples were
removed and allowed to cool in a desiccators to a constant weight. The percent weight loss
from ignition yielded the total amount of volatile matter.
Figure 3.2 Two sets of bioreactor cells with and without soil representing the four phases of decomposition (Hossain et al, 2007).

42
3.3 Experimental program
An experimental program was designed to determine the permeability with degradation
of the MSW. Tests were also conducted to determine the influence of density and the
percentage of cover soil on permeability of the municipal solid waste. Tests were
conducted on samples obtained from the reactors at each stage of decomposition to
determine the variation in
• Particle size distribution with degradation
• Permeability with degradation
• Permeability with the change in finer fraction
• Permeability with change in density.
• Permeability with percentage of cover soil
Table 3.3 gives the notations followed and Table 3.4 gives the testing program and
number of tests carried out in the current research.
Based on the literature review the unit weight of MSW ranges between 20pcf to
80pcf depending on the compaction effort and percentage of soil. Therefore for the current
study, tests were proposed to be performed at 40pcf (640.73 kg/m3), 50 pcf (800.92
kg/m3) and 60 pcf (961.10 kg/m3). During landfilling, soils are used as daily cover. The
percentage of soil in MSW varies between 15 to 30%. To consider the effects of daily
cover soil on the permeability of MSW, a second set of tests were planned to be performed
at 20% and 30% of soil. The grain size distribution of the cover soil is presented in Figure
3.4., and the properties of the soil used are given in Table 3.5

43
Table 3.3 Experimental program and variables
Test Material Variables Number of tests
Cover Soil 1 Particle Size Analysis MSW 8
Specific Gravity MSW Entire sample Fraction passing US sieve No.200
12
4
Moisture Content MSW 12
MSW 4 phases and 3 densities
12
MSWRS1+20% soil 4 phases and 3 densities
12
MSWRS2 + 20% soil
4 phases and 3 densities
12
MSWRS1 + 30% soil
4 phases and 3 densities
12
Permeability
MSWRS2 + 30% soil
4 phases and 3 densities
12
Table 3.4 Notations
Notation Explanation
RS1 Reactor Set 1 without soil
RS2 Reactor Set 2 with soil
RSx-n Reactor set ‘x’ with n% of soil. Where x=1 or 2, and n= 0, 20 and 30
Table 3.5 Properties of Cover Soil
Soil Classification SW-SM Well graded sand
with silt and gravel
Percentage of particles passing US sieve 200 9.52
Specific Gravity 2.54
Coefficient of permeability (cm/s) 0.00081
Density (kg/m3) 1742

44
Figure 3.3 Flow diagram representing the samples considered for permeability testing
44

45
Figure 3.4 Grain size distribution of cover soil
45

46
3.4 Laboratory Tests
Determination of engineering properties of MSW is difficult due to the heterogeneity
and vide variety of particles in MSW. Landva and Clark (1990) concluded that
geotechnical testing of these complex material is feasible as long as it is recognized that
application of conventional testing methods and analysis may not be applicable. The
following sections present a brief description of different test procedures adopted in the
current study.
3.4.1 Moisture Content
Moisture content of the samples were determined according to standard method
ASTM D 2974 – 00 and APHA 2540 - B (Kelly, 2002). Samples were oven dried at a
temperature of 105oC and moisture contents were determined by by both dry weight basis
and wet weight basis.
3.4.2 Specific Gravity
The specific gravity tests were conducted in accordance with ASTM test method
ASTM D 854-02 and ASTM D 5057-90. Three tests were done on representative samples
for each phase of degradation and an average value was reported. Additionally, tests were
also conducted on fraction passing through US Sieve No. 200. The specific gravity of the
specimen was determined by the following equation and temperature correction is
applied (ASTM D 854-00).
Gs = ( )
( ) ( )s
s
www
w
−− 21
(3.1)
Where ws = weight of oven dried sample, w1= weight of pycnometer + water and w2 =
weight of pycnometer + sample + water

47
Figure 3.5 shows the typical sample and test apparatus used for determination of
specific gravity. The samples for determination of specific gravity for the fraction passing
US sieve No. 200 is obtained as given section 3.3.4.1.
Figure 3.5 Typical sample and apparatus used; a) Fraction passing US sieve No. 200; b) Volumetric flask; c) Representative sample; d) Pycnometer

48
3.4.3 Particle Size Analysis
Considering the vide range of particle size and the nature of the waste, wet sieve
analysis was conducted. Wet sieving is preferred as the particles adhere when dried and
conventional dry analysis may not give accurate results. For fraction passing US sieve
No. 200 hydrometer analysis is adopted. The samples were prepared following the test
procedure given in ASTM D2217 and the wet sieve analysis was conducted in
accordance with ASTM D422-63. The test procedure is carried out in three stages.
1. Determination of finer fraction passing US sieve No. 200
2. Mechanical wet sieve analysis on fraction retained on US sieve No. 200
3. Sedimentation analysis of the fraction passing US sieve No. 200
3.4.3.1 Determination of finer fraction passing US sieve No 200.
Oven dried samples weighing approximately 0.25 kg were quartered and washed
through US sieve no. 200 and the sample retained is further analyzed by wet sieving.
From the percentage of mass retained, the percentage of finer fraction is calculated as
given below (ASTM D 1140-00).
f = 100×t
p
w
w (3.2)
where wp= weight of sample passing through US sieve No. 200, ie., wt-wr and wt
and wr are the total weight of sample taken and weight of sample retained on US sieve
No. 200. the wash water thus obtained is carefully preserved for determination of specific
gravity and hydrometer analysis.

49
3.4.3.2 Mechanical Analysis
The sample retained on #200 sieve is further passed trough a series of sieves (1-
in, 3/4-in, 3/8-in No.4, No.10, No. 20, No. 40, No. 60, No. 100 and No. 200). The
particles retained on each sieve were collected, dried and weighed. The percentage
passing through each sieve is calculated by dividing the weight of sample retained on
each sieve to the total weight of the sample. The gradation of the portion passing through
US sieve 200 is obtained by hydrometer analysis of the wash water from the wet sieve
analysis. Tests were carried out on two representative samples of each phase and the
average grain size distribution was plotted.
3.4.3.3 Hydrometer analysis
The water collected during wet sieving is oven dried to obtain approximately
750ml of solution containing the fraction passing through US sieve No 200. The solution
is further mixed with dispersing agent solution prepared to be at concentration of 40g/l.
The obtained mixture was stirred thoroughly and the solution was transferred to the
sedimentation cylinder. The cylinder is made up to 1000ml and then placed at a location
where minimal disturbance is expected. The test is carried out in accordance with ASTM
test method for particle size analysis of soils (ASTM D 422-63)

50
Figure 3.6 Hydrometer test (a) Typical fraction passing US sieve No. 200; (b) Graduated cylinders with hydrometer and test solution
3.4.4 Permeability
The effects of MSW decomposition on permeability were determined using the constant
head permeability method in the laboratory. The coefficient of permeability of the MSW
samples were measured at different phases of decomposition and densities. Tests were
also conducted to determine the influence of percentage of finer fraction and density on
the permeability of MSW. The MSW particles are much thinner and flatter than the soil
particles and the flow in waste might be through inter particle and intra particle voids,
hence, the general principles applicable for soils may not be applicable to MSW.
However, due to the lack of standard test procedure for determination of permeability of
municipal solid waste, the standard test procedure for determination of permeability of
the granular soils (ASTM D 2434-68) is adopted for the current work. The test setup

51
consist of an acrylic cylinder with inside diameter of 15.24 cm (6 inches) and a height of
24 cm, porous stones, stand, clamps, silicon grease and a tank maintaining a constant
hydraulic head. Table 3.6 presents a brief overview of sample size, mode of compaction
for permeability testing used in previous studies.
3.4.4.1 Sample Preparation:
The remolded sample of known weight from the reactors at its natural moisture
content was taken and the particles greater than half the diameter of the cylinder were
shredded so as to reduce the boundary effects. The sample was then transferred to acrylic
cylinder in five uniformly distributed layers to achieve the required uniform density. The
required densities were obtained by changing the packing of sample by maintaining the
constant height of the sample. The weight of the sample is predetermined by multiplying
the volume of the sample with the required density.

52
Table 3.6 Glossary of sample size, mode of compaction for permeability testing from previous studies.
Source Sample Description Maximum particle size Sample placement Test
Pelkey (1997) five years old obtained from the test pits 6.4m deep at Spruce Lake landfill, NB, Canada
Equal to diameter of sample
Compacted in 6-8 roughly equal lifts with a 5.6 kg hammer that was dropped from a height of 20 to 30
Constant head test in consolidometer
Gabr (1995) The samples were retrieved from field auger cuttings. Majority of waste assumed to be 15 and 30 years old
1/6th of the diameter of the specimen
Compacted into a 70.6mm diameter and 152mm long split mould. Three lifts with 12 blows from a standard proctor test hammer
Falling head and constant head test on triaxial compression specimens
Korman (1987) Waste from paper mills approximately 1 to 15 years old at 2 to 16 feet deep and fresh wastes. Tests were conducted on undisturbed samples from Shelby tubes and hollow stem auger and reconstituted samples.
Not reported Regid wall permeability tests on fresh wastes and flexible wall permeability tests on landfilled waste
52

53
Table 3.5 - continued
Source Sample Description Maximum particle size Sample placement Test
Durmusoglu et. al. (2006)
Approximately 10 year old sample from Rock Prairie Road Landfill in Brazos County, Tx.
Large scale consolidometer 2 cm
Small scale cell 0.5 cm.
compacted at standard proctor capacitive effort
Falling head test in large and small scale consolidometer. Large scale compression cell is of 71.2 cm diameter and 55.8cm high.
Chen (1995) Typical mixture of paper, plastic and refuse derived fuel (RDF) from National Ecology of Baltimore, MD
Not reported Packed with increments of less than 2 kg of MSW to allow uniform compression.
Constant head tests in a test column of 122 cm long and 38.1cm diameter.
Bleiker (1993) Disturbed refuse samples from Keele Valley Landfill, Toronto, Ontario
Not reported A small portion of sample is placed in the ring and each effective stress level is applied for 90 minutes.
Falling head test in a Fixed brass ring having a diameter of 63mm and a thickness of 19mm
Beaven and Powrie (1995)
Crude Domestic Refuse directly from tipping face of landfill and pulverized refuse passed through 150mm filter.
Not reported Placed and compressed approximately to field density.
Constant head flow test in Pitsea compression cell of 2m diameter and 3m high.
53

54
3.4.4.2 Test Procedure:
The acrylic cylinder along with the accessories are weighed. The sample is then
transferred to the cylinder as given in the pervious section and the acrylic cylinder along
with sample are mounted on the stand and the clamps were tightened. The entire setup is
weighed again so as to determine the weight of the sample. The height of the sample is
measured and recorded. The setup is connected to the water line making sure that there
are no air bubbles along the water line. The head is measured and the flow in sample is
allowed to stabilize until no air bubbles appear in the outlet pipe. When the flow rate is
constant the permeability, k, is determined from the total amount of flow, Q, in a given
time, t, as
k = hAt
QL (3.3)
where h is the hydraulic head, A area of cross section of specimen, and L is the
height of the sample. Figure 3.7 shows the step by step procedure for determination of
permeability.

55
Fig 3.7 step by step procedure for determination of coefficient of permeability. (a) and (b) apparatus and experimental setup; (c) representative sample; (d), (e) and (f) sample
placement and compaction; (g) sample mounted on the stand with porous stone on the top; (h) set up connected to water line (i) maintaining constant head;
(j) allowing the flow in sample to stabilize (k) collecting the water drained at a given time; (l) measuring the water collected.

56
CHAPTER 4
ANALYSIS OF TEST RESULTS
4.1 Introduction
Particle size analysis, along with moisture content and specific gravity of the
sample were determined for preliminary characterization of the sample at each phase of
degradation. The following sections provide the test results.
4.2 Refuse Decomposition Results
Based on the experimental results methane production rates and the pH of
leachate are presented in Figures 4.1 and Figure 4.2 respectively. Recirculation of
neutralized leachate along with anaerobic digester sludge enhanced the refuse
decomposition. The results show that at 25th day the samples were in anaerobic acid
phase. The rate of methane production was maximum after 106 days and the samples
were in accelerated methane production phase. After 225 days the samples were in
decelerated methane production phase. The reactors were destructively sampled after 25
days, 106 days, 225 days and 253 days to obtain the representative at the end of each
phase of decomposition (Hossain et al, 2007).
The change in percentage of volatile solids from each of the reactor is presented
in Table 4.1. Leachate recirculation had a significant effect on the degradation of the
waste. The percent change (utilized) in volatile solids increases from 0.91 in Phase I to
39.24 in final phase. The cumulative methane production increased significantly with

57
waste degradation and time. The cumulative gas production was only 23.49 L in
phase I compared to 515.4 L in Phase IV. With degradation and conversion of Volatile
organic content to gases, gas production increased significantly. Therefore, the
percentage of Volatile organic content is expected to change with time and degradation.
Table 4.1 Methane Production and Sample Composition in Sampled Reactors
(Hossain et al, 2007)
Phase Time of Reactor
Operation
Cumulative Methane
Production (L)
% Change in Volatile
Solids
1 25 23.49 0.91
2 106 195.03 1.40
3 225 487.73 12.88
4 253 515.41 39.24
0.0
0.1
0.2
0.3
0.4
0.5
0.6
0.7
0 50 100 150 200 250Days
Reactor 1-1 Reactor 1-2
Reactor 1-3 Reactor 1-4
Met
han
e Y
ield
, L
/lb
/day
Phase IV
Phase II
Phase I
Phase III
Figure 4.1 Rate of gas production from reactors at each phase of Decomposition of reactors without soil (Hossain et al, 2007)

58
5
5.5
6
6.5
7
7.5
8
8.5
9
9.5
0 50 100 150 200 250
Time, days
Reactor 1-1 Reactor 1-2
Reactor 1-3 Reactor 1-4
Phase III
Phase II
Phase IV
Phase I
pH
Figure 4.2 pH of generated leachate from the bioreactor cells (Hossain et al, 2007)
4.3 Change in composition with degradation
The change in weight percentage of degradable constituents for the sample in the
first set of reactor is given in Figure 4.3 and that of reactor set 2 are given in Figure 4.4.
From the plots it can be observed that there is a decrease in weight percentage of
degradable constituents with the stage of degradation. The percentage decrease increased
for each phase of disintegration. Food wastes are completely consumed by the end of
second phase and paper approximately 50% at the end of phase IV in the first set of
reactors. The rate of decomposition also depends on the type of individual constituent.
Although each reactor doesn’t have the same constituents the results are observed to be
comparable.

59
0
10
20
30
40
50
60
70
80
90
100
Textile Paper Food
Per
centa
ge
Dec
reas
ePhase I
Phase II
Phase III
Phase IV
Figure 4.3 Change in weight percentage of degradable constituents in reactor set 1 (Haque, 2007)
0
10
20
30
40
50
60
70
80
90
100
Textile Paper Food
Per
cen
tage
Dec
reas
e
Phase I
Phase II
Phase III
Phase IV
Figure 4.4 Change in weight percentage of degradable constituents in reactor Set 2
(Haque, 2007)

60
4.4 Geotechnical Testing
4.4.1 Particle Size Analysis
From visual inspection there is no observable disintegration of paper and plastic,
in Phase I and Phase II of degradation but it appeared like all the food wastes were
consumed during these phases. Letters on the paper were clearly visible even after the
second phase of disintegration. Chunks of paper and textile were observed in phase III
implying a partial disintegration of paper and textile However, paper was completely
disintegrated and is in the form of paste at the end of phase IV. Figure 4.5 shows the
disintegrated paper in each phase. Figure 4.8 shows the typical fractions retained on 2-
inch US sieve, 1-inch US sieve, US sieve # 60 and US sieve # 200 during particle size
distribution. Wet sieve analysis on the fraction retained on US sieve No. 200 indicated
particle disintegration as the stage of decomposition progresses. Figure 4.6 and Figure 4.7
presents the particle size distribution curves for municipal solid waste at different stages
of decomposition from reactor set 1 and 2 respectively
Particle size distribution curves indicate an increase in percent of fraction passing
US sieve No. 200 with degradation. The MSW particles were relatively larger during the
initial stages of degradation and with degradation, the matrix structure of paper, textile
and other degradable constituents were broken down into smaller particles. This resulted
in an overall increase in percentage of finer fraction passing US sieve 200. The
percentage of particles finer than 75µm (US sieve No 200) for phase I is only 10% when
compared to 39% in Phase IV. Figure 4.9 presents the variation in percentage of fraction
passing US sieve No 200 with degradation of municipal solid waste. The increase in finer

61
fraction with degradation is about 2-3 times, which is expected to change the hydraulic
behavior of MSW in a landfill.
Figure 4.5 Disintegration of paper with degradation; (a) Phase I; (b) Phase II; (c) Phase III; (d) Phase IV
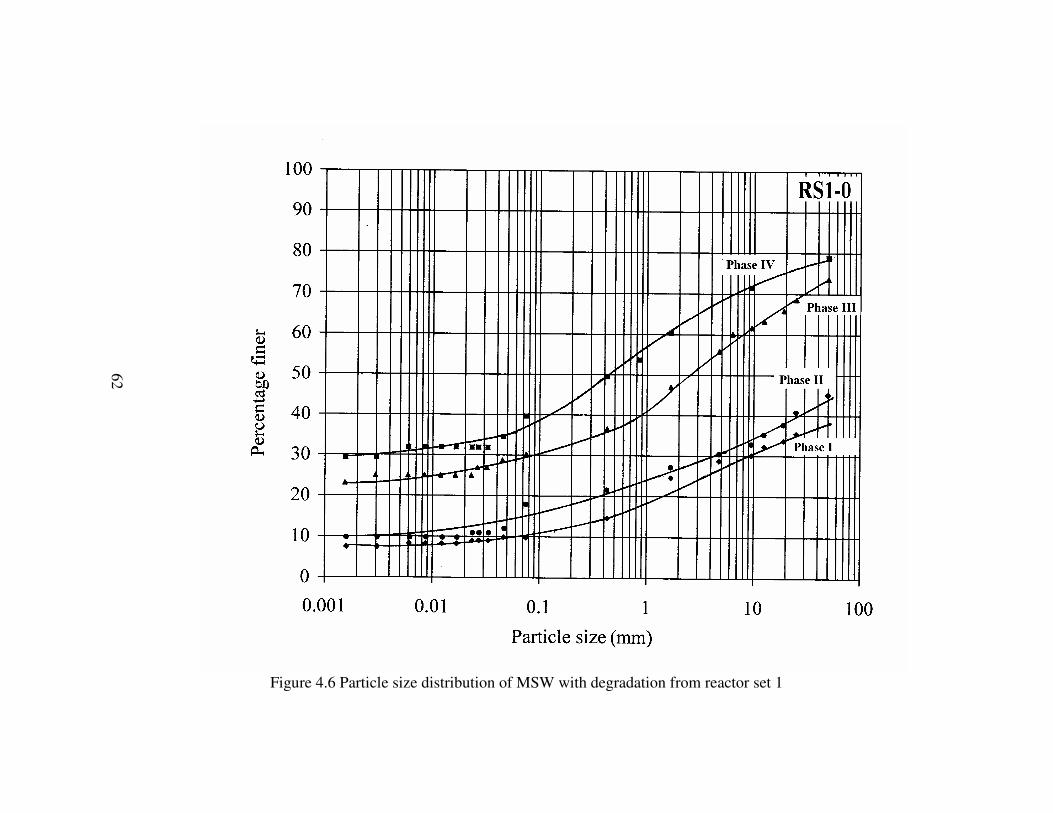
62
Figure 4.6 Particle size distribution of MSW with degradation from reactor set 1
62

63
Figure 4.7 Particle size distribution of MSW with degradation from reactor set 2
63

64
Figure 4.8 Typical sample retained on the corresponding sieve; (a) Fraction Retained on 2 – inch US sieve; (b) Sample Passing 1 Inch US sieve and retained on 1/4th –inch US sieve; (c) Sample Passing US – sieve # 40 and retained on US sieve # 60; (d) Sample
Passing Us sieve # 60 and retained on US sieve # 200

65
0
5
10
15
20
25
30
35
40
45
1 2 3 4
Phase
Per
cen
tag
e fi
ner
RS1-0
Figure 4.9 Percentage of particles finer than 75µm (US Sieve No. 200)
with degradation
4.4.2 Specific Gravity
A total of 12 specific gravity tests were conducted on the waste samples at each
phase of degradation. Additionally, tests were also carried out on the fraction finer than
US sieve 200. Table 4.2 presents the test results of the specific gravity of MSW. The
average value of specific gravity is decreasing with the degradation of MSW. The
possible reason might be due to the increase in percentage of plastic which has a
relatively low specific gravity and decrease in percentage of paper with decomposition.

66
Table 4.2 Test results of specific gravity of MSW
Material Test 1 Test 2 Test 3 Average STDEV Particles Passing US Sieve No.
200
MSW-Phase I 1.11 0.94 1.15 1.07 0.114 1.65
MSW-Phase II 0.83 1.11 0.92 0.95 0.137 1.54
MSW-Phase III 0.91 0.97 0.86 0.91 0.055 1.52
MSW-Phase IV 0.89 0.90 0.92 0.91 0.012 1.46
STDEV – Standard Deviation
An attempt was made to compare the results with the values calculated based on
the specific gravity of the individual constituent. Table 4.3 presents the typical values
of specific gravity of individual constituents from the literature. The values of specific
gravity were obtained by the following equation
( )
100
.1
∑=
n
x
sxx Gp
(4.1)
where px is the percentage of the individual constituent with specific gravity, Gsx.
Table 4.3 Typical values of specific gravity from literature.
Material Specific Gravity
Paper* 1.20
Plastic# 0.91(LDPE) to 0.97 (HDPE)
Food* 0.43 (Oats)-0.77 (Potato, Wheat)
Textile* 1.31(wool)
* http://www.reade.com/Particle_Briefings/spec-gra2html # www.plasticusa.com/specgrav.html

67
Table 4.4 presents the experimental and calculated values of specific gravity. The
variation in specific gravity can be clearly observed with the change in composition.
Hence, the decrease in values of specific gravity with each phase can be attributed to the
change in percentage composition of individual constituent of the sample.
Table 4.4 Experimental and calculated values of specific gravity of MSW
Material MSW
experimental calculated
MSW-Phase I 1.07 1.2
MSW-Phase II 0.96 1.16
MSW-Phase III 0.91 1.14
MSW-Phase IV 0.91 1.12
4.4.3 Moisture Content
The results of average moisture content of the MSW from the reactors with and
without soil with degradation were presented in Table 4.5. The observed increase in
moisture content with degradation can be attributed to the particle disintegration
resulting in decrease in pore spaces, enabling the MSW to hold the moisture.
Table 4.5 Moisture content of MSW
Moisture Content (%)
Material Sample from Reactor
without Soil Sample from
Reactor with soil
Dry
Weight Basis
Wet Weight Basis
Dry Weight Basis
Wet Weight Basis
MSW-Phase I 149.1 59.5 126.8 55.3
MSW-Phase II 158.6 59.7 197.1 65.9
MSW-Phase III 180.4 63.3 230.3 68.9
MSW-Phase IV 198.4 64.7 245.1 69.6

68
4.4.4 Permeability
4.4.4.1 Permeability with degradation
Permeability tests were conducted on MSW samples at each phase of
degradation at three given densities. Permeability of MSW was in the order of 10-2 cm/s
after the first phase of degradation and decreased to the order of 10-4 cm/s at the final
phase of degradation. Figure 4.10 presents the change in permeability of MSW at each
phase of degradation at 700 kg/m3 and Figure 4.11 presents the variation in permeability
with percentage of particles passing US sieve # 200. The change in permeability might
be due to the particle disintegration with decomposition and the resulting increase in
percentage of finer fraction. With the increase in percentage of finer fraction, there
might be a significant change in pore size, geometry and continuity resulting in the
decrease of fluid flow. Blieker (1993) from laboratory fixed ring test results on samples
from Keele Valley Landfills reported a higher coefficient of permeability for a 5 year
old sample when compared to a 10 year old sample which implies a reduction in
permeability with the age of MSW.

69
0.00E+00
1.00E-03
2.00E-03
3.00E-03
4.00E-03
5.00E-03
6.00E-03
7.00E-03
8.00E-03
9.00E-03
1.00E-02
I II III IVPhase
Coef
fici
ent
of
Per
mea
bil
ity
(cm
/s)
RS1-0
Figure 4.10 Permeability with degradation of the samples from reactor set 1
0.00E+00
1.00E-03
2.00E-03
3.00E-03
4.00E-03
5.00E-03
6.00E-03
7.00E-03
8.00E-03
9.00E-03
1.00E-02
0 5 10 15 20 25 30 35 40 45
Percentage finer
Co
effi
cien
t o
f p
erm
eab
ilit
y (
cm/s
)
700
800
900
Phase I
Phase II
Phase III
Phase IV
RS1-0
Figure 4.11 Permeability with the percentage of particles passing US Sieve No. 200

70
4.4.4.2 Permeability with voids ratio.
Moisture transport in MSW might be through the inter particle and intra particle
voids depending on their size and continuity. The void ratio of the specimen is
determined using the equation
e = 1−d
wsG
ρ
ρ
where Gs = Specific gravity of the solid components; ρw = density of water and
ρd = dry density of specimen = w+1
ρ ; where, ρ = density of sample and, w = moisture
content (dry)
Average value of specific gravity (Gs) obtained is considered for the calculation.
The Variation in permeability of the MSW at Phase I, II, III and IV of degradation with
the calculated void ratio is presented in Figures 4.12, 4.13, 4.14 and 4.15 respectively.
With the increase in the density of sample the voids ratio decreases, thus, decreasing the
permeability
Figure 4.16 presents the observed trend of permeability plotted on a logarithmic
scale against voids ratio. From Figure 4.16 it can be understood that permeability
decreases with decrease in voids ratio of MSW. The possible reason might be the
decrease in size of the flow channels with the decrease in voids ratio, resulting in an
overall reduction of permeability.

71
0.00E+00
2.00E-03
4.00E-03
6.00E-03
8.00E-03
1.00E-02
1.20E-02
0.6 1.1 1.6 2.1 2.6 3.1 3.6
Voids Ratio
Coef
fici
ent
of
Per
mea
bil
ity
(cm
/s)
662.2 kg/m3
779.14
kg/m3
950.37 kg/m3
Density
RS1-0
Figure 4.12 Permeability with voids ratio of MSW at phase I
0.00E+00
1.00E-03
2.00E-03
3.00E-03
4.00E-03
5.00E-03
6.00E-03
7.00E-03
0.6 1.1 1.6 2.1 2.6 3.1
Voids Ratio
Coef
fien
t of
Per
mea
bil
ity (
cm/s
) 659.8 kg/m3
798.2 kg/m3
938.04 kg/m3
DensityDensity
RS1-0
Figure 4.13 Permeability with voids ratio of MSW at phase II

72
0.00E+00
5.00E-04
1.00E-03
1.50E-03
2.00E-03
2.50E-03
3.00E-03
0.6 1.1 1.6 2.1 2.6 3.1
Voids Ratio
Coef
fici
ent
of
Per
mea
bil
ity
(cm
/s)
768.08 kg/m3
650.3 kg/m3
927.94 kg/m3
Density
RS1-0
Figure 4.14 Permeability with voids ratio of MSW at phase III
0.00E+00
4.00E-04
8.00E-04
1.20E-03
1.60E-03
0.6 1.1 1.6 2.1 2.6 3.1 3.6
voids Ratio
Co
effi
cien
t o
f P
erm
eabil
ity
(cm
/s) 678.54 kg/m
3
791.79kg/m3
932.43 kg/m3
Density
RS1-0
4) Phase IV
Figure 4.15 Permeability with voids ratio of MSW at phase IV
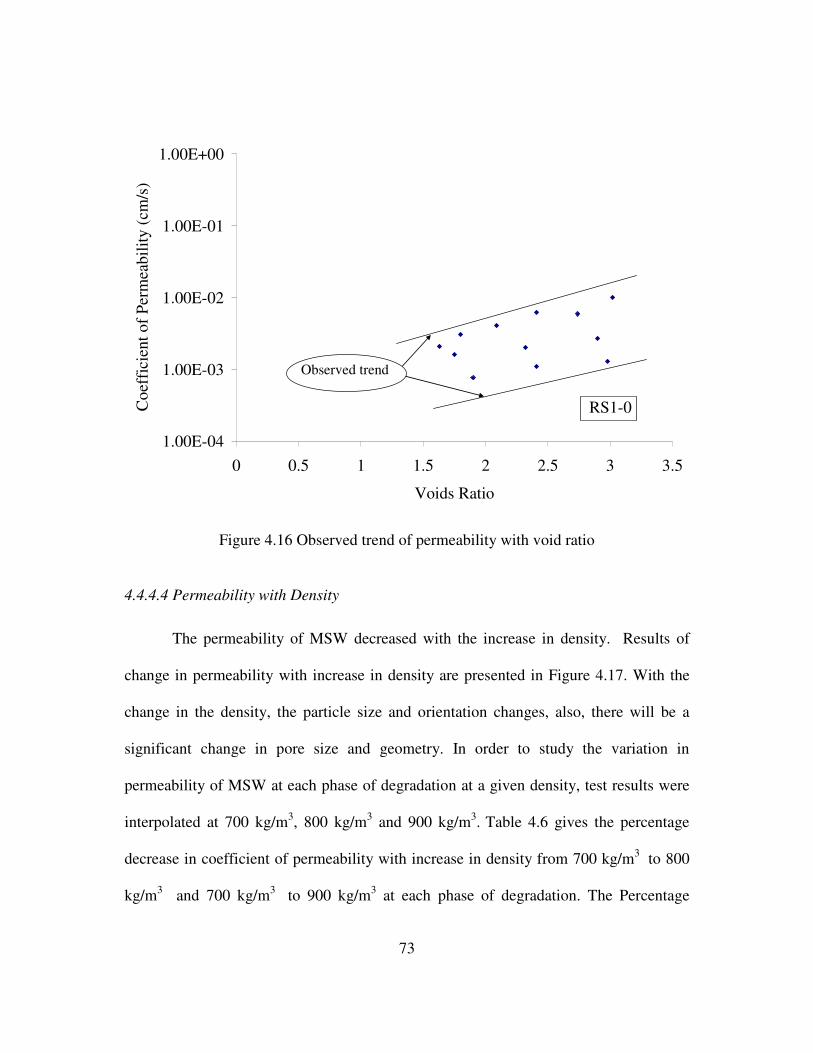
73
1.00E-04
1.00E-03
1.00E-02
1.00E-01
1.00E+00
0 0.5 1 1.5 2 2.5 3 3.5
Voids Ratio
Co
effi
cien
t o
f P
erm
eabil
ity (
cm/s
)
Observed trend
RS1-0
Figure 4.16 Observed trend of permeability with void ratio
4.4.4.4 Permeability with Density
The permeability of MSW decreased with the increase in density. Results of
change in permeability with increase in density are presented in Figure 4.17. With the
change in the density, the particle size and orientation changes, also, there will be a
significant change in pore size and geometry. In order to study the variation in
permeability of MSW at each phase of degradation at a given density, test results were
interpolated at 700 kg/m3, 800 kg/m3 and 900 kg/m3. Table 4.6 gives the percentage
decrease in coefficient of permeability with increase in density from 700 kg/m3 to 800
kg/m3 and 700 kg/m3 to 900 kg/m3 at each phase of degradation. The Percentage

74
decrease in coefficient of permeability with increase in density from 700 to 900 kg/m3
for phase I material is 55.5 % which is greater than the percentage decrease of
coefficient of permeability for the sample at phase IV. The reason for this behavior
might be the composition and size of the individual constituent of the sample. Paper and
plastic being more compressible, at lower density, the pore size will be significantly
wider when compared to the size and continuity of the pore spaces at a higher density,
resulting a decrease in amount of fluid flow through the pores at higher density. In
contrast the paper in the phase IV is in the form of a paste, which with compaction
might not have a significant reduction in void space. Figure 4.18 gives the observed
trend in interpolated values of coefficient of permeability at a given density. It can be
concluded from Figure 4.18 that the coefficient of permeability decreases with the
increase in density at all stages of degradation.
Table 4.6 Percentage decrease in coefficient of permeability with increase in density from 700 kg/m3 to 800 kg/m3 and 700 kg/m3 to 900 kg/m3 at each phase of degradation.
Percentage Decrease in Permeability
Phase of Degradation
700 kg/m3 to 800 kg/m3
700 kg/m3 to 900 kg/m3
Phase I 34.09 54.54
Phase II 43.05 62.5
Phase III 48 72
Phase IV 7.69 34.61

75
0.00E+00
2.00E-03
4.00E-03
6.00E-03
8.00E-03
1.00E-02
1.20E-02
600 650 700 750 800 850 900 950 1000Density, kg/m3
Co
effi
cien
t o
f P
erm
eab
ilit
y (
cm/s
)
Phase I
Phase II
Phase III
Phase IV
RS1-0
Figure 4.17 Permeability with density
0.00E+00
1.00E-03
2.00E-03
3.00E-03
4.00E-03
5.00E-03
6.00E-03
7.00E-03
8.00E-03
9.00E-03
1.00E-02
I II III IV
Phase of degredation
Coef
fici
ent
of
Per
mea
bil
ity
(cm
/s)
700
800
900
Density (kg/cm3)
RS1-0
Figure 4.18 Interpolated values of permeability at a given density

76
The permeability results when plotted against their corresponding densities gave an
agreeable relation with the test results of vertical permeability against dry unit weights
by Powrie and Beaven (2005). Figure 4.19 gives the comparison of trend of the results
obtained in the current research with the values vertical permeability obtained by
Powrie and Beaven (2005).
1.0E-07
1.0E-06
1.0E-05
1.0E-04
1.0E-03
1.0E-02
1.0E-01
1.0E+00
0 200 400 600 800 1000 1200
Density (kg/m3)
Coef
fici
ent
of
Per
mea
bil
ity (
cm/s
)
Current study Powrie and Beaven (2005)
Powrie and
Beaven (2005)
Current Study
Upper Bound
Lower Bound
Figure 4.19 Comparison of values obtained in the current study and values of vertical permeability with dry density obtained by Powrie and Beaven (2005)

77
4.4.4.5 Effects of Cover Soil
There is an overall decrease in permeability with increase in percentage soil.
The trend is the same at each phase of degradation. The variation in coefficient of
permeability for the samples at each phase of degradation with varying percentages of
soil are presented in Figure 4.20 to Figure 4.27.
The average percentage decrease in permeability for samples at each phase of
degradation for different percentages of soil and density are given in Table 4.7 to Table
4.10. The Percentage decrease in permeability is cumulative when there is combined
effect of both increase in density and increase in percentage of soil.
The variability in the permeability of MSW can be attributed to the change in
orientation and size of flow path which is the function of size, shape and properties the
individual constituent. Also, the percentage of fines increase with the increase in
percentage of the soil contributes to a further decrease in coefficient of permeability.
The decrease in the order of permeability with addition of soil and increase in density is
in the order of 10-2 cm/s as the waste degradation proceeds from phase I to phase IV.
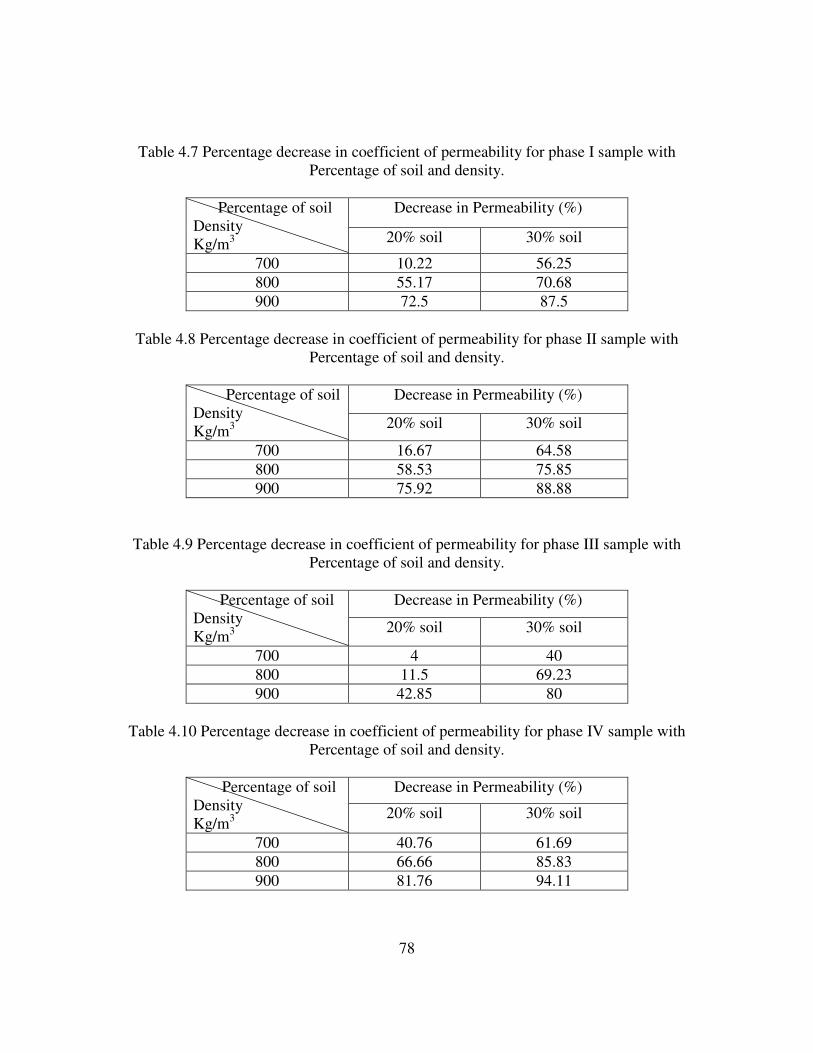
78
Table 4.7 Percentage decrease in coefficient of permeability for phase I sample with
Percentage of soil and density.
Decrease in Permeability (%) Percentage of soil Density Kg/m3 20% soil 30% soil
700 10.22 56.25
800 55.17 70.68
900 72.5 87.5
Table 4.8 Percentage decrease in coefficient of permeability for phase II sample with
Percentage of soil and density.
Decrease in Permeability (%) Percentage of soil Density Kg/m3 20% soil 30% soil
700 16.67 64.58
800 58.53 75.85
900 75.92 88.88
Table 4.9 Percentage decrease in coefficient of permeability for phase III sample with Percentage of soil and density.
Decrease in Permeability (%) Percentage of soil Density Kg/m3 20% soil 30% soil
700 4 40
800 11.5 69.23
900 42.85 80
Table 4.10 Percentage decrease in coefficient of permeability for phase IV sample with
Percentage of soil and density.
Decrease in Permeability (%) Percentage of soil Density Kg/m3 20% soil 30% soil
700 40.76 61.69
800 66.66 85.83
900 81.76 94.11

79
0.00E+00
2.00E-03
4.00E-03
6.00E-03
8.00E-03
1.00E-02
1.20E-02
1.40E-02
600 650 700 750 800 850 900 950 1000 1050
Density kg/m3
Co
effi
cien
t o
f per
mea
bil
ity
(cm
/s)
RS1-0
RS1-20
RS2-20
RS1-30
RS2-30
Figure 4.20 Changes in permeability with percentage soil for Phase I
RS1-0 RS1-20 RS2-20 RS1-30 RS2-30 900800
700
0.00E+00
1.00E-03
2.00E-03
3.00E-03
4.00E-03
5.00E-03
6.00E-03
7.00E-03
8.00E-03
9.00E-03
Co
effi
cien
t o
f P
erm
eab
ilit
y (
cm/s
)
Sample
Density kg/m3
900
800
700
Figure 4.21 Change in permeability with percentage soil for Phase I at a given density

80
0.00E+00
1.00E-03
2.00E-03
3.00E-03
4.00E-03
5.00E-03
6.00E-03
7.00E-03
8.00E-03
9.00E-03
1.00E-02
600 650 700 750 800 850 900 950 1000
Density kg/m3
Co
effi
cien
t o
f p
erm
eab
ilit
y (
cm/s
)
RS1-0
RS1-20
RS2-20
RS1-30
RS2-30
Figure 4.22 Changes in permeability with percentage soil for Phase II
RS1-0 RS1-20 RS2-20 RS1-30 RS2-30 900800
700
0.00E+00
1.00E-03
2.00E-03
3.00E-03
4.00E-03
5.00E-03
6.00E-03
7.00E-03
Co
effi
cien
t o
f P
erm
eab
ilit
y (
cm/s
)
Sample
Density kg/m3
900
800
700
Figure 4.23 Change in permeability with percentage soil for Phase II at a given density

81
0.00E+00
5.00E-04
1.00E-03
1.50E-03
2.00E-03
2.50E-03
3.00E-03
3.50E-03
4.00E-03
600 650 700 750 800 850 900 950 1000
Density kg/m3
Co
effi
cien
t o
f p
erm
eab
ilit
y (
cm/s
)
RS1-0
RS1-20
RS2-20
RS1-30
RS2-30
Figure 4.24 Changes in permeability with percentage soil for Phase III
RS1-0 RS1-20 RS2-20 RS1-30 RS2-30 900800
700
0.00E+00
5.00E-04
1.00E-03
1.50E-03
2.00E-03
2.50E-03
Co
effi
cien
t o
f P
erm
eab
ilit
y (
cm/s
)
Sample
Density kg/m3
900
800
700
Figure 4.25 Change in permeability with percentage soil for Phase III at a given density

82
0.00E+00
2.00E-04
4.00E-04
6.00E-04
8.00E-04
1.00E-03
1.20E-03
1.40E-03
600 650 700 750 800 850 900 950 1000
Density kg/m3
Co
effi
cien
t o
f p
erm
eab
ilit
y (
cm/s
)
RS1-0
RS1-20
RS2-20
RS1-30
RS2-30
Figure 4.26 Changes in permeability with percentage soil for Phase IV
RS1-0 RS1-20 RS2-20 RS1-30 RS2-30 900800
700
0.00E+00
2.00E-04
4.00E-04
6.00E-04
8.00E-04
1.00E-03
1.20E-03
1.40E-03
Co
effi
cien
t o
f P
erm
eab
ilit
y (
cm/s
)
Sample
Density kg/m3
900
800
700
Figure 4.27 Change in permeability with percentage soil for Phase IV at a given
density

83
CHAPTER 5
SUMMARY AND CONCLUSIONS
Permeability in municipal solid waste is mainly dependent on the pore size and
geometry, which in turn varies with the size and shape of the individual particle and
packing density. MSW samples representing various stages of decomposition are
generated in a laboratory scale reactors operated under conditions designed to simulate
decomposition in bioreactor landfills. The reactors were destructively sampled at the
end of each phase of degradation based on the reactors methane production rate curve.
In the current study an experimental program was designed to determine the variation of
coefficient of permeability with degradation, and also to study the influence of various
other parameters influencing the permeability of MSW.
The following parameters are considered for the current study.
a. Phase of Degradation
b. Packaging density
c. Percentage of soil
Tests were carried out at three different densities for the samples at different
stages of degradation. Tests were also conducted with two percentages of soil so as to
determine the influence of the cover soil.

84
The experimental results are summarized as follows:
1 Particle size analysis indicated a decrease in particle size with degradation. This
phenomenon can be attributed to the disintegration of the degradable waste like
paper food and textile with time.
2 The permeability of MSW at the first phase of degradation is 0.0088 cm/s at 700
kg/cm3. As the sample degrades at the same density permeability reduced to
0.0013 cm/s. The reason for the decrease might be due to the increase in
percentage of finer fraction passing US sieve no. 200 occupying the pore spaces
thus decreasing the size of the flow path.
3 Density of the sample is observed to have significant affect on the permeability
of MSW. Permeability decreased with the increase in density. The possible
reason for the decrease might be due to the reduction in pore size and change in
geometry and continuity of pores resulting in decrease in area of flow.
4 There is a decrease in voids ratio with increase in density, thus, resulting in
decrease in permeability.
5 There is an overall decrease in permeability with increase in percentage soil.
The trend is the same for the samples at each phase of degradation. The reason
might be the increase in finer fraction filling in the void spaces.

85
6 The Percentage decrease in permeability is much higher when there is
combined affect of both increase in density and increase in percentage of cover
soil.
From the current work, the following recommendations can be given for future
research.
1) Inclusion of control materials along with the MSW samples in the reactor might
be useful to identify the extent of degradation.
2) Head loss along the sample during the permeability testing might be helpful to
determine the influence of heterogeneity and stratification.
3) Further study on Influence of cover soils with different generally used cover
soils.
4) Further study on permeability tests using leachate instead of water.

86
REFERENCES
Beaven R. P., and Powrie, W. (1995). “Hydrological and Geotechnical Properties of
Refuse using a Large Scale Compression Cell” Proceedings Sardina 95, Fifth
International Landfill Symposium, 2, 745-760.
Beaven. R. P., and Powrie, W. (1996). “Determination of The Hydrogeological and
Geotechnical Properties of Refuse In Relation to Sustainable Landfilling”
Proceedings Nineteenth International Madison Waste Conference : municipal &
industrial waste : September 25-26, 1996. 435-445.
Bleiker, E.D., McBean, E., and Farquhar, G. (1993). “Refuse Sampling and
Permeability Testing At The Brock Westand Keele Valley Landfills”
Proceedings, Sixteenth International Madison Waste Conference : municipal &
industrial waste, September 22-23, 1993. 548-567.
Chen, H. T. (1995). “Hydraulic Conductivity of Compacted Municipal Solid Waste”
Bioresource Technology, 51, 205-212.
Dixon, N., Russell,. D., and Jones, V. (2005). “Engineering properties of municipal
solid waste” Geotextiles and Geomembranes. 23, 205-233.
Durmusoglu, E., Sanchez, M. Itza and Corapcioglu, Y. M. (2006). “Permeability and
compression characteristics of Municipal solid waste” Environ Geol 50, 773-789
Gabr, M. A., and Valero, S. N. (1995). “Geotechnical Properties of Municipal Solid
Waste,” Geotechnical Testing Journal, 18(2), 241-255.

87
Haque, M. A. (2007). “Dynamic Characteristic and Stability Analysis of Municipal
Solid Waste in Bioreactor Landfill” Doctoral Thesis(work under progress), The
University of Texas At Arlington.
Hossain, M.S., Haque, M.A., Qasim, S. R., and Hoyos, L. (2007). “Dynamic
Characteristic of Municipal Solid Waste with Degradation in Bioreactor
Landfills,” 4th International Conference on Earthquake Geotechnical
Engineering, to be held in June 25 - 28, 2007, Thessaloniki, Greece.
Hossain, M.S. (2002). “Mechanics of Compressibility And Strength Of Solid Waste In
Bioreactor Landfills” Doctoral Thesis, North Carolina State University at
Raleigh.
Hyder, M. M., and Khire M. V (2004) “Evaluation of heterogeneity and anisotropy if
waste properties on leachate recirculation in bioreactor landfills” Journal of
solid waste technology and management, 30(4) 233-242.
Jain, P., Powell, J., Townsend, T. G., and Reinhart, D, R. (2006). “Estimating The
Hydraulic Conductivity Of Landfilled Municipal Solid Waste Using Borehole
Permeameter Test” Journal of Environmental engineering, ASCE, 132(6), 645-
653.
Jang, Y.S., Kim Y.W., and Lee S.I. (2002). “Hydraulic properties and leachate level
analysis of Kimpo metropolitan Landfill, Korea” Waste Management, 22, 261-
267.

88
Jin, H., Warith, M.A, and Menon, M. (2005). “Accelerating the biodegradation of high
moisture and organic content solid wastes in bioreactor landfills” 9th
Environmental Engineering Specialty Conference, June 2-4, 2005 116-1-10.
Kelly, R. J. (2002). “Solid Waste Biodegradation Enhancements and the Evaluation of
Analytical Methods Used to Predict Waste Stability” Masters Thesis, Virginia
Polytechnic Institute and State University.
Koerner, R. G., and Eith, W. A. (2005). “Drainage capability of fully degraded MSW
with respect to various leachate collection and removal systems” Geotechnical
special publication 130, pp 4233-4237.
Korman, E. M, Horvitz, E.G., Kleppe H. J., and Dalton, G. M. (1987). “Material
properties of landfilled primary waste” Environmental Conference : Portland
Marriott, Portland, OR, April 27-29. 179-186.
Landva, A., and Clark J. (1986). “Geotechnical testing of waste fill” 9th Canadian
Geotechnical Conference, August 27-30, 1986, 371-385.
Moore, R., Dhal. K., and Yazdani, R. (1997). ”Hydraulic characteristics of municipal
solid waste: Findings of the Yolo County bioreactor landfill project”
Proceedings of the thirteenth International Conference on Solid Waste
Technology and Management : Philadelphia, PA, U.S.A., November 16-19,
1997.
Oweis, I. S., and Khera, R. P. (1990). “Geotechnology of waste management”
Butterworths, Kent, England.

89
Pelkey, S.G. (1997) “Geotechnical Properties of Municipal Solid Waste” Masters
Thesis, The University of New Brunswick, Canada.
Pohland, F. (1996). “Landfill Bioreactors: Fundamentals and Practice”, Water quality
international, 18-22.
Powrie, W and Beaven R.P. (1999). “Hydraulic Properties of Household Waste and
Applications for Landfills” Proceedings Institution of civil Engineers,
Geotechnical Engineering, 137, 235-247.
Powrie, W., Beaven R.P., and Hudson, A. P., (2005). “Factors affecting the Hydraulic
Conductivity of Waste” International work shop, Hydro-Physico-Mechanics of
Landfills, LIRIGM Grenoble University of France.
Reinhart D.R., McCreanor P.T., and Townsend T. (2002). “The Bioreactor Landfill: its
status and future” Waste Management and Research, 20, 172-186.
Reinhart D R., and Townsend, T. G. (1997). “Landfill Bioreactor Design and
Operation” Lewis Publishers, New York.
Rendra, S., Fernandes L ., and Warith M.A (2003) “Degradation of Municipal Solid
Waste in Simulated Aerobic and Anaerobic Bioreactor Landfills” The Journal of
solid waste technology and management 29(3), 145-153.
Shank, K. L. (1993). “Determination of the Hydraulic Conductivity of the Alachua
County Southwest Landfill” Masters Thesis, The University of Florida.
Sharma, H. D., and Krishna, R. R. (2004). “Geoenvironmental Engineering: Site
Remediation, waste Containment and Emerging Management Technologies”
John Wiley & sons, New Jersey.

90
Sponza, D. T and Agdag, O. N. (2004). “Impact of Leachate Recirculation And
Recirculation Volume on Stabilization of Municipal Solid Wastes In Simulated
Anaerobic Bioreactors” Process Biochemistry, 39, 2157-2165
Tchobanoglous, G., Theisen, H., Vigil, S. 1993. Integrated solid waste management.
McGraw-Hill, New York.
United States Environmental Protection Agency (2006) “Municipal Solid Waste In The
United States: 2005 Facts and Figures” Executive Summary EPA530-S-06-001
October 2006 (www.epa.gov).
Warith M (2002) “Bioreactor Landfills Experimental and Field Results” Waste
Management 22(7) 7-17.
Zeiss, C., and Major. W. (1993) “Moisture Flow Through Municipal Solid Waste
Patterns and Characteristics” Journal of Environmental Systems, Vol 22(3)
211-231.
Zoornberg, G. J., Jernigan, B, L., Sanglerat, T, R., and Cooley, B. H. (1999).
“Retention of Free liquids in Landfills undergoing Vertical Expansion” Journal
of Geotechnical and Geoenvironmental Engineering, Vol 125(7), 583-594.

91
BIOGRAPHICAL INFORMATION
Kiran Kumar Penmethsa graduated in Civil and Environmental Engineering,
Andhra University, Visakhapatnam, India with a Bachelors degree in 2002 and later on
continued his master program in the same university specializing in Soil Mechanics and
Foundation Engineering and graduated with masters degree in 2005. He started his
graduate studies at University of Texas at Arlington in August 2005. During his
graduate program, he had an opportunity to work as a graduate teaching assistant for
undergraduate courses in civil engineering. The author’s main research interests include
Expansive Soils, Utilization of Waste to Energy Residues and Bioreactor Landfills.