performance tuning using hardware counter data philip mucci [email protected]@cs.utk.edu shirley...
Post on 20-Dec-2015
224 views
TRANSCRIPT
Performance Tuning Using Hardware Counter Data
Philip [email protected]
Shirley [email protected]
Nils [email protected]
SC 2001November 12, 2001Denver, Colorado

2
Outline
• Issues in application performance tuning – 30 minutes
• General design of PAPI – 15 minutes• PAPI high-level interface – 15 minutes• PAPI low-level interface – 15 minutes• Counter overflow interrupts and
statistical profiling – 30 minutes (advanced)
• Tools that use PAPI – 30 minutes• Code examples – 30 minutes
3
Issues in Application Performance Tuning

4
HPC Architecture
• RISC or super-scalar architecture– Pipelined functional units– Multiple functional units in the CPU– Speculative execution– Several levels of cache memory– Cache lines shared between CPUs

FloatingPointUnit
FPU1
FloatingPointUnit
FPU2
LD/STUnit
LS1
FixedPointUnit
FXU2
LD/STUnit
LS2
FixedPointUnit
FXU1
FixedPointUnit
FXU3
Branch/Dispatch
Memory Mgmt UnitInstruction Cache
IU
BIU Bus Interface Unit: L2 Control, Clock
Memory Mgmt UnitData Cache
DU
L2 Cache1-16 MB 5XX Bus
Branch history table: 2048 entries
Branch target cache: 256 entries
32 KB, 128-way
64 KB, 128-way
32 Bytes 32 Bytes
32 Bytes @ 200 MHz = 6.4 GB/s
16 Bytes @100 MHz = 1.6 GB/s
POWER3 Processing Units (Model 260)

6
L2 C
ache
Bus Controller
L3 C
ache
Sco
reb
oard
, P
redi
cate
,N
aTs,
Exc
eptio
ns
Branch & PredicateRegisters
128 Integer Registers 128 FP Registers
BranchUnits
Integerand
MM Units
Dual-PortL1
DataCache
AndDTLB
ALA
T
FloatingPointUnits
SIMDFMAC
BranchPrediction
IA-32Decode
AndControl
L1 Instruction CacheAnd
Fetch/Pre-fetch EngineITLB
Register Stack Engine / Re-Mapping
B B B M M I I F F
DecouplingBuffer
8 Bundles
Itanium ™ Processor Block Diagram

7
Hardware Counters
• Small set of registers that count events, which are occurrences of specific signals related to the processor’s function
• Monitoring these events facilitates correlation between the structure of the source/object code and the efficiency of the mapping of that code to the underlying architecture.
8
Pipelined Functional Units
• The circuitry on a chip that performs a given operation is called a functional unit.
• Most integer and floating point units are pipelined – Each stage of a pipelined unit working
simultaneously on different sets of operands
– After initial startup latency, goal is to generate one result every clock cycle

9
Super-scalar Processors
• Processors that have multiple functional units are called super-scalar.
• Examples:– IBM Power 3
• 2 floating point units (multiply-add)• 3 fixed point units• 2 load/store units• 1 branch/dispatch unit

10
Super-scalar Processors (cont.)
– MIPS R12K• 2 floating point units (1 multiply-add, 1
add)• 2 integer units• 2 load/store units
– Alpha EV67• Instruction fetch/issue/retire unit• Integer execution unit (2 IU clusters)• Floating point execution unit (2 FPUs)

11
Super-scalar Processors (cont.)
– Intel Itanium• EPIC (Explicitly Parallel Instruction
Computing) design• 4 integer units• 4 multimedia units• 2 load/store units• 3 branch units• 2 extended precision floating point units• 2 single precision floating point units

12
Out of Order Execution
• CPU dynamically executes instructions as their operands become available, out of order if necessary– Any result generated out of order is
temporary until all previous instructions have successfully completed.
– Queues are used to select which instructions to issue dynamically to the execution units.
– Relevant hardware counter metrics: instructions issued, instructions completed
13
Speculative Execution
• The CPU attempts to predict which way a branch will go and continues executing instructions speculatively along that path.– If the prediction is wrong, instructions
executed down the incorrect path must be canceled.
– On many processors, hardware counters keep counts of branch prediction hits and misses.
14
Instruction Counts and Functional Unit Status
• Relevant hardware counter data– Total cycles– Total instructions– Floating point operations– Load/store instructions– Cycles functional units are idle– Cycles stalled
• waiting for memory access• waiting for resource
– Conditional branch instructions• executed• mispredicted

15
Cache and Memory Hierarchy
• Registers: On-chip circuitry used to hold operands and results of calculations
• L1 (primary) data cache: Small on-chip cache used to hold data about to be operated on
• L2 (secondary) cache: Larger (on- or off-chip) cache used to hold data and instructions retrieved from local memory.
• Some systems have L3 and even L4 caches.

16
Cache and Memory Hierarchy (cont.)
• Local memory: Memory on the same node as the processor
• Remote memory: Memory on another node but accessible over an interconnect network.
• Each level of the memory hierarchy introduces approximately an order of magnitude more latency than the previous level.

17
Cache Structure
• Memory on a node is organized as an array of cache lines which are typically 4 or 8 words long. When a data item is fetched from a higher level cache or from local memory, an entire cache line is fetched.
• Caches can be either – direct mapped or – N-way set associative
• A cache miss occurs when the program refers to a data item that is not present in the cache.

18
Cache Contention
• When two or more CPUs alternately and repeatedly update the same cache line– memory contention
• when two or more CPUs update the same variable
• correcting it involves an algorithm change
– false sharing• when CPUs update distinct variables that occupy
the same cache line• correcting it involves modification of data
structure layout
19
Cache Contention (cont.)
• Relevant hardware counter metrics– Cache misses and hit ratios– Cache line invalidations

20
TLB and Virtual Memory
• Memory is divided into pages.• The operating system translates the
virtual page addresses used by a program into physical addresses used by the hardware.– The most recently used addresses are
cached in the translation lookaside buffer (TLB).
– When the program refers to a virtual address that is not in the TLB, a TLB miss occurs.
• Relevant hardware counter metric: TLB misses

21
Memory Latencies
• CPU register: 0 cycles• L1 cache hit: 2-3 cycles• L1 cache miss satisfied by L2 cache hit:
8-12 cycles• L2 cache miss satisfied from main
memory, no TLB miss: 75-250 cycles• TLB miss requiring only reload of the
TLB: ~2000 cycles• TLB miss requiring reload of virtual
page – page fault: hundreds of millions of cycles

22
Steps of Optimization
• Optimize compiler switches • Integrate libraries• Profile• Optimize blocks of code that
dominate execution time by using hardware counter data to determine why the bottlenecks exist
• Always examine correctness at every stage!

23
General Design of PAPI

24
Goals
• Solid foundation for cross platform performance analysis tools
• Free tool developers from re-implementing counter access
• Standardization between vendors, academics and users
• Encourage vendors to provide hardware and OS support for counter access
• Reference implementations for a number of HPC architectures
• Well documented and easy to use

25
Overview of PAPI
• Performance Application Programming Interface
• The purpose of the PAPI project is to design, standardize and implement a portable and efficient API to access the hardware performance monitor counters found on most modern microprocessors.
• Parallel Tools Consortium project http://www.ptools.org/

26
PAPI Counter Interfaces
• PAPI provides three interfaces to the underlying counter hardware: 1. The low level interface manages hardware
events in user defined groups called EventSets.
2. The high level interface simply provides the ability to start, stop and read the counters for a specified list of events.
3. Graphical tools to visualize information.

27
PAPI Implementation
Java Monitor GUI
PAPI Low LevelPAPI High Level
Hardware Performance Counter
Operating System
Kernel Extension
PAPI Machine Dependent SubstrateMachine
SpecificLayer
PortableLayer

28
PAPI Preset Events
• Proposed standard set of events deemed most relevant for application performance tuning
• Defined in papiStdEventDefs.h• Mapped to native events on a
given platform– Run tests/avail to see list of PAPI
preset events available on a platform
29
PAPI Release
• Platforms– Linux/x86, Windows 2000
• Requires patch to Linux kernel, driver for Windows
– Linux/IA-64– Sun Solaris/Ultra 2.8– IBM AIX/Power
• Contact IBM for pmtoolkit– SGI IRIX/MIPS– Compaq Tru64/Alpha Ev6 & Ev67
• Requires OS device driver from Compaq– Cray T3E/Unicos

30
PAPI Release (cont.)
• C and Fortran bindings and Matlab wrappers
• To download software:http://icl.cs.utk.edu/projects/papi/

31
PAPI High-level Interface

32
High-level Interface
• Meant for application programmers wanting coarse-grained measurements
• Not thread safe• Calls the lower level API• Allows only PAPI preset events• Easier to use and less setup
(additional code) than low-level

33
High-level API
• C interfacePAPI_start_countersPAPI_read_countersPAPI_stop_countersPAPI_accum_countersPAPI_num_countersPAPI_flops
• Fortran interfacePAPIF_start_countersPAPIF_read_countersPAPIF_stop_countersPAPIF_accum_countersPAPIF_num_countersPAPIF_flops

34
Setting up the High-level Interface
• Int PAPI_num_counters(void)
– Initializes PAPI (if needed)
– Returns number of hardware counters
• int PAPI_start_counters(int *events, int len)
– Initializes PAPI (if needed)
– Sets up an event set with the given counters
– Starts counting in the event set
• int PAPI_library_init(int version)
– Low-level routine implicitly called by above

35
Controlling the Counters
• PAPI_stop_counters(long_long *vals, int alen)– Stop counters and put counter values in array
• PAPI_accum_counters(long_long *vals, int alen)
– Accumulate counters into array and reset
• PAPI_read_counters(long_long *vals, int alen)– Copy counter values into array and reset counters
• PAPI_flops(float *rtime, float *ptime, long_long *flpins, float *mflops)– Wallclock time, process time, FP ins since start,– Mflop/s since last call

36
PAPI_flops
• int PAPI_flops(float *real_time, float *proc_time, long_long *flpins, float *mflops)– Only two calls needed, PAPI_flops before and after
the code you want to monitor– real_time is the wall-clocktime between the two calls– proc_time is the “virtual” time or time the process
was actually executing between the two calls (not as fine grained as real_time but better for longer measurements)
– flpins is the total floating point instructions executed between the two calls
– mflops is the Mflop/s rating between the two calls

37
PAPI High-level Example
long long values[NUM_EVENTS]; unsigned int
Events[NUM_EVENTS]={PAPI_TOT_INS,PAPI_TOT_CYC}; /* Start the counters */ PAPI_start_counters((int*)Events,NUM_EVENTS); /* What we are monitoring? */ do_work(); /* Stop the counters and store the results in values */ retval = PAPI_stop_counters(values,NUM_EVENTS);

38
Return codes
Name Description PAPI_OK No error PAPI_EINVAL Invalid argument PAPI_ENOMEM Insufficient memory PAPI_ESYS A system/C library call failed. Check errno variable PAPI_ESBSTR Substrate returned an error. E.g. unimplemented feature PAPI_ECLOST Access to the counters was lost or interrupted PAPI_EBUG Internal error PAPI_ENOEVNT Hardware event does not exist PAPI_ECNFLCT Hardware event exists, but resources are exhausted PAPI_ENOTRUN Event or envent set is currently counting PAPI_EISRUN Events or event set is currently running PAPI_ENOEVST No event set available PAPI_ENOTPRESET Argument is not a preset PAPI_ENOCNTR Hardware does not support counters PAPI_EMISC Any other error occured

39
PAPI Low-level Interface
40
Low-level Interface
• Increased efficiency and functionality over the high level PAPI interface
• About 40 functions• Obtain information about the
executable and the hardware• Thread-safe• Fully programmable• Callbacks on counter overflow

41
Low-level Functionality
• Library initializationPAPI_library_init, PAPI_thread_init,
PAPI_shutdown• Timing functions
PAPI_get_real_usec, PAPI_get_virt_usecPAPI_get_real_cyc, PAPI_get_virt_cyc
• Inquiry functions• Management functions• Simple lock
PAPI_lock/PAPI_unlock

42
Event sets
• The event set contains key information– What low-level hardware counters to use
– Most recently read counter values
– The state of the event set (running/not running)
– Option settings (e.g., domain, granularity, overflow, profiling)
• Event sets can overlap if they map to the same hardware counter set-up.– Allows inclusive/exclusive measurements

43
Event set Operations
• Event set managementPAPI_create_eventset, PAPI_add_event[s], PAPI_rem_event[s], PAPI_destroy_eventset
• Event set controlPAPI_start, PAPI_stop, PAPI_read, PAPI_accum
• Event set inquiryPAPI_query_event, PAPI_list_events,...

44
Simple Example
#include "papi.h“#define NUM_EVENTS 2int Events[NUM_EVENTS]={PAPI_FP_INS,PAPI_TOT_CYC}, EventSet;
long_long values[NUM_EVENTS];/* Initialize the Library */retval = PAPI_library_init(PAPI_VER_CURRENT);/* Allocate space for the new eventset and do setup */retval = PAPI_create_eventset(&EventSet);/* Add Flops and total cycles to the eventset */retval = PAPI_add_events(&EventSet,Events,NUM_EVENTS);/* Start the counters */retval = PAPI_start(EventSet);
do_work(); /* What we want to monitor*/
/*Stop counters and store results in values */retval = PAPI_stop(EventSet,values);

45
Overlapping Counters
retval = PAPI_start(InclEventSet);retval = PAPI_start(OthersEventSet);
...
retval = PAPI_reset(OthersEventSet);do_flops(NUM_FLOPS); /* Function call */retval = PAPI_accum(OthersEventSet,Othersvalues);
...
retval = PAPI_stop(InclEventSet,Inclvalues);printf("Counts: %12lld %12lld\n",
Inclvalues[0], Inclvalues[0]-Othersvalues[0]);

46
Counter Domains
• int PAPI_set_domain(int domain);– PAPI_DOM_USER User context counted
– PAPI_DOM_KERNEL Kernel/OS context counted
– PAPI_DOM_OTHER Exception/transient mode
– PAPI_DOM_ALL All above contexts counted
– PAPI_DOM_MIN The smallest available context
– PAPI_DOM_MAX The largest available context
• All domains not available on all platforms - OS dependent

47
Counter Granularity
• int PAPI_set_granularity(int granul);– PAPI_GRN_THR count each individual thread
– PAPI_GRN_PROC count each individual process
– PAPI_GRN_PROCG count each process group
– PAPI_GRN_SYS count on the current CPU
– PAPI_GRN_SYS_CPU count on every CPU's
– PAPI_GRN_MIN (=PAPI_GRN_THR)
– PAPI_GRN_MAX (=PAPI_GRN_SYS_CPU)
• Requires OS support

48
Using PAPI with Threads
• After PAPI_library_init need to register unique thread identifier function
• For Pthreads
retval=PAPI_thread_init(pthread_self, 0);
• OpenMP
retval=PAPI_thread_init(omp_get_thread_num, 0);
• Each thread responsible for creation, start, stop and read of its own counters

49
Using PAPI with Multiplexing
• Multiplexing allows simultaneous use of more counters than are supported by the hardware.
• PAPI_multiplex_init() – should be called after PAPI_library_init()
to initialize multiplexing• PAPI_set_multiplex( int *EventSet );
– Used after the eventset is created to turn on multiplexing for that eventset
• Then use PAPI like normal

50
Issues with Multiplexing
• Some platforms support hardware multiplexing, on those that don’t PAPI implements multiplexing in software.
• The more events you multiplex, the more likely the representation is not correct.

51
Multiplex Code Examples
tests/multiplex1.c
tests/multiplex1_pthreads.c
From the PAPI source distribution:

52
Native Events
• An event countable by the CPU can be counted even if there is no matching preset PAPI event
• Same interface as when setting up a preset event, but a CPU-specific bit pattern is used instead of the PAPI event definition

53
Native Event Examples
tests/native.c
ftests/native.F
From the PAPI source distribution:

54
Counter Overflow Interrupts
and
Statistical Profiling

55
Callbacks on Counter Overflow
• PAPI provides the ability to call user-defined handlers when a specified event exceeds a specified threshold.
• For systems that do not support counter overflow at the OS level, PAPI sets up a high resolution interval timer and installs a timer interrupt handler.

56
PAPI_overflow
• int PAPI_overflow(int EventSet, int EventCode, int threshold, int flags, PAPI_overflow_handler_t handler)
• Sets up an EventSet such that when it is PAPI_start()’d, it begins to register overflows
• The EventSet may contain multiple events, but only one may be an overflow trigger.

57
Overflow Code Examples
tests/overflow.c
tests/overflow_pthreads.c
From the PAPI source distribution:

58
Statistical Profiling
• PAPI provides support for execution profiling based on any counter event.
• PAPI_profil() creates a histogram of overflow counts for a specified region of the application code.
59
PAPI_profil
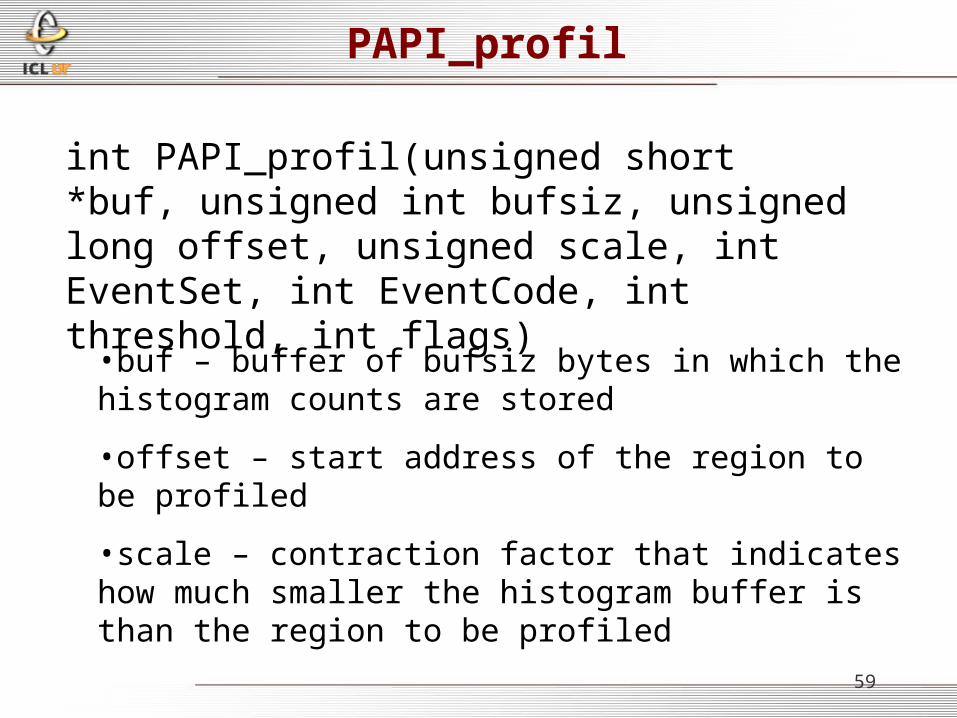
int PAPI_profil(unsigned short *buf, unsigned int bufsiz, unsigned long offset, unsigned scale, int EventSet, int EventCode, int threshold, int flags)
•buf – buffer of bufsiz bytes in which the histogram counts are stored
•offset – start address of the region to be profiled
•scale – contraction factor that indicates how much smaller the histogram buffer is than the region to be profiled

60
Profiling Code Examples
tests/profile.c
tests/sprofile.c
tests/profile_pthreads.c
From the PAPI source distribution:

61
Tools that use PAPI

62
Perfometer
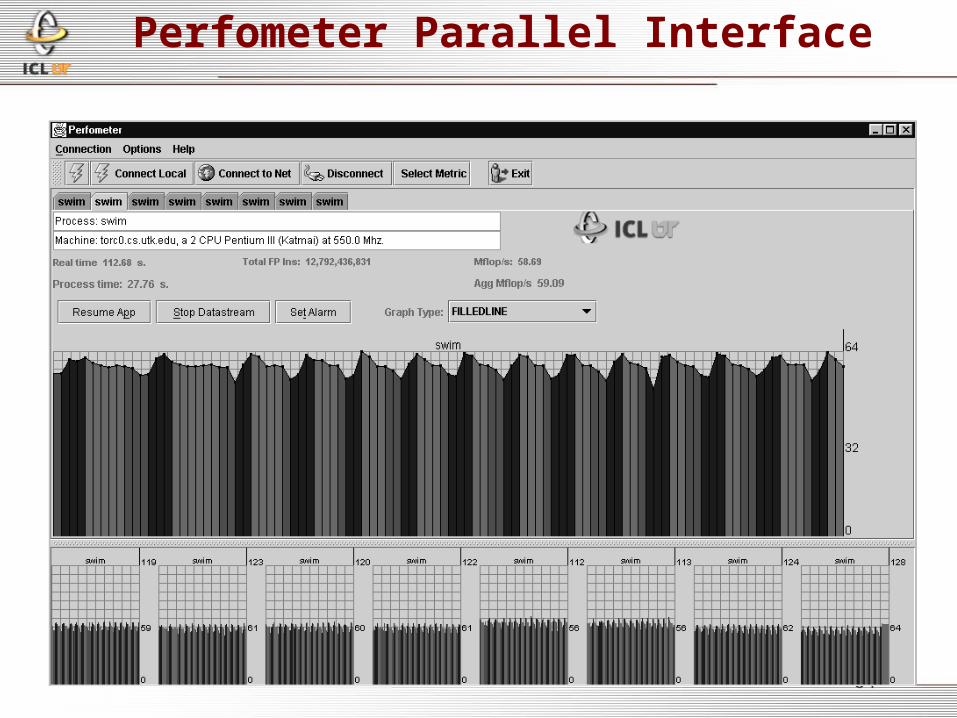
• Application is instrumented with PAPI– call perfometer()– call mark_perfometer(Color)
• Application is started. At the call to perfometer, signal handler and timer are set to collect and send the information to a Java applet containing the graphical view.
• Sections of code that are of interest can be designated with specific colors– Using a call to set_perfometer(‘color’)
• Real-time display or trace file

63
Perfometer DisplayMachine info
Process &Real time
Flop/s Rate
Flop/s Min/Max
64
Perfometer Parallel Interface

65
Third-party Tools that use PAPI
• DEEP/PAPI (Pacific Sierra) http://www.psrv.com/deep_papi_top.html
• TAU (Allen Mallony, U of Oregon) http://www.cs.uoregon.edu/research/paracomp/tau/
• SvPablo (Dan Reed, U of Illinois) http://vibes.cs.uiuc.edu/Software/SvPablo/svPablo.htm
• Cactus (Ed Seidel, Max Plank/U of Illinois) http://www.aei-potsdam.mpg.de
• Vprof (Curtis Janssen, Sandia Livermore Lab) http://aros.ca.sandia.gov/~cljanss/perf/vprof/
• Cluster Tools (Al Geist, ORNL)• DynaProf (Phil Mucci, UTK)
http://www.cs.utk.edu/~mucci/dynaprof/

66
DEEP/PAPI

67
SvPablo

68
TAU

69
vprof

70
Code Examples

71
Code Examples
• Parallelising a particle particle simulator
• Parallelising a frequency domain MHD simulator

72
Particle - particle simulator
• Particles fall in a well• Particle interactions
computed for particles in the neighbourhood only
• Occasionally the neighbourhood list is recomputed
• 1000 particles• Neighbour list length
10000• ~6000-7000 interactions
Neighborhood

73
Algorithm used
• Force vector is sum-updated in a “random” access pattern
• Little cache re-use
• Inhibits SMP parallelization
For each particle iFor each neighbor j
Compute distance ijCompute inter-particle forceUpdate force on particles i & j
Compute accelerations and updated positions
74
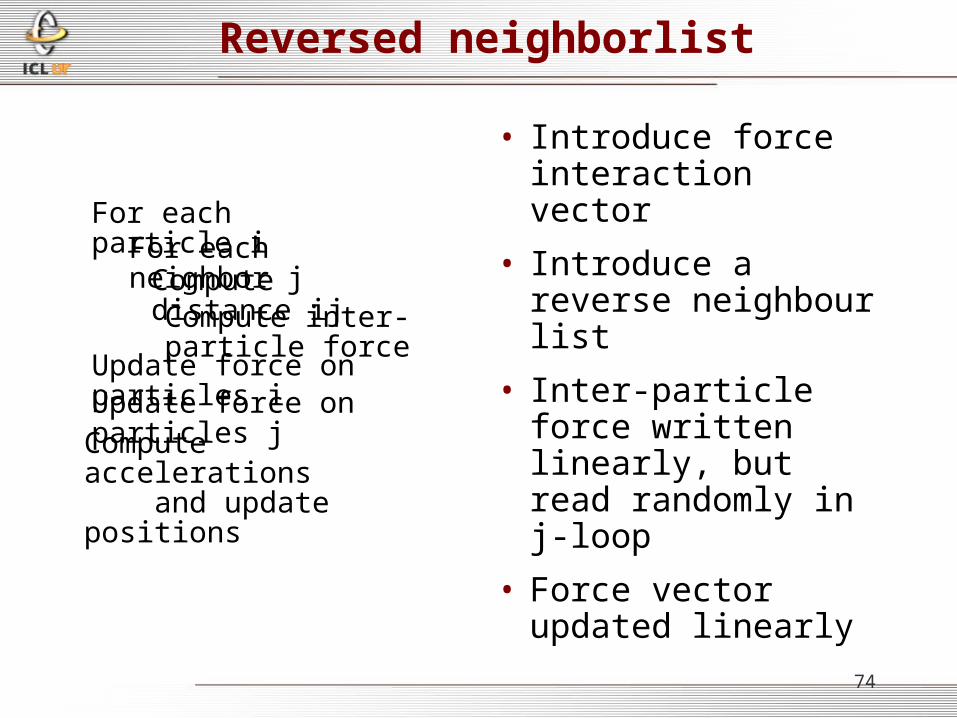
Reversed neighborlist
• Introduce force interaction vector
• Introduce a reverse neighbour list
• Inter-particle force written linearly, but read randomly in j-loop
• Force vector updated linearly
For each particle iFor each neighbor j
Compute distance ijCompute inter-particle force
Update force on particles jCompute accelerations and update positions
Update force on particles i

75
1 Naive load balancing2 Neighbour balancing
Final performanceWall clock time per time step

76
Explanation
• User reports serial program 3 times faster– Several contributing factors:
• Compiler optimisations
• Compiler inlining
• Better cache utilization
• Without the linear traversing of writes no speed-up (not shown in previous graph)
• Scaling problem on the SGI is a cache issue? Whole problem fits nicely into one 8MB L2 cache

77
Frequency domain MHD
• Code makes frequent 3D FFT transformations
• Electric and magnetic field double complex 128 bit precision
• Array dimensions are (3,N,N,N), N=64
• Array size: 12MB per field
• In between calls matrices are set up in loopsM(:,j,k,l)=A(:,j,k,l) × B(:,j,k,l) + C(:,j,k,l)
• Parallel FFTs are available
• Parallel matrix set up is straight forward

78
Expected behaviour
• Code is expected to be memory bound outside FFTs due to array sizes and number of floating point operations vs. memory accesses
• Going parallel on a bus gives no gain - or does it?
• Speed-up should be obtainable on CC-NUMA
• Code should run well on vector systems with good FFTs and enough memory ports

79
Observed behaviour
Overloaded systemSerial DXML FFTs

80
Obtained speed up vs. streams
• The IBM bus is “switched” - this can explain that speed-up was obtained
• Speed-up on the SGI platform could be better
http://www.cs.virginia.edu/stream/standard/Bandwidth.htmlMachine ncpus COPY SCALE ADD TRIAD
IBM_SP-PWR3smp-High-222 8 2954.1 2821 3889 3872.2 10 6̂ BYTE/SECIBM_SP-PWR3smp-High-222 4 1603.5 1535.9 2218.3 2187.5IBM_SP-PWR3smp-High-222 2 820.7 800.4 1182.1 1165.4IBM_SP-PWR3smp-High-222 1 413 421.2 587.4 614.2
SGI_Origin2000-195 8 1355 1450 1413 1675SGI_Origin2000-195 6 1066 1075 1262 1396SGI_Origin2000-195 4 666 727 792 874SGI_Origin2000-195 2 351 365 392 413SGI_Origin2000-195 1 296 300 315 317

81
PAPI measurements — IBM
• Critical code section
main loop….Call nlin(….)….
end main loop
Subroutine nlinCompute arraysCall FFTsCompute arrays
Call FFTs Compute arraysend subroutine nlin
• Overlapping counters used
Inclusive results SecondsMain loop 169.90FFTs 109.66nlin 131.13
Exclusive results SecondsPAPI main loop: 38.76PAPI FFTs: 109.66PAPI nlin: 21.47

82
Raw results
Exclusive results PAPI_L1_LDM PAPI_L1_STM PAPI_L2_LDM PAPI_L2_STMPAPI main loop: 234670773 9165559 0 675PAPI FFTs: 159252099 16727100 0 0PAPI nlin: 152516696 19557038 0 0
PAPI_LD_INS PAPI_ST_INSPAPI main loop: 894209461 513179931PAPI FFTs: 6169588863 5057277064PAPI nlin: 661376717 475098610
PAPI_FP_INS PAPI_PRF_DM SecondsPAPI main loop: 334859261 5042052 38.8PAPI FFTs: 7967695530 10715 109.7PAPI nlin: 1097492151 24339739 21.5

83
Deduced results
Exclusive results LD_INS/FP_INS: ST_INS/FP_INS: LD_INS/L1_LDM:PAPI main loop: 2.67 1.53 3.81PAPI FFTs: 0.77 0.63 38.74PAPI nlin: 0.60 0.43 4.34
L1 LD B/W: L1 ST B/W: PREF B/W:PAPI main loop: 184.76 7.22 3.97 MiBi/secPAPI FFTs: 44.32 4.65 0.00PAPI nlin: 216.78 27.80 34.60
PAPI main loop: 8.64 M(FP_INS)/sPAPI FFTs: 72.66PAPI nlin: 51.12
• Still not at memory peak in nlin
• Good cache reuse in FFTs• No cache reuse in main
loop (cache line length is 32 byte)

84
For More Information
• http://icl.cs.utk.edu/projects/papi/– Software and documentation– Reference materials– Papers and presentations– Third-party tools– Mailing lists